UNITED STATES
SECURITIES AND EXCHANGE COMMISSION
Washington, D.C. 20549
FORM 6-K
REPORT OF FOREIGN PRIVATE ISSUER
PURSUANT TO RULE 13a-16 OR 15d-16
UNDER THE SECURITIES EXCHANGE ACT OF 1934
For the month of February, 2022
Commission File Number 001-36487
Atlantica Sustainable Infrastructure plc
(Exact name of Registrant as specified in its charter)
Not applicable
(Translation of Registrant’s name into English)
Great West House, GW1, 17th floor
Great West Road
Brentford, TW8 9DF
United Kingdom
Tel: +44 203 499 0465
Indicate by check mark whether the registrant files or will file annual reports under cover of Form 20-F or Form 40-F:
| ☒ Form 20-F | ☐ Form 40-F |
Indicate by check mark if the registrant is submitting the Form 6-K in paper as permitted by Regulation S-T Rule 101(b)(1): ☐
Indicate by check mark if the registrant is submitting the Form 6-K in paper as permitted by Regulation S-T Rule 101(b)(7): ☐

FY 2021 Earnings Presentation February 28, 2022

DISCLAIMER Forward Looking StatementsThis presentation contains forward-looking statements. These forward-looking statements include, but are not limited to, all statements other than statements of historical facts contained in this presentation, including, without limitation, those regarding our future financial position and results of operations, our strategy, plans, objectives, goals and targets, future developments in the markets in which we operate or are seeking to operate or anticipated regulatory changes in the markets in which we operate or intend to operate. In some cases, you can identify forward-looking statements by terminology such as anticipate," "believe," "continue," "could," "estimate," "expect," "forecast," "guidance," "intend," "is likely to," "may," "plan," "potential," "predict," "projected," "should" or "will" or the negative of such terms or other similar expressions or terminology.By their nature, forward-looking statements involve risks and uncertainties because they relate to events and depend on circumstances that may or may not occur in the future. Forward-looking statements speak only as of the date of this presentation and are not guarantees of future performance and are based on numerous assumptions. Our actual results of operations, financial condition and the development of events may differ materially from (and be more negative than) those made in, or suggested by, the forward-looking statements. Except as required by law, we do not undertake any obligation to update any forward-looking statements to reflect events or circumstances after the date hereof or to reflect anticipated or unanticipated events or circumstances.Investors should read the section entitled "Item 3.D—Risk Factors" and the description of our segments and business sectors in the section entitled "Item 4.B. Information on the Company—Business Overview", each in our Annual Report on Form 20-F for the fiscal year ended December 31, 2021, filed with the Securities and Exchange Commission (“SEC”), for a more complete discussion of the risks and factors that could affect us.Forward-looking statements include, but are not limited to, statements relating to: expected value, expected investments in expansions, payments from investments; equity investment and project growth strategy; estimated returns and cash available for distribution (“CAFD”) estimates, including CAFD per share growth strategy and targets, CAFD estimates per currency, geography and sector; net corporate leverage based on CAFD estimates; debt refinancing; the quality of our long-term contracts; self-amortizing project debt structure and related debt reduction; the use of non-GAAP measures as a useful predicting tool for investors; the possibility to extend asset life; cost improvements from debt refinancing; dividends; achievement of environmental, social and governance goals; and various other factors, including those factors discussed under “Item 3.D—Risk Factors” and “Item 5.A—Operating Results” in our Annual Report on Form 20-F for the fiscal year ended December 31, 2021 filed with the SEC.The CAFD and other guidance incorporated into this presentation are estimates as of February 28, 2022. These estimates are based on assumptions believed to be reasonable as of the date Atlantica Sustainable Infrastructure plc (“Atlantica”, the “Company”, “we” or “us”) published its 2021 Financial Results. We disclaim any current intention to update such guidance, except as required by law. Non-GAAP Financial Information This presentation also includes certain non-GAAP financial measures, including Adjusted EBITDA, Adjusted EBITDA as a percentage of revenues (margin), CAFD and CAFD per share. Non-GAAP financial measures are not measurements of our performance or liquidity under IFRS as issued by IASB and should not be considered alternatives to operating profit or profit for the period or any other performance measures derived in accordance with IFRS as issued by the IASB or any other generally accepted accounting principles or as alternatives to cash flow from operating, investing or financing activities. Please refer to the appendix of this presentation for a reconciliation of the non-GAAP financial measures included in this presentation to the most directly comparable financial measures prepared in accordance with IFRS as well as the reasons why management believes the use of non-GAAP financial measures (including CAFD and Adjusted EBITDA) in this presentation provides useful information to investors.In our discussion of operating results, we have included foreign exchange impacts in our revenue and Adjusted by providing constant currency growth. The constant currency presentation is not a measure recognized under IFRS and excludes the impact of fluctuations in foreign currency exchange rates. We believe providing constant currency information provides valuable supplemental information regarding our results of operations. We calculate constant currency amounts by converting our current period local currency revenue and Adjusted EBITDA using the prior period foreign currency average exchange rates and comparing these adjusted amounts to our prior period reported results. This calculation may differ from similarly titled measures used by others and, accordingly, the constant currency presentation is not meant to substitute for recorded amounts presented in conformity with IFRS as issued by the IASB nor should such amounts be considered in isolation.
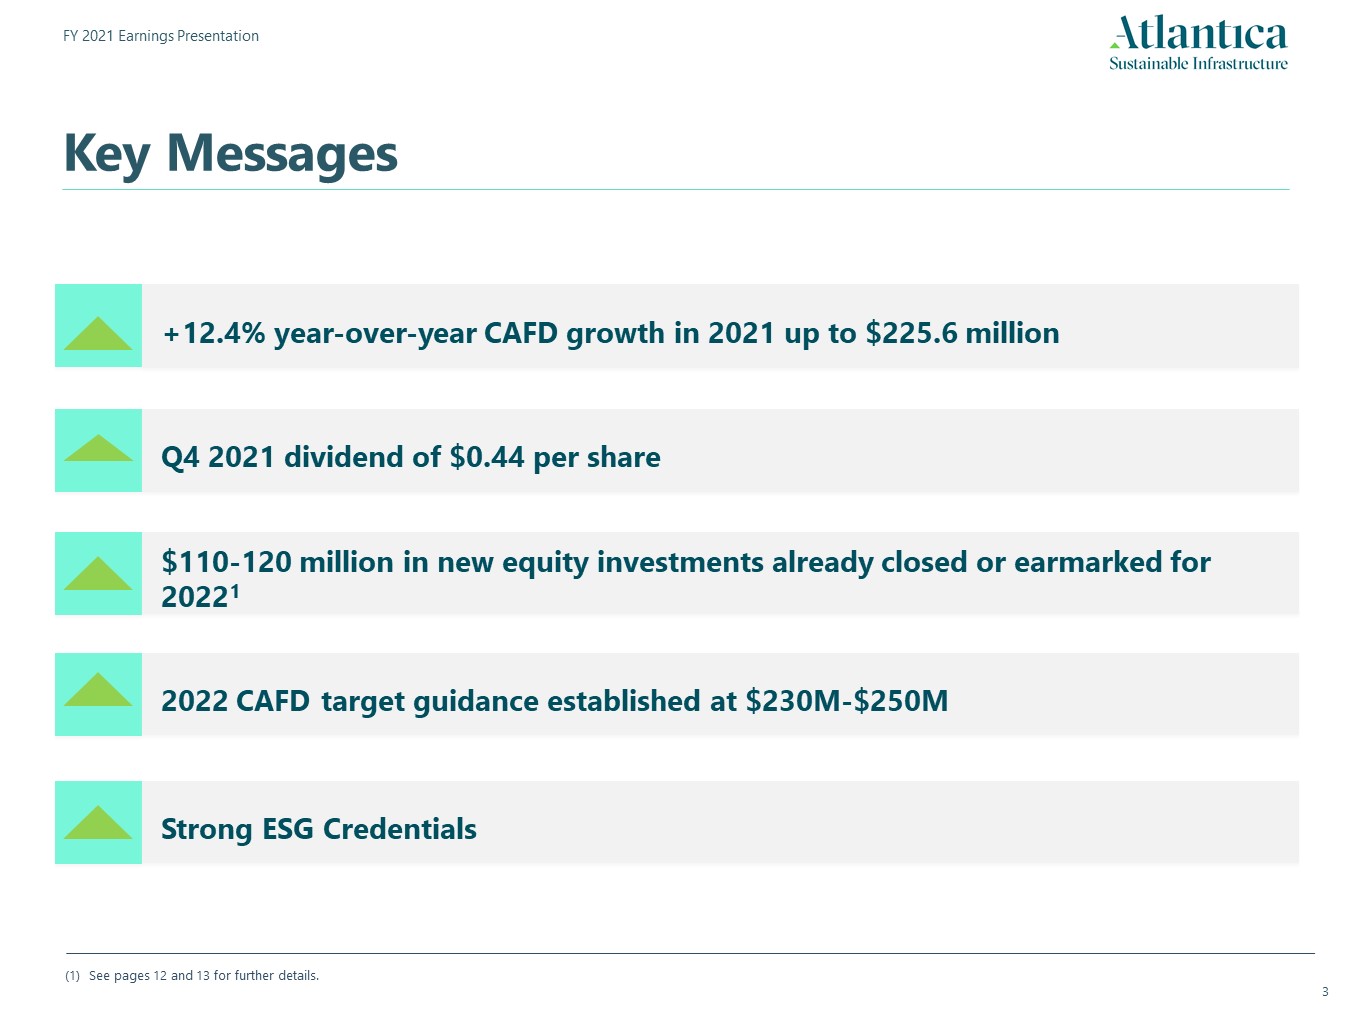
Key Messages +12.4% year-over-year CAFD growth in 2021 up to $225.6 million Q4 2021 dividend of $0.44 per share Strong ESG Credentials $110-120 million in new equity investments already closed or earmarked for 20221 See pages 12 and 13 for further details. 2022 CAFD target guidance established at $230M-$250M
1. Financial Results FY 2021 Results Presentation
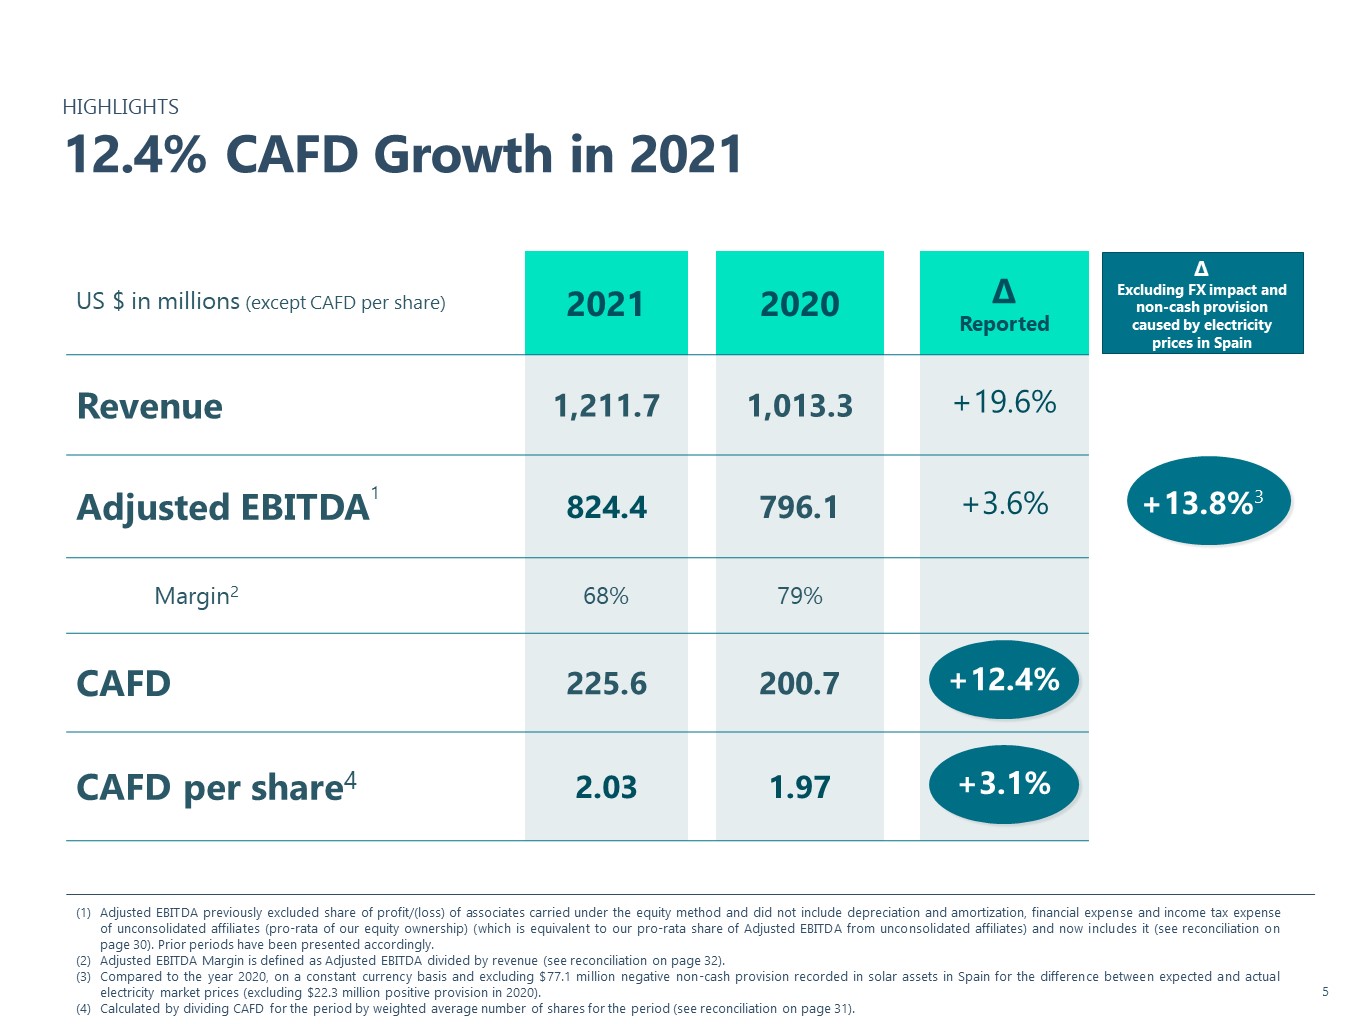
∆ Excluding FX impact and non-cash provision caused by electricity prices in Spain US $ in millions (except CAFD per share) 2021 2020 ∆ Reported Revenue 1,211.7 1,013.3 +19.6% Adjusted EBITDA1 824.4 796.1 +3.6% Margin2 68% 79% CAFD 225.6 200.7 +12.4% CAFD per share4 2.03 1.97 +3.1% HIGHLIGHTS12.4% CAFD Growth in 2021 Adjusted EBITDA previously excluded share of profit/(loss) of associates carried under the equity method and did not include depreciation and amortization, financial expense and income tax expense of unconsolidated affiliates (pro-rata of our equity ownership) (which is equivalent to our pro-rata share of Adjusted EBITDA from unconsolidated affiliates) and now includes it (see reconciliation on page 30). Prior periods have been presented accordingly.Adjusted EBITDA Margin is defined as Adjusted EBITDA divided by revenue (see reconciliation on page 32).Compared to the year 2020, on a constant currency basis and excluding $77.1 million negative non-cash provision recorded in solar assets in Spain for the difference between expected and actual electricity market prices (excluding $22.3 million positive provision in 2020).Calculated by dividing CAFD for the period by weighted average number of shares for the period (see reconciliation on page 31). +13.8%3
∆ Excluding FX impact and non-cash provision caused by electricity prices in Spain US $ in millions (except CAFD per share) 2021 2020 ∆ Reported Revenue 1,211.7 1,013.3 +19.6% Adjusted EBITDA1 824.4 796.1 +3.6% Margin2 68% 79% CAFD 225.6 200.7 +12.4% CAFD per share4 2.03 1.97 +3.1% HIGHLIGHTS12.4% CAFD Growth in 2021 Adjusted EBITDA previously excluded share of profit/(loss) of associates carried under the equity method and did not include depreciation and amortization, financial expense and income tax expense of unconsolidated affiliates (which is equivalent to our pro-rata share of Adjusted EBITDA from unconsolidated affiliates) and now includes it (see reconciliation on page 30). Prior periods have been presented accordingly (pro-rata of our equity ownership).Adjusted EBITDA Margin is defined as Adjusted EBITDA divided by revenue (see reconciliation on page 32).Compared to the year 2020, on a constant currency basis and excluding $77.1 million negative non-cash provision recorded in solar assets in Spain for the difference between expected and actual electricity market prices (excluding $22.3 million positive provision in 2020).Calculated by dividing CAFD for the period by weighted average number of shares for the period (see reconciliation on page 31). +13.8%3
∆ Excluding FX impact and non-cash provision caused by electricity prices in Spain US $ in millions (except CAFD per share) 2021 2020 ∆ Reported Revenue 1,211.7 1,013.3 +19.6% Adjusted EBITDA1 824.4 796.1 +3.6% Margin2 68% 79% CAFD 225.6 200.7 +12.4% CAFD per share4 2.03 1.97 +3.1% HIGHLIGHTS12.4% CAFD Growth in 2021 Adjusted EBITDA previously excluded share of profit/(loss) of associates carried under the equity method and did not include depreciation and amortization, financial expense and income tax expense of unconsolidated affiliates (which is equivalent to our pro-rata share of Adjusted EBITDA from unconsolidated affiliates) and now includes it (see reconciliation on page 30). Prior periods have been presented accordingly.Adjusted EBITDA Margin is defined as Adjusted EBITDA divided by revenue (see reconciliation on page 32).Compared to the year 2020, on a constant currency basis and excluding $77.1 million negative non-cash provision recorded in solar assets in Spain for the difference between expected and actual electricity market prices (excluding $22.3 million positive provision in 2020).Calculated by dividing CAFD for the period by weighted average number of shares for the period (see reconciliation on page 31). +13.8%3
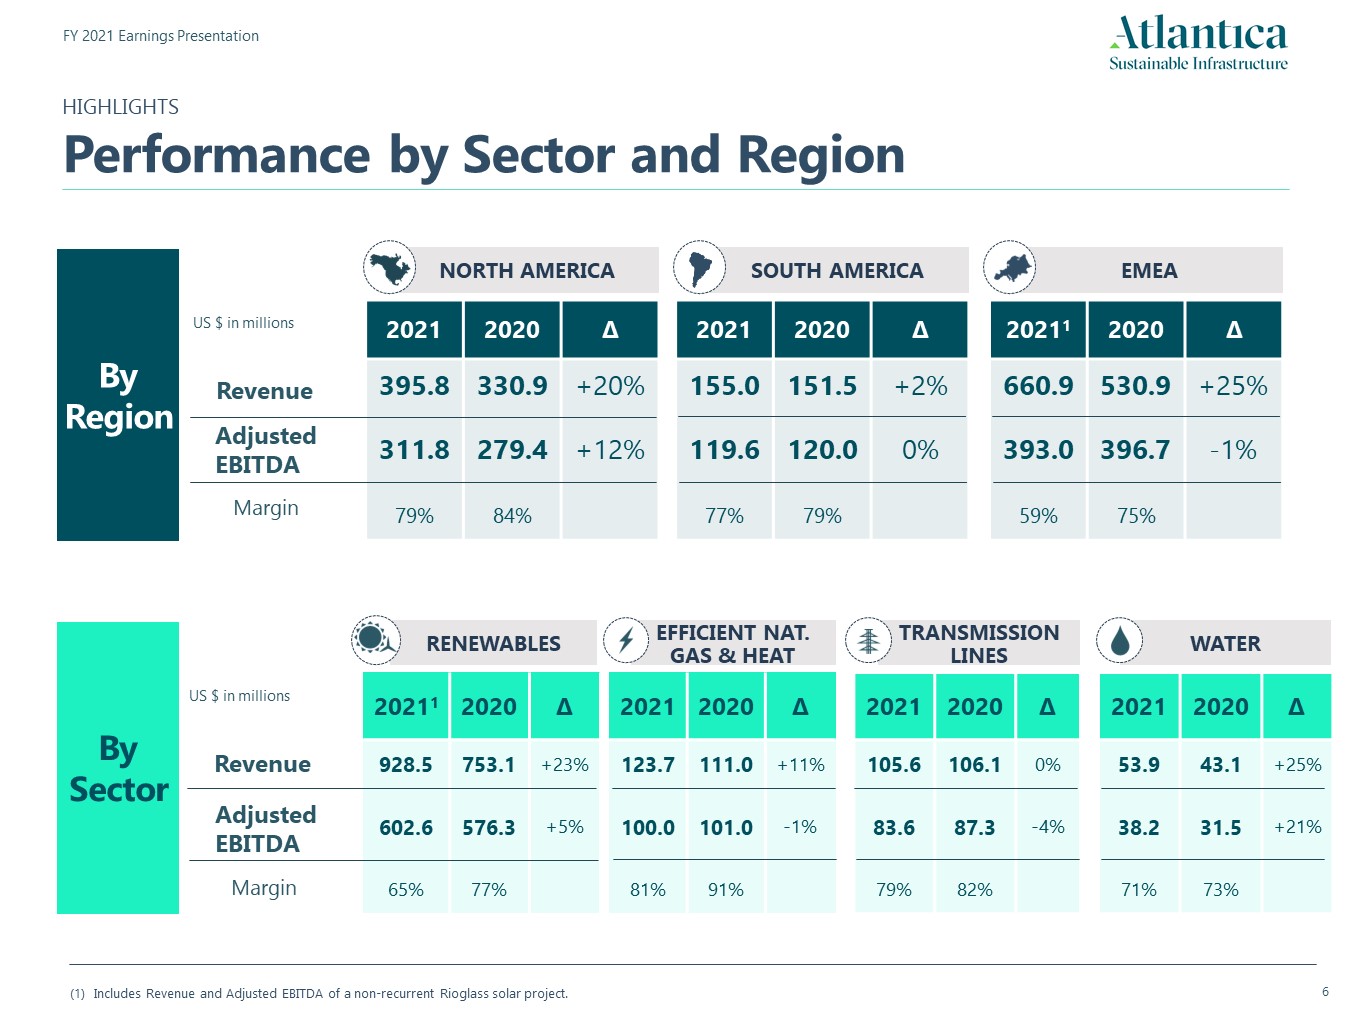
HIGHLIGHTSPerformance by Sector and Region Includes Revenue and Adjusted EBITDA of a non-recurrent Rioglass solar project. WATER 2021 2020 ∆ 53.9 43.1 +25% 38.2 31.5 +21% 71% 73% RENEWABLES 20211 2020 ∆ 928.5 753.1 +23% 602.6 576.3 +5% 65% 77% EFFICIENT NAT. GAS & HEAT 2021 2020 ∆ 123.7 111.0 +11% 100.0 101.0 -1% 81% 91% TRANSMISSION LINES 2021 2020 ∆ 105.6 106.1 0% 83.6 87.3 -4% 79% 82% By Sector US $ in millions Revenue Margin EMEA NORTH AMERICA 2021 2020 ∆ 395.8 330.9 +20% 311.8 279.4 +12% 79% 84% SOUTH AMERICA 20211 2020 ∆ 660.9 530.9 +25% 393.0 396.7 -1% 59% 75% By Region US $ in millions Revenue Adjusted EBITDA Margin 2021 2020 ∆ 155.0 151.5 +2% 119.6 120.0 0% 77% 79% Adjusted EBITDA
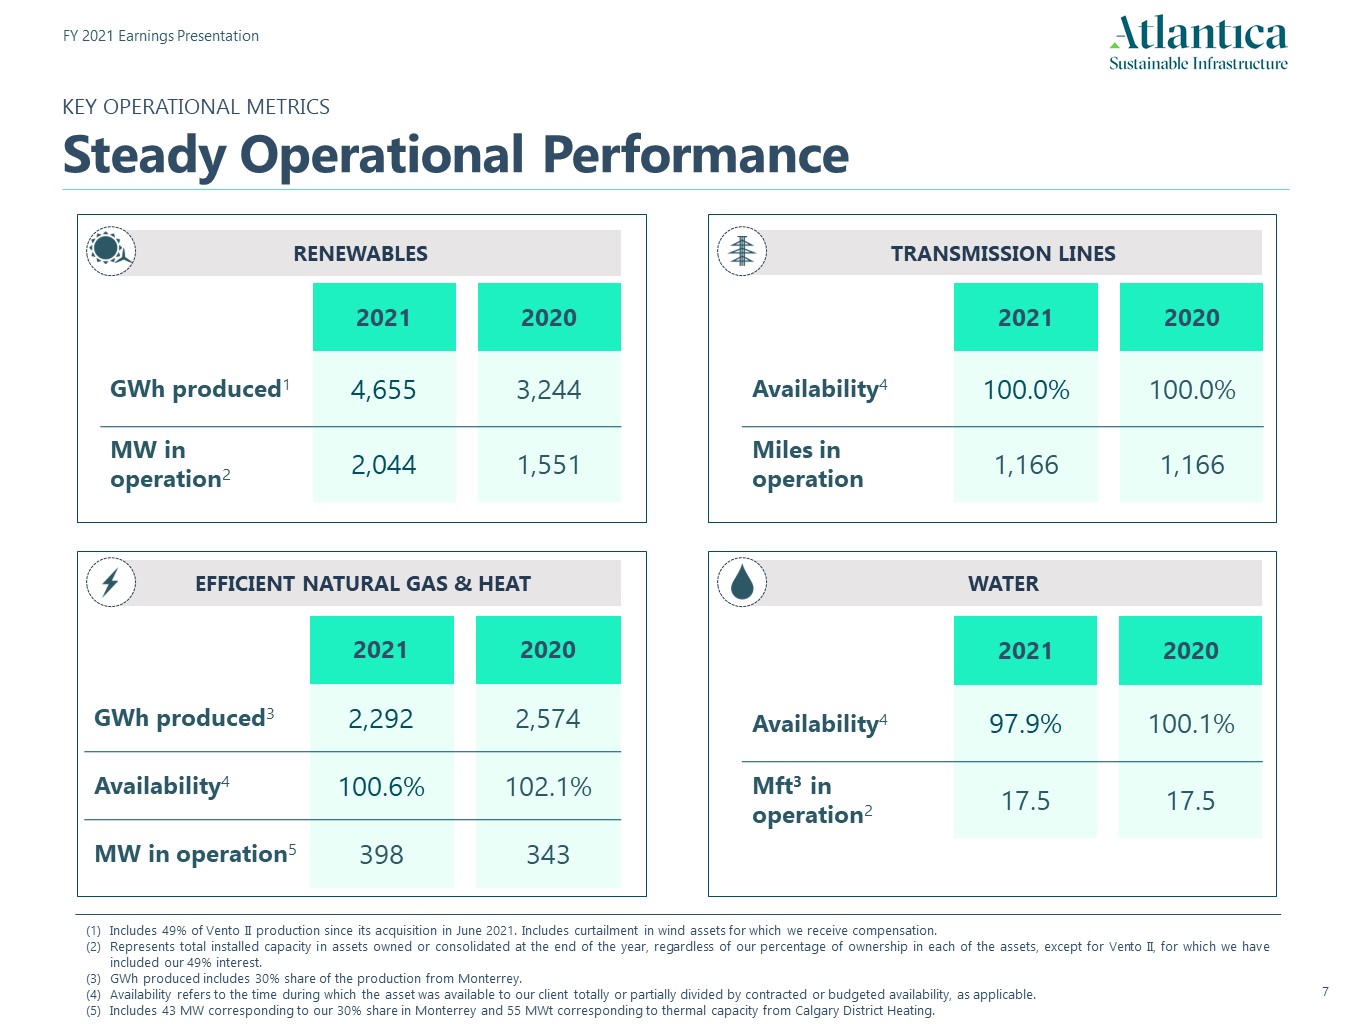
Includes 49% of Vento II production since its acquisition in June 2021. Includes curtailment in wind assets for which we receive compensation. Represents total installed capacity in assets owned or consolidated at the end of the year, regardless of our percentage of ownership in each of the assets, except for Vento II, for which we have included our 49% interest.GWh produced includes 30% share of the production from Monterrey.Availability refers to the time during which the asset was available to our client totally or partially divided by contracted or budgeted availability, as applicable.Includes 43 MW corresponding to our 30% share in Monterrey and 55 MWt corresponding to thermal capacity from Calgary District Heating. WATER RENEWABLES TRANSMISSION LINES EFFICIENT NATURAL GAS & HEAT 2021 2020 Availability4 97.9% 100.1% Mft3 in operation2 17.5 17.5 2021 2020 GWh produced1 4,655 3,244 MW in operation2 2,044 1,551 2021 2020 GWh produced3 2,292 2,574 Availability4 100.6% 102.1% MW in operation5 398 343 2021 2020 Availability4 100.0% 100.0% Miles in operation 1,166 1,166 KEY OPERATIONAL METRICSSteady Operational Performance
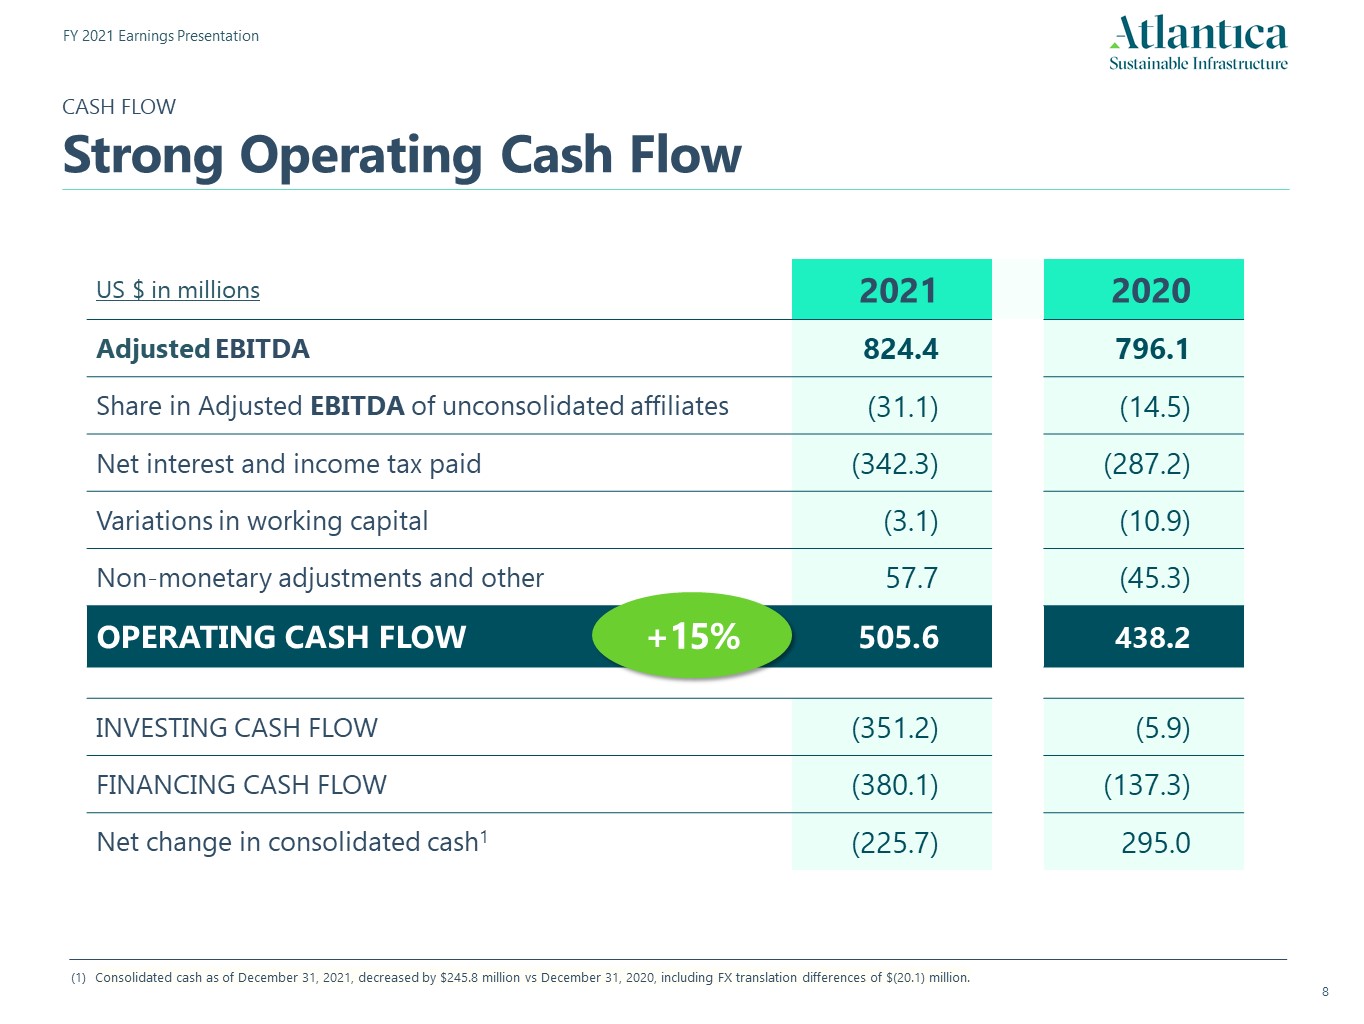
Consolidated cash as of December 31, 2021, decreased by $245.8 million vs December 31, 2020, including FX translation differences of $(20.1) million. CASH FLOWStrong Operating Cash Flow US $ in millions 2021 2020 Adjusted EBITDA 824.4 796.1 Share in Adjusted EBITDA of unconsolidated affiliates (31.1) (14.5) Net interest and income tax paid (342.3) (287.2) Variations in working capital (3.1) (10.9) Non-monetary adjustments and other 57.7 (45.3) OPERATING CASH FLOW 505.6 438.2 INVESTING CASH FLOW (351.2) (5.9) FINANCING CASH FLOW (380.1) (137.3) Net change in consolidated cash1 (225.7) 295.0 +15%
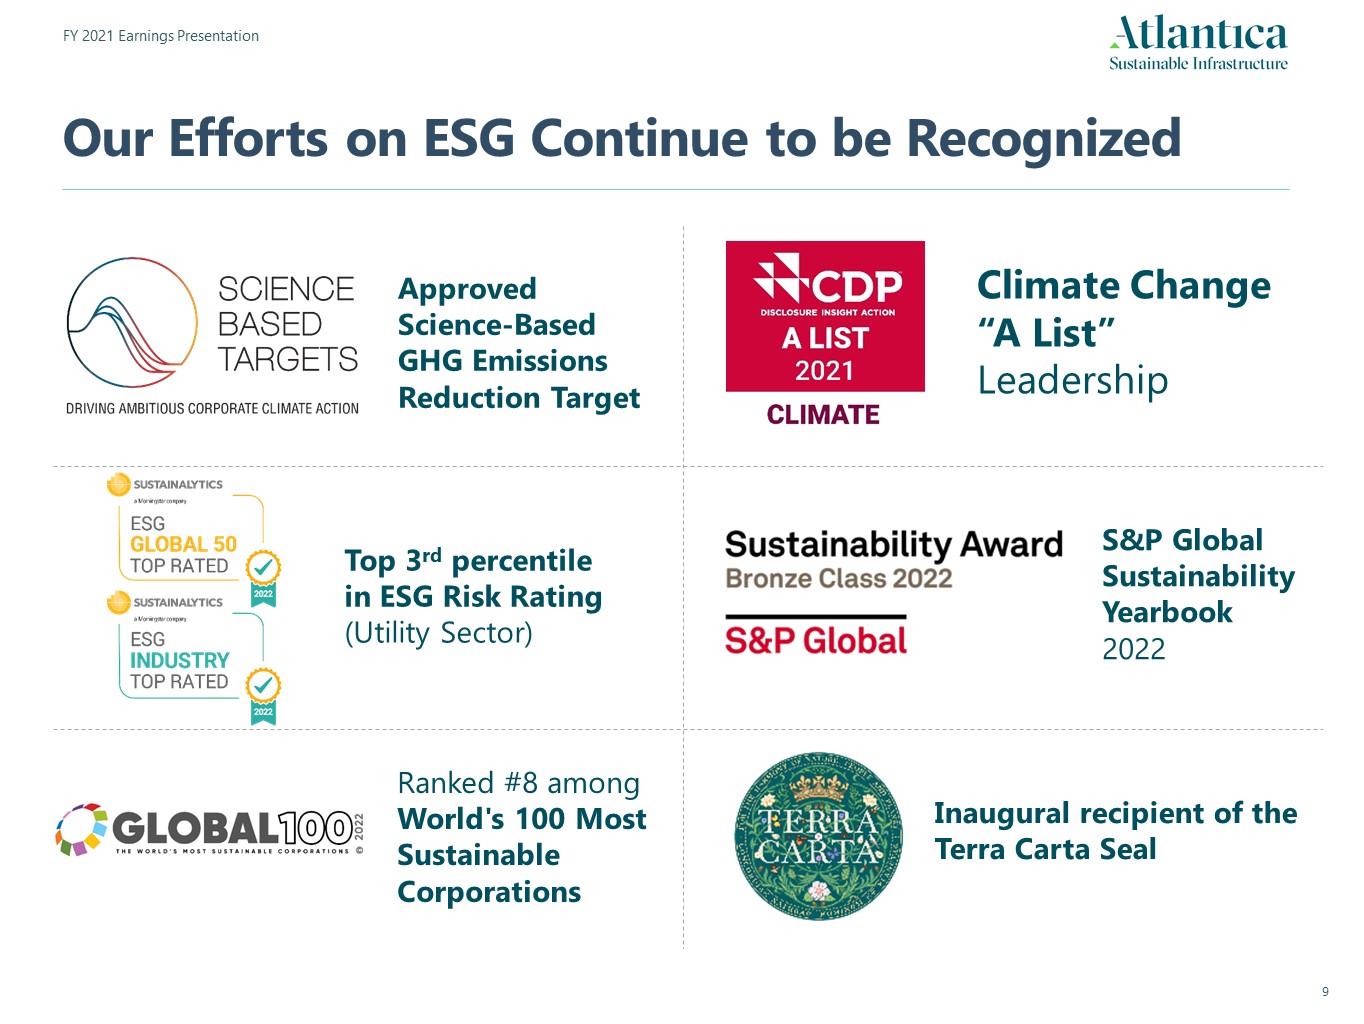
Approved Science-Based GHG Emissions Reduction Target Top 3rd percentile in ESG Risk Rating (Utility Sector) Ranked #8 among World's 100 Most SustainableCorporations Inaugural recipient of the Terra Carta Seal S&P Global Sustainability Yearbook2022 Climate Change “A List”Leadership Our Efforts on ESG Continue to be Recognized
2. 2022 Outlook and Growth FY 2021 Results Presentation
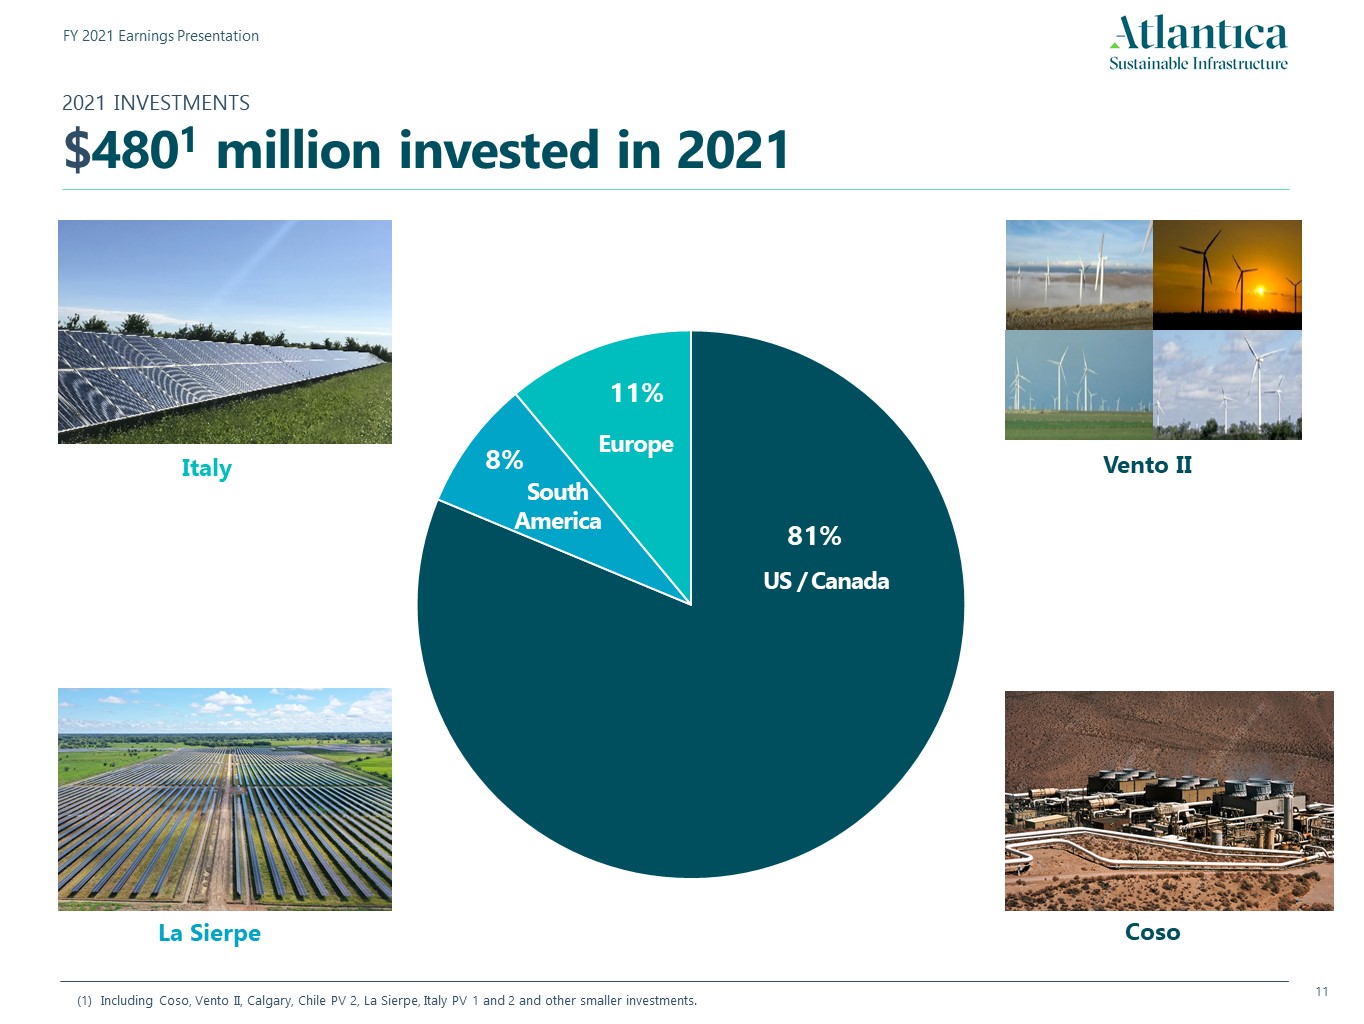
2021 INVESTMENTS$4801 million invested in 2021 Coso Coso Vento II La Sierpe Italy US / Canada Europe South America Including Coso, Vento II, Calgary, Chile PV 2, La Sierpe, Italy PV 1 and 2 and other smaller investments.

2022 INVESTMENTS$110-$120 million by Q1 2022 51(1) US $ in millions 60-70 110-120(2) 2022~40% of target already closed or committed Acquisitions closed Investments earmarked in assets under constructionin 2022 Total Including $8 million expected to be invested in an expansion of the Chile TL4 asset and a related substation in 2022.Assets currently under construction or scheduled for construction in 2022.
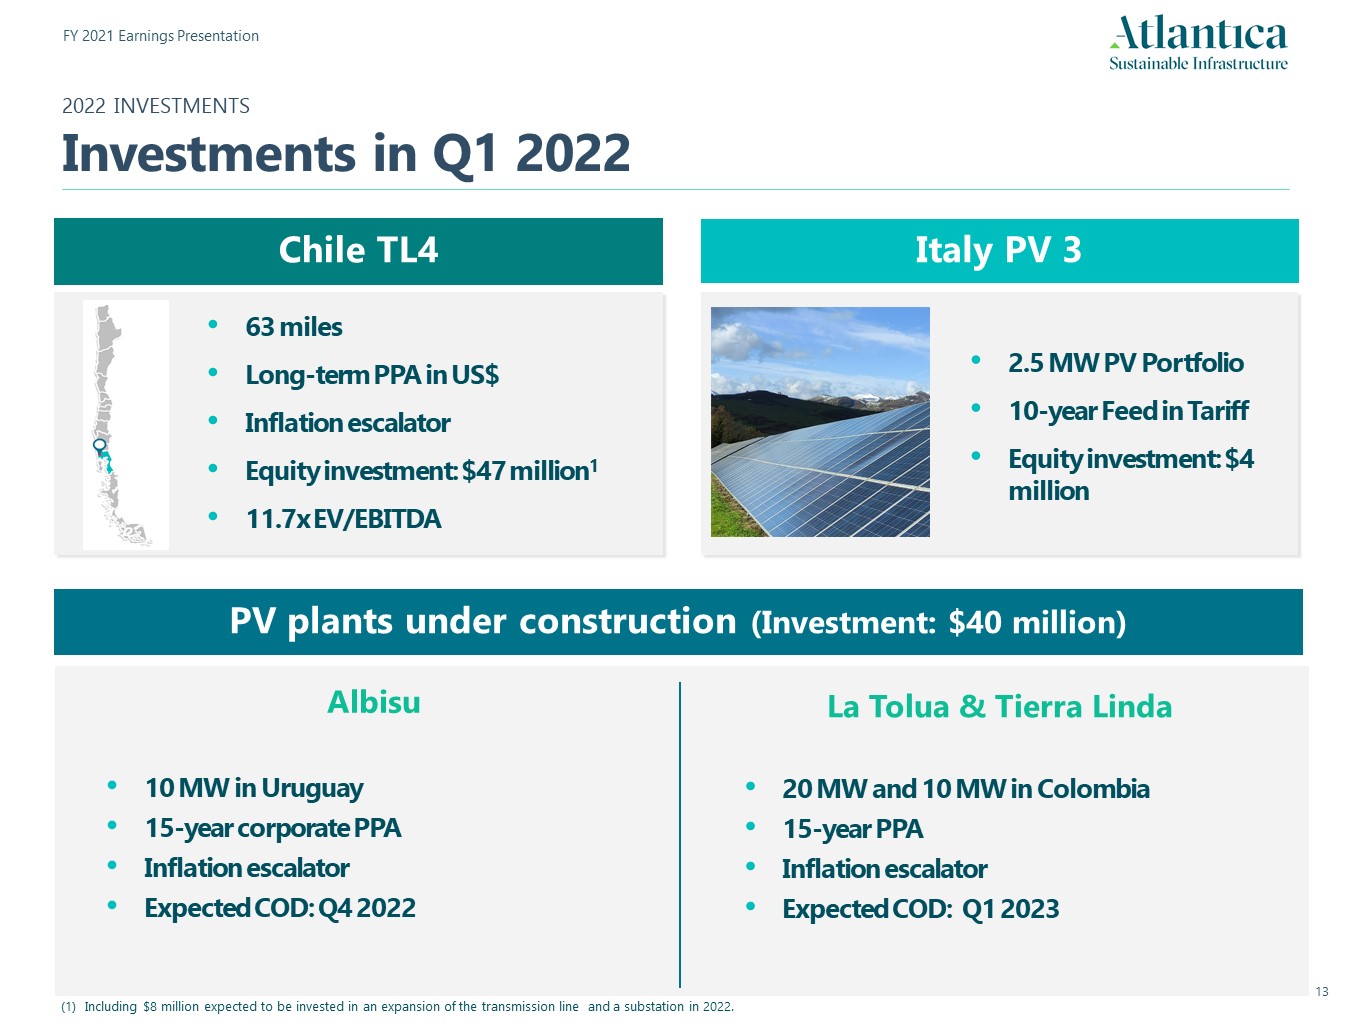
2022 INVESTMENTSInvestments in Q1 2022 PV plants under construction (Investment: $40 million) 10 MW in Uruguay 15-year corporate PPAInflation escalatorExpected COD: Q4 2022 20 MW and 10 MW in Colombia15-year PPAInflation escalatorExpected COD: Q1 2023 Albisu La Tolua & Tierra Linda Chile TL4 Italy PV 3 63 milesLong-term PPA in US$Inflation escalatorEquity investment: $47 million111.7x EV/EBITDA 2.5 MW PV Portfolio10-year Feed in Tariff Equity investment: $4 million Including $8 million expected to be invested in an expansion of the transmission line and a substation in 2022.
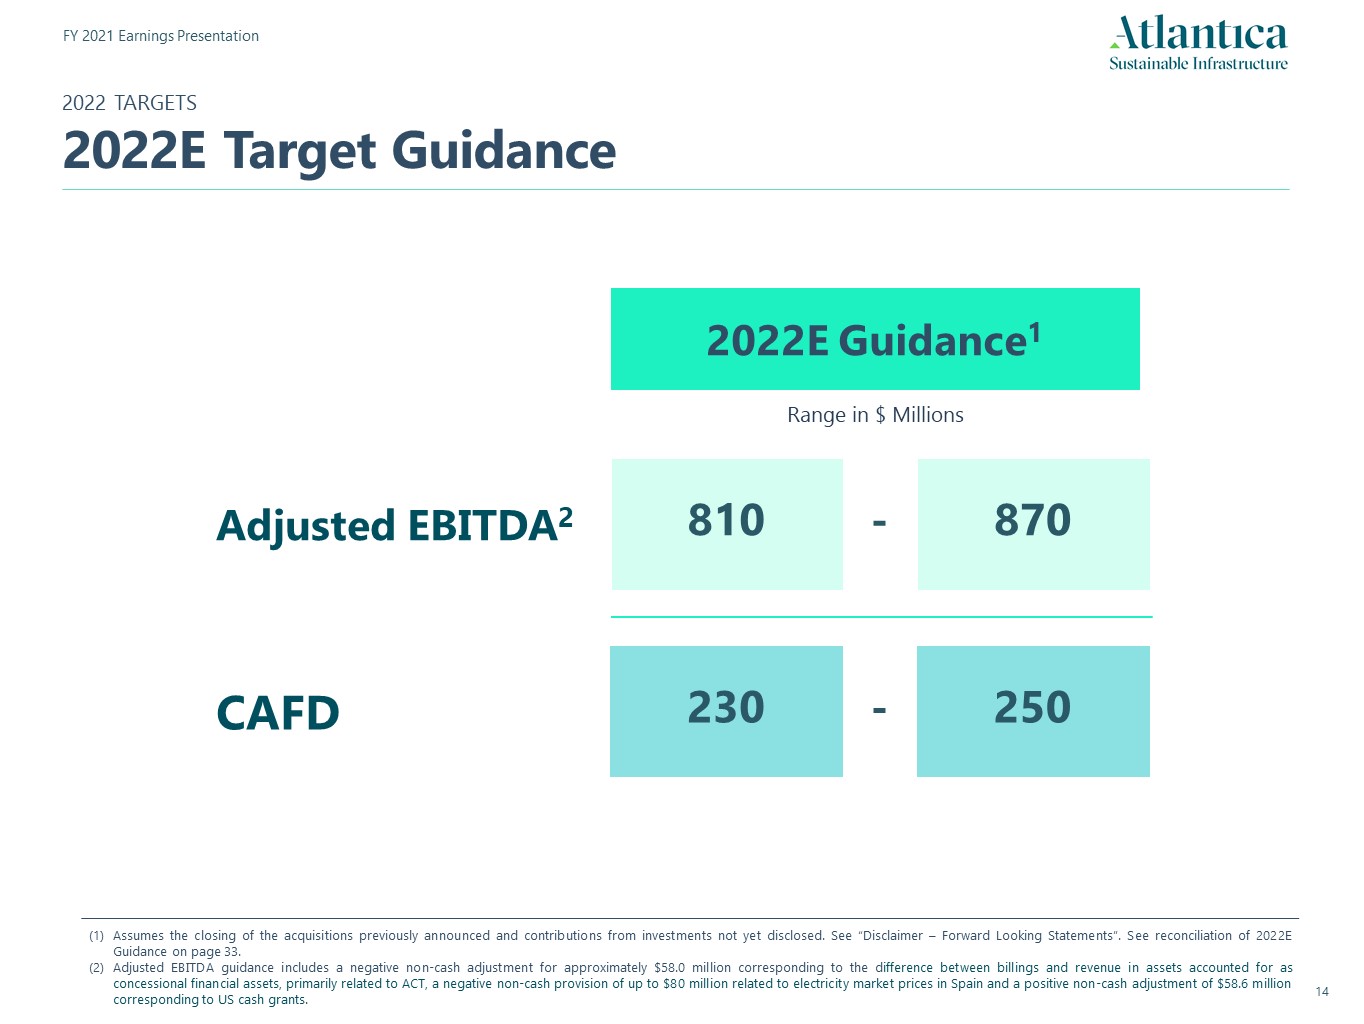
810 230 870 250 2022 TARGETS2022E Target Guidance 2022E Guidance1 Range in $ Millions Adjusted EBITDA2 Assumes the closing of the acquisitions previously announced and contributions from investments not yet disclosed. See “Disclaimer – Forward Looking Statements”. See reconciliation of 2022E Guidance on page 33. Adjusted EBITDA guidance includes a negative non-cash adjustment for approximately $58.0 million corresponding to the difference between billings and revenue in assets accounted for as concessional financial assets, primarily related to ACT, a negative non-cash provision of up to $80 million related to electricity market prices in Spain and a positive non-cash adjustment of $58.6 million corresponding to US cash grants. CAFD - -
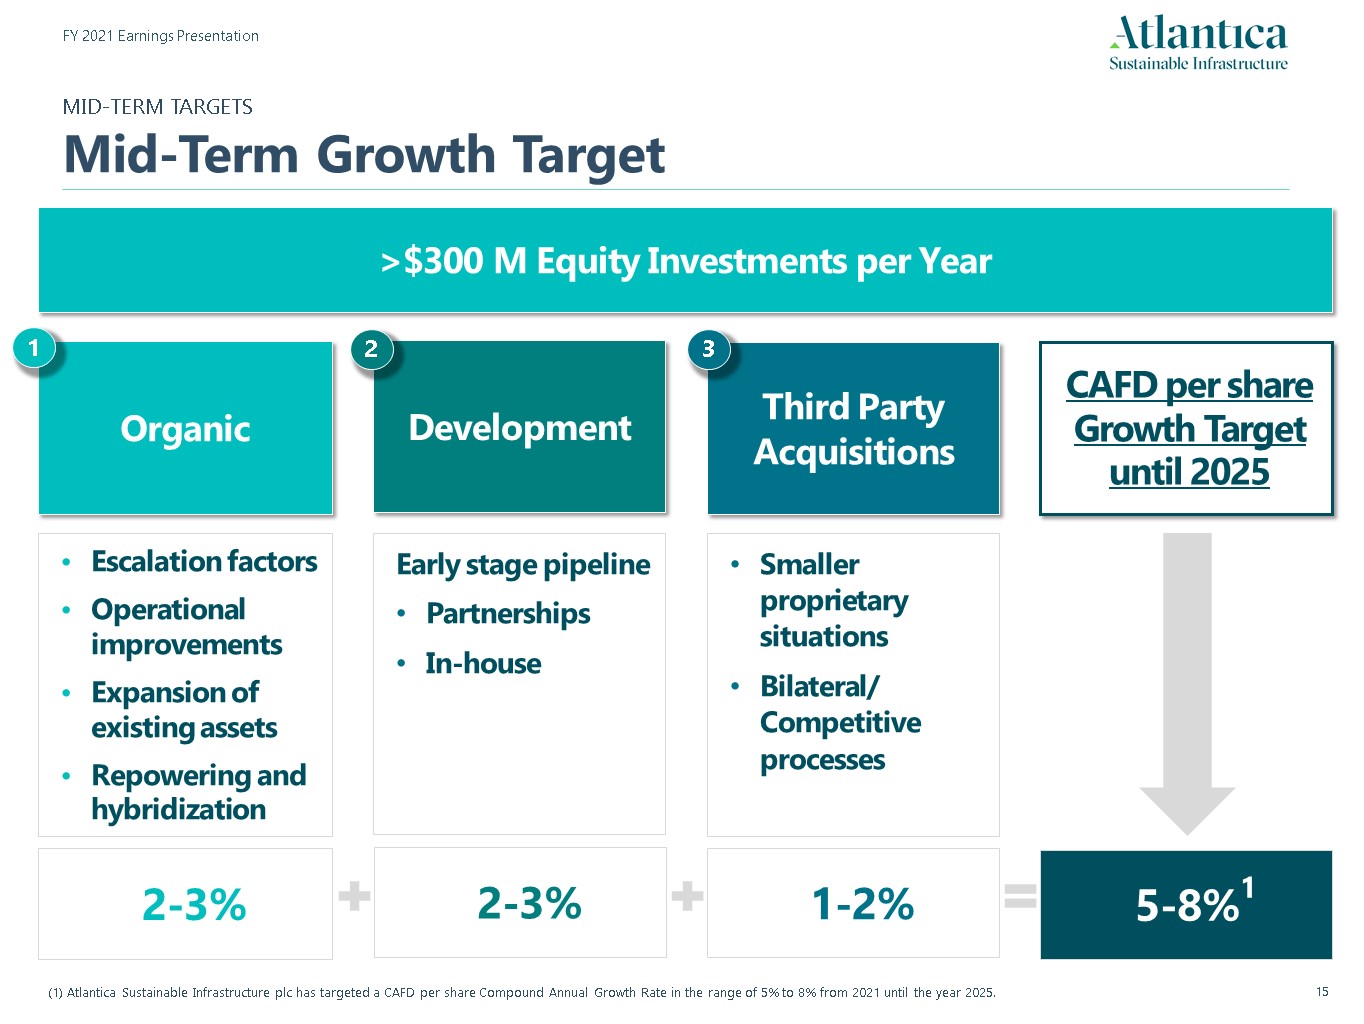
MID-TERM TARGETSMid-Term Growth Target Organic Escalation factorsOperational improvementsExpansion of existing assetsRepowering and hybridization 2-3% Development Early stage pipelinePartnershipsIn-house 2-3% 1 2 Third Party Acquisitions 1-2% Smaller proprietary situationsBilateral/ Competitive processes CAFD per share Growth Target until 2025 5-8%1 3 (1) Atlantica Sustainable Infrastructure plc has targeted a CAFD per share Compound Annual Growth Rate in the range of 5% to 8% from 2021 until the year 2025. >$300 M Equity Investments per Year

Appendix FY 2021 Results Presentation
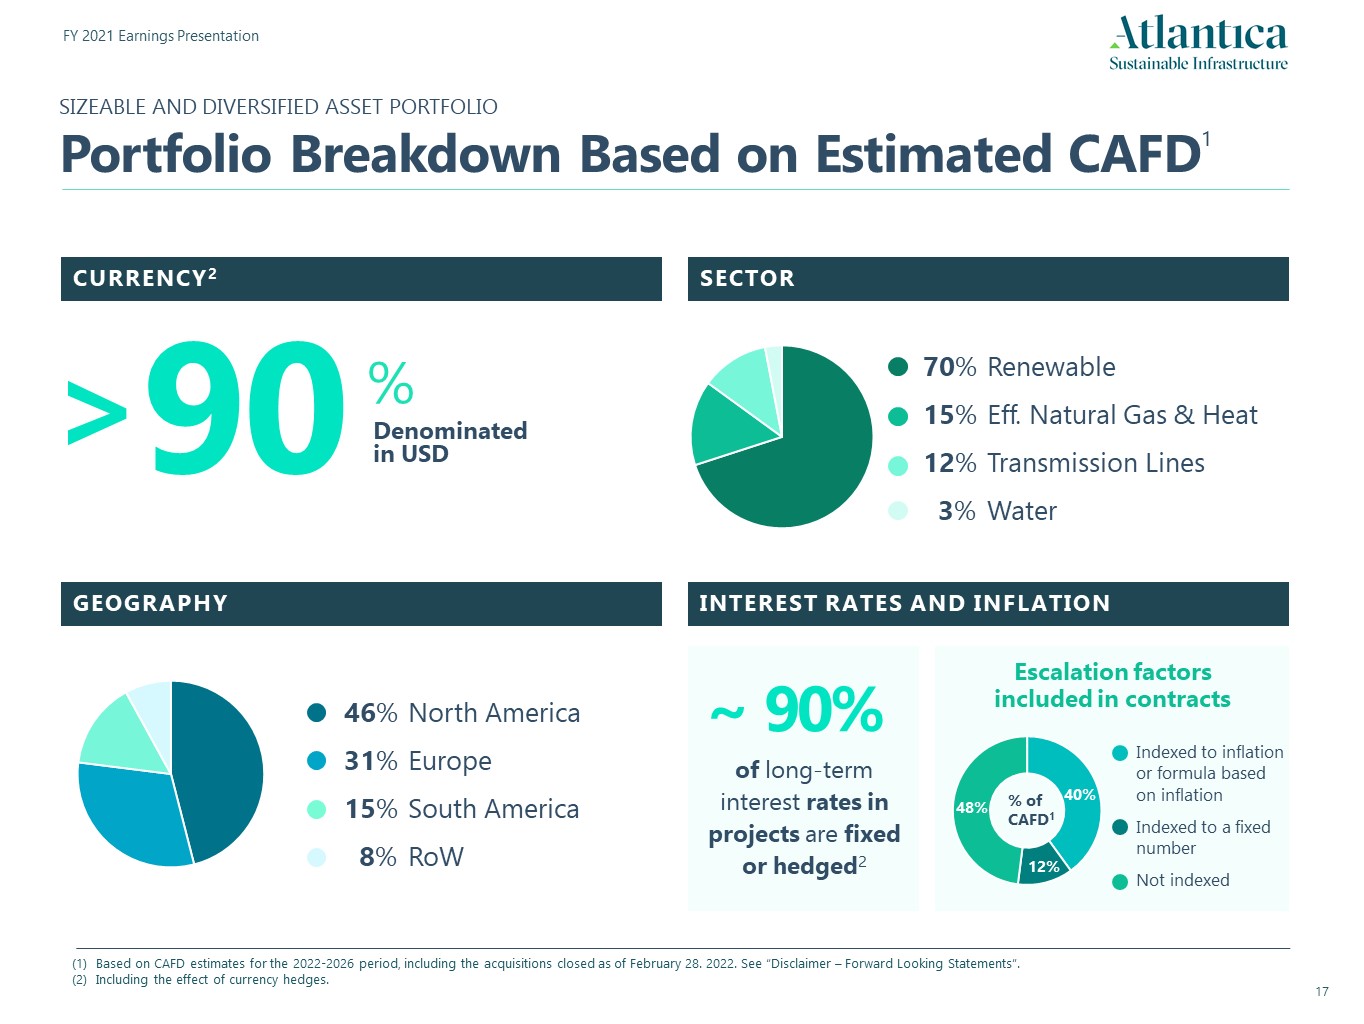
CURRENCY2 SECTOR GEOGRAPHY Based on CAFD estimates for the 2022-2026 period, including the acquisitions closed as of February 28. 2022. See “Disclaimer – Forward Looking Statements”.Including the effect of currency hedges. of long-term interest rates in projects are fixed or hedged2 ~ 90% 90 Denominatedin USD % > 70% Renewable15% Eff. Natural Gas & Heat12% Transmission Lines 3% Water 46% North America31% Europe15% South America 8% RoW SIZEABLE AND DIVERSIFIED ASSET PORTFOLIOPortfolio Breakdown Based on Estimated CAFD1 INTEREST RATES AND INFLATION Indexed to inflation or formula based on inflationIndexed to a fixed numberNot indexed Escalation factors included in contracts
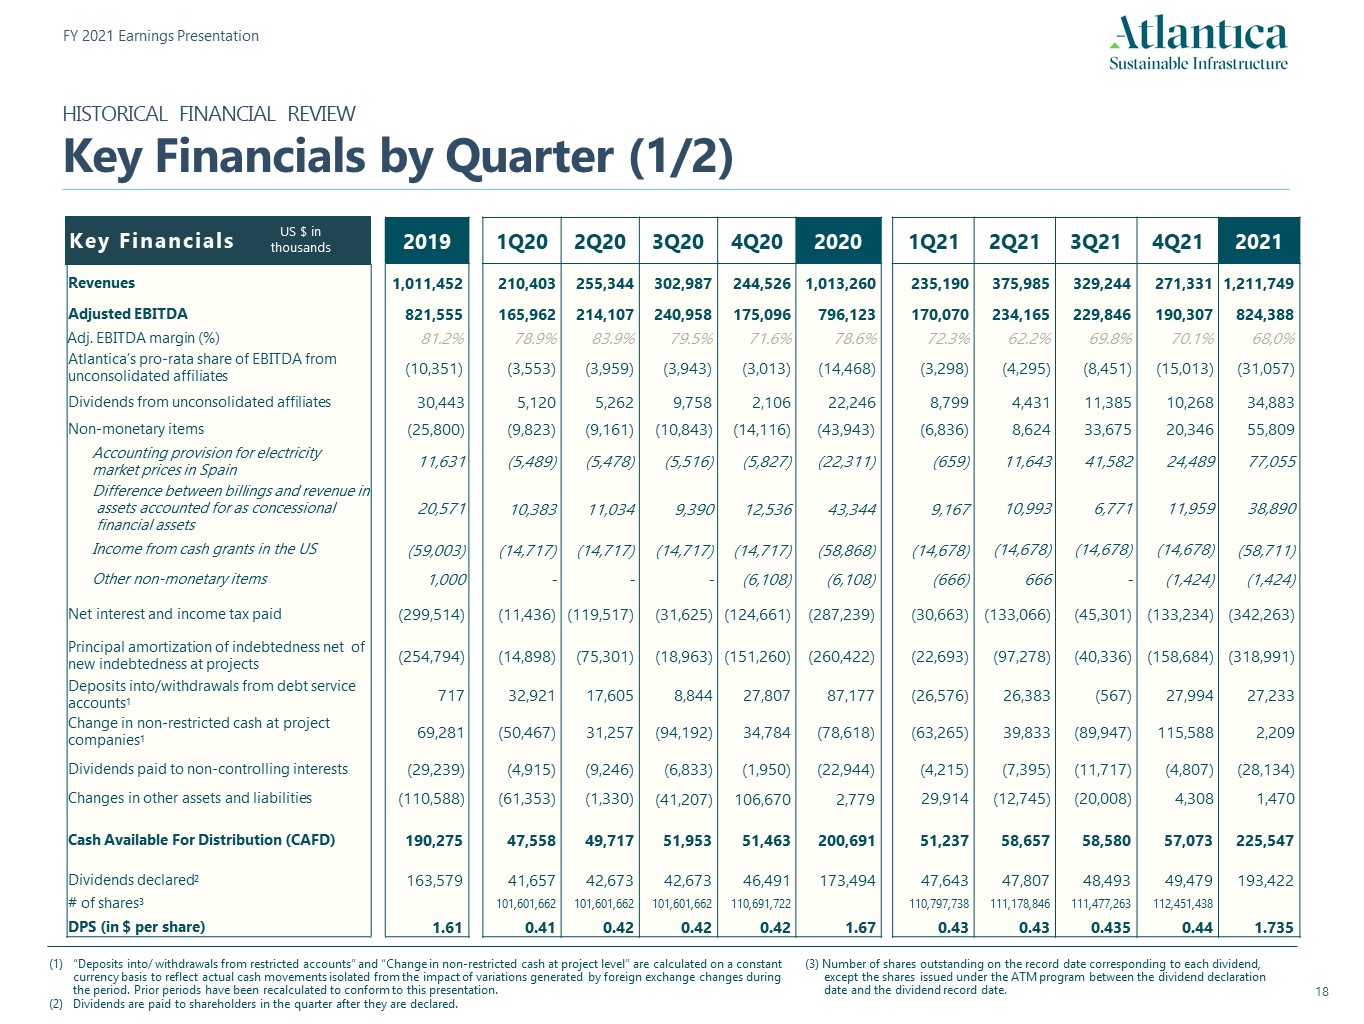
2019 1Q20 2Q20 3Q20 4Q20 2020 1Q21 2Q21 3Q21 4Q21 2021 Revenues 1,011,452 210,403 255,344 302,987 244,526 1,013,260 235,190 375,985 329,244 271,331 1,211,749 Adjusted EBITDA 821,555 165,962 214,107 240,958 175,096 796,123 170,070 234,165 229,846 190,307 824,388 Adj. EBITDA margin (%) 81.2% 78.9% 83.9% 79.5% 71.6% 78.6% 72.3% 62.2% 69.8% 70.1% 68,0% Atlantica’s pro-rata share of EBITDA from unconsolidated affiliates (10,351) (3,553) (3,959) (3,943) (3,013) (14,468) (3,298) (4,295) (8,451) (15,013) (31,057) Dividends from unconsolidated affiliates 30,443 5,120 5,262 9,758 2,106 22,246 8,799 4,431 11,385 10,268 34,883 Non-monetary items (25,800) (9,823) (9,161) (10,843) (14,116) (43,943) (6,836) 8,624 33,675 20,346 55,809 Accounting provision for electricity market prices in Spain 11,631 (5,489) (5,478) (5,516) (5,827) (22,311) (659) 11,643 41,582 24,489 77,055 Difference between billings and revenue in assets accounted for as concessional financial assets 20,571 10,383 11,034 9,390 12,536 43,344 9,167 10,993 6,771 11,959 38,890 Income from cash grants in the US (59,003) (14,717) (14,717) (14,717) (14,717) (58,868) (14,678) (14,678) (14,678) (14,678) (58,711) Other non-monetary items 1,000 - - - (6,108) (6,108) (666) 666 - (1,424) (1,424) Net interest and income tax paid (299,514) (11,436) (119,517) (31,625) (124,661) (287,239) (30,663) (133,066) (45,301) (133,234) (342,263) Principal amortization of indebtedness net of new indebtedness at projects (254,794) (14,898) (75,301) (18,963) (151,260) (260,422) (22,693) (97,278) (40,336) (158,684) (318,991) Deposits into/withdrawals from debt service accounts1 717 32,921 17,605 8,844 27,807 87,177 (26,576) 26,383 (567) 27,994 27,233 Change in non-restricted cash at project companies1 69,281 (50,467) 31,257 (94,192) 34,784 (78,618) (63,265) 39,833 (89,947) 115,588 2,209 Dividends paid to non-controlling interests (29,239) (4,915) (9,246) (6,833) (1,950) (22,944) (4,215) (7,395) (11,717) (4,807) (28,134) Changes in other assets and liabilities (110,588) (61,353) (1,330) (41,207) 106,670 2,779 29,914 (12,745) (20,008) 4,308 1,470 Cash Available For Distribution (CAFD) 190,275 47,558 49,717 51,953 51,463 200,691 51,237 58,657 58,580 57,073 225,547 Dividends declared2 163,579 41,657 42,673 42,673 46,491 173,494 47,643 47,807 48,493 49,479 193,422 # of shares3 101,601,662 101,601,662 101,601,662 110,691,722 110,797,738 111,178,846 111,477,263 112,451,438 DPS (in $ per share) 1.61 0.41 0.42 0.42 0.42 1.67 0.43 0.43 0.435 0.44 1.735 HISTORICAL FINANCIAL REVIEWKey Financials by Quarter (1/2) Key Financials US $ in thousands “Deposits into/ withdrawals from restricted accounts” and “Change in non-restricted cash at project level” are calculated on a constant currency basis to reflect actual cash movements isolated from the impact of variations generated by foreign exchange changes during the period. Prior periods have been recalculated to conform to this presentation.Dividends are paid to shareholders in the quarter after they are declared. US $ in millions (3) Number of shares outstanding on the record date corresponding to each dividend, except the shares issued under the ATM program between the dividend declaration date and the dividend record date.
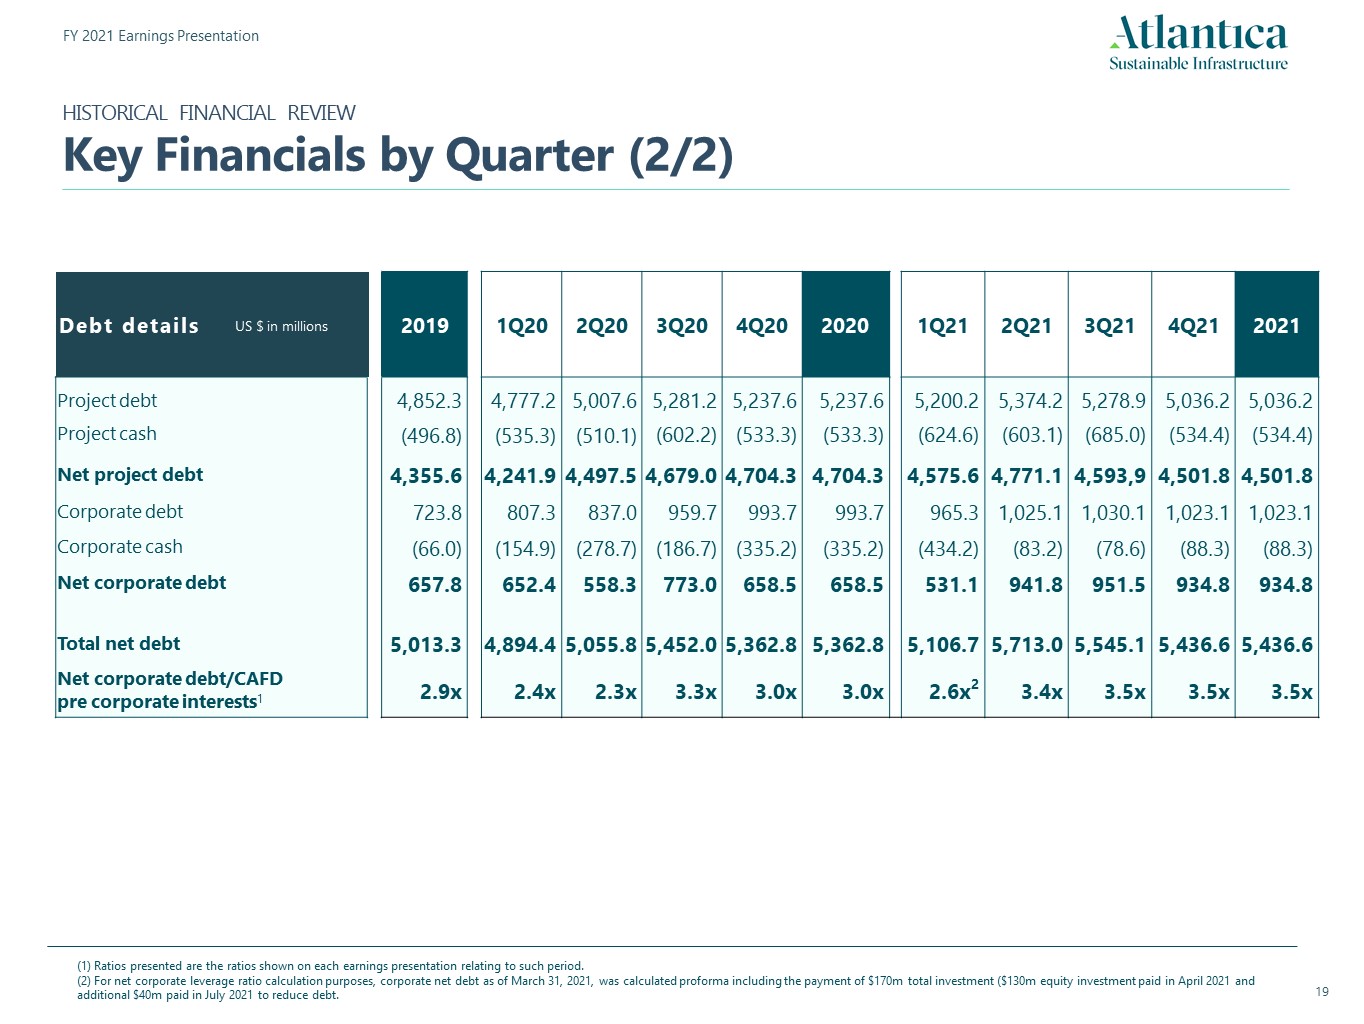
2019 1Q20 2Q20 3Q20 4Q20 2020 1Q21 2Q21 3Q21 4Q21 2021 Project debt 4,852.3 4,777.2 5,007.6 5,281.2 5,237.6 5,237.6 5,200.2 5,374.2 5,278.9 5,036.2 5,036.2 Project cash (496.8) (535.3) (510.1) (602.2) (533.3) (533.3) (624.6) (603.1) (685.0) (534.4) (534.4) Net project debt 4,355.6 4,241.9 4,497.5 4,679.0 4,704.3 4,704.3 4,575.6 4,771.1 4,593,9 4,501.8 4,501.8 Corporate debt 723.8 807.3 837.0 959.7 993.7 993.7 965.3 1,025.1 1,030.1 1,023.1 1,023.1 Corporate cash (66.0) (154.9) (278.7) (186.7) (335.2) (335.2) (434.2) (83.2) (78.6) (88.3) (88.3) Net corporate debt 657.8 652.4 558.3 773.0 658.5 658.5 531.1 941.8 951.5 934.8 934.8 Total net debt 5,013.3 4,894.4 5,055.8 5,452.0 5,362.8 5,362.8 5,106.7 5,713.0 5,545.1 5,436.6 5,436.6 Net corporate debt/CAFD pre corporate interests1 2.9x 2.4x 2.3x 3.3x 3.0x 3.0x 2.6x2 3.4x 3.5x 3.5x 3.5x HISTORICAL FINANCIAL REVIEWKey Financials by Quarter (2/2) Debt details US $ in millions (1) Ratios presented are the ratios shown on each earnings presentation relating to such period.(2) For net corporate leverage ratio calculation purposes, corporate net debt as of March 31, 2021, was calculated proforma including the payment of $170m total investment ($130m equity investment paid in April 2021 and additional $40m paid in July 2021 to reduce debt.
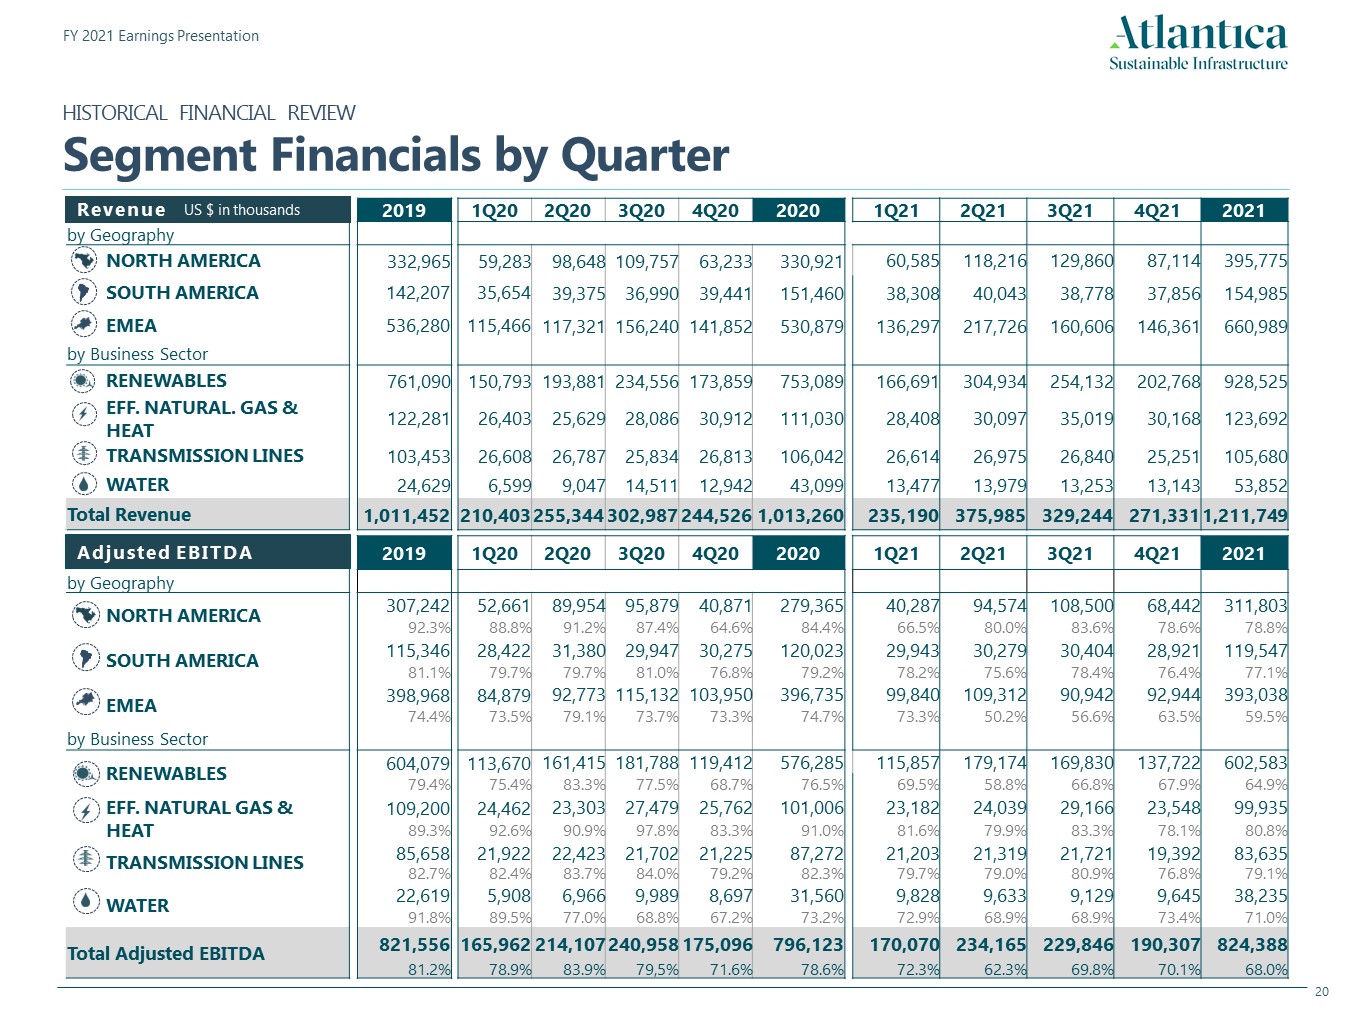
HISTORICAL FINANCIAL REVIEWSegment Financials by Quarter 2019 1Q20 2Q20 3Q20 4Q20 2020 1Q21 2Q21 3Q21 4Q21 2021 by Geography NORTH AMERICA 332,965 59,283 98,648 109,757 63,233 330,921 60,585 118,216 129,860 87,114 395,775 SOUTH AMERICA 142,207 35,654 39,375 36,990 39,441 151,460 38,308 40,043 38,778 37,856 154,985 EMEA 536,280 115,466 117,321 156,240 141,852 530,879 136,297 217,726 160,606 146,361 660,989 by Business Sector RENEWABLES 761,090 150,793 193,881 234,556 173,859 753,089 166,691 304,934 254,132 202,768 928,525 EFF. NATURAL. GAS & HEAT 122,281 26,403 25,629 28,086 30,912 111,030 28,408 30,097 35,019 30,168 123,692 TRANSMISSION LINES 103,453 26,608 26,787 25,834 26,813 106,042 26,614 26,975 26,840 25,251 105,680 WATER 24,629 6,599 9,047 14,511 12,942 43,099 13,477 13,979 13,253 13,143 53,852 Total Revenue 1,011,452 210,403 255,344 302,987 244,526 1,013,260 235,190 375,985 329,244 271,331 1,211,749 2019 1Q20 2Q20 3Q20 4Q20 2020 1Q21 2Q21 3Q21 4Q21 2021 by Geography NORTH AMERICA 307,242 52,661 89,954 95,879 40,871 279,365 40,287 94,574 108,500 68,442 311,803 92.3% 88.8% 91.2% 87.4% 64.6% 84.4% 66.5% 80.0% 83.6% 78.6% 78.8% SOUTH AMERICA 115,346 28,422 31,380 29,947 30,275 120,023 29,943 30,279 30,404 28,921 119,547 81.1% 79.7% 79.7% 81.0% 76.8% 79.2% 78.2% 75.6% 78.4% 76.4% 77.1% EMEA 398,968 84,879 92,773 115,132 103,950 396,735 99,840 109,312 90,942 92,944 393,038 74.4% 73.5% 79.1% 73.7% 73.3% 74.7% 73.3% 50.2% 56.6% 63.5% 59.5% by Business Sector RENEWABLES 604,079 113,670 161,415 181,788 119,412 576,285 115,857 179,174 169,830 137,722 602,583 79.4% 75.4% 83.3% 77.5% 68.7% 76.5% 69.5% 58.8% 66.8% 67.9% 64.9% EFF. NATURAL GAS & HEAT 109,200 24,462 23,303 27,479 25,762 101,006 23,182 24,039 29,166 23,548 99,935 89.3% 92.6% 90.9% 97.8% 83.3% 91.0% 81.6% 79.9% 83.3% 78.1% 80.8% TRANSMISSION LINES 85,658 21,922 22,423 21,702 21,225 87,272 21,203 21,319 21,721 19,392 83,635 82.7% 82.4% 83.7% 84.0% 79.2% 82.3% 79.7% 79.0% 80.9% 76.8% 79.1% WATER 22,619 5,908 6,966 9,989 8,697 31,560 9,828 9,633 9,129 9,645 38,235 91.8% 89.5% 77.0% 68.8% 67.2% 73.2% 72.9% 68.9% 68.9% 73.4% 71.0% Total Adjusted EBITDA 821,556 165,962 214,107 240,958 175,096 796,123 170,070 234,165 229,846 190,307 824,388 81.2% 78.9% 83.9% 79,5% 71.6% 78.6% 72.3% 62.3% 69.8% 70.1% 68.0% Adjusted EBITDA Revenue US $ in thousands

2019 1Q20 2Q20 3Q20 4Q20 2020 1Q21 2Q21 3Q21 4Q21 2021 RENEWABLES3 (GWh) 3,236 526 957 1,125 636 3,244 606 1,377 1,477 1,195 4,655 (GWh) 2,090 644 624 664 642 2,574 542 501 622 627 2,292 (availability %) 95.0% 102.4% 100.9% 103.8% 101.2% 102.1% 98.3% 100.1% 101.1% 103.0% 100.6% TRANSMISSION LINES (availability %) 100.0% 99.9% 99.9% 100.0% 100.0% 100.0% 100.0% 99.9% 100.0% 100.0% 100.0% WATER (availability %) 101.2% 101.8% 102.2% 101.1% 95.4% 100.1% 97.5% 101.9% 99.8% 91.9% 97.9% 2019 1Q20 2Q20 3Q20 4Q20 2020 1Q21 2Q21 3Q21 4Q21 2021 RENEWABLES1 (MW) 1,496 1,496 1,551 1,551 1,551 1,551 1,591 2,018 2,022 2,044 2,044 EFFICIENT NAT. GAS & HEAT2 (MW) 343 343 343 343 343 343 343 398 398 398 398 TRANSMISSION LINES (Miles) 1,166 1,166 1,166 1,166 1,166 1,166 1,166 1,166 1,166 1,166 1,166 WATER1 (Mft3/day) 10.5 10.5 17.5 17.5 17.5 17.5 17.5 17.5 17.5 17.5 17.5 Capacity in operation(at the end of the period) Production / Availability 5 5 5 Represents total installed capacity in assets owned or consolidated at the end of the period, regardless of our percentage of ownership in each of the assets, except for Vento II, for which we have included our 49% interest. Includes 43 MW corresponding to our 30% share in Monterrey since August 2, 2019, and 55 MWt corresponding to thermal capacity from Calgary District Heating since May 14, 2021.Includes 49% of Vento II production since its acquisition. Includes curtailment in wind assets for which we receive compensation.Major maintenance overhaul held in Q1 and Q2 2019 in ACT, as scheduled, which reduced production and electric availability as per the contract. GWh produced includes 30% of the production from Monterrey since August 2, 2019.Availability refers to the time during which the asset was available to our client totally or partially divided by contracted or budgeted availability, as applicable. EFFICIENT NAT. GAS & HEAT 4 HISTORICAL FINANCIAL REVIEWKey Performance Indicators
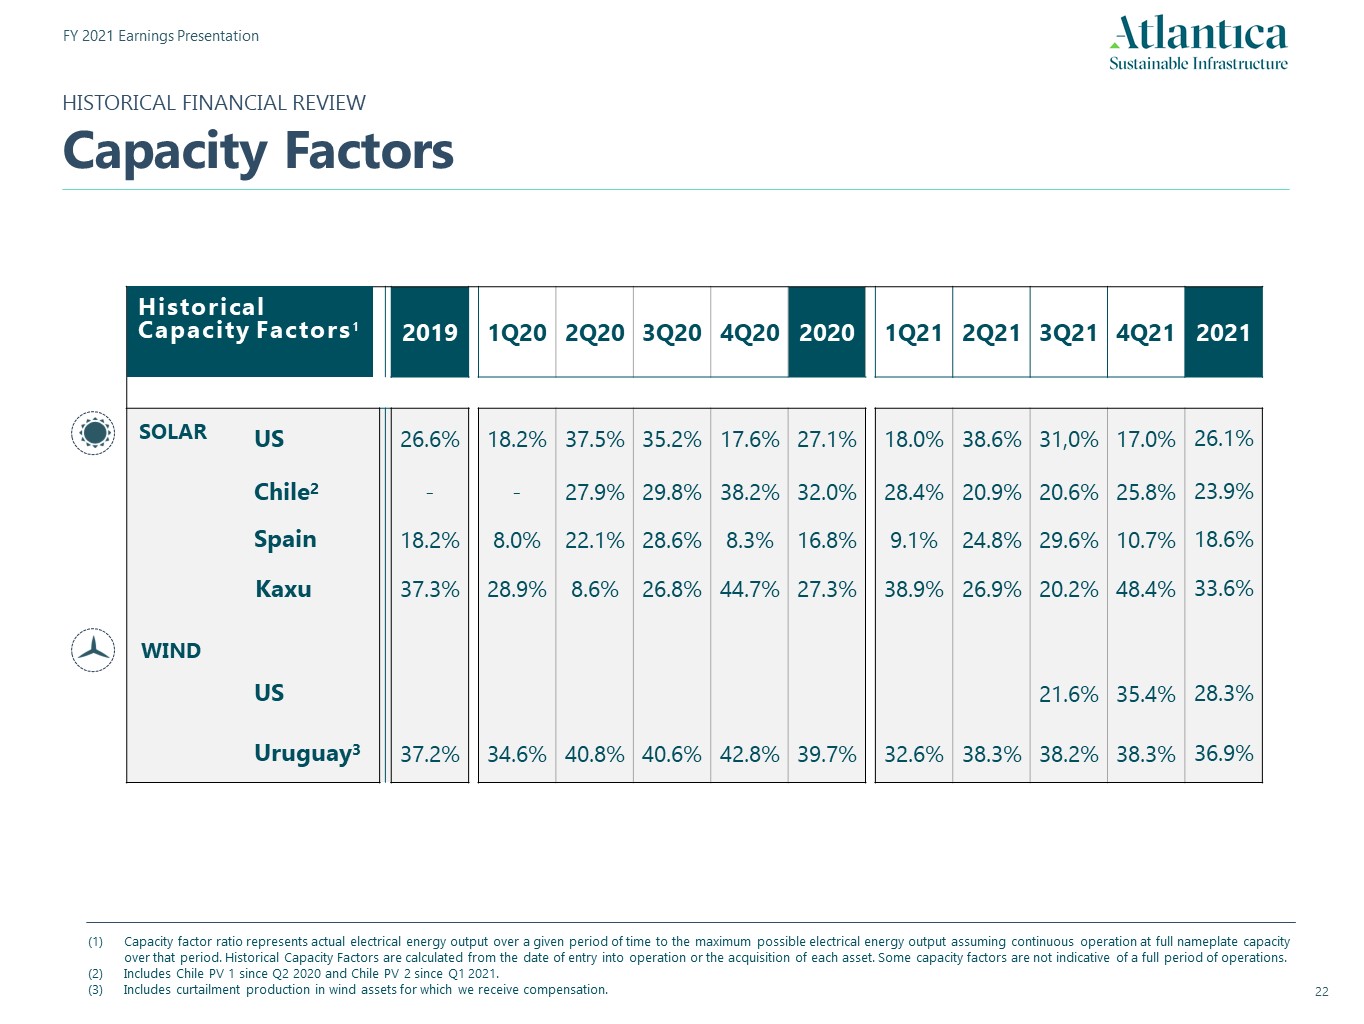
2019 1Q20 2Q20 3Q20 4Q20 2020 1Q21 2Q21 3Q21 4Q21 2021 US 26.6% 18.2% 37.5% 35.2% 17.6% 27.1% 18.0% 38.6% 31,0% 17.0% 26.1% Chile2 - - 27.9% 29.8% 38.2% 32.0% 28.4% 20.9% 20.6% 25.8% 23.9% Spain 18.2% 8.0% 22.1% 28.6% 8.3% 16.8% 9.1% 24.8% 29.6% 10.7% 18.6% Kaxu 37.3% 28.9% 8.6% 26.8% 44.7% 27.3% 38.9% 26.9% 20.2% 48.4% 33.6% US 21.6% 35.4% 28.3% Uruguay3 37.2% 34.6% 40.8% 40.6% 42.8% 39.7% 32.6% 38.3% 38.2% 38.3% 36.9% SOLAR Historical Capacity Factors1 Capacity factor ratio represents actual electrical energy output over a given period of time to the maximum possible electrical energy output assuming continuous operation at full nameplate capacity over that period. Historical Capacity Factors are calculated from the date of entry into operation or the acquisition of each asset. Some capacity factors are not indicative of a full period of operations.Includes Chile PV 1 since Q2 2020 and Chile PV 2 since Q1 2021.Includes curtailment production in wind assets for which we receive compensation. HISTORICAL FINANCIAL REVIEWCapacity Factors WIND
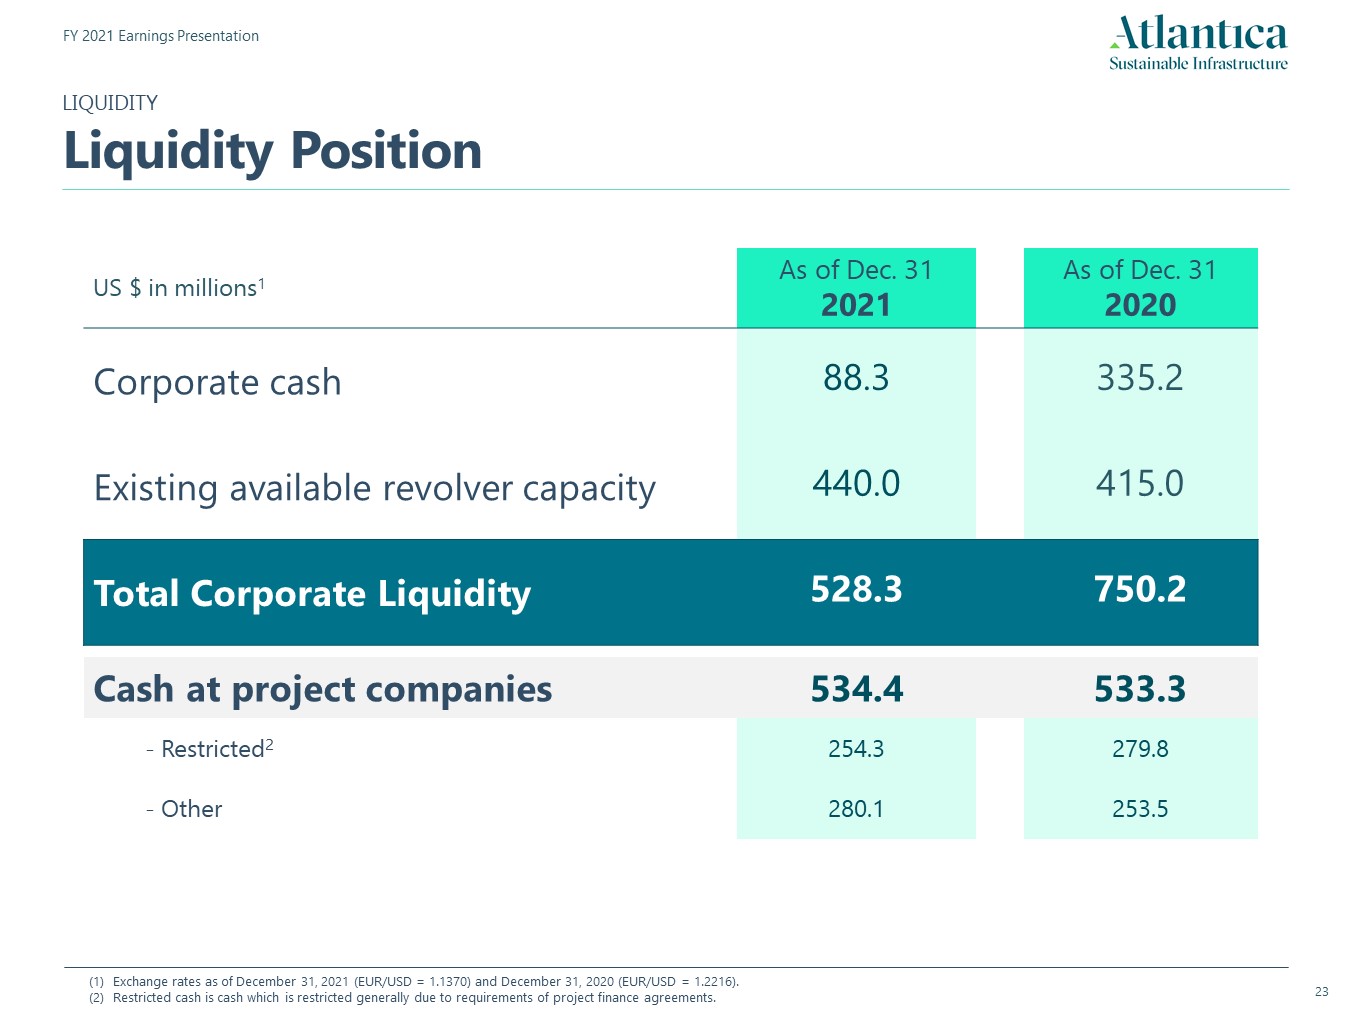
Exchange rates as of December 31, 2021 (EUR/USD = 1.1370) and December 31, 2020 (EUR/USD = 1.2216).Restricted cash is cash which is restricted generally due to requirements of project finance agreements. US $ in millions1 As of Dec. 312021 As of Dec. 312020 Corporate cash 88.3 335.2 Existing available revolver capacity 440.0 415.0 Total Corporate Liquidity 528.3 750.2 Cash at project companies 534.4 533.3 - Restricted2 254.3 279.8 - Other 280.1 253.5 LIQUIDITYLiquidity Position
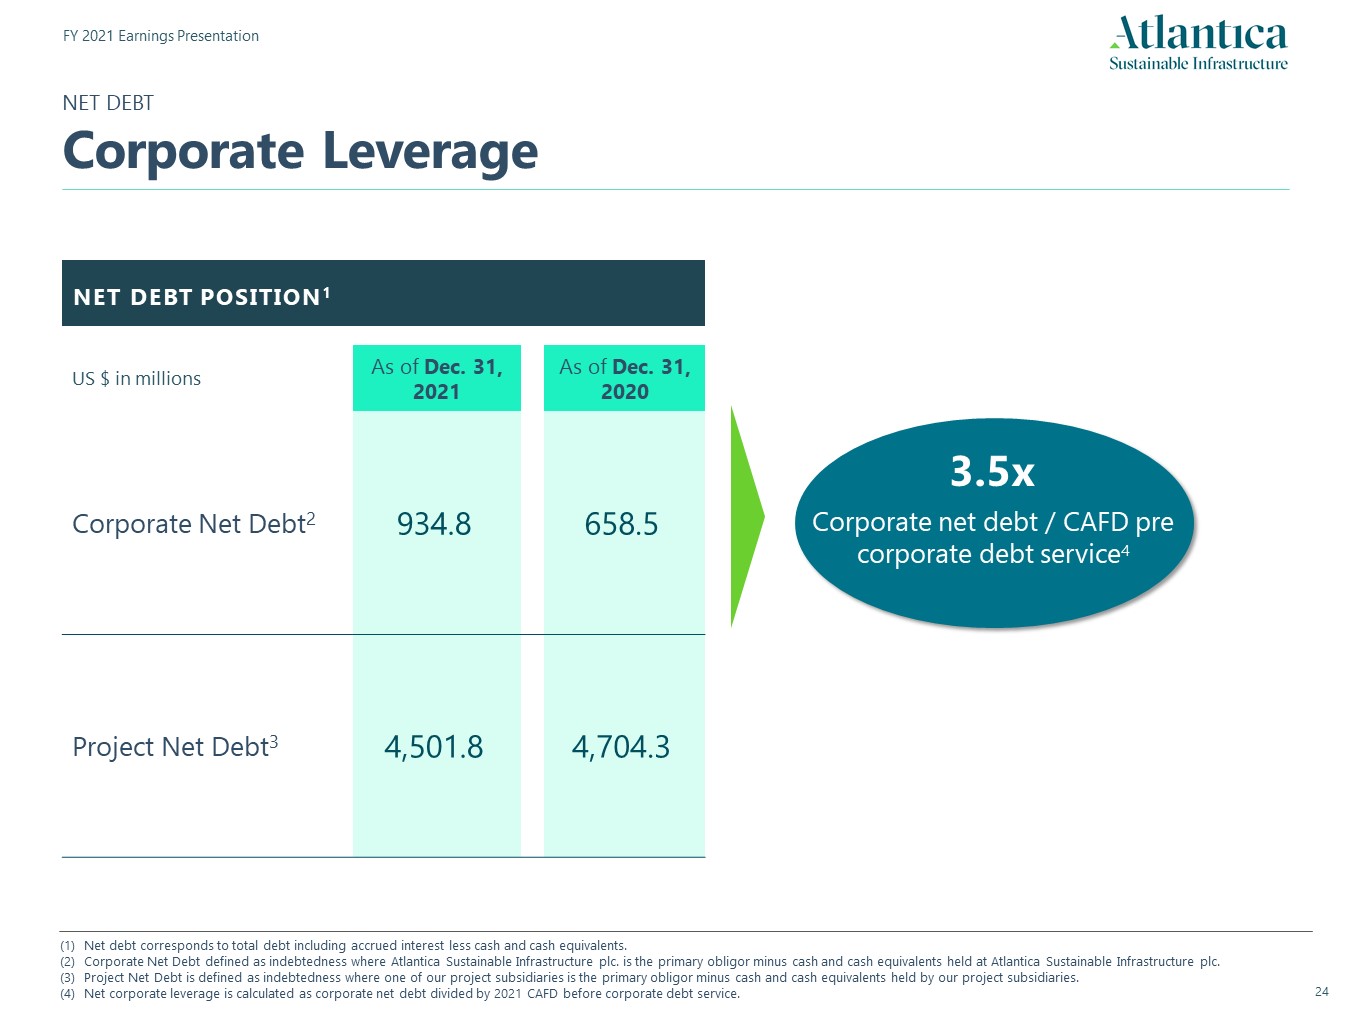
NET DEBT POSITION1 Net debt corresponds to total debt including accrued interest less cash and cash equivalents.Corporate Net Debt defined as indebtedness where Atlantica Sustainable Infrastructure plc. is the primary obligor minus cash and cash equivalents held at Atlantica Sustainable Infrastructure plc. Project Net Debt is defined as indebtedness where one of our project subsidiaries is the primary obligor minus cash and cash equivalents held by our project subsidiaries.Net corporate leverage is calculated as corporate net debt divided by 2021 CAFD before corporate debt service. US $ in millions As of Dec. 31,2021 As of Dec. 31,2020 Corporate Net Debt2 934.8 658.5 Project Net Debt3 4,501.8 4,704.3 NET DEBTCorporate Leverage Corporate net debt / CAFD pre corporate debt service X.Xx Corporate net debt / CAFD pre corporate debt service4 3.5x
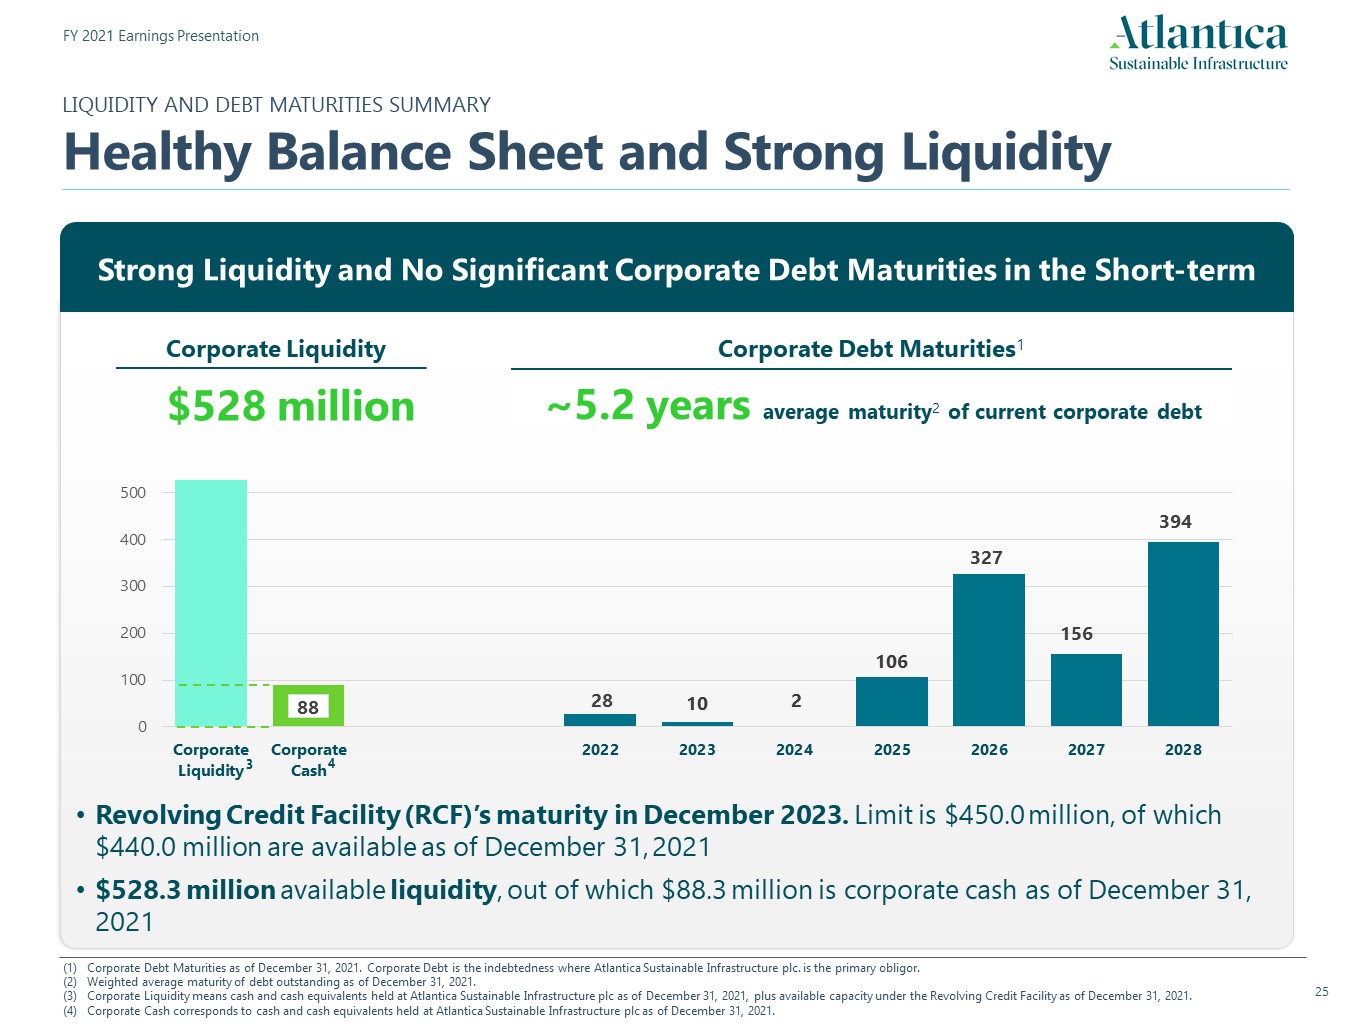
LIQUIDITY AND DEBT MATURITIES SUMMARYHealthy Balance Sheet and Strong Liquidity Strong Liquidity and No Significant Corporate Debt Maturities in the Short-term $528 million Corporate Liquidity ~5.2 years average maturity2 of current corporate debt Revolving Credit Facility (RCF)’s maturity in December 2023. Limit is $450.0 million, of which $440.0 million are available as of December 31, 2021$528.3 million available liquidity, out of which $88.3 million is corporate cash as of December 31, 2021 Corporate Debt Maturities1 Corporate Debt Maturities as of December 31, 2021. Corporate Debt is the indebtedness where Atlantica Sustainable Infrastructure plc. is the primary obligor.Weighted average maturity of debt outstanding as of December 31, 2021.Corporate Liquidity means cash and cash equivalents held at Atlantica Sustainable Infrastructure plc as of December 31, 2021, plus available capacity under the Revolving Credit Facility as of December 31, 2021.Corporate Cash corresponds to cash and cash equivalents held at Atlantica Sustainable Infrastructure plc as of December 31, 2021. 10 2 3 4 106
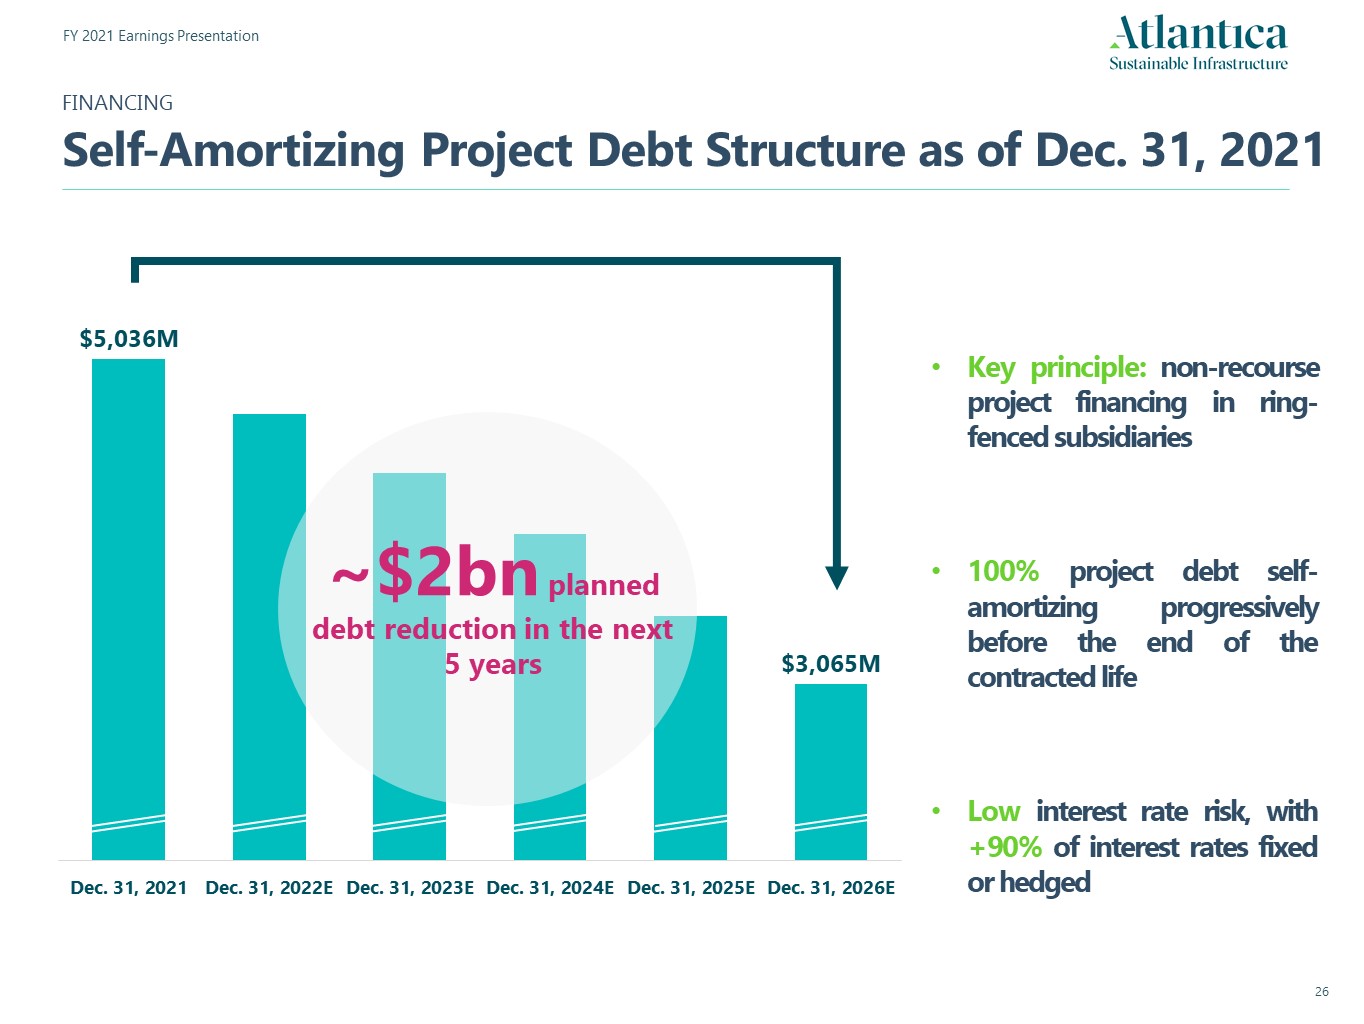
Key principle: non-recourse project financing in ring-fenced subsidiaries100% project debt self-amortizing progressively before the end of the contracted lifeLow interest rate risk, with +90% of interest rates fixed or hedged ~$2bn planned debt reduction in the next 5 years FINANCING Self-Amortizing Project Debt Structure as of Dec. 31, 2021
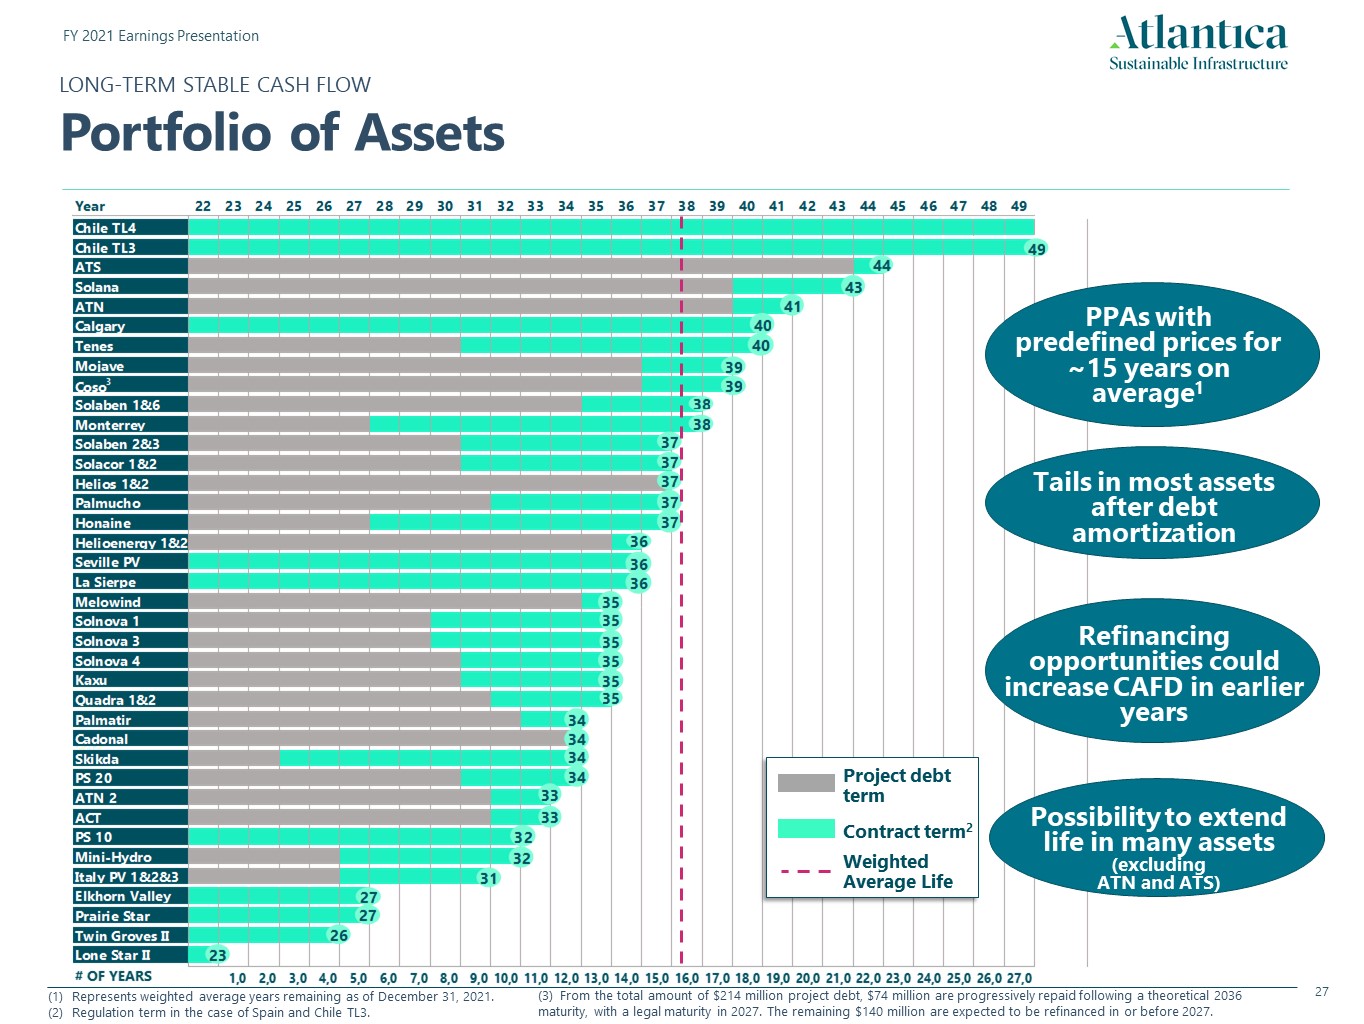
Weighted Average Life Project debt term PPAs with predefined prices for ~15 years on average1 Refinancing opportunities could increase CAFD in earlier years Possibility to extend life in many assets (excluding ATN and ATS) Tails in most assets after debt amortization Contract term2 LONG-TERM STABLE CASH FLOWPortfolio of Assets Represents weighted average years remaining as of December 31, 2021.Regulation term in the case of Spain and Chile TL3. (3) From the total amount of $214 million project debt, $74 million are progressively repaid following a theoretical 2036 maturity, with a legal maturity in 2027. The remaining $140 million are expected to be refinanced in or before 2027.
NON-GAAP FINANCIAL INFORMATIONReconciliation of Non-GAAP Measures Our management believes Adjusted EBITDA, CAFD and CAFD per share are useful to investors and other users of our financial statements in evaluating our operating performance because it provides them with an additional tool to compare business performance across companies and across periods. Adjusted EBITDA is widely used by investors to measure a company’s operating performance without regard to items such as interest expense, taxes, depreciation and amortization, which can vary substantially from company to company depending upon accounting methods and book value of assets, capital structure and the method by which assets were acquired. Our management believes CAFD and CAFD per share are relevant supplemental measure of the Company’s ability to earn and distribute cash returns to investors and is useful to investors in evaluating our operating performance because securities analysts and other interested parties use such calculations as a measure of our ability to make quarterly distributions. In addition, CAFD is used by our management team for determining future acquisitions and managing our growth. Adjusted EBITDA, CAFD and CAFD per share are widely used by other companies in the same industry. Our management uses Adjusted EBITDA, CAFD and CAFD per share as measures of operating performance to assist in comparing performance from period to period and aims to use them on a consistent basis moving forward. They also readily view operating trends as a measure for planning and forecasting overall expectations, for evaluating actual results against such expectations, and for communicating with our board of directors, shareholders, creditors, analysts and investors concerning our financial performance.We present non-GAAP financial measures because we believe that they and other similar measures are widely used by certain investors, securities analysts and other interested parties as supplemental measures of performance and liquidity. The non-GAAP financial measures may not be comparable to other similarly titled measures employed by other companies and they may have limitations as analytical tools. These measures may not be fit for isolated consideration or as a substitute for analysis of our operating results as reported under IFRS as issued by the IASB. Non-GAAP financial measures and ratios are not measurements of our performance or liquidity under IFRS as issued by the IASB. Thus, they should not be considered as alternatives to operating profit, profit for the period, any other performance measures derived in accordance with IFRS as issued by the IASB, any other generally accepted accounting principles or as alternatives to cash flow from operating, investing or financing activities. Some of the limitations of these non-GAAP measures are:they do not reflect our cash expenditures, future requirements for capital expenditures or contractual commitments; they do not reflect changes in, or cash requirements for, our working capital needs;they may not reflect the significant interest expense, or the cash requirements necessary, to service interest or principal payments, on our debts;although depreciation and amortization are non-cash charges, the assets being depreciated and amortized will often need to be replaced in the future and Adjusted EBITDA, CAFD and CAFD per share do not reflect any cash requirements that would be required for such replacements;some of the exceptional items that we eliminate in calculating Adjusted EBITDA reflect cash payments that were made, or will be made in the future; andthe fact that other companies in our industry may calculate Adjusted EBITDA, CAFD and CAFD per share differently than we do, which limits their usefulness as comparative measures.We define Adjusted EBITDA as profit/(loss) for the year attributable to the parent company, after adding back loss/(profit) attributable to non-controlling interest, income tax expense, financial expense (net), depreciation, amortization and impairment charges of entities included in the Annual Consolidated Financial Statements and Depreciation and amortization, financial expense and income tax expense of unconsolidated affiliates (pro rata of our equity ownership). Adjusted EBITDA previously excluded share of profit/(loss) of associates carried under the equity method and did not include Depreciation and amortization, financial expense and income tax expense of unconsolidated affiliates (pro-rata of our equity ownership). Prior periods have been presented accordingly. CAFD is calculated as cash distributions received by the Company from its subsidiaries minus cash expenses of the Company, including third party debt service and general and administrative expenses. CAFD per share is calculated by dividing CAFD for the period by weighted average number of shares for the period.
NON-GAAP FINANCIAL INFORMATIONReconciliation of Non-GAAP Measures Our management believes Adjusted EBITDA, CAFD and CAFD per share are useful to investors and other users of our financial statements in evaluating our operating performance because it provides them with an additional tool to compare business performance across companies and across periods. Adjusted EBITDA is widely used by investors to measure a company’s operating performance without regard to items such as interest expense, taxes, depreciation and amortization, which can vary substantially from company to company depending upon accounting methods and book value of assets, capital structure and the method by which assets were acquired. Our management believes CAFD and CAFD per share are relevant supplemental measure of the Company’s ability to earn and distribute cash returns to investors and is useful to investors in evaluating our operating performance because securities analysts and other interested parties use such calculations as a measure of our ability to make quarterly distributions. In addition, CAFD is used by our management team for determining future acquisitions and managing our growth. Adjusted EBITDA, CAFD and CAFD per share are widely used by other companies in the same industry. Our management uses Adjusted EBITDA, CAFD and CAFD per share as measures of operating performance to assist in comparing performance from period to period and aims to use them on a consistent basis moving forward. They also readily view operating trends as a measure for planning and forecasting overall expectations, for evaluating actual results against such expectations, and for communicating with our board of directors, shareholders, creditors, analysts and investors concerning our financial performance.We present non-GAAP financial measures because we believe that they and other similar measures are widely used by certain investors, securities analysts and other interested parties as supplemental measures of performance and liquidity. The non-GAAP financial measures may not be comparable to other similarly titled measures employed by other companies and they may have limitations as analytical tools. These measures may not be fit for isolated consideration or as a substitute for analysis of our operating results as reported under IFRS as issued by the IASB. Non-GAAP financial measures and ratios are not measurements of our performance or liquidity under IFRS as issued by the IASB. Thus, they should not be considered as alternatives to operating profit, profit for the period, any other performance measures derived in accordance with IFRS as issued by the IASB, any other generally accepted accounting principles or as alternatives to cash flow from operating, investing or financing activities. Some of the limitations of these non-GAAP measures are:they do not reflect our cash expenditures, future requirements for capital expenditures or contractual commitments; they do not reflect changes in, or cash requirements for, our working capital needs;they may not reflect the significant interest expense, or the cash requirements necessary, to service interest or principal payments, on our debts;although depreciation and amortization are non-cash charges, the assets being depreciated and amortized will often need to be replaced in the future and Adjusted EBITDA, CAFD and CAFD per share do not reflect any cash requirements that would be required for such replacements;some of the exceptional items that we eliminate in calculating Adjusted EBITDA reflect cash payments that were made, or will be made in the future; andthe fact that other companies in our industry may calculate Adjusted EBITDA, CAFD and CAFD per share differently than we do, which limits their usefulness as comparative measures.We define Adjusted EBITDA as profit/(loss) for the year attributable to the parent company, after adding back loss/(profit) attributable to non-controlling interest, income tax expense, financial expense (net), depreciation, amortization and impairment charges of entities included in the Annual Consolidated Financial Statements and Depreciation and amortization, financial expense and income tax expense of unconsolidated affiliates (pro rata of our equity ownership). Adjusted EBITDA previously excluded share of profit/(loss) of associates carried under the equity method and did not include Depreciation and amortization, financial expense and income tax expense of unconsolidated affiliates. Prior periods have been presented accordingly. CAFD is calculated as cash distributions received by the Company from its subsidiaries minus cash expenses of the Company, including third party debt service and general and administrative expenses. CAFD per share is calculated by dividing CAFD for the period by weighted average number (pro-rata of our equity ownership) of shares for the period.
NON-GAAP FINANCIAL INFORMATIONReconciliation of Non-GAAP Measures Our management believes Adjusted EBITDA, CAFD and CAFD per share are useful to investors and other users of our financial statements in evaluating our operating performance because it provides them with an additional tool to compare business performance across companies and across periods. Adjusted EBITDA is widely used by investors to measure a company’s operating performance without regard to items such as interest expense, taxes, depreciation and amortization, which can vary substantially from company to company depending upon accounting methods and book value of assets, capital structure and the method by which assets were acquired. Our management believes CAFD and CAFD per share are relevant supplemental measure of the Company’s ability to earn and distribute cash returns to investors and is useful to investors in evaluating our operating performance because securities analysts and other interested parties use such calculations as a measure of our ability to make quarterly distributions. In addition, CAFD is used by our management team for determining future acquisitions and managing our growth. Adjusted EBITDA, CAFD and CAFD per share are widely used by other companies in the same industry. Our management uses Adjusted EBITDA, CAFD and CAFD per share as measures of operating performance to assist in comparing performance from period to period and aims to use them on a consistent basis moving forward. They also readily view operating trends as a measure for planning and forecasting overall expectations, for evaluating actual results against such expectations, and for communicating with our board of directors, shareholders, creditors, analysts and investors concerning our financial performance.We present non-GAAP financial measures because we believe that they and other similar measures are widely used by certain investors, securities analysts and other interested parties as supplemental measures of performance and liquidity. The non-GAAP financial measures may not be comparable to other similarly titled measures employed by other companies and they may have limitations as analytical tools. These measures may not be fit for isolated consideration or as a substitute for analysis of our operating results as reported under IFRS as issued by the IASB. Non-GAAP financial measures and ratios are not measurements of our performance or liquidity under IFRS as issued by the IASB. Thus, they should not be considered as alternatives to operating profit, profit for the period, any other performance measures derived in accordance with IFRS as issued by the IASB, any other generally accepted accounting principles or as alternatives to cash flow from operating, investing or financing activities. Some of the limitations of these non-GAAP measures are:they do not reflect our cash expenditures, future requirements for capital expenditures or contractual commitments; they do not reflect changes in, or cash requirements for, our working capital needs;they may not reflect the significant interest expense, or the cash requirements necessary, to service interest or principal payments, on our debts;although depreciation and amortization are non-cash charges, the assets being depreciated and amortized will often need to be replaced in the future and Adjusted EBITDA, CAFD and CAFD per share do not reflect any cash requirements that would be required for such replacements;some of the exceptional items that we eliminate in calculating Adjusted EBITDA reflect cash payments that were made, or will be made in the future; andthe fact that other companies in our industry may calculate Adjusted EBITDA, CAFD and CAFD per share differently than we do, which limits their usefulness as comparative measures.We define Adjusted EBITDA as profit/(loss) for the year attributable to the parent company, after adding back loss/(profit) attributable to non-controlling interest, income tax expense, financial expense (net), depreciation, amortization and impairment charges of entities included in the Annual Consolidated Financial Statements and Depreciation and amortization, financial expense and income tax expense of unconsolidated affiliates (pro rata of our equity ownership). Adjusted EBITDA previously excluded share of profit/(loss) of associates carried under the equity method and did not include Depreciation and amortization, financial expense and income tax expense of unconsolidated affiliates. Prior periods have been presented accordingly. CAFD is calculated as cash distributions received by the Company from its subsidiaries minus cash expenses of the Company, including third party debt service and general and administrative expenses. CAFD per share is calculated by dividing CAFD for the period by weighted average number of shares for the period.
NON-GAAP FINANCIAL INFORMATIONReconciliation of Non-GAAP Measures Information presented as the pro-rata share of our unconsolidated affiliates reflects our proportionate ownership of each asset in our property portfolio that we do not consolidate and has been calculated by multiplying our unconsolidated affiliates’ financial statement line items by our percentage ownership thereto. Note 7 to our consolidated financial statements as of and for the year ended December 31, 2021 includes a description of our unconsolidated affiliates and our pro rata share thereof. We do not control the unconsolidated affiliates. Multiplying our unconsolidated affiliates’ financial statement line items by our percentage ownership may not accurately represent the legal and economic implications of holding a noncontrolling interest in an unconsolidated affiliate. We include pro-rata share of depreciation and amortization, financial expense and income tax expense of unconsolidated affiliates because we believe it assists investors in estimating the effect of such items in the profit/(loss) of associates carried under the equity method (which is included in the calculation of our Adjusted EBITDA) based on our economic interest in such unconsolidated affiliates. Each unconsolidated affiliate may report a specific line item in its financial statements in a different manner. In addition, other companies in our industry may calculate their proportionate interest in unconsolidated affiliates differently than we do, limiting the usefulness of such information as a comparative measure. Because of these limitations, the information presented as the pro-rata share of our unconsolidated affiliates should not be considered in isolation or as a substitute for our or such unconsolidated affiliates’ financial statements as reported under applicable accounting principles.
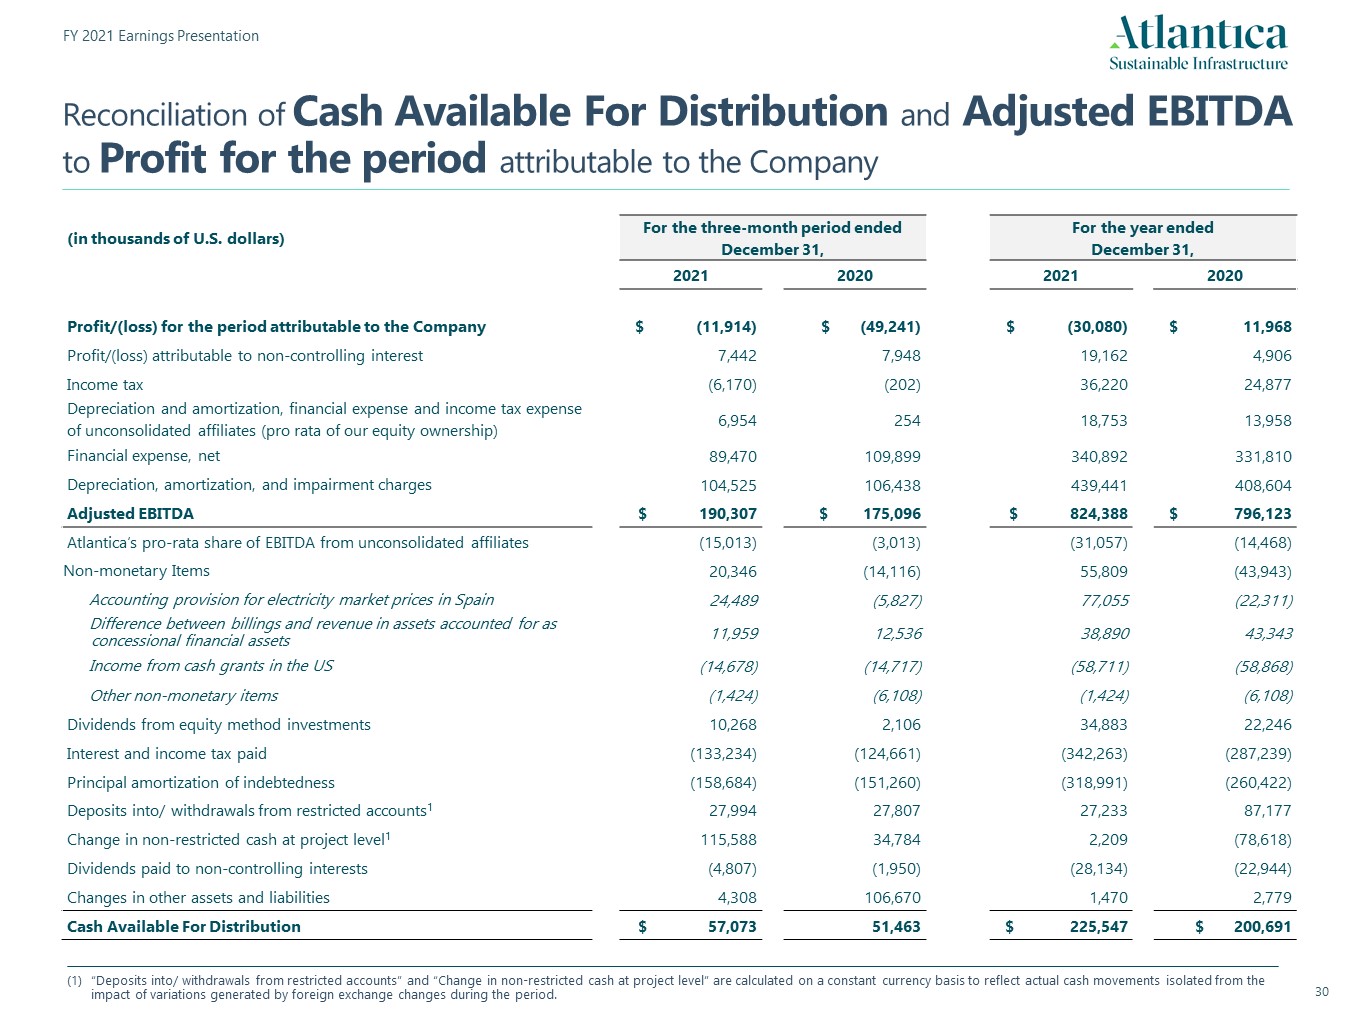
Reconciliation of Cash Available For Distribution and Adjusted EBITDA to Profit for the period attributable to the Company “Deposits into/ withdrawals from restricted accounts” and “Change in non-restricted cash at project level” are calculated on a constant currency basis to reflect actual cash movements isolated from the impact of variations generated by foreign exchange changes during the period. (in thousands of U.S. dollars) For the three-month period ended December 31, For the year ended December 31, 2021 2020 2021 2020 Profit/(loss) for the period attributable to the Company $ (11,914) $ (49,241) $ (30,080) $ 11,968 Profit/(loss) attributable to non-controlling interest 7,442 7,948 19,162 4,906 Income tax (6,170) (202) 36,220 24,877 Depreciation and amortization, financial expense and income tax expense of unconsolidated affiliates (pro rata of our equity ownership) 6,954 254 18,753 13,958 Financial expense, net 89,470 109,899 340,892 331,810 Depreciation, amortization, and impairment charges 104,525 106,438 439,441 408,604 Adjusted EBITDA $ 190,307 $ 175,096 $ 824,388 $ 796,123 Atlantica’s pro-rata share of EBITDA from unconsolidated affiliates (15,013) (3,013) (31,057) (14,468) Non-monetary Items 20,346 (14,116) 55,809 (43,943) Accounting provision for electricity market prices in Spain 24,489 (5,827) 77,055 (22,311) Difference between billings and revenue in assets accounted for as concessional financial assets 11,959 12,536 38,890 43,343 Income from cash grants in the US (14,678) (14,717) (58,711) (58,868) Other non-monetary items (1,424) (6,108) (1,424) (6,108) Dividends from equity method investments 10,268 2,106 34,883 22,246 Interest and income tax paid (133,234) (124,661) (342,263) (287,239) Principal amortization of indebtedness (158,684) (151,260) (318,991) (260,422) Deposits into/ withdrawals from restricted accounts1 27,994 27,807 27,233 87,177 Change in non-restricted cash at project level1 115,588 34,784 2,209 (78,618) Dividends paid to non-controlling interests (4,807) (1,950) (28,134) (22,944) Changes in other assets and liabilities 4,308 106,670 1,470 2,779 Cash Available For Distribution $ 57,073 51,463 $ 225,547 $ 200,691
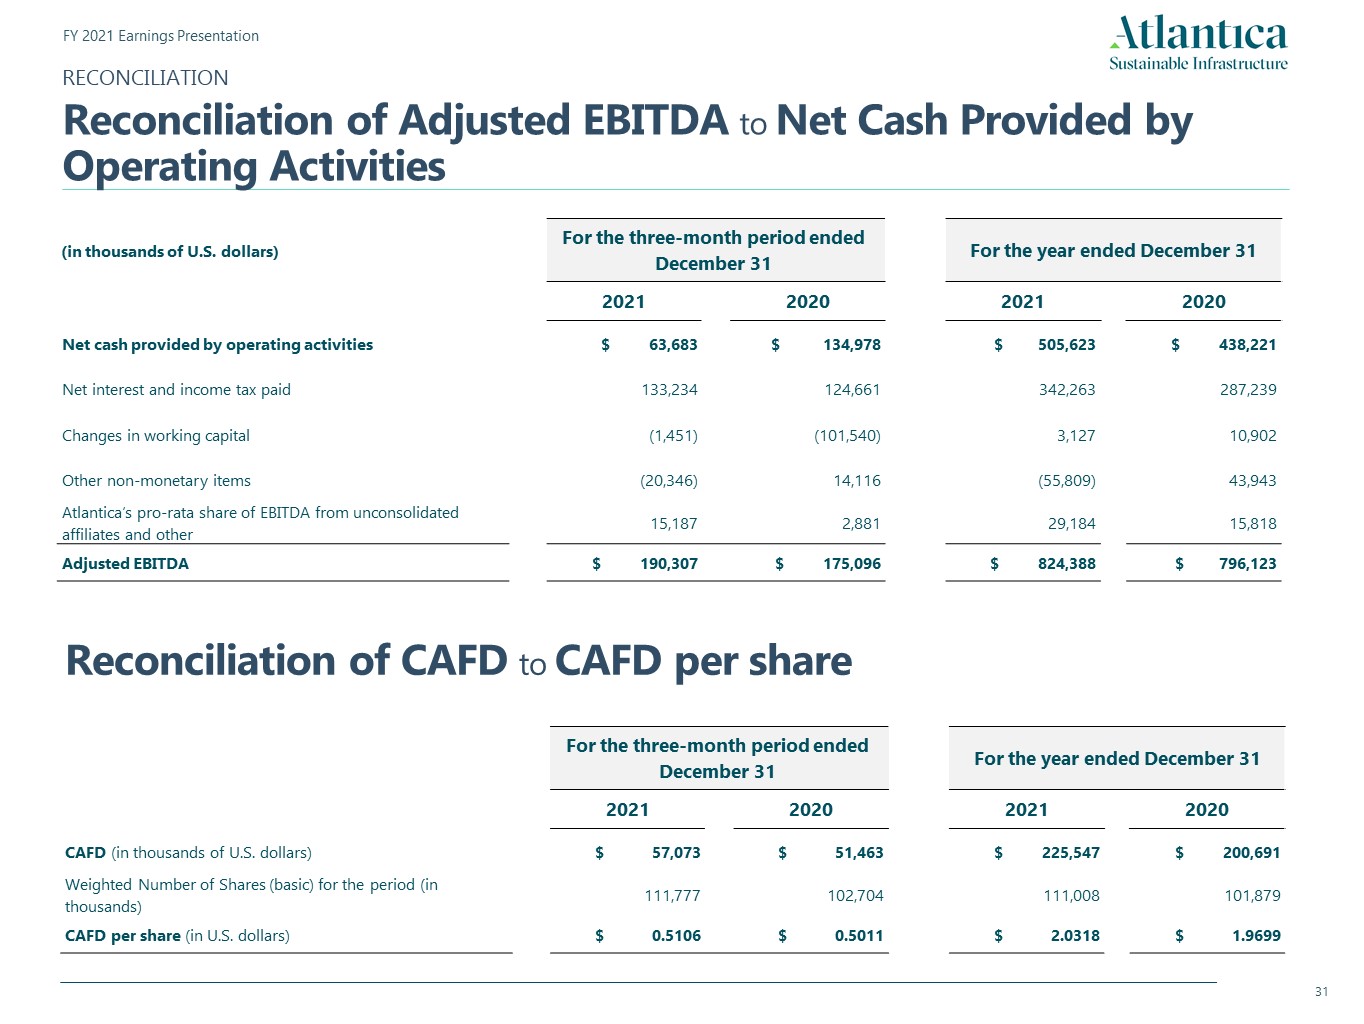
RECONCILIATIONReconciliation of Adjusted EBITDA to Net Cash Provided by Operating Activities (in thousands of U.S. dollars) For the three-month period ended December 31 For the year ended December 31 2021 2020 2021 2020 Net cash provided by operating activities $ 63,683 $ 134,978 $ 505,623 $ 438,221 Net interest and income tax paid 133,234 124,661 342,263 287,239 Changes in working capital (1,451) (101,540) 3,127 10,902 Other non-monetary items (20,346) 14,116 (55,809) 43,943 Atlantica’s pro-rata share of EBITDA from unconsolidated affiliates and other 15,187 2,881 29,184 15,818 Adjusted EBITDA $ 190,307 $ 175,096 $ 824,388 $ 796,123 Reconciliation of CAFD to CAFD per share For the three-month period ended December 31 For the year ended December 31 2021 2020 2021 2020 CAFD (in thousands of U.S. dollars) $ 57,073 $ 51,463 $ 225,547 $ 200,691 Weighted Number of Shares (basic) for the period (in thousands) 111,777 102,704 111,008 101,879 CAFD per share (in U.S. dollars) $ 0.5106 $ 0.5011 $ 2.0318 $ 1.9699
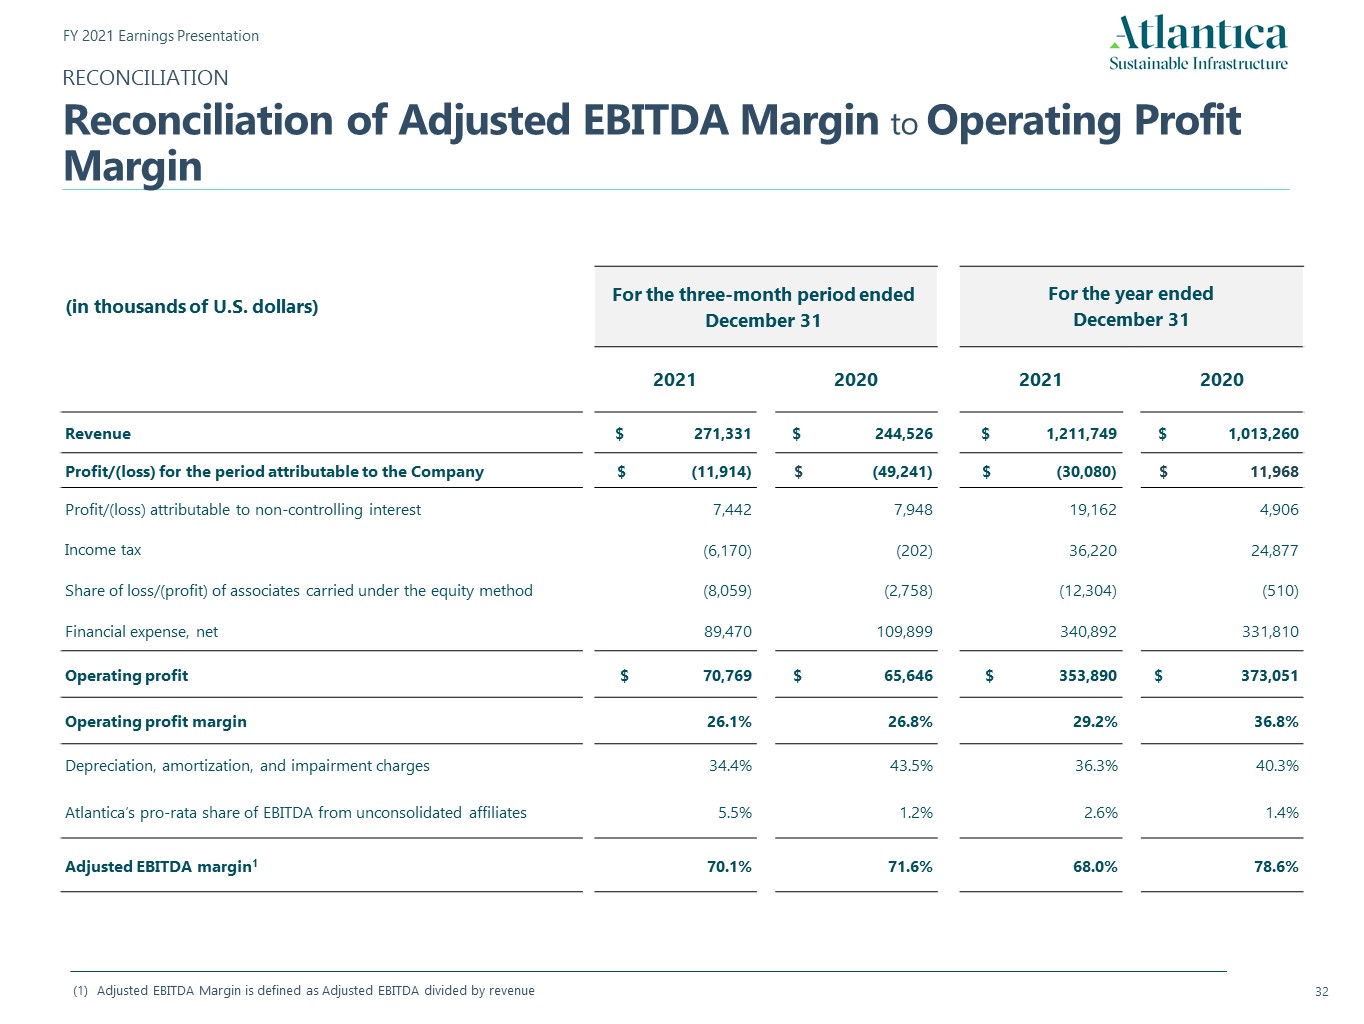
RECONCILIATIONReconciliation of Adjusted EBITDA Margin to Operating Profit Margin Adjusted EBITDA Margin is defined as Adjusted EBITDA divided by revenue (in thousands of U.S. dollars) For the three-month period ended December 31 For the year ended December 31 2021 2020 2021 2020 Revenue $ 271,331 $ 244,526 $ 1,211,749 $ 1,013,260 Profit/(loss) for the period attributable to the Company $ (11,914) $ (49,241) $ (30,080) $ 11,968 Profit/(loss) attributable to non-controlling interest 7,442 7,948 19,162 4,906 Income tax (6,170) (202) 36,220 24,877 Share of loss/(profit) of associates carried under the equity method (8,059) (2,758) (12,304) (510) Financial expense, net 89,470 109,899 340,892 331,810 Operating profit $ 70,769 $ 65,646 $ 353,890 $ 373,051 Operating profit margin 26.1% 26.8% 29.2% 36.8% Depreciation, amortization, and impairment charges 34.4% 43.5% 36.3% 40.3% Atlantica’s pro-rata share of EBITDA from unconsolidated affiliates 5.5% 1.2% 2.6% 1.4% Adjusted EBITDA margin1 70.1% 71.6% 68.0% 78.6%

RECONCILIATIONReconciliation of 2022 Target Guidance for Adjusted EBITDA to CAFD (in millions of U.S. dollars) Guidance1 2022E Adjusted EBITDA 810 – 870 Atlantica’s pro-rata share of EBITDA from unconsolidated affiliates (50) – (60) Dividends from equity method investments 50 – 60 Non-monetary items2 20 – 70 Net interest and income tax paid (320) – (340) Principal amortization of indebtedness (320) – (340) Changes in other assets and liabilities and change in available cash at project level 0 – 30 Cash Available For Distribution 230 – 250 The forward-looking measures of 2021 Adjusted EBITDA and CAFD are non-GAAP measures that cannot be reconciled to the most directly comparable GAAP financial measure without unreasonable effort primarily because of the uncertainties involved in estimating forward looking income tax expense, mark-to-market changes in derivatives, profit attributable to non-controlling interest and Share of loss/(profit) of associates carried under the equity method to arrive at net income and which are subtracted therefrom to arrive to CAFD.Non-monetary items include (1) a positive non-cash adjustment for approximately $58.0 million corresponding to the difference between billings and revenue in assets accounted for as concessional financial assets, primarily related to ACT, (2) a positive non-cash adjustment of up to $80 million related to electricity market prices in Spain and (3) a negative non-cash adjustment of approximately $58.6 million related to income from cash grants in the U.S.
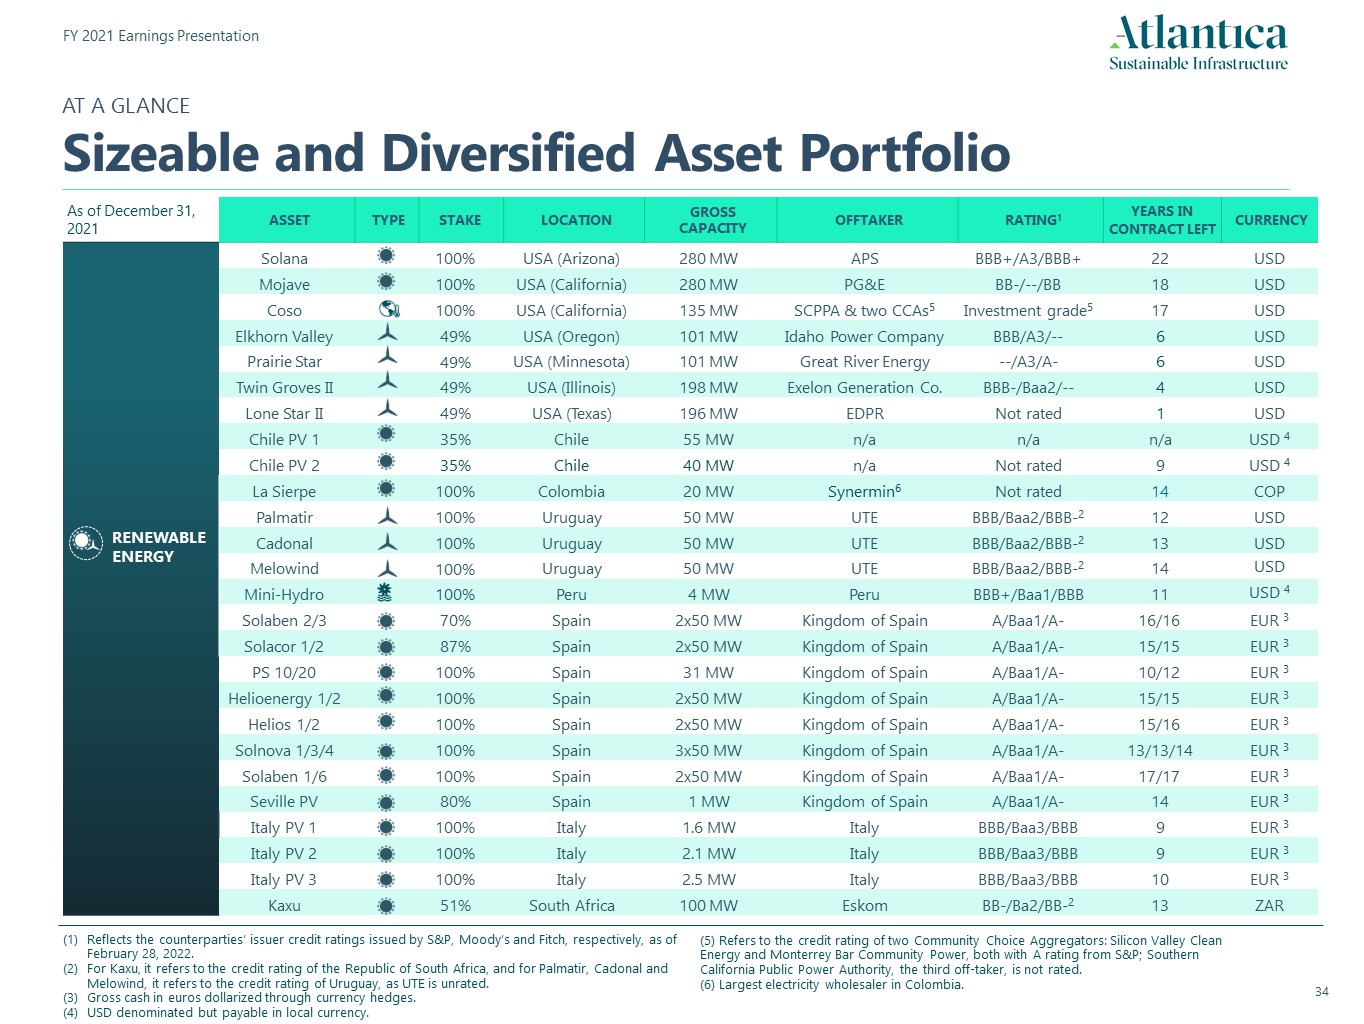
As of December 31, 2021 ASSET TYPE STAKE LOCATION GROSSCAPACITY OFFTAKER RATING1 YEARS INCONTRACT LEFT CURRENCY RENEWABLE ENERGY Solana 100% USA (Arizona) 280 MW APS BBB+/A3/BBB+ 22 USD Mojave 100% USA (California) 280 MW PG&E BB-/--/BB 18 USD Coso 100% USA (California) 135 MW SCPPA & two CCAs5 Investment grade5 17 USD Elkhorn Valley 49% USA (Oregon) 101 MW Idaho Power Company BBB/A3/-- 6 USD Prairie Star 49% USA (Minnesota) 101 MW Great River Energy --/A3/A- 6 USD Twin Groves II 49% USA (Illinois) 198 MW Exelon Generation Co. BBB-/Baa2/-- 4 USD Lone Star II 49% USA (Texas) 196 MW EDPR Not rated 1 USD Chile PV 1 35% Chile 55 MW n/a n/a n/a USD 4 Chile PV 2 35% Chile 40 MW n/a Not rated 9 USD 4 La Sierpe 100% Colombia 20 MW Synermin6 Not rated 14 COP Palmatir 100% Uruguay 50 MW UTE BBB/Baa2/BBB-2 12 USD Cadonal 100% Uruguay 50 MW UTE BBB/Baa2/BBB-2 13 USD Melowind 100% Uruguay 50 MW UTE BBB/Baa2/BBB-2 14 USD Mini-Hydro 100% Peru 4 MW Peru BBB+/Baa1/BBB 11 USD 4 Solaben 2/3 70% Spain 2x50 MW Kingdom of Spain A/Baa1/A- 16/16 EUR 3 Solacor 1/2 87% Spain 2x50 MW Kingdom of Spain A/Baa1/A- 15/15 EUR 3 PS 10/20 100% Spain 31 MW Kingdom of Spain A/Baa1/A- 10/12 EUR 3 Helioenergy 1/2 �� 100% Spain 2x50 MW Kingdom of Spain A/Baa1/A- 15/15 EUR 3 Helios 1/2 100% Spain 2x50 MW Kingdom of Spain A/Baa1/A- 15/16 EUR 3 Solnova 1/3/4 100% Spain 3x50 MW Kingdom of Spain A/Baa1/A- 13/13/14 EUR 3 Solaben 1/6 100% Spain 2x50 MW Kingdom of Spain A/Baa1/A- 17/17 EUR 3 Seville PV 80% Spain 1 MW Kingdom of Spain A/Baa1/A- 14 EUR 3 Italy PV 1 100% Italy 1.6 MW Italy BBB/Baa3/BBB 9 EUR 3 Italy PV 2 100% Italy 2.1 MW Italy BBB/Baa3/BBB 9 EUR 3 Italy PV 3 100% Italy 2.5 MW Italy BBB/Baa3/BBB 10 EUR 3 Kaxu 51% South Africa 100 MW Eskom BB-/Ba2/BB-2 13 ZAR Reflects the counterparties’ issuer credit ratings issued by S&P, Moody’s and Fitch, respectively, as of February 28, 2022.For Kaxu, it refers to the credit rating of the Republic of South Africa, and for Palmatir, Cadonal and Melowind, it refers to the credit rating of Uruguay, as UTE is unrated.Gross cash in euros dollarized through currency hedges.USD denominated but payable in local currency. AT A GLANCESizeable and Diversified Asset Portfolio (5) Refers to the credit rating of two Community Choice Aggregators: Silicon Valley Clean Energy and Monterrey Bar Community Power, both with A rating from S&P; Southern California Public Power Authority, the third off-taker, is not rated.(6) Largest electricity wholesaler in Colombia.
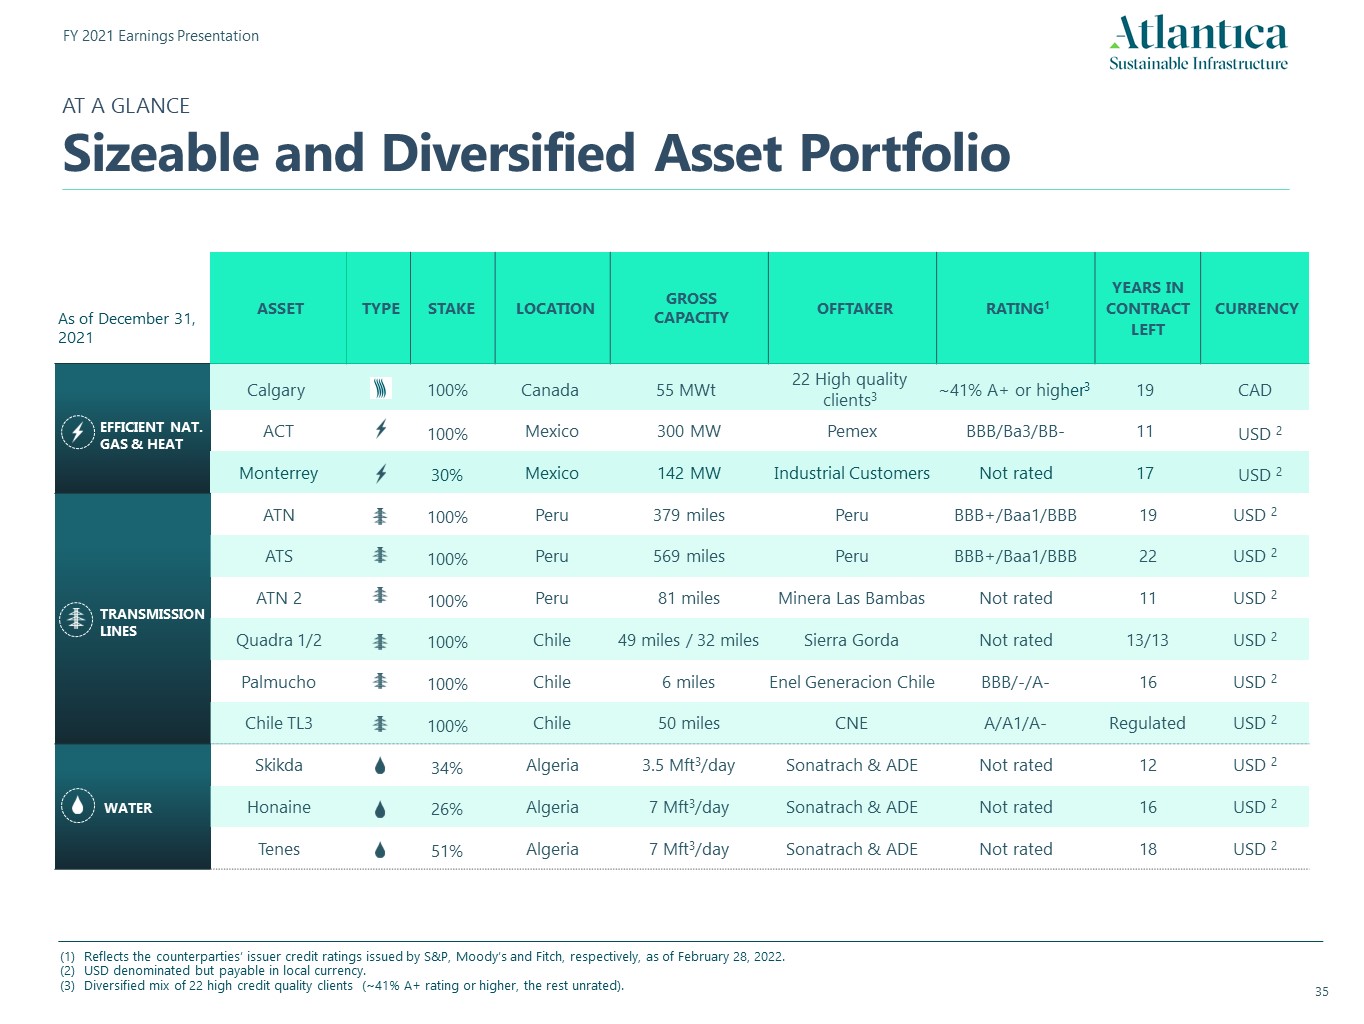
As of December 31, 2021 ASSET TYPE STAKE LOCATION GROSSCAPACITY OFFTAKER RATING1 YEARS INCONTRACT LEFT CURRENCY EFFICIENT NAT. GAS & HEAT Calgary 100% Canada 55 MWt 22 High quality clients3 ~41% A+ or higher3 19 CAD ACT 100% Mexico 300 MW Pemex BBB/Ba3/BB- 11 USD 2 Monterrey 30% Mexico 142 MW Industrial Customers Not rated 17 USD 2 TRANSMISSION LINES ATN 100% Peru 379 miles Peru BBB+/Baa1/BBB 19 USD 2 ATS 100% Peru 569 miles Peru BBB+/Baa1/BBB 22 USD 2 ATN 2 100% Peru 81 miles Minera Las Bambas Not rated 11 USD 2 Quadra 1/2 100% Chile 49 miles / 32 miles Sierra Gorda Not rated 13/13 USD 2 Palmucho 100% Chile 6 miles Enel Generacion Chile BBB/-/A- 16 USD 2 Chile TL3 100% Chile 50 miles CNE A/A1/A- Regulated USD 2 WATER Skikda 34% Algeria 3.5 Mft3/day Sonatrach & ADE Not rated 12 USD 2 Honaine 26% Algeria 7 Mft3/day Sonatrach & ADE Not rated 16 USD 2 Tenes 51% Algeria 7 Mft3/day Sonatrach & ADE Not rated 18 USD 2 Reflects the counterparties’ issuer credit ratings issued by S&P, Moody’s and Fitch, respectively, as of February 28, 2022.USD denominated but payable in local currency.Diversified mix of 22 high credit quality clients (~41% A+ rating or higher, the rest unrated). AT A GLANCESizeable and Diversified Asset Portfolio
Great West House, GW1, 17th floor,Great West RoadBrentford TW8 9DFLondon (United Kingdom)
SIGNATURES
Pursuant to the requirements of the Securities Exchange Act of 1934, the Registrant has duly caused this report to be signed on its behalf by the undersigned, thereunto duly authorized.
Atlantica Sustainable Infrastructure plc | |||
Date: February 28, 2022 | By: | /s/ Santiago Seage | |
Name: | Santiago Seage | ||
Title: | Chief Executive Officer | ||