
Welcome David J. Houston, Jr., Chairman September 3, 2015 1 2015 Annual Meeting of Stockholders
Proposals for Vote 1. DIRECTOR NOMINEES Brian G. Leary Ronald K. Perry Anthony (Bud) LaCava 2. EQUITY INCENTIVE PLAN Approval of the Blue Hills Bancorp, Inc. 2015 Equity Incentive Plan 3. RATIFICATION OF AUDITORS Ratification of the appointment of Wolf & Company, P.C. as our independent registered accounting firm for 2015 2
Introduction Bill Parent, President and Chief Executive Officer 3 Work hard. Bank easy.
Forward-Looking Statements This presentation contains forward-looking statements, which can be identified by the use of words such as “estimate,” “project,” “believe,” “intend,” “anticipate,” “plan,” “seek,” “expect,” “will,” “may” and words of similar meaning. These forward- looking statements include, but are not limited to statements of our goals, intentions and expectations; statements regarding our business plans, prospects, growth and operating strategies; statements regarding the asset quality of our loan and investment portfolios; and estimates of our risks and future costs and benefits. These forward-looking statements are based on our current beliefs and expectations and are inherently subject to significant business, economic and competitive uncertainties and contingencies, many of which are beyond our control. In addition, these forward-looking statements are subject to assumptions with respect to future business strategies and decisions that are subject to change. We do not undertake any obligation to update any forward-looking statements after the date of this presentation, except as required by law. The following factors, among others, could cause actual results to differ materially from the anticipated results or other expectations expressed in the forward-looking statements: our ability to implement successfully our new business strategy, which includes significant asset and liability growth; our ability to increase our market share in our market areas and capitalize on growth opportunities; our ability to implement successfully our branch network expansion strategy; general economic conditions, either nationally or in our market areas, that are worse than expected; competition among depository and other financial institutions; inflation and changes in the interest rate environment that reduce our margins or reduce the fair value of financial instruments; adverse changes in the securities markets which, given the significant size of our investment securities portfolio, could cause a material decline in our reported equity and/or our net income if we must record impairment charges or a decline in the fair value of our securities; changes in laws or government regulations or policies affecting financial institutions, including changes in regulatory fees and capital requirements; changes in consumer spending, borrowing and savings habits; changes in accounting policies and practices, as may be adopted by the bank regulatory agencies, the Financial Accounting Standards Board, the Securities and Exchange Commission and the Public Company Accounting Oversight Board; changes in our organization, compensation and benefit plans; changes in our financial condition or results of operations that reduce capital available to pay dividends; and changes in the financial condition or future prospects of issuers of securities that we own. Because of these and a wide variety of other risks and uncertainties, our actual future results may be materially different from the results indicated by forward-looking statements. 4
Key Accomplishments 5 Mutual-to-stock conversion Priced at the adjusted maximum for gross proceeds of $278 million 100% ownership by depositors, employees and directors at closing Continued loan growth Total loans of $1.3 billion at June 30, 2015, increasing 64% since the end of 2013 Deposit growth Total deposits of $1.3 billion at June 30, 2015, increasing 39% since the end of 2013 New branch in Milton opened in October 2014 with over $35 million in deposits by June 30, 2015 Progress in growing commercial deposits Nantucket Bank acquisition Improvement of funding profile Expansion of geographic coverage with hyper-local brand Increased brand profile Blue Hills Bank Pavilion Multimedia advertising deal with The Boston Globe Philanthropy $7 million contributed to a new charitable foundation Named a top corporate charitable contributor in 2014 by Boston Business Journal
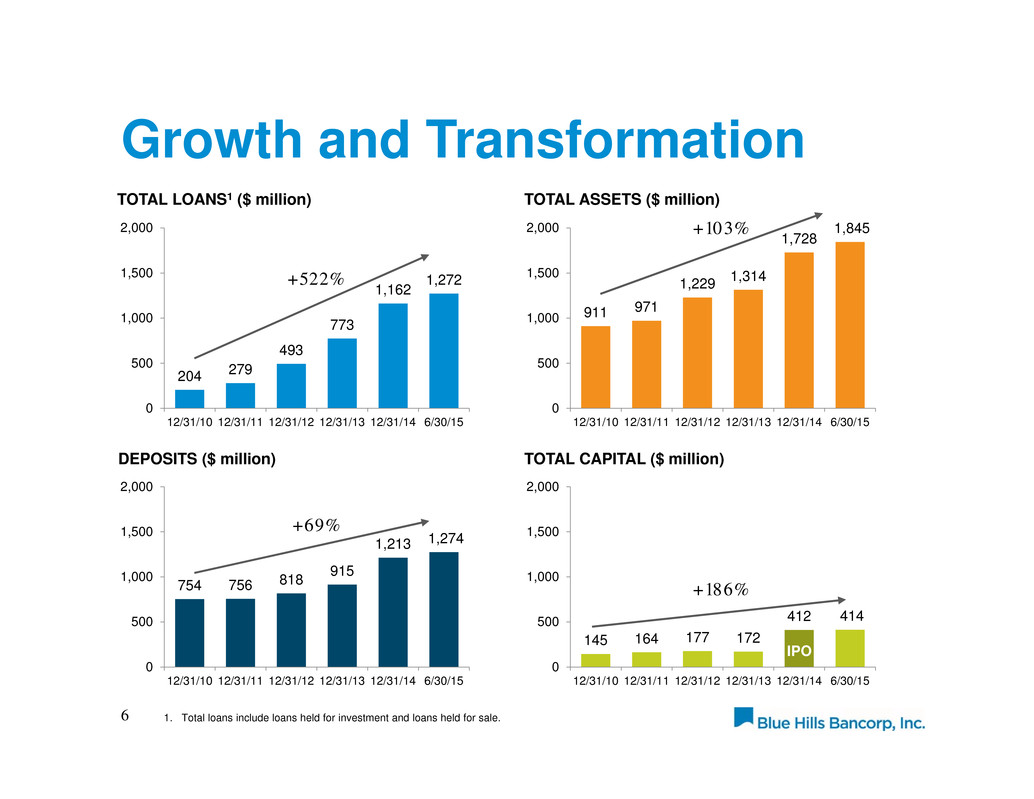
Growth and Transformation 6 204 279 493 773 1,162 1,272 0 500 1,000 1,500 2,000 12/31/10 12/31/11 12/31/12 12/31/13 12/31/14 6/30/15 TOTAL LOANS1 ($ million) 911 971 1,229 1,314 1,728 1,845 0 500 1,000 1,500 2,000 12/31/10 12/31/11 12/31/12 12/31/13 12/31/14 6/30/15 TOTAL ASSETS ($ million) 754 756 818 915 1,213 1,274 0 500 1,000 1,500 2,000 12/31/10 12/31/11 12/31/12 12/31/13 12/31/14 6/30/15 DEPOSITS ($ million) 145 164 177 172 412 414 0 500 1,000 1,500 2,000 12/31/10 12/31/11 12/31/12 12/31/13 12/31/14 6/30/15 TOTAL CAPITAL ($ million) +522% +103% +186% +69% IPO 1. Total loans include loans held for investment and loans held for sale.
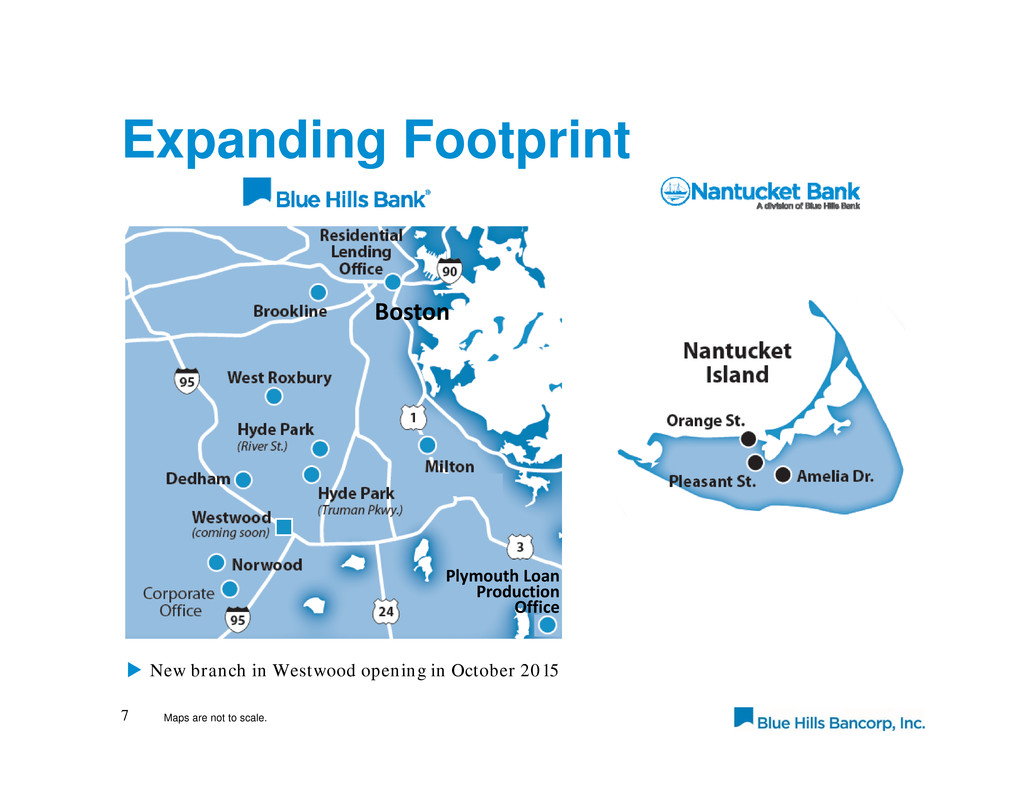
Expanding Footprint 7 New branch in Westwood opening in October 2015 Boston Plymouth Loan Production Office Maps are not to scale.
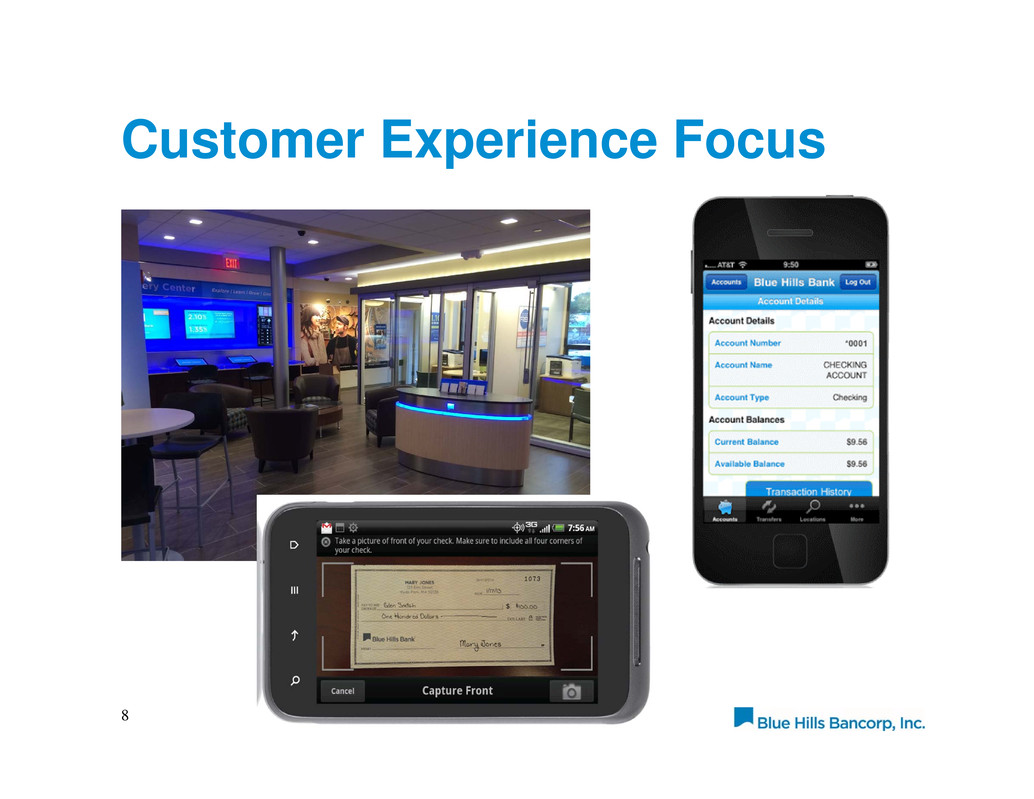
Customer Experience Focus 8
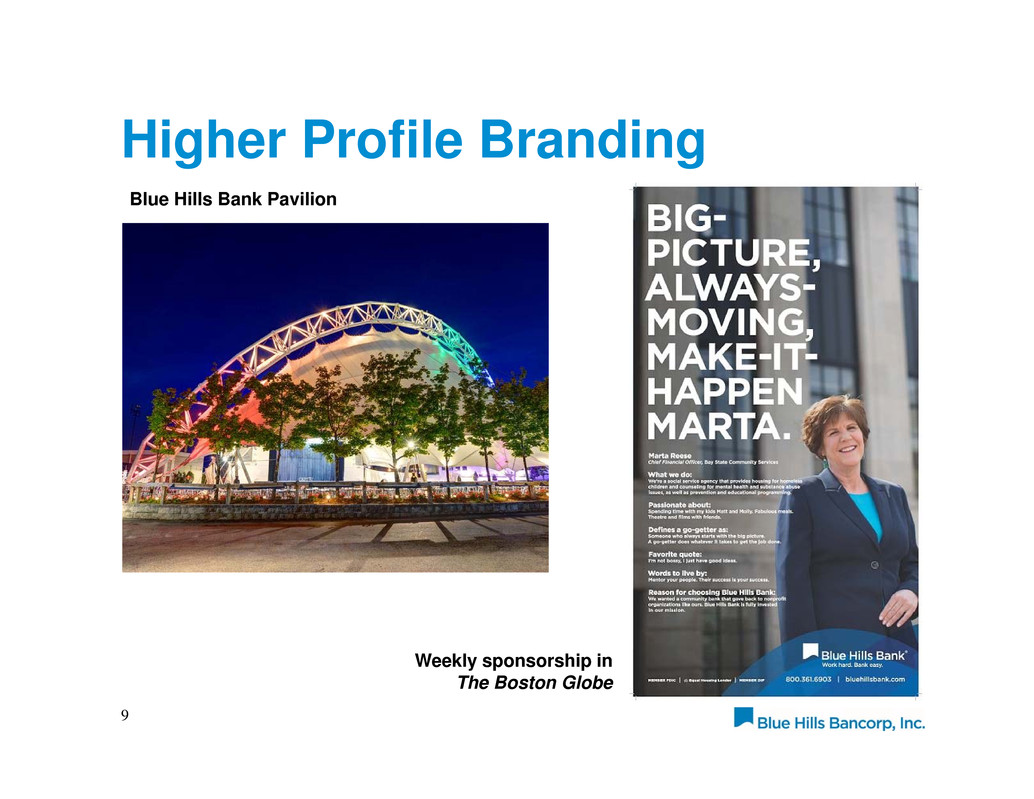
Higher Profile Branding 9 Blue Hills Bank Pavilion Weekly sponsorship in The Boston Globe
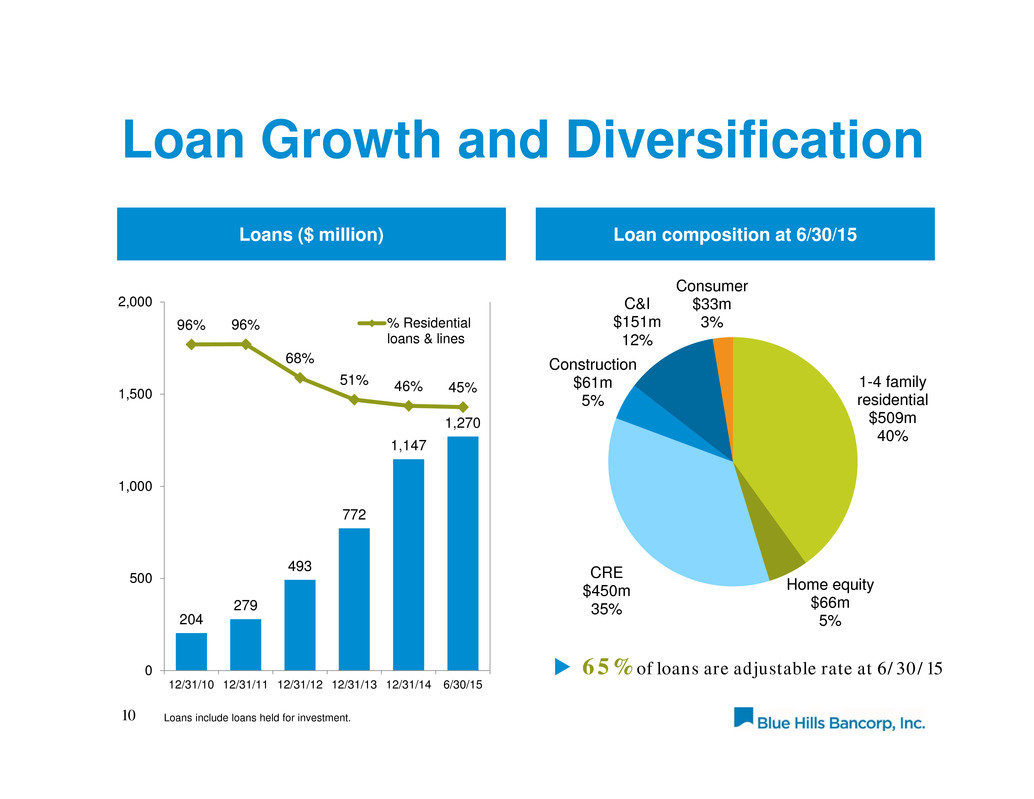
Loan Growth and Diversification 65% of loans are adjustable rate at 6/30/15 10 Loans ($ million) Loan composition at 6/30/15 204 279 493 772 1,147 1,270 96% 96% 68% 51% 46% 45% 0 500 1,000 1,500 2,000 12/31/10 12/31/11 12/31/12 12/31/13 12/31/14 6/30/15 % Residential loans & lines 1-4 family residential $509m 40% Home equity $66m 5% CRE $450m 35% Construction $61m 5% C&I $151m 12% Consumer $33m 3% Loans include loans held for investment.
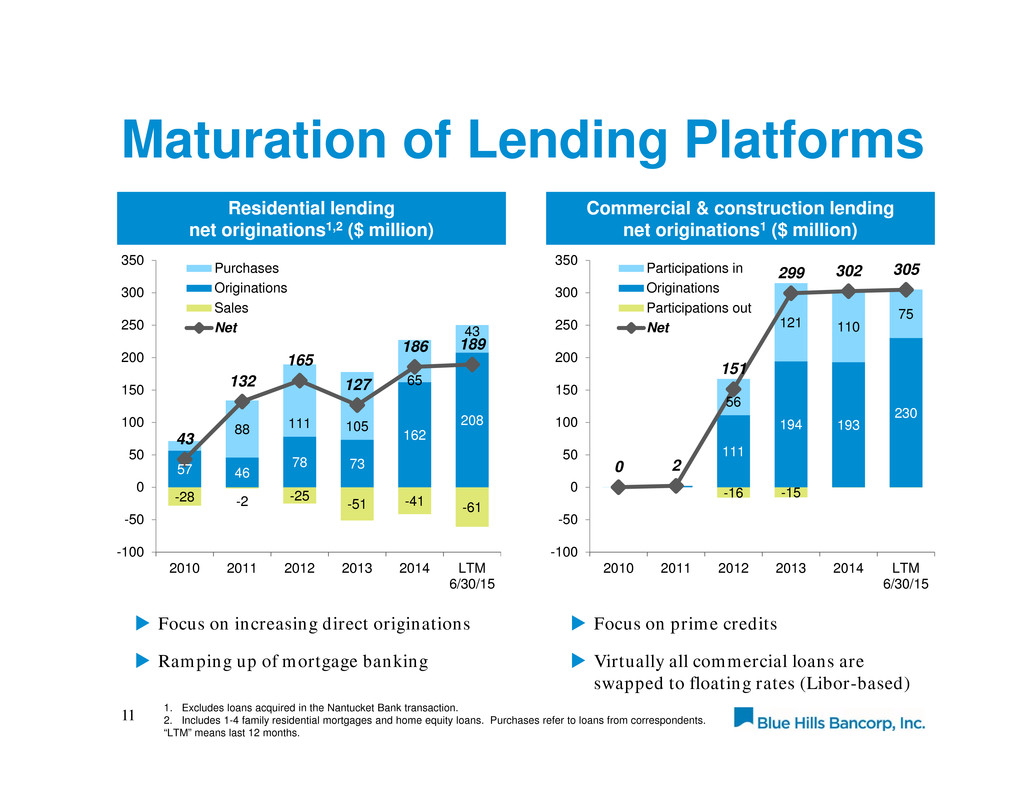
Maturation of Lending Platforms 11 Residential lending net originations1,2 ($ million) Commercial & construction lending net originations1 ($ million) -28 -2 -25 -51 -41 -61 57 46 78 73 162 208 88 111 105 65 43 43 132 165 127 186 189 -100 -50 0 50 100 150 200 250 300 350 2010 2011 2012 2013 2014 LTM 6/30/15 Purchases Originations Sales Net Focus on increasing direct originations Ramping up of mortgage banking 1. Excludes loans acquired in the Nantucket Bank transaction. 2. Includes 1-4 family residential mortgages and home equity loans. Purchases refer to loans from correspondents. “LTM” means last 12 months. -16 -15 111 194 193 230 56 121 110 75 0 2 151 299 302 305 -100 -50 0 50 100 150 200 250 300 350 2010 2011 2012 2013 2014 LTM 6/30/15 Participations in Originations Participations out Net Focus on prime credits Virtually all commercial loans are swapped to floating rates (Libor-based)
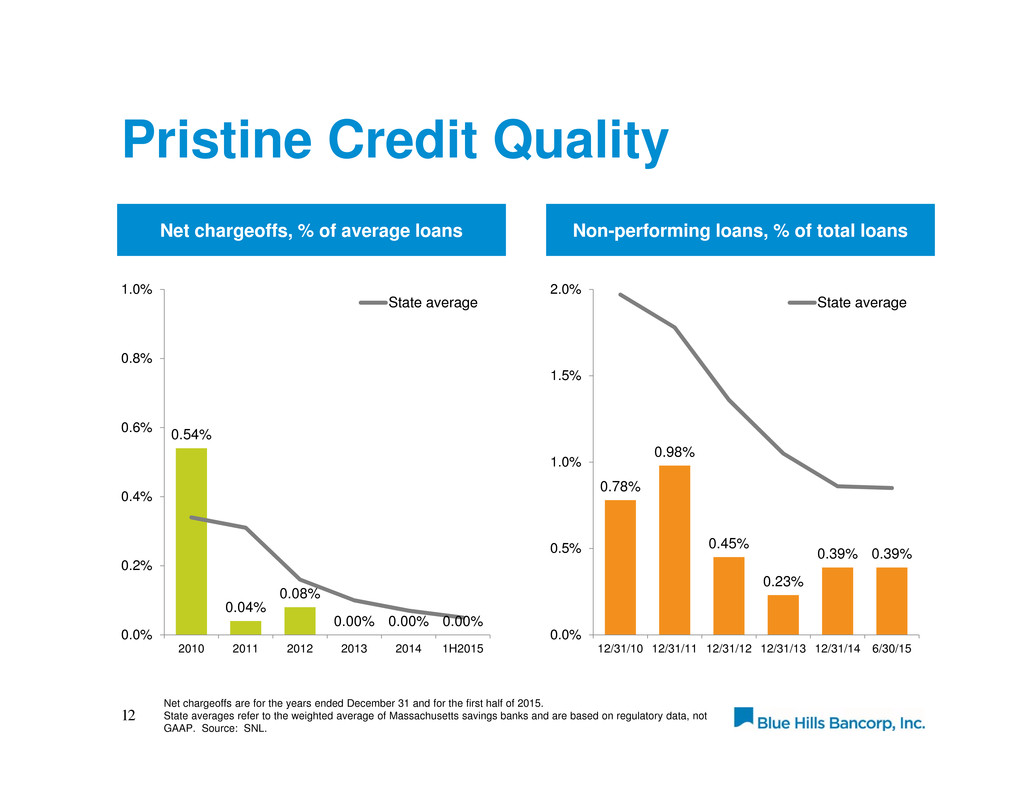
Pristine Credit Quality 12 Net chargeoffs, % of average loans Non-performing loans, % of total loans 0.54% 0.04% 0.08% 0.00% 0.00% 0.00% 0.0% 0.2% 0.4% 0.6% 0.8% 1.0% 2010 2011 2012 2013 2014 1H2015 State average 0.78% 0.98% 0.45% 0.23% 0.39% 0.39% 0.0% 0.5% 1.0% 1.5% 2.0% 12/31/10 12/31/11 12/31/12 12/31/13 12/31/14 6/30/15 State average Net chargeoffs are for the years ended December 31 and for the first half of 2015. State averages refer to the weighted average of Massachusetts savings banks and are based on regulatory data, not GAAP. Source: SNL.
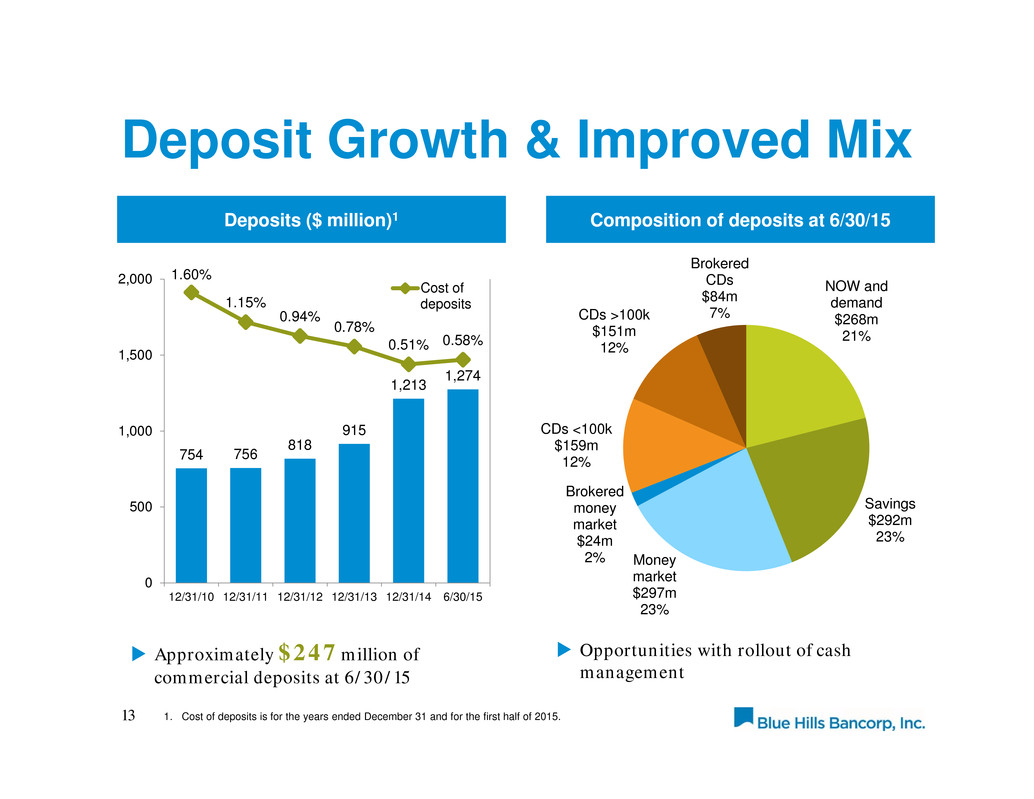
Deposit Growth & Improved Mix Opportunities with rollout of cash management 13 Deposits ($ million)1 Composition of deposits at 6/30/15 754 756 818 915 1,213 1,274 1.60% 1.15% 0.94% 0.78% 0.51% 0.58% 0 500 1,000 1,500 2,000 12/31/10 12/31/11 12/31/12 12/31/13 12/31/14 6/30/15 Cost of deposits NOW and demand $268m 21% Savings $292m 23% Money market $297m 23% Brokered money market $24m 2% CDs <100k $159m 12% CDs >100k $151m 12% Brokered CDs $84m 7% 1. Cost of deposits is for the years ended December 31 and for the first half of 2015. Approximately $247 million of commercial deposits at 6/30/15
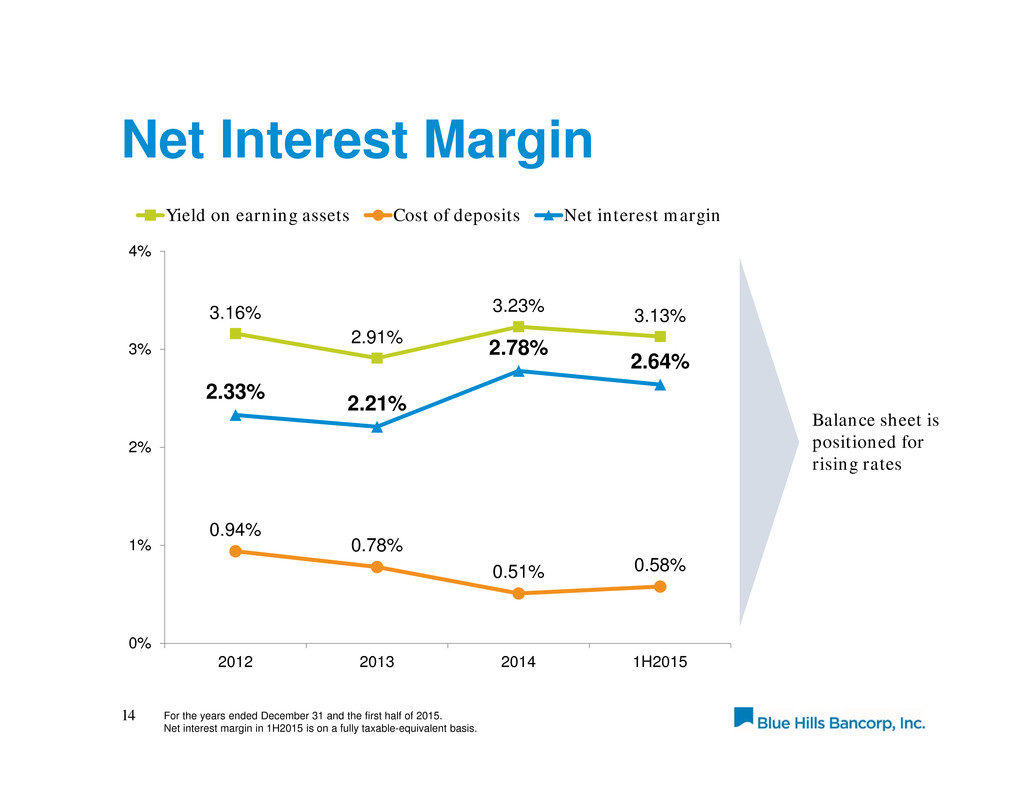
3.16% 2.91% 3.23% 3.13% 0.94% 0.78% 0.51% 0.58% 2.33% 2.21% 2.78% 2.64% 0% 1% 2% 3% 4% 2012 2013 2014 1H2015 Yield on earning assets Cost of deposits Net interest margin Net Interest Margin 14 For the years ended December 31 and the first half of 2015. Net interest margin in 1H2015 is on a fully taxable-equivalent basis. Balance sheet is positioned for rising rates

Earnings Momentum 15 $000 2013Y 2014Y 1H2015 Net interest and dividend income 25,121 42,377 21,780 Realized securities gains and impairment losses, net 4,999 2,515 1,585 Other noninterest income 6,140 5,606 3,076 Total income 36,260 50,498 26,441 Noninterest expense 29,215 40,589 21,286 Pre-tax, pre-provision earnings 7,045 9,909 5,155 Provision for loan losses 4,094 3,381 823 Pre-tax income before nonrecurring items 2,951 6,528 4,332 Nonrecurring items: Bank-owned life insurance death benefit gains Incentive and benefit plan restructuring expenses Pension curtailment gain Nantucket Bank acquisition expenses Mutual-to-stock conversion expenses Charitable foundation contribution 1,872 (1,677) — (583) (184) — 182 — 1,304 (950) (869) (7,000) — — — — — — Net nonrecurring items (572) (7,333) — Income (loss) before income taxes, GAAP 2,379 (805) 4,332 Provision (benefit) for income taxes (284) (622) 1,327 Net income (loss) 2,663 (183) 3,005
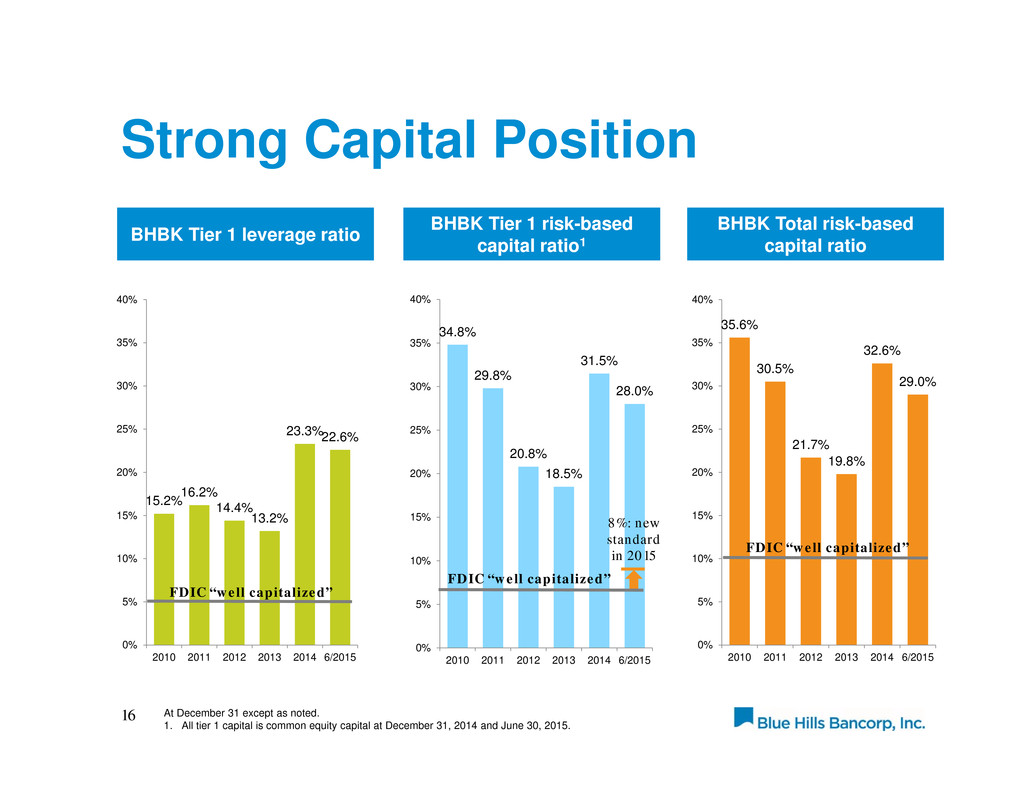
Strong Capital Position 16 BHBK Tier 1 leverage ratio BHBK Tier 1 risk-based capital ratio1 15.2% 16.2% 14.4% 13.2% 23.3%22.6% 0% 5% 10% 15% 20% 25% 30% 35% 40% 2010 2011 2012 2013 2014 6/2015 At December 31 except as noted. 1. All tier 1 capital is common equity capital at December 31, 2014 and June 30, 2015. BHBK Total risk-based capital ratio 34.8% 29.8% 20.8% 18.5% 31.5% 28.0% 0% 5% 10% 15% 20% 25% 30% 35% 40% 2010 2011 2012 2013 2014 6/2015 35.6% 30.5% 21.7% 19.8% 32.6% 29.0% 0% 5% 10% 15% 20% 25% 30% 35% 40% 2010 2011 2012 2013 2014 6/2015 FDIC “well capitalized” FDIC “well capitalized” FDIC “well capitalized” 8%: new standard in 2015

Strong Stock Price Performance 17 Closing price ($) per BHBK share at the end of each month since the IPO 10.00 12.40 12.89 13.12 13.33 13.22 13.58 13.29 12.87 13.22 13.42 13.71 14.00 14.44 14.15 8 10 12 14 16 Buyback announced for 5% of shares First quarterly dividend paid, $0.02 per share ABQI index, total return* *ABQI is the NASDAQ OMX ABA Community Bank Index (ABQI), which tracks the performance of the most actively traded community banks of the composite index (ABAQ). Comparable indices have been shown with a base value of 10 on 7/21/2014 to coincide with BHBK’s share price at the IPO date and represent total return (assuming dividend reinvestment). Russell 2000, total return
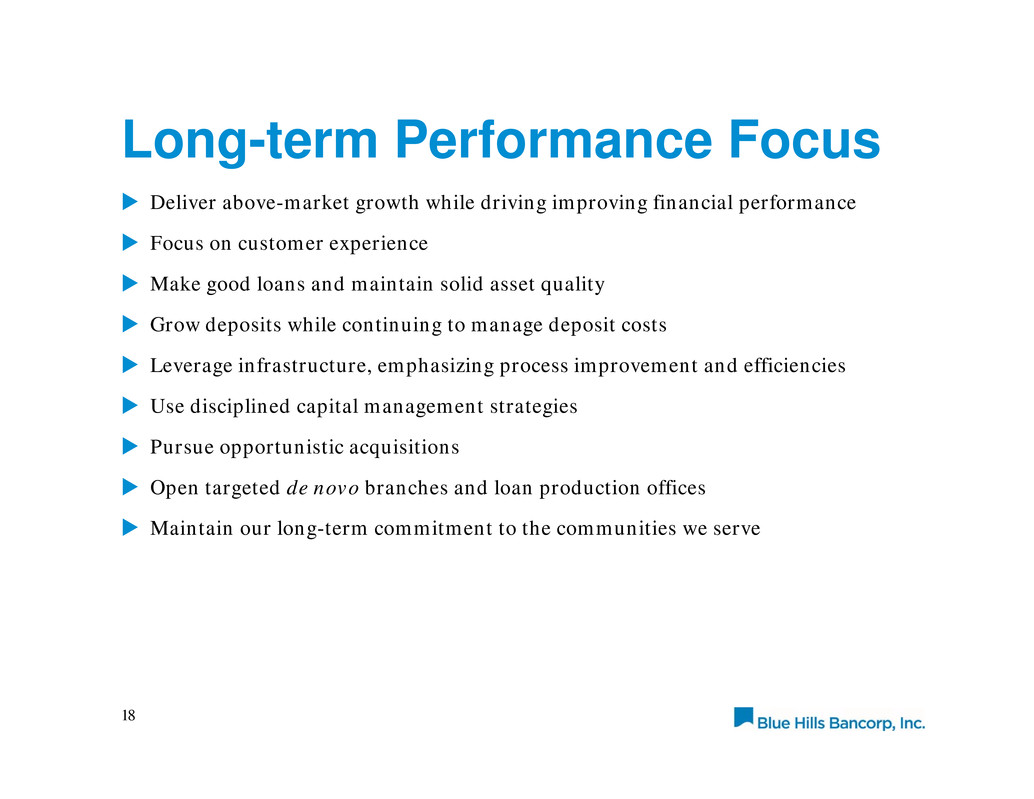
Long-term Performance Focus Deliver above-market growth while driving improving financial performance Focus on customer experience Make good loans and maintain solid asset quality Grow deposits while continuing to manage deposit costs Leverage infrastructure, emphasizing process improvement and efficiencies Use disciplined capital management strategies Pursue opportunistic acquisitions Open targeted de novo branches and loan production offices Maintain our long-term commitment to the communities we serve 18
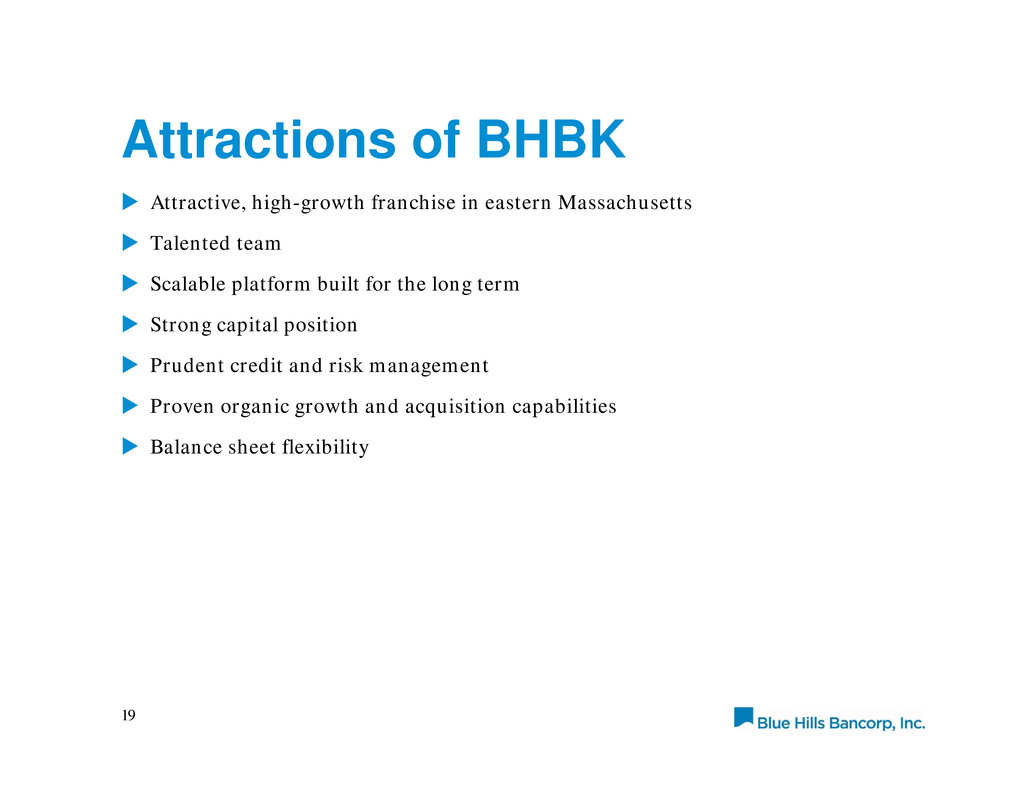
Attractions of BHBK Attractive, high-growth franchise in eastern Massachusetts Talented team Scalable platform built for the long term Strong capital position Prudent credit and risk management Proven organic growth and acquisition capabilities Balance sheet flexibility 19
Title 20 1. Footnote. Questions & Answers


