VECTRUS FIRST QUARTER 2016 RESULTS KEN HUNZEKER CHIEF EXECUTIVE OFFICER AND PRESIDENT MATT KLEIN SENIOR VICE PRESIDENT AND CHIEF FINANCIAL OFFICER MAY 11, 2016

SAFE HARBOR STATEMENT Page 2 SAFE HARBOR STATEMENT UNDER THE PRIVATE SECURITIES LITIGATION REFORM ACT OF 1995 (THE "ACT"): CERTAIN MATERIAL PRESENTED HEREIN INCLUDES FORWARD-LOOKING STATEMENTS INTENDED TO QUALIFY FOR THE SAFE HARBOR FROM LIABILITY ESTABLISHED BY THE ACT. THESE FORWARD-LOOKING STATEMENTS INCLUDE, BUT ARE NOT LIMITED TO, STATEMENTS ABOUT OUR REVENUE AND EPS GUIDANCE FOR 2016, CONTRACT OPPORTUNITIES AND AWARDS, BUSINESS STRATEGY, OUTLOOK, OBJECTIVES, PLANS, INTENTIONS OR GOALS, AND ANY DISCUSSION OF FUTURE OPERATING OR FINANCIAL PERFORMANCE. WHENEVER USED, WORDS SUCH AS "MAY," "WILL," "LIKELY," "ANTICIPATE," "ESTIMATE," "EXPECT," "PROJECT," "INTEND," "PLAN," "BELIEVE," "TARGET," "COULD," "POTENTIAL," "CONTINUE," OR SIMILAR TERMINOLOGY ARE FORWARD-LOOKING STATEMENTS. THESE STATEMENTS ARE BASED ON THE BELIEFS AND ASSUMPTIONS OF OUR MANAGEMENT BASED ON INFORMATION CURRENTLY AVAILABLE TO MANAGEMENT. FORWARD-LOOKING STATEMENTS ARE NOT GUARANTEES OF FUTURE PERFORMANCE AND ARE SUBJECT TO RISKS AND UNCERTAINTIES THAT COULD CAUSE ACTUAL RESULTS TO DIFFER MATERIALLY FROM THE RESULTS CONTEMPLATED BY THE FORWARD-LOOKING STATEMENTS, OUR HISTORICAL EXPERIENCE AND OUR PRESENT EXPECTATIONS OR PROJECTIONS. THESE RISKS AND UNCERTAINTIES INCLUDE, BUT ARE NOT LIMITED TO: RISKS AND UNCERTAINTIES RELATING TO THE SPIN-OFF FROM OUR FORMER PARENT, INCLUDING WHETHER THE SPIN-OFF AND THE RELATED TRANSACTIONS WILL RESULT IN ANY TAX LIABILITY, ECONOMIC, POLITICAL AND SOCIAL CONDITIONS IN THE COUNTRIES IN WHICH WE CONDUCT OUR BUSINESSES; CHANGES IN U.S. GOVERNMENT MILITARY OPERATIONS, INCLUDING ITS OPERATIONS IN AFGHANISTAN; COMPETITION IN OUR INDUSTRY; CHANGES IN, OR DELAYS IN THE COMPLETION OF, U.S. OR INTERNATIONAL GOVERNMENT BUDGETS; GOVERNMENT REGULATIONS AND COMPLIANCE THEREWITH, INCLUDING CHANGES TO THE DEPARTMENT OF DEFENSE PROCUREMENT PROCESS; CHANGES IN TECHNOLOGY; PROTESTS OF NEW AWARDS; OUR ABILITY TO SUBMIT PROPOSALS FOR AND/OR WIN POTENTIAL OPPORTUNITIES IN OUR PIPELINE; INTELLECTUAL PROPERTY MATTERS; GOVERNMENTAL INVESTIGATIONS, REVIEWS, AUDITS AND COST ADJUSTMENTS; CONTINGENCIES RELATED TO ACTUAL OR ALLEGED ENVIRONMENTAL CONTAMINATION, CLAIMS AND CONCERNS; OUR SUCCESS IN EXPANDING OUR GEOGRAPHIC FOOTPRINT OR BROADENING OUR CUSTOMER BASE, MARKETS AND CAPABILITIES; OUR ABILITY TO REALIZE THE FULL AMOUNTS REFLECTED IN OUR BACKLOG AND TO RETAIN AND RENEW OUR EXISTING CONTRACTS; OUR MAINTAINING OUR GOOD RELATIONSHIP WITH THE U.S. GOVERNMENT; IMPAIRMENT OF GOODWILL; OUR PERFORMANCE OF OUR CONTRACTS AND OUR ABILITY TO CONTROL COSTS; OUR LEVEL OF INDEBTEDNESS; OUR COMPLIANCE WITH THE TERMS OF OUR CREDIT AGREEMENT; SUBCONTRACTOR AND EMPLOYEE PERFORMANCE AND CONDUCT; OUR TEAMING ARRANGEMENTS WITH OTHER CONTRACTORS; ECONOMIC AND CAPITAL MARKETS CONDITIONS; ANY FUTURE ACQUISITIONS, INVESTMENTS OR JOINT VENTURES; OUR ABILITY TO RETAIN AND RECRUIT QUALIFIED PERSONNEL; OUR MAINTENANCE OF SAFE WORK SITES AND EQUIPMENT; ANY DISPUTES WITH LABOR UNIONS; COSTS OF OUTCOME OF ANY LEGAL PROCEEDINGS; SECURITY BREACHES AND OTHER DISRUPTIONS TO OUR INFORMATION TECHNOLOGY AND OPERATIONS; CHANGES IN OUR TAX PROVISIONS OR EXPOSURE TO ADDITIONAL INCOME TAX LIABILITIES; CHANGES IN U.S. GENERALLY ACCEPTED ACCOUNTING PRINCIPLES; OUR COMPLIANCE WITH PUBLIC COMPANY ACCOUNTING AND FINANCIAL REPORTING REQUIREMENTS; AND OTHER FACTORS SET FORTH IN PART I, ITEM 1A, – “RISK FACTORS,” AND ELSEWHERE IN OUR 2015 ANNUAL REPORT ON FORM 10-K AND DESCRIBED FROM TIME TO TIME IN OUR FUTURE REPORTS FILED WITH THE SECURITIES AND EXCHANGE COMMISSION. WE UNDERTAKE NO OBLIGATION TO UPDATE ANY FORWARD-LOOKING STATEMENTS, WHETHER AS A RESULT OF NEW INFORMATION, FUTURE EVENTS OR OTHERWISE, EXCEPT AS REQUIRED BY LAW.

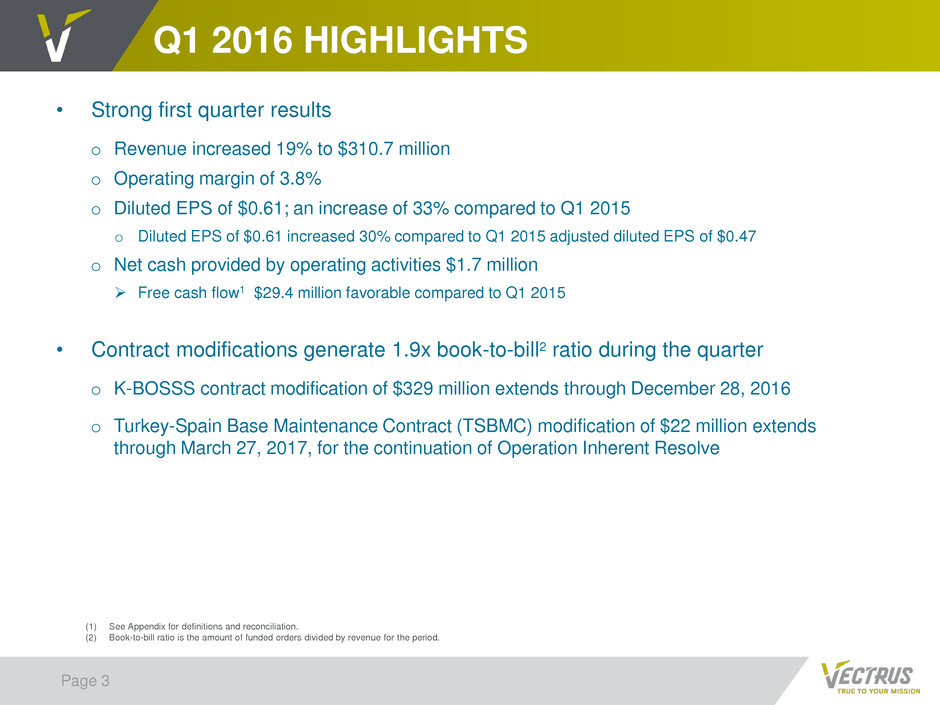
Q1 2016 HIGHLIGHTS Page 3 • Strong first quarter results o Revenue increased 19% to $310.7 million o Operating margin of 3.8% o Diluted EPS of $0.61; an increase of 33% compared to Q1 2015 o Diluted EPS of $0.61 increased 30% compared to Q1 2015 adjusted diluted EPS of $0.47 o Net cash provided by operating activities $1.7 million Free cash flow1 $29.4 million favorable compared to Q1 2015 • Contract modifications generate 1.9x book-to-bill2 ratio during the quarter o K-BOSSS contract modification of $329 million extends through December 28, 2016 o Turkey-Spain Base Maintenance Contract (TSBMC) modification of $22 million extends through March 27, 2017, for the continuation of Operation Inherent Resolve (1) See Appendix for definitions and reconciliation. (2) Book-to-bill ratio is the amount of funded orders divided by revenue for the period.

VECTRUS UPDATE Page 4 • Re-competes remain a priority in 2016 o K-BOSSS o APS-5 Kuwait/Qatar o Maxwell BOS • Awarded the re-competition of the Enterprise Legacy Voice and Information System (ELVIS) contract approx. $12 million • New Business o Opportunities are materializing on the AFCAP IDIQ vehicle o Approx. $1 billion of proposals submitted and pending potential award1, 100% for new business; approx. $6 billion in potential new business opportunities identified over the next 12 months • Thule Base Maintenance Contract appeal results pending • Operational Excellence contributing to improvements in operating income • Negotiated favorable changes to the credit agreement covenants (1) Indefinite Delivery Indefinite Quantity (IDIQ) contracts carry no value in the pipeline of potential proposals to be submitted until a specific task order is identified.

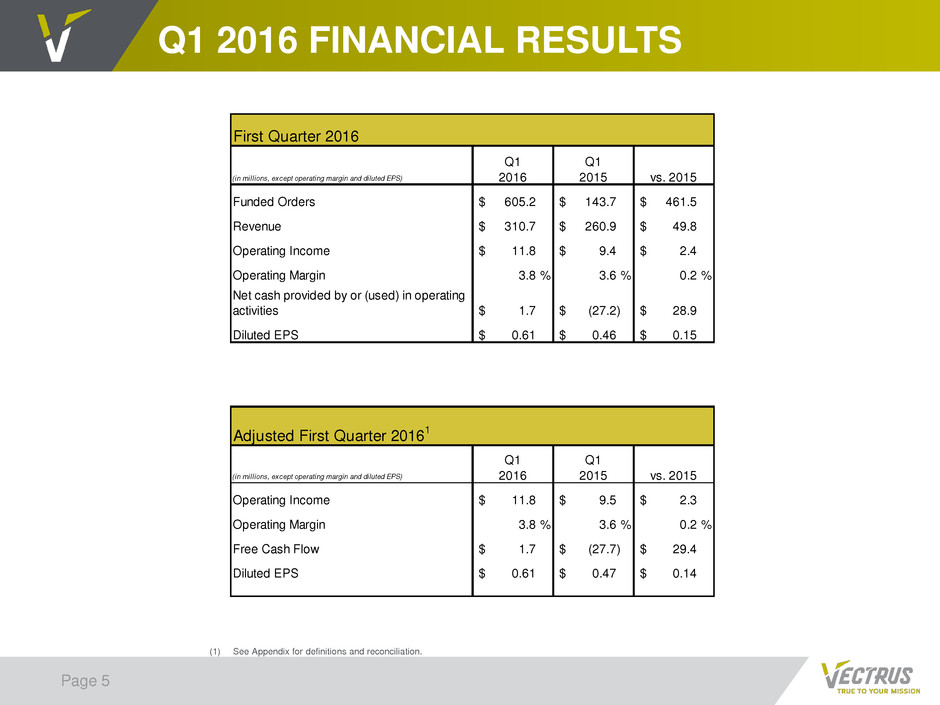
Q1 2016 FINANCIAL RESULTS Page 5 (1) See Appendix for definitions and reconciliation. (in millions, except operating margin and diluted EPS) Q1 2016 Q1 2015 vs. 2015 Funded Orders 605.2$ 143.7$ 461.5$ Revenue 310.7$ 260.9$ 49.8$ Operating Income 11.8$ 9.4$ 2.4$ Operating Margin 3.8 % 3.6 % 0.2 % Net cash provided by or (used) in operating activities 1.7$ (27.2)$ 28.9$ Diluted EPS 0.61$ 0.46$ 0.15$ (in millions, except operating margin and diluted EPS) Q1 2016 Q1 2015 vs. 2015 Operating Income 11.8$ 9.5$ 2.3$ Operating Margin 3.8 % 3.6 % 0.2 % Free Cash Flow 1.7$ (27.7)$ 29.4$ Diluted EPS 0.61$ 0.47$ 0.14$ First Quarter 2016 Adjusted First Quarter 2016 1

BACKLOG1 Page 6 (2) (1) Total backlog represents firm orders and potential options on multi-year contracts, excluding potential orders under IDIQ contracts. • Total backlog $2.5 billion as of April 1, 2016 o Funded backlog $1.0 billion o Unfunded backlog $1.5 billion $0.7 $0.7 $0.9 $0.7 $1.0 $1.9 $1.8 $1.5 $1.7 $1.5 $- $0.5 $1.0 $1.5 $2.0 $2.5 $3.0 Q1 2015 Q2 2015 Q3 2015 Q4 2015 Q1 2016 Funded Unfunded $2.6 $2.4 $2.4 $2.5 $2.5 ($B)

UPDATED 2016 GUIDANCE SUMMARY Page 7 (1) See Appendix for reconciliation. (2) 2016 diluted EPS is calculated using the estimated weighted average diluted common shares outstanding of 11.2 million for the year ending December 31, 2016. (3) 2016 free cash flow is calculated as estimated GAAP net cash provided by operating activities less 2016 estimated capital expenditures of $2.1 million. (in millions, except operating margin and diluted EPS) (Prior) 2016 Mid-point (Updated) 2016 Mid-point Adjusted 20151 (Updated) 2016 Mid Variance to 2015 %Var Revenue 1,110$ to 1,190$ 1,150$ to 1,190$ 1,150$ 1,170$ 1,181$ (11)$ (0.9)% Operating Margin 3.60 % to 3.90 % 3.60 % to 3.90 % 3.75 % 3.75 % 3.68 % 7 BPS Diluted EPS2 1.94$ to 2.31$ 2.02$ to 2.31$ 2.12$ 2.16$ 2.23$ (0.07)$ (3.1)% Free Cash Flow3 20$ to 30$ 22$ to 30$ 25$ 26$ 18$ 8$ 44.4 % (Prior) 2016 Guidance (Updated) 2016 Guidance

KEN HUNZEKER CHIEF EXECUTIVE OFFICER AND PRESIDENT MATT KLEIN SENIOR VICE PRESIDENT AND CHIEF FINANCIAL OFFICER VECTRUS FIRST QUARTER 2016 RESULTS

APPENDIX

RECONCILIATION OF NON-GAAP MEASURES Page 10 The primary financial performance measures we use to manage our business and monitor results of operations are revenue trends and operating income trends. In addition, we consider adjusted operating income, adjusted operating margin, adjusted net income, adjusted diluted earnings per share, and free cash flow to be useful to management and investors in evaluating our operating performance for the periods presented, and to provide a tool for evaluating our ongoing operations. This information can assist investors in assessing our financial performance and measures our ability to generate capital for deployment among competing strategic alternatives and initiatives. Adjusted operating income, adjusted operating margin, adjusted net income, adjusted diluted earnings per share, and free cash flow, however, are not measures of financial performance under generally accepted accounting principles in the United States of America (GAAP) and should not be considered a substitute for operating income, net income, diluted earnings per share, or net cash provided by operating activities as determined in accordance with GAAP. Reconciliations of these items are provided below. “Adjusted operating income” is defined as operating income, adjusted to exclude items that may include, but are not limited to, other income; significant charges or credits that impact current results but are not related to our ongoing operations and unusual and infrequent non-operating items and non-operating tax settlements or adjustments, such as separation costs incurred to become a stand-alone public company. “Adjusted operating margin” is defined as adjusted operating income divided by revenue. "Adjusted net income" is defined as net income, adjusted to exclude items that may include, but are not limited to, other income; significant charges or credits that impact current results that are related to our ongoing operations and unusual and infrequent items an non-operating tax settlements or adjustments, such as separation costs incurred to become a stand-alone public company. "Adjusted diluted earnings per share" is defined as adjusted net income divided by the weighted average diluted common shares outstanding. “Free cash flow” is defined as GAAP net cash provided by or used in operating activities less capital expenditures.

Page 11 RECONCILIATION OF NON-GAAP MEASURES (CONT.) (in thousands, except per share data) Adjusted Diluted Earnings Per Share April 1, 2016 March 27, 2015 Net income 6,589$ 4,965$ Separation costs 1 (pretax) — 146 Tax impact of adjustments — (53) Adjusted net income 6,589$ 5,058$ GAAP EPS - diluted 0.61$ 0.46$ Adjusted EPS - diluted 0.61$ 0.47$ Weighted average common shares outstanding - diluted 10,856 10,780 Three Months Ended 1 Costs incurred to become a stand-alone public company. (in thousands, except operating margin and adjusted operating margin) Operating I come (Non-GAAP Measure) ril , arch 27, 2015 Operating income 11,811 9,355 Operating margin 3.8 % 3.6 % Separation costs 1 (pretax) — 146 Adjusted operating income 11,811$ 9,501$ j t operating margin 3.8 % 3.6 % 1 Costs incurred to become a stand-alone public company. Three Months Ended (in thousands) Free Cash Flow (Non-GAAP Measure) April 1, 2016 March 27, 2015 Net cash provided by (used in) operating activities 1,685$ (27,229)$ Less: Capital expenditures (31) (465) Free cash flow 1,654$ (27,694)$ Three Months Ended

Page 12 RECONCILIATION OF NON-GAAP MEASURES (CONT.) (In thousands) 2015 Revenue 1,180,684$ (In thousands) Adjusted Operating Income (Non-GAAP Measure) 2015 Operating income 39,962$ Operating margin 3.4 % Separation costs 1 (pretax) 177 Tax indemnifications 2 3,300 Adjusted operating income 43,439$ Adjusted operating margin 3.68 % Year Ended December 31, Year Ended December 31, 1 Costs incurred to become a stand-alone public company. 2 Tax indemnifications in connection with the spin-off (see "Tax Indemnifications" in Note 3 to the financial statements in our 2015 Annual Report on Form 10-K). (In thousands, except for share and per share data) Adjusted Net Income and Adjusted Diluted Earnings Per Share (Non-GAAP Measure) 2015 Net income 30,973$ Separation costs 1 (pretax) 177 Tax impact of adjustments (13) Net settlement of uncertain tax positions 2 (6,949) Adjusted net income 24,188$ GAAP EPS - diluted $2.86 Adjusted EPS - diluted $2.23 Weighted average common shares outstanding - diluted 10,825 (In thousands) Free Cash Flow (Non-GAAP Measure) 2015 Net cash provided by operating activities $ 18,880 Less: Capital expenditures (793) Free cash flow $ 18,087 Year Ended December 31, Year Ended December 31, 1 Costs incurred to become a stand-alone public company. 2 Net settlement of uncertain tax positions due to resolution of examinations of tax returns of our former parent ("Uncertain Tax Positions" in Note 3 to the financial statements in our 2015 Annual Report on Form 10-K).


