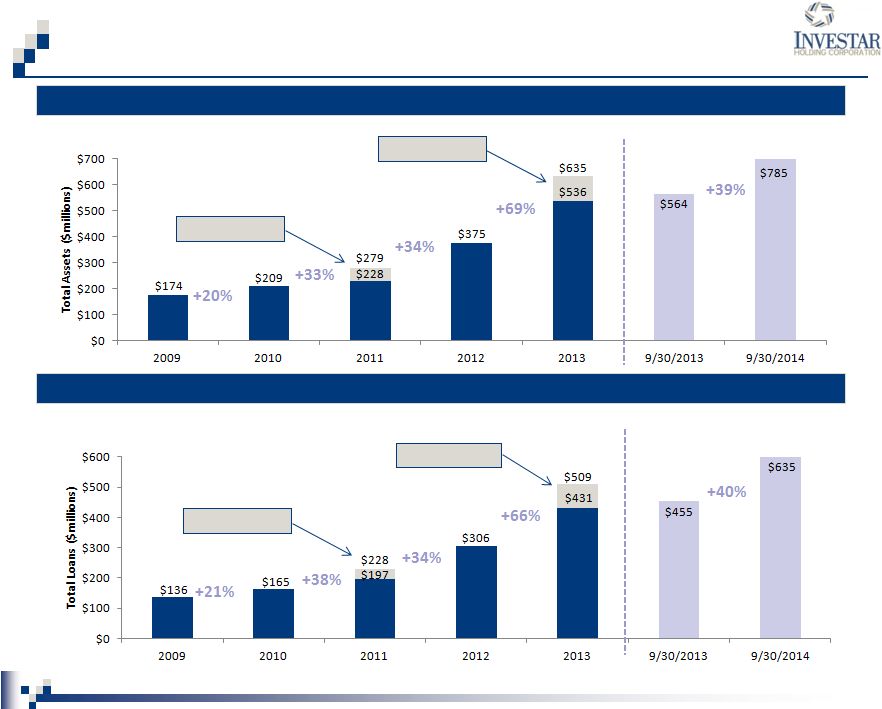
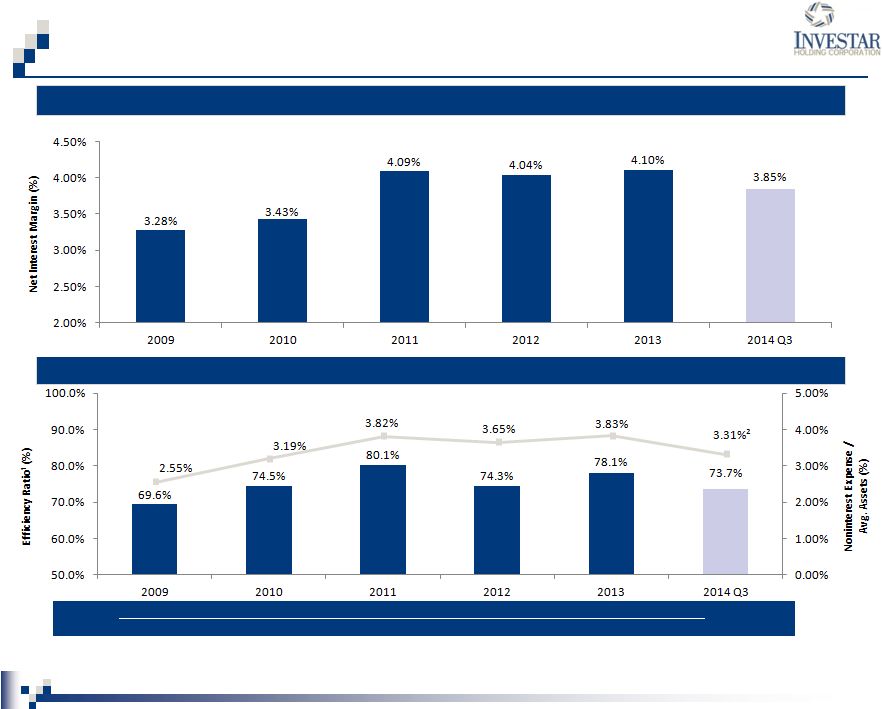
Non-GAAP Financial Measures 22 Tangible book value per share, the ratio of tangible equity to tangible assets, and the efficiency ratio are not financial measures recognized under GAAP and, therefore, are considered non-GAAP financial measures. Our management, banking regulators, many financial analysts and other investors use these non-GAAP financial measures to compare the capital adequacy of banking organizations with significant amounts of preferred equity and/or goodwill or other intangible assets, which typically stem from the use of the purchase accounting method of accounting for mergers and acquisitions. Tangible equity, tangible assets, tangible book value per share or related measures should not be considered in isolation or as a substitute for total stockholders’ equity, total assets, book value per share or any other measure calculated in accordance with GAAP. Moreover, the manner in which we calculate tangible equity, tangible assets, tangible book value per share and any other related measures may differ from that of other companies reporting measures with similar names. The following table reconciles, as of the dates set forth below, stockholders’ equity (on a GAAP basis) to tangible equity and total assets (on a GAAP basis) to tangible assets and calculates our tangible book value per share. Dollar values in thousands except per share amounts Year Ended December 31, Nine Months Ended 2009 2010 2011 2012 2013 2013 Q3 2014 Q3 Total Stockholders‘ Equity - GAAP $15,219 $16,814 $35,166 $43,553 $55,483 $55,504 $102,165 Adjustments Goodwill $0 $0 $2,684 $2,684 $2,684 $2,684 $2,684 Other Intangibles $0 $0 $155 $145 $573 $583 $542 Tangible Equity $15,219 $16,814 $32,327 $40,724 $52,226 $52,237 $98,939 Total Assets - GAAP $173,915 $209,465 $279,330 $375,446 $634,946 $563,818 $784,597 Adjustments Goodwill $0 $0 $2,684 $2,684 $2,684 $2,684 $2,684 Other Intangibles $0 $0 $155 $145 $573 $583 $542 Tangible Assets $173,915 $209,465 $276,491 $372,617 $631,689 $560,551 $781,371 Total Shares Outstanding Book Value Per Share $10.88 $11.46 $12.82 $13.56 $14.06 $14.07 $14.08 Effect of Adjustment $0.00 $0.00 ($1.03) ($0.88) ($0.82) ($0.82) ($0.44) Tangible Book Value Per Share $10.88 $11.46 $11.79 $12.68 $13.24 $13.25 $13.64 Total Equity to Total Assets 8.75% 8.03% 12.59% 11.60% 8.74% 9.84% 13.03% Effect of Adjustment 0 0 (0.90) (0.67) (0.47) (0.52) (0.37) Tangible Equity to Tangible Assets 8.75% 8.03% 11.69% 10.93% 8.27% 9.32% 12.66% Efficiency Ratio Noninterest Expense $4,052 $6,195 $8,615 $11,645 $19,024 $13,406 $17,429 Income before Noninterest Expense $4,552 $7,293 $10,116 $14,985 $23,340 $17,454 $22,454 Provision $1,273 $1,019 $639 $685 $1,026 $340 $1,198 Efficiency Ratio 69.6% 74.5% 80.1% 74.3% 78.1% 75.3% 73.7% |