Exhibit 99.2 NASDAQ: ISTR 1Q 2020 Earnings Release Presentation April 23, 2020
FORWARD-LOOKING STATEMENTS This presentation may contain forward-looking statements within the meaning of the Private Securities Litigation Reform Act of 1995 that reflect the Company’s current views with respect to, among other things, future events and financial performance. The Company generally identifies forward-looking statements by terminology such as www.investarbank.com “outlook,” “believes,” “expects,” “potential,” “continues,” “may,” “will,” “could,” “should,” “seeks,” “approximately,” “predicts,” “intends,” “plans,” “estimates,” “anticipates,” or the negative version of those words or other comparable words. Any forward-looking statements contained in this presentation are based on the historical performance of the Company and its subsidiaries or on the Company’s current plans, estimates and NASDAQ: ISTR expectations. The inclusion of this forward-looking information should not be regarded as a representation by the Company that the future plans, estimates or expectations by the Company will be achieved. Such forward-looking statements are subject to various risks and uncertainties and assumptions relating to the Company’s operations, We encourage everyone to visit the financial results, financial condition, business prospects, growth strategy and liquidity. If one or more of these or other risks or uncertainties materialize, or if the Company’s underlying assumptions prove to be incorrect, the Investors Section of our website at Company’s actual results may vary materially from those indicated in these statements. The Company does not undertake any obligation to publicly update or review any forward-looking statement, whether as a result of new www.investarbank.com, where we information, future developments or otherwise. A number of important factors could cause actual results to differ materially from those indicated by the forward-looking statements. These factors include, but are not limited to, the have posted additional important following, any one or more of which could materially affect the outcome of future events: information such as press releases • the ongoing impacts of the COVID-19 pandemic on economic conditions in general and on the Bank’s markets in and SEC filings. particular, and on the Bank’s operations and financial results; • ongoing disruptions in the oil and gas industry due to the significant decrease in the price of oil; • business and economic conditions generally and in the financial services industry in particular, whether nationally, regionally or in the markets in which we operate; We intend to use our website to • our ability to achieve organic loan and deposit growth, and the composition of that growth; • our ability to integrate and achieve anticipated cost savings from our acquisitions; expedite public access to time-critical • changes (or the lack of changes) in interest rates, yield curves and interest rate spread relationships that affect information regarding the Company our loan and deposit pricing; • the extent of continuing client demand for the high level of personalized service that is a key element of our in advance of or in lieu of distributing banking approach as well as our ability to execute our strategy generally; • our dependence on our management team, and our ability to attract and retain qualified personnel; a press release or a filing with the • changes in the quality or composition of our loan or investment portfolios, including adverse developments in borrower industries or in the repayment ability of individual borrowers; SEC disclosing the same information. • inaccuracy of the assumptions and estimates we make in establishing reserves for probable loan losses and other estimates; • the concentration of our business within our geographic areas of operation in Louisiana, Texas and Alabama; and • concentration of credit exposure; and • the satisfaction of the conditions to closing the pending acquisition of Cheaha Bank and the ability to subsequently integrate it effectively. These factors should not be construed as exhaustive. Additional information on these and other risk factors can be found in Item 1A. “Risk Factors” and Item 7. “Special Note Regarding Forward-Looking Statements” in the Company’s Annual Report on Form 10-K for the year ended December 31, 2019, filed with the Securities and Exchange Commission. 2
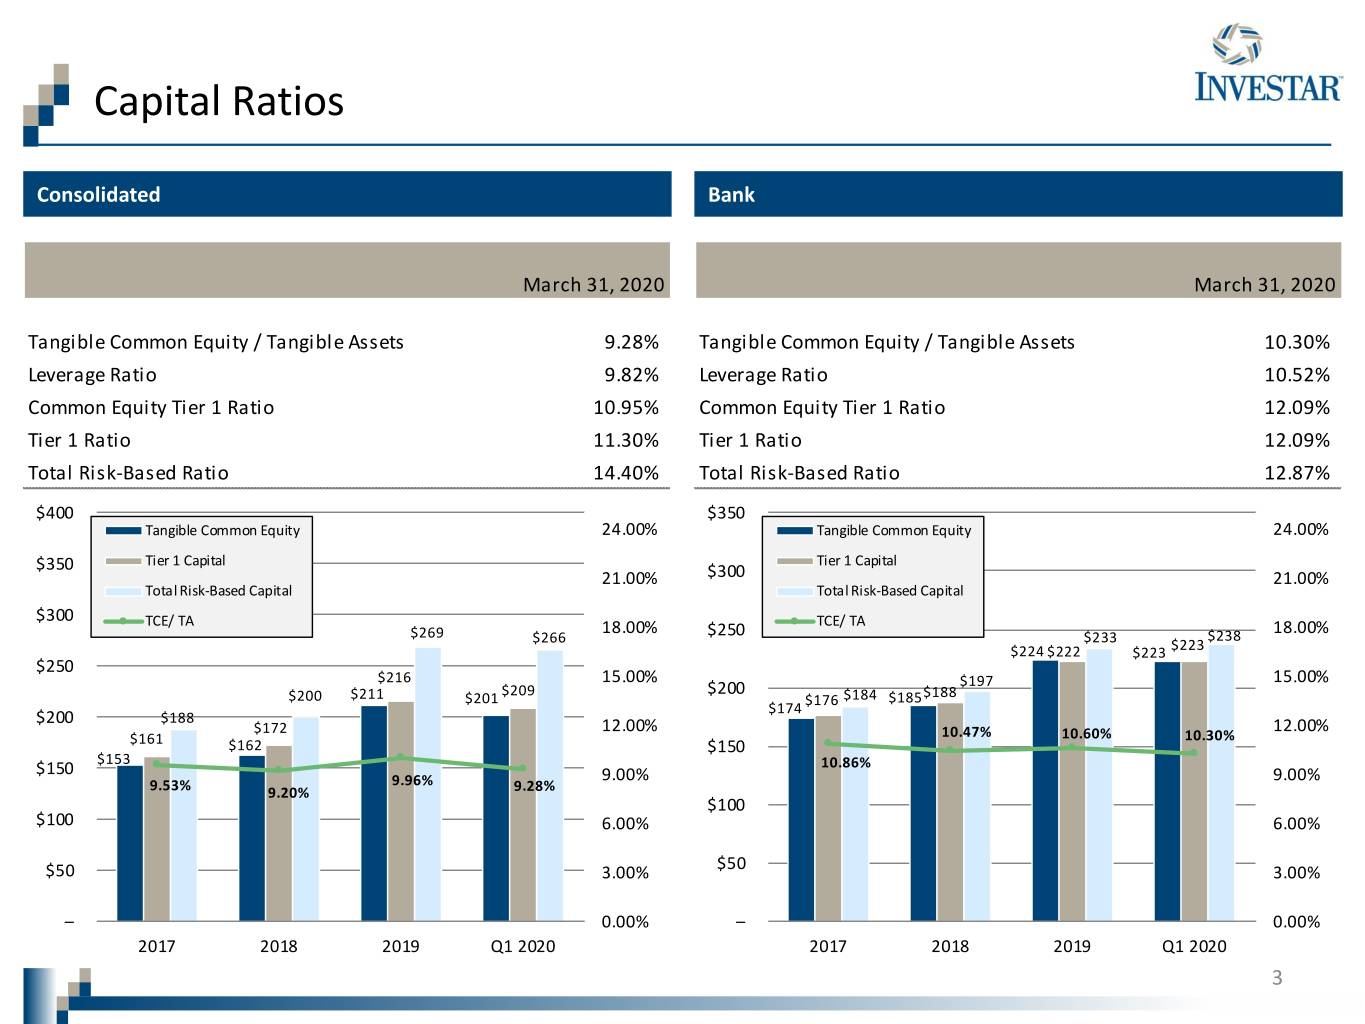
Capital Ratios Consolidated Bank March 31, 2020 March 31, 2020 Tangible Common Equity / Tangible Assets 9.28% Tangible Common Equity / Tangible Assets 10.30% Leverage Ratio 9.82% Leverage Ratio 10.52% Common Equity Tier 1 Ratio 10.95% Common Equity Tier 1 Ratio 12.09% Tier 1 Ratio 11.30% Tier 1 Ratio 12.09% Total Risk-Based Ratio 14.40% Total Risk-Based Ratio 12.87% $400 $350 Tangible Common Equity 24.00% Tangible Common Equity 24.00% $350 Tier 1 Capital Tier 1 Capital 21.00% $300 21.00% Total Risk-Based Capital Total Risk-Based Capital $300 TCE/ TA 18.00% TCE/ TA 18.00% $269 $266 $250 $233 $238 $224 $222 $223 $223 $250 $216 15.00% $197 15.00% $209 $200 $188 $200 $211 $201 $176 $184 $185 $174 $200 $188 $172 12.00% 12.00% 10.47% 10.60% 10.30% $161 $162 $150 $153 $150 10.86% 9.96% 9.00% 9.00% 9.53% 9.20% 9.28% $100 $100 6.00% 6.00% $50 $50 3.00% 3.00% – 0.00% – 0.00% 2017 2018 2019 Q1 2020 2017 2018 2019 Q1 2020 3

Loan Portfolio Segmentation March 31, 2020 Business Lending Portfolio¹ Entertainment Other Services (except Public 1% Administration) Health Care and Social C&I 6% 18% 1-4 Family Hospitality Assistance 19% 1% 12% Restaurants 5% Direct Consumer Energy / 2% Servicing Wholesale Multifamily 8% Trade 3% 12% Other $1,730M Industries C&D less than 5% $684M 11% 7% Real Estate, Rental and Construction Leasing 6% 11% Professional, Commercial Scientific, and Manufacturing Technical Services Real Estate Retail 8% 11% 47% 12% Yield on loans: 5.11% 43% of CRE is owner-occupied (1) Business lending portfolio includes owner-occupied CRE and C&I loans as of March 31, 2020 4
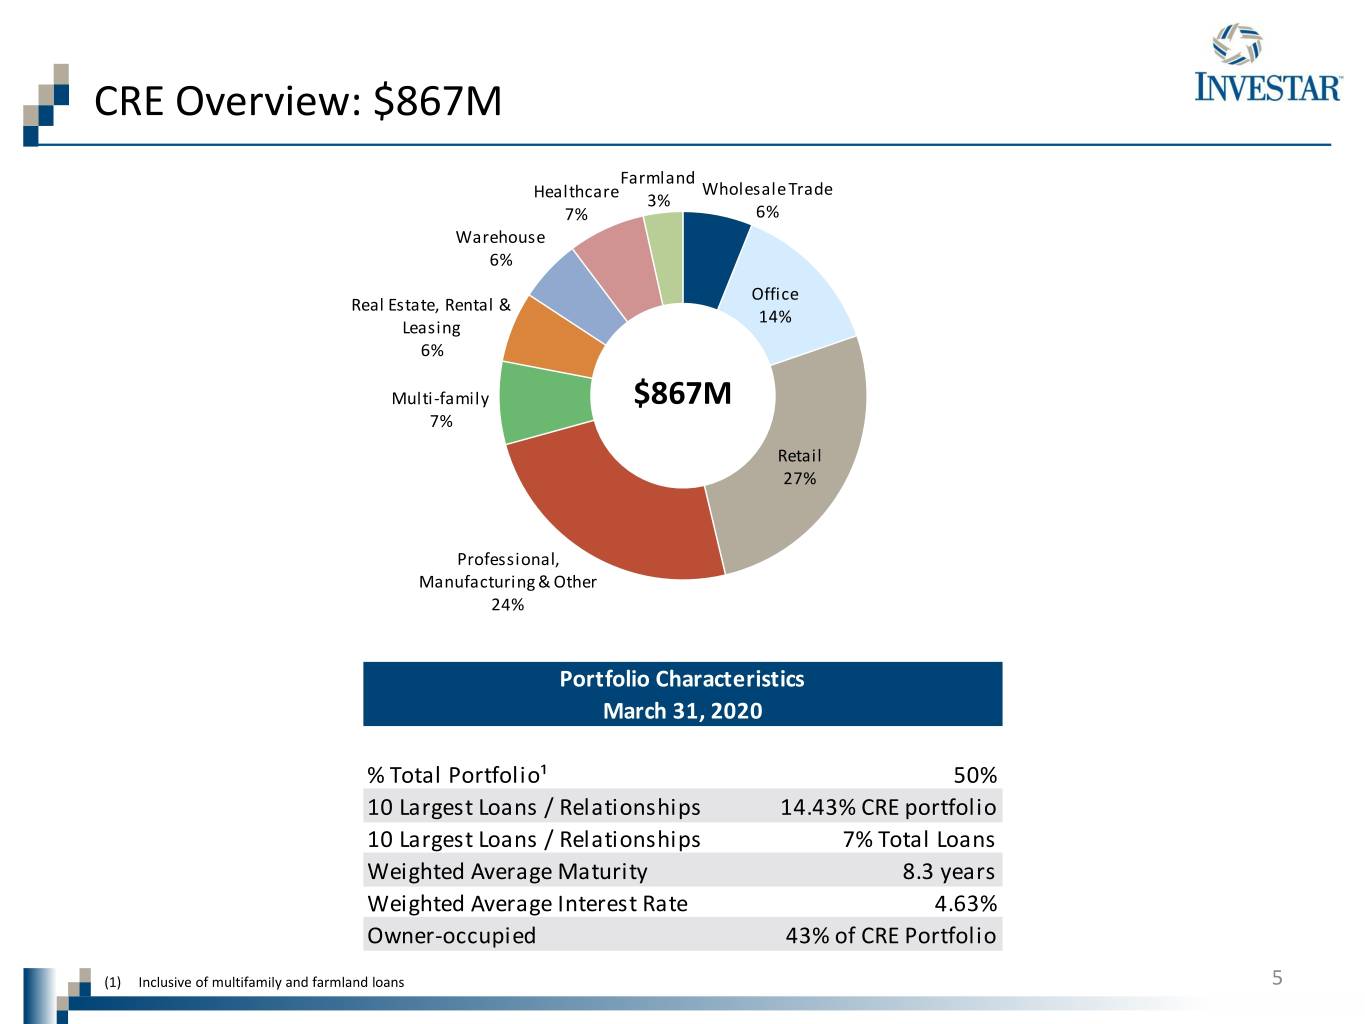
CRE Overview: $867M Farmland Wholesale Trade Healthcare 3% 7% 6% Warehouse 6% Office Real Estate, Rental & 14% Leasing 6% Multi-family $867M 7% Retail 27% Professional, Manufacturing & Other 24% Portfolio Characteristics March 31, 2020 % Total Portfolio¹ 50% 10 Largest Loans / Relationships 14.43% CRE portfolio 10 Largest Loans / Relationships 7% Total Loans Weighted Average Maturity 8.3 years Weighted Average Interest Rate 4.63% Owner-occupied 43% of CRE Portfolio (1) Inclusive of multifamily and farmland loans 5
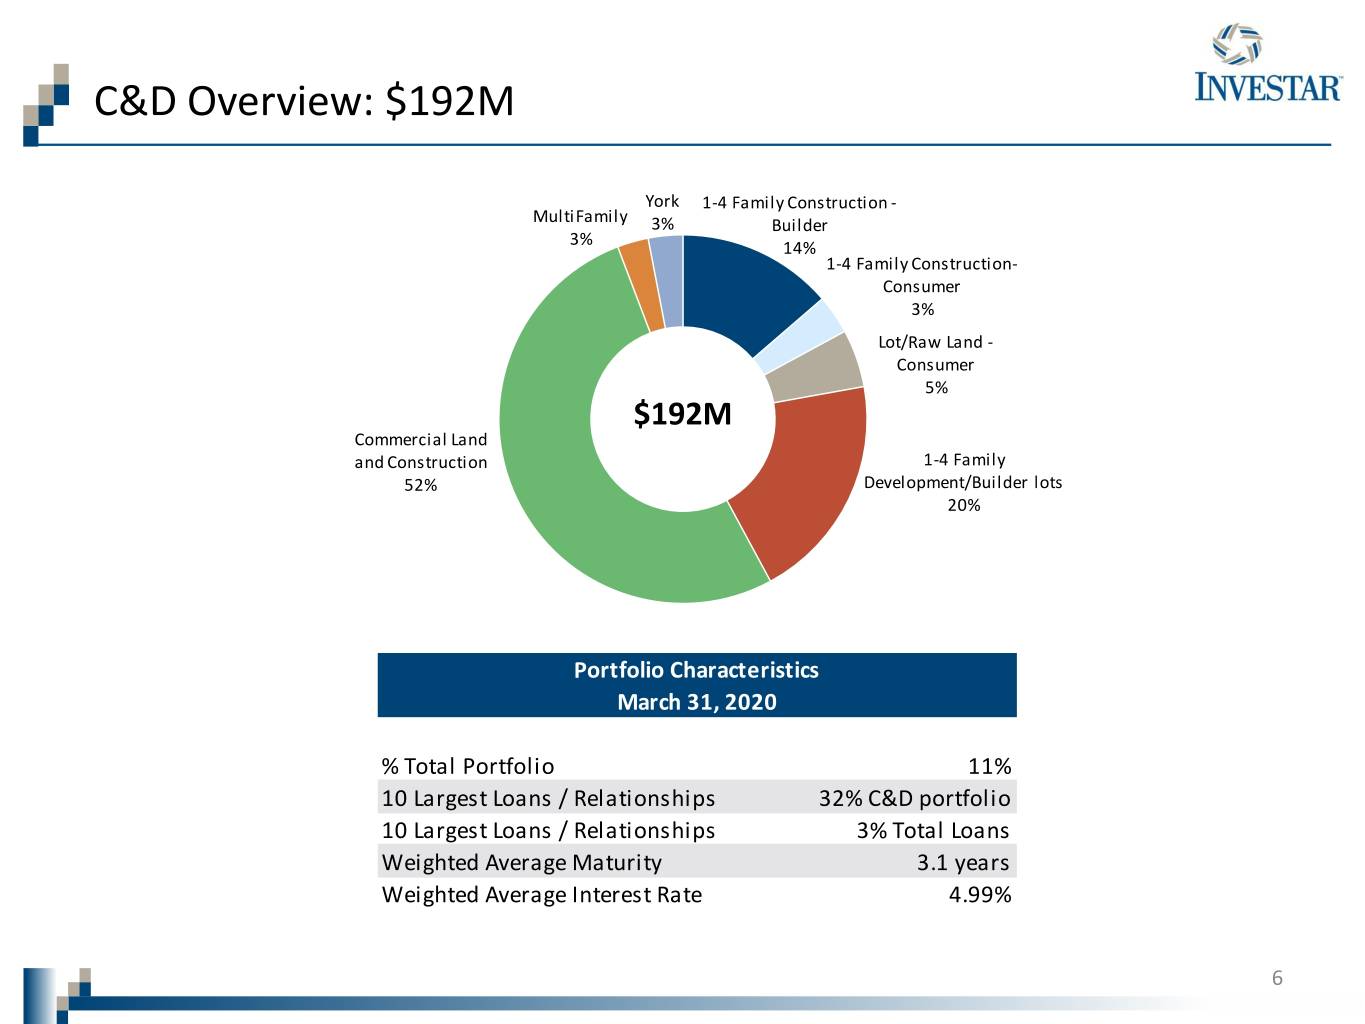
C&D Overview: $192M York 1-4 Family Construction - MultiFamily 3% Builder 3% 14% 1-4 Family Construction- Consumer 3% Lot/Raw Land - Consumer 5% $192M Commercial Land and Construction 1-4 Family 52% Development/Builder lots 20% Portfolio Characteristics March 31, 2020 % Total Portfolio 11% 10 Largest Loans / Relationships 32% C&D portfolio 10 Largest Loans / Relationships 3% Total Loans Weighted Average Maturity 3.1 years Weighted Average Interest Rate 4.99% 6
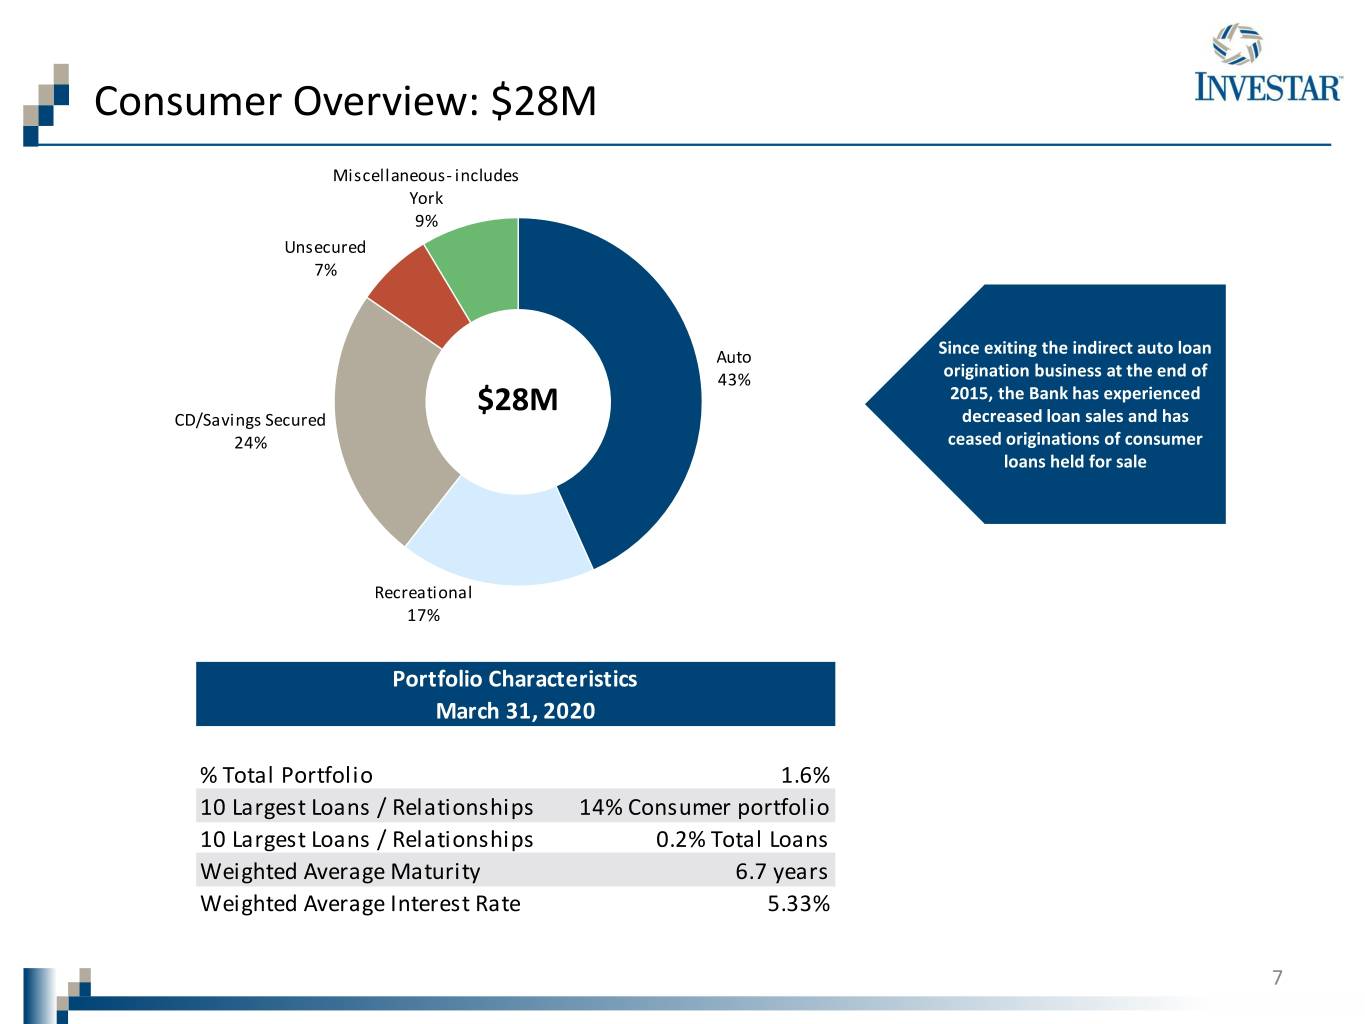
Consumer Overview: $28M Miscellaneous- includes York 9% Unsecured 7% Auto Since exiting the indirect auto loan 43% origination business at the end of $28M 2015, the Bank has experienced CD/Savings Secured decreased loan sales and has 24% ceased originations of consumer loans held for sale Recreational 17% Portfolio Characteristics March 31, 2020 % Total Portfolio 1.6% 10 Largest Loans / Relationships 14% Consumer portfolio 10 Largest Loans / Relationships 0.2% Total Loans Weighted Average Maturity 6.7 years Weighted Average Interest Rate 5.33% 7
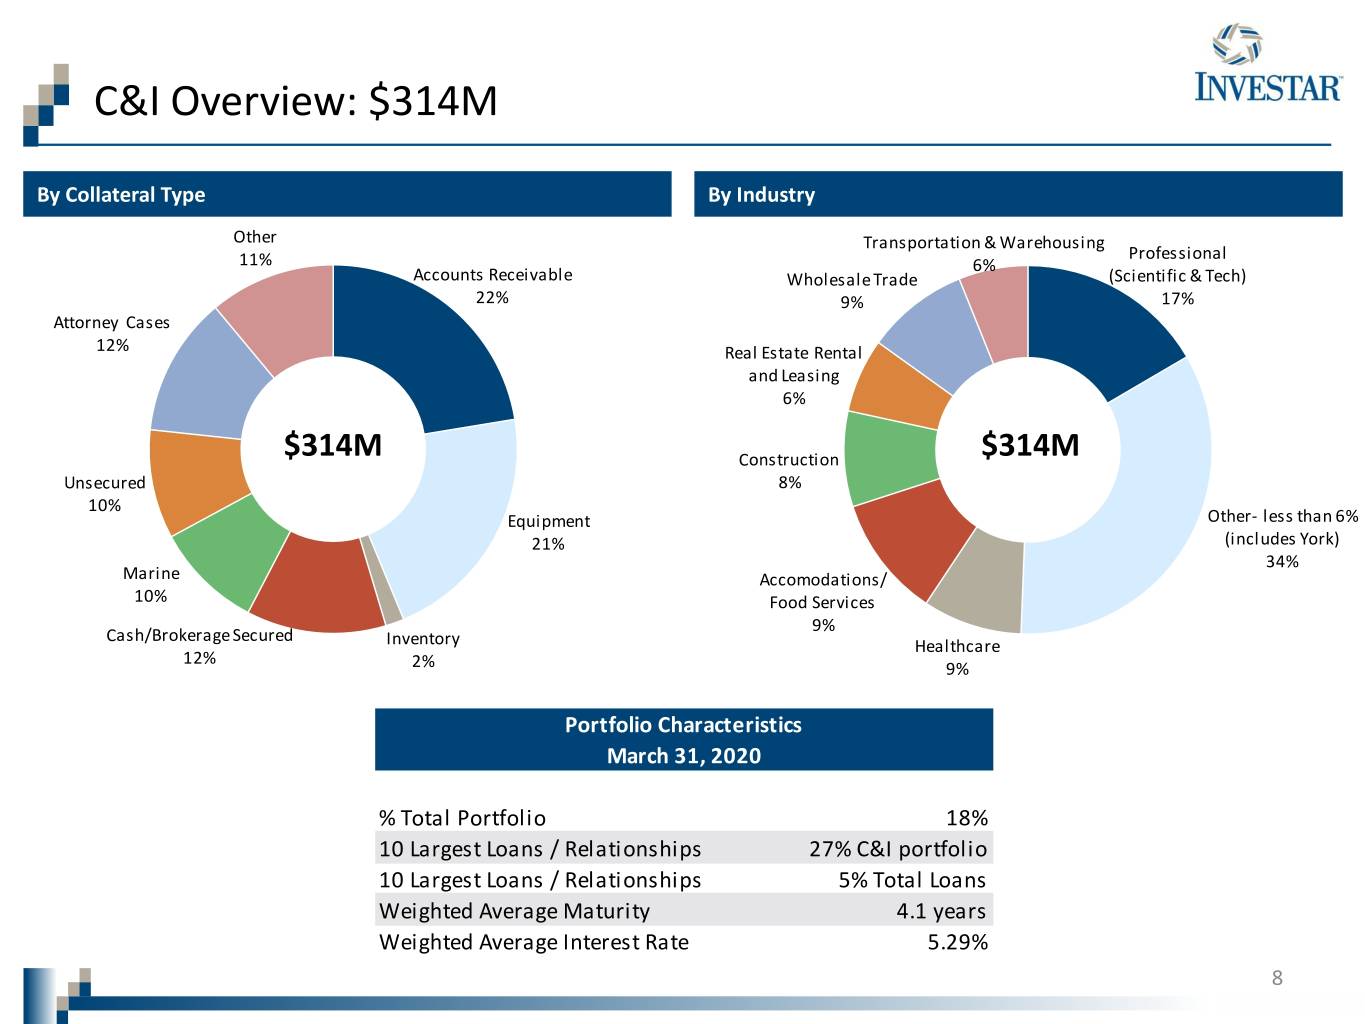
C&I Overview: $314M By Collateral Type By Industry Other Transportation & Warehousing Professional 11% 6% Accounts Receivable Wholesale Trade (Scientific & Tech) 22% 9% 17% Attorney Cases 12% Real Estate Rental and Leasing 6% $314M Construction $314M Unsecured 8% 10% Equipment Other- less than 6% 21% (includes York) 34% Marine Accomodations/ 10% Food Services 9% Cash/Brokerage Secured Inventory Healthcare 12% 2% 9% Portfolio Characteristics March 31, 2020 % Total Portfolio 18% 10 Largest Loans / Relationships 27% C&I portfolio 10 Largest Loans / Relationships 5% Total Loans Weighted Average Maturity 4.1 years Weighted Average Interest Rate 5.29% 8
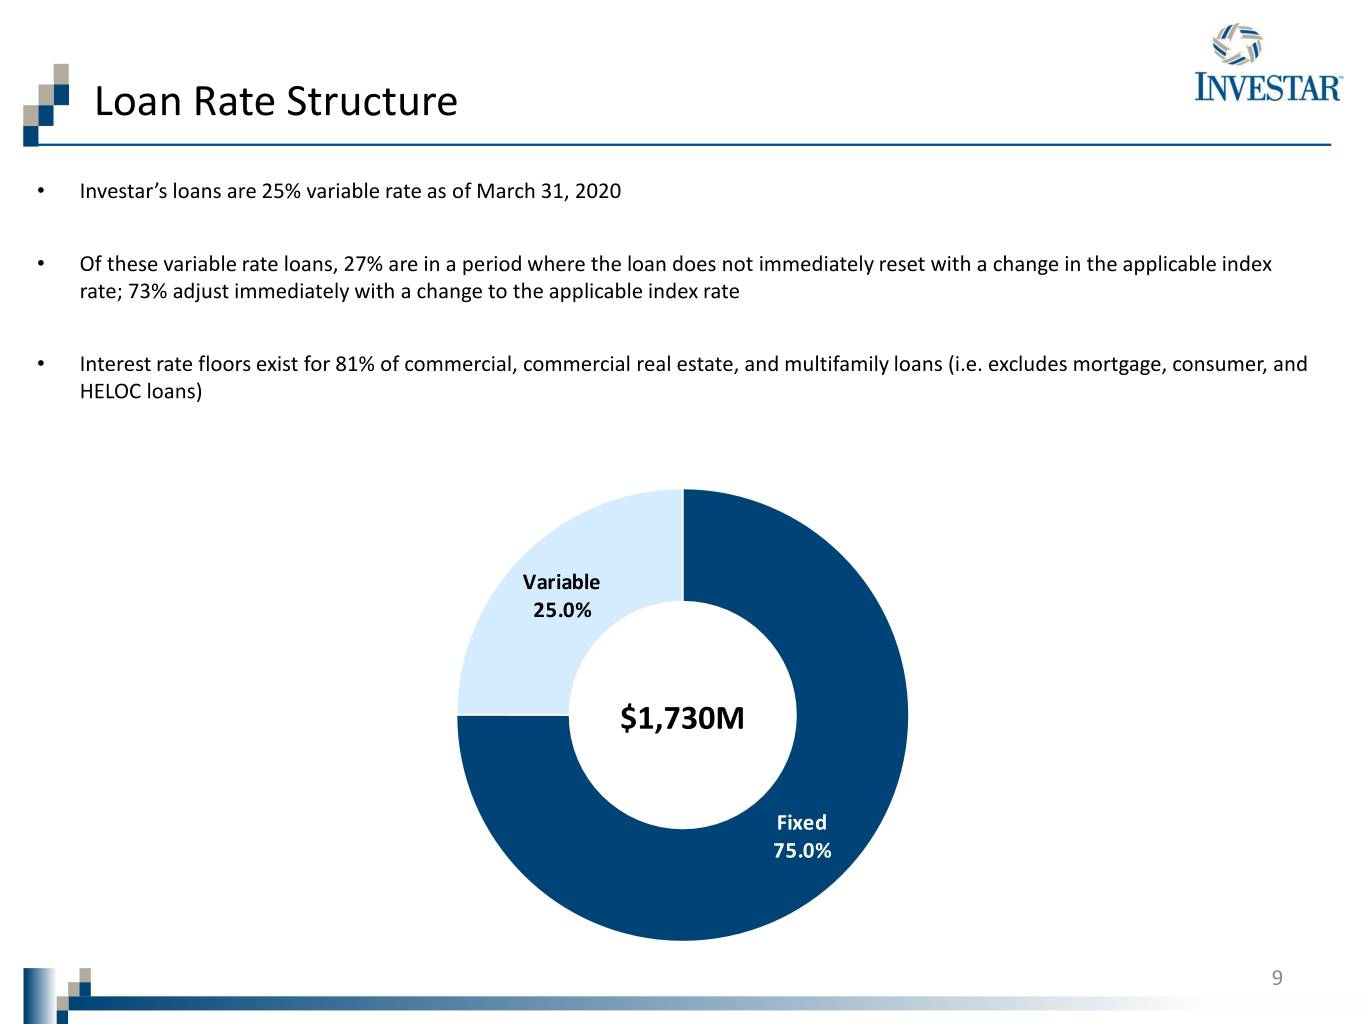
Loan Rate Structure • Investar’s loans are 25% variable rate as of March 31, 2020 • Of these variable rate loans, 27% are in a period where the loan does not immediately reset with a change in the applicable index rate; 73% adjust immediately with a change to the applicable index rate • Interest rate floors exist for 81% of commercial, commercial real estate, and multifamily loans (i.e. excludes mortgage, consumer, and HELOC loans) Variable 25.0% $1,730M Fixed 75.0% 9
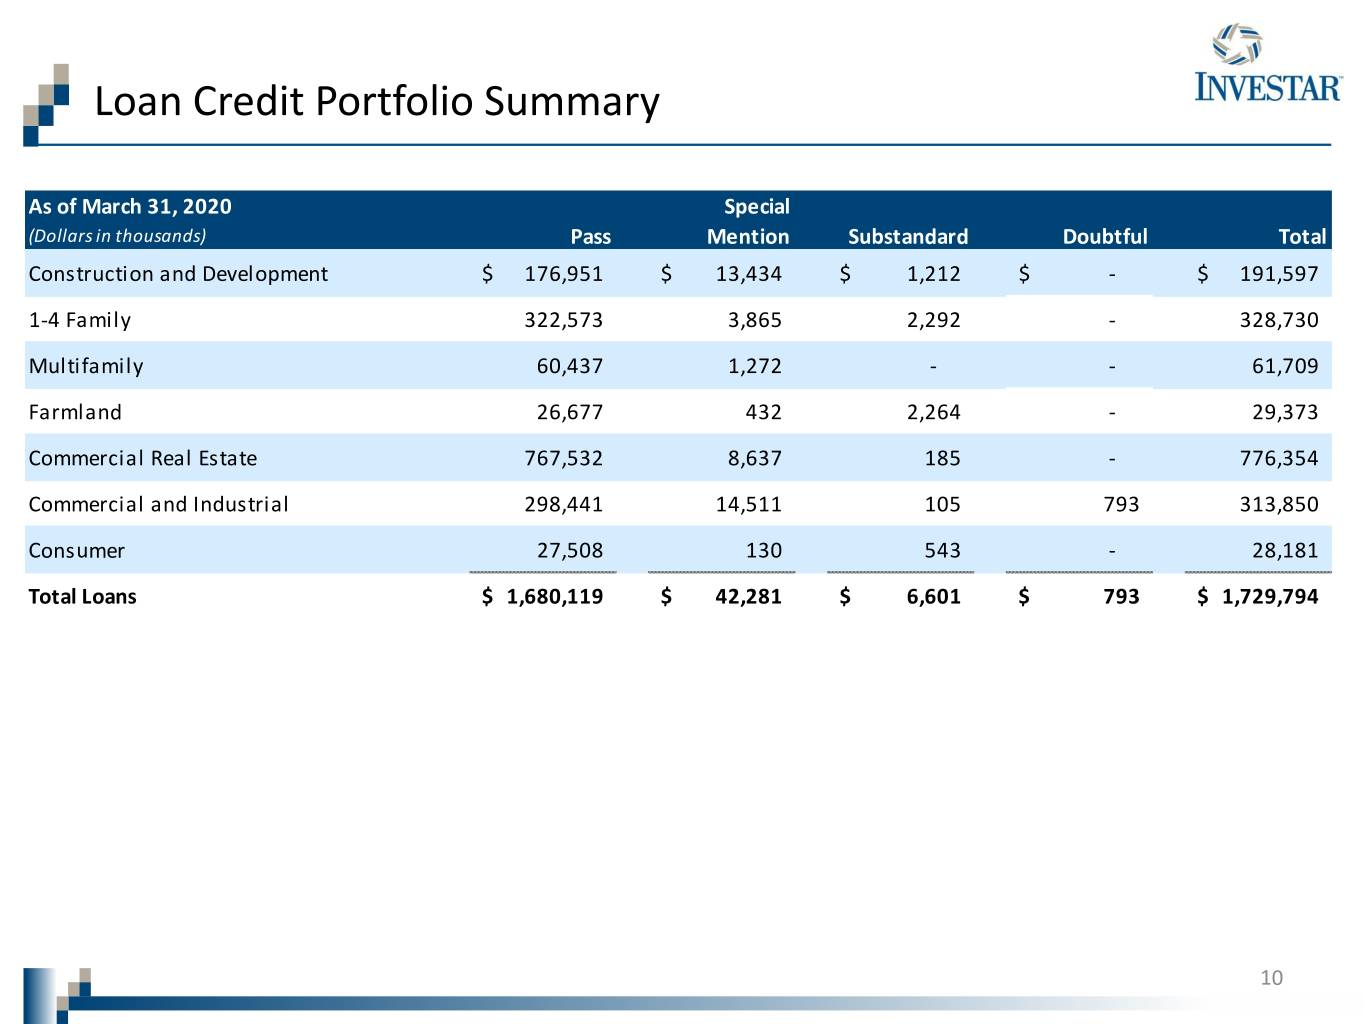
Loan Credit Portfolio Summary As of March 31, 2020 Special (Dollars in thousands) Pass Mention Substandard Doubtful Total Construction and Development $ 176,951 $ 13,434 $ 1,212 $ - $ 191,597 1-4 Family 322,573 3,865 2,292 - 328,730 Multifamily 60,437 1,272 - - 61,709 Farmland 26,677 432 2,264 - 29,373 Commercial Real Estate 767,532 8,637 185 - 776,354 Commercial and Industrial 298,441 14,511 105 793 313,850 Consumer 27,508 130 543 - 28,181 Total Loans $ 1,680,119 $ 42,281 $ 6,601 $ 793 $ 1,729,794 10
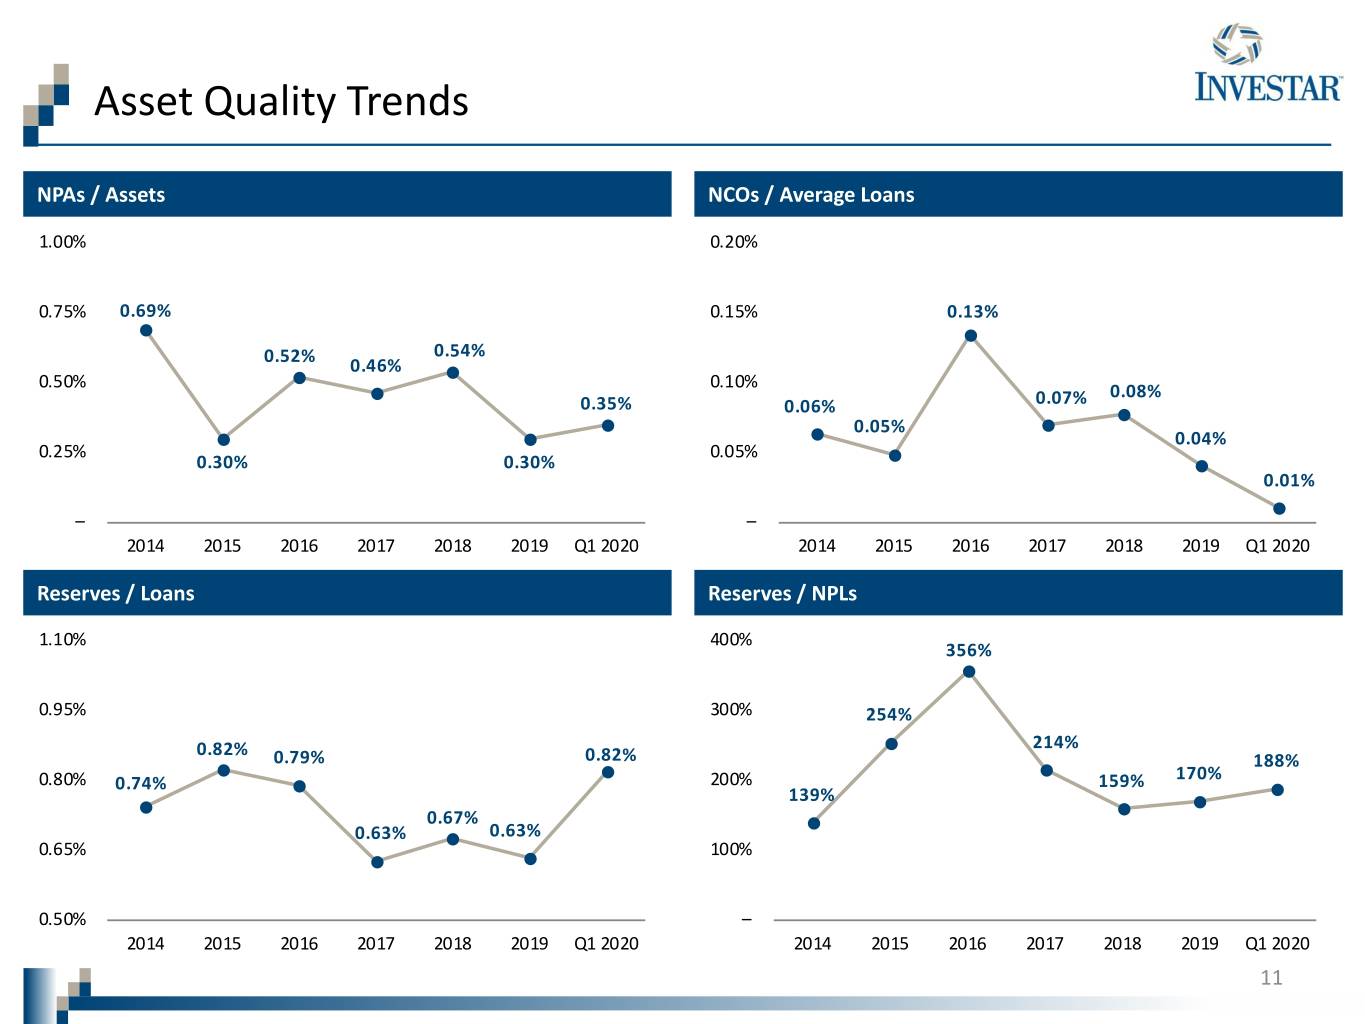
Asset Quality Trends NPAs / Assets NCOs / Average Loans 1.00% 0.20% 0.75% 0.69% 0.15% 0.13% 0.52% 0.54% 0.46% 0.50% 0.10% 0.08% 0.35% 0.06% 0.07% 0.05% 0.04% 0.25% 0.05% 0.30% 0.30% 0.01% – – 2014 2015 2016 2017 2018 2019 Q1 2020 2014 2015 2016 2017 2018 2019 Q1 2020 Reserves / Loans Reserves / NPLs 1.10% 400% 356% 0.95% 300% 254% 0.82% 214% 0.79% 0.82% 188% 170% 0.80% 0.74% 200% 159% 139% 0.67% 0.63% 0.63% 0.65% 100% 0.50% – 2014 2015 2016 2017 2018 2019 Q1 2020 2014 2015 2016 2017 2018 2019 Q1 2020 11

Net Interest Margin 6.00% Yield on Interest Earning Assets Net Interest Margin Cost of Funds 5.00% 4.84% 4.65% 4.71% 4.52% 4.29% 4.25% 4.12% 4.00% 3.85% 3.61% 3.61% 3.51% 3.46% 3.32% 3.39% 3.00% 2.00% 1.40% 1.32% 1.10% 0.86% 0.92% 1.00% 0.72% 0.73% – 2014 2015 2016 2017 2018 2019 Q1 2020 12
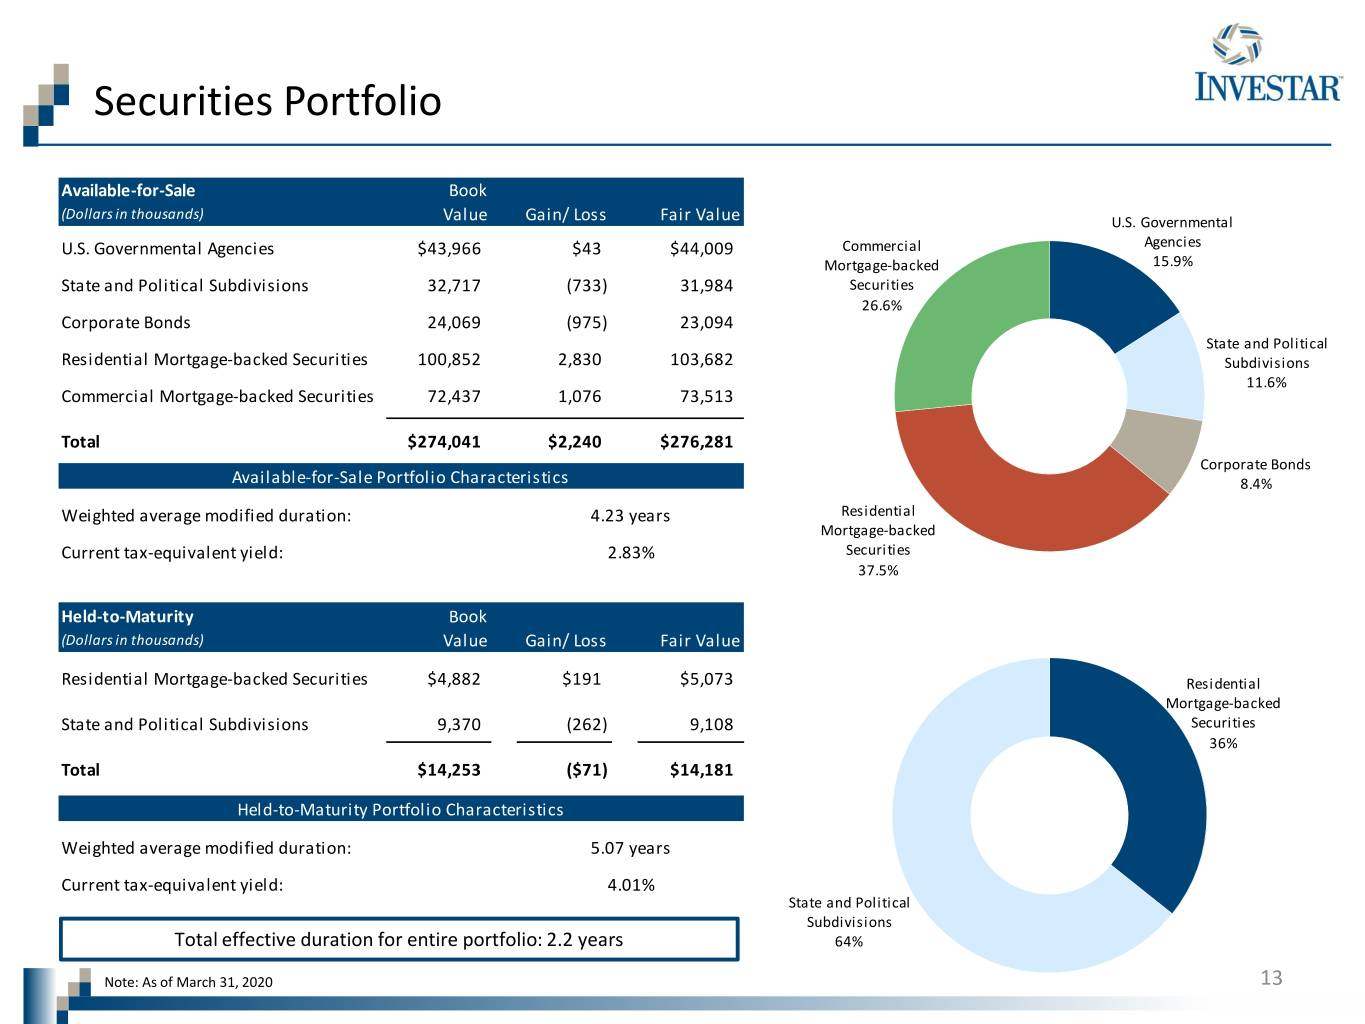
Securities Portfolio Available-for-Sale Book (Dollars in thousands) Value Gain/ Loss Fair Value U.S. Governmental U.S. Governmental Agencies $43,966 $43 $44,009 Commercial Agencies Mortgage-backed 15.9% State and Political Subdivisions 32,717 (733) 31,984 Securities 26.6% Corporate Bonds 24,069 (975) 23,094 State and Political Residential Mortgage-backed Securities 100,852 2,830 103,682 Subdivisions 11.6% Commercial Mortgage-backed Securities 72,437 1,076 73,513 Total $274,041 $2,240 $276,281 Corporate Bonds Available-for-Sale Portfolio Characteristics 8.4% Weighted average modified duration: 4.23 years Residential Mortgage-backed Current tax-equivalent yield: 2.83% Securities 37.5% Held-to-Maturity Book (Dollars in thousands) Value Gain/ Loss Fair Value Residential Mortgage-backed Securities $4,882 $191 $5,073 Residential Mortgage-backed State and Political Subdivisions 9,370 (262) 9,108 Securities 36% Total $14,253 ($71) $14,181 Held-to-Maturity Portfolio Characteristics Weighted average modified duration: 5.07 years Current tax-equivalent yield: 4.01% State and Political Subdivisions Total effective duration for entire portfolio: 2.2 years 64% Note: As of March 31, 2020 13


