| As filed with the Securities and Exchange Commission on August 27, 2015 |
| UNITED STATES |
| SECURITIES AND EXCHANGE COMMISSION |
| WASHINGTON, D.C. 20549 |
| FORM N-CSR |
| CERTIFIED SHAREHOLDER REPORT OF REGISTERED MANAGEMENT |
| INVESTMENT COMPANIES |
| Investment Company Act file number 811-22989 |
| ALTMFX TRUST |
| Three Canal Plaza, Suite 600 |
| Portland, Maine 04101 |
| Christopher J. Koons, Principal Executive Officer |
| Three Canal Plaza, Suite 600 |
| Portland, Maine 04101 |
| 207-347-2000 |
| Date of fiscal year end: December 31, 2015 |
| Date of reporting period: January 1, 2015 – June 30, 2015 |
ITEM 1. REPORT TO STOCKHOLDERS.
CASTLERIGG EQUITY EVENT AND ARBITRAGE FUND SCHEDULE OF INVESTMENTS JUNE 30, 2015 |
| Shares | Security Description | Value |
Long Positions - 89.8% | ||||||
Common Stock - 89.3% | ||||||
Bermuda - 4.0% | ||||||
Financials - 4.0% | ||||||
| 3,445 | PartnerRe, Ltd. | $ | 442,682 | |||
Canada - 3.4% | ||||||
Consumer, Cyclical - 3.4% | ||||||
| 17,200 | Hudson's Bay Co. | 382,146 | ||||
United States - 80.1% | |||||||||
Basic Materials - 4.9% | |||||||||
| 3,900 | Sigma-Aldrich Corp. | 543,465 | |||||||
Communications - 6.8% | |||||||
| 35,900 | JDS Uniphase Corp. (a) | 415,722 | |||||
| 54,186 | Windstream Holdings, Inc. | 345,707 | |||||
| 761,429 | |||||||
Consumer, Cyclical - 23.0% | |||||||
| 6,330 | ANN, Inc. (a) | 305,676 | |||||
| 13,550 | Bob Evans Farms, Inc. | 691,728 | |||||
| 16,092 | Ethan Allen Interiors, Inc. | 423,863 | |||||
| 8,950 | Family Dollar Stores, Inc. | 705,349 | |||||
| 11,140 | La Quinta Holdings, Inc. (a) | 254,549 | |||||
| 13,400 | Meritor, Inc. (a) | 175,808 | |||||
| 2,556,973 | |||||||
Consumer, Non-cyclical - 27.5% | |||||||
| 11,200 | Akorn, Inc. (a) | 488,992 | |||||
| 21,150 | Brookdale Senior Living, Inc. (a) | 733,905 | |||||
| 5,600 | Catamaran Corp. (a) | 342,048 | |||||
| 5,920 | Hospira, Inc. (a) | 525,163 | |||||
| 1,400 | Humana, Inc. (b) | 267,792 | |||||
| 3,400 | Mylan NV (a) | 230,724 | |||||
| 5,000 | Omnicare, Inc. | 471,250 | |||||
| 3,059,874 | |||||||
Financials – 9.2% | |||||||
| 32,086 | American Realty Capital Properties, Inc. REIT (a) | 260,859 | |||||
| 11,350 | CIT Group, Inc. | 527,661 | |||||
| 3,000 | HCC Insurance Holdings, Inc. | 230,520 | |||||
| 1,019,040 | |||||||
Government - 4.7% | |||||||
| 5,853 | City National Corp. (b) | 529,053 | |||||
Technology - 4.0% | |||||||
| 4,700 | Altera Corp. | 240,640 | |||||
| 4,050 | Broadcom Corp., Class A | 208,535 | |||||
| 449,175 | |||||||
United Kingdom - 1.8% | |||||||
Consumer, Non-cyclical - 1.8% | |||||||
| 14,260 | Travelport Worldwide, Ltd. | 196,503 |
Total Common Stock (Cost $10,588,878) | 9,940,340 | |||||||||
| Shares | Security Description | Strike Price | Exp. Date | Value |
Purchased Options - 0.5% | ||||||||||||
| 59 | SPDR S&P 500 ETF | $ | 205.00 | 01/16 | $ | 56,138 | ||||||
Total Put Options Purchased (Cost $57,112) | 56,138 | |||||||||||
Total Long Positions - 89.8% (Cost $10,645,990)* | 9,996,478 |
Total Short Positions - (7.0)% (Proceeds $(770,659))* | (774,564 | ) |
Total Written Options - (0.2)% (Premiums Received $(27,257))* | (24,013 | ) |
| Other Assets & Liabilities, Net – 17.4% | 1,932,339 | ||
| Net Assets – 100.0% | $ | 11,130,240 |
| See Notes to Financial Statements. | 1 |
CASTLERIGG EQUITY EVENT AND ARBITRAGE FUND SCHEDULE OF SECURITIES SOLD SHORT JUNE 30, 2015 |
| Shares | Security Description | Value |
Short Positions - (7.0)% |
Common Stock - (7.0)% |
Canada - (2.4)% |
Financials - (2.4)% |
| (4,383) | Royal Bank of Canada | $ | (268,021) |
Singapore - (0.8)% |
Technology - (0.8)% |
| (709) | Avago Technologies, Ltd. | (94,247) |
United States - (3.8)% |
Consumer, Cyclical - (2.5)% |
| (4,293) | Ascena Retail Group, Inc. | (71,500) | |||
| (500) | Choice Hotels International, Inc. | (27,125) | |||
| (2,223) | Dollar Tree, Inc. | (175,595) |
| (274,220) | ||
Financials - (1.3)% | ||
| (6,963) | Host Hotels & Resorts, Inc. REIT | (138,076) |
Total Common Stock - (7.0)% (Cost $(770,659)) | (774,564) |
Total Short Positions - (7.0)% (Cost $(770,659)) | $ | (774,564) |
| See Notes to Financial Statements. | 2 |
CASTLERIGG EQUITY EVENT AND ARBITRAGE FUND SCHEDULE OF PUT OPTIONS WRITTEN JUNE 30, 2015 |
| Contracts | Security Description | Strike Price | Exp. Date | Value |
Written Options - (0.2)% |
Put Options Written - (0.2)% | |||||||||
| (59) | SPDR S&P 500 ETF | $ | 185.00 | 01/16 | $ | (24,013) | |||
Total Put Options Written (Premiums Received $(27,257)) | (24,013) |
Total Written Options - (0.2)% (Premiums Received $(27,257)) | $ | (24,013) |
| See Notes to Financial Statements. | 3 |
CASTLERIGG EQUITY EVENT AND ARBITRAGE FUND NOTES TO SCHEDULES OF INVESTMENTS, SECURITIES SOLD SHORT AND PUT OPTIONS WRITTEN JUNE 30, 2015 |
| ETF | Exchange Traded Fund |
| REIT | Real Estate Investment Trust |
| (a) | Non-income producing security. |
| (b) | All or a portion of this security is held as collateral for securities sold short. |
| * Cost for federal income tax purposes is substantially the same as for financial statement purposes and net unrealized depreciation consists of: |
| Gross Unrealized Appreciation | $ | 40,937 | ||
| Gross Unrealized Depreciation | (691,110 | ) | ||
| Net Unrealized Depreciation | $ | (650,173 | ) |
At June 30, 2015, the Fund held the following total return swap agreements:
AFACounterparty | Reference Entity / Obligation | Pays / Receive(1) | Average Spread | Maturity Date | Currency | Notional Amount in Local Currency | Net Unrealized Appreciation (Depreciation) | ||||||||||||
| Bank of America | Delhaize Group | Receive | EUR LIBOR 1M 40BPS | 6/10/2016 | EUR | (298,509 | ) | $ | (22,183 | ) | |||||||||
| Delhaize Group | Receive | EUR LIBOR 1M 40BPS | 6/10/2016 | EUR | (77,425 | ) | (2,926 | ) | |||||||||||
| Delhaize Group | Receive | EUR LIBOR 1M 40BPS | 6/10/2016 | EUR | (81,488 | ) | (2,089 | ) | |||||||||||
| Koninklijke Ahold N.V. | Pay | EUR LIBOR 1M -40BPS | 6/10/2016 | EUR | 336,018 | 17,340 | |||||||||||||
| Koninklijke Ahold N.V. | Pay | EUR LIBOR 1M -40BPS | 6/10/2016 | EUR | 87,870 | 2,067 | |||||||||||||
| Koninklijke Ahold N.V. | Pay | EUR LIBOR 1M -40BPS | 6/10/2016 | EUR | 92,797 | 1,379 | |||||||||||||
| Cazenove | Norbert Dentressangle | Receive | EUR LIBOR 1M 40BPS | 6/10/2016 | EUR | (78,183 | ) | 176 | |||||||||||
| Citigroup | Computer Sciences Corp. | Receive | USD LIBOR 1M 35BPS | 4/19/2016 | USD | (351,522 | ) | (16,835 | ) | ||||||||||
| Dresser Rand | Receive | USD LIBOR 1M 35BPS | 4/19/2016 | USD | (525,677 | ) | 19,653 | ||||||||||||
| OM Group, Inc. | Receive | USD LIBOR 1M 35BPS | 4/19/2016 | USD | (232,148 | ) | (3,719 | ) | |||||||||||
| Optimal Payments PLC | Receive | GBP LIBOR 1M 40BPS | 4/11/2016 | GBP | (300,269 | ) | (85,300 | ) | |||||||||||
| SunEdison, Inc. | Receive | USD LIBOR 1M 35BPS | 4/19/2016 | USD | (431,248 | ) | (2,734 | ) | |||||||||||
| Oddo & Cie | Norbert Dentressangle | Receive | EUR LIBOR 1M 40BPS | 6/10/2016 | EUR | (325,688 | ) | 635 | |||||||||||
| $ | (94,536 | ) | |||||||||||||||||
| (1) | Receive represents that the Fund receives payments for any positive return on the underlying reference. The Fund makes payments for any negative return on such underlying reference. Pay represents that the Fund receives payments for any negative return on the underlying reference. The Fund makes payments for any positive return on such underlying reference. |
The following is a summary of the inputs used to value the Fund’s investments and other financial instruments and liabilities as of June 30, 2015.
The inputs or methodology used for valuing securities are not necessarily an indication of the risks associated with investing in those securities. For more information on valuation inputs, and their aggregation into the levels used in the table below, please refer to the Security Valuation section in Note 2 of the accompanying Notes to Financial Statements.
| Level 1 | Level 2 | Level 3 | Total |
| Assets | ||||||||||||||||
| Investments At Value | ||||||||||||||||
| Common Stock | ||||||||||||||||
| Communications | $ | 761,429 | $ | - | $ | - | $ | 761,429 | ||||||||
| Consumer, Cyclical | 2,939,119 | - | - | 2,939,119 | ||||||||||||
| Consumer, Non-cyclical | 3,256,377 | - | - | 3,256,377 | ||||||||||||
| Financials | 1,990,775 | - | - | 1,990,775 | ||||||||||||
| Materials | 543,465 | - | - | 543,465 | ||||||||||||
| Technology | 449,175 | - | - | 449,175 | ||||||||||||
| Purchased Options | 56,138 | - | - | 56,138 | ||||||||||||
| Total Investments At Value | $ | 9,996,478 | $ | - | $ | - | $ | 9,996,478 | ||||||||
| Other Financial Instruments** | ||||||||||||||||
| Over the Counter Total Return Swaps | - | 41,250 | - | 41,250 | ||||||||||||
| Total Assets | $ | 9,996,478 | $ | 41,250 | $ | - | $ | 10,037,728 |
| See Notes to Financial Statements. | 4 |
CASTLERIGG EQUITY EVENT AND ARBITRAGE FUND NOTES TO SCHEDULES OF INVESTMENTS, SECURITIES SOLD SHORT AND PUT OPTIONS WRITTEN JUNE 30, 2015 |
| Level 1 | Level 2 | Level 3 | Total |
| Liabilities |
| Securities Sold Short | ||||||||||||||||
| Common Stock | $ | (774,564 | ) | $ | - | $ | - | $ | (774,564 | ) | ||||||
| Total Securities Sold Short | $ | (774,564 | ) | $ | - | $ | - | $ | (774,564 | ) | ||||||
| Other Financial Instruments** | ||||||||||||||||
| Written Options | (24,013 | ) | - | - | (24,013 | ) | ||||||||||
| Over the Counter Total Return Swaps | - | (135,786 | ) | - | (135,786 | ) | ||||||||||
| Total Other Financial Instruments** | $ | (24,013 | ) | $ | (135,786 | ) | $ | - | $ | (159,799 | ) | |||||
| Total Liabilities | $ | (798,577 | ) | $ | (135,786 | ) | $ | - | $ | (934,363 | ) | |||||
| ** | Other Financial Instruments are derivative instruments not reflected in the Schedule of Investments and Schedule of Securities Sold Short, such as total return swaps, which are valued at the unrealized appreciation (depreciation) of the instrument. Written options are reported at their market value at period end. |
The Fund utilizes the end of period methodology when determining transfers. There were no transfers among Level 1, Level 2 and Level 3 for the period ended June 30, 2015.
| Portfolio Holdings | (% of Total Net Assets) | ||
| Sector Breakdown | Long | Short | |
| Basic Materials | 4.9% | - | % |
| Communications | 6.8% | - | % |
| Consumer, Cyclical | 26.4% | (2.5) | % |
| Consumer, Non-cyclical | 29.3% | - | % |
| Financials | 13.2% | (3.7) | % |
| Government | 4.7% | - | % |
| Technology | 4.0% | (0.8) | % |
| Purchased Options | 0.5% | - | % |
| Written Options | - | (0.2) | % |
| Other Assets & Liabilities, Net | 17.4% | - | % |
| Total | 107.2% | (7.2) | % |
| See Notes to Financial Statements. | 5 |
CASTLERIGG EQUITY EVENT AND ARBITRAGE FUND STATEMENT OF ASSETS AND LIABILITIES JUNE 30, 2015 |
| ASSETS | ||||||
| Total investments, at value (Cost $10,645,990) | $ | 9,996,478 | ||||
| Over the counter total return swaps | 41,250 | |||||
| Cash | 2,458,304 | |||||
| Receivables: | ||||||
| Investment securities sold | 35,471 | |||||
| Dividends | 8,651 | |||||
| Adviser | From investment adviser | 4,342 | ||||
| Prepaid expenses | 9,092 | |||||
| Deferred offering costs | 95,230 | |||||
| Total Assets | 12,648,818 | |||||
| LIABILITIES | ||||||
| Securities sold short, at value (Proceeds $770,659) | 774,564 | |||||
| Put options written, at value (Premiums received $27,257) | 24,013 | |||||
| Over the counter total return swaps | 135,786 | |||||
| Payables: | ||||||
| Investment securities purchased | 277,707 | |||||
| Dividends on securities sold short | 1,490 | |||||
| Due to broker | 280,245 | |||||
| Accrued Liabilities: | ||||||
| Fund services fees | 8,500 | |||||
| Other expenses | 16,273 | |||||
| Total Liabilities | 1,518,578 | |||||
| NET ASSETS | $ | 11,130,240 | ||||
| COMPONENTS OF NET ASSETS | ||||||
| Paid-in capital | $ | 11,773,382 | ||||
| Accumulated net investment loss | (28,356 | ) | ||||
| Accumulated net realized gain | 130,774 | |||||
| Net unrealized depreciation | (745,560 | ) | ||||
| NET ASSETS | $ | 11,130,240 | ||||
| SHARES OF BENEFICIAL INTEREST AT NO PAR VALUE (UNLIMITED SHARES AUTHORIZED) | ||||||
| Institutional Shares | 1,178,321 | |||||
NET ASSET VALUE, OFFERING AND REDEMPTION PRICE PER SHARE* | ||||||
| Institutional Shares | $ | 9.45 | ||||
| * | Shares redeemed or exchanged within 90 days of purchase are charged a 2.00% redemption fee. | |||||
| See Notes to Financial Statements. | 6 |
CASTLERIGG EQUITY EVENT AND ARBITRAGE FUND STATEMENT OF OPERATIONS PERIOD ENDED JUNE 30, 2015* |
| INVESTMENT INCOME | |||||||
| Dividend income (Net of foreign withholding taxes of $145) | $ | 57,246 | |||||
| Total Investment Income | 57,246 | ||||||
| Adviser | |||||||
| EXPENSES | |||||||
| Investment adviser fees | 56,826 | ||||||
| Fund services fees | 56,779 | ||||||
| Custodian fees | 17,876 | ||||||
| Registration fees | 1,168 | ||||||
| Professional fees | 28,476 | ||||||
| Trustees' fees and expenses | 2,967 | ||||||
| Offering costs | 31,076 | ||||||
| Dividend and interest expense on securities sold short | 21,832 | # | |||||
| Interest expense | 500 | 1 | |||||
| Miscellaneous expenses | 12,569 | ||||||
| Total Expenses | 230,069 | ||||||
| Fees waived and expenses reimbursed | (144,467 | ) | |||||
| Net Expenses | 85,602 | ||||||
| NET INVESTMENT LOSS | (28,356 | ) | |||||
| NET REALIZED AND UNREALIZED GAIN (LOSS) | |||||||
| Net realized gain (loss) on: | |||||||
| Investments | 148,927 | ||||||
| Foreign currency transactions | 12,891 | ||||||
| Securities sold short | (28,873 | ) | |||||
| Written options | (7,771 | ) | |||||
| Over the counter total return swaps | 5,600 | ||||||
| Net realized gain | 130,774 | ||||||
| Net change in unrealized appreciation (depreciation) on: | |||||||
| Investments | (649,512 | ) | |||||
| Foreign currency translations | (851 | ) | |||||
| Securities sold short | (3,905 | ) | |||||
| Written options | 3,244 | ||||||
| Over the counter total return swaps | (94,536 | ) | |||||
| Net change in unrealized appreciation (depreciation) | (745,560 | ) | |||||
| NET REALIZED AND UNREALIZED LOSS | (614,786 | ) | |||||
| DECREASE IN NET ASSETS RESULTING FROM OPERATIONS | $ | (643,142 | ) | ||||
| * | Commencement of operations was February 2, 2015. | ||||||
| See Notes to Financial Statements. | 7 |
CASTLERIGG EQUITY EVENT AND ARBITRAGE FUND STATEMENT OF CHANGES IN NET ASSETS |
| # | # | ||||||
February 2, 2015* through June 30, 2015 | |||||||
| OPERATIONS | |||||||
| Net investment loss | $ | (28,356 | ) | ||||
| Net realized gain | 130,774 | ||||||
| Net change in unrealized appreciation (depreciation) | (745,560 | ) | |||||
| Decrease in Net Assets Resulting from Operations | (643,142 | ) | |||||
| CAPITAL SHARE TRANSACTIONS | |||||||
| Sale of shares: | |||||||
| Institutional Shares | 11,773,382 | ||||||
| Increase in Net Assets | 11,130,240 | ||||||
| NET ASSETS | |||||||
| Beginning of Period | - | ||||||
| End of Period (Including line (a)) | $ | 11,130,240 | |||||
| SHARE TRANSACTIONS | |||||||
| Sale of shares: | |||||||
| Institutional Shares | 1,178,321 | ||||||
| (a) | Accumulated net investment loss | $ | (28,356 | ) | |||
| * | Commencement of operations. | ||||||
| See Notes to Financial Statements. | 8 |
CASTLERIGG EQUITY EVENT AND ARBITRAGE FUND FINANCIAL HIGHLIGHTS |
| These financial highlights reflect selected data for a share outstanding throughout the period. | |||||
February 2, 2015 (a) through June 30, 2015 | |||||
| INSTITUTIONAL SHARES | |||||
| NET ASSET VALUE, Beginning of Period | $ | 10.00 | |||
| INVESTMENT OPERATIONS | |||||
| Net investment loss (b) | (0.02 | ) | |||
| Net realized and unrealized loss | (0.53 | ) | |||
| Total from Investment Operations | (0.55 | ) | |||
| NET ASSET VALUE, End of Period | $ | 9.45 | |||
| TOTAL RETURN | (5.50 | )%(c) | |||
| RATIOS/SUPPLEMENTARY DATA | |||||
| Net Assets at End of Period (000's omitted) | $11,130 | ||||
| Ratios to Average Net Assets: | |||||
| Net investment loss | (0.62 | )%(d) | |||
| Net expenses including dividend expenses | 1.88 | %(d) | |||
| Dividend expenses | 0.49 | %(d) | |||
| Net expenses without dividend expenses | 1.39 | %(d) | |||
| Gross expenses (e) | 5.06 | %(d) | |||
| PORTFOLIO TURNOVER RATE | 136 | %(c) | |||
| (a) | Commencement of operations. | ||||
| (b) | Calculated based on average shares outstanding during the period. | ||||
| (c) | Not annualized. | ||||
| (d) | Annualized. | ||||
| (e) | Reflects the expense ratio excluding any waivers and/or reimbursements. | ||||
| See Notes to Financial Statements. | 9 |
CASTLERIGG EQUITY EVENT AND ARBITRAGE FUND NOTES TO FINANCIAL STATEMENTS JUNE 30, 2015 |
Note 1. Organization
The Castlerigg Equity Event and Arbitrage Fund (the “Fund”) is a diversified portfolio of ALTMFX Trust (the “Trust”). The Trust is a Delaware statutory trust that is registered as an open-end, management investment company under the Investment Company Act of 1940 (the “Act”), as amended. Under its Trust Instrument, the Trust is authorized to issue an unlimited number of the Fund’s shares of beneficial interest without par value. The Fund currently offers two classes of shares: Institutional Shares and Investor Shares. The Institutional Shares commenced operations on February 2, 2015. As of June 30, 2015, the Investor Shares have not commenced operations. The Fund seeks capital growth over full market cycles, largely independent of market movement.
Note 2. Summary of Significant Accounting Policies
These financial statements are prepared in accordance with accounting principles generally accepted in the United States of America (“GAAP”), which require management to make estimates and assumptions that affect the reported amounts of assets and liabilities, the disclosure of contingent liabilities at the date of the financial statements, and the reported amounts of increases and decreases in net assets from operations during the fiscal period. Actual amounts could differ from those estimates. The following summarizes the significant accounting policies of the Fund:
Security Valuation – Exchange-traded securities and over-the-counter securities are valued using the last quoted trade or official closing price, provided by independent pricing services as of the close of trading on the market or exchange for which they are primarily traded, on each Fund business day. In the absence of a sale, such securities are valued at the mean of the last bid and ask price provided by independent pricing services. Non-exchange-traded securities for which quotations are available are valued using the last quoted sales price, or in the absence of a sale, at the mean of the last bid and ask prices provided by independent pricing services. Short-term investments that mature in 60 days or less may be valued at amortized cost. Exchange-traded options for which the last quoted sale price is outside the closing bid and ask price, will be valued at the mean of the closing bid and ask price.
The Fund values its investments at fair value pursuant to procedures adopted by the Trust's Board of Trustees (the "Board") if (1) market quotations are insufficient or not readily available or (2) the adviser believes that the values available are unreliable. The Trust’s Valuation Committee, as defined in the Fund’s registration statement, performs certain functions as they relate to the administration and oversight of the Fund’s valuation procedures. Under these procedures, the Valuation Committee convenes on a regular and ad-hoc basis to review such investments and considers a number of factors, including valuation methodologies and significant unobservable inputs, when arriving at fair value.
The Valuation Committee may work with the adviser to provide valuation inputs. In determining fair valuations, inputs may include market-based analytics which may consider related or comparable assets or liabilities, recent transactions, market multiples, book values and other relevant investment information. Adviser inputs may include an income-based approach in which the anticipated future cash flows of the investment are discounted in determining fair value. Discounts may also be applied based on the nature or duration of any restrictions on the disposition of the investments. The Valuation Committee performs regular reviews of valuation methodologies, key inputs and assumptions, disposition analysis and market activity.
Fair valuation is based on subjective factors and, as a result, the fair value price of an investment may differ from the security’s market price and may not be the price at which the asset may be sold. Fair valuation could result in a different Net Asset Value ("NAV") than a NAV determined by using market quotes.
The Fund has a three-tier fair value hierarchy. The basis of the tiers is dependent upon the various “inputs” used to determine the value of the Fund’s investments. These inputs are summarized in the three broad levels listed below:
Level 1 — quoted prices in active markets for identical assets and liabilities
Level 2 — other significant observable inputs (including quoted prices of similar securities, interest rates, prepayment speeds, credit risk, etc.)
Level 3 — significant unobservable inputs (including the Fund’s own assumptions in determining the fair value of investments)
The aggregate value by input level, as of June 30, 2015, for the Fund’s investments is included in the Fund’s Notes to Schedules of Investments, Securities Sold Short and Put Options Written.
Security Transactions, Investment Income and Realized Gain and Loss – Investment transactions are accounted for on the trade date. Dividend income and expense are recorded on the ex-dividend date. Foreign dividend income is recorded on the ex-dividend
| 10 |
CASTLERIGG EQUITY EVENT AND ARBITRAGE FUND NOTES TO FINANCIAL STATEMENTS JUNE 30, 2015 |
date or as soon as possible after the Fund determines the existence of a dividend declaration after exercising reasonable due diligence. Income and capital gains on some foreign securities may be subject to foreign withholding taxes, which are accrued as applicable. Interest income is recorded on an accrual basis. Premium is amortized and discount is accreted using the effective interest method. Identified cost of investments sold is used to determine the gain and loss for both financial statement and federal income tax purposes.
Securities Sold Short – The Fund may sell a security short to increase investment returns. The Fund may also sell a security short in anticipation of a decline in the market value of a security. A short sale is a transaction in which a fund sells a security that it does not own. To complete the transaction, the fund must borrow the security in order to deliver it to the buyer. The fund must replace the borrowed security by purchasing it at market price at the time of replacement; the price may be higher or lower than the price at which the fund sold the security. The fund incurs a loss from a short sale if the price of the security increases between the date of the short sale and the date on which the fund replaces the borrowed security. The fund realizes a profit if the price of the security declines between those dates.
Until the fund replaces the borrowed security, the fund will maintain on its books and records cash and long securities to sufficiently cover its short position on a daily basis. The collateral for the securities sold short includes the Deposits with Brokers as shown on the Statements of Assets and Liabilities and the securities held long as shown on the Schedules of Investments. Dividends and interest paid on securities sold short are recorded as an expense on the Fund’s Statement of Operations.
Total Return Swaps – The Fund may invest in total return swaps. Total return swaps are contracts in which one party agrees to make periodic payments to another party based on the change in market value of the assets underlying the contract, which may include a specified security, basket of securities or securities indices during the specified period, in return for periodic payments based on a fixed or variable interest rate or the total return from other underlying assets. Total return swap agreements may be used to obtain exposure to a security or market without owning or taking physical custody of such security or investing directly in such market. Total return swap agreements may effectively add leverage to the Fund’s portfolio because, in addition to its total net assets, the Fund would be subject to investment exposure on the notional amount of the swap.
Total return swaps are subject to the risk that a counterparty will default on its payment obligations to the Fund thereunder. Swap agreements also bear the risk that the Fund will not be able to meet its obligation to the counterparty. Generally, the Fund will enter into total return swaps on a net basis (i.e., the two payment streams are netted against one another with the Fund receiving or paying, as the case may be, only the net amount of the two payments). The net amount of the excess, if any, of the Fund’s obligations over its entitlements with respect to each total return swap will be accrued on a daily basis, and an amount of liquid assets having an aggregate net asset value at least equal to the accrued excess will be segregated by the Fund. If the total return swap transaction is entered into on other than a net basis, the full amount of the Fund’s obligations will be accrued on a daily basis, and the full amount of the Fund’s obligations will be segregated by the Fund in an amount equal to or greater than the market value of the liabilities under the total return swap agreement or the amount it would have cost the Fund initially to make an equivalent direct investment, plus or minus any amount the Fund is obligated to pay or is to receive under the total return swap agreement.
Notional amounts of each individual total return swap agreement outstanding as of June 30, 2015, for the Fund, are disclosed in the Notes to Schedules of Investments, Securities Sold Short and Put Options Written.
Purchased Options – When a fund purchases an option, an amount equal to the premium paid by the fund is recorded as an investment and is subsequently adjusted to the current value of the option purchased. If an option expires on the stipulated expiration date or if the fund enters into a closing sale transaction, a gain or loss is realized. If a call option is exercised, the cost of the security acquired is increased by the premium paid for the call. If a put option is exercised, a gain or loss is realized from the sale of the underlying security, and the proceeds from such sale are decreased by the premium originally paid. Purchased options are non-income producing securities.
The values of each individual purchased option outstanding as of June 30, 2015, are disclosed in the Fund’s Schedule of Investments.
Written Options – When a fund writes an option, an amount equal to the premium received by the fund is recorded as a liability and is subsequently adjusted to the current value of the option written. Premiums received from writing options that expire unexercised are treated by the fund on the expiration date as realized gain from written options. The difference between the premium and the amount paid on effecting a closing purchase transaction, including brokerage commissions, is also treated as a realized gain, or if the premium is less than the amount paid for the closing purchase transaction, as a realized loss. If a call option is exercised, the premium is added to the proceeds from the sale of the underlying security in determining whether the fund has
| 11 |
CASTLERIGG EQUITY EVENT AND ARBITRAGE FUND NOTES TO FINANCIAL STATEMENTS JUNE 30, 2015 |
realized a gain or loss. If a put option is exercised, the premium reduces the cost basis of the securities purchased by the fund. The fund, as writer of an option, bears the market risk of an unfavorable change in the price of the security underlying the written option. Written options are non-income producing securities.
The values of each individual written option outstanding as of June 30, 2015, are disclosed in the Fund’s Schedule of Put Options Written.
Transactions in written options during the period ended June 30, 2015, were as follows:
| Calls | Puts | |||||||||
| Number of Contracts | Premiums | Number of Contracts | Premiums | |||||||
| Options Outstanding, February 2, 2015 | - | $ | - | - | $ | - | ||||
| Options written | (35) | (1,722) | (59) | (27,257) | ||||||
| Options terminated in closing transactions | 9 | 517 | - | - | ||||||
| Options exercised | 14 | 826 | - | - | ||||||
| Options expired | 12 | 379 | - | - | ||||||
| Options Outstanding, June 30, 2015 | - | $ | - | (59) | $ | (27,257) | ||||
Distributions to Shareholders – Distributions to shareholders of net investment income, if any, are declared and paid at least annually. Distributions to shareholders of net capital gains, if any, are declared and paid annually. Distributions to shareholders are recorded on the ex-dividend date. Distributions are based on amounts calculated in accordance with applicable federal income tax regulations, which may differ from GAAP. These differences are due primarily to differing treatments of income and gain on various investment securities held by the Fund, timing differences and differing characterizations of distributions made by the Fund.
Federal Taxes – The Fund intends to continue to qualify each year as a regulated investment company under Subchapter M of the Internal Revenue Code and to distribute all of its taxable income to shareholders. In addition, by distributing in each calendar year substantially all of its net investment income and capital gains, if any, the Fund will not be subject to a federal excise tax. Therefore, no federal income or excise tax provision is required. The Fund will file a U.S. federal income and excise tax return as required. A fund’s federal income tax returns are subject to examination by the Internal Revenue Service for a period of three fiscal years after they are filed. As of June 30, 2015, there are no uncertain tax positions that would require financial statement recognition, de-recognition or disclosure.
Income and Expense Allocation – The Trust accounts separately for the assets, liabilities and operations of each of its investment portfolios. Expenses that are directly attributable to more than one investment portfolio are allocated among the respective investment portfolios in an equitable manner.
Redemption Fees – A shareholder who redeems or exchanges shares within 90 days of purchase will incur a redemption fee of 2.00% of the current net asset value of shares redeemed or exchanged, subject to certain limitations. The fee is charged for the benefit of the remaining shareholders and will be paid to the Fund to help offset transaction costs. The fee is accounted for as an addition to paid-in capital. The Fund reserves the right to modify the terms of or terminate the fee at any time. There are limited exceptions to the imposition of the redemption fee.
Offering Costs – Offering costs for the Fund of $117,062 consisted of fees related to the mailing and printing of the initial prospectus, certain startup legal costs, and initial registration filings. Such costs are amortized over a twelve-month period beginning with the commencement of operations of the Fund.
Commitments and Contingencies – In the normal course of business, the Fund enters into contracts that provide general indemnifications by the Fund to the counterparty to the contract. The Fund’s maximum exposure under these arrangements is dependent on future claims that may be made against the Fund and, therefore, cannot be estimated; however, the risk of loss from such claims is considered remote.
Note 3. Fees and Expenses
Investment Adviser – Sandell Asset Management Corp. (the “Adviser”) is the investment adviser to the Fund. Pursuant to an investment advisory agreement, the Adviser receives an advisory fee from the Fund at an annual rate of 1.25% of the Fund’s average daily net assets.
| 12 |
CASTLERIGG EQUITY EVENT AND ARBITRAGE FUND NOTES TO FINANCIAL STATEMENTS JUNE 30, 2015 |
Distribution – Foreside Fund Services, LLC serves as the Fund’s distributor (the “Distributor”). The Distributor is not affiliated with the Adviser or Atlantic Fund Administration, LLC (d/b/a Atlantic Fund Services) (“Atlantic”) or their affiliates. The Fund has adopted a Distribution Plan (the “Plan”) for Investor Class shares in accordance with Rule 12b-1 of the Act. Under the Plan, the Fund pays the Distributor and/or any other entity as authorized by the Board a fee of up to 0.25% of the average daily net assets of Investor Class.
Other Service Providers – Atlantic provides fund accounting, fund administration, compliance and transfer agency services to the Fund. Atlantic also provides certain shareholder report production, and EDGAR conversion and filing services. Pursuant to an Atlantic services agreement, the Fund pays Atlantic customary fees for its services. Atlantic provides a Principal Executive Officer, a Principal Financial Officer, a Chief Compliance Officer, and an Anti-Money Laundering Officer to the Fund, as well as certain additional compliance support functions.
Trustees and Officers – The Trust pays each independent Trustee an annual retainer fee of $5,000 for service to the Trust. The Trustees may receive additional fees for special Board meetings. Each Trustee is also reimbursed for all reasonable out-of-pocket expenses incurred in connection with their duties as a Trustee, including travel and related expenses incurred in attending Board meetings. Certain officers of the Trust are also officers or employees of the above named service providers, and during their terms of office received no compensation from the Fund.
Note 4. Expenses Reimbursed and Fees Waived
The Adviser has contractually agreed to waive its fee and/or reimburse certain expenses to limit total operating expenses (excluding all taxes, interest, portfolio transaction expenses, dividend and interest expense on short sales, acquired fund fees and expenses, proxy expenses and extraordinary expanses) to 1.60% for Institutional Shares through April 29, 2016. Other fund service providers have voluntarily agreed to waive and reimburse a portion of their fees. These voluntary fee waivers and reimbursements may be reduced or eliminated at any time. For the period ended June 30, 2015, fees waived and expenses reimbursed were as follows:
| Investment Adviser Fees Waived | Investment Adviser Expenses Reimbursed | Other Waivers | Total Fees Waived and Expenses Reimbursed | |||||||
| $ | 56,826 | $ | 73,266 | $ | 14,375 | $ | 144,467 | |||
The Fund may repay the Adviser for fees waived and expenses reimbursed pursuant to the expense cap if such payment is made within three years of the fee waiver or expense reimbursement, and does not cause the net annual fund operating expenses of the Fund to exceed the expense cap in place at the time the fees were waived. As of June 30, 2015, the following amounts are subject to recapture by the Adviser:
| Period Ended | Amount of Fees Waived and/or Expenses Reimbursed | Expiration Date to Recoup Fees Waived and/or Expenses Reimbursed | Fees Recouped | |||||
| June 30, 2015 | $ | 130,092 | December 31, 2018 | $ | - | |||
Note 5. Security Transactions
The cost of purchases and proceeds from sales of investment securities (including maturities), other than short-term investments during the period ended June 30, 2015, were $22,916,754 and $11,514,811, respectively.
Note 6. Summary of Derivative Activity
The volume of open derivative positions may vary on a daily basis as the Fund transacts derivative contracts in order to achieve the exposure desired by the Adviser. The notional value of activity for the period ended June 30, 2015 for any derivative type that was held during the period is as follows:
| Written Options | $ | (28,979 | ) | |
| Purchased Options | $ | 57,112 | ||
| Total Return Swaps | $ | (2,329,305 | ) |
| 13 |
CASTLERIGG EQUITY EVENT AND ARBITRAGE FUND NOTES TO FINANCIAL STATEMENTS JUNE 30, 2015 |
The Fund’s use of derivatives during the period ended June 30, 2015, was limited to options and total return swaps.
Following is a summary of the effect of derivatives on the Statement of Assets and Liabilities as of June 30, 2015:
| Location: | Interest Rate Contracts | Equity Contracts | |||||||
| Asset derivatives: | |||||||||
| Total investments, at value | $ | - | $ | 56,138 | |||||
| Over the counter total return swaps | 41,250 | - | |||||||
| Total asset derivatives | $ | 41,250 | $ | 56,138 | |||||
| Liability derivatives: | |||||||||
| Over the counter total return swaps | $ | (135,786 | ) | $ | - | ||||
| Put options written, at value | - | (24,013 | ) | ||||||
| Total liability derivatives | $ | (135,786 | ) | $ | (24,013 | ) | |||
Realized and unrealized gains and losses on derivatives contracts during the period ended June 30, 2015, by the Fund are recorded in the following locations on the Statement of Operations:
| Location: | Interest Rate Contracts | Equity Contracts | |||||||
| Net realized gain (loss) on: | |||||||||
| Over the counter total return swaps | $ | 5,600 | $ | - | |||||
| Written Options | - | (7,771 | ) | ||||||
| Total net realized gain (loss) | $ | 5,600 | $ | (7,771 | ) | ||||
| Net change in unrealized appreciation (depreciation) on: | |||||||||
| Over the counter total return swaps | $ | (94,536 | ) | $ | - | ||||
| Investments | - | (974 | ) | ||||||
| Written Options | - | 3,244 | |||||||
| Total net change in unrealized appreciation (depreciation) | $ | (94,536 | ) | $ | 2,270 | ||||
Asset (Liability) amounts shown in the table below represent amounts for derivative related investments at June 30, 2015. These amounts may be collateralized by cash or financial instruments.
| Gross Asset (Liability) as Presented in the Statement of Assets and Liabilities | Financial Instruments (Received) Pledged** | Cash Collateral (Received) Pledged** | Net Amount | |||||||||||||
| Assets: | ||||||||||||||||
| Over-the-counter derivatives* | $ | 97,388 | $ | - | $ | - | $ | 97,388 | ||||||||
| Liabilities: | ||||||||||||||||
| Over-the-counter derivatives* | $ | (159,799 | ) | $ | 24,013 | $ | 135,786 | $ | - | |||||||
| * | Over-the-counter derivatives may consist of options contracts and total return swap agreements. The amounts disclosed above represent the exposure to one or more counterparties. For further detail on individual derivative contracts and the corresponding unrealized appreciation (depreciation), see the Notes to Schedules of Investments, Securities Sold Short and Put Options Written. |
| ** | The actual financial instruments and cash collateral (received) pledged may be in excess of the amounts shown in the table. The table only reflects collateral amounts up to the amount of the financial instrument disclosed on the Statement of Assets and Liabilities. |
Note 7. Federal Income Tax
As of June 30, 2015, distributable earnings (accumulated loss) on a tax basis were as follows:
| Undistributed Ordinary Income | $ | 102,131 | ||
| Unrealized Depreciation | (745,273) | |||
| Total | $ | (643,142) |
| 14 |
CASTLERIGG EQUITY EVENT AND ARBITRAGE FUND NOTES TO FINANCIAL STATEMENTS JUNE 30, 2015 |
The difference between components of distributable earnings on a tax basis and the amounts reflected in the Statement of Assets and Liabilities are primarily due to swaps, wash sales and currency gain/loss.
Note 8. Recent Accounting Pronouncements
In May 2015, the Financial Accounting Standards Board (“FASB”) issued Accounting Standards Update 2015-07 (“ASU 2015-07”) eliminating the requirement for investments measured at net asset value to be categorized within the fair value hierarchy under GAAP and requiring the disclosure of sufficient information to reconcile the fair value of the remaining assets categorized within the fair value hierarchy to the financial statements. ASU 2015-07 is effective for interim and annual reporting periods beginning after December 15, 2015. Management has reviewed the requirements and believes the adoption of ASU 2015-07 will not have a material impact on the financial statements.
Note 9. Subsequent Events
Subsequent events occurring after the date of this report through the date these financial statements were issued have been evaluated for potential impact and the Fund has had no such events.
| 15 |
CASTLERIGG EQUITY EVENT AND ARBITRAGE FUND ADDITIONAL INFORMATION JUNE 30, 2015 |
Investment Advisory Agreement Approval
At the October 22, 2014 Board meeting, the Board, including the Independent Trustees, considered the approval of the initial investment advisory agreement between the Adviser and the Trust pertaining to the Fund (the “Advisory Agreement”). In preparation for its deliberations, the Board requested and reviewed written responses from the Adviser to a due diligence questionnaire circulated on the Board's behalf. The Board also discussed the materials with Independent Trustee counsel and, as necessary, with the Trust's administrator, Atlantic Fund Services. During its deliberations, the Board received an oral presentation from the Adviser, and was assisted by the advice of Independent Trustee counsel.
In evaluating the Advisory Agreement for the Fund, the Board reviewed written materials furnished by the Adviser and the administrator, including information regarding the Adviser's personnel, operations, profitability estimates and financial condition.
At the meeting, the Board reviewed, among other matters: (1) the nature, extent and quality of the services to be provided to the Fund by the Adviser, including information on the investment performance of other accounts managed by the Adviser with similar investment policies to those of the Fund; (2) the costs of the services to be provided and anticipated profitability to the Adviser with respect to its relationship with the Fund; (3) the advisory fee and projected total expense ratio of the Fund compared to a relevant peer group of funds and an unregistered fund managed by the Adviser with similar investment policies as the Fund; (4) the extent to which economies of scale may be realized as the Fund grows and whether the advisory fee enables the Fund's investors to share in the benefits of economies of scale; and (5) any other benefits projected to be received by the Adviser from its relationship with the Fund.
Nature, Extent and Quality of Services
Based on written materials received, the presentation from representatives of the Adviser, a discussion with the Adviser about the Adviser’s personnel, operations and financial condition, and a discussion with the Trust’s CCO about the Adviser’s compliance program, the Board considered the overall quality of services to be provided by the Adviser under the Advisory Agreement. In this regard, the Board considered information regarding the experience, qualifications and professional background of the portfolio manager and other personnel at the Adviser with principal responsibility for the Fund, noting in particular the personnel’s experience with event-driven strategies across merger arbitrage and equity event situations, as well as the investment philosophy and decision-making process of those professionals and the capability and integrity of the Adviser’s senior management and staff.
The Board also considered the managerial and financial resources available to the Adviser. The Board noted the Adviser’s representation that the firm is sufficiently well-capitalized. Based on the presentation and the materials provided by the Adviser in connection with the Board’s consideration of the Advisory Agreement, the Board concluded that, overall, it was satisfied with the nature, extent and quality of services to be provided to the Fund under the Advisory Agreement.
Performance
Recognizing that the Fund is new and has no performance history, the Board did not consider the performance history of the Fund. Instead, the Board considered the performance history of the Adviser's similarly managed MLIS Castlerigg Equity and Event Arbitrage UCITS Fund (the “UCITS Fund"), two peer funds with a similar strategy, and the performance of the CS Event Driven Risk Arbitrage Hedge Fund Index (“CS Index”). The Board noted that the UCITS Fund outperformed both peer funds and the CS Index in each of the last two annual periods ended December 31, 2013 and December 31, 2012 and for the period January 1, 2014 through June 30, 2014. The Board noted that the UCITS Fund underperformed both peer funds and the CS Index for the annual periods ended December 31, 2011 and December 31, 2010. Based on the foregoing, the Board concluded that the Adviser’s investment management services could benefit the Fund and its shareholders.
Compensation
The Board considered the Adviser’s proposed compensation for providing advisory services to the Fund and analyzed comparative information on advisory fee rates (after fee waivers) and total expenses of the Fund’s relevant Lipper peers. The Board noted that the Adviser’s proposed actual advisory fee rate (including the proposed fee waiver) for the Fund is the lowest advisory fee rate in its Lipper peer group, and that the estimated total expenses for the Fund are slightly higher than the median of its Lipper peers. In addition, the Board noted the Adviser’s representation that the Fund will receive a discount from the Adviser’s standard fee schedule in order to keep the total expense ratio at a level that the Adviser believes is advantageous to asset growth. The Board noted that the Adviser has contractually agreed to limit the Fund’s total annual Fund operating expenses (excluding all taxes, interest, portfolio transaction expenses, dividend and interest expense on short sales, acquired fund fees and expenses, proxy
| 16 |
CASTLERIGG EQUITY EVENT AND ARBITRAGE FUND ADDITIONAL INFORMATION JUNE 30, 2015 |
expenses and extraordinary expenses) for Investor Shares to 1.85% and those for Institutional Shares to 1.60%, through April 29, 2016. Based on the foregoing, the Board concluded that the Adviser’s advisory fee rate to be charged to the Fund was reasonable.
Cost of Services and Profitability
The Board considered that profits to be realized by the Adviser would be a function of the future growth in assets of the Fund and concluded that the costs of the services to be provided and profits to be realized by the Adviser were not a material factor at this time in approving the Advisory Agreement.
Economies of Scale
The Board evaluated whether the Fund would benefit from any economies of scale. In this respect, the Board noted the Adviser’s representation that the Fund potentially could benefit from economies of scale as assets grow, but the Adviser was not proposing breakpoints at this time because the Fund had not yet commenced operations and assets under management would need to achieve economies of scale before the Adviser would consider breakpoints. Based on the foregoing information, the Board concluded that economies of scale were not a material factor in approving the Advisory Agreement.
Other Benefits
The Board noted the Adviser’s representation that, aside from its contractual advisory fees, it does not expect to benefit in a material way from its relationship with the Fund. Based on the foregoing representation, the Board concluded that other benefits received by the Adviser from its relationship with the Fund were not a material factor to consider in approving the Advisory Agreement.
Conclusion
The Board did not identify any single factor as being of paramount importance, and different Trustees may have given different weight to different factors. The Board reviewed a memorandum from Trust counsel discussing the legal standards applicable to its consideration of the Advisory Agreement. Based on its review, including consideration of each of the factors referenced above, the Board determined, in the exercise of its reasonable business judgment, that the advisory arrangement, as outlined in the Advisory Agreement, was fair and reasonable in light of the services to be performed, expenses to be incurred and such other matters as the Board considered relevant.
Proxy Voting Information
A description of the policies and procedures that the Fund uses to determine how to vote proxies relating to securities held in the Fund’s portfolio is available, without charge and upon request, by calling (855) 328-9764 and on the U.S. Securities and Exchange Commission’s (the “SEC”) website at www.sec.gov. The Fund’s proxy voting record for the period from the Fund’s commencement of operations to June 30 will be available, without charge and upon request, by calling (855) 328-9764 and no later than August 31 of this year on the SEC’s website at www.sec.gov.
Availability of Quarterly Portfolio Schedules
The Fund files its complete schedule of portfolio holdings with the SEC for the first and third quarters of each fiscal year on Form N-Q. These filings are available, without charge and upon request on the SEC’s website at www.sec.gov or may be reviewed and copied at the SEC’s Public Reference Room in Washington, DC. Information on the operation of the Public Reference Room may be obtained by calling (800) SEC-0330.
Shareholder Expense Example
As a shareholder of the Fund, you incur two types of costs: (1) transaction costs, including redemption fees, and (2) ongoing costs, including management fees, distribution (12b-1) fees and other Fund expenses. This example is intended to help you understand your ongoing costs (in dollars) of investing in the Fund, and to compare these costs with the ongoing costs of investing in other mutual funds.
The example is based on an investment of $1,000 invested at the beginning of the period and held for the entire period from February 2, 2015, through June 30, 2015.
Actual Expenses – The first line of the table below provides information about actual account values and actual expenses. You may
| 17 |
CASTLERIGG EQUITY EVENT AND ARBITRAGE FUND ADDITIONAL INFORMATION JUNE 30, 2015 |
use the information in this line, together with the amount you invested, to estimate the expenses that you paid over the period. Simply divide your account value by $1,000 (for example, an $8,600 account value divided by $1,000 = 8.6), then multiply the result by the number in the first line under the heading entitled “Expenses Paid During Period” to estimate the expenses you paid on your account during the period.
Hypothetical Example for Comparison Purposes – The second line of the table below provides information about hypothetical account values and hypothetical expenses based on the Fund’s actual expense ratio and an assumed rate of return of 5% per year before expenses, which is not the Fund’s actual return. The hypothetical account values and expenses may not be used to estimate the actual ending account balance or expenses you paid for the period. You may use this information to compare the ongoing costs of investing in the Fund and other funds. To do so, compare this 5% hypothetical example with the 5% hypothetical examples that appear in the shareholder reports of other funds.
Please note that the expenses shown in the table are meant to highlight your ongoing costs only and do not reflect any transactional costs, such as redemption fees. Therefore, the second line of the table is useful in comparing ongoing costs only, and will not help you determine the relative total costs of owning different funds. In addition, if these transactional costs were included, your costs would have been higher.
| Beginning | Ending | Expenses | Annualized | ||||||||
| Account Value | Account Value | Paid During | Expense | ||||||||
| February 2, 2015 | June 30, 2015 | Period** | Ratio** | ||||||||
| Institutional Shares | |||||||||||
| Actual | $ | 1,000.00 | $ | 945.00 | $ | 5.48 | 1.39 | % | |||
| Hypothetical (5% return before taxes) | $ | 1,000.00 | $ | 1,017.90 | $ | 6.95 | 1.39 | % | |||
| * | Expenses are equal to the Fund’s annualized expense ratio multiplied by the average account value over the period, multiplied by the number of days in the most recent fiscal half-year divided by 365 to reflect the half-year period (except that the average account values reflect the Fund’s actual return information for the 148-day period between February 2, 2015, the commencement date of Fund operations, through June 30, 2015). |
| 18 |
CASTLERIGG EQUITY EVENT AND ARBITRAGE FUND
FOR MORE INFORMATION:
P.O. Box 588
Portland, ME 04112
(855) 328-9764 (toll free)
INVESTMENT ADVISER
Sandell Asset Management Corp.
540 Madison Avenue, 36th Floor
New York, NY 10022
TRANSFER AGENT
Atlantic Fund Services
P.O. Box 588
Portland, ME 04112
www.atlanticfundservices.com
DISTRIBUTOR
Foreside Fund Services, LLC
Three Canal Plaza, Suite 100
Portland, Maine 04101
www.foreside.com
This report is submitted for the general information of the shareholders of the Fund. It is not authorized for distribution to prospective investors unless preceded or accompanied by an effective prospectus, which includes information regarding the Fund’s risks, objectives, fees and expenses, experience of its management, and other information.
250-SAR-0615

| NP STRATEGIC MUNICIPAL FUND PERFORMANCE CHART AND ANALYSIS JUNE 30, 2015 |
The following chart reflects the change in the value of a hypothetical $25,000 investment, including reinvested dividends and distributions, in NP Strategic Municipal Fund (the “Fund”) compared with the performance of the benchmark, S&P National AMT Free Municipal Bond Index TR, since inception. The S&P National AMT Free Municipal Bond Index TR is a broad, market value-weighted index designed to seek to measure the performance of the tax-exempt, investment-grade U. S. municipal bond market. The total return of the S&P National AMT Free Municipal Bond Index TR include the reinvestment of dividends and income. The total return of the Fund includes operating expenses that reduce returns, while the total return of the S&P National AMT Free Municipal Bond Index TR does not include expenses. The Fund is professionally managed while the S&P National AMT Free Municipal Bond Index TR is unmanaged and is not available for investment.
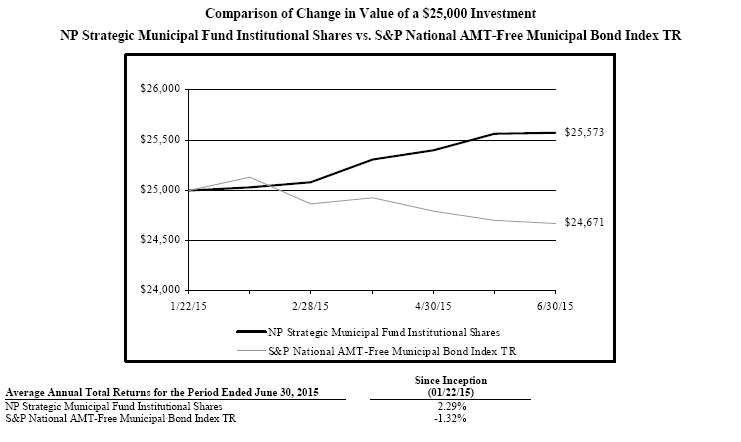
Performance data quoted represents past performance and is no guarantee of future results. Current performance may be lower or higher than the performance data quoted. Investment return and principal value will fluctuate so that shares, when redeemed, may be worth more or less than original cost. For the most recent month-end performance, please call (844) 218-5179. As stated in the Fund’s current prospectus, the annual operating expense ratio (gross) for Institutional Shares is 1.75%. However, the Fund’s adviser has contractually agreed to reduce a portion of its fees and reimburse expenses to limit total operating expenses (excluding all taxes, interest, portfolio transaction expenses, dividend and interest expense on short sales, acquired fund fees and expenses, proxy expenses and extraordinary expenses) to 1.20% and 1.45% for Institutional and Investor Shares, respectively, through April 29, 2016 (the "Expense Cap"). The Fund may repay the Adviser for fees waived and expenses reimbursed pursuant to the Expense Cap if such payment is made within three years of the fee waiver or expense reimbursement and does not cause the Net Annual Fund Operating Expenses to exceed the Expense Cap in place at the time the fees were waived. During the period, certain fees were waived and/or expenses reimbursed; otherwise, returns would have been lower. Shares redeemed within 60 days of purchase will be charged a 1.00% redemption fee. The performance table and graph do not reflect the deduction of taxes that a shareholder would pay on Fund distributions or the redemption of Fund shares.
| 1 |
| NP STRATEGIC MUNICIPAL FUND SCHEDULE OF INVESTMENTS JUNE 30, 2015 |
| Principal | Security Description | Rate | Maturity | Value |
Municipal Bonds - 62.1% | |||||||||||
California - 23.4% | |||||||||||
| $ | 3,000,000 | Chabot-Las Positas Community College District, California General Obligation Bond, Series C (a) | 5.03 | % | 08/01/43 | $ | 747,240 | ||||
Delaware - 6.3% | |||||||||||
| 100,000 | County of New Castle DE, Delaware General Obligation Bond, Series A | 4.00 | 07/15/15 | 100,161 | |||||||
| 100,000 | State of Delaware, Delaware General Obligation Bond, Series A | 3.00 | 07/01/15 | 100,008 | |||||||
| 200,169 | |||||||||||
Kansas - 4.7% | |||||||||||
| 150,000 | City of Wichita KS, Kansas Water & Sewer Utility Revenue Bond, Series A | 5.00 | 10/01/15 | 151,824 | |||||||
Nevada - 3.1% | |||||||||||
| 100,000 | State of Nevada, Nevada General Obligation Bond, Series G | 5.00 | 08/01/15 | 100,419 | |||||||
North Carolina - 3.2% | |||||||||||
| 100,000 | County of Guilford NC, North Carolina General Obligation Bond, Series C | 4.00 | 04/01/16 | 102,810 | |||||||
Texas - 10.2% | ||||||||||
| 165,000 | Texas Private Activity Bond Surface Transportation Corp., Texas Revenue Bond | 7.00 | 06/30/40 | 196,743 | ||||||
| 125,000 | Texas Transportation Commission State Highway Fund, Texas Revenue Bond | 5.00 | 04/01/20 | 129,447 | ||||||
| 326,190 | ||||||||||
Utah - 4.7% | ||||||||||
| 150,000 | State of Utah, Utah General Obligation Bond, Series B | 4.00 | 07/01/15 | 150,017 | ||||||
Virginia - 6.5% | ||||||||||
| 200,000 | County of Henrico VA, Virginia General Obligation Bond | 4.00 | 08/01/16 | 207,924 | ||||||
Total Municipal Bonds (Cost $1,982,899) | 1,986,593 |
Total Investments - 62.1% (Cost $1,982,899)* | $ | 1,986,593 |
| Other Assets & Liabilities, Net – 37.9% | 1,212,067 | ||
| Net Assets – 100.0% | $ | 3,198,660 |
| (a) | Zero coupon bond. Interest rate presented is yield to maturity. |
| * Cost for federal income tax purposes is substantially the same as for financial statement purposes and net unrealized appreciation consists of: |
| Gross Unrealized Appreciation | $ | 4,911 | ||
| Gross Unrealized Depreciation | (1,217 | ) | ||
| Net Unrealized Appreciation | $ | 3,694 |
| See Notes to Financial Statements. | 2 |
| NP STRATEGIC MUNICIPAL FUND SCHEDULE OF INVESTMENTS JUNE 30, 2015 |
The following is a summary of the inputs used to value the Fund’s investments as of June 30, 2015.
The inputs or methodology used for valuing securities are not necessarily an indication of the risks associated with investing in those securities. For more information on valuation inputs, and their aggregation into the levels used in the table below, please refer to the Security Valuation section in Note 2 of the accompanying Notes to Financial Statements.
| Valuation Inputs | Investments in Securities |
| Level 1 - Quoted Prices | $ | - | ||
| Level 2 - Other Significant Observable Inputs | 1,986,593 | |||
| Level 3 - Significant Unobservable Inputs | - | |||
| Total | $ | 1,986,593 |
The Level 2 value displayed in this table is Municipal Bonds. Refer to this Schedule of Investments for a further breakout of each security by state.
The Fund utilizes the end of period methodology when determining transfers. There were no transfers among Level 1, Level 2 and Level 3 for the period ended June 30, 2015.
| PORTFOLIO HOLDINGS | ||
| % of Net Assets | ||
| Municipal Bonds | 62.1 | % |
| Other Assets & Liabilities | 37.9 | % |
| 100.0 | % |
| See Notes to Financial Statements. | 3 |
| NP STRATEGIC MUNICIPAL FUND STATEMENT OF ASSETS AND LIABILITIES JUNE 30, 2015 |
| ASSETS | ||||||
| Total investments, at value (Cost $1,982,899) | $ | 1,986,593 | ||||
| Cash | 1,071,593 | |||||
| Receivables: | ||||||
| Fund shares sold | 4,629 | |||||
| Interest | 14,899 | |||||
| Adviser | From investment adviser | 84,663 | ||||
| Prepaid expenses | 7,464 | |||||
| Deferred offering costs | 67,157 | |||||
| Total Assets | 3,236,998 | |||||
| LIABILITIES | ||||||
| Payables: | ||||||
| Distributions payable | 4,629 | |||||
| Accrued Liabilities: | ||||||
| Fund services fees | 6,803 | |||||
| Other expenses | 26,906 | |||||
| Total Liabilities | 38,338 | |||||
| NET ASSETS | $ | 3,198,660 | ||||
| COMPONENTS OF NET ASSETS | ||||||
| Paid-in capital | $ | 3,080,825 | ||||
| Distributions in excess of net investment income | (293 | ) | ||||
| Accumulated net realized gain | 114,434 | |||||
| Net unrealized appreciation | 3,694 | |||||
| NET ASSETS | $ | 3,198,660 | ||||
| SHARES OF BENEFICIAL INTEREST AT NO PAR VALUE (UNLIMITED SHARES AUTHORIZED) | 312,912 | |||||
NET ASSET VALUE, OFFERING AND REDEMPTION PRICE PER SHARE* | $ | 10.22 | ||||
| * | Shares redeemed or exchanged within 60 days of purchase are charged a 1.00% redemption fee. | |||||
| See Notes to Financial Statements. | 4 |
| NP STRATEGIC MUNICIPAL FUND STATEMENT OF OPERATIONS PERIOD ENDED JUNE 30, 2015* |
| INVESTMENT INCOME | |||||||
| Interest income | $ | 33,000 | |||||
| Total Investment Income | 33,000 | ||||||
| Adviser | |||||||
| EXPENSES | |||||||
| Investment adviser fees | 21,746 | ||||||
| Fund services fees | 53,925 | ||||||
| Custodian fees | 23,163 | ||||||
| Registration fees | 819 | ||||||
| Professional fees | 34,980 | ||||||
| Trustees' fees and expenses | 2,722 | ||||||
| Offering costs | 42,983 | ||||||
| Miscellaneous expenses | 21,448 | ||||||
| Total Expenses | 201,786 | ||||||
| Fees waived and expenses reimbursed | (174,318 | ) | |||||
| Net Expenses | 27,468 | ||||||
| NET INVESTMENT INCOME | 5,532 | ||||||
| NET REALIZED AND UNREALIZED GAIN (LOSS) | |||||||
| Net realized gain on investments | 114,434 | ||||||
| Net change in unrealized appreciation (depreciation) on investments | 3,694 | ||||||
| NET REALIZED AND UNREALIZED GAIN | 118,128 | ||||||
| INCREASE IN NET ASSETS RESULTING FROM OPERATIONS | $ | 123,660 | |||||
| * | Commencement of operations was January 22, 2015. | ||||||
| See Notes to Financial Statements. | 5 |
| NP STRATEGIC MUNICIPAL FUND STATEMENT OF CHANGES IN NET ASSETS |
| December 31, 2015 | # | 42185 | # | # | |||
January 22, 2015* through June 30, 2015 | |||||||
| OPERATIONS | |||||||
| Net investment income | $ | 5,532 | |||||
| Net realized gain | 114,434 | ||||||
| Net change in unrealized appreciation (depreciation) | 3,694 | ||||||
| Increase in Net Assets Resulting from Operations | 123,660 | ||||||
| DISTRIBUTIONS TO SHAREHOLDERS FROM | |||||||
| Net investment income | (5,825 | ) | |||||
| CAPITAL SHARE TRANSACTIONS | |||||||
| Sale of shares | 7,575,000 | ||||||
| Reinvestment of distributions | 5,825 | ||||||
| Redemption of shares | (4,500,000 | ) | |||||
| Increase in Net Assets from Capital Share Transactions | 3,080,825 | ||||||
| Increase in Net Assets | 3,198,660 | ||||||
| NET ASSETS | |||||||
| Beginning of Period | - | ||||||
| End of Period (Including line (a)) | $ | 3,198,660 | |||||
| SHARE TRANSACTIONS | |||||||
| Sale of shares | 752,225 | ||||||
| Reinvestment of distributions | 570 | ||||||
| Redemption of shares | (439,883 | ) | |||||
| Increase in Shares | 312,912 | ||||||
| (a) | Distributions in excess of net investment income | $ | (293 | ) | |||
| * | Commencement of operations. | ||||||
| See Notes to Financial Statements. | 6 |
| NP STRATEGIC MUNICIPAL FUND FINANCIAL HIGHLIGHTS |
| These financial highlights reflect selected data for a share outstanding throughout the period. | |||||
January 22, 2015 (a) through June 30, 2015 | |||||
| NET ASSET VALUE, Beginning of Period | $ | 10.00 | |||
| INVESTMENT OPERATIONS | |||||
| Net investment income (b) | 0.01 | ||||
| Net realized and unrealized gain | 0.22 | ||||
| Total from Investment Operations | 0.23 | ||||
| DISTRIBUTIONS TO SHAREHOLDERS FROM | |||||
| Net investment income | (0.01 | ) | |||
| NET ASSET VALUE, End of Period | $ | 10.22 | |||
| TOTAL RETURN | 2.29 | %(c) | |||
| RATIOS/SUPPLEMENTARY DATA | |||||
| Net Assets at End of Period (000's omitted) | $3,199 | ||||
| Ratios to Average Net Assets: | |||||
| Net investment income | 0.24 | %(d) | |||
| Net expenses | 1.20 | %(d) | |||
| Gross expenses (e) | 8.82 | %(d) | |||
| PORTFOLIO TURNOVER RATE | 912 | %(c) | |||
| (a) | Commencement of operations. | ||||
| (b) | Calculated based on average shares outstanding during each period. | ||||
| (c) | Not annualized. | ||||
| (d) | Annualized. | ||||
| (e) | Reflects the expense ratio excluding any waivers and/or reimbursements. | ||||
| See Notes to Financial Statements. | 7 |
| NP STRATEGIC MUNICIPAL FUND NOTES TO FINANCIAL STATEMENTS JUNE 30, 2015 |
Note 1. Organization
The NP Strategic Municipal Fund (the “Fund”) is a non-diversified portfolio of ALTMFX Trust (the “Trust”). The Trust is a Delaware statutory trust that is registered as an open-end, management investment company under the Investment Company Act of 1940 (the “Act”), as amended. Under its Trust Instrument, the Trust is authorized to issue an unlimited number of the Fund’s shares of beneficial interest without par value. The Fund currently offers two classes of shares: Institutional Shares and Investor Shares. The Institutional Shares commenced operations on January 22, 2015. As of June 30, 2015, the Investor Shares have not commenced operations. The Fund seeks to generate returns by investing in municipal securities that pay current income or offer relative value trading opportunities.
Note 2. Summary of Significant Accounting Policies
These financial statements are prepared in accordance with accounting principles generally accepted in the United States of America (“GAAP”), which require management to make estimates and assumptions that affect the reported amounts of assets and liabilities, the disclosure of contingent liabilities at the date of the financial statements, and the reported amounts of increases and decreases in net assets from operations during the fiscal period. Actual amounts could differ from those estimates. The following summarizes the significant accounting policies of the Fund:
Security Valuation – Exchange-traded securities and over-the-counter securities are valued using the last quoted trade or official closing price, provided by independent pricing services as of the close of trading on the market or exchange for which they are primarily traded, on each Fund business day. In the absence of a sale, such securities are valued at the mean of the last bid and ask price provided by independent pricing services. Non-exchange-traded securities for which quotations are available are valued using the last quoted sales price, or in the absence of a sale, at the mean of the last bid and ask prices provided by independent pricing services. Shares of open-end mutual funds are valued at net asset value (“NAV”). Short-term investments that mature in 60 days or less may be valued at amortized cost. The Fund values its investments at fair value pursuant to procedures adopted by the Trust's Board of Trustees (the "Board") if (1) market quotations are insufficient or not readily available or (2) the adviser believes that the values available are unreliable. The Trust’s Valuation Committee, as defined in the Fund’s registration statement, performs certain functions as they relate to the administration and oversight of the Fund’s valuation procedures. Under these procedures, the Valuation Committee convenes on a regular and ad-hoc basis to review such investments and considers a number of factors, including valuation methodologies and significant unobservable inputs, when arriving at fair value.
The Valuation Committee may work with the adviser to provide valuation inputs. In determining fair valuations, inputs may include market-based analytics which may consider related or comparable assets or liabilities, recent transactions, market multiples, book values and other relevant investment information. Adviser inputs may include an income-based approach in which the anticipated future cash flows of the investment are discounted in determining fair value. Discounts may also be applied based on the nature or duration of any restrictions on the disposition of the investments. The Valuation Committee performs regular reviews of valuation methodologies, key inputs and assumptions, disposition analysis and market activity.
Fair valuation is based on subjective factors and, as a result, the fair value price of an investment may differ from the security’s market price and may not be the price at which the asset may be sold. Fair valuation could result in a different NAV than a NAV determined by using market quotes.
The Fund has a three-tier fair value hierarchy. The basis of the tiers is dependent upon the various “inputs” used to determine the value of the Fund’s investments. These inputs are summarized in the three broad levels listed below:
Level 1 — quoted prices in active markets for identical assets and liabilities
Level 2 — other significant observable inputs (including quoted prices of similar securities, interest rates, prepayment speeds, credit risk, etc.)
Level 3 — significant unobservable inputs (including the Fund’s own assumptions in determining the fair value of investments)
The aggregate value by input level, as of June 30, 2015, for the Fund’s investments is included at the end of the Fund’s Schedule of Investments.
Security Transactions, Investment Income and Realized Gain and Loss – Investment transactions are accounted for on the trade date. Dividend income is recorded on the ex-dividend date. Foreign dividend income is recorded on the ex-dividend date or as soon as possible after the Fund determines the existence of a dividend declaration after exercising reasonable due diligence. Income and
| 8 |
| NP STRATEGIC MUNICIPAL FUND NOTES TO FINANCIAL STATEMENTS JUNE 30, 2015 |
capital gains on some foreign securities may be subject to foreign withholding taxes, which are accrued as applicable. Interest income is recorded on an accrual basis. Premium is amortized and discount is accreted using the effective interest method. Identified cost of investments sold is used to determine the gain and loss for both financial statement and federal income tax purposes.
Distributions to Shareholders – Distributions to shareholders of net investment income, if any, are declared and paid at least annually. Distributions to shareholders of net capital gains, if any, are declared and paid annually. Distributions to shareholders are recorded on the ex-dividend date. Distributions are based on amounts calculated in accordance with applicable federal income tax regulations, which may differ from GAAP. These differences are due primarily to differing treatments of income and gain on various investment securities held by the Fund, timing differences and differing characterizations of distributions made by the Fund.
Federal Taxes – The Fund intends to continue to qualify each year as a regulated investment company under Subchapter M of the Internal Revenue Code and to distribute all of its taxable income to shareholders. In addition, by distributing in each calendar year substantially all of its net investment income and capital gains, if any, the Fund will not be subject to a federal excise tax. Therefore, no federal income or excise tax provision is required. The Fund will file a U.S. federal income and excise tax return as required. A fund’s federal income tax returns are subject to examination by the Internal Revenue Service for a period of three fiscal years after they are filed. As of June 30, 2015, there are no uncertain tax positions that would require financial statement recognition, de-recognition or disclosure.
Income and Expense Allocation – The Trust accounts separately for the assets, liabilities and operations of each of its investment portfolios. Expenses that are directly attributable to more than one investment portfolio are allocated among the respective investment portfolios in an equitable manner.
Redemption Fees – A shareholder who redeems or exchanges shares within 60 days of purchase will incur a redemption fee of 1.00% of the current net asset value of shares redeemed or exchanged, subject to certain limitations. The fee is charged for the benefit of the remaining shareholders and will be paid to the Fund to help offset transaction costs. The fee is accounted for as an addition to paid-in capital. The Fund reserves the right to modify the terms of or terminate the fee at any time. There are limited exceptions to the imposition of the redemption fee.
Offering Costs – Offering costs for the Fund of $42,983 consisted of fees related to the mailing and printing of the initial prospectus, certain startup legal costs, and initial registration filings. Such costs are amortized over a twelve-month period beginning with the commencement of operations of the Fund.
Commitments and Contingencies – In the normal course of business, the Fund enters into contracts that provide general indemnifications by the Fund to the counterparty to the contract. The Fund’s maximum exposure under these arrangements is dependent on future claims that may be made against the Fund and, therefore, cannot be estimated; however, based on experience, the risk of loss from such claims is considered remote.
Note 3. Fees and Expenses
Investment Adviser – Napier Park Global Capital (US) LP (the “Adviser”) is the investment adviser to the Fund. Pursuant to an investment advisory agreement, the Adviser receives an advisory fee from the Fund at an annual rate of 0.95% of the Fund’s average daily net assets.
Distribution – Foreside Fund Services, LLC serves as the Fund’s distributor (the “Distributor”). The Distributor is not affiliated with the Adviser or Atlantic Fund Administration, LLC (d/b/a Atlantic Fund Services) (“Atlantic”) or their affiliates. The Fund has adopted a Distribution Plan (the “Plan”) for Investor Shares in accordance with Rule 12b-1 of the Act. Under the Plan, the Fund pays the Distributor and/or any other entity as authorized by the Board a fee of 0.25% of the average daily net assets of the Investor Shares.
Other Service Providers – Atlantic provides fund accounting, fund administration, compliance and transfer agency services to the Fund. Atlantic also provides certain shareholder report production, and EDGAR conversion and filing services. Pursuant to an Atlantic services agreement, the Fund pays Atlantic customary fees for its services. Atlantic provides a Principal Executive Officer, a Principal Financial Officer, a Chief Compliance Officer, and an Anti-Money Laundering Officer to the Fund, as well as certain additional compliance support functions.
Trustees and Officers – The Trust pays each independent Trustee an annual retainer fee of $5,000 for service to the Trust. The Trustees may receive additional fees for special Board meetings. Each Trustee is also reimbursed for all reasonable out-of-pocket expenses incurred in connection with their duties as a Trustee, including travel and related expenses incurred in
| 9 |
| NP STRATEGIC MUNICIPAL FUND NOTES TO FINANCIAL STATEMENTS JUNE 30, 2015 |
attending Board meetings. Certain officers of the Trust are also officers or employees of the above named service providers, and during their terms of office received no compensation from the Fund.
Note 4. Expenses Reimbursed and Fees Waived
The Adviser has contractually agreed to waive its fee and/or reimburse certain expenses to limit total operating expenses (excluding all taxes, interest, portfolio transaction expenses, dividend and interest expense on short sales, acquired fund fees and expenses, proxy expenses and extraordinary expanses) to 1.20% for Institutional Shares through April 29, 2016. Other fund service providers have voluntarily agreed to waive and reimburse a portion of their fees. These voluntary fee waivers and reimbursements may be reduced or eliminated at any time. For the period ended June 30, 2015, fees waived and expenses reimbursed were as follows:
| Investment Adviser Fees Waived | Investment Adviser Expenses Reimbursed | Other Waivers | Total Fees Waived and Expenses Reimbursed | |||||||
| $ | 21,746 | $ | 139,713 | $ | 12,859 | $ | 174,318 | |||
The Fund may repay the Adviser for fees waived and expenses reimbursed pursuant to the expense cap if such payment (1) is made within three years of the fee waiver or expense reimbursement, (2) is approved by the Board and (3) does not cause net annual fund operating expenses of the Fund to exceed the expense cap in place at the time the fees were waived. As of June 30, 2015, the following amounts are subject to recapture by the Adviser:
| Amount of Fees Waived and/or Expenses Reimbursed | Expiration Date to Recoup Fees Waived and/or Expenses Reimbursed | Fees Recouped | ||||||
| June 30, 2015 | $ | 161,459 | December 31, 2018 | $ | - | |||
Note 5. Security Transactions
The cost of purchases and proceeds from sales of investment securities (including maturities), other than short-term investments during the period ended June 30, 2015, were $28,254,527 and $26,990,409, respectively.
Note 6. Federal Income Tax
As of June 30, 2015, distributable earnings on a tax basis were as follows:
| Undistributed Ordinary Income | $ | 114,434 | ||
| Unrealized Appreciation | $ | 3,694 | ||
| Total | $ | 118,128 |
The difference between components of distributable earnings on a tax basis and the amounts reflected in the Statement of Assets and Liabilities are primarily due to distributions in excess of earnings.
Note 7. Recent Accounting Pronouncements
In May 2015, the Financial Accounting Standards Board (“FASB”) issued Accounting Standards Update 2015-07 (“ASU 2015-07”) eliminating the requirement for investments measured at net asset value to be categorized within the fair value hierarchy under GAAP and requiring the disclosure of sufficient information to reconcile the fair value of the remaining assets categorized within the fair value hierarchy to the financial statements. ASU 2015-07 is effective for interim and annual reporting periods beginning after December 15, 2015. Management has reviewed the requirements and believes the adoption of ASU 2015-07 will not have a material impact on the financial statements.
Note 8. Subsequent Events
Subsequent events occurring after the date of this report through the date these financial statements were issued have been evaluated for potential impact and the Fund has had no such events.
| 10 |
| NP STRATEGIC MUNICIPAL FUND ADDITIONAL INFORMATION JUNE 30, 2015 |
Investment Advisory Agreement Approval
At the October 22, 2014 Board meeting, the Board, including the Independent Trustees, considered the approval of the initial investment advisory agreement between the Adviser and the Trust pertaining to the Fund (the “Advisory Agreement”). In preparation for its deliberations, the Board requested and reviewed written responses from the Adviser to a due diligence questionnaire circulated on the Board's behalf. The Board also discussed the materials with Independent Trustee counsel and, as necessary, with the Trust's administrator, Atlantic Fund Services. During its deliberations, the Board received an oral presentation from the Adviser, and was assisted by the advice of Independent Trustee counsel.
In evaluating the Advisory Agreement for the Fund, the Board reviewed written materials furnished by the Adviser and the administrator, including information regarding the Adviser's personnel, operations, profitability estimates and financial condition.
At the meeting, the Board reviewed, among other matters: (1) the nature, extent and quality of the services to be provided to the Fund by the Adviser, including information on the investment performance of other accounts managed by the Adviser with similar investment policies as the Fund; (2) the costs of the services to be provided and anticipated profitability to the Adviser with respect to its relationship with the Fund; (3) the advisory fee and projected total expense ratio of the Fund compared to a relevant peer group of funds and two private funds managed by the Adviser with similar investment strategies to those of the Fund; (4) the extent to which economies of scale may be realized as the Fund grows and whether the advisory fee enables the Fund's investors to share in the benefits of economies of scale; and (5) any other benefits projected to be received by the Adviser from its relationship with the Fund.
Nature, Extent and Quality of Services
Based on written materials received, the presentation from representatives of the Adviser, a discussion with the Adviser about the Adviser’s personnel, operations and financial condition, and a discussion with the Trust’s CCO about the Adviser’s compliance program, the Board considered the overall quality of services provided by the Adviser under the Advisory Agreement. In this regard, the Board considered information regarding the experience, qualifications and professional background of the portfolio manager and other personnel at the Adviser with principal responsibility for the Fund, noting in particular the personnel’s experience with managing municipal bond investments, as well as the investment philosophy and decision-making process of those professionals and the capability and integrity of the Adviser’s senior management and staff.
The Board also considered the managerial and financial resources available to the Adviser. The Board noted the Adviser’s representation that the firm is sufficiently well-capitalized. Based on the presentation and the materials provided by the Adviser in connection with the Board’s consideration of the Advisory Agreement, the Board concluded that, overall, it was satisfied with the nature, extent and quality of services to be provided to the Fund under the Advisory Agreement.
Performance
Recognizing that the Fund is new and has no performance history, the Board did not consider the performance history of the Fund. Instead, the Board considered the performance history of the Adviser's similarly managed Absolute Return Muni Strategy Fund (“Muni Fund”) and Municipal Investment Grade Fund I (the “MIG I Fund”) compared to the performance of the S&P Muni Index (“S&P Muni Index”). In considering the performance of the Muni Fund, the Board noted that, prior to February 2014, the Muni Fund’s investments were limited to bonds with a credit rating of at least AA-; and, while the Fund may invest in bonds of any credit quality, it will primarily invest in bonds which are investment grade (BBB- or higher). The Board noted that the Muni Fund outperformed versus the S&P Muni Index in the most recent annual period ended December 31, 2013, but underperformed versus the S&P Muni Index in each of the annual periods ended December 31, 2012 and December 31, 2011. The Board also noted that the MIG IFund (which commenced operations on March 24, 2013) outperformed versus the S&P Muni Index during the annual period ended December 31, 2013. Based on the foregoing, the Board concluded that the Adviser’s investment management services could benefit the Fund and its shareholders.
Compensation
The Board considered the Adviser’s proposed compensation for providing advisory services to the Fund and analyzed comparative information on advisory fee rates (after fee waivers) and total expenses of the Fund’s relevant Lipper peers. The Board noted that the Adviser’s proposed actual advisory fee rate (including the proposed fee waiver) for the Fund is slightly
| 11 |
| NP STRATEGIC MUNICIPAL FUND ADDITIONAL INFORMATION JUNE 30, 2015 |
higher than the median of its Lipper peer group, and that the estimated total expenses for the Fund are also slightly more than the median of its Lipper peers. In addition, the Board noted the Adviser’s representation that the Fund will receive a discount from the Adviser’s standard fee schedule in order to keep the total expense ratio at a level that the Adviser believes is advantageous to asset growth. In this respect, the Board noted that the Adviser has contractually agreed to limit the Fund’s total annual Fund operating expenses (excluding all taxes, interest, portfolio transaction expenses, dividend and interest expense on short sales, acquired fund fees and expenses, proxy expenses and extraordinary expenses) for Investor Shares to 1.45% and those of Institutional Shares to 1.20%, through April 29, 2016. Based on the foregoing, the Board concluded that the Adviser’s advisory fee rate to be charged to the Fund was reasonable.
Cost of Services and Profitability
The Board considered that profits to be realized by the Adviser would be a function of the future growth in assets of the Fund and concluded that the costs of the services to be provided and profits to be realized by the Adviser were not a material factor in approving the Advisory Agreement.
Economies of Scale
The Board evaluated whether the Funds would benefit from any economies of scale. In this respect, the Board noted the Adviser’s representation that the Fund potentially could benefit from economies of scale as assets grow, but the Adviser was not proposing breakpoints at this time because the Fund had not yet commenced operations and assets under management would need to achieve economies of scale before the Adviser would consider adopting breakpoints. Based on the foregoing information, the Board concluded that economies of scale were not a material factor in approving the Advisory Agreement.
Other Benefits
The Board considered the Adviser’s representation that it may benefit from its relationship with the Fund with respect to further marketing recognition and building of the Napier Park brand, as well as the possibility of in the future launching registered funds using other investment strategies.
Conclusion
The Board did not identify any single factor as being of paramount importance, and different Trustees may have given different weight to different factors. The Board reviewed a memorandum from Trust counsel discussing the legal standards applicable to its consideration of the Advisory Agreement. Based on its review, including consideration of each of the factors referenced above, the Board determined, in the exercise of its reasonable business judgment, that the advisory arrangement, as outlined in the Advisory Agreement, was fair and reasonable in light of the services to be performed, expenses to be incurred and such other matters as the Board considered relevant.
Proxy Voting Information
A description of the policies and procedures that the Fund uses to determine how to vote proxies relating to securities held in the Fund’s portfolio is available, without charge and upon request, by calling (844) 218-5179 and on the U.S. Securities and Exchange Commission’s (the “SEC”) website at www.sec.gov. The Fund’s proxy voting record for the period from the Fund’s commencement of operations to June 30 will be available, without charge and upon request, by calling (844) 218-5179 and no later than August 31 of this year on the SEC’s website at www.sec.gov.
Availability of Quarterly Portfolio Schedules
The Fund files its complete schedule of portfolio holdings with the SEC for the first and third quarters of each fiscal year on Form N-Q. These filings are available, without charge and upon request on the SEC’s website at www.sec.gov or may be reviewed and copied at the SEC’s Public Reference Room in Washington, DC. Information on the operation of the Public Reference Room may be obtained by calling (800) SEC-0330.
| 12 |
| NP STRATEGIC MUNICIPAL FUND ADDITIONAL INFORMATION JUNE 30, 2015 |
Shareholder Expense Example
As a shareholder of the Fund, you incur two types of costs: (1) transaction costs, including redemption fees, and (2) ongoing costs, including management fees, 12b-1 fees, and other Fund expenses. This example is intended to help you understand your ongoing costs (in dollars) of investing in the Fund, and to compare these costs with the ongoing costs of investing in other mutual funds.
The example is based on an investment of $1,000 invested at the beginning of the period and held for the entire period from January 22, 2015, through June 30, 2015.
Actual Expenses – The first line of the table below provides information about actual account values and actual expenses. You may use the information in this line, together with the amount you invested, to estimate the expenses that you paid over the period. Simply divide your account value by $1,000 (for example, an $8,600 account value divided by $1,000 = 8.6), then multiply the result by the number in the first line under the heading entitled “Expenses Paid During Period” to estimate the expenses you paid on your account during the period.
Hypothetical Example for Comparison Purposes – The second line of the table below provides information about hypothetical account values and hypothetical expenses based on the Fund’s actual expense ratio and an assumed rate of return of 5% per year before expenses, which is not the Fund’s actual return. The hypothetical account values and expenses may not be used to estimate the actual ending account balance or expenses you paid for the period. You may use this information to compare the ongoing costs of investing in the Fund and other funds. To do so, compare this 5% hypothetical example with the 5% hypothetical examples that appear in the shareholder reports of other funds.
Please note that the expenses shown in the table are meant to highlight your ongoing costs only and do not reflect any transactional costs, such as redemption fees. Therefore, the second line of the table is useful in comparing ongoing costs only, and will not help you determine the relative total costs of owning different funds. In addition, if these transactional costs were included, your costs would have been higher.
| Beginning | Ending | Expenses | Annualized | ||||||||
| Account Value | Account Value | Paid During | Expense | ||||||||
| January 22, 2015 | June 30, 2015 | Period** | Ratio** | ||||||||
| Institutional Shares | |||||||||||
| Actual | $ | 1,000.00 | $ | 1,022.94 | $ | 5.29 | 1.20 | % | |||
| Hypothetical (5% return before taxes) | $ | 1,000.00 | $ | 1,018.84 | $ | 6.01 | 1.20 | % | |||
| * Expenses are equal to the Fund's annualized expense ratio as indicated above multiplied by the average account value over the period, multiplied by the number of days in the most recent half-year divided by 365 to reflect the half-year period (except for the Fund's actual return which reflects the 159-day period between January 22, 2015, the commencement of operations of the Fund, through June 30, 2015). |
| 13 |
NP Strategic Municipal Fund
FOR MORE INFORMATION:
P.O. Box 588
Portland, ME 04112
(844) 215-5179 (toll free)
INVESTMENT ADVISER
Napier Park Global Capital (US) LP
280 Park Avenue, 3rd Floor
New York, NY 10017
TRANSFER AGENT
Atlantic Fund Services
P.O. Box 588
Portland, ME 04112
www.atlanticfundservices.com
DISTRIBUTOR
Foreside Fund Services, LLC
Three Canal Plaza, Suite 100
Portland, Maine 04101
www.foreside.com
This report is submitted for the general information of the shareholders of the Fund. It is not authorized for distribution to prospective investors unless preceded or accompanied by an effective prospectus, which includes information regarding the Fund’s risks, objectives, fees and expenses, experience of its management, and other information.
215-SAR-0615
| ITEM 2. CODE OF ETHICS. |
| Not applicable. |
| ITEM 3. AUDIT COMMITTEE FINANCIAL EXPERT. |
| Not applicable. |
| ITEM 4. PRINCIPAL ACCOUNTANT FEES AND SERVICES. |
| Not applicable. |
| ITEM 5. AUDIT COMMITTEE OF LISTED REGISTRANTS. |
| Not applicable |
| ITEM 6. INVESTMENTS. |
| (a) | Included as part of report to shareholders under Item 1. |
| (b) | Not applicable. |
| ITEM 7. DISCLOSURE OF PROXY VOTING POLICIES AND PROCEDURES FOR CLOSED-END |
| MANAGEMENT INVESTMENT COMPANIES. |
| Not applicable. |
| ITEM 8. PORTFOLIO MANAGERS OF CLOSED-END MANAGEMENT INVESTMENT COMPANIES. |
| Not applicable. |
| ITEM 9. PURCHASES OF EQUITY SECURITIES BY CLOSED-END MANAGEMENT INVESTMENT COMPANY AND AFFILIATED PURCHASERS. |
| Not applicable. |
| ITEM 10. SUBMISSION OF MATTERS TO A VOTE OF SECURITY HOLDERS |
| The Registrant does not accept nominees to the board of trustees from shareholders. |
| ITEM 11. CONTROLS AND PROCEDURES |
(a) The Registrant’s Principal Executive Officer and Principal Financial Officer have concluded that the Registrant’s disclosure controls and procedures (as defined in Rule 30a-3(c) under the Investment Company Act of 1940 (the “Act”)) are effective, based on their evaluation of the controls and procedures required by Rule 30a-3(b) under the Act and Rules 13a-15(b) or 15d-15(b) under the Securities Exchange Act of 1934, as of a date within 90 days of the filing date of this report.
(b) There were no changes in the Registrant’s internal control over financial reporting (as defined in
Rule 30a-3(d) under the Act) that occurred during the second fiscal quarter of the period covered by this report that have materially affected, or are reasonably likely to materially affect, the Registrant’s internal control over financial reporting.
| ITEM 12. EXHIBITS. |
| (a)(1) Not applicable. |
| (a)(2) Certifications pursuant to Rule 30a-2(a) of the Act, and Section 302 of the Sarbanes-Oxley Act of 2002. (Exhibits filed herewith) |
| (a)(3) Not applicable. |
| (b) Certifications pursuant to Rule 30a-2(b) of the Act, and Section 906 of the Sarbanes-Oxley Act of 2002. (Exhibit filed herewith) |
| SIGNATURES |
Pursuant to the requirements of the Securities Exchange Act of 1934 and the Investment Company Act of 1940, the Registrant has duly caused this report to be signed on its behalf by the undersigned, thereunto duly authorized.
| Registrant | ALTMFX Trust |
| By | /s/ Christopher J. Koons | |
| Christopher J. Koons, Principal Executive Officer | ||
| Date | August 25, 2015 |
Pursuant to the requirements of the Securities Exchange Act of 1934 and the Investment Company Act of 1940, this report has been signed below by the following persons on behalf of the Registrant and in the capacities and on the dates indicated.
| By | /s/ Christopher J. Koons | |
| Christopher J. Koons, Principal Executive Officer | ||
| Date | August 25, 2015 |
| By | /s/ Karen Shaw | |
| Karen Shaw, Principal Financial Officer | ||
| Date | August 25, 2015 |