Exhibit (c)(11)
| EXPERT ADVISORS TO THE LNG AND NATURAL GAS INDUSTRIES www.poten.com |
| © POTEN & PARTNERS 2009 CONFIDENTIAL • This assessment is to provide a base, high and low forecast of the number of FSRUs required • Explanation of the divergence between rechartering rates and forecasted charter rates for new FSRUs |
| © POTEN & PARTNERS 2009 CONFIDENTIAL |
| © POTEN & PARTNERS 2009 CONFIDENTIAL |
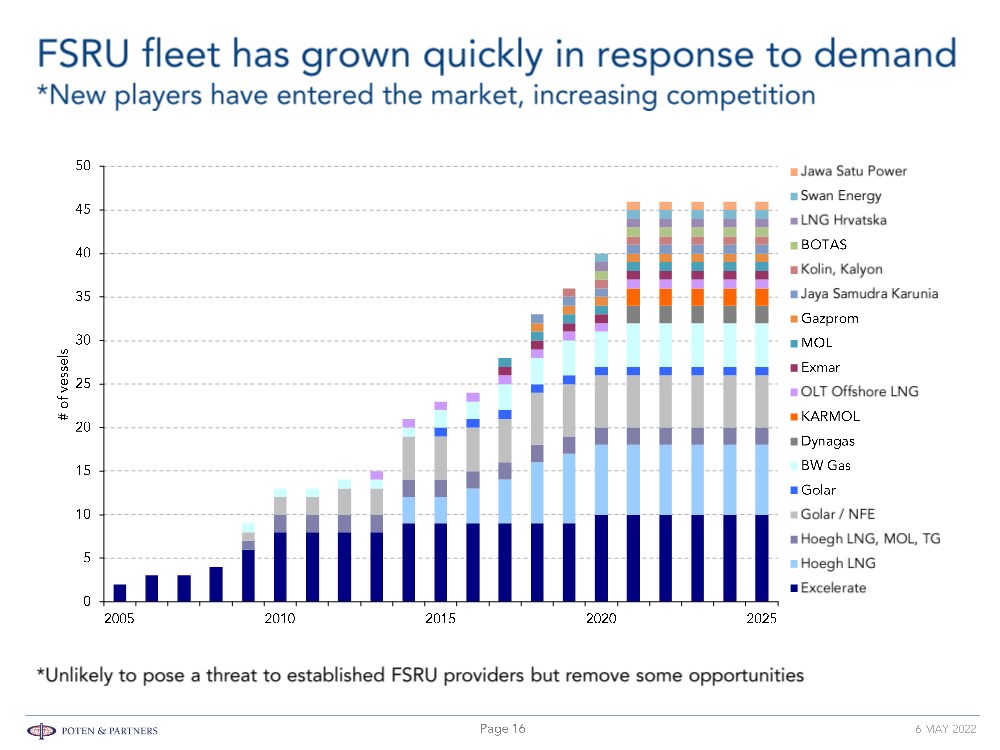
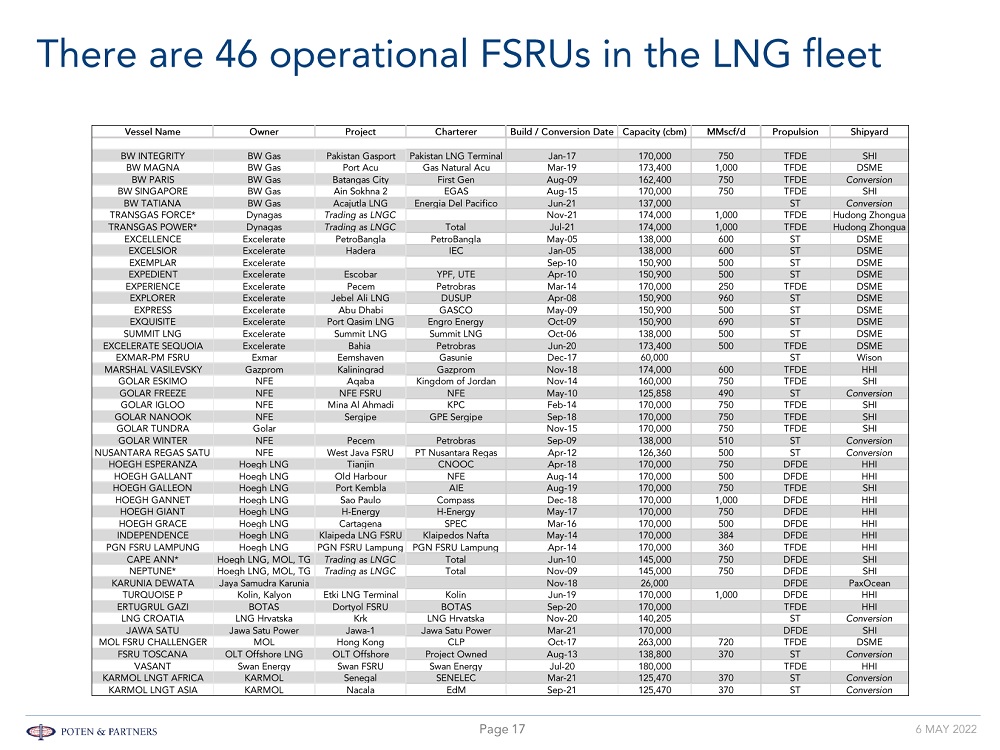
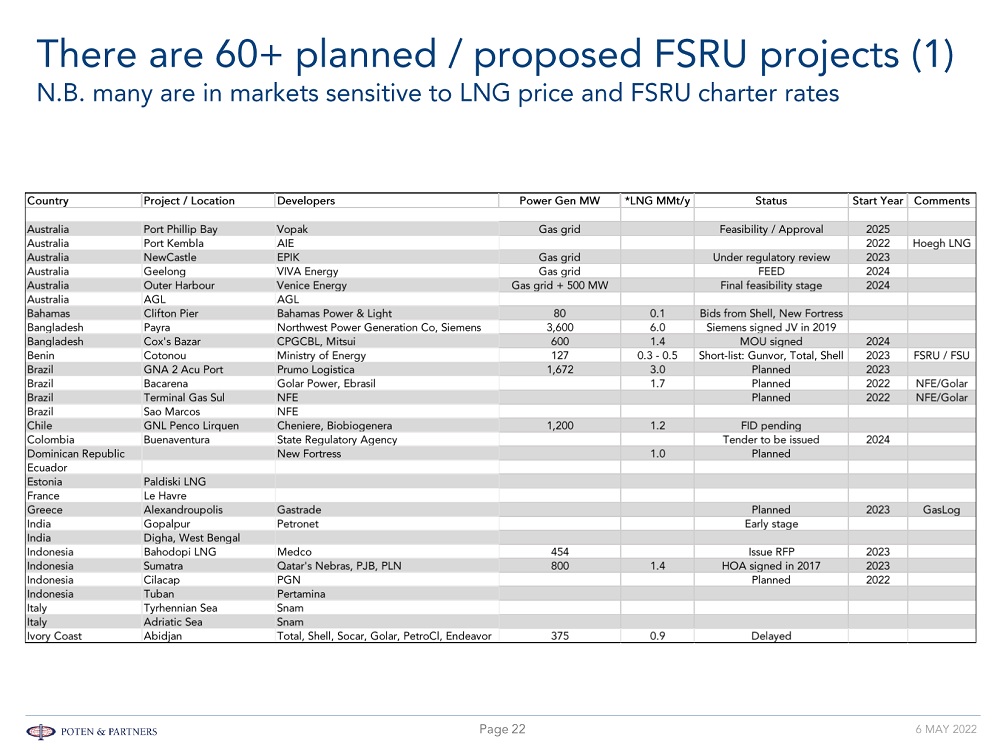
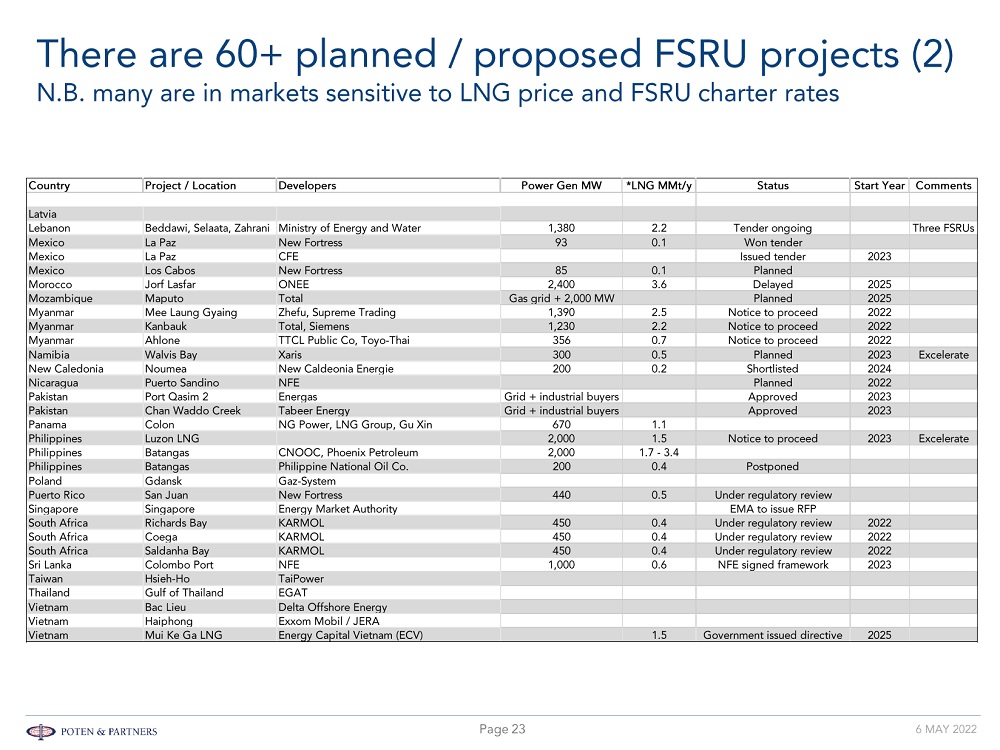
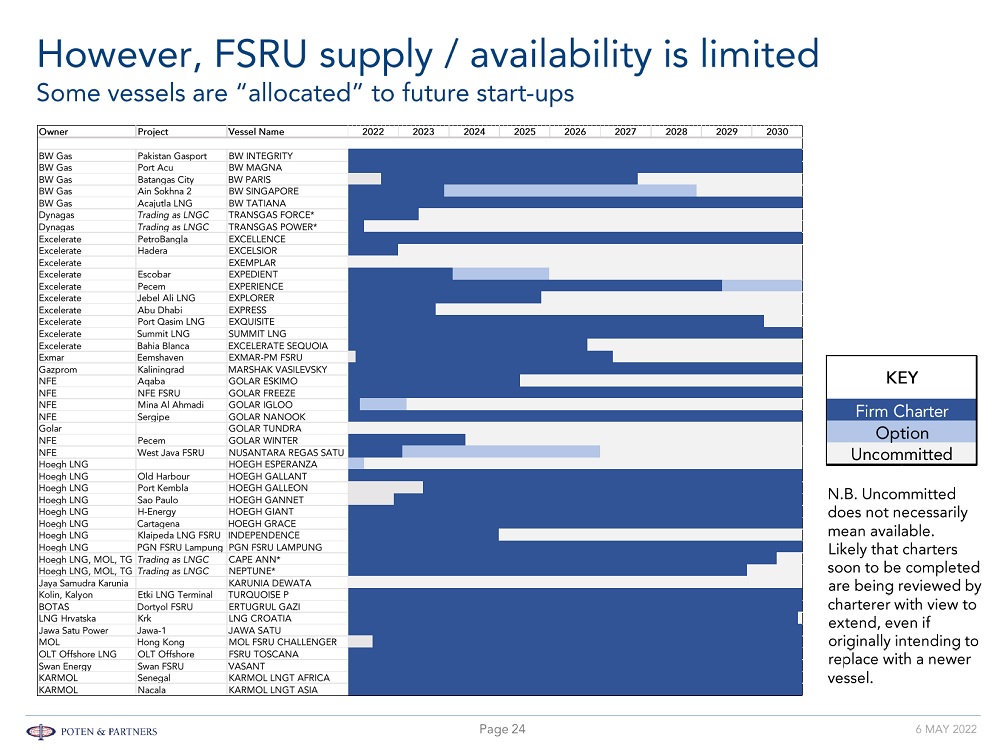
| © POTEN & PARTNERS 2009 CONFIDENTIAL • Growth of FSRUs to service markets is driven by capital cost savings and shorter implementation schedules. • FSRU fleet has grown quickly in response to demand. There are currently 46 existing FSRUs, none on order. • New players have entered the market; increasing competition, and reducing opportunities for established players. • Cost and time savings, flexibility, lower credit needs and security of supply (Europe) will continue to drive demand. • There are 60+ planned FSRU projects. N.B. many are in markets sensitive to LNG price and FSRU charter rates. • Some vessels are “allocated” to future start-ups, and current charters could be re-negotiated / extended. • The FSRU fleet currently comprises nine conversions. • Depending on the storage capacity requirement, there is a fleet of available conventional LNG carriers that can be converted to FSRUs. However, the vessels are mostly older and smaller compared to the current standard LNGC. • About $50 million – $80 million conversion cost, plus out of service lost revenue. • Timing of conversion vs newbuild – 18 months vs 3-4 years. The earliest delivery for a newbuild is likely to be 2025 - 2026, whilst a conversion could be operational by the end of 2023. |
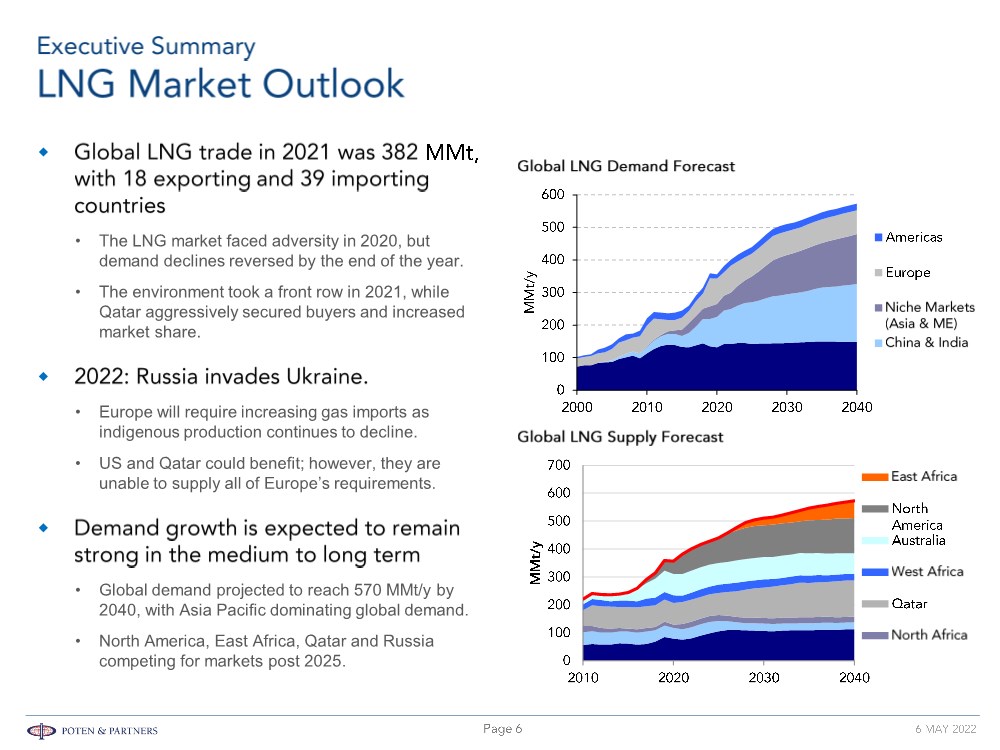
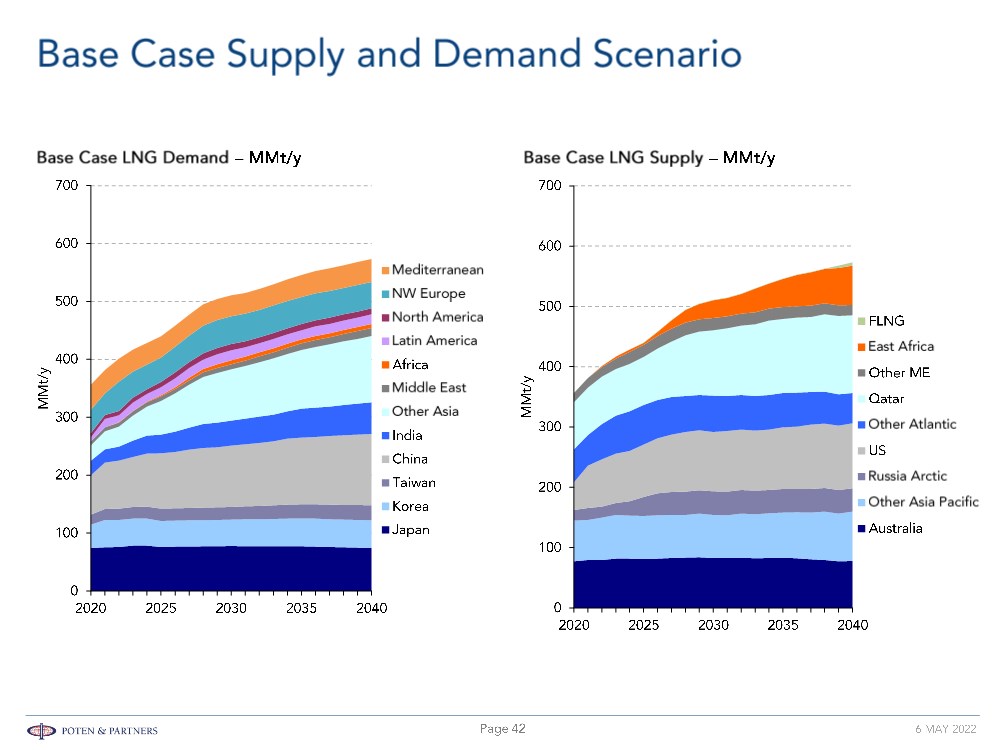
| © POTEN & PARTNERS 2009 CONFIDENTIAL • The LNG market faced adversity in 2020, but demand declines reversed by the end of the year. • The environment took a front row in 2021, while Qatar aggressively secured buyers and increased market share. • Europe will require increasing gas imports as indigenous production continues to decline. • US and Qatar could benefit; however, they are unable to supply all of Europe’s requirements. • Global demand projected to reach 570 MMt/y by 2040, with Asia Pacific dominating global demand. • North America, East Africa, Qatar and Russia competing for markets post 2025. |
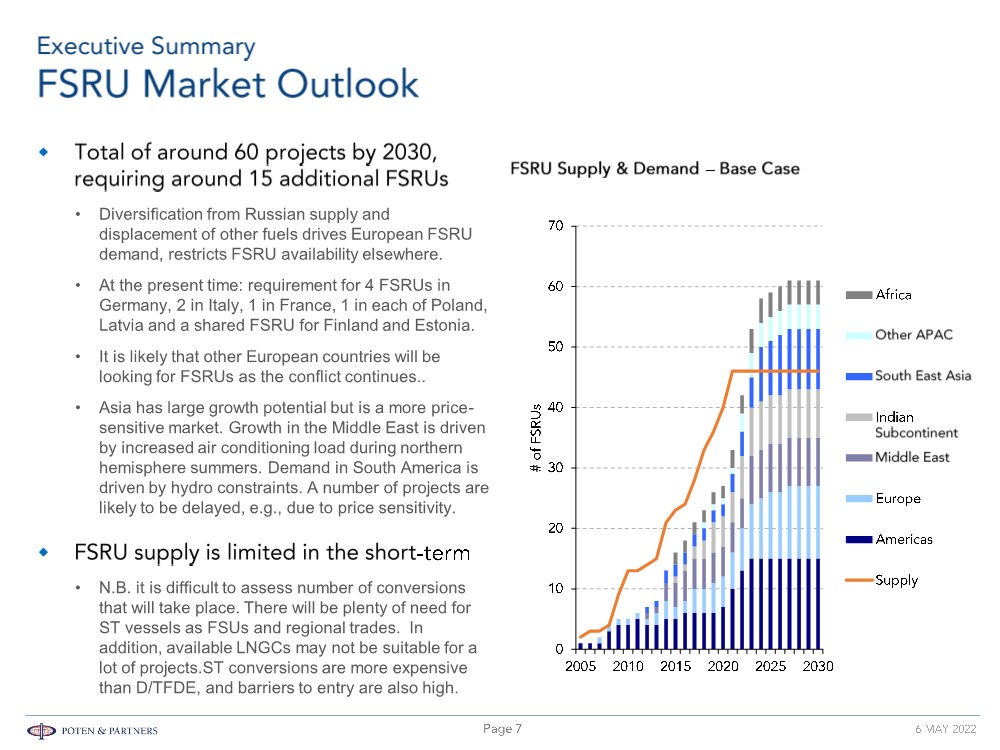
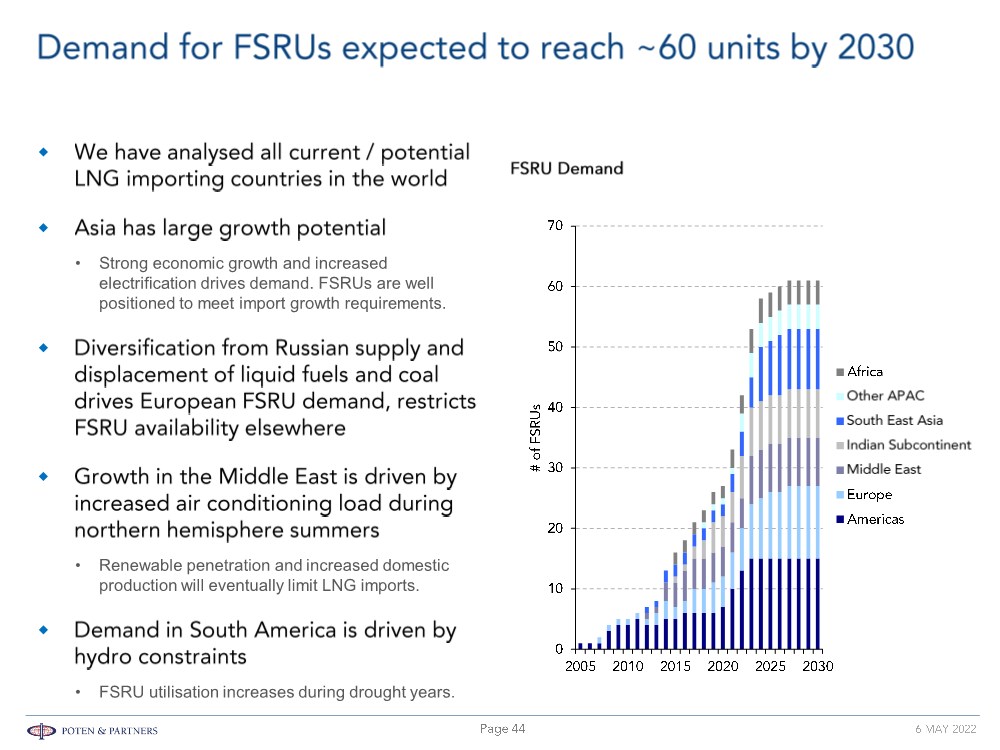
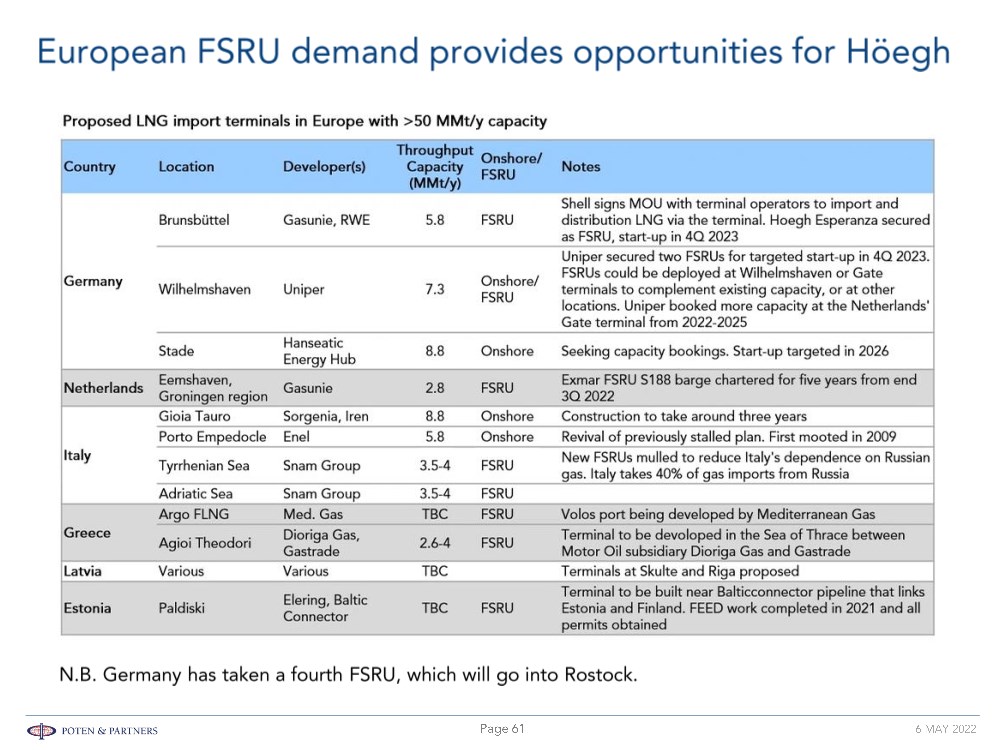
| © POTEN & PARTNERS 2009 CONFIDENTIAL • Diversification from Russian supply and displacement of other fuels drives European FSRU demand, restricts FSRU availability elsewhere. • At the present time: requirement for 4 FSRUs in Germany, 2 in Italy, 1 in France, 1 in each of Poland, Latvia and a shared FSRU for Finland and Estonia. • It is likely that other European countries will be looking for FSRUs as the conflict continues.. • Asia has large growth potential but is a more price- sensitive market. Growth in the Middle East is driven by increased air conditioning load during northern hemisphere summers. Demand in South America is driven by hydro constraints. A number of projects are likely to be delayed, e.g., due to price sensitivity. • N.B. it is difficult to assess number of conversions that will take place. There will be plenty of need for ST vessels as FSUs and regional trades. In addition, available LNGCs may not be suitable for a lot of projects.ST conversions are more expensive than D/TFDE, and barriers to entry are also high. |
| © POTEN & PARTNERS 2009 CONFIDENTIAL • However, Cape Ann and Neptune are ideally suited to the colder waters of the Baltic and NWE where seawater temperatures do not support open loop operations. • Their success will be dependent on LNGC conversion time and demonstrating sufficient experience in operations. • They could potentially secure a premium charter rate based on timing and availability but equally a discount if they are not considered experienced. • The main competitors will be those with significant LNGC fleets that they control (rather than locked into a project). • MOL, SeaPeak (Teekay?), Gaslog, etc, for example and those with sufficient cash resources or access to cheap money. Sinokor is possibly not a competitor as no real LNGC operating experience. |
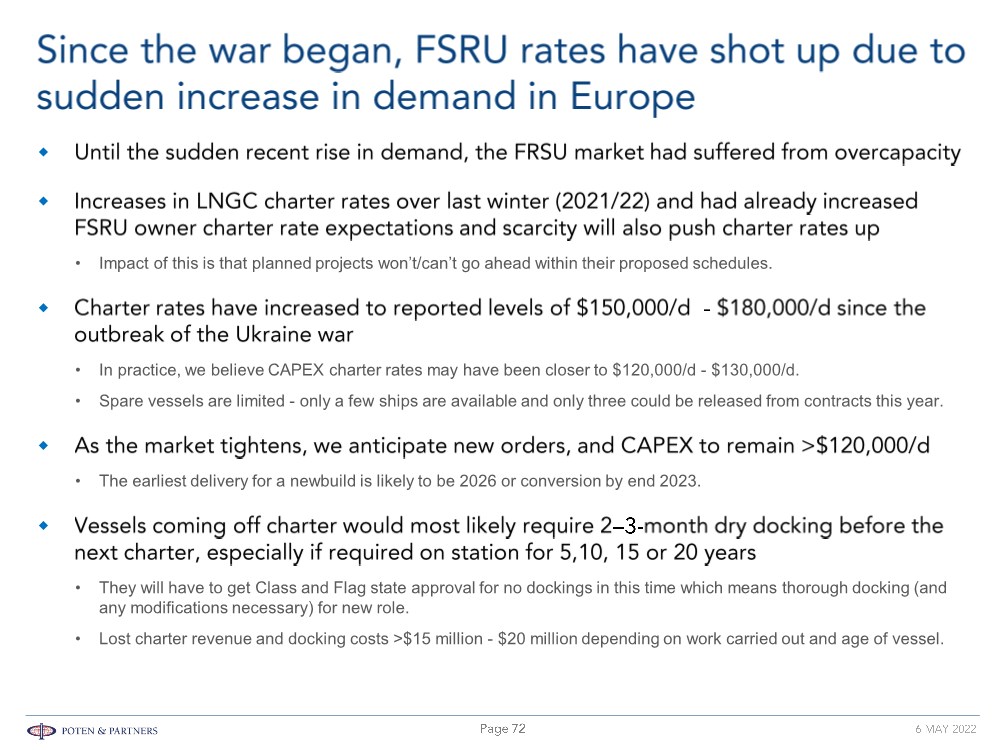
| © POTEN & PARTNERS 2009 CONFIDENTIAL • Until the sudden recent rise in demand, the FRSU market had suffered from overcapacity. • Increases in LNGC charter rates over last winter (2021/22) and had already increased FSRU owner charter rate expectations and scarcity will also push charter rates up. • Impact of this is that planned projects won’t/can’t go ahead within their proposed schedules. • In practice, we believe CAPEX charter rates may have been closer to $120,000/d - $130,000/d. Spare vessels are limited - only a few ships are available and only three could be released from contracts this year. • The earliest delivery for a newbuild is likely to be 2026 or conversion by end 2023. • EEXI impact will also prompt newbuildings with some owners switching to alternative fuelled tonnage – slot capacity will remain high most likely to 2030 and beyond. • Delays to the 60+ planned projects will result in pent-up demand in the future, particularly if LNG prices moderate • Those with FSRUs on charter and charter terminating in 3-5 years would be expected to extend the charter, renegotiating for the FSRU currently available versus trying to replace it with a larger more efficient FSRU – as none would likely exist in the market. The question is when would or should they renegotiate? |
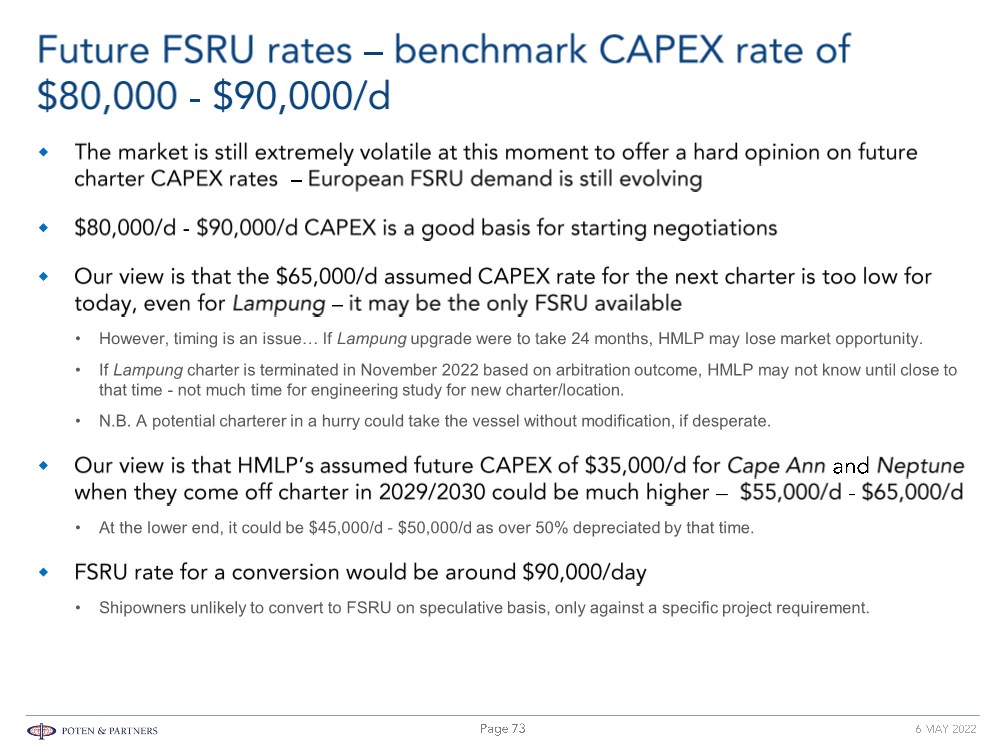
| © POTEN & PARTNERS 2009 CONFIDENTIAL • LNGCs are at about $235 million and FSRUs at about $275 million. • Likely to be continued upward pressure on prices, particularly for steel, cutbacks in nickel and aluminium supplies from Russia. Further upward pressure from shipyard capacity constraints, containership orders, possible regeneration of VLCC and bulk carrier fleets. • The market is still extremely volatile at this moment to offer a hard opinion on future charter CAPEX rates – European FSRU demand is still evolving . • $80,000/d - $90,000/d CAPEX is a good basis for starting negotiations. • Our view is that the $65,000/d assumed CAPEX rate for the next charter is too low for today, even for Lampung – it may be the only FSRU available • Our view is that HMLP’s assumed future CAPEX of $35,000/d for Cape Ann and Neptune when they come off charter in 2029/2030 could be much higher – $55,000/d - $65,000/d – At the lower end, it could be $45,000/d - $50,000/d as over 50% depreciated by that time. • N.B. FSRU rate for a conversion would be around $90,000/day – Shipowners unlikely to convert to FSRU on speculative basis, only against a specific project requirement. |
| © POTEN & PARTNERS 2009 CONFIDENTIAL |
| © POTEN & PARTNERS 2009 CONFIDENTIAL |
| © POTEN & PARTNERS 2009 CONFIDENTIAL |
| © POTEN & PARTNERS 2009 CONFIDENTIAL • These provide significant financing benefits to sponsors by lowering upfront investments • FSRUs’ much lower CAPEX could outweigh the cost of chartering the FSRU, and in general the overall terminal costs for FSRU-based import projects end up lower than onshore LNG import projects • But this depends on overall size of LNG demand and impact of economies of scale – typically favouring onshore terminals for higher volumes of throughput and storage • Power generation cost savings by displacing oil- based fuels (e.g., diesel oil) with cheaper regasified LNG |

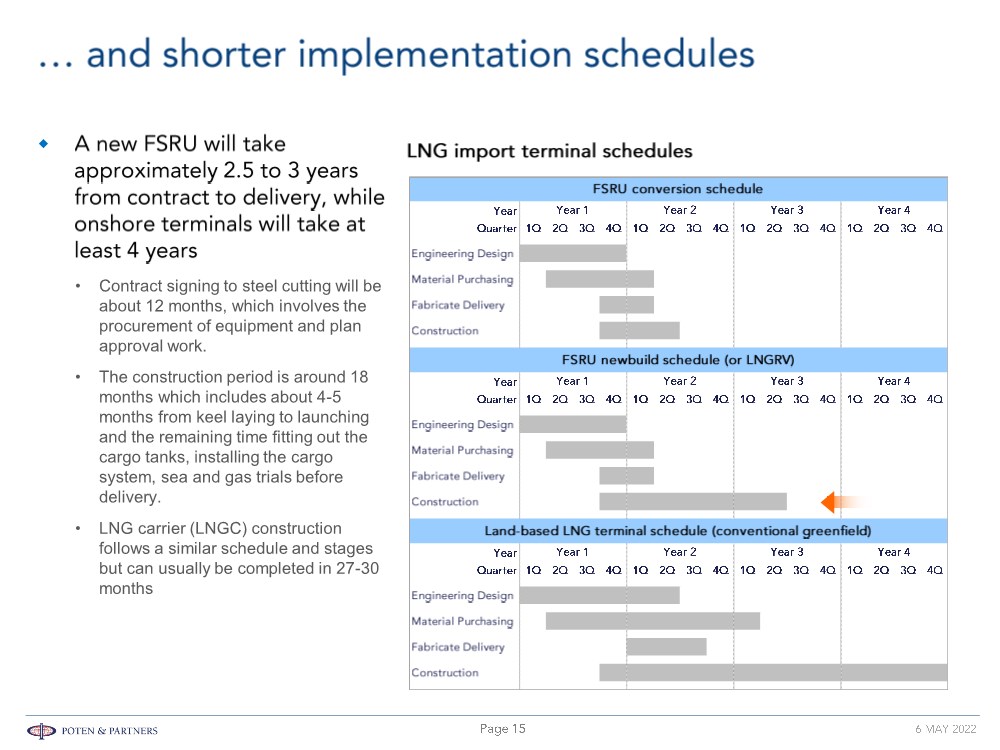
| © POTEN & PARTNERS 2009 CONFIDENTIAL • Contract signing to steel cutting will be about 12 months, which involves the procurement of equipment and plan approval work. • The construction period is around 18 months which includes about 4-5 months from keel laying to launching and the remaining time fitting out the cargo tanks, installing the cargo system, sea and gas trials before delivery. • LNG carrier (LNGC) construction follows a similar schedule and stages but can usually be completed in 27-30 months |
| © POTEN & PARTNERS 2009 CONFIDENTIAL |
| © POTEN & PARTNERS 2009 CONFIDENTIAL |
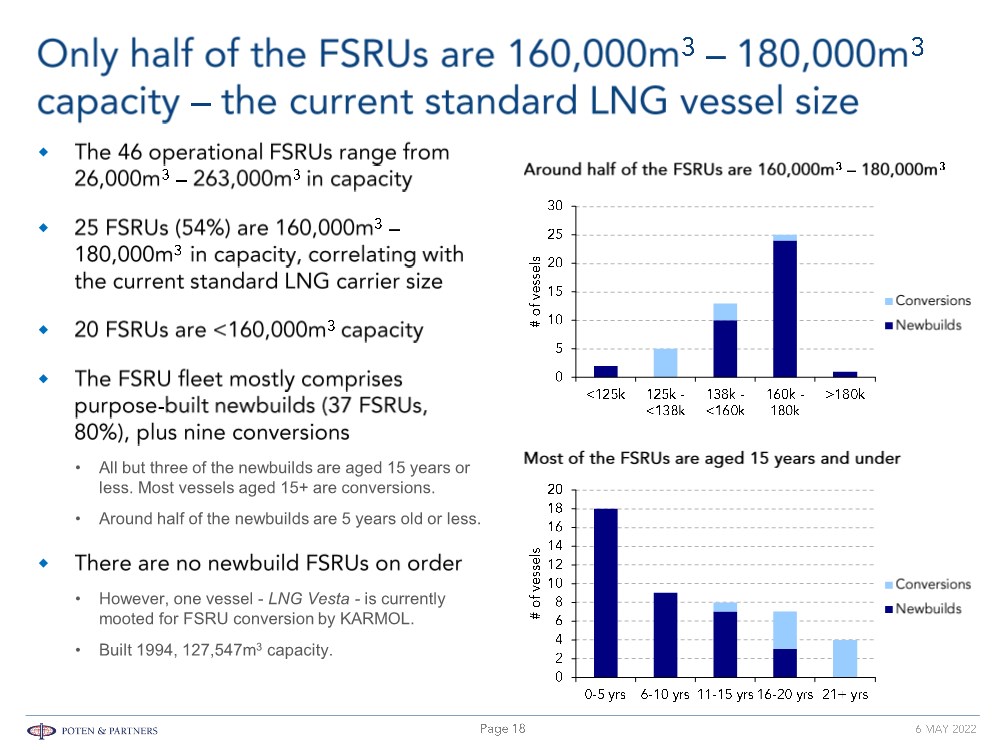
| © POTEN & PARTNERS 2009 CONFIDENTIAL • All but three of the newbuilds are aged 15 years or less. Most vessels aged 15+ are conversions. • Around half of the newbuilds are 5 years old or less. • However, one vessel - LNG Vesta - is currently mooted for FSRU conversion by KARMOL. • Built 1994, 127,547m3 capacity. |
| © POTEN & PARTNERS 2009 CONFIDENTIAL • Only one FSU, the 173,400m3 Bahrain Spirit, is a newbuild. The other five FSUs are conversions of older vessels; 125,000m3 – 130,000m3 in capacity. • The FRU is a 28,000m3 unit, Torman, owned by GasFin for the Tema LNG project in Ghana. • Owned by GTLK (Russian State Transport Leasing Company) and MOL; for Novatek’s transshipment operations for its Arctic 2 LNG project in Russia. • The vessels will be stationed at each of Bechevinskaya Bay in the Kamchatka Territory and Ura Bay at Murmansk. They will be used to reload LNG from ice-class ARC7 LNGCs to conventional LNGCs. • Koryak FSU is due to be delivered by the end of Q3 this year, while Saam FSU is due by the end of Q4. The first train for Arctic 2 LNG is due to start in 2023. • The FSUs have entered into bareboat charter agreements with Arctic Transshipment, a joint venture of Novatek and TotalEnergies. |
| © POTEN & PARTNERS 2009 CONFIDENTIAL |
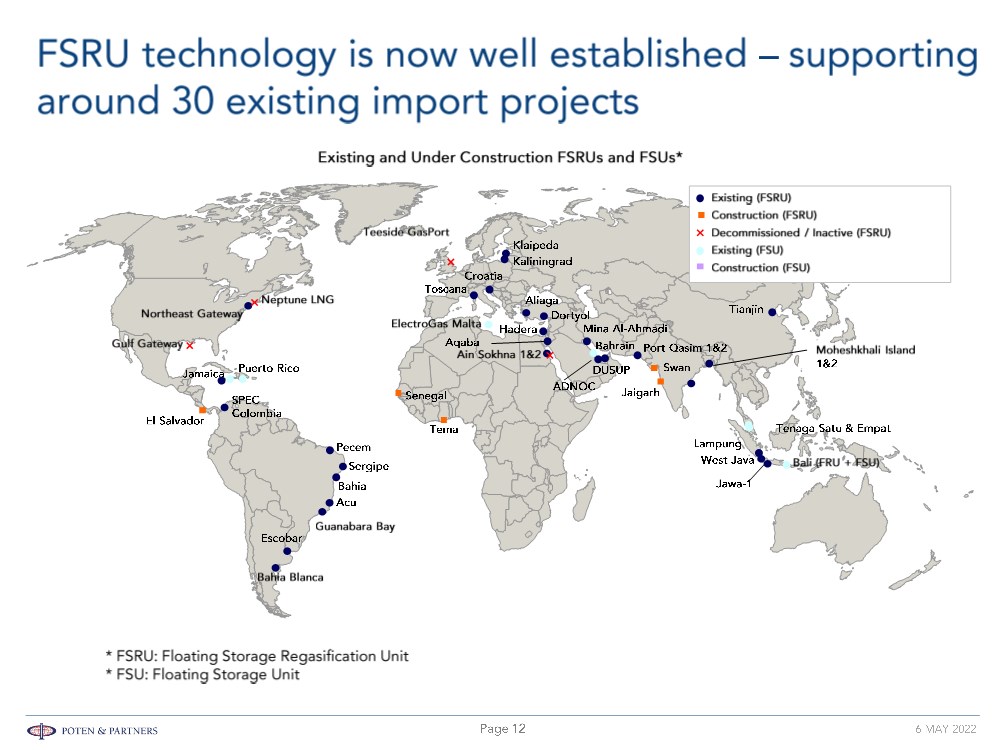
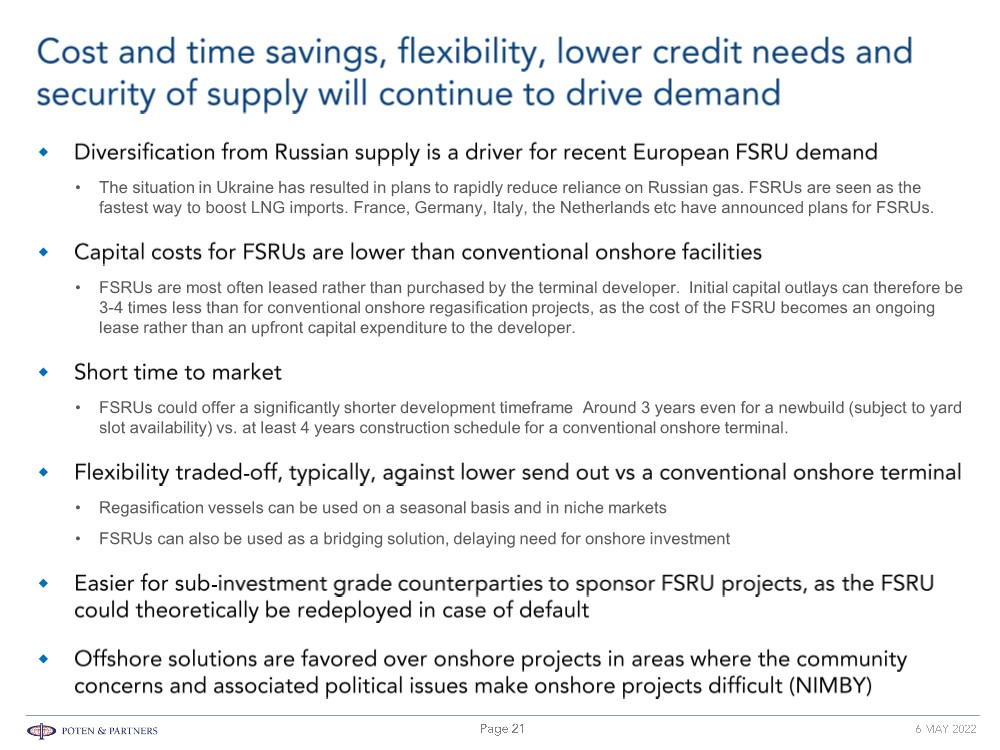
| © POTEN & PARTNERS 2009 CONFIDENTIAL • The situation in Ukraine has resulted in plans to rapidly reduce reliance on Russian gas. FSRUs are seen as the fastest way to boost LNG imports. France, Germany, Italy, the Netherlands etc have announced plans for FSRUs. • FSRUs are most often leased rather than purchased by the terminal developer. Initial capital outlays can therefore be 3-4 times less than for conventional onshore regasification projects, as the cost of the FSRU becomes an ongoing lease rather than an upfront capital expenditure to the developer. • FSRUs could offer a significantly shorter development timeframe Around 3 years even for a newbuild (subject to yard slot availability) vs. at least 4 years construction schedule for a conventional onshore terminal. • Regasification vessels can be used on a seasonal basis and in niche markets • FSRUs can also be used as a bridging solution, delaying need for onshore investment |
| © POTEN & PARTNERS 2009 CONFIDENTIAL |
| © POTEN & PARTNERS 2009 CONFIDENTIAL |
| © POTEN & PARTNERS 2009 CONFIDENTIAL |
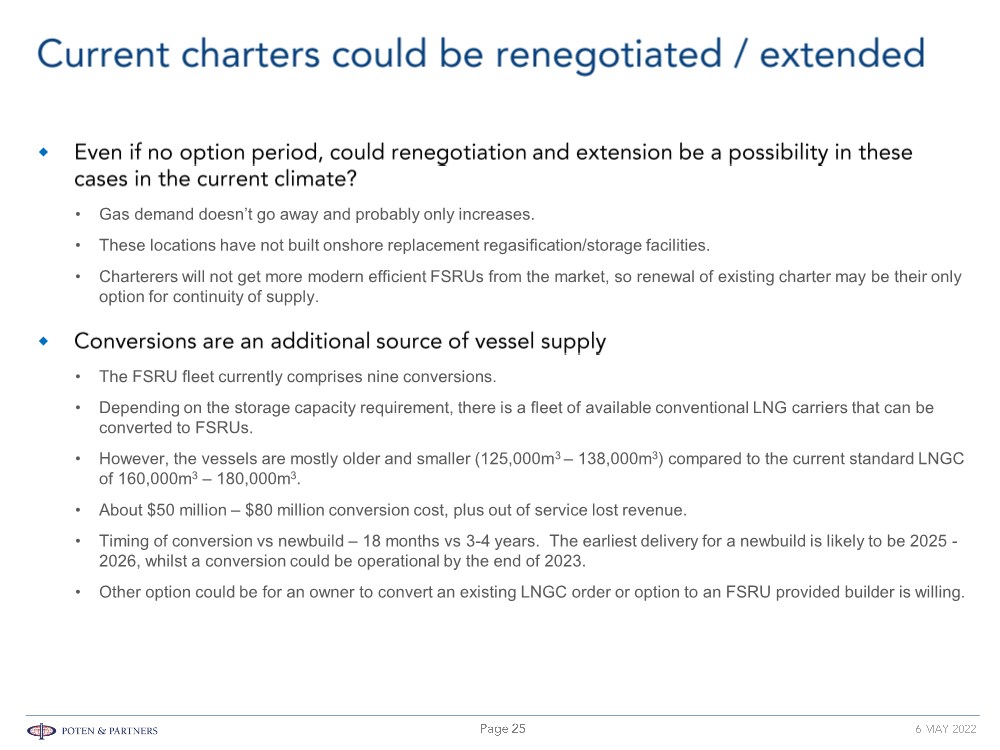
| © POTEN & PARTNERS 2009 CONFIDENTIAL • Gas demand doesn’t go away and probably only increases. • These locations have not built onshore replacement regasification/storage facilities. • Charterers will not get more modern efficient FSRUs from the market, so renewal of existing charter may be their only option for continuity of supply. • The FSRU fleet currently comprises nine conversions. • Depending on the storage capacity requirement, there is a fleet of available conventional LNG carriers that can be converted to FSRUs. • However, the vessels are mostly older and smaller (125,000m3 – 138,000m3) compared to the current standard LNGC of 160,000m3 – 180,000m3. • About $50 million – $80 million conversion cost, plus out of service lost revenue. • Timing of conversion vs newbuild – 18 months vs 3-4 years. The earliest delivery for a newbuild is likely to be 2025 - 2026, whilst a conversion could be operational by the end of 2023. • Other option could be for an owner to convert an existing LNGC order or option to an FSRU provided builder is willing. |
| © POTEN & PARTNERS 2009 CONFIDENTIAL |

| © POTEN & PARTNERS 2009 CONFIDENTIAL |
| © POTEN & PARTNERS 2009 CONFIDENTIAL • 2020 demand of 357 MMt was slightly lower than in 2019, the first decline in demand since 2013. • The Covid-19 pandemic negatively impacted LNG growth in 2020 – we were anticipating around 372 MMt pre-Covid. • The warm winter of 2019-20 in North Asia was the second in a row. By summer Europe could not absorb the surplus. • The oil price war and oversupply of LNG drove spot LNG prices to record lows, below US variable costs. • US supply was curtailed by as much as 75% as offtakers canceled cargoes. • Demand recovered in the second half of the year, causing prices to recover. • In Australia, Gorgon and Prelude faced extended partial or full shutdowns to correct operating problems. • Hurricanes Laura and Delta in the US Gulf interrupted deliveries from Cameron and Sabine. • Fire at Snohvit in Norway – supply is not expected to restart until May 2022. |
| © POTEN & PARTNERS 2009 CONFIDENTIAL |
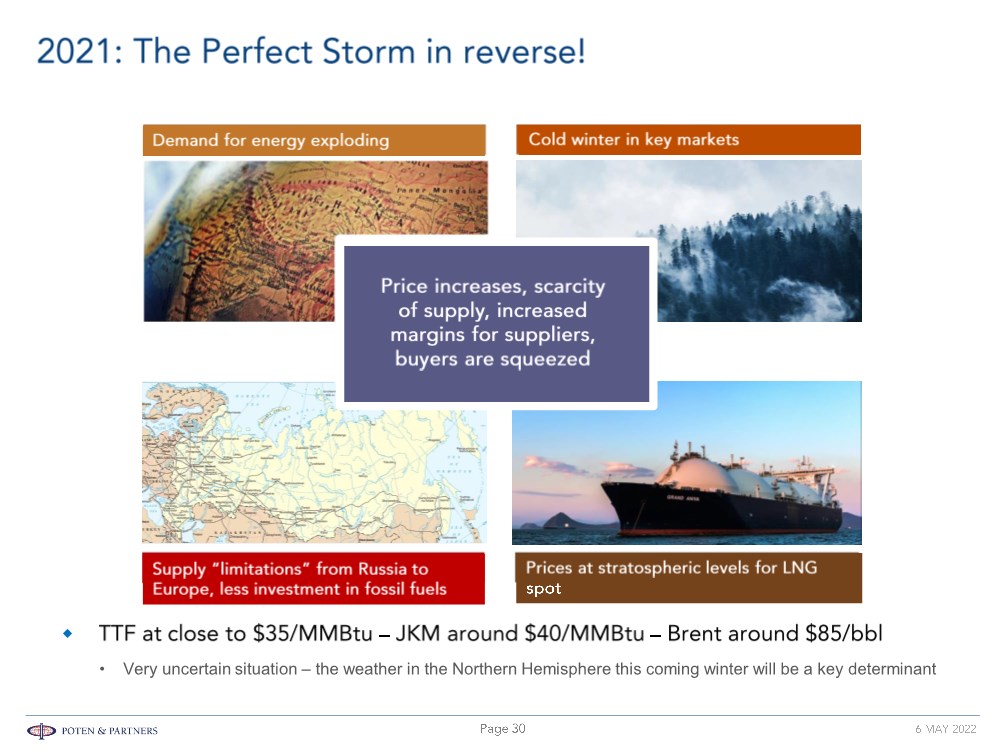
| © POTEN & PARTNERS 2009 CONFIDENTIAL • Very uncertain situation – the weather in the Northern Hemisphere this coming winter will be a key determinant |
| © POTEN & PARTNERS 2009 CONFIDENTIAL • Carbon neutral LNG cargoes became the flavor of the day, but is this sustainable economically? • IMO shipping regulations - will place further pressure on Steam Turbine vessels, potentially impacting global fleet. • Qatar has emerged as a key incremental supplier of LNG this decade – as other LNG supply regions struggle. • US and Canadian projects have found it more difficult to secure buyers, raise financing, and pass environmental hurdles - particularly in the case of Canadian projects. However, pre-FID US projects are gaining new impetus (and long-term sales) as a result of the unexpectedly strong demand rebound and resulting price environment. • Delays in Mozambique due to precarious security situation – Qatar start-ups may temper the market impact of Mozambique delays - if short lived. Papua New Guinea projects delay as government wanted larger share of revenues. • Asian LNG markets have recovered post-Covid and sustained aggressive global growth. • Both Atlantic and Pacific (TTF, JKM) spot prices closed out the year at >$30/MMBtu and US Gulf LNG production was producing at maximum as a result, with extremely high margins on offer. – Prices were surprisingly strong even during shoulder and summer months (driven by high oil prices, cold winter in Asia, and strong economic recovery post pandemic). |
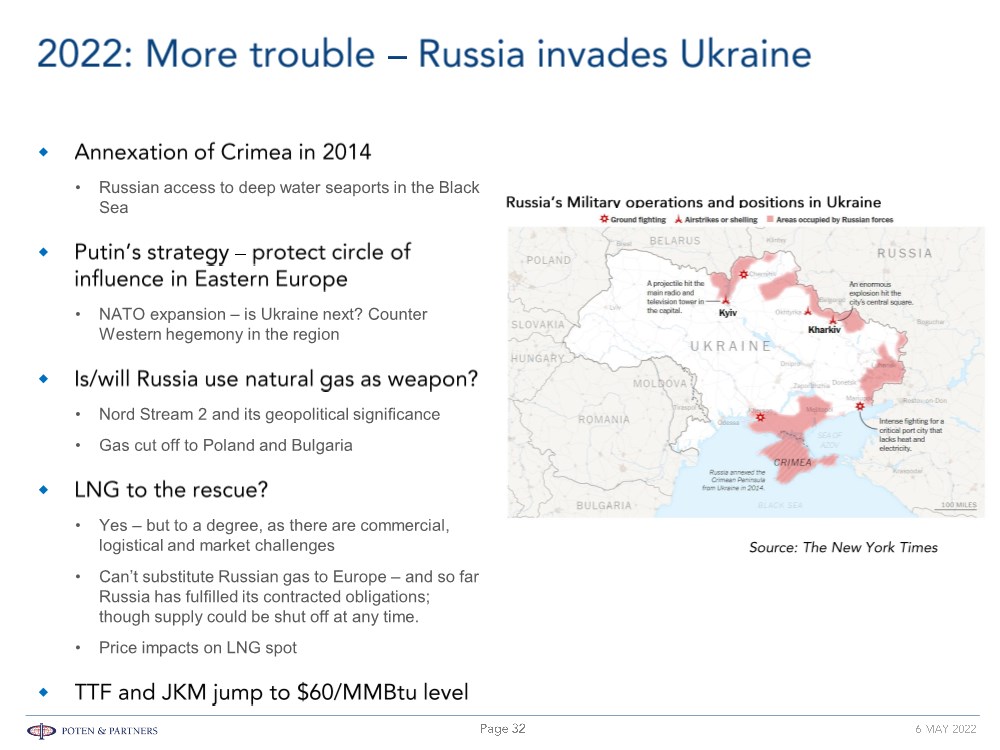
| © POTEN & PARTNERS 2009 CONFIDENTIAL • Russian access to deep water seaports in the Black Sea • NATO expansion – is Ukraine next? Counter Western hegemony in the region • Nord Stream 2 and its geopolitical significance • Gas cut off to Poland and Bulgaria • Yes – but to a degree, as there are commercial, logistical and market challenges • Can’t substitute Russian gas to Europe – and so far Russia has fulfilled its contracted obligations; though supply could be shut off at any time. • Price impacts on LNG spot |
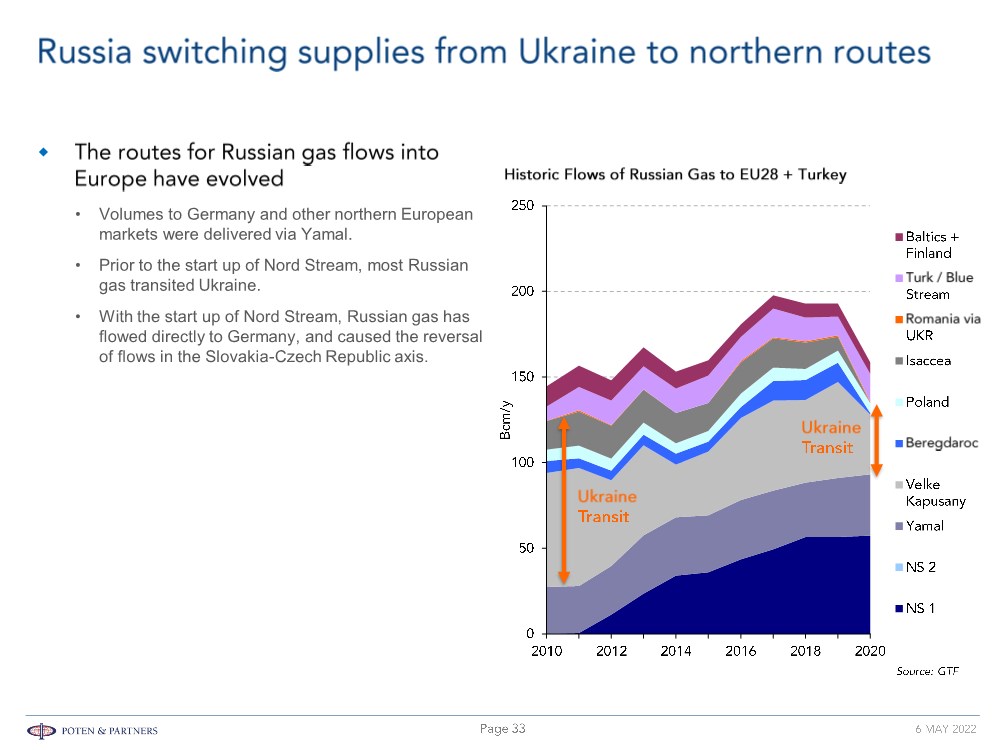
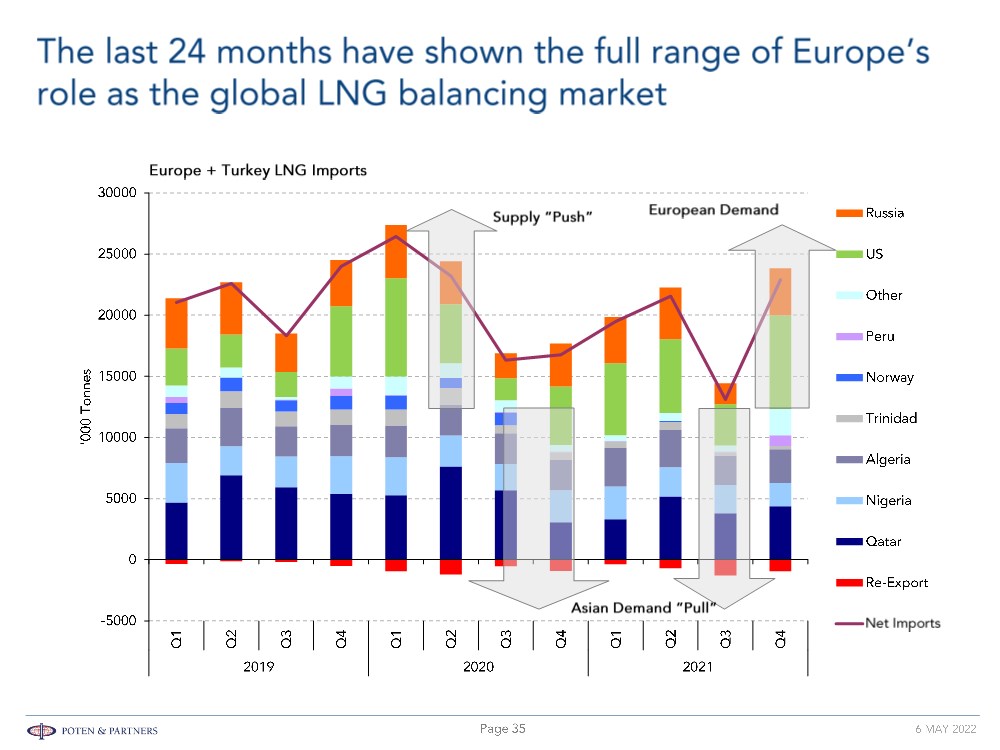
| © POTEN & PARTNERS 2009 CONFIDENTIAL • Volumes to Germany and other northern European markets were delivered via Yamal. • Prior to the start up of Nord Stream, most Russian gas transited Ukraine. • With the start up of Nord Stream, Russian gas has flowed directly to Germany, and caused the reversal of flows in the Slovakia-Czech Republic axis. |
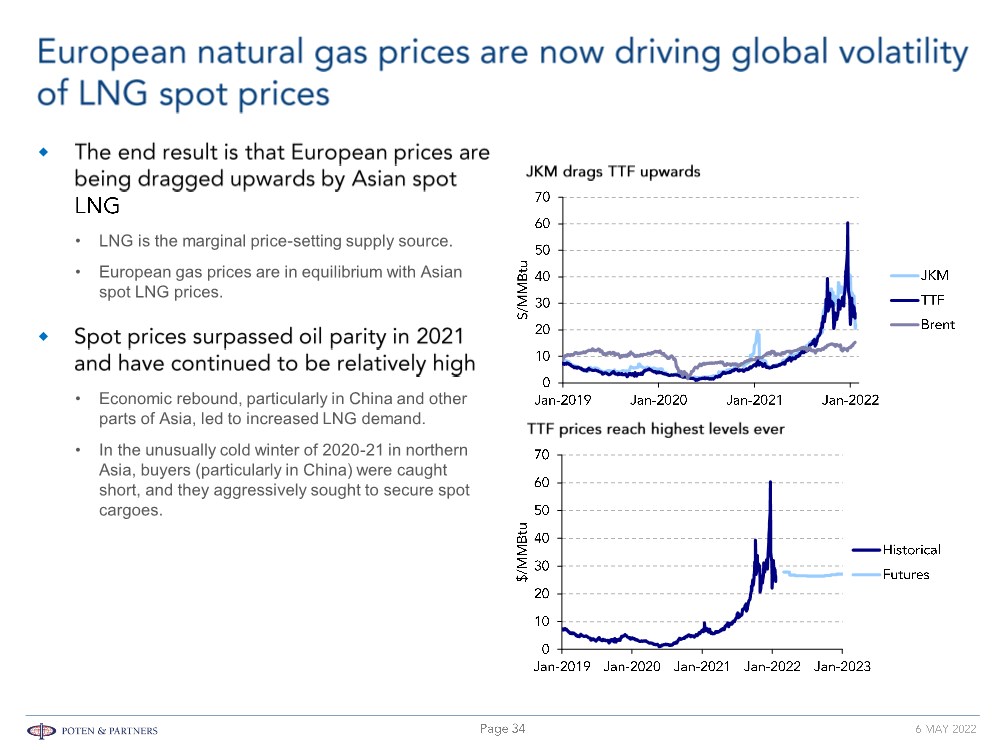
| © POTEN & PARTNERS 2009 CONFIDENTIAL • LNG is the marginal price-setting supply source. • European gas prices are in equilibrium with Asian spot LNG prices. • Economic rebound, particularly in China and other parts of Asia, led to increased LNG demand. • In the unusually cold winter of 2020-21 in northern Asia, buyers (particularly in China) were caught short, and they aggressively sought to secure spot cargoes. |
| © POTEN & PARTNERS 2009 CONFIDENTIAL |
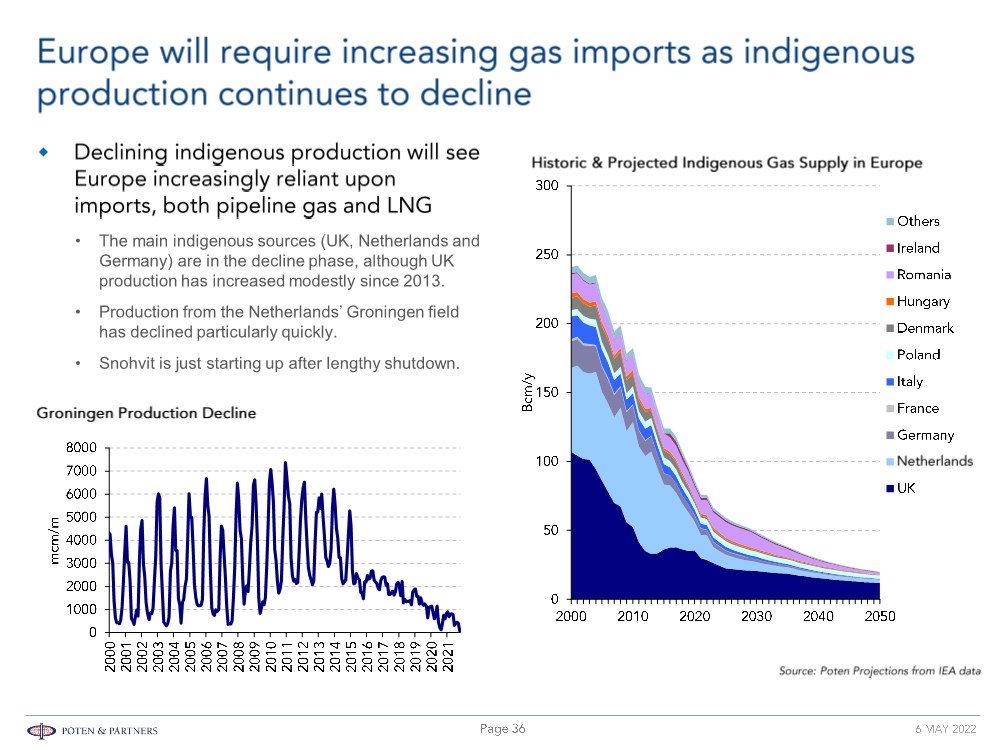
| © POTEN & PARTNERS 2009 CONFIDENTIAL • The main indigenous sources (UK, Netherlands and Germany) are in the decline phase, although UK production has increased modestly since 2013. • Production from the Netherlands’ Groningen field has declined particularly quickly. • Snohvit is just starting up after lengthy shutdown. |
| © POTEN & PARTNERS 2009 CONFIDENTIAL |
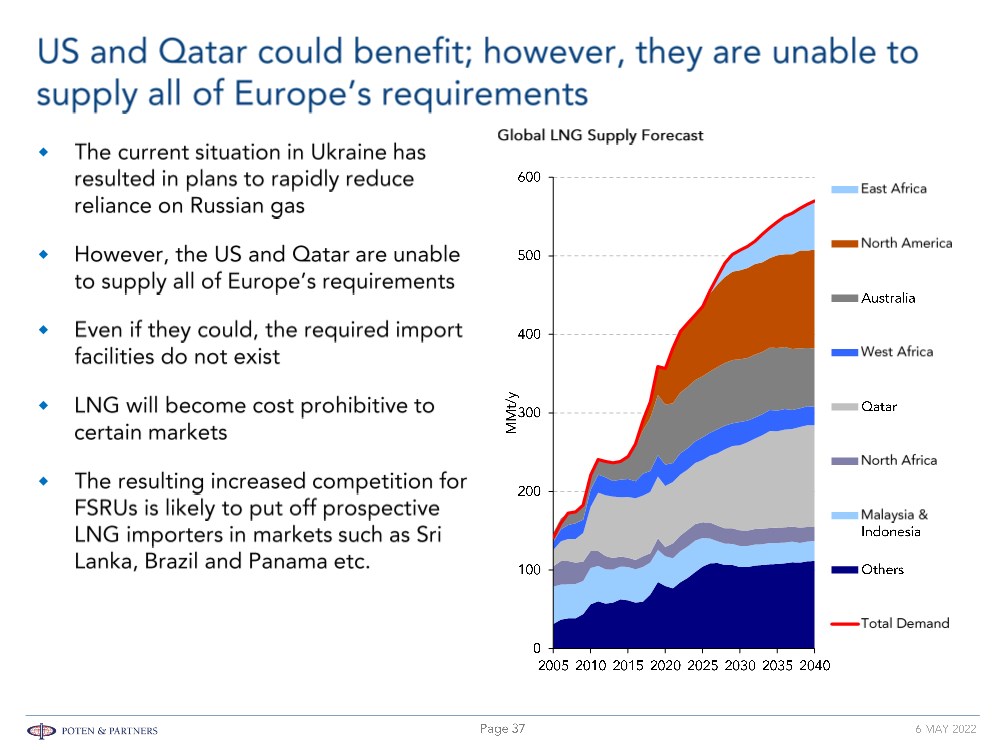
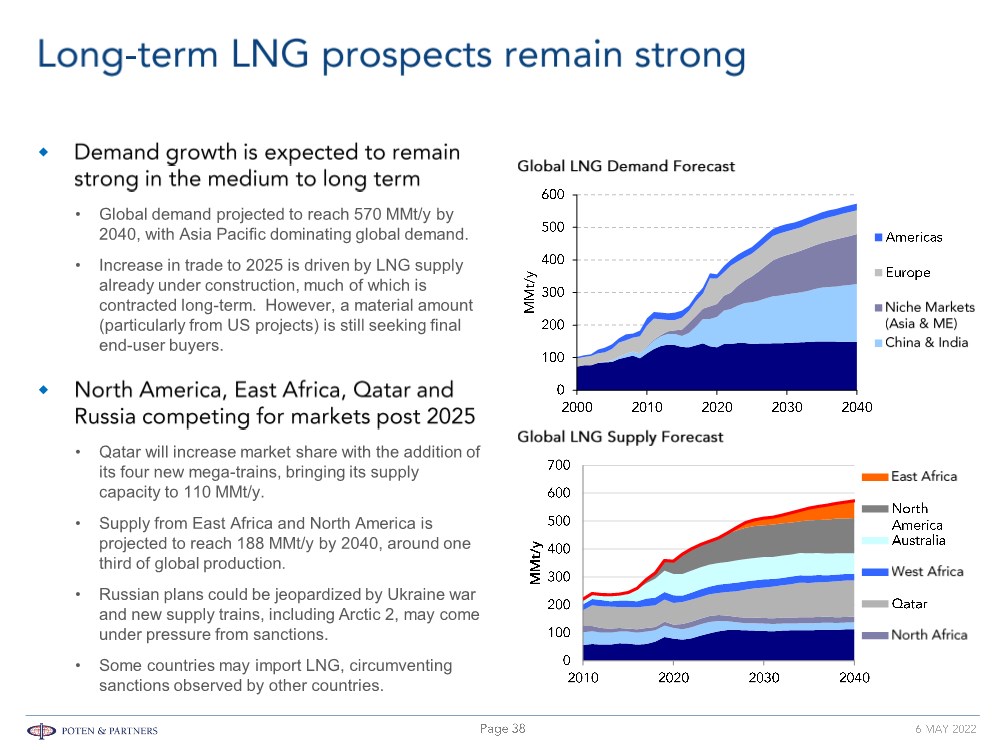
| © POTEN & PARTNERS 2009 CONFIDENTIAL • Global demand projected to reach 570 MMt/y by 2040, with Asia Pacific dominating global demand. • Increase in trade to 2025 is driven by LNG supply already under construction, much of which is contracted long-term. However, a material amount (particularly from US projects) is still seeking final end-user buyers. • Qatar will increase market share with the addition of its four new mega-trains, bringing its supply capacity to 110 MMt/y. • Supply from East Africa and North America is projected to reach 188 MMt/y by 2040, around one third of global production. • Russian plans could be jeopardized by Ukraine war and new supply trains, including Arctic 2, may come under pressure from sanctions. • Some countries may import LNG, circumventing sanctions observed by other countries. |
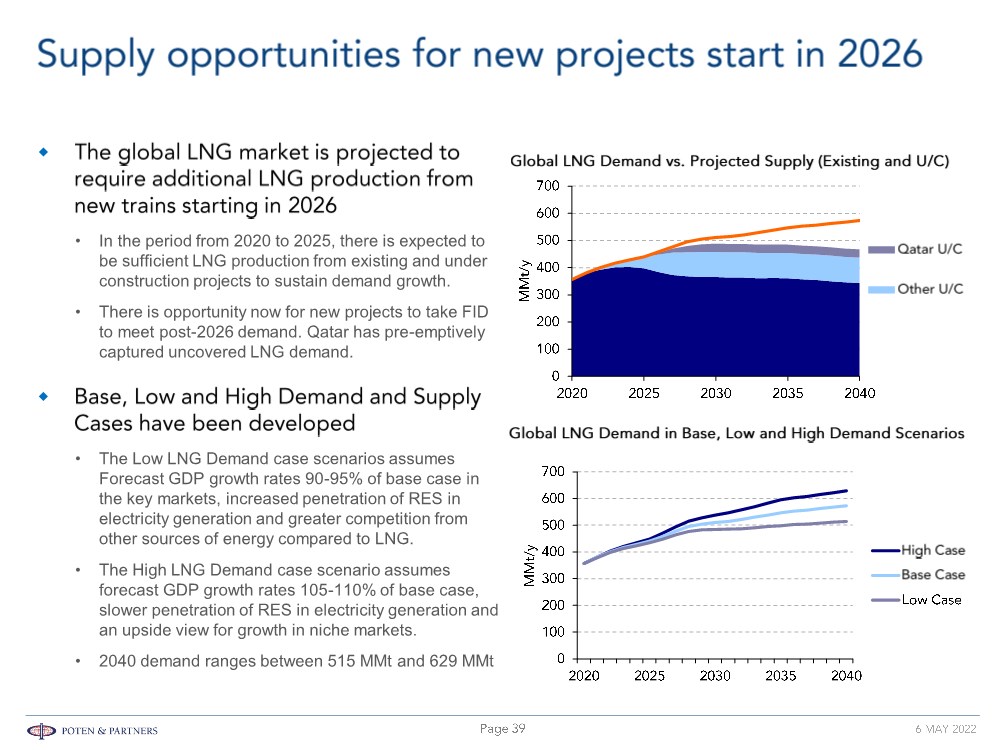
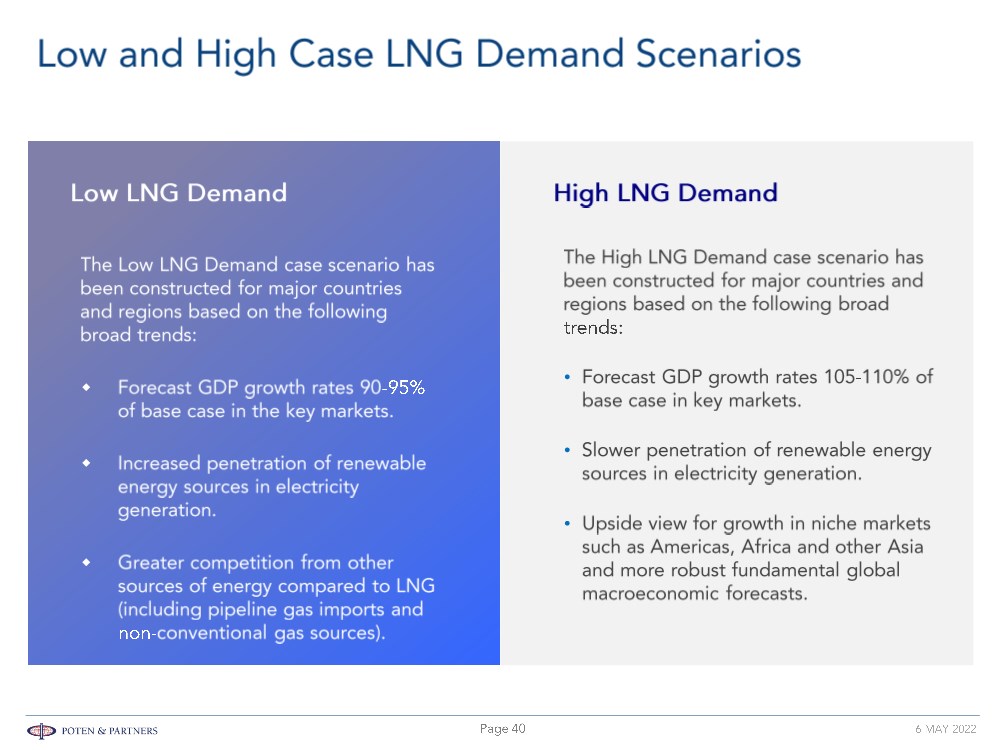
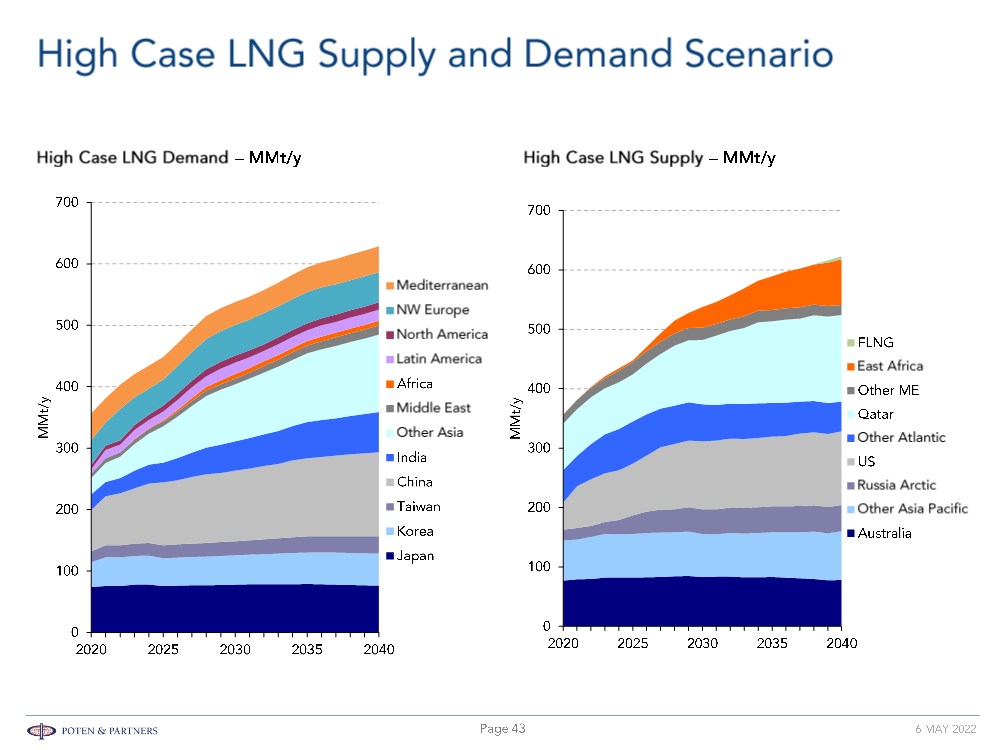
| © POTEN & PARTNERS 2009 CONFIDENTIAL • In the period from 2020 to 2025, there is expected to be sufficient LNG production from existing and under construction projects to sustain demand growth. • There is opportunity now for new projects to take FID to meet post-2026 demand. Qatar has pre-emptively captured uncovered LNG demand. • The Low LNG Demand case scenarios assumes Forecast GDP growth rates 90-95% of base case in the key markets, increased penetration of RES in electricity generation and greater competition from other sources of energy compared to LNG. • The High LNG Demand case scenario assumes forecast GDP growth rates 105-110% of base case, slower penetration of RES in electricity generation and an upside view for growth in niche markets. • 2040 demand ranges between 515 MMt and 629 MMt |
| © POTEN & PARTNERS 2009 CONFIDENTIAL • • • |
| © POTEN & PARTNERS 2009 CONFIDENTIAL |
| © POTEN & PARTNERS 2009 CONFIDENTIAL |
| © POTEN & PARTNERS 2009 CONFIDENTIAL |
| © POTEN & PARTNERS 2009 CONFIDENTIAL • Strong economic growth and increased electrification drives demand. FSRUs are well positioned to meet import growth requirements. • Renewable penetration and increased domestic production will eventually limit LNG imports. • FSRU utilisation increases during drought years. |
| © POTEN & PARTNERS 2009 CONFIDENTIAL • LNG carriers and FSRUs are built with a 40-year design life based on North Atlantic weather conditions. • Older FSRUs tended to come with smaller storage capacity. Also, it was mainly the older Moss-type ships, with storage capacities less than 138,000 m3 that were converted into FSRUs. • The average size of new LNG carriers is 175,000m3. This means that the LNG carrier would have to stay docked for longer periods of time to offload or deliver a partial load. Also, it reduces options to redeploy as an LNG carrier. • Smaller storage availability also reduces buffer and increases risks of running short of LNG in case an LNG carrier is delayed in-route. Many projects/countries have opted for larger FSRUs in order to increase security of supply, a recent example being Pakistan. • In addition, boil-off-rate and power generation efficiency are worse for these older ships. |
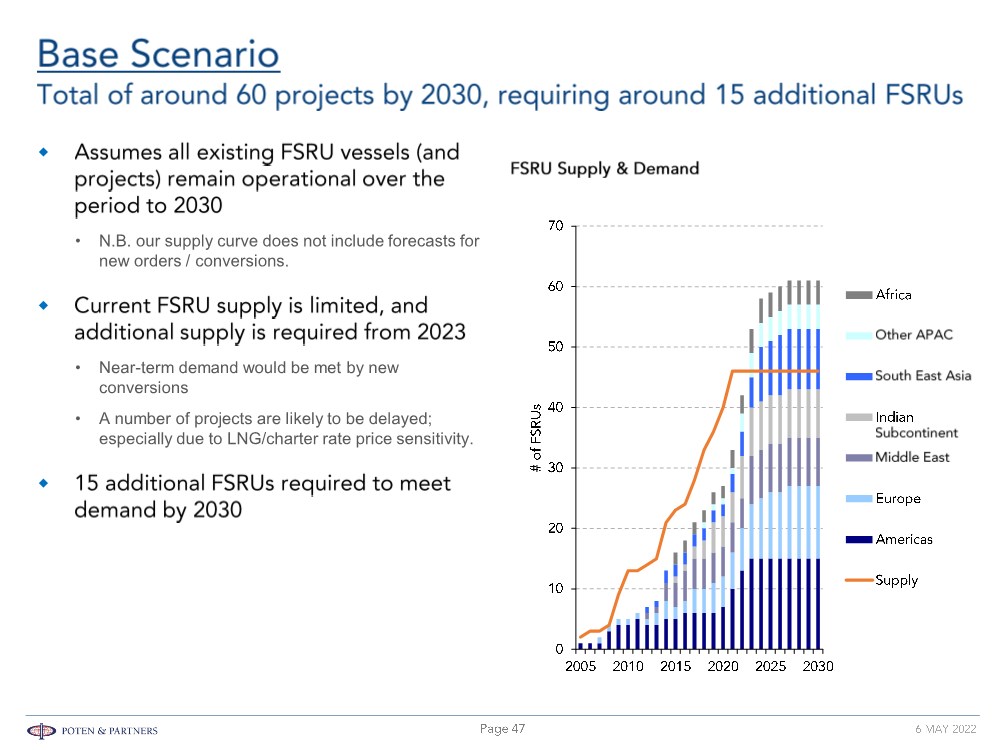
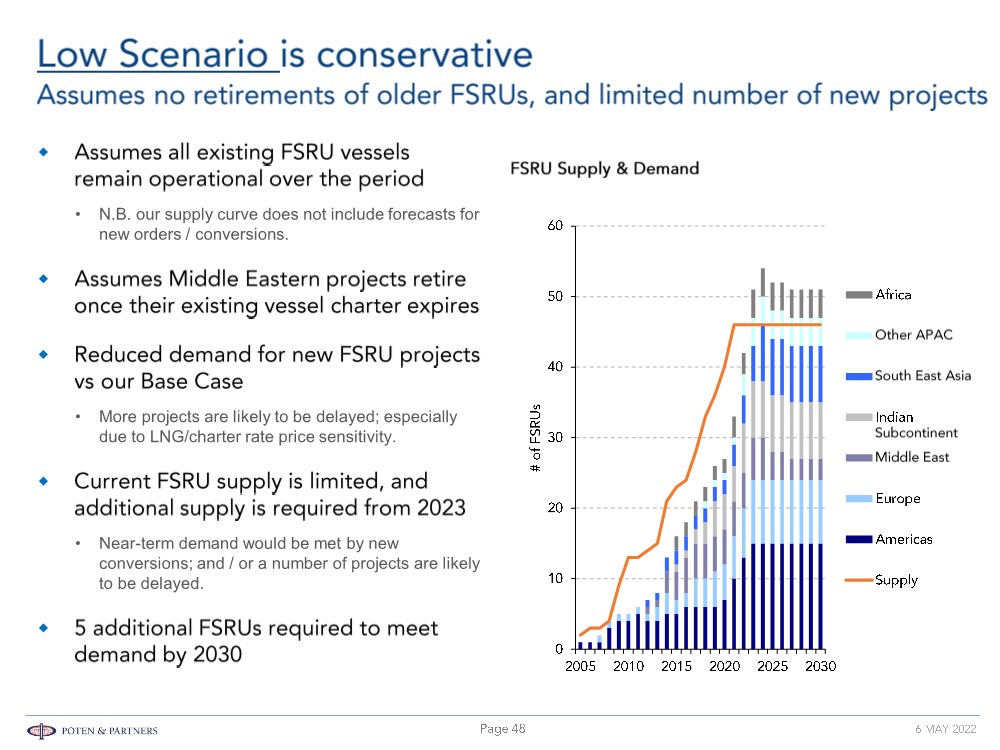
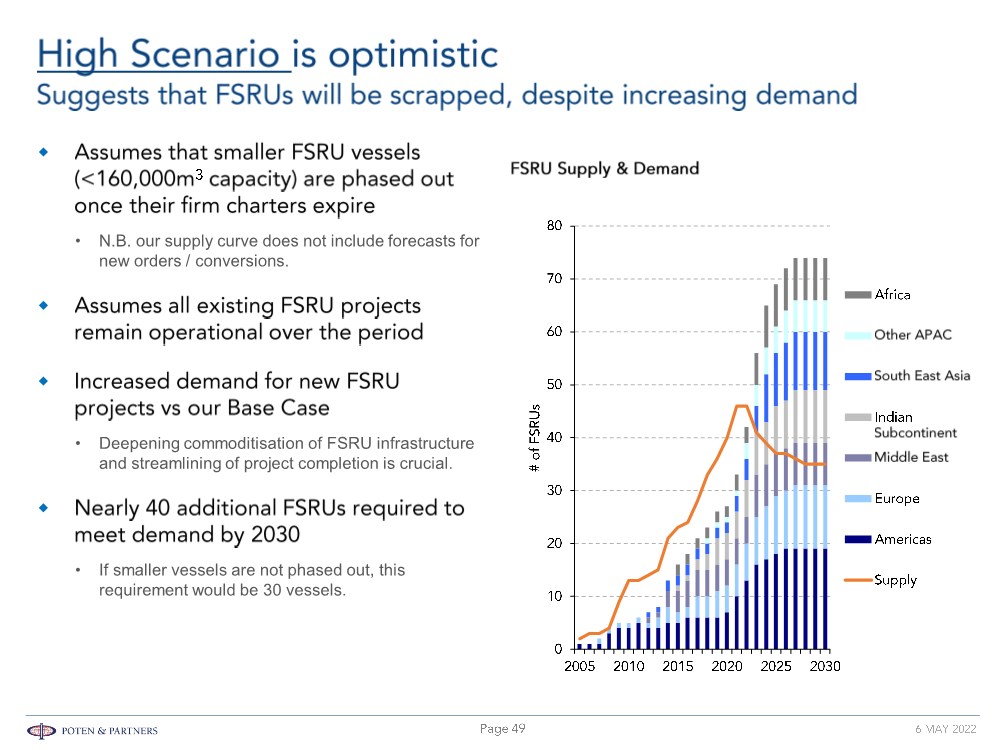
| © POTEN & PARTNERS 2009 CONFIDENTIAL • Base Scenario: assuming our Base Case demand for FSRUs, matched against our current FSRU supply picture (both existing and in the orderbook). • Low Scenario: assuming a conservative demand for FSRUs, matched against our current FSRU supply picture – but assuming no FSRU retirements. This case reflects a world where the older, smaller FSRUs can still compete for smaller, price sensitive markets – despite the logistical difficulties of limited storage capacity. • High Scenario: assuming a higher demand for FSRUs, matched against our current FSRU supply picture (both existing and in the orderbook) – assuming gradual retirements of the older, smaller FSRUs. This is a more bullish view for FSRU providers, particularly for the ones with a more modern fleet. • When the demand crosses availability of existing FSRUs, the implication is that a new FSRU would have to be ordered from a shipyard to meet the requirement or be converted from an existing LNGC. • It is too difficult at the moment to make any realistic forecasts beyond 2030 as current climate is too uncertain – too many variables which are outside normal forecasting parameters. |
| © POTEN & PARTNERS 2009 CONFIDENTIAL • N.B. our supply curve does not include forecasts for new orders / conversions. • Near-term demand would be met by new conversions • A number of projects are likely to be delayed; especially due to LNG/charter rate price sensitivity. |
| © POTEN & PARTNERS 2009 CONFIDENTIAL • N.B. our supply curve does not include forecasts for new orders / conversions. • More projects are likely to be delayed; especially due to LNG/charter rate price sensitivity. • Near-term demand would be met by new conversions; and / or a number of projects are likely to be delayed. |
| © POTEN & PARTNERS 2009 CONFIDENTIAL • N.B. our supply curve does not include forecasts for new orders / conversions. • Deepening commoditisation of FSRU infrastructure and streamlining of project completion is crucial. • If smaller vessels are not phased out, this requirement would be 30 vessels. |
| © POTEN & PARTNERS 2009 CONFIDENTIAL |
| © POTEN & PARTNERS 2009 CONFIDENTIAL • • • • • • • • • • • • • • • • • • |
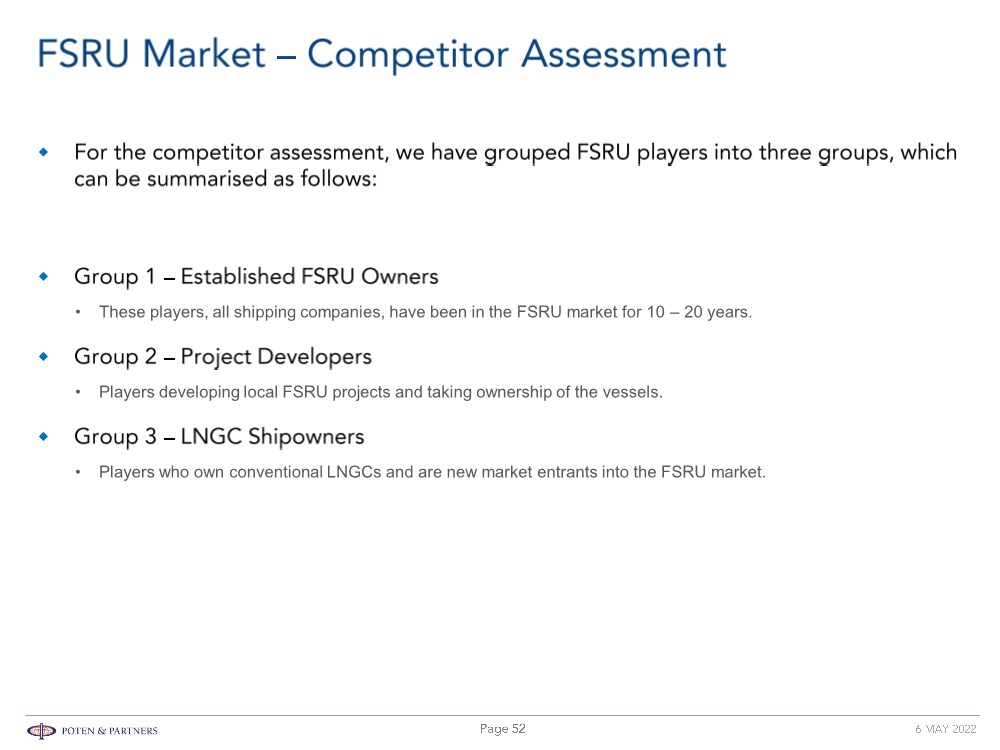
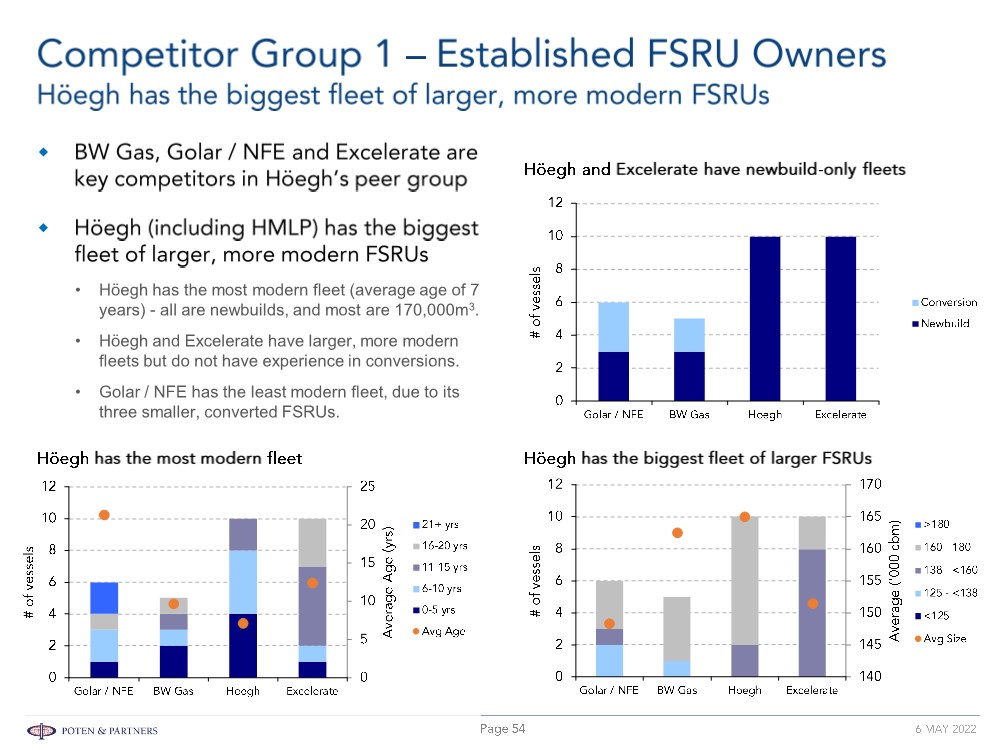
| © POTEN & PARTNERS 2009 CONFIDENTIAL • These players, all shipping companies, have been in the FSRU market for 10 – 20 years. • Players developing local FSRU projects and taking ownership of the vessels. • Players who own conventional LNGCs and are new market entrants into the FSRU market. |
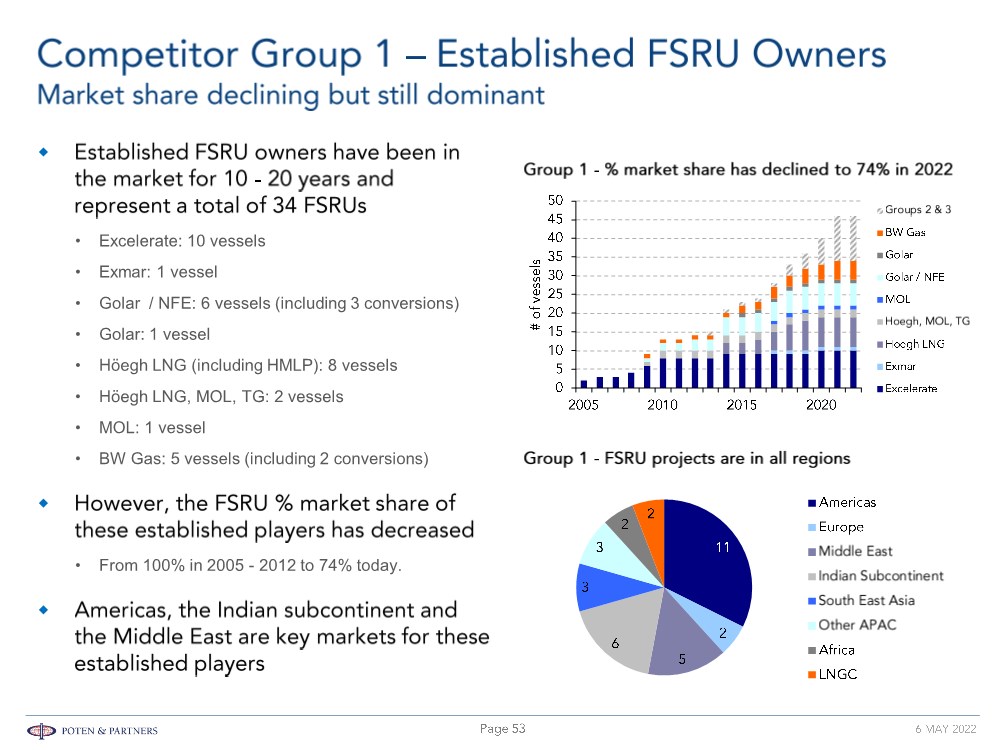
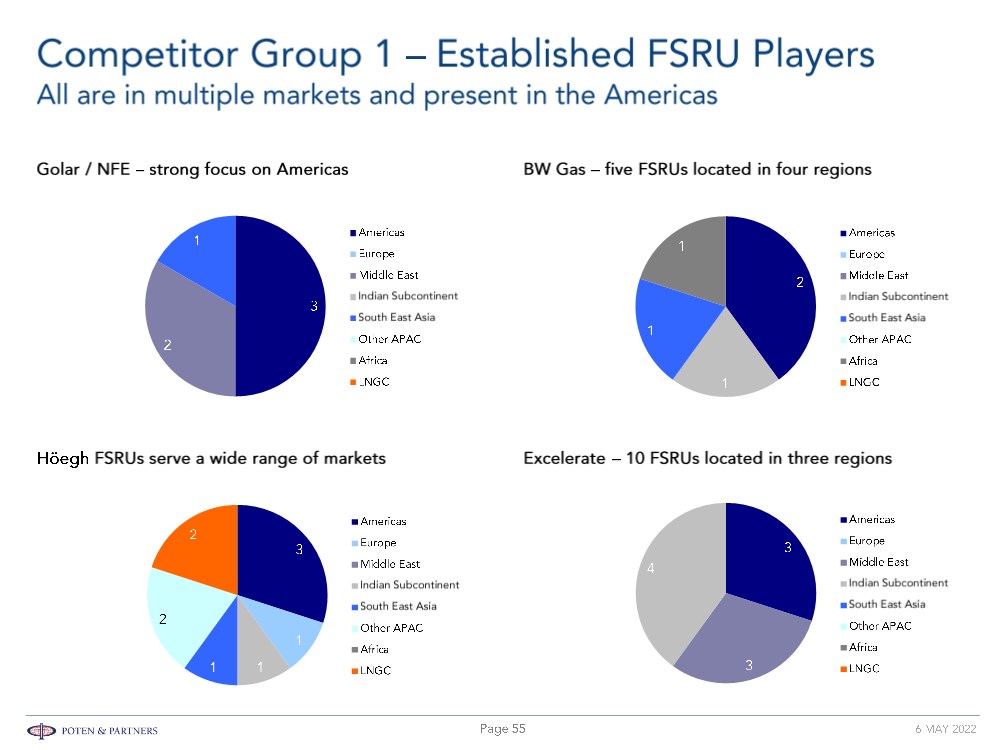
| © POTEN & PARTNERS 2009 CONFIDENTIAL • Excelerate: 10 vessels • Exmar: 1 vessel • Golar / NFE: 6 vessels (including 3 conversions) • Golar: 1 vessel • Höegh LNG (including HMLP): 8 vessels • Höegh LNG, MOL, TG: 2 vessels • MOL: 1 vessel • BW Gas: 5 vessels (including 2 conversions) • From 100% in 2005 - 2012 to 74% today. |
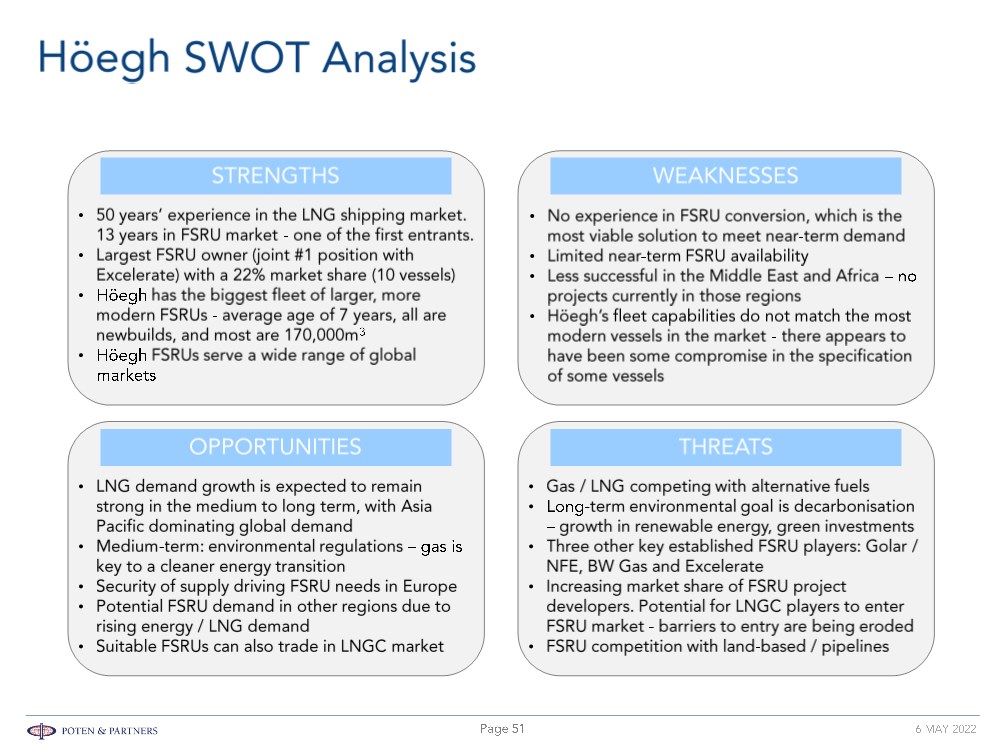
| © POTEN & PARTNERS 2009 CONFIDENTIAL • Höegh has the most modern fleet (average age of 7 years) - all are newbuilds, and most are 170,000m3. • Höegh and Excelerate have larger, more modern fleets but do not have experience in conversions. • Golar / NFE has the least modern fleet, due to its three smaller, converted FSRUs. |
| © POTEN & PARTNERS 2009 CONFIDENTIAL |
| © POTEN & PARTNERS 2009 CONFIDENTIAL • A converted FSRU, stationed in Italy. • Gazprom – Newbuild in Russia, delivered 2018 • Jaya Samudra Karunia – Small-scale newbuild, to be stationed in Indonesia, delivered in 2018 • Kolin / Kalyon – Newbuild in Turkey, delivered 2019 • BOTAS – Newbuild in Turkey, delivered 2020 • LNG Hrvatska – Conversion in Croatia, built 2020 • Swan Energy – Newbuild in India, delivered 2020 • Jawa Satu Power – Newbuild in Indonesia, 2021 • Two converted FSRUs, built in 2021; for LNG to power projects in Senegal and Mozambique. • Only employs FSRUs with its power barges. |
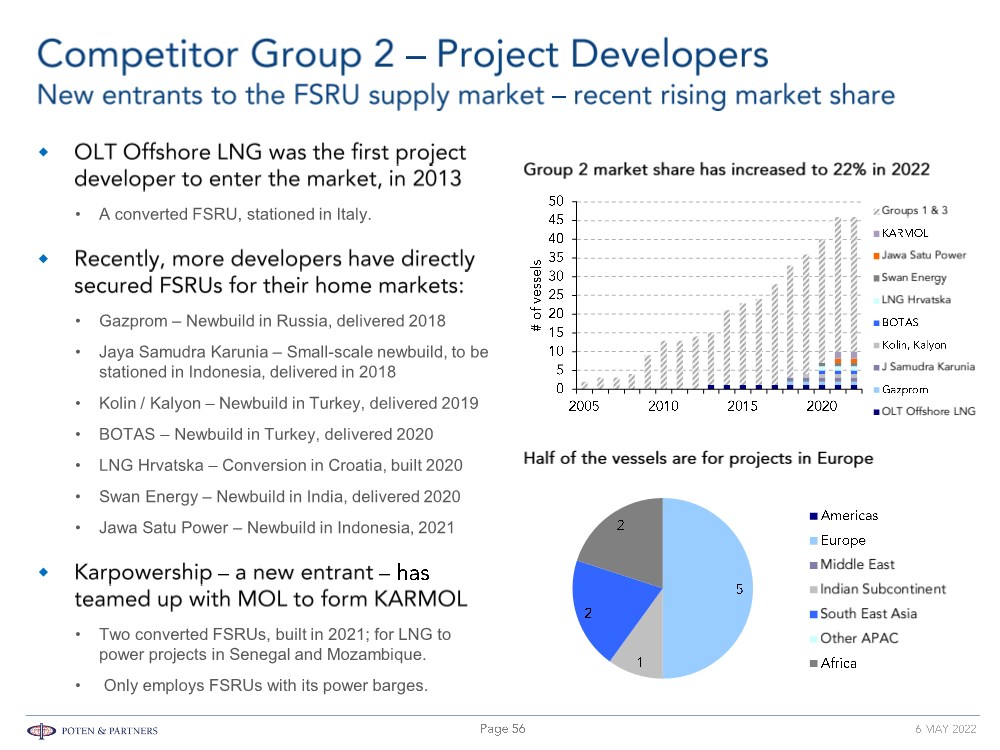
| © POTEN & PARTNERS 2009 CONFIDENTIAL • Reduced barriers to entry in terms of price and wider LNG experience across the industry; often driven by local companies / entrepreneurs. • However, by doing it themselves, they have to employ greater amount of up-front capital in securing the FSRU – it would normally be OPEX for the charter payments. • Most of the activity has been in Europe – Italy, Russia, Turkey and Croatia. |

| © POTEN & PARTNERS 2009 CONFIDENTIAL • Maran Gas is a Greek LNG ship owner / operator established in 2003. Its first LNG vessels were delivered in 2005. • Maran Gas owns a total of 53 LNG vessels, including 10 vessels currently under construction. – This total includes 19 operational conventional LNGCs co-owned with Nakilat. • Excelerate signed a five-year bareboat charter with Maran Gas for a 173,400m3 newbuild FSRU, Excelerate Sequoia, delivered in 2020. The agreement gives Excelerate the option to buy the vessel during the charter. – Excelerate Technical Management provides ship management for the vessel. • Excelerate Sequoia can operate as a trading LNGC or an FSRU. It is currently operating as an FSRU in Bahia, Brazil. • Dynagas is a Greek LNG ship owner / operator established in 2004. Its first LNG vessels were delivered in 2007. • Dynagas owns a total of 23 LNG vessels, including five vessels currently under construction. – This total includes five operational Arc-7 ice class vessels, and two operational FSRUs. – The other 16 vessels are conventional LNG carriers. • Dynagas took delivery of two 174,000m3 FSRU newbuilds: Transgas Power and Transgas Force. • Both vessels have been operating as conventional LNG carriers since delivery last year. However, both vessels have recently (March 2022) entered charter deals for German FSRU projects. • These speculative orders were driven by Dynagas’ bullish view of the FSRU market. The vessels were specifically designed to also be able to operate as LNGCs. |
| © POTEN & PARTNERS 2009 CONFIDENTIAL • Such players may be able to offer cargoes to support their move into infrastructure. • However, not “too speculative” - a more conservative approach compared to conventional LNG carriers. |
| © POTEN & PARTNERS 2009 CONFIDENTIAL • Owners do not typically contract for multiple FSRUs on a speculative basis. • Based on a 3-year contract to delivery schedule, established owners are likely to have one FSRU on speculative build at any time against the prospect of being able to place it in a project. • Cost of FSRU is $40million - $50 million more than an equivalent sized LNGC so more “calculated” speculation that vessel will get placed if built. • Owner does not really want to have to trade in LNGC market and get lower return in early life of vessel. • Once past the feasibility stage, many FSRU projects come close, but can fail to develop for various reasons. • Estimated that the success rate (i.e., getting to a signed charter party agreement) is worse than 1 in 4 projects due to competition and “project failure”. |
| © POTEN & PARTNERS 2009 CONFIDENTIAL |
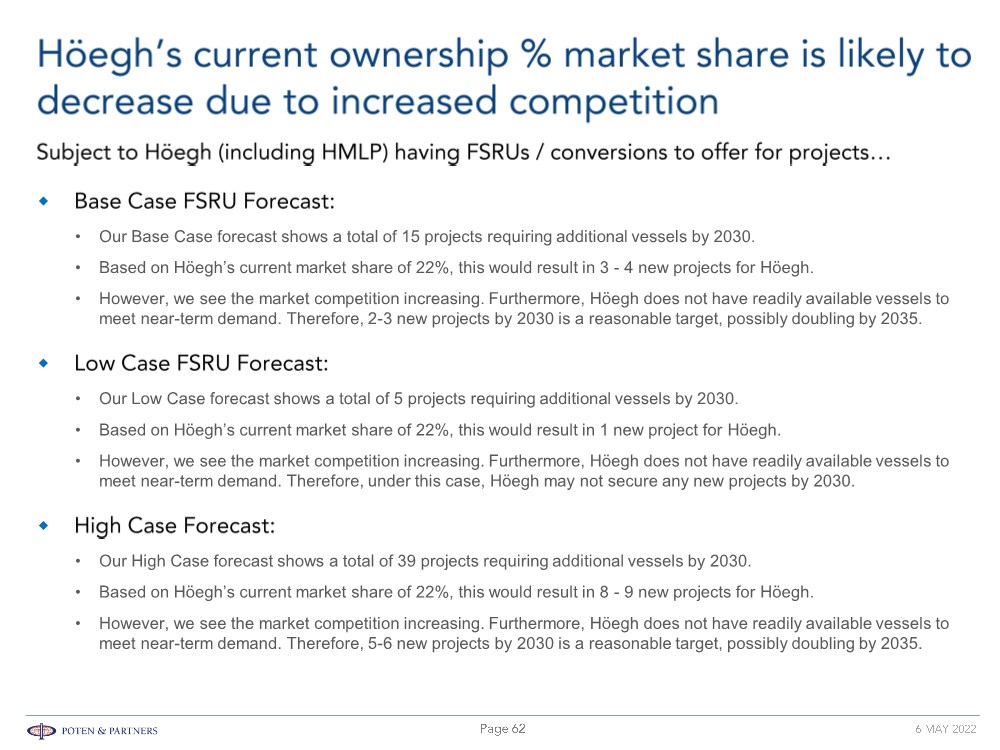
| © POTEN & PARTNERS 2009 CONFIDENTIAL • Our Base Case forecast shows a total of 15 projects requiring additional vessels by 2030. • Based on Höegh’s current market share of 22%, this would result in 3 - 4 new projects for Höegh. • However, we see the market competition increasing. Furthermore, Höegh does not have readily available vessels to meet near-term demand. Therefore, 2-3 new projects by 2030 is a reasonable target, possibly doubling by 2035. • Our Low Case forecast shows a total of 5 projects requiring additional vessels by 2030. • Based on Höegh’s current market share of 22%, this would result in 1 new project for Höegh. • However, we see the market competition increasing. Furthermore, Höegh does not have readily available vessels to meet near-term demand. Therefore, under this case, Höegh may not secure any new projects by 2030. • Our High Case forecast shows a total of 39 projects requiring additional vessels by 2030. • Based on Höegh’s current market share of 22%, this would result in 8 - 9 new projects for Höegh. • However, we see the market competition increasing. Furthermore, Höegh does not have readily available vessels to meet near-term demand. Therefore, 5-6 new projects by 2030 is a reasonable target, possibly doubling by 2035. |
| © POTEN & PARTNERS 2009 CONFIDENTIAL |

| © POTEN & PARTNERS 2009 CONFIDENTIAL • Through an FSRU Time-Charter Agreement (TCA) – Project sponsor charters/leases the vessel from the FSRU Owner for a fixed time period. – FSRU Owner just charters out the FSRU and typically has no terminal ownership or fixed infrastructure development responsibilities – Charter rate, length of time charter, option periods can vary between projects • Through a Terminal Use Agreement (TUA) – FSRU Owner is also the owner of the import terminal and receives a service fee for use of the terminal – FSRU Owner is also the regasification service provider – Typically includes the development of fixed infrastructure such as docking system, offshore pipelines (as part of a full regasification project) • Turn-key solutions such as Build-Operate-Own-Transfer (BOOT) – FSRU provider builds and operates the import facility (including providing the FSRU and required fixed infrastructure such as docking system, jetty and pipeline to shore) as well as LNG supply for a fixed period until the asset is transferred to the project offtaker – Typically, this comes through a Gas Sales Agreement (GSA) at the point of consumption – Services include LNG supply, FSRU provision, regas services and fixed infrastructure to deliver regasified LNG to customers • In this report, we will primarily be focusing on charter rates expected in Time-Charter Agreements, where the FSRU Owner only leases the FSRU to a Project . |
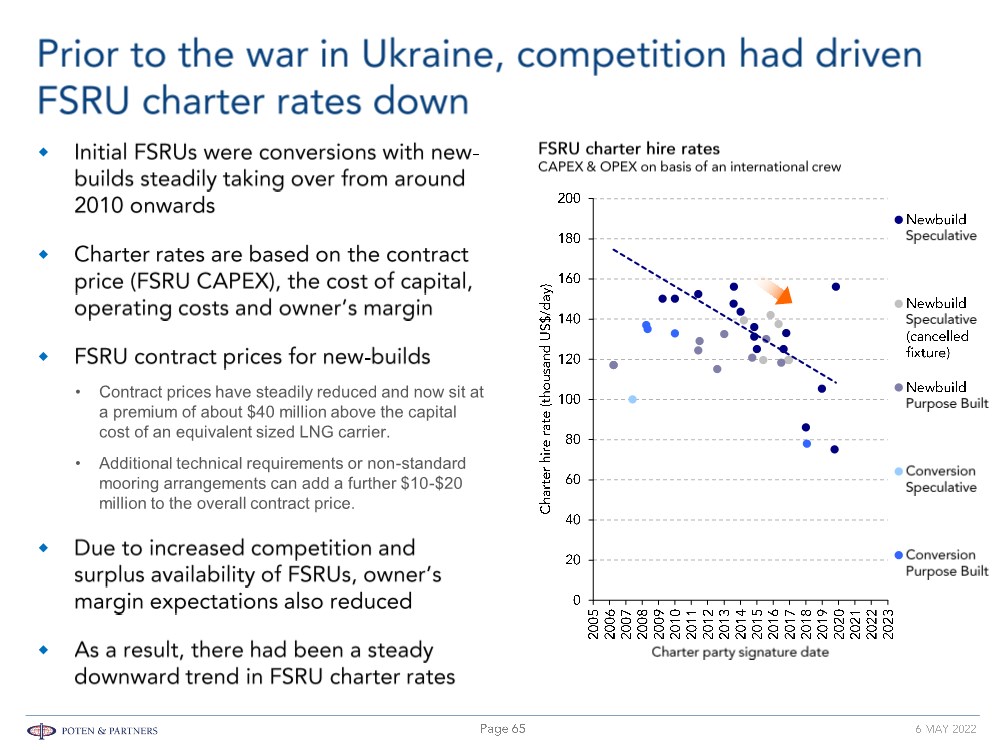
| © POTEN & PARTNERS 2009 CONFIDENTIAL • Contract prices have steadily reduced and now sit at a premium of about $40 million above the capital cost of an equivalent sized LNG carrier. • Additional technical requirements or non-standard mooring arrangements can add a further $10-$20 million to the overall contract price. |
| © POTEN & PARTNERS 2009 CONFIDENTIAL • They are ultimately sponsored by state-owned players motivated primarily by wider strategic considerations, particularly energy security concerns, rather than profits. • Expected demand also frequently fails to materialise. • Frequently imports are made into countries where gas and/or power costs are subsidised. • N.B. there are a few cases where demand has exceeded FSRU capacity and larger or multiple vessels required. • Plus, the relative lack of competition had allowed them to enjoy high rates of return. • Rates continue to be strong for individual projects, but pressure on margins is likely to increase, eroding some profitability, either through lower charter rates or having to carry unchartered vessels awaiting employment. • They have typically structured their involvement so that the risks and losses are borne by other players. • Rather, they vary depending on the competitive conditions surrounding each bid. |
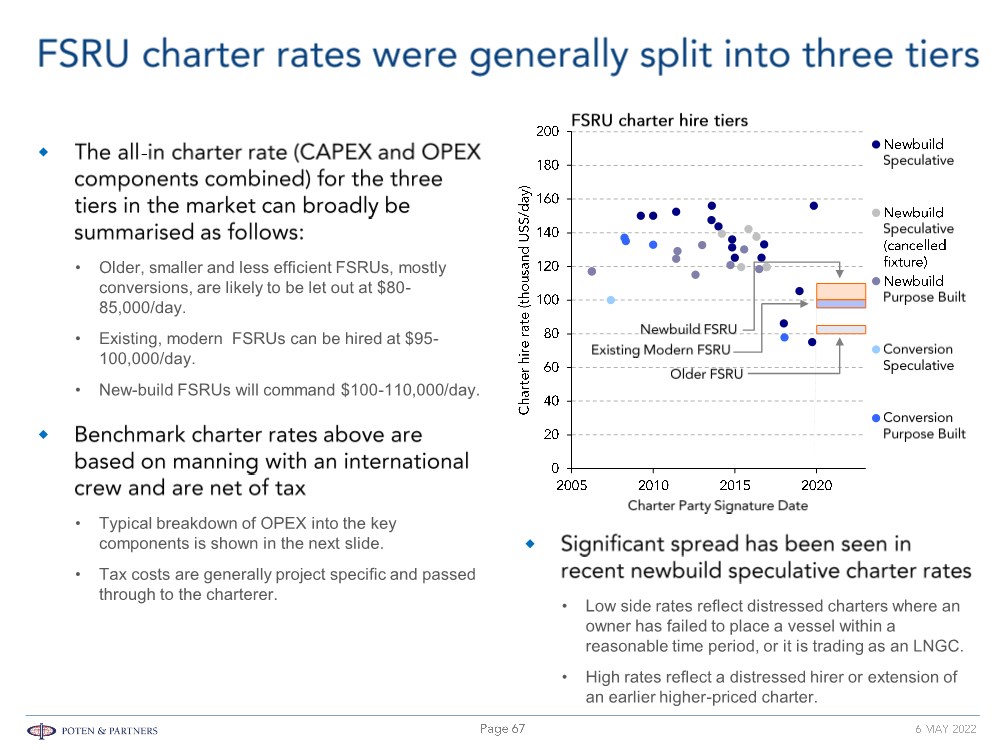
| © POTEN & PARTNERS 2009 CONFIDENTIAL • Older, smaller and less efficient FSRUs, mostly conversions, are likely to be let out at $80- 85,000/day. • Existing, modern FSRUs can be hired at $95- 100,000/day. • New-build FSRUs will command $100-110,000/day. • Typical breakdown of OPEX into the key components is shown in the next slide. • Tax costs are generally project specific and passed through to the charterer. • Low side rates reflect distressed charters where an owner has failed to place a vessel within a reasonable time period, or it is trading as an LNGC. • High rates reflect a distressed hirer or extension of an earlier higher-priced charter. |
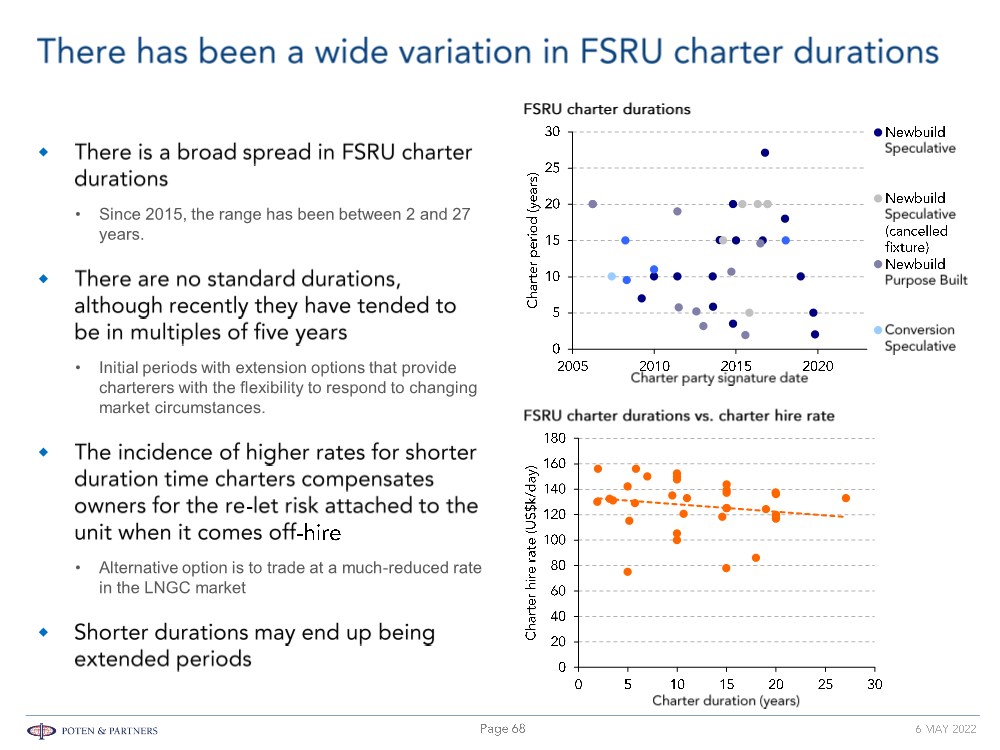
| © POTEN & PARTNERS 2009 CONFIDENTIAL • Since 2015, the range has been between 2 and 27 years. • Initial periods with extension options that provide charterers with the flexibility to respond to changing market circumstances. • Alternative option is to trade at a much-reduced rate in the LNGC market |
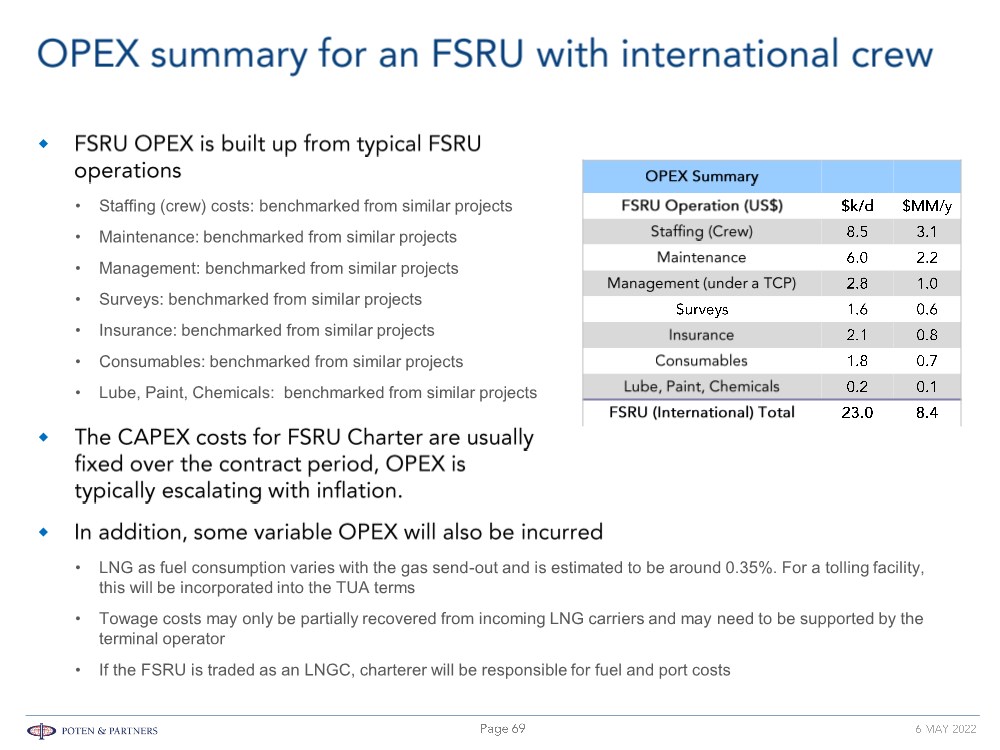
| © POTEN & PARTNERS 2009 CONFIDENTIAL • Staffing (crew) costs: benchmarked from similar projects • Maintenance: benchmarked from similar projects • Management: benchmarked from similar projects • Surveys: benchmarked from similar projects • Insurance: benchmarked from similar projects • Consumables: benchmarked from similar projects • Lube, Paint, Chemicals: benchmarked from similar projects • LNG as fuel consumption varies with the gas send-out and is estimated to be around 0.35%. For a tolling facility, this will be incorporated into the TUA terms • Towage costs may only be partially recovered from incoming LNG carriers and may need to be supported by the terminal operator • If the FSRU is traded as an LNGC, charterer will be responsible for fuel and port costs |
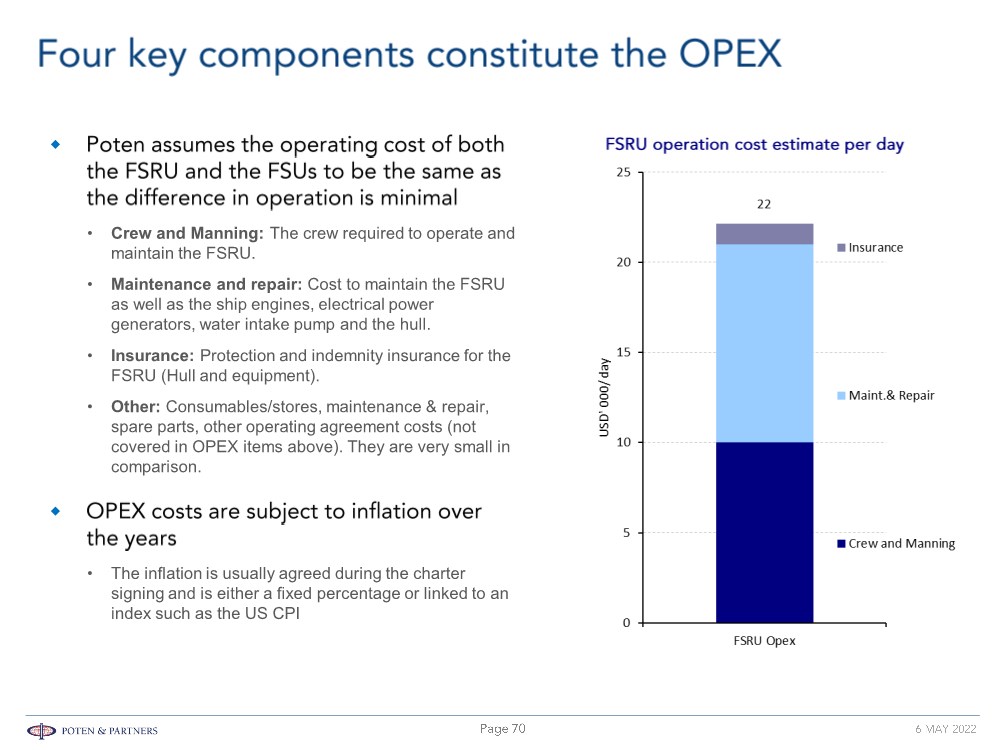
| © POTEN & PARTNERS 2009 CONFIDENTIAL • Crew and Manning: The crew required to operate and maintain the FSRU. • Maintenance and repair: Cost to maintain the FSRU as well as the ship engines, electrical power generators, water intake pump and the hull. • Insurance: Protection and indemnity insurance for the FSRU (Hull and equipment). • Other: Consumables/stores, maintenance & repair, spare parts, other operating agreement costs (not covered in OPEX items above). They are very small in comparison. • The inflation is usually agreed during the charter signing and is either a fixed percentage or linked to an index such as the US CPI |
| © POTEN & PARTNERS 2009 CONFIDENTIAL • FSRU storage and sendout capacity • FSRU technology and systems such as open-loop, closed-loop, combined loop regasification • Charter duration and timeline • Market supply demand and availability of charters • Also (with the exception of Bahrain Spirit) more likely to be a much older vessel. |
| © POTEN & PARTNERS 2009 CONFIDENTIAL • Impact of this is that planned projects won’t/can’t go ahead within their proposed schedules. • In practice, we believe CAPEX charter rates may have been closer to $120,000/d - $130,000/d. • Spare vessels are limited - only a few ships are available and only three could be released from contracts this year. • The earliest delivery for a newbuild is likely to be 2026 or conversion by end 2023. • They will have to get Class and Flag state approval for no dockings in this time which means thorough docking (and any modifications necessary) for new role. • Lost charter revenue and docking costs >$15 million - $20 million depending on work carried out and age of vessel. |
| © POTEN & PARTNERS 2009 CONFIDENTIAL • However, timing is an issue… If Lampung upgrade were to take 24 months, HMLP may lose market opportunity. • If Lampung charter is terminated in November 2022 based on arbitration outcome, HMLP may not know until close to that time - not much time for engineering study for new charter/location. • N.B. A potential charterer in a hurry could take the vessel without modification, if desperate. • At the lower end, it could be $45,000/d - $50,000/d as over 50% depreciated by that time. • Shipowners unlikely to convert to FSRU on speculative basis, only against a specific project requirement. |
| © POTEN & PARTNERS 2009 CONFIDENTIAL |

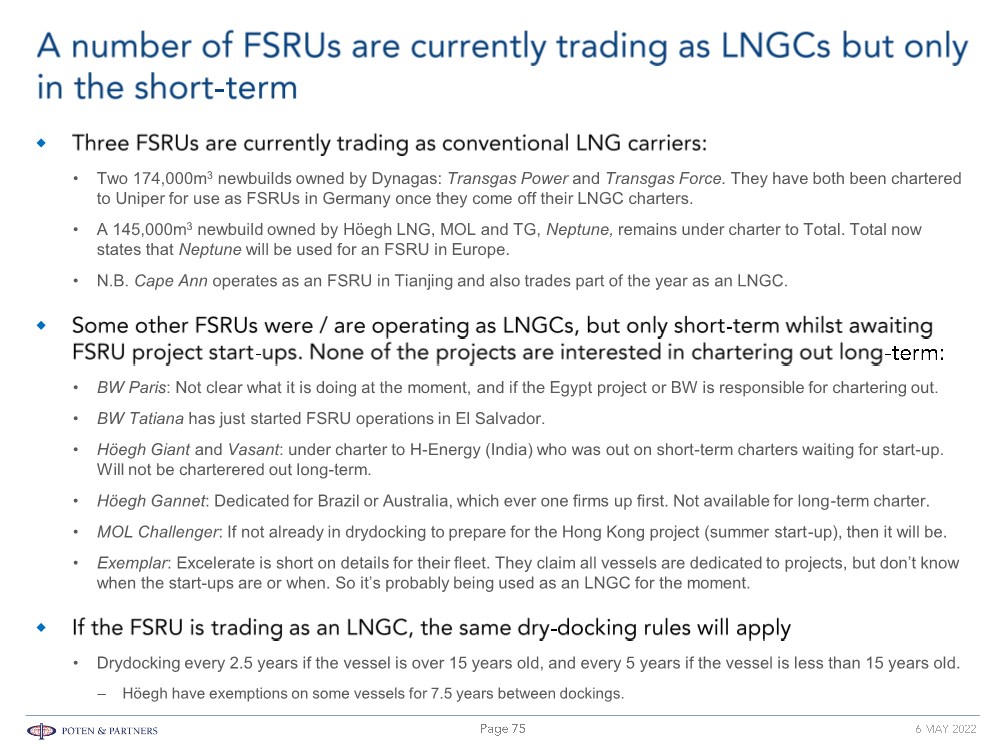
| © POTEN & PARTNERS 2009 CONFIDENTIAL • Two 174,000m3 newbuilds owned by Dynagas: Transgas Power and Transgas Force. They have both been chartered to Uniper for use as FSRUs in Germany once they come off their LNGC charters. • A 145,000m3 newbuild owned by Höegh LNG, MOL and TG, Neptune, remains under charter to Total. Total now states that Neptune will be used for an FSRU in Europe. • N.B. Cape Ann operates as an FSRU in Tianjing and also trades part of the year as an LNGC. • BW Paris: Not clear what it is doing at the moment, and if the Egypt project or BW is responsible for chartering out. • BW Tatiana has just started FSRU operations in El Salvador. • Höegh Giant and Vasant: under charter to H-Energy (India) who was out on short-term charters waiting for start-up. Will not be charterered out long-term. • Höegh Gannet: Dedicated for Brazil or Australia, which ever one firms up first. Not available for long-term charter. • MOL Challenger: If not already in drydocking to prepare for the Hong Kong project (summer start-up), then it will be. • Exemplar: Excelerate is short on details for their fleet. They claim all vessels are dedicated to projects, but don’t know when the start-ups are or when. So it’s probably being used as an LNGC for the moment. • Drydocking every 2.5 years if the vessel is over 15 years old, and every 5 years if the vessel is less than 15 years old. – Höegh have exemptions on some vessels for 7.5 years between dockings. |
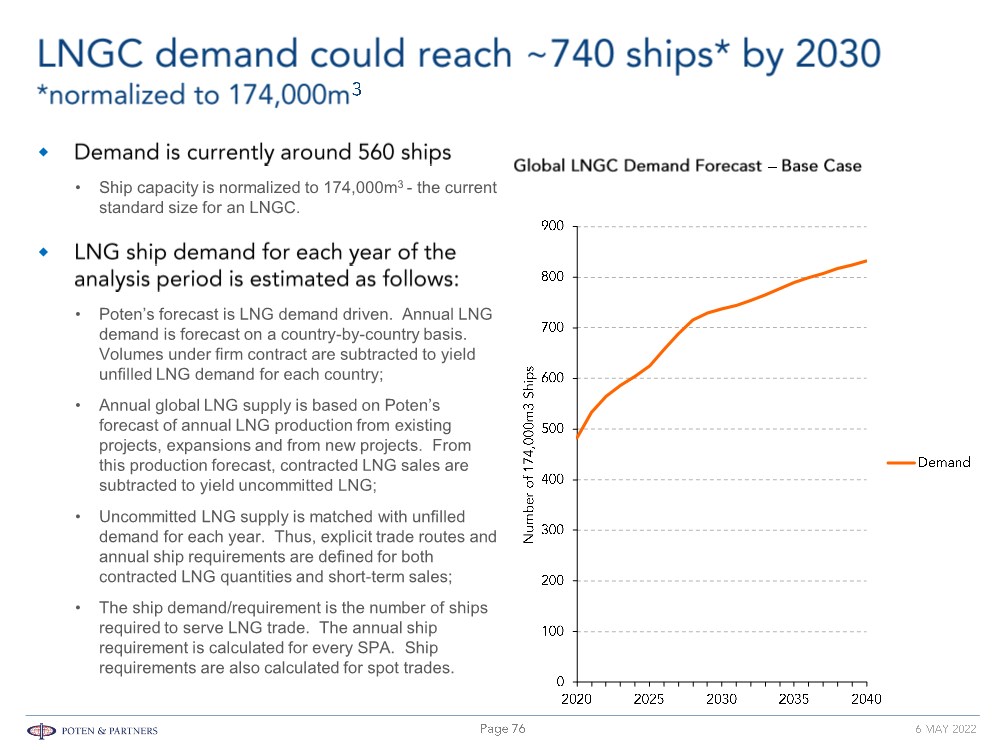
| © POTEN & PARTNERS 2009 CONFIDENTIAL • Ship capacity is normalized to 174,000m3 - the current standard size for an LNGC. • Poten’s forecast is LNG demand driven. Annual LNG demand is forecast on a country-by-country basis. Volumes under firm contract are subtracted to yield unfilled LNG demand for each country; • Annual global LNG supply is based on Poten’s forecast of annual LNG production from existing projects, expansions and from new projects. From this production forecast, contracted LNG sales are subtracted to yield uncommitted LNG; • Uncommitted LNG supply is matched with unfilled demand for each year. Thus, explicit trade routes and annual ship requirements are defined for both contracted LNG quantities and short-term sales; • The ship demand/requirement is the number of ships required to serve LNG trade. The annual ship requirement is calculated for every SPA. Ship requirements are also calculated for spot trades. |
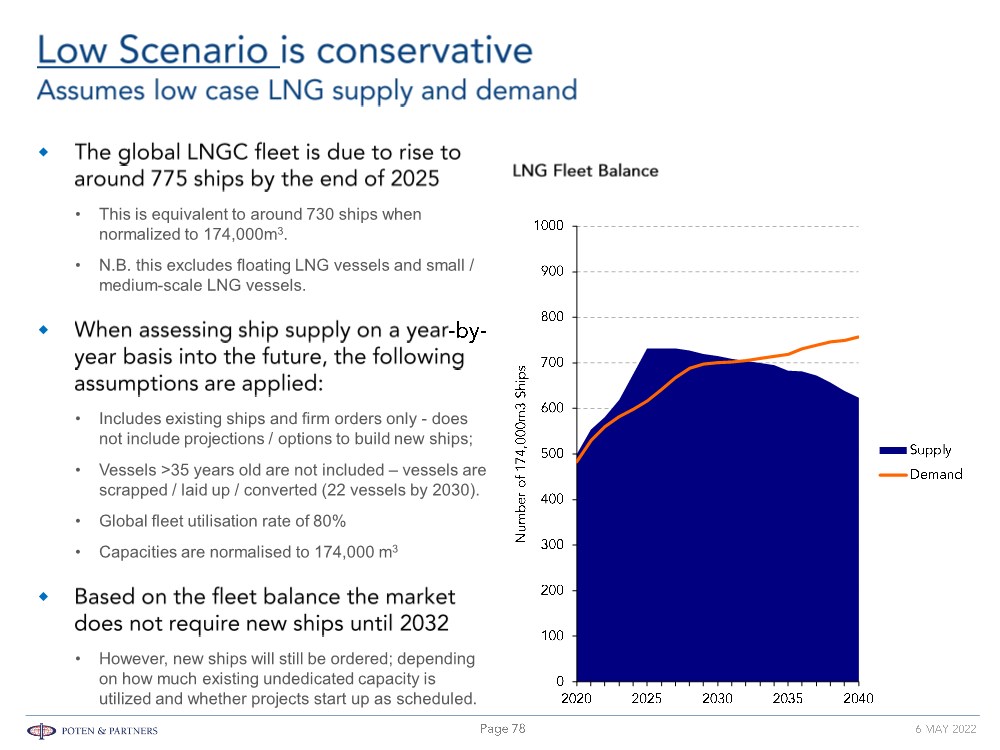
| © POTEN & PARTNERS 2009 CONFIDENTIAL • This is equivalent to around 730 ships when normalized to 174,000m3. • N.B. this excludes floating LNG vessels and small / medium-scale LNG vessels. • Includes existing ships and firm orders only - does not include projections / options to build new ships; • Vessels >35 years old are not included – vessels are scrapped / laid up / converted (22 vessels by 2030). • Global fleet utilisation rate of 80% • Capacities are normalised to 174,000 m3 • However, new ships will still be ordered; depending on how much existing undedicated capacity is utilized and whether projects start up as scheduled. |

| © POTEN & PARTNERS 2009 CONFIDENTIAL • This is equivalent to around 730 ships when normalized to 174,000m3. • N.B. this excludes floating LNG vessels and small / medium-scale LNG vessels. • Includes existing ships and firm orders only - does not include projections / options to build new ships; • Vessels >35 years old are not included – vessels are scrapped / laid up / converted (22 vessels by 2030). • Global fleet utilisation rate of 80% • Capacities are normalised to 174,000 m3 • However, new ships will still be ordered; depending on how much existing undedicated capacity is utilized and whether projects start up as scheduled. |
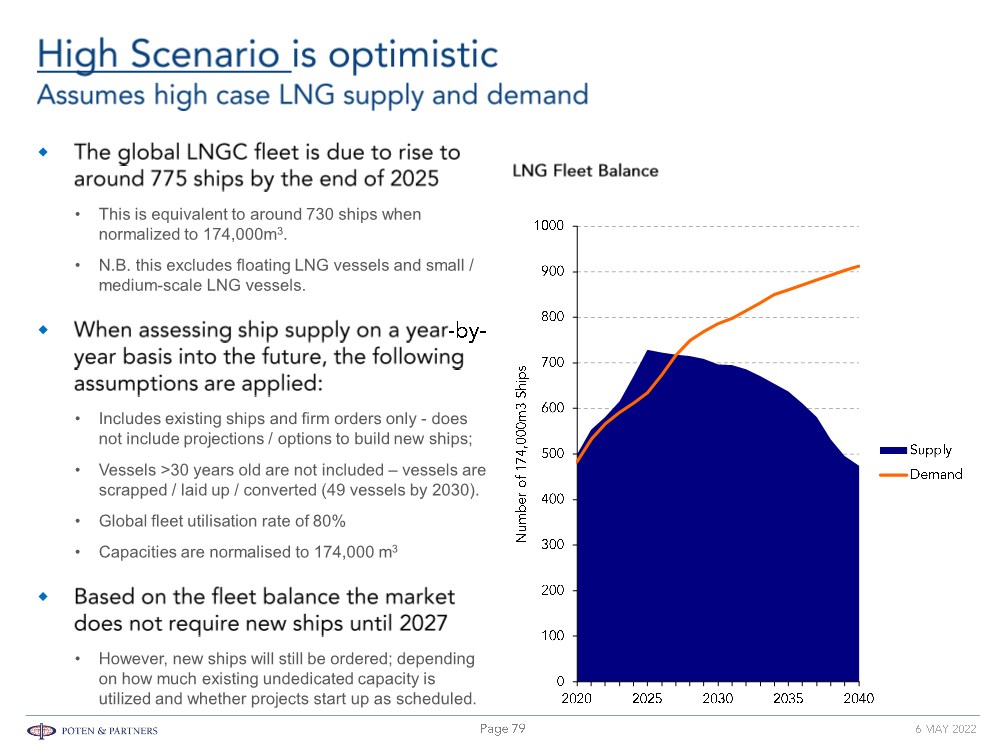
| © POTEN & PARTNERS 2009 CONFIDENTIAL • This is equivalent to around 730 ships when normalized to 174,000m3. • N.B. this excludes floating LNG vessels and small / medium-scale LNG vessels. • Includes existing ships and firm orders only - does not include projections / options to build new ships; • Vessels >30 years old are not included – vessels are scrapped / laid up / converted (49 vessels by 2030). • Global fleet utilisation rate of 80% • Capacities are normalised to 174,000 m3 • However, new ships will still be ordered; depending on how much existing undedicated capacity is utilized and whether projects start up as scheduled. |
| © POTEN & PARTNERS 2009 CONFIDENTIAL |
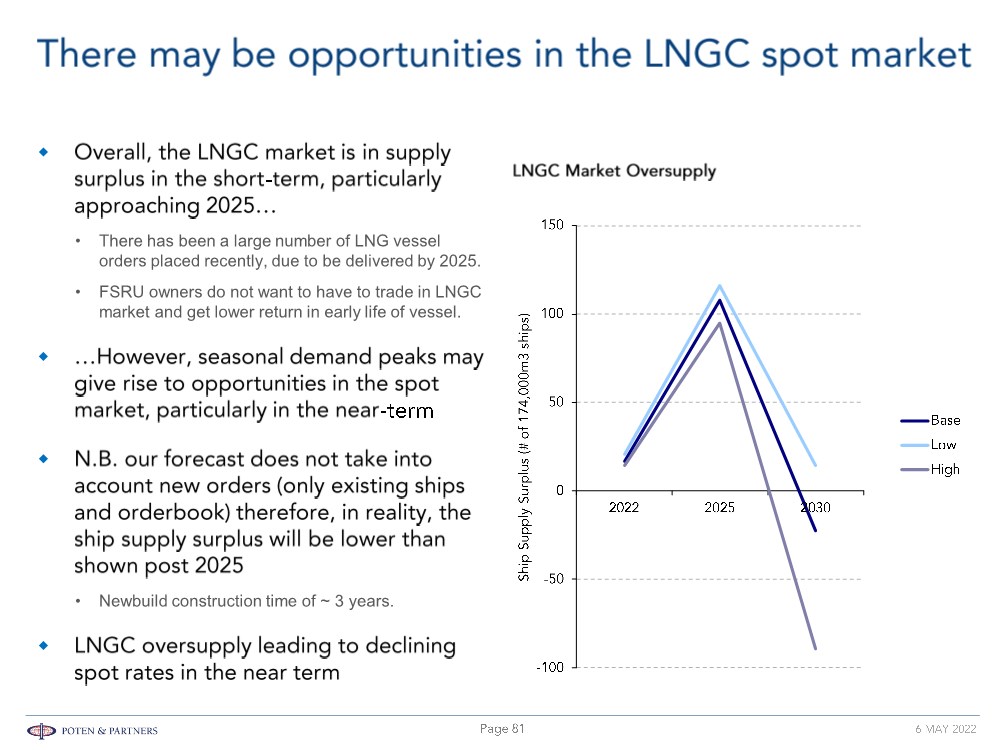
| © POTEN & PARTNERS 2009 CONFIDENTIAL • There has been a large number of LNG vessel orders placed recently, due to be delivered by 2025. • FSRU owners do not want to have to trade in LNGC market and get lower return in early life of vessel. • Newbuild construction time of ~ 3 years. |
| © POTEN & PARTNERS 2009 CONFIDENTIAL |
| © POTEN & PARTNERS 2009 CONFIDENTIAL |