UNITED STATES
SECURITIES AND EXCHANGE COMMISSION
Washington, DC 20549
FORM N-CSR
CERTIFIED SHAREHOLDER REPORT OF REGISTERED
MANAGEMENT INVESTMENT COMPANIES
Investment Company Act file number 811-22956
Forefront Income Trust
(Exact name of registrant as specified in charter)
641 Lexington Avenue, 29th Floor, New York, NY 10022
(Address of principal executive offices) (Zip code)
Eversheds Sutherland (US) LLP
700 Sixth Street, N.W. Washington, DC 20001
(Name and address of agent for service)
Registrant's telephone number, including area code: 212-488-4972
Date of fiscal year end: September 30
Date of reporting period: March 31, 2018
| Item 1. | REPORT TO STOCKHOLDERS. |
Semi-Annual Report 2018
For the period from October 1, 2017 through March 31, 2018 (Unaudited)
Forefront Income Trust
This report and the financial statements contained herein are submitted for the general information of the shareholders of the Forefront Income Trust (the “Trust”). The Trust’s shares are not deposits or obligations of, or guaranteed by, any depository institution. The Trust’s shares are not insured by the FDIC, Federal Reserve Board or any other agency, and are subject to investment risks, including possible loss of principal amount invested. The Trust’s distributor is not a bank.
(This page has been left blank intentionally.)
Statements in this Semi-Annual Report that reflect projections or expectations of future financial or economic performance of the Forefront Income Trust (“Trust”) and of the market in general and statements of the Trust’s plans and objectives for future operations are forward-looking statements. No assurance can be given that actual results or events will not differ materially from those projected, estimated, assumed or anticipated in any such forward-looking statements. Important factors that could result in such differences, in addition to the other factors noted with such forward-looking statements, include, without limitation, general economic conditions such as inflation, recession and interest rates. Past performance is not a guarantee of future results.
An investment in the Trust involves a high degree of risk, will be illiquid and should be considered speculative. An investment is subject to the possible loss of the entire principal amount invested. The Trust is appropriate only for shareholders who can tolerate a high degree of risk and do not require a liquid investment, as the investments will be illiquid. Other than in very limited circumstances, if any, you should not expect to be able to sell your Shares other than through repurchase offers on a quarterly basis, of which there is no assurance. As a closed-end interval Trust, there is currently no secondary market for the Trust and none is expected to develop.
There can be no assurance that the Trust will meet its investment objective. It is designed for long-term investors and not as a trading vehicle. Credit or default risk may subject the Trust’s assets to additional risk. The Trust will invest primarily in unrated or below-investment-grade-rate (“junk” of high yield/high risk) present a significant risk of loss of default and are more volatile than investment grade securities. Special tax rules will apply to certain shareholders if we are not treated as a publicly offered regulated investment company (RIC). The Trust is classified as a “nondiversified” investment company, and may invest a greater portion of its assets in a more limited number of issuers than a diversified investment company. As a result, the Trust’s investment portfolio may be subject to greater risk and volatility than if its investments were made in the securities of a broad range of issuers.
The performance information quoted in this Semi-Annual Report represents past performance, which is not a guarantee of future results. Investment return and principal value of an investment will fluctuate so that an investor’s shares, when redeemed, may be worth more or less than their original cost. Current performance may be lower or higher than the performance data quoted. An investor may obtain performance data current to the most recent month-end by visiting ncfunds.com.
This report is submitted for the general information of the shareholders of the Trust. It is not authorized for distribution to prospective investors unless preceded or accompanied by an effective prospectus, which includes information regarding the Trust’s risks, objectives, fees and expenses, experience of its management, and other information.
The Trust is no longer offering new shares and does not have an effective prospectus.
This Semi-Annual Report was first distributed to shareholders on or about June 14, 2018.
For More Information on Your Forefront Income Trust:
See Our Web site at forefrontcapitaladvisors.com
Forefront Income Trust
Performance Update
(Unaudited)
For the period from December 31, 2014 (Commencement of Operations) to March 31, 2018
Comparison of the Change in Value of a $10,000 Investment
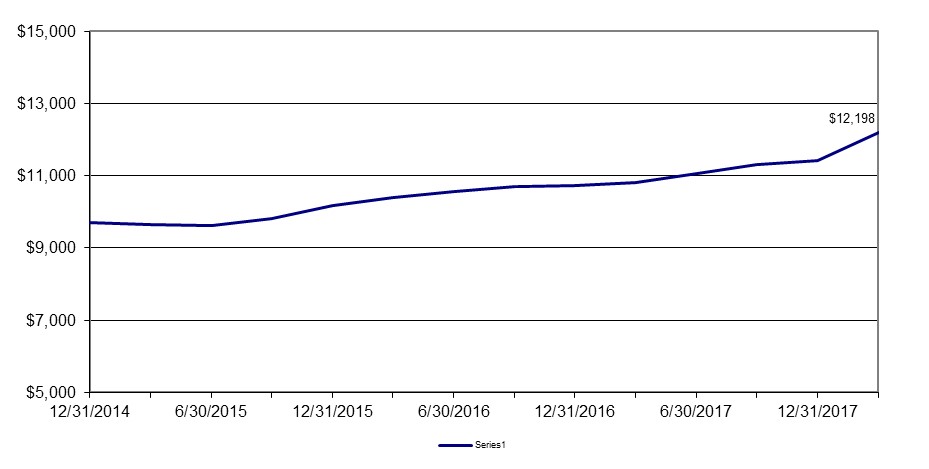
This graph assumes an initial investment of $10,000 ($9,700 after maximum sales load of 3.00%) at December 31, 2014 (Commencement of Operations). All dividends and distributions are reinvested. This graph depicts the performance of the Forefront Income Trust. The graph is shown for illustrative purposes only.
| Average Annual Total Returns |
| As of March 31, 2018 | One Year | Since Inception | Inception Date | Gross Expense Ratio* |
| Forefront Income Trust - No Sales Load | 6.31% | 6.97% (a) | 12/31/14 | 5.79% |
Forefront Income Trust- 3.00% Maximum Sales Load | 3.23% | 6.00% (a) | 12/31/14 | 5.79% |
| * | The gross expense ratio shown is from the Trust's prospectus dated January 30, 2017. |
Performance quoted above represents past performance, which is no guarantee of future results. Investment return and principal value will fluctuate so that shares, when redeemed, may be worth more or less than their original cost. Current performance may be lower or higher than the performance data quoted. An investor may obtain performance data, current to the most recent month-end, by calling the Trust.
The graph and table do not reflect the deduction of taxes that a shareholder would pay on Trust distributions or the redemption of Trust shares. Average annual total returns are historical in nature and measure net investment income and capital gain or loss from portfolio investments assuming reinvestments of distributions.
| Forefront Income Trust | | | | | | | | |
| | | | | | | | | | | | | |
| Schedule of Investments | | | | | | | | |
| (Unaudited) | | | | | | | | | | |
| | | | | | | | | | | | | |
| As of March 31, 2018 | | | | | | | | | |
| | | Shares/Amount | | | | | | | | | Value (Note 1) | |
| | | | | | | | | | | | | |
| SENIOR LOANS - 35.72% | | | | | | | | | | | | |
| | | | | | Interest Rate | | | Maturity Date | | | | |
| Financial Services - 29.67% | | | | | | | | | | | | |
| Auto Funding Group, LLC (a)(b) | | $ | 2,700,500 | | | | 10.000 | % | | | 4/20/2018 | | | | 2,453,500 | |
| | | | | | | | | | | | | | | | | |
| Retail - 6.05% | | | | | | | | | | | | | | | | |
| Banjo & Matilda, Inc. (a) | | $ | 500,000 | | | | 0.000 | % | | | 6/18/2018 | | | | 500,000 | |
| | | | | | | | | | | | | | | | | |
| Total Senior Loans (Cost $3,200,500) | | | | | | | | | | | | | | | 2,953,500 | |
| STRUCTURED NOTES - 42.19% | | | | | | | Interest Rate | | | | Maturity Date | | | | | |
| | | | | | | | | | | | | | | | | |
| Retail - 0.36% | | | | | | | | | | | | | | | | |
| Banjo & Matilda, Inc. (a) | | $ | 64,844 | | | | 18.000 | % | | | 12/31/2018 | | | | 29,844 | |
| | | | | | | | | | | | | | | | | |
| Real Estate - 41.83% | | | | | | | | | | | | | | | | |
| 1501 Sheepshead Bay Road Partners, LLC (a)(b) | | $ | 172,625 | | | | 18.000 | % | | | 12/31/2018 | | | | 172,625 | |
| 2020 Eastchester Road, LLC (a)(b) | | $ | 227,500 | | | | 18.000 | % | | | 12/31/2018 | | | | 227,500 | |
| 35 Tech Partners, LLC (a)(b) | | $ | 500,000 | | | | 16.500 | % | | | 12/31/2018 | | | | 500,000 | |
| Blaichbridge Driggs, LLC (a) | | $ | 435,000 | | | | 18.000 | % | | | 12/31/2018 | | | | 435,000 | |
| Caroline Square Realty, LLC (a)(b) | | $ | 400,000 | | | | 15.500 | % | | | 7/26/2018 | | | | 400,000 | |
| City Ridge Realty, LLC (a)(b) | | $ | 400,000 | | | | 15.000 | % | | | 5/15/2018 | | | | 400,000 | |
| Club at Charter Point Realty, LLC (a)(b) | | $ | 397,750 | | | | 15.000 | % | | | 5/15/2018 | | | | 397,750 | |
| CPRE Holdings, LLC (a)(b) | | $ | 175,000 | | | | 15.000 | % | | | 6/1/2018 | | | | 175,000 | |
| WBSH Met Tower, LLC (a)(b) | | $ | 750,000 | | | | 18.000 | % | | | 12/31/2018 | | | | 750,000 | |
| | | | | | | | | | | | | | | | 3,457,875 | |
| | | | | | | | | | | | | | | | | |
| Total Structured Notes (Cost $3,522,719) | | | | | | | | | | | | | | | 3,487,719 | |
(Continued)
| Forefront Income Trust | | | | | | | | | |
| | | | | | | | | | | | | | | |
| Schedule of Investments - Continued | | | | | | | | |
| (Unaudited) | | | | | | | | | | | | |
| | | | | | | | | | | | | | | |
| As of March 31, 2018 | | | | | | | | | | | |
| | | | Shares | | | | | | | | | | | | Value | |
| | | | | | | | | | | | | | | | | |
| WARRANTS - 0.00% | | | | | | | | | | | | | | | | |
| | | | | | | | Exercise Price | | | | Exercise Date | | | | | |
| Banjo & Matilda, Inc. | | | 6,000,000 | | | $ | 0.05 | | | | 2/5/2021 | | | $ | - | |
| | | | | | | | | | | | | | | | | |
| Total Warrants (Cost $0) | | | | | | | | | | | | | | | - | |
| | | | | | | | | | | | | | | | | |
| SUPPLIER CREDIT - 5.44% | | | | | | | | | | | | | | | | |
| | | | | | | | | | | | | | | | | |
| Chris' Cookies | | | 450,059 | | | | | | | | | | | $ | 450,059 | |
| | | | | | | | | | | | | | | | | |
| Total Supplier Credit Agreements (Cost $0) | | | | | | | | | | | | | | | 450,059 | |
| | | | | | | | | | | | | | | | | |
| SHORT-TERM INVESTMENT - 3.81% | | | | | | | | | | | | | | | | |
| Blackrock Liquidity | | | | | | | | | | | | | | | | |
| Money Market Portfolio | | | 314,858 | | | | | | | | | | | | 314,858 | |
| | | | | | | | | | | | | | | | | |
| Total Short-Term Investment (Cost $314,858) | | | | | | | | | | | | | | | 314,858 | |
| | | | | | | | | | | | | | | | | |
| Total Value of Investments (Cost $7,488,136) -87.16% | | | | | | | | | | | | | | $ | 7,206,136 | |
| | | | | | | | | | | | | | | | | |
| Other Assets Less Liabilities -12.84% | | | | | | | | | | | | | | | 1,061,316 | |
| | | | | | | | | | | | | | | | | |
| Net Assets - 100% | | | | | | | | | | | | | | $ | 8,267,452 | |
| (a) | Restricted Securities. Securities for which market quotations are not readily available. The aggregate value of such securities is 80.68% of net assets, and the fair value has been determined under procedures approved by the Trust's Board of Trustees. There are no discounts for these securities since there are no restrictions upon sale. |
| (b) | Structured Notes. There are several risks associated with the use of structured notes. Structured notes are leveraged, thereby providing an exposure to the underlying benchmark greater than the face amount and increasing the volatility of each note relative to the change in the underlying linked financial instrument. A highly liquid secondary market may not exist for the structured notes in which Forefront Income Trust invests, which may make it difficult for Forefront Income Trust to sell the structured notes it holds at an acceptable price or to accurately value them. In addition, structured notes are subject to the risk that the counterparty to the instrument, or issuer, might not pay interest when due or repay principal at the maturity of the obligation. Forefront Income Trust bears the risk of loss of the amount expected to be received in the event of the default or bankruptcy of the issuer. |
(Continued)
| Forefront Income Trust | | | | | | | | | |
| | | | | | | | | | | | | | |
| Schedule of Investments - Continued | | | | | | | | |
| (Unaudited) | | | | | | | | | | | | |
| | | | | | | | | | | | | | |
| As of March 31, 2018 | | | | | | | | | | | |
| Summary of Investments | | | | | | |
| | | % of Net | | | | |
| | | Assets | | | Value | |
| Senior Loans | | | 35.72 | % | | $ | 2,953,500 | |
| Structured Notes | | | 42.19 | % | | | 3,487,719 | |
| Warrants | | | 0.00 | % | | | - | |
| Short-Term Investment | | | 3.81 | % | | | 314,858 | |
| Supplier Credit | | | 5.44 | % | | | 450,059 | |
| Other Assets Less Liabilities | | | 12.84 | % | | | 1,061,316 | |
| Total | | | 100.00 | % | | $ | 8,267,452 | |
See Notes to Financial Statements
| Forefront Income Trust | | |
| | | | |
| Statement of Assets and Liabilities | | |
| (Unaudited) | | |
| | | | |
| As of March 31, 2018 | | |
| Assets: | | | |
| Investments, at value (cost $7,488,136) | | $ | 7,206,136 | |
| Receivables: | | | | |
| Interest | | | 1,061,900 | |
| Due from Advisor | | | 237,603 | |
| Prepaid expenses: | | | | |
| Compliance fees | | | 567 | |
| Registration and filing expenses | | | 7,692 | |
| Insurance fees | | | 11,374 | |
| Other assets | | | 5,934 | |
| | | | | |
| Total assets | | | 8,531,206 | |
| | | | | |
| Liabilities: | | | | |
| Accrued expenses: | | | | |
| Administration fees | | | 9,460 | |
| Advisory fees | | | 195,699 | |
| Professional fees | | | 30,348 | |
| Custody fees | | | 1,805 | |
| Shareholder servicing fees | | | 6,185 | |
| Distribution fees | | | 5,145 | |
| Loan expenses | | | 10,112 | |
| Trustee fees | | | 5,000 | |
| | | | | |
| Total liabilities | | | 263,754 | |
| | | | | |
| Total Net Assets | | $ | 8,267,452 | |
| | | | | |
| Net Assets Consist of: | | | | |
| Paid in Interest | | $ | 8,300,795 | |
| Undistributed net investment income | | | 243,128 | |
| Accumulated net realized gain on investments | | | 5,529 | |
| Accumulated net unrealized depreciation on investments | | | (282,000 | ) |
| | | | | |
| Total Net Assets | | $ | 8,267,452 | |
| Shares Outstanding, no par value (unlimited authorized shares) | | | 844,541 | |
| Net Asset Value and Redemption Price Per Share Outstanding | | $ | 9.79 | |
| | | | | |
| Maximum Offering Price Per Share ($9.79 ÷ 97.00%) | | $ | 10.09 | |
See Notes to Financial Statements
| Forefront Income Trust | | |
| | | | |
| Statement of Operations | | |
| (Unaudited) | | |
| | | | |
| For the period ended March 31, 2018 | | |
| Investment Income: | | | |
| Interest | | $ | 583,249 | |
| Dividends | | | 1,335 | |
| Other | | | 1,096 | |
| | | | | |
| Total Investment Income | | | 585,680 | |
| | | | | |
| Expenses: | | | | |
| Advisory fees | | | 195,699 | |
| Compliance fees (Note 2) | | | 34,652 | |
| Professional fees | | | 48,370 | |
| Administration fees (Note 2) | | | 38,382 | |
| Distribution fees | | | 9,688 | |
| Trustee fees and meeting expenses (Note 2) | | | 10,217 | |
| Registration and filing expenses | | | 3,600 | |
| Shareholder fulfillment expenses | | | 8,918 | |
| Insurance fees | | | 21,722 | |
| Custody fees (Note 2) | | | 2,446 | |
| Loan fees | | | 7,383 | |
| Other fees | | | 1,078 | |
| | | | | |
| Total Expenses | | | 382,155 | |
| | | | | |
| Fees waived by advisor per Expense Limitation Agreement (Note 2) | | | (113,517 | ) |
| | | | | |
| Net Expenses | | | 268,638 | |
| | | | | |
| Net Investment Income | | | 317,042 | |
| | | | | |
| Realized and Unrealized Loss on Investments: | | | | |
| | | | | |
| Net change in unrealized depreciation on investments | | | (102,000 | ) |
| | | | | |
| Net Realized and Unrealized Loss on Investments | | | (102,000 | ) |
| | | | | |
| Net Increase in Net Assets Resulting from Operations | | $ | 215,042 | |
See Notes to Financial Statements
| Forefront Income Trust | | |
| | | | | | | | | | | | |
| Statements of Changes in Net Assets | | |
| For the periods ended | | March 31, 2018 (a) | | | September 30, 2017 (b) | |
| | | | | | | |
| Operations: | | | | | | |
| Net investment income | | $ | 317,042 | | | $ | 898,206 | |
| Net realized gain from investment transactions | | | - | | | | 306,936 | |
| Net change in unrealized appreciation on investments | | | (102,000 | ) | | | (180,000 | ) |
| | | | | | | | | |
| Net Increase in Net Assets Resulting from Operations | | | 215,042 | | | | 1,025,142 | |
| | | | | | | | | |
| Distributions to Shareholders: | | | | | | | | |
| Net Investment Income | | | (781,034 | ) | | | (723,475 | ) |
| Net realized gain from investment | | | (301,411 | ) | | | (43,328 | ) |
| | | | | | | | | |
| Net Decrease in Net Assets Resulting from Distributions | | | (1,082,445 | ) | | | (766,803 | ) |
| | | | | | | | | |
| Beneficial Interest Transactions: | | | | | | | | |
| Shares sold | | | - | | | | 1,086,549 | |
| Reinvested dividends and distributions | | | 194,834 | | | | 76,139 | |
| Shares Repurchased | | | (927,566 | ) | | | (2,845,957 | ) |
| | | | | | | | | |
| Decrease in Net Assets Resulting from Beneficial Interest Transactions | | | (732,732 | ) | | | (1,683,269 | ) |
| | | | | | | | | |
| Net Decrease in Net Assets | | | (1,600,135 | ) | | | (1,424,930 | ) |
| | | | | | | | | |
| Net Assets: | | | | | | | | |
| Beginning of period | | | 9,867,587 | | | | 11,292,517 | |
| End of period | | $ | 8,267,452 | | | $ | 9,867,587 | |
| | | | | | | | | |
| Undistributed Net Investment Income | | $ | 243,128 | | | $ | 707,120 | |
| | | | | | | | | |
| Share Information: | | | | | | | | |
| Shares Sold | | | - | | | | 103,906 | |
| Reinvested Distributions | | | 19,461 | | | | 7,465 | |
| Shares Repurchased | | | (92,182 | ) | | | (269,258 | ) |
| Net Increase in Shares of Beneficial Interest | | | (72,721 | ) | | | (157,887 | ) |
| (b) | For the year ended September 30, 2017. |
See Notes to Financial Statements
| Forefront Income Trust | | | | |
| | | | | | | | | |
| Statement of Cash Flows | | | | |
| (Unaudited) | | | | | |
| | | | | | | | | |
| For the period ended March 31, 2018 | | | | |
| Cash flows from operating activities: | | | |
| Net increase in net assets resulting from operations | | $ | 215,042 | |
| | | | | |
| Adjustments to reconcile net increase in capital resulting from operations to net cash provided by operating activities: | | | | |
| | | | | |
| Purchases of investments | | | (3,719,650 | ) |
| Proceeds from sale of investments and maturities | | | 5,179,007 | |
| Increase in Due From Advisor | | | (88,516 | ) |
| Decrease in other assets | | | 1,993 | |
| Change in net unrealized depreciation on investments | | | 102,000 | |
| Decrease in dividend and interest receivable | | | 175,210 | |
| Increase in prepaid registration and filing expenses | | | (1,276 | ) |
| Decrease in prepaid insurance expenses | | | 1,157 | |
| Increase in prepaid compliance fees | | | (148 | ) |
| Decrease in professional fees | | | (9,725 | ) |
| Increase in shareholder servicing fees | | | 1,538 | |
| Decrease in custody fees | | | (724 | ) |
| Increase in accrued administration fees | | | 883 | |
| Increase in accrued loan expenses | | | 326 | |
| Decrease in accrued trustee fees | | | (4,783 | ) |
| Increase in accrued distribution fees | | | 3,722 | |
| Decrease in accrued advisory fees | | | (40,879 | ) |
| Net cash provided by operating activities | | | 1,815,177 | |
| | | | | |
| Cash flows used in financing activities: | | | | |
| | | | | |
| Cash distribution paid | | | (887,611 | ) |
| Fund shares repurchased | | | (927,566 | ) |
| Net cash used in financing activities | | | (1,815,177 | ) |
| | | | | |
| Net increase in cash and cash equivalents | | | - | |
| | | | | |
| Beginning of period | | | - | |
| | | | | |
| Ending of period | | $ | - | |
See Notes to Financial Statements
| Forefront Income Trust | | | | |
| | | | | | | | | | | | | | | | | | | |
| Financial Highlights | | | | | | | | | | | | |
For a share outstanding during each of the periods ended | | | March 31, 2018 (i) | | | | September 30, 2017 (d) | | | | September 30, 2016 (e) | |
| | | | | | | | | | | | | |
| Net Asset Value, Commencement of Operations | | $ | 10.85 | | | $ | 10.50 | | | $ | 10.11 | |
| | | | | | | | | | | | | |
| Income from Investment Operations: | | | | | | | | | | | | |
| Net investment income | | | 0.37 | | | | 0.97 | | | | 0.86 | |
| Net realized and unrealized gain on investments | | | (0.12 | ) (f) | | | 0.12 | | | | 0.04 | |
| | | | | | | | | | | | | |
| Total from Investment Operations | | | 0.24 | | | | 1.09 | | | | 0.90 | |
| | | | | | | | | | | | | |
| Less Distributions: | | | | | | | | | | | | |
| From net investment income | | | (0.93 | ) | | | (0.70 | ) | | | (0.51 | ) |
| From net realized gain on investment | | | (0.37 | ) | | | (0.04 | ) | | | - | |
| | | | | | | | | | | | | |
| Total Distributions | | | (1.30 | ) | | | (0.74 | ) | | | (0.51 | ) |
| | | | | | | | | | | | | |
| Net Asset Value, End of Period | | $ | 9.79 | | | $ | 10.85 | | | $ | 10.50 | |
| | | | | | | | | | | | | |
| Total Return (c) | | | 1.71 | %(b) | | | 10.92 | %(b) | | | 9.15 | %(b) |
| | | | | | | | | | | | | |
| Net Assets, End of Period (in thousands) | | $ | 8,267 | | | $ | 9,868 | | | $ | 11,293 | |
| | | | | | | | | | | | | |
| Ratios of: | | | | | | | | | | | | |
| Gross Expenses to Average Net Assets (e)(g) | | | 4.34 | %(a) | | | 6.29 | % | | | 5.79 | %(a) |
| Net Expenses to Average Net Assets (e)(g) | | | 0.83 | %(a) | | | 1.89 | % | | | 1.75 | %(a) |
| Net Investment Income to Average Net Assets (g)(h) | | | 3.60 | %(a) | | | 8.47 | % | | | 8.38 | %(a) |
| | | | | | | | | | | | | |
| Portfolio turnover rate | | | 12.31 | %(b) | | | 36.76 | % | | | 84.14 | %(b) |
| (c) | Total return does not reflect sales charge, if any. |
| (d) | For the year ended September 30, 2017 |
| (e) | For the year ended September 30, 2016 |
| (f) | Less than $0.01 per share. |
| (g) | Does not include the proportionate share of income and expenses of the investment companies in which the Trust invests. |
Recognition of net investment income by the Trust is affected by the timing of the declaration of dividends by the underlying investment companies in which the Trust invests. See notation (e).
See Notes to Financial Statements
Forefront Income Trust
Notes to Financial Statements
(Unaudited)
1. Organization and Significant Accounting Policies
The Forefront Income Trust (the “Trust”) is organized as a Delaware statutory trust organized on August 20, 2014 and is registered under the Investment Company Act of 1940, as amended (the “1940 Act”), as a closed-end, non-diversified, “interval” management investment company. The Trust follows accounting and reporting guidance in the Financial Accounting Standards Board (“FASB”) Accounting Standards Codifications 946, Financial Services – Investment Companies. The Trust became effective on December 8, 2014 and commenced operations on December 31, 2014 upon the issuance of shares.
The Trust seeks to achieve its investment objective of current income by primarily investing in fixed income securities, such as unrated or below-investment-grade-rated (commonly referred to as “junk” or high yield risk) loans and debt instruments with maturities of generally not more than three years, as well as, to a lesser extent, dividend yielding preferred securities, all of which will represent what Forefront Capital Advisors, LLC (the “Advisor”) believes to be deep value opportunities, in that they will offer prospective returns that are high in proportion to their risks as assessed by the Advisor based on its fundamental analysis.
The following is a summary of significant accounting policies consistently followed by the Trust. The policies are in conformity with accounting principles generally accepted in the United States of America (“GAAP”). The Trust’s fiscal year end is September 30.
Investment Valuation
The Trust’s investments in securities are carried at fair value. Securities listed on an exchange or quoted on a national market system are valued at the last sales price as of 4:00 p.m. Eastern Time. Securities traded in the NASDAQ over-the-counter market are generally valued at the NASDAQ Official Closing Price. Other securities traded in the over-the-counter market and listed securities for which no sale was reported on that date are valued at the most recent bid price. Securities and assets for which representative market quotations are not readily available (e.g., if the exchange on which the security is principally traded closes early or if trading of the particular security is halted during the day and does not resume prior to the Trust’s net asset value calculation) or which cannot be accurately valued using the Trust’s normal pricing procedures are valued at fair value as determined in good faith under policies approved by the Trustees, who consist of the Independent Trustees, the Chairman, and the Chief Executive Officer of the Advisor. A security’s “fair value” price may differ from the price next available for that security using the Trust’s normal pricing procedures. Instruments with maturities of 60 days or less are valued at amortized cost, which approximates market value.
Investments in underlying investment vehicles are valued, as a practical expedient, utilizing the net asset valuations provided by the underlying investment vehicles and/or their administrators, without adjustment, when the net asset valuations of the investments are calculated in a manner consistent with GAAP for investment companies. The Trust applies the practical expedient to its investments in underlying investment vehicles on an investment-by-investment basis, and consistently with the Trust’s entire position in a particular underlying investment vehicle, unless it is probable that the Trust will sell a portion of an investment at an amount different from the net asset valuation. If it is probable that the Trust will sell an investment in the underlying investment vehicle at an amount different from the net asset valuation or in other situations where the practical expedient is not available, the Trust considers other factors in addition to the net asset valuation, such as subscription and redemption rights, expected discounted cash flows, transactions in the secondary market, bids received from potential buyers, and overall market conditions in its determination of fair value.
Valuation of Securities For Which Independent Pricing Sources Are Not Available
The Trust may hold certain interests in loans and other fixed income securities, including senior loans, and will not have readily available market quotations or will not be priced by an independent pricing source or pricing model. Such loans and fixed income securities will be valued by the Advisor, Forefront Capital Advisors, LLC (the “Advisor”), according to the fair value process set forth in the Trust’s valuation policies and procedures. Loans and other securities held by the Trust which do not trade in any market, which are not priced by an independent pricing source or pricing model, or which are deemed to be illiquid will be valued at fair value by the Advisor under valuations policies and procedures established by and under the general supervision and responsibility of the Trust’s Board of Trustees.
Forefront Income Trust
Notes to Financial Statements
(Unaudited)
The Advisor meets with the Board of Trustees on a quarterly basis, or more frequently as needed, to review and discuss the appropriateness of such fair values using more current information such as, recent security news, recent market transactions, updated corporate action information and/or other macro or security specific events. The Advisor is responsible for developing the Trust’s written valuation processes and procedures, conducting periodic reviews of the valuation policies, and evaluating the overall fairness and consistent application of the valuation policies as well as ensuring that the valuation methodologies for investments that are categorized within Level 3 of the fair value hierarchy are fair, consistent, and verifiable. Valuations determined by the Advisor are required to be supported by market data, third-party pricing sources, industry accepted third-party pricing models, counterparty prices, or other methods the Board of Trustees deem to be appropriate, including the use of internal proprietary pricing models. When determining the reliability of third party pricing information for investments owned by the Trust, the Board of Trustees, among other things, conducts due diligence reviews of pricing vendors, monitors the daily change in prices and reviews transactions among market participants.
Also, when observable inputs become available, the Board of Trustees conducts back testing of the methodologies used to value Level 3 financial instruments to substantiate the unobservable inputs used to value those investments. Such back testing includes comparing Level 3 investment values to observable inputs such as exchange-traded prices, transaction prices, and/or vendor prices.
The fair value methodologies and processes set forth in the Trust’s valuation policies and procedures take into account applicable regulatory and accounting guidance, including the fair value measurement standards incorporated in Financial Accounting Standards Board (“FASB”) Topic 820, in addition to other factors, as defined below.
Fair Value Measurement
Various inputs are used in determining the value of the Trust's investments. These inputs are summarized in the three broad levels listed below:
Level 1: quoted prices in active markets for identical securities
Level 2: other significant observable inputs (including quoted prices for similar securities and identical securities in inactive markets, interest rates, credit risk, etc.)
Level 3: significant unobservable inputs (including the Trust’s own assumptions in determining fair value of investments)
The availability of observable inputs can vary from security to security and is affected by a wide variety of factors, including, for example, the type of security, whether the security is new and not yet established in the marketplace, the liquidity of markets, and other characteristics particular to the security. To the extent that valuation is based on models or inputs that are less observable or unobservable in the market, the determination of fair value requires more judgment. Accordingly, the degree of judgment exercised in determining fair value is greatest for instruments categorized in Level 3.
The inputs used to measure fair value may fall into different levels of the fair value hierarchy. In such cases, for disclosure purposes, the level in the fair value hierarchy within which the fair value measurement falls in its entirety, is determined based on the lowest level input that is significant to the fair value measurement in its entirety.
Forefront Income Trust
Notes to Financial Statements
(Unaudited)
The inputs or methodology used for valuing securities are not necessarily an indication of the risk associated with investing in those securities. The following table summarizes the inputs as of March 31, 2018 for the Trust’s assets measured at fair value:
| Investments (a) | | Total | | | Level 1 | | | Level 2 | | | Level 3 | |
| Assets | | | | | | | | | | | | |
| Senior Loans | | $ | 2,953,500 | | | $ | - | | | $ | - | | | $ | 2,953,500 | |
| Structured Notes | | | 3,487,719 | | | | - | | | | - | | | | 3,487,719 | |
| Supplier Credit | | | 450,059 | | | | - | | | | - | | | | 450,059 | |
| Warrants | | | - | | | | - | | | | - | | | | - | |
| Short-Term Investment | | | 314,858 | | | | 314,858 | | | | - | | | | - | |
| Total | | $ | 7,206,136 | | | $ | 314,858 | | | $ | - | | | $ | 6,891,278 | |
| (a) | The Trust had no significant transfers into or out of Level 1, 2, or 3 during the period ended March 31, 2018. The Trust held Level 3 securities during the period. The aggregate value of such securities is 83.35% of net assets, and they have been fair valued under procedures approved by the Trust’s Board of Trustees. It is the Trust’s policy to record transfers at the end of the reporting period. |
The table below presents a reconciliation of all Level 3 fair value measurements existing at March 31, 2018:
| | | Senior Loans | | | Structured Notes | | | Supplier Credit | | | Warrants | �� |
| Opening Balance | | $ | 3,020,500 | | | $ | 5,112,750 | | | $ | 576,289 | | | $ | - | |
| Purchases | | | - | | | | - | | | | 934,769 | | | | - | |
| Principal payments/sales | | | - | | | | (1,590,031 | ) | | | (1,060,999 | ) | | | - | |
| Accrued discounts (premiums) | | | - | | | | - | | | | | | | | - | |
| Realized Gains | | | - | | | | - | | | | | | | | - | |
| Unrealized Losses | | | (67,000 | ) | | | (35,000 | ) | | | | | | | - | |
| Ending Balance | | $ | 2,953,500 | | | $ | 3,487,719 | | | $ | 450,059 | | | $ | - | |
Valuation Techniques
Senior Loans and Structured Notes
Investments in private operating companies also consist of senior loan investments and structured notes. The transaction price, excluding transaction costs, is typically the Trust’s best estimate of fair value at inception. When evidence supports a change to the carrying value from the transaction price, adjustments are made to reflect expected exit values in the investment’s principal market under current market conditions. Ongoing reviews by management are based on an assessment of each underlying investment from the inception date through the most recent valuation date. These assessments typically incorporate valuation techniques that consider trends in the performance and credit profile of each underlying investment, evaluation of arm’s length financing, an income approach based upon a discounted cash flow analysis and sales transactions with third parties. Inputs relied upon by debt investments using the income approach include an understanding of the underlying company’s compliance with debt covenants, the operating performance of the underlying company, trends in liquidity and financial leverage ratios of the underlying company from the point of the original investment to the stated valuation date, an assessment of the credit profile of the underlying company from the original investment to the stated valuation date, as well as an assessment of the underlying company’s business enterprise value, liquidation value and debt repayment capacity of each subject debt investment. In addition, inputs include an assessment of potential yield adjustments for each debt investment based upon trends in the credit profile of the underlying company and trends in the interest rate environment from the date of the original investment to the stated valuation date. Investments in senior loans and structured notes provided to private operating companies are generally included in Level 3 of the fair value hierarchy.
Forefront Income Trust
Notes to Financial Statements
(Unaudited)
Supplier Credit
The Trust’s investment in supplier credit is priced at estimated fair value which is based on the sales contract (invoice) value. The buyer is bound by the terms and conditions of the sale contract. Ongoing reviews by management are based on the investment’s financial performance measured by activity ratios like: receivables turnover ratio, liquidity ratios, assessment of market conditions and industry sector seasonality.
Short-Term Investment
Investments in the short term investment for the Blackrock Liquidity account was priced at the ending net asset value (NAV) provided by the service agent of the account. These securities will be categorized as Level 1 securities since they are valued at the closing price reported by an active market.
Warrants
The Trust may invest in derivative financial instruments (derivatives), like warrants, in order to manage risk or gain exposure to various other investments or markets. Derivatives may contain various risks including the potential inability of the counterparty to fulfill their obligations under the terms of the contract, the potential for an illiquid secondary market, and the potential for market movements which may expose the Fund to gains or losses in excess of the amounts shown on the Statement of Assets and Liabilities. Trust Level 3 investments in warrants have been valued by comparing quoted stock price against exercise price.
At March 31, 2018, investments in the Senior Loans, Structured Notes, and Supplier Credit within Level 3 have been valued at fair value using unadjusted third party transaction prices as described above by the Advisor. No unobservable inputs internally developed by the Trust have been applied to these investments, thus tabular disclosure has been omitted. The Senior Loans and Structured Notes are collateralized by underlying assets and/or real estate property. As part of the Trust’s analysis for entering into these loans as well as for its fair value analysis, the Advisor will value the collateral using valuation techniques such as the discounted cash flow method, the direct capitalization method and the comparable sales method. The Trust’s remaining Level 3 investment in the Limited Partnership was valued using the unadjusted net asset value of investments in private investment vehicles. No unobservable inputs internally developed by the Trust have been applied to this investment thus tabular disclosure has also been omitted.
Investment Transactions and Investment Income
Investment transactions are accounted for as of the date purchased or sold (trade date). Dividend income is recorded on the ex-dividend date. Certain dividends from investments will be recorded as soon as the Trust is informed of the dividend if such information is obtained subsequent to the ex-dividend date. Interest income is recorded on the accrual basis and includes accretion of discounts and amortization of premiums. Generally, when interest and/or principal payments on a loan become past due, or if the Trust otherwise does not expect the borrower to be able to service its debt and other obligations, the Trust will place the loan on non-accrual status and will generally cease recognizing interest income on that loan for financial reporting purposes until all principal and interest have been brought current through payment or due to restructuring such that the interest income is deemed to be collectible. The Trust generally restores non-accrual loans to accrual status when past due principal and interest is paid and, in the Trust’s judgment, the payments are likely to remain current. As of March 31, 2018, the Trust had no non-accrual assets held in its portfolio. Gains and losses are determined on the identified cost basis, which is the same basis used for federal income tax purposes.
Forefront Income Trust
Notes to Financial Statements
(Unaudited)
Expenses
The Trust bears expenses incurred specifically on its behalf as well as a portion of general Trust level expenses, which are allocated according to methods reviewed and approved annually by the Trustees. The expenses of the Trust are detailed below in Note 2.
Distributions
The Trust may declare and distribute dividends from net investment income (if any) quarterly. Distributions from capital gains (if any) are generally declared and distributed annually. Dividends and distributions to shareholders are determined in accordance with income tax regulations and are recorded on ex-dividend date.
Estimates
The preparation of financial statements in conformity with GAAP requires management to make estimates and assumptions that affect the reported amounts of assets and liabilities and disclosure of contingent assets and liabilities at the date of the financial statements and the reported amounts of increases and decreases in the net assets from operations during the reported period. Actual results could differ from those estimates.
Federal Income Taxes
No provision for income taxes is included in the accompanying financial statements, as the Trust intends to distribute to shareholders all taxable investment income and realized gains and otherwise comply with Subchapter M of the Internal Revenue Code applicable to regulated investment companies.
| 2. | Transactions with Affiliates and Service Providers |
Advisor
The Trust will not pay the Advisor a fixed management fee. The Trust will pay the Advisor an Advisory Fee annually in arrears for the previous fiscal year after the close of such fiscal year and in the first quarter following the close of such fiscal year, subject to the Trust having achieved an increase in its Pre-Advisory Fee Net Investment Income for that previous fiscal year of 8.00% (in other words, subject to the Trust having achieved an 8.00% Pre-Advisory Fee net return (the “Hurdle”) for its shareholders for that previous fiscal year.) The Advisor will receive no compensation until after the Hurdle is passed. Thereafter, the Advisory Fee will be charged, and will be equal to (i) 80% of the portion, if any, of the Trust’s Pre-Advisory Fee Net Investment Income (as defined below) that exceeds the 8.00% Hurdle but is less than or equal to an 18.00% return, plus (ii) 20% of the portion, if any, of the Trust’s Pre-Advisory Fee Net Investment Income that exceeds an 18.00% return. For the purposes of calculating the Advisory Fee, “Pre-Advisory Fee Net Investment Income shall mean, with respect to any fiscal year, interest income, dividend income, and any other income, including (i) any fees such as commitments and origination fees received by the Trust; (ii) any structuring, diligence, consulting, and any other fees received by the Trust, or by the Advisor and accruing to the Trust, in connection with the Trust investment; and (iii) any income received from investments with a deferred interest feature (such as original interest discount, pay in kind interest, and zero coupon securities), less other expenses. Pre-Advisory Fee Net Investment Income does not include any realized or unrealized capital gains. For the purposes of calculating Pre-Advisory Fee Net Investment Income, neither the liquidation preference of any preferred shares issued by the Trust nor the aggregate amount of any borrowings for investment purposes will be deducted from the Trust’s total assets. Pre-Advisory Fee Net Investment Income includes accrued income that we have not yet received in cash, such as the amount of any market discount we may accrue on debt instruments we purchase below par value. Total Advisory fees paid to the Advisor during the period ended March 31, 2018 were $236,578.
The Advisor has entered into a contractual agreement (the “Expense Limitation Agreement”) with the Trust, under which it has agreed to waive or reduce its fees and to assume other expenses of the Trust, if necessary, in amounts that limit the Trust’s total operating expenses (exclusive of interest, taxes, brokerage commissions, borrowing costs, fees and expenses of other investment companies in which the Trust invests, and other expenditures which are capitalized in accordance with generally accepted accounting principles, other extraordinary expenses not incurred in the ordinary course of the Trust’s business, and amounts, if any, payable under a Rule 12b-1 distribution plan) to not more than 1.75% of the average daily net assets of the Trust. The current term of the Expense Limitation Agreement remains in effect until December 31, 2018. While there can be no assurance that the Expense Limitation Agreement will continue after that date, it is expected to continue from year-to-year thereafter.
Forefront Income Trust
Notes to Financial Statements
(Unaudited)
The Advisor paid the initial organizational expenses of the Fund, which amounted to $37,500, and are subject to repayment by the Fund, provided the Fund is able to make such repayment without causing operating expenses to exceed the annual rate of 1.75% and provided that the fees and expenses which are subject of the repayment were incurred within three years of the repayment. As of the period ended March 31, 2018, the remaining amount for recoupment by the Advisor was $37,500. The Advisor reimbursed the Fund for $25,000 during the period.
Organizational and Deferred Offering Costs
The Fund’s organizational costs of $37,500, which were incurred prior to the commencement of operations through September 10, 2014, were reimbursed by the Advisor. The organizational costs consisted of legal fees incurred to establish and launch the Trust. The organizational costs are expensed as incurred.
The Fund’s offering costs consist of legal fees for preparing the initial prospectus and statement of additional information. These offering costs, which are subject to the Expense Limitation Agreement, are accounted for as deferred costs until the commencement of operations and, thereafter, amortized to expense over twelve months on a straight-line basis. For the period ended March 31, 2018, there were no remaining offering costs to be deferred in the Fund.
Administrator
The Trust has engaged S&Z Fund Services, LLC as its Administrator (the “Administrator”). For the period, the Trust paid the Administrator $37,500 in fees.
Compliance Services
Barge Consulting, LLC serves as the Trust’s Chief Compliance Officer. Barge Consulting, LLC is entitled to receive customary fees of $5,800 per month from the Trust for their services pursuant to the Compliance Services agreement with the Trust. The Trust incurred $34,800 in fees for compliance consulting services.
Transfer Agent
S&Z Fund Services, LLC (“Transfer Agent”) serves as transfer, dividend paying, and shareholder servicing agent for the Fund. S&Z Fund Services, LLC does not separately bill for these services.
Distributor
Rafferty Capital Markets, LLC (the “Distributor”) serves as the Trust’s principal distributor. The Distributor is entitled to receive customary fees of $1,333 per month from the Trust for their services pursuant to the Distribution Agreement with the Trust. The Trust incurred $11,111 in fees during this period.
Trustees
The Board of Trustees consists of one Independent Trustee. For the period from October 1, 2017 through March 31, 2018, the Trust incurred $20,000 in Trustee fees.
| 3. | Share Repurchase Program |
The Trust makes quarterly offers to repurchase its Shares pursuant to Rule 23c-3(b) under the 1940 Act. The Trust is authorized to repurchase between 5% and 25% of its Shares outstanding on the quarterly repurchase request deadline. However, no assurance can be given that shareholders will be able to sell all of their Shares tendered to the Trust pursuant to any particular repurchase offer or than any particular Shares tendered will be accepted in such a repurchase offer. Shares tendered for repurchase within 180 days from the date of the original issuance of the Shares will be subject to a repurchase fee of 2%. The Trust’s quarterly repurchase offers will end on the third Friday (or the preceding business day if such third Friday is not a business day) of each month in which a repurchase offer ends.
Forefront Income Trust
Notes to Financial Statements
(Unaudited)
Special Redemption Rights
In certain varying circumstances, an issuer of preferred securities may redeem the securities prior to a specified date. For instance, for certain types of preferred securities, a redemption may be triggered by certain changes in U.S. federal income tax or securities laws. As with call provisions, a special redemption by the issuer may negatively affect the return of the security held by the Trust.
| 4. | Purchases and Sales of Investment Securities |
For the period ended March 31, 2018, the aggregate cost of purchases and proceeds from sales of investment securities (excluding short-term securities) were as follows:
| Purchases of Securities | Proceeds from Sales and Maturities of Securities |
| $ 935,865 | $ 2,785,563 |
There were no long-term purchases or sales of U.S Government Obligations during the period ended March 31, 2018.
Distributions are determined in accordance with Federal income tax regulations, which differ from GAAP, and, therefore, may differ significantly in amount or character from net investment income and realized gains for financial reporting purposes. Financial reporting records are adjusted for permanent book/tax differences to reflect tax character but are not adjusted for temporary differences.
Management reviewed the Trust’s tax positions taken on federal income tax returns for the open tax period of September 30, 2017 and as of and during the period ended March 31, 2018, and concluded that the Trust does not have a liability for uncertain tax positions. The Trust recognizes interest and penalties, if any, related to unrecognized tax benefits as income tax expense in the Statement of Operations. During the year, the Trust did not incur any interest or penalties. The Trust identifies its major tax jurisdictions as U.S. Federal and New York State where the Trust makes its significant investments. The Trust does not expect that its assessment regarding unrecognized tax positions will change over the next twelve months. There are no income tax returns currently under examination.
Distributions during the periods ended were characterized for tax purposes as follows:
| | | March 31, 2018 | | | September 30, 2017 | |
| Ordinary Income | | $ | 1,082,445 | | | $ | 766,803 | |
At March 31, 2018, the tax-basis cost of investments and components of distributable earnings were as follows:
| Cost of Investments | | $ | 7,488,136 | |
| | | | | |
| Unrealized Appreciation | | | - | |
| Unrealized Depreciation | | | (282,000 | ) |
| Net Unrealized Appreciation | | $ | 7,206,136 | |
Forefront Income Trust
Notes to Financial Statements
(Unaudited)
| 6. | Commitments and Contingencies |
Under the Trust’s organizational documents, its officers and Trustees are indemnified against certain liabilities arising out of the performance of their duties to the Trust. In addition, in the normal course of business, the Trust entered into contracts with its service providers, on behalf of the Trust, and others that provide for general indemnifications. The Trust’s maximum exposure under these arrangements is unknown, as this would involve future claims that may be made against the Trust. The Trust expects the risk of loss to be remote.
| 7. | Investments in Restricted Securities |
Restricted securities include securities that have not been registered under the Securities Act of 1933. The Trust may invest in restricted securities that are consistent with the Trust’s investment strategy. Investments in restricted securities are valued at fair value under procedures approved by the Trust’s Board of Trustees.
As of March 31, 2018, the Trust was invested in the following restricted securities:
Security | Initial Purchase Date | Shares | Cost | Value | % of Net Assets |
Banjo & Matilda, Inc. | 6/18/2015 | 500,000 | $500,000 | $500,000 | 6.05% |
WBSH Met Tower, LLC | 6/30/2015 | 750,000 | $750,000 | $750,000 | 9.07% |
Auto Funding Group, LLC | 10/20/2015 | 2,700,500 | $2,700,500 | $2,453,500 | 29.67% |
1501 Sheepshead Bay Road Partners, LLC | 1/19/2016 | 172,625 | $172,625 | $172,625 | 2.09% |
Blaichbridge Driggs, LLC | 3/11/2016 | 435,000 | $435,000 | $435,000 | 5.26% |
| 2020 Eastchester Road, LLC | 4/19/2016 | 227,500 | $227,500 | $227,500 | 2.75% |
| Banjo & Matilda, Inc. | 1/4/2017 | 65,000 | $64,844 | $29,844 | 0.36% |
| 35 Tech Partners, LLC | 12/22/2016 | 500,000 | $500,000 | $500,000 | 6.05% |
| City Ridge Realty, LLC | 3/21/2017 | 400,000 | $400,000 | $400,000 | 4.84% |
| Club at Charter Point Realty, LLC | 3/21/2017 | 397,750 | $397,750 | $397,750 | 4.81% |
| CPRE Holdings, LLC | 9/19/2017 | 175,000 | $175,000 | $175,000 | 2.12% |
| Caroline Square Realty, LLC | 7/26/2017 | 400,000 | $400,000 | $400,000 | 4.84% |
| Chris’s Cookies | Various | 450,059 | $450,059 | $450,059 | 5.44% |
The Trust in the normal course of business makes investments in financial instruments where the risk of potential loss exists due to changes in the market (market risk), or failure or inability of the counterparty to a transaction to perform (credit and counterparty risk). See below for a detailed description of select principal risks.
Market risk. The Trust’s investments in financial instruments expose it to various risks such as, but not limited to, interest rate and equity. Interest rate risk is the risk that a fixed income investment's value will change due to a change in the absolute level of interest rates, in the spread between two rates, in the shape of the yield curve or in any other interest rate relationship. Such changes usually affect securities inversely and can be reduced by diversifying (for example, investing in fixed-income securities with different durations) or hedging (for example, through an interest rate swap).
Forefront Income Trust
Notes to Financial Statements
(Unaudited)
Equity risk. Equity Risk is the risk that the market values of equities, such as common stocks or equity related investments may decline due to general market conditions, such a political or macroeconomic factors. Additionally, equities may decline in value due to specific factors affecting a related industry or industries. Equity securities and equity related investments generally have greater market price volatility than fixed income securities.
Credit and counterparty risks. The Trust is exposed to credit risk to counterparties with whom it transacts with and also bears the risk of settlement default. The Trust may lose money if the issuer or guarantor of a fixed income security is unable or unwilling to make timely principal and/or interest payments, or to otherwise honor its obligations.
In accordance with GAAP, the Trust has evaluated the need for disclosures and/or adjustments resulting from subsequent events through the date of issuance of these financial statements. Management has evaluated subsequent events through the issuance of these financial statements.
On May 14, 2018, the investment advisory agreement between the Trust and the Advisor expired and was not renewed by the Trust’s board of trustees (the “Board”). Since that time, the Board has considered a number of options for the future of the Trust. On June 11, 2018, the Board approved a plan of liquidation and dissolution for the Trust (the “Plan”). The Plan provides that the Trust will begin to liquidate its assets immediately and will return funds to the shareholders as the Trust is able to liquidate its holdings. The Plan contemplates that this process will take several months and expects there to be several distributions to shareholders over the course of the liquidation. The Board is considering possible options regarding who will lead the process of liquidation, but no agreement has been reached as of the date of this Report.
Forefront Income Trust
Additional Information
(Unaudited)
| 1. | Proxy Voting Policies and Voting Record |
A copy of the Trust’s Proxy Voting and Disclosure Policy and the Advisor’s Disclosure Policy are included as Appendix B to the Trust’s Statement of Additional Information and are available, without charge, upon request, on the website of the Securities and Exchange Commission (“SEC”) at sec.gov. Information regarding how the Trust voted proxies relating to portfolio securities during the most recent period ended June 30, is available (1) without charge, upon request, by calling the Trust at the number above and (2) on the SEC’s website at sec.gov.
| 2. | Quarterly Portfolio Holdings |
The Trust files its complete schedule of portfolio holdings with the SEC for the first and third quarters of each fiscal year on Form N-Q. The Trust’s Forms N-Q are available on the SEC’s website at sec.gov. You may review and make copies at the SEC’s Public Reference Room in Washington, D.C. Information on the operation of the Public Reference Room may be obtained by calling the SEC at 800-SEC-0330.
We are required to advise you within 60 days of the Trust’s fiscal year-end regarding the federal tax status of certain distributions received by shareholders during each fiscal year. The following information is provided for the Trust’s period ended March 31, 2018.
During the period, there were $1,082,445 in income distributions paid by the Trust.
Dividend and distributions received by retirement plans such as IRAs, Keogh-type plans, and 403(b) plans need not be reported as taxable income. However, many retirement plans may need this information for their annual information meeting.
| 4. | Schedule of Shareholder Expenses |
As a shareholder of the Fund, you incur two types of costs: (1) transaction costs, including sales charges (loads) on purchase payments, reinvested dividends, or other distributions; redemption fees; and exchange fees; and (2) ongoing costs, including management fees; distribution [and/or service] (12b-1) fees; and other Fund expenses. This Example is intended to help you understand your ongoing costs (in dollars) of investing in the Fund and to compare these costs with the ongoing costs of investing in other mutual funds.
The Example is based on an investment of $1,000 invested at the beginning of the period and held for the entire period from October 1, 2017 through March 31, 2018.
Actual Expenses – The first line of the table below provides information about actual account values and actual expenses. You may use the information in this line, together with the amount you invested, to estimate the expenses that you paid over the period. Simply divide your account value by $1,000 (e.g., an $8,600 account value divided by $1,000 = 8.6), then multiply the result by the number in the first line under the heading entitled “Expenses Paid During Period” to estimate the expenses you paid on your account during this period.
Hypothetical Example for Comparison Purposes – The second line of the table below provides information about hypothetical account values and hypothetical expenses based on the Fund’s actual expense ratio and an assumed rate of return of 5% per year before expenses, which is not the Fund’s actual return. The hypothetical account values and expenses may not be used to estimate the actual ending account balance or expenses you paid for the period. You may use this information to compare the ongoing costs of investing in the Fund and other funds. To do so, compare this 5% hypothetical example with the 5% hypothetical examples that appear in the shareholder reports of the other funds.
Please note that the expenses shown in the table are meant to highlight your ongoing costs only and do not reflect any transactional costs, such as sales charges (loads), redemption fees, or exchange fees. Therefore, the second line of the table is useful in comparing ongoing costs only, and will not help you determine the relative total costs of owning different funds. In addition, if these transactional costs were included, your costs would have been higher.
Forefront Income Trust
Additional Information
(Unaudited)
| Forefront Income Trust | Beginning Account Value October 1, 2017 | Ending Account Value March 31, 2018 | Expenses Paid During Period* |
| Actual | $1,000.00 | $1,017.05 | $4.17 |
| Hypothetical (5% annual return before expenses) | $1,000.00 | $1,020.79 | $4.18 |
| * | Expenses are equal to the average account value over the period multiplied by the Trust’s annualized expense ratio multiplied by 182/365 (to reflect the one-half year period). |
Forefront Income Trust
Additional Information
(Unaudited)
Approval of Investment Advisory Agreement (Unaudited)
At an in-person meeting (the “Meeting”) of the Board of Trustees of Forefront Income Trust (the “Fund”) held on November 14, 2017, the Board considered the renewal of the investment advisory agreement (the “Agreement”) between Forefront Capital Advisors, LLC (the “Advisor”) and the Fund.
Prior to the Meeting, the Advisor provided the Board with materials in response to written questions sent to the Advisor by counsel to the Fund (the “Materials”). At the meeting, Mr. Reifler discussed the Materials and discussed each investment held by the Fund and how it had performed over the period that it had been held. Mr. Reifler explained that the Advisor was pleased with the performance of the Fund’s investments but was not pleased with the sales of shares of the Fund. He further explained that the Fund had not grown to the size where it had sufficient assets to cover its expenses. In response to questions from the Board, Mr. Reifler explained that the Fund’s unique fee structure, which the Advisor believed was very favorable to investors, proved to be a challenge in selling the Fund because it was unfamiliar to most financial intermediaries.
In considering the renewal of the Advisory Agreement, the Board took into consideration all of the Materials, the presentations made during the meeting, and the comprehensive discussions during the Meeting. After the discussions during the main portion of the Meeting, the Board’s sole Independent Trustee met in executive session with independent counsel, with the Fund’s chief compliance officer, and with Bradley Reifler.
Nature, Extent and Quality of Services.
The Board examined the nature, extent and quality of the services that had been provided by the Advisor. The Board noted that the Advisor had developed a relationship with each of the Fund’s portfolio companies and was intimately familiar with the business of each such company. The Board determined that the Advisor’s knowledge of the portfolio companies was very important in connection with assessing each such company’s ability to return capital to the Fund. The Advisor also discussed its process for evaluating new companies in which to invest.
The Board discussed ongoing regulatory matters and litigation concerning affiliates of the Advisor. The Advisor assured the Board that such matters were not a distraction to the Advisor’s ability to provide services to the Fund.
Investment Performance.
The Board examined the performance history of the Fund and compared such performance to similar Funds. The Board concluded that the Fund’s performance had been satisfactory.
Fees and Expenses.
The Board examined the fee structure of the Fund as compared to similar Funds. The Board acknowledged that the Fund’s fee structure was unique in that there was no base management fee. The Board concluded that the fee structure was satisfactory to investors.
Economies of Scale
Given the size of the Fund, the Board determined that there were no economies of scale.
Profitability
In connection with assessing the Advisor’s profitability, the Board focused on the expense limitation agreement between the Advisor and the Fund and determined that, given the asset size of the Fund, the Advisor’s relationship with the Fund was not likely to be profitable.
Forefront Income Trust
Additional Information
(Unaudited)
Future of the Fund
Given the low asset level of the Fund, the Board determined that the Advisor should examine options for the Fund’s future and present such options to the Board at a future meeting.
Conclusion
Having requested and received such information from the Adviser as the Board believed to be reasonably necessary to evaluate the terms of the Agreement, the Board concluded that the Agreement should be renewed for a period of six months rather than a full year to allow the Advisor time to examine options for the future of the Fund. The Board asked that the Advisor keep the Board updated regarding the Advisors suggestions for the future of the Fund.
(This page has been left blank intentionally.)
Forefront Income Trust
| For Shareholder Service Inquiries: | For Investment Advisor Inquiries: |
| | |
| S&Z Fund Services, LLC | Forefront Capital Advisors, LLC |
| 145 Pinelawn Road | 641 Lexington Avenue |
| Suite 200 South | 29th Floor |
| Melville, New York 11747 | New York, NY 10022 |
| | |
| Telephone: | |
| 631-368-3110 | |
| | |
| | World Wide Web @: |
| | |
| | forefrontcapitaladvisors.com |
Distributor:
Rafferty Capital Markets, LLC
1010 Franklin Avenue
Suite 300A
Garden City, NY 11530
There is no affiliation between Forefront Income Trust, including its principals, and Rafferty Capital Markets, LLC.
Not applicable.
| Item 3. | AUDIT COMMITTEE FINANCIAL EXPERT. |
Not applicable.
| Item 4. | PRINCIPAL ACCOUNTANT FEES AND SERVICES. |
Not applicable.
| Item 5. | AUDIT COMMITTEE OF LISTED REGISTRANTS. |
Not applicable.
| Item 6. | SCHEDULE OF INVESTMENTS. |
A copy of Schedule I - Investments in securities of unaffiliated issuers as of the close of the reporting period is included as part of the report to shareholders filed under Item 1 of this Form.
| Item 7. | DISCLOSURE OF PROXY VOTING POLICIES AND PROCEDURES FOR CLOSED-END MANAGEMENT INVESTMENT COMPANIES. |
Not applicable.
| Item 8. | PORTFOLIO MANAGERS OF CLOSED-END MANAGEMENT INVESTMENT COMPANIES. |
Not applicable.
| Item 9. | PURCHASES OF EQUITY SECURITIES BY CLOSED-END MANAGEMENT INVESTMENT COMPANY AND AFFILIATED PURCHASERS. |
Not applicable.
| Item 10. | SUBMISSION OF MATTERS TO A VOTE OF SECURITYHOLDERS. |
None.
| Item 11. | CONTROLS AND PROCEDURES. |
| (a) | The Chief Executive Officer and the Chief Financial Officer have concluded that the registrant’s disclosure controls and procedures are effective based on their evaluation of the disclosure controls and procedures as of a date within 90 days of the filing of this report. |
| (b) | There were no changes in the registrant's internal control over financial reporting that occurred during the registrant’s second fiscal quarter of the period covered by this report that have materially affected, or are reasonably likely to materially affect, the registrant’s internal control over financial reporting. |
| (a)(2) | Certifications required by Item 12.(a)(2) of Form N-CSR are filed herewith as Exhibit 12.(a)(2). |
| (b) | Certifications required by Item 12.(b) of Form N-CSR are filed herewith as Exhibit 12.(b). |
SIGNATURES
Pursuant to the requirements of the Securities Exchange Act of 1934 and the Investment Company Act of 1940, the registrant has duly caused this report to be signed on its behalf by the undersigned, thereunto duly authorized.
Forefront Income Trust
| By: (Signature and Title) | /s/Brad Reifler | |
| | Brad Reifler | |
| Date: October 22, 2018 | Principal Executive Officer | |
Pursuant to the requirements of the Securities Exchange Act of 1934 and the Investment Company Act of 1940, this report has been signed below by the following persons on behalf of the registrant and in the capacities and on the dates indicated.
| By: (Signature and Title) | /s/Brad Reifler | |
| | Brad Reifler | |
| Date: October 22, 2018 | Principal Executive Officer | |