| FREE WRITING PROSPECTUS | ||
| FILED PURSUANT TO RULE 433 | ||
| REGISTRATION FILE NO.: 333-172366-13 | ||
 |  |
Free Writing Prospectus
Structural and Collateral Term Sheet
$1,251,672,501
(Approximate Aggregate Cut-off Date Balance of Mortgage Pool)
$1,079,567,000
(Approximate Aggregate Principal Balance of Offered Certificates)
WFRBS Commercial Mortgage Trust 2014-C20
as Issuing Entity
Wells Fargo Commercial Mortgage Securities, Inc.
as Depositor
Wells Fargo Bank, National Association
The Royal Bank of Scotland
Rialto Mortgage Finance, LLC
C-III Commercial Mortgage LLC
Liberty Island Group I LLC
NCB, FSB
Basis Real Estate Capital II, LLC
as Sponsors and Mortgage Loan Sellers
Commercial Mortgage Pass-Through Certificates
Series 2014-C20
April 22, 2014
| WELLS FARGO SECURITIES | RBS | |
Co-Lead Manager and Co-Bookrunner | Co-Lead Manager and Co-Bookrunner | |
Deutsche Bank Securities Co-Manager | ||
STATEMENT REGARDING THIS FREE WRITING PROSPECTUS
The depositor has filed a registration statement (including a prospectus) with the Securities and Exchange Commission (‘‘SEC’’) (SEC File No. 333-172366) for the offering to which this communication relates. Before you invest, you should read the prospectus in the registration statement and other documents the depositor has filed with the SEC for more complete information about the depositor, the issuing entity and this offering. You may get these documents for free by visiting EDGAR on the SEC Web site at www.sec.gov. Alternatively, the depositor, any underwriter, or any dealer participating in the offering will arrange to send you the prospectus after filing if you request it by calling toll free 1-800-745-2063 (8 a.m. – 5 p.m. EST) or by emailing wfs.cmbs@wellsfargo.com.
Nothing in this document constitutes an offer of securities for sale in any other jurisdiction where the offer or sale is not permitted. The information contained herein is preliminary as of the date hereof, supersedes any such information previously delivered to you and will be superseded by any such information subsequently delivered and ultimately by the final prospectus relating to the securities. These materials are subject to change, completion, supplement or amendment from time to time.
STATEMENT REGARDING ASSUMPTIONS AS TO SECURITIES, PRICING ESTIMATES AND OTHER INFORMATION
The attached information contains certain tables and other statistical analyses (the “Computational Materials”) which have been prepared in reliance upon information furnished by the Mortgage Loan Sellers. Numerous assumptions were used in preparing the Computational Materials, which may or may not be reflected herein. As such, no assurance can be given as to the Computational Materials’ accuracy, appropriateness or completeness in any particular context; or as to whether the Computational Materials and/or the assumptions upon which they are based reflect present market conditions or future market performance. The Computational Materials should not be construed as either projections or predictions or as legal, tax, financial or accounting advice. You should consult your own counsel, accountant and other advisors as to the legal, tax, business, financial and related aspects of a purchase of these securities. Any weighted average lives, yields and principal payment periods shown in the Computational Materials are based on prepayment and/or loss assumptions, and changes in such prepayment and/or loss assumptions may dramatically affect such weighted average lives, yields and principal payment periods. In addition, it is possible that prepayments or losses on the underlying assets will occur at rates higher or lower than the rates shown in the attached Computational Materials. The specific characteristics of the securities may differ from those shown in the Computational Materials due to differences between the final underlying assets and the preliminary underlying assets used in preparing the Computational Materials. The principal amount and designation of any security described in the Computational Materials are subject to change prior to issuance. None of Wells Fargo Securities, LLC (“WFS”), RBS Securities Inc. (“RBSSI”), Deutsche Bank Securities Inc. or any of their respective affiliates make any representation or warranty as to the actual rate or timing of payments or losses on any of the underlying assets or the payments or yield on the securities. The information in this presentation is based upon management forecasts and reflects prevailing conditions and management’s views as of this date, all of which are subject to change. In preparing this presentation, we have relied upon and assumed, without independent verification, the accuracy and completeness of all information available from public sources or which was provided to us by or on behalf of the Mortgage Loan Sellers or which was otherwise reviewed by us.
This free writing prospectus contains certain forward-looking statements. If and when included in this free writing prospectus, the words “expects”, “intends”, “anticipates”, “estimates” and analogous expressions and all statements that are not historical facts, including statements about our beliefs or expectations, are intended to identify forward-looking statements. Any forward-looking statements are made subject to risks and uncertainties which could cause actual results to differ materially from those stated. Those risks and uncertainties include, among other things, declines in general economic and business conditions, increased competition, changes in demographics, changes in political and social conditions, regulatory initiatives and changes in customer preferences, many of which are beyond our control and the control of any other person or entity related to this offering. The forward-looking statements made in this free writing prospectus are made as of the date stated on the cover. We have no obligation to update or revise any forward-looking statement.
Wells Fargo Securities is the trade name for certain capital markets and investment banking services of Wells Fargo & Company and its subsidiaries, including Wells Fargo Securities, LLC, member FINRA and SIPC, and Wells Fargo Bank, National Association.
RBS is a trade name for the investment banking business of RBSSI. Securities, syndicated loan arranging, financial advisory and other investment banking activities are performed by RBSSI and their securities affiliates. Lending, derivatives and other commercial banking activities are performed by The Royal Bank of Scotland plc and their banking affiliates. RBSSI is a member of SIPC, FINRA and the NYSE.
IRS CIRCULAR 230 NOTICE
THIS TERM SHEET IS NOT INTENDED OR WRITTEN TO BE USED, AND CANNOT BE USED, FOR THE PURPOSE OF AVOIDING U.S. FEDERAL, STATE OR LOCAL TAX PENALTIES. THIS TERM SHEET IS WRITTEN AND PROVIDED BY THE DEPOSITOR IN CONNECTION WITH THE PROMOTION OR MARKETING BY THE DEPOSITOR AND THE CO-LEAD BOOKRUNNING MANAGERS OF THE TRANSACTION OR MATTERS ADDRESSED HEREIN. INVESTORS SHOULD SEEK ADVICE BASED ON THEIR PARTICULAR CIRCUMSTANCES FROM AN INDEPENDENT TAX ADVISOR.
IMPORTANT NOTICE REGARDING THE OFFERED CERTIFICATES
The Offered Certificates referred to in these materials and the asset pool backing them are subject to modification or revision (including the possibility that one or more classes of certificates may be split, combined or eliminated at any time prior to issuance or availability of a final prospectus) and are offered on a “when, as and if issued” basis. Prospective investors should understand that, when considering the purchase of the Offered Certificates, a contract of sale will come into being no sooner than the date on which the relevant class of certificates has been priced and the underwriters have confirmed the allocation of certificates to be made to investors; any “indications of interest” expressed by any prospective investor, and any “soft circles” generated by the underwriters, will not create binding contractual obligations for such prospective investors, on the one hand, or the underwriters, the depositor or any of their respective agents or affiliates, on the other hand.
As a result of the foregoing, a prospective investor may commit to purchase certificates that have characteristics that may change, and each prospective investor is advised that all or a portion of the certificates referred to in these materials may be issued without all or certain of the characteristics described in these materials. The underwriters’ obligation to sell certificates to any prospective investor is conditioned on the certificates and the transaction having the characteristics described in these materials. If the underwriters determine that a condition is not satisfied in any material respect, such prospective investor will be notified, and neither the depositor nor the underwriters will have any obligation to such prospective investor to deliver any portion of the Offered Certificates which such prospective investor has committed to purchase, and there will be no liability between the underwriters, the depositor or any of their respective agents or affiliates, on the one hand, and such prospective investor, on the other hand, as a consequence of the non-delivery.
Each prospective investor has requested that the underwriters provide to such prospective investor information in connection with such prospective investor’s consideration of the purchase of the certificates described in these materials. These materials are being provided to each prospective investor for informative purposes only in response to such prospective investor’s specific request. The underwriters described in these materials may from time to time perform investment banking services for, or solicit investment banking business from, any company named in these materials. The underwriters and/or their affiliates or respective employees may from time to time have a long or short position in any security or contract discussed in these materials.
The information contained herein supersedes any previous such information delivered to any prospective investor and will be superseded by information delivered to such prospective investor prior to the time of sale.
IMPORTANT NOTICE RELATING TO AUTOMATICALLY-GENERATED EMAIL DISCLAIMERS
Any legends, disclaimers or other notices that may appear at the bottom of any email communication to which this free writing prospectus is attached relating to (1) these materials not constituting an offer (or a solicitation of an offer), (2) no representation that these materials are accurate or complete and may not be updated or (3) these materials possibly being confidential, are not applicable to these materials and should be disregarded. Such legends, disclaimers or other notices have been automatically generated as a result of these materials having been sent via Bloomberg or another system.
THE INFORMATION IN THIS STRUCTURAL AND COLLATERAL TERM SHEET IS NOT COMPLETE AND MAY BE AMENDED PRIOR TO THE TIME OF SALE. THIS TERM SHEET IS NOT AN OFFER TO SELL THESE SECURITIES AND IT IS NOT A SOLICITATION OF AN OFFER TO BUY THESE SECURITIES IN ANY JURISDICTION WHERE THE OFFER OR SALE IS NOT PERMITTED.
2
| WFRBS Commercial Mortgage Trust 2014-C20 | Certificate Structure |
| I. | Certificate Structure |
Expected Ratings (DBRS/KBRA/Moody’s)(1) | Approximate Initial Certificate Principal Balance or Notional Amount(2) | Approx. Initial Credit Support(3) | Pass-Through Rate Description | Weighted Average Life (Years)(4) | Expected Principal Window(4) | Certificate Principal to Value Ratio(5) | Certificate Principal U/W NOI Debt Yield(6) | |||||||||||
| Offered Certificates | ||||||||||||||||||
| A-1 | AAA(sf)/AAA(sf)/Aaa(sf) | $70,328,000 | 30.000% | (7) | 2.63 | 06/14 – 02/19 | 34.7% | 17.5% | ||||||||||
| A-2 | AAA(sf)/AAA(sf)/Aaa(sf) | $95,556,000 | 30.000% | (7) | 4.92 | 02/19 – 05/19 | 34.7% | 17.5% | ||||||||||
| A-3 | AAA(sf)/AAA(sf)/Aaa(sf) | $45,543,000 | 30.000% | (7) | 6.92 | 04/21 – 04/21 | 34.7% | 17.5% | ||||||||||
| A-4 | AAA(sf)/AAA(sf)/Aaa(sf) | $250,000,000 | 30.000% | (7) | 9.82 | 01/24 – 04/24 | 34.7% | 17.5% | ||||||||||
| A-5 | AAA(sf)/AAA(sf)/Aaa(sf) | $312,986,000 | 30.000% | (7) | 9.92 | 04/24 – 04/24 | 34.7% | 17.5% | ||||||||||
| A-SB | AAA(sf)/AAA(sf)/Aaa(sf) | $101,757,000 | 30.000% | (7) | 7.40 | 05/19 – 01/24 | 34.7% | 17.5% | ||||||||||
A-S(8) | AAA(sf)/AAA(sf)/Aaa(sf) | $62,584,000 | 25.000% | (7) | 9.92 | 04/24 – 04/24 | 37.2% | 16.3% | ||||||||||
| X-A | AAA(sf)/AAA(sf)/Aaa(sf) | $938,754,000 | (9) | N/A | Variable(10) | N/A | N/A | N/A | N/A | |||||||||
| X-B | AAA(sf)/AAA(sf)/NR | $223,736,000 | (11) | N/A | Variable(12) | N/A | N/A | N/A | N/A | |||||||||
B(8) | AA(low)(sf)/AA-(sf)/Aa3(sf) | $95,440,000 | 17.375% | (7) | 9.92 | 04/24 – 05/24 | 41.0% | 14.8% | ||||||||||
C(8) | A(low)(sf)/A-(sf)/A3(sf) | $45,373,000 | 13.750% | (7) | 10.01 | 05/24 – 05/24 | 42.8% | 14.2% | ||||||||||
PEX(8) | A(low)(sf)/A-(sf)/A1(sf) | $203,397,000 | 13.750% | (7) | 9.94 | 04/24 – 05/24 | 42.8% | 14.2% | ||||||||||
Non-Offered Certificates | ||||||||||||||||||
| X-C | AAA(sf)/NR/NR | $89,182,501 | (13) | N/A | Variable(14) | N/A | N/A | N/A | N/A | |||||||||
| D | BBB(low)(sf)/BBB-(sf)/NR | $82,923,000 | 7.125% | (7) | 10.01 | 05/24 – 05/24 | 46.0% | 13.2% | ||||||||||
| E | BB(low)(sf)/BB-(sf)/NR | $32,857,000 | 4.500% | (7) | 10.01 | 05/24 – 05/24 | 47.3% | 12.8% | ||||||||||
| F | B(low)(sf)/B-(sf)/NR | $18,775,000 | 3.000% | (7) | 10.01 | 05/24 – 05/24 | 48.1% | 12.6% | ||||||||||
| G | NR/NR/NR | $37,550,501 | 0.000% | (7) | 10.01 | 05/24 – 05/24 | 49.6% | 12.2% | ||||||||||
| Notes: | |
| (1) | The expected ratings presented are those of DBRS, Inc. (“DBRS”), Kroll Bond Rating Agency, Inc. (“KBRA”) and Moody’s Investors Service, Inc. (“Moody’s”) which the depositor hired to rate the offered certificates. One or more other nationally recognized statistical rating organizations that were not hired by the depositor may use information they receive pursuant to Rule 17g-5 under the Securities Exchange Act of 1934, as amended (the “Exchange Act”) or otherwise, to rate or provide market reports and/or published commentary related to the offered certificates. We cannot assure you as to what ratings a non-hired nationally recognized statistical rating organization would assign or that its reports will not express differing, possibly negative, views of the mortgage loans and/or the offered certificates. The ratings of each class of offered certificates address the likelihood of the timely distribution of interest and, except in the case of the Class X-A and Class X-B certificates, the ultimate distribution of principal due on those classes on or before the Rated Final Distribution Date. See “Risk Factors—Risks Related to the Offered Certificates—Ratings of the Certificates Have Substantial Limitations” and “Ratings” in the free writing prospectus, dated April 22, 2014 (the “Free Writing Prospectus”). |
| (2) | The principal balances and notional amounts set forth in the table are approximate. The actual initial principal balances and notional amounts may be larger or smaller depending on the aggregate cut-off date principal balance of the mortgage loans definitively included in the pool of mortgage loans, which aggregate cut-off date principal balance may be as much as 5% larger or smaller than the amount presented in the Free Writing Prospectus. |
| (3) | The approximate initial credit support with respect to the Class A-1, A-2, A-3, A-4, A-5 and A-SB Certificates represents the approximate credit enhancement for the Class A-1, A-2, A-3, A-4, A-5 and A-SB Certificates in the aggregate. The percentage indicated under the column “Approx. Initial Credit Support” with respect to the Class C Certificates and the Class PEX Certificates represents the approximate credit support for the Class C regular interest, which will have an initial outstanding principal balance on the closing date of $45,373,000. |
| (4) | Weighted Average Lives and Expected Principal Windows are calculated based on an assumed prepayment rate of 0% CPR and the “Structuring Assumptions” described on Annex B to the Free Writing Prospectus. |
| (5) | The Certificate Principal to Value Ratio for each Class of Certificates (other than the Class A-1, A-2, A-3, A-4, A-5 and A-SB Certificates and other than the Exchangeable Certificates) is calculated by dividing the aggregate principal balance of such class of certificates and all classes of certificates (other than the Exchangeable Certificates), if any, that are senior to such class, by the aggregate appraised value of approximately $2,524,727,642 (calculated as described in the Free Writing Prospectus) of the mortgaged properties securing the mortgage loans (excluding, with respect to each pari passu loan combination, a pro rata portion of the related appraised value allocated to the related companion loan(s) based on their cut-off date principal balance). The Certificate Principal to Value Ratios for each of the Class A-1, A-2, A-3, A-4, A-5 and A-SB Certificates are calculated by dividing the aggregate principal balance of the Class A-1, A-2, A-3, A-4, A-5 and A-SB Certificates by such aggregate appraised value (excluding, with respect to each pari passu loan combination, a pro rata portion of the related appraised value allocated to the related companion loan(s) based on their cut-off date principal balance). The Certificate Principal to Value Ratio for each of the Class A-S, B and C Certificates is calculated by dividing the aggregate principal balance of the Class A-S regular interest, the Class B regular interest or the Class C regular interest, as applicable, and all other classes of certificates (other than the Exchangeable Certificates) and the regular interests that are senior to such class, by such aggregate appraised value (excluding, with respect to each pari passu loan combination, a pro rata portion of the related appraised value allocated to the related companion loan(s) based on their cut-off date principal balance). The Certificate Principal to Value Ratio of the Class PEX Certificates is equal to the Certificate Principal to Value Ratio of the Class C Certificates. In any event, however, excess mortgaged property value associated with a mortgage loan will not be available to offset losses on any other mortgage loan (unless such mortgage loans are cross-collateralized and the cross-collateralization remains in effect). |
| (6) | The Certificate Principal U/W NOI Debt Yield for each Class of Certificates (other than the Class A-1, A-2, A-3, A-4, A-5 and A-SB Certificates and other than the Exchangeable Certificates) is calculated by dividing the underwritten net operating income (which excludes, with respect to each pari passu loan combination, a pro rata portion of the related underwritten net operating income allocated to the related companion loan(s) based on their cut-off date principal balance) for the mortgage pool of approximately $153,247,798 (calculated as described in the Free Writing Prospectus) by the aggregate certificate principal balance of such class of certificates and all classes of certificates (other than the Exchangeable Certificates), if any, that are senior to such class of certificates. The Certificate Principal U/W NOI Debt Yield for each of the Class A-1, A-2, A-3, A-4, A-5 and A-SB Certificates is calculated by dividing such mortgage pool underwritten net operating income (which excludes, with respect to each pari passu loan combination, a pro rata portion of the related underwritten net operating income allocated to the related companion loan(s) based on their cut-off date principal balance) by the aggregate principal balance of the Class A-1, A-2, A-3, A-4, A-5 and A-SB Certificates. The Certificate Principal U/W NOI Debt Yield for each of the Class A-S, B and C Certificates is calculated by dividing the underwritten net operating income (which excludes, with respect to each pari passu loan combination, a pro rata portion of the related underwritten net operating income allocated to the related companion loan(s) based on their cut-off date principal balance) for the mortgage pool of approximately $153,247,798 (calculated as described in the Free Writing Prospectus) by the aggregate principal balance of the Class A-S regular interest, the Class B regular interest or the Class C regular interest, as applicable, and all other classes of certificates (other than the Exchangeable Certificates) and the regular interests that are senior to such class. The Certificate Principal U/W NOI Debt Yield of the Class PEX Certificates is equal to the Certificate Principal U/W NOI Debt Yield for the Class C Certificates. In any event, however, cash flow from each mortgaged property supports only the related |
THE INFORMATION IN THIS STRUCTURAL AND COLLATERAL TERM SHEET IS NOT COMPLETE AND MAY BE AMENDED PRIOR TO THE TIME OF SALE. THIS TERM SHEET IS NOT AN OFFER TO SELL THESE SECURITIES AND IT IS NOT A SOLICITATION OF AN OFFER TO BUY THESE SECURITIES IN ANY JURISDICTION WHERE THE OFFER OR SALE IS NOT PERMITTED.
3
| WFRBS Commercial Mortgage Trust 2014-C20 | Certificate Structure |
| mortgage loan and will not be available to support any other mortgage loan (unless such mortgage loans are cross-collateralized and the cross-collateralization remains in effect). | |
| (7) | The pass-through rates for the Class A-1, A-2, A-3, A-4, A-5, A-SB, A-S, B, C, D, E, F and G Certificates in each case will be one of the following: (i) a fixed rate per annum, (ii) the weighted average of the net mortgage interest rates on the mortgage loans for the related distribution date, (iii) a variable rate per annum equal to the lesser of (a) a fixed rate and (b) the weighted average of the net mortgage interest rates on the mortgage loans for the related distribution date or (iv) a variable rate per annum equal to the weighted average of the net mortgage interest rates on the mortgage loans for the related distribution date minus a specified percentage. For purposes of the calculation of the weighted average of the net mortgage interest rates on the mortgage loans for each distribution date, the mortgage interest rates will be adjusted as necessary to a 30/360 basis. The Class PEX Certificates will not have a pass-through rate, but will be entitled to receive the sum of the interest distributable on the Class PEX Components. The pass-through rate for the Class A-S Certificates, the Class A-S regular interest and the Class PEX Component A-S will, at all times, be the same. The pass-through rate for the Class B Certificates, the Class B regular interest and the Class PEX Component B will, at all times, be the same. The pass-through rate for the Class C Certificates, the Class C regular interest and the Class PEX Component C will, at all times, be the same. |
| (8) | The Class A-S, B, C and PEX Certificates are “Exchangeable Certificates”. On the closing date, the upper-tier REMIC of the issuing entity will issue the Class A-S, B and C regular interests (each a “regular interest”) which will have outstanding principal balances on the closing date of $62,584,000, $95,440,000 and $45,373,000, respectively. The regular interests will be held in a grantor trust for the benefit of the holders of the Class A-S, B, C and PEX Certificates. The Class A-S, B, C and PEX Certificates will, at all times, represent undivided beneficial ownership interests in a grantor trust that will hold those regular interests. Each class of the Class A-S, B and C Certificates will, at all times, represent an undivided beneficial ownership interest in a percentage of the outstanding certificate principal balance of the regular interest with the same alphabetical class designation. The Class PEX Certificates will, at all times, represent an undivided beneficial ownership interest in the remaining percentages of the outstanding certificate principal balances of the Class A-S, B and C regular interests and which portions of those regular interests are referred to in this Term Sheet as the Class PEX Component A-S, Class PEX Component B and Class PEX Component C (collectively, the “Class PEX Components”). Following any exchange of Class A-S, B and C Certificates for Class PEX Certificates or any exchange of Class PEX Certificates for Class A-S, B and C Certificates as described in the Free Writing Prospectus, the percentage interest of the outstanding certificate principal balances of the Class A-S, B and C regular interest that is represented by the Class A-S, B, C and PEX Certificates will be increased or decreased accordingly. The initial certificate principal balance of each of the Class A-S, B and C Certificates shown in the table represents the maximum certificate principal balance of such class without giving effect to any exchange. The initial certificate principal balance of the Class PEX Certificates is equal to the aggregate of the initial certificate principal balance of the Class A-S, B and C Certificates and represents the maximum certificate principal balance of the Class PEX Certificates that could be issued in an exchange. The certificate principal balances of the Class A-S, B and C Certificates to be issued on the closing date will be reduced, in required proportions, by an amount equal to the certificate principal balance of the Class PEX Certificates issued on the closing date. Distributions and allocations of payments and losses with respect to the Exchangeable Certificates are described in this Term Sheet under “Allocations and Distributions on the Class A-S, B, C and PEX Certificates” and under “Description of the Offered Certificates—Distributions” in the Free Writing Prospectus. The maximum certificate principal balance of the Class PEX Certificates is set forth in the table but is not included in the certificate principal balance of the certificates set forth on the cover page of this Term Sheet or on the top of the cover page of the Free Writing Prospectus. |
| (9) | The Class X-A Certificates are notional amount certificates. The Notional Amount of the Class X-A Certificates will be equal to the aggregate principal balance of the Class A-1, A-2, A-3, A-4, A-5 and A-SB Certificates and the Class A-S regular interest outstanding from time to time (without regard to any exchange of Class A-S, B and C Certificates for Class PEX Certificates). The Class X-A Certificates will not be entitled to distributions of principal. |
| (10) | The pass-through rate for the Class X-A Certificates for any distribution date will be a per annum rate equal to the excess, if any, of (a) the weighted average of the net mortgage interest rates on the mortgage loans for the related distribution date, over (b) the weighted average of the pass-through rates on the Class A-1, A-2, A-3, A-4, A-5 and A-SB Certificates and the Class A-S regular interest for the related distribution date, weighted on the basis of their respective aggregate principal balances outstanding immediately prior to that distribution date. For purposes of the calculation of the weighted average of the net mortgage interest rates on the mortgage loans for each distribution date, the mortgage interest rates will be adjusted as necessary to a 30/360 basis. |
| (11) | The Class X-B Certificates are notional amount certificates. The Notional Amount of the Class X-B Certificates will be equal to the aggregate principal balance of the Class B and C regular interests and the Class D Certificates outstanding from time to time. The Class X-B Certificates will not be entitled to distributions of principal. |
| (12) | The pass-through rate for the Class X-B Certificates for any distribution date will be a per annum rate equal to the excess, if any, of (a) the weighted average of the net mortgage interest rates on the mortgage loans for the related distribution date, over (b) the weighted average of the pass-through rates on the Class B and C regular interests and the Class D Certificates for the related distribution date, weighted on the basis of their respective aggregate principal balances outstanding immediately prior to that distribution date. For purposes of the calculation of the weighted average of the net mortgage interest rates on the mortgage loans for each distribution date, the mortgage interest rates will be adjusted as necessary to a 30/360 basis. |
| (13) | The Class X-C Certificates are notional amount certificates. The Notional Amount of the Class X-C Certificates will be equal to the aggregate principal balance of the Class E, F and G Certificates outstanding from time to time. The Class X-C Certificates will not be entitled to distributions of principal. |
| (14) | The pass-through rate for the Class X-C Certificates for any distribution date will be a per annum rate equal to the excess, if any, of (a) the weighted average of the net mortgage interest rates on the mortgage loans for the related distribution date, over (b) the weighted average of the pass-through rates on the Class E, F and G Certificates for the related distribution date, weighted on the basis of their respective aggregate principal balances outstanding immediately prior to that distribution date. For purposes of the calculation of the weighted average of the net mortgage interest rates on the mortgage loans for each distribution date, the mortgage interest rates will be adjusted as necessary to a 30/360 basis. |
THE INFORMATION IN THIS STRUCTURAL AND COLLATERAL TERM SHEET IS NOT COMPLETE AND MAY BE AMENDED PRIOR TO THE TIME OF SALE. THIS TERM SHEET IS NOT AN OFFER TO SELL THESE SECURITIES AND IT IS NOT A SOLICITATION OF AN OFFER TO BUY THESE SECURITIES IN ANY JURISDICTION WHERE THE OFFER OR SALE IS NOT PERMITTED.
4
| WFRBS Commercial Mortgage Trust 2014-C20 | Issue Characteristics |
| II. | Transaction Highlights |
Mortgage Loan Sellers:
Mortgage Loan Seller | Number of Mortgage Loans | Number of Mortgaged Properties | Aggregate Cut-off Date Balance | % of Cut-off Date Pool Balance | ||||||||||||||
| Wells Fargo Bank, National Association | 22 | 39 | $ | 381,805,654 | 30.5 | % | ||||||||||||
The Royal Bank of Scotland(1) | 10 | 12 | 329,459,500 | 26.3 | ||||||||||||||
| Rialto Mortgage Finance, LLC | 24 | 48 | 319,112,391 | 25.5 | ||||||||||||||
| C-III Commercial Mortgage LLC | 16 | 16 | 79,962,588 | 6.4 | ||||||||||||||
| Liberty Island Group I LLC | 7 | 8 | 62,011,825 | 5.0 | ||||||||||||||
| NCB, FSB | 11 | 11 | 44,528,668 | 3.6 | ||||||||||||||
Basis Real Estate Capital II, LLC | 8 | 8 | 34,791,875 | 2.8 | ||||||||||||||
| Total | 98 | 142 | $ | 1,251,672,501 | 100.0 | % | ||||||||||||
| (1) | The mortgage loan seller referred to herein as The Royal Bank of Scotland is comprised of two affiliated companies: The Royal Bank of Scotland plc and RBS Financial Products Inc. With respect to the mortgage loans being sold for deposit into the trust by The Royal Bank of Scotland: (a) nine (9) of the mortgage loans, having an aggregate cut-off date principal balance of $322,979,500 and representing approximately 25.8% of the aggregate principal balance of the pool of mortgage loans as of the cut-off date, were originated by and are being sold to the trust only by The Royal Bank of Scotland plc and (b) one (1) of the mortgage loans, having a cut-off date principal balance of $6,480,000 and representing approximately 0.5% of the aggregate principal balance of the pool of mortgage loans as of the cut-off date, was originated by and is being sold to the trust by RBS Financial Products Inc. |
Loan Pool:
| Cut-off Date Balance: | $1,251,672,501 |
| Number of Mortgage Loans: | 98 |
| Average Cut-off Date Balance per Mortgage Loan: | $12,772,168 |
| Number of Mortgaged Properties: | 142 |
Average Cut-off Date Balance per Mortgaged Property(1): | $8,814,595 |
| Weighted Average Mortgage Interest Rate: | 4.871% |
| Ten Largest Mortgage Loans as % of Cut-off Date Pool Balance: | 46.9% |
| Weighted Average Original Term to Maturity or ARD (months): | 114 |
| Weighted Average Remaining Term to Maturity or ARD (months): | 113 |
Weighted Average Original Amortization Term (months)(2): | 351 |
Weighted Average Remaining Amortization Term (months)(2): | 350 |
| Weighted Average Seasoning (months): | 1 |
| (1) | Information regarding mortgage loans secured by multiple properties is based on an allocation according to relative appraised values or the allocated loan amounts or property-specific release prices set forth in the related loan documents or such other allocation as the related mortgage loan seller deemed appropriate. |
| (2) | Excludes any mortgage loan that does not amortize. |
Credit Statistics:
Weighted Average U/W Net Cash Flow DSCR(1): | 1.83x |
Weighted Average U/W Net Operating Income Debt Yield(1): | 12.2% |
Weighted Average Cut-off Date Loan-to-Value Ratio(1): | 64.7% |
Weighted Average Balloon or ARD Loan-to-Value Ratio(1): | 55.1% |
% of Mortgage Loans with Additional Subordinate Debt(2): | 9.3% |
% of Mortgage Loans with Single Tenants(3): | 17.1% |
| (1) | With respect to the Woodbridge Center mortgage loan and the Brunswick Square mortgage loan, each of which is part of a pari passu loan combination, loan-to-value ratio, debt service coverage ratio and debt yield calculations include the related pari passu companion loan(s) unless otherwise stated. The information for each mortgaged property that relates to a mortgage loan that is cross-collateralized with other mortgage loans is based upon the principal balance of that mortgage loan, except that the applicable loan-to-value ratio, debt service coverage ratio or debt yield for each such mortgaged property is based upon the ratio or yield (as applicable) for the aggregate indebtedness evidenced by all loans in the group. On an individual basis, without regard to the cross-collateralization feature, any mortgaged property securing a mortgage loan that is part of a cross-collateralized group of mortgage loans may have a higher loan-to-value ratio, lower debt service coverage ratio and/or lower debt yield than is presented herein. Information for each residential cooperative mortgage loan is calculated using underwritten net cash flow for the related residential cooperative property which is the projected net cash flow reflected in the most recent appraisal obtained by or otherwise in the possession of the related mortgage loan seller as of the cut-off date, and the loan-to value ratio information for residential cooperative mortgage loans is based upon the appraised value of the residential cooperative property determined as if such residential cooperative property is operated as a residential cooperative. See Annex A-1 to the Free Writing Prospectus. Debt service coverage ratio, debt yield and loan-to-value ratio information takes no account of subordinate debt (whether or not secured by the related mortgaged property), if any, that is allowed under the terms of any mortgage loan. |
| (2) | Ten (10) of the mortgage loans, each of which is secured by residential cooperative properties, currently have in place subordinate secured lines of credit to the related mortgage borrowers that permit future advances (such loans, collectively, the “Subordinate Coop LOCs”). The percentage figure expressed as “% of Mortgage Loans with Additional Subordinate Debt” is determined as a percentage of cut-off date principal balance and does not take into account future subordinate debt (whether or not secured by the mortgaged property), if any, that may be permitted under the terms of any mortgage loan or the Pooling and Servicing Agreement. See “Description of the Mortgage Pool—Subordinate and/or Other Financing” and “—Additional Debt Financing for Mortgage Loans Secured by Residential Cooperatives” in the Free Writing Prospectus |
| (3) | Excludes mortgage loans that are secured by multiple single tenant properties. |
THE INFORMATION IN THIS STRUCTURAL AND COLLATERAL TERM SHEET IS NOT COMPLETE AND MAY BE AMENDED PRIOR TO THE TIME OF SALE. THIS TERM SHEET IS NOT AN OFFER TO SELL THESE SECURITIES AND IT IS NOT A SOLICITATION OF AN OFFER TO BUY THESE SECURITIES IN ANY JURISDICTION WHERE THE OFFER OR SALE IS NOT PERMITTED.
5
| WFRBS Commercial Mortgage Trust 2014-C20 | Issue Characteristics |
Loan Structural Features:
Amortization: Based on the Cut-off Date Pool Balance, 97.3% of the mortgage pool (96 mortgage loans) has scheduled amortization, as follows:
59.6% (74 mortgage loans) requires amortization during the entire loan term; and
37.7% (22 mortgage loans) provides for an interest-only period followed by an amortization period.
Interest-Only: Based on the Cut-off Date Pool Balance, 2.7% of the mortgage pool (two mortgage loans) provides for interest-only payments during the entire loan term. The Weighted Average Cut-off Date Loan-to-Value Ratio and Weighted Average U/W Net Cash Flow DSCR for those mortgage loans is 52.0% and 2.06x, respectively.
Hard Lockboxes: Based on the Cut-off Date Pool Balance, 56.7% of the mortgage pool (34 mortgage loans) has hard lockboxes in place.
Reserves: The mortgage loans require amounts to be escrowed monthly as follows (excluding any mortgage loans with springing provisions):
| Real Estate Taxes: | 64.7% of the pool | |||
| Insurance: | 37.6% of the pool | |||
| Capital Replacements: | 62.5% of the pool | |||
| TI/LC: | 43.0% of the pool(1) | |||
| (1) | The percentage of Cut-off Date Balance for loans with TI/LC reserves is based on the aggregate principal balance allocable to office, retail, industrial and mixed use properties. | |||
Call Protection/Defeasance: Based on the Cut-off Date Pool Balance, the mortgage pool has the following call protection and defeasance features:
81.1% of the mortgage pool (77 mortgage loans) features a lockout period, then defeasance only until an open period;
14.7% of the mortgage pool (9 mortgage loans) features a lockout period, then the greater of a prepayment premium or yield maintenance until an open period;
3.6% of the mortgage pool (11 mortgage loans) features no lockout period, but requires the greater of a prepayment premium or yield maintenance for a period, then a prepayment premium until an open period; and
0.6% of the mortgage pool (1 mortgage loan) features a lockout period, then defeasance or the greater of a prepayment premium or yield maintenance until an open period.
Please refer to Annex A-1 to the Free Writing Prospectus for further description of individual loan call protection.
THE INFORMATION IN THIS STRUCTURAL AND COLLATERAL TERM SHEET IS NOT COMPLETE AND MAY BE AMENDED PRIOR TO THE TIME OF SALE. THIS TERM SHEET IS NOT AN OFFER TO SELL THESE SECURITIES AND IT IS NOT A SOLICITATION OF AN OFFER TO BUY THESE SECURITIES IN ANY JURISDICTION WHERE THE OFFER OR SALE IS NOT PERMITTED.
6
| WFRBS Commercial Mortgage Trust 2014-C20 | Issue Characteristics |
| III. | Issue Characteristics | ||
| Securities Offered: | $1,079,567,000 approximate monthly pay, multi-class, commercial mortgage REMIC pass-through certificates consisting of twelve classes (Classes A-1, A-2, A-3, A-4, A-5, A-SB, A-S, B, C, PEX, X-A and X-B), which are offered pursuant to a registration statement filed with the SEC. | ||
| Mortgage Loan Sellers: | Wells Fargo Bank, National Association (“WFB”); The Royal Bank of Scotland (“RBS”); Rialto Mortgage Finance, LLC (“RMF”); C-III Commercial Mortgage LLC (“CIIICM”); Liberty Island Group I LLC (“LIG I”); NCB, FSB and Basis Real Estate Capital II, LLC (“Basis”). | ||
| Co-lead Bookrunning Managers: | Wells Fargo Securities, LLC and RBS Securities Inc. | ||
| Co-Manager: | Deutsche Bank Securities Inc. | ||
| Rating Agencies: | DBRS, Inc., Kroll Bond Rating Agency, Inc. and Moody’s Investors Service, Inc. | ||
| Master Servicers: | Wells Fargo Bank, National Association and NCB, FSB | ||
| Special Servicers: | Rialto Capital Advisors, LLC and NCB, FSB | ||
| Certificate Administrator: | Wells Fargo Bank, National Association | ||
| Trustee: | Wilmington Trust, National Association | ||
| Trust Advisor: | Pentalpha Surveillance LLC | ||
| Initial Majority Subordinate Certificateholder: | Rialto CMBS II, LLC or another affiliate of Rialto Capital Advisors, LLC | ||
| Cut-off Date: | The Cut-off Date with respect to each mortgage loan is the due date for the monthly debt service payment that is due in May 2014 (or, in the case of any mortgage loan that has its first due date in June 2014, the date that would have been its due date in May 2014 under the terms of that mortgage loan if a monthly debt service payment were scheduled to be due in that month). | ||
| Expected Closing Date: | On or about May 13, 2014. | ||
| Determination Dates: | The 11th day of each month (or if that day is not a business day, the next succeeding business day), commencing in June 2014. | ||
| Distribution Dates: | The fourth business day following the Determination Date in each month, commencing in June 2014. | ||
| Rated Final Distribution Date: | The Distribution Date in May 2047. | ||
| Interest Accrual Period: | With respect to any Distribution Date, the calendar month preceding the month in which such Distribution Date occurs. | ||
| Day Count: | The Offered Certificates will accrue interest on a 30/360 basis. | ||
| Minimum Denominations: | $10,000 for each Class of Offered Certificates (other than the Class X-A and X-B Certificates) and $1,000,000 for the Class X-A and X-B Certificates. Investments may also be made in any whole dollar denomination in excess of the applicable minimum denomination. | ||
| Clean-up Call: | 1% | ||
| Delivery: | DTC, Euroclear and Clearstream Banking | ||
| ERISA/SMMEA Status: | Each Class of Offered Certificates is expected to be eligible for exemptive relief under ERISA. No Class of Offered Certificates will be SMMEA eligible. | ||
| Risk Factors: | THE CERTIFICATES INVOLVE CERTAIN RISKS AND MAY NOT BE SUITABLE FOR ALL INVESTORS. SEE THE “RISK FACTORS” SECTION OF THE FREE WRITING PROSPECTUS. | ||
| Bond Analytics Information: | The Certificate Administrator will be authorized to make distribution date settlements, CREFC® reports and certain supplemental reports (other than confidential information) available to certain financial modeling and data provision services, including Bloomberg Financial Markets L.P., Trepp LLC, Intex Solutions, Inc., Markit Group Limited, Interactive Data Corp., BlackRock Financial Management, Inc and CMBS.com, Inc. |
THE INFORMATION IN THIS STRUCTURAL AND COLLATERAL TERM SHEET IS NOT COMPLETE AND MAY BE AMENDED PRIOR TO THE TIME OF SALE. THIS TERM SHEET IS NOT AN OFFER TO SELL THESE SECURITIES AND IT IS NOT A SOLICITATION OF AN OFFER TO BUY THESE SECURITIES IN ANY JURISDICTION WHERE THE OFFER OR SALE IS NOT PERMITTED.
7
| WFRBS Commercial Mortgage Trust 2014-C20 | Characteristics of the Mortgage Pool |
| IV. | Characteristics of the Mortgage Pool(1) |
| A. | Ten Largest Mortgage Loans |
Mortgage Loan Seller | Mortgage Loan Name | City | State | Number of Mortgage Loans / Mortgaged Properties | Mortgage Loan Cut-off Date Balance ($) | % of Cut- off Date Pool Balance (%) | Property Type | Number of SF, Rooms or Units | Cut-off Date Balance Per SF, Room or Unit ($) | Cut-off Date LTV Ratio (%) | Balloon or ARD LTV Ratio (%) | U/W NCF DSCR (x) | U/W NOI Debt Yield (%) | |||||||
| RBS | Woodbridge Center | Woodbridge | NJ | 1 / 1 | $130,000,000 | 10.4 | % | Retail | 1,105,409 | $226 | 68.3 | % | 60.2 | % | 1.42 | x | 9.3 | % | ||
| WFB | Bloomberg Data Center | Orangeburg | NY | 1 / 1 | 87,847,310 | 7.0 | Other | 131,805 | 666 | 64.1 | 47.6 | 1.74 | 12.1 | |||||||
| WFB | Worldgate Centre | Herndon | VA | 1 / 1 | 65,000,000 | 5.2 | Retail | 229,326 | 283 | 73.4 | 59.9 | 1.30 | 8.7 | |||||||
| WFB | Sugar Creek I & II | Sugar Land | TX | 1 / 2 | 62,625,000 | 5.0 | Office | 409,168 | 153 | 75.0 | 68.9 | 1.52 | 10.0 | |||||||
| RBS | Rockwell – ARINC HQ | Annapolis | MD | 1 / 1 | 48,545,500 | 3.9 | Office | 271,303 | 179 | 66.3 | 60.7 | 2.07 | 12.8 | |||||||
| RBS | Brunswick Square | East Brunswick | NJ | 1 / 1 | 46,888,781 | 3.7 | Retail | 292,685 | 262 | 68.0 | 55.7 | 1.54 | 10.4 | |||||||
| RBS | Hilton DFW Lakes Hotel and Conference Center | Grapevine | TX | 1 / 1 | 45,943,116 | 3.7 | Hospitality | 393 | 116,904 | 70.0 | 61.9 | 1.59 | 12.4 | |||||||
| RMF | Residence Inn Aventura | Aventura | FL | 1 / 1 | 38,449,540 | 3.1 | Hospitality | 191 | 201,306 | 65.2 | 59.7 | 1.71 | 11.6 | |||||||
| RMF | Savoy Retail & 60th Street Residential | New York | NY | 1 / 2 | 35,000,000 | 2.8 | Various | 71,355 | 491 | 37.6 | 32.9 | 1.74 | 10.8 | |||||||
| RMF | Minneapolis Apartment Portfolio | Minneapolis | MN | 1 / 17 | 26,500,000 | 2.1 | Multifamily | 437 | 60,641 | 76.0 | 66.1 | 1.38 | 9.5 | |||||||
| Top Three Total/Weighted Average | 3 / 3 | $282,847,310 | 22.6 | % | 68.2 | % | 56.2 | % | 1.49 | x | 10.0 | % | ||||||||
| Top Five Total/Weighted Average | 5 / 6 | $394,017,810 | 31.5 | % | 69.0 | % | 58.8 | % | 1.57 | x | 10.4 | % | ||||||||
| Top Ten Total/Weighted Average | 10 / 28 | $586,799,247 | 46.9 | % | 67.2 | % | 57.6 | % | 1.58 | x | 10.6 | % | ||||||||
| Non-Top Ten Total/Weighted Average | 88 / 114 | $664,873,255 | 53.1 | % | 62.5 | % | 52.9 | % | 2.06 | x | 13.7 | % | ||||||||
| (1) | With respect to the Woodbridge Center mortgage loan and the Brunswick Square mortgage loan, each of which is part of a pari passu loan combination, Cut-off Date Balance per square foot, loan-to-value ratio, debt service coverage ratio and debt yield calculations include the related pari passu companion loan(s) (unless otherwise stated). With respect to each Mortgage Loan, debt service coverage ratio, debt yield and loan-to-value ratio information takes no account of subordinate debt (whether or not secured by the related mortgaged property), if any, that is allowed under the terms of any mortgage loan. |
THE INFORMATION IN THIS STRUCTURAL AND COLLATERAL TERM SHEET IS NOT COMPLETE AND MAY BE AMENDED PRIOR TO THE TIME OF SALE. THIS TERM SHEET IS NOT AN OFFER TO SELL THESE SECURITIES AND IT IS NOT A SOLICITATION OF AN OFFER TO BUY THESE SECURITIES IN ANY JURISDICTION WHERE THE OFFER OR SALE IS NOT PERMITTED.
8
| WFRBS Commercial Mortgage Trust 2014-C20 | Characteristics of the Mortgage Pool |
| B. | Summary of Pari Passu Split Loan Structures |
| Property Name | Mortgage Loan Seller | Related Notes in Loan Group (Original Balance) | Holder of Note | Whether Note is Lead Servicing for the Entire Loan Combination | Current Master Servicer Under Related Securitization Servicing Agreement | Current Special Servicer Under Related Securitization Servicing Agreement | ||
| RBS | $130,000,000 | WFRBS 2014-C20 | Yes | Wells Fargo Bank, National Association | Rialto Capital Advisors, LLC | |||
| Woodbridge Center | RBS | $60,000,000 | (1) | No | TBD | TBD | ||
| RBS | $60,000,000 | (1) | No | TBD | TBD | |||
| Brunswick Square | RBS | $47,000,000 | WFRBS 2014-C20 | Yes | Wells Fargo Bank, National Association | Rialto Capital Advisors, LLC | ||
| RBS | $30,000,000 | WFRBS 2014-C19 | No | Wells Fargo Bank, National Association | LNR Partners, LLC | |||
| (1) | The related pari passu companion loans are currently held by the mortgage loan seller for the mortgage loan included in the WFRBS 2014-C20 trust and are expected to be contributed to future trusts. No assurance can be provided that Note A-2 and Note A-3 will not be split further. |
| C. | Mortgage Loans with Additional Secured and Mezzanine Financing(1) |
| Loan No. | Mortgage Loan Seller | Mortgage Loan Name | Mortgage Loan Cut-off Date Balance ($) | % of Cut- off Date Balance (%) | Sub Debt Cut-off Date Balance ($) | Mezzanine Debt Cut-off Date Balance ($) | Total Debt Interest Rate (%)(2)(3) | Mortgage Loan U/W NCF DSCR (x) | Total Debt U/W NCF DSCR (x)(3) | Mortgage Loan Cut- off Date U/W NOI Debt Yield (%) | Total Debt Cut-off Date U/W NOI Debt Yield (%) | Mortgage Loan Cut-off Date LTV Ratio (%) | Total Debt Cut-off Date LTV Ratio (%) | ||
| 4 | WFB | Sugar Creek I & II | $62,625,000 | 5.0% | $0 | $8,562,500 | 5.467% | 1.52x | 1.22x | 10.0% | 8.8% | 75.0% | 85.3% | ||
| 37 | RMF | Hilton Garden Inn North Phoenix | 10,134,022 | 0.8 | 0 | 750,000 | 6.555 | 1.35 | 1.11 | 11.3 | 10.5 | 69.9 | 75.1 | ||
| Total/Weighted Average | $72,759,022 | 5.8% | $0 | $9,312,500 | 5.618% | 1.50x | 1.20x | 10.2% | 9.0% | 74.3% | 83.9% | ||||
| (1) | In addition, ten (10) of the mortgage loans, each of which are secured by residential cooperative properties, currently have in place Subordinate Coop LOCs that permit future advances, but as to which there are no present outstanding balances. See “Description of the Mortgage Pool—Subordinate and/or Other Financing” and “—Additional Debt Financing for Mortgage Loans Secured by Residential Cooperatives” in the Free Writing Prospectus. |
| (2) | Total Debt Interest Rate for any specified mortgage loan reflects the weighted average of the interest rates on the respective components of the total debt. |
| (3) | The Sugar Creek I & II Mezzanine Loan accrues interest at an interest rate of 11.000% per annum and requires payments of interest-only for the entire term. The Mezzanine Loan borrower may elect to defer and accrue interest at a rate of 3.000% per annum over the first five years of the Sugar Creek I & II Mezzanine Loan. The Total Debt U/W NCF DSCR stated above is based on the 11.000% interest rate; Total Debt U/W NCF DSCR based on the 8.000% interest rate is 1.29x. |
THE INFORMATION IN THIS STRUCTURAL AND COLLATERAL TERM SHEET IS NOT COMPLETE AND MAY BE AMENDED PRIOR TO THE TIME OF SALE. THIS TERM SHEET IS NOT AN OFFER TO SELL THESE SECURITIES AND IT IS NOT A SOLICITATION OF AN OFFER TO BUY THESE SECURITIES IN ANY JURISDICTION WHERE THE OFFER OR SALE IS NOT PERMITTED.
9
| WFRBS Commercial Mortgage Trust 2014-C20 | Characteristics of the Mortgage Pool |
| D. | Previous Securitization History(1) |
Loan No. | Mortgage Loan Seller | Mortgage Loan or Mortgaged Property Name | City | State | Property Type | Mortgage Loan or Mortgaged Property Cut-off Date Balance ($) | % of Cut-off Date Pool Balance (%) | Previous Securitization |
| 1 | RBS | Woodbridge Center | Woodbridge | NJ | Retail | $130,000,000 | 10.4% | JPMCC 2005-LDP1 |
| 3 | WFB | Worldgate Centre | Herndon | VA | Retail | 65,000,000 | 5.2 | MLMT 2004-BPC1 |
| 6 | RBS | Brunswick Square | East Brunswick | NJ | Retail | 46,888,781 | 3.7 | CSFB 2004-C4 |
| 13.01 | WFB | 102nd Street Apartments | Inglewood | CA | Multifamily | 2,628,840 | 0.2 | JPMCC 2004-CB8 |
| 13.06 | WFB | Daisy Avenue Apartments | Long Beach | CA | Multifamily | 1,956,023 | 0.2 | JPMCC 2004-CB8 |
| 13.09 | WFB | Dawson Apartments | Long Beach | CA | Multifamily | 1,491,294 | 0.1 | JPMCC 2004-CB8 |
| 16 | NCB, FSB | The Howard Owners, Inc. | Rego Park | NY | Multifamily | 21,482,525 | 1.7 | CSFB 2005-C3 |
| 18 | WFB | Woodmont Plaza | Bethesda | MD | Office | 20,000,000 | 1.6 | BACM 2004-4 |
| 19 | RMF | DoubleTree Richardson | Richardson | TX | Hospitality | 18,656,758 | 1.5 | CSMC 2008-C1 |
| 21 | CIIICM | Orange Avenue MHP | Paramount | CA | Manufactured Housing Community | 8,223,449 | 0.7 | JPMCC 2004-LN2 |
| 24 | LIG I | Town Park Office | Kennesaw | GA | Office | 12,192,475 | 1.0 | COMM 2004-LB2A |
| 26.03 | WFB | Mariposa Apartments | Los Angeles | CA | Multifamily | 2,274,914 | 0.2 | JPMCC 2004-CB8 |
| 33 | WFB | Diamond Mine Mini Storage Union City | Union City | CA | Self Storage | 5,500,000 | 0.4 | GECMC 2004-C1 |
| 34 | WFB | Diamond Mine Mini Storage Brentwood | Brentwood | CA | Self Storage | 4,700,000 | 0.4 | GECMC 2004-C1 |
| 35 | LIG I | 41 University Drive | Newtown | PA | Office | 10,177,291 | 0.8 | GMAC 2003-C3 |
| 37 | RMF | Hilton Garden Inn North Phoenix | Phoenix | AZ | Hospitality | 10,134,022 | 0.8 | S2H 2012-LV1 |
| 39.02 | RMF | Poplar Springs | College Park | GA | Multifamily | 4,577,419 | 0.4 | BACM 2005-1 |
| 43.01 | RMF | East Garden Village | Garden City | KS | Manufactured Housing Community | 7,089,556 | 0.6 | COMM 2004-LB2A |
| 56 | CIIICM | Poplar Garden | Gates | NY | Multifamily | 5,793,360 | 0.5 | LBUBS 2005-C3 |
| 57 | RBS | Eastlake Shopping Center | Killeen | TX | Retail | 4,635,848 | 0.4 | BACM 2004-4 |
| 58 | RBS | South Loop II Shopping Center | Temple | TX | Retail | 1,146,500 | 0.1 | BACM 2004-4 |
| 70 | WFB | Walgreens – Everett | Everett | WA | Retail | 4,332,200 | 0.3 | MSC 2003-IQ6 |
| 71 | WFB | Weston Road Business Center | Weston | FL | Mixed Use | 4,294,928 | 0.3 | LBUBS 2004-C4 |
| 78 | WFB | Walgreens – Pasadena | Pasadena | TX | Retail | 3,494,184 | 0.3 | LBUBS 2004-C2 |
| 81 | WFB | Walgreens – Carson City | Carson City | NV | Retail | 3,171,064 | 0.3 | JPMCC 2004-PNC1 |
| 85 | NCB, FSB | 321 Apartments Corp. | New York | NY | Multifamily | 2,995,799 | 0.2 | TIAA 2001-C1A |
| 88 | CIIICM | Folly Road Self Storage | Charleston | SC | Self Storage | 2,700,000 | 0.2 | LBUBS 2004-C4 |
| 89 | NCB, FSB | 929 Park Avenue Apartments Corp. | New York | NY | Multifamily | 2,548,069 | 0.2 | CSMC 2006-C1 |
| 91 | Basis | Barrington Apartments | Bedford | OH | Multifamily | 2,275,000 | 0.2 | JPMCC 2004-C2 |
| 92 | NCB, FSB | Tanglewood Gardens Owners Corp. | White Plains | NY | Multifamily | 1,997,240 | 0.2 | CSFB 2004-C4 |
| 93 | NCB, FSB | Centrentset Corp. | New York | NY | Multifamily | 1,895,010 | 0.2 | MSC 2005-IQ10 |
| 94 | NCB, FSB | Fowler Court Tenants Inc. | New York | NY | Multifamily | 1,745,377 | 0.1 | CSFB 2005-C5 |
| 95 | NCB, FSB | Park Terrace Manor, Inc. | New York | NY | Multifamily | 1,497,911 | 0.1 | TIAA 2001-C1A |
| 98 | NCB, FSB | 119 West 71st Street Owners Corp. | New York | NY | Multifamily | 827,847 | 0.1 | MSC 2005-IQ10 |
| Total | $418,323,685 | 33.4% |
| (1) | The table above represents the most recent securitization with respect to the mortgaged property securing the related mortgage loan, based on information provided by the related borrower or obtained through searches of a third-party database. While the above mortgage loans may have been securitized multiple times in prior transactions, mortgage loans are only listed in the above chart if the mortgage loan in this securitization paid off a mortgage loan in another securitization. The information has not otherwise been confirmed by the mortgage loan sellers. |
THE INFORMATION IN THIS STRUCTURAL AND COLLATERAL TERM SHEET IS NOT COMPLETE AND MAY BE AMENDED PRIOR TO THE TIME OF SALE. THIS TERM SHEET IS NOT AN OFFER TO SELL THESE SECURITIES AND IT IS NOT A SOLICITATION OF AN OFFER TO BUY THESE SECURITIES IN ANY JURISDICTION WHERE THE OFFER OR SALE IS NOT PERMITTED.
10
| WFRBS Commercial Mortgage Trust 2014-C20 | Characteristics of the Mortgage Pool |
| E. | Mortgage Loans with Scheduled Balloon Payments and Related Classes |
Class A-2(1) | ||||||||||||||||
| Loan No. | Mortgage Loan Seller | Mortgage Loan Name | State | Property Type | Mortgage Loan Cut-off Date Balance ($) | % of Cut-off Date Pool Balance (%) | Mortgage Loan Balance at Maturity ($) | % of Class A-2 Certificate Principal Balance (%)(2) | SF/ Rooms/ Pads/ Units | Loan per SF /Room/ Pad/Unit ($) | U/W NCF DSCR (x) | U/W NOI Debt Yield (%) | Cut-off Date LTV Ratio (%) | Balloon or ARD LTV Ratio (%) | Rem. IO Period (mos.) | Rem. Term to Maturity (mos.) |
| 8 | RMF | Residence Inn Aventura | FL | Hospitality | $38,449,540 | 3.1% | $35,246,054 | 36.9% | 191 | $201,306 | 1.71x | 11.6% | 65.2% | 59.7% | 0 | 59 |
| 21 | CIIICM | Orange Avenue MHP | CA | Manufactured Housing Community | 8,223,449 | 0.7 | 7,552,962 | 7.9 | 117 | 61,152 | 1.44 | 9.0 | 69.3 | 63.7 | 0 | 59 |
| 22 | CIIICM | El Rancho MHP | CA | Manufactured Housing Community | 7,981,759 | 0.6 | 7,330,978 | 7.7 | 148 | 61,152 | 1.44 | 9.0 | 69.3 | 63.7 | 0 | 59 |
| 29 | CIIICM | Country Place MHP | CA | Manufactured Housing Community | 6,952,080 | 0.6 | 6,385,252 | 6.7 | 100 | 65,392 | 1.37 | 8.6 | 67.3 | 61.8 | 0 | 59 |
| 30 | CIIICM | Torrance MHP | CA | Manufactured Housing Community | 3,902,992 | 0.3 | 3,584,767 | 3.8 | 66 | 65,392 | 1.37 | 8.6 | 67.3 | 61.8 | 0 | 59 |
| 39 | RMF | Poplar Springs and Garden Walk Portfolio | GA | Multifamily | 9,900,000 | 0.8 | 9,482,981 | 9.9 | 561 | 17,647 | 1.43 | 11.2 | 71.0 | 68.0 | 23 | 59 |
| 41 | Basis | Hilton Garden Inn Panama City | FL | Hospitality | 9,600,000 | 0.8 | 8,804,776 | 9.2 | 111 | 86,486 | 1.69 | 11.9 | 64.9 | 59.5 | 0 | 60 |
| 51 | CIIICM | Holiday Inn Bakersfield | CA | Hospitality | 7,187,581 | 0.6 | 6,386,356 | 6.7 | 90 | 79,862 | 1.65 | 12.6 | 69.8 | 62.0 | 0 | 59 |
| 70 | WFB | Walgreens - Everett | WA | Retail | 4,332,200 | 0.3 | 3,980,339 | 4.2 | 13,650 | 317 | 1.52 | 9.3 | 63.0 | 57.9 | 0 | 57 |
| Total/Weighted Average | $96,529,602 | 7.7% | $88,754,465 | 92.9% | 1.58x | 10.8% | 66.9% | 61.5% | 2 | 59 | ||||||
| (1) | The table above presents the mortgage loan(s) whose balloon payments would be applied to pay down the principal balance of the Class A-2 Certificates, assuming a 0% CPR and applying the “Structuring Assumptions” described in the Free Writing Prospectus, including the assumptions that (i) none of the mortgage loans in the pool experience prepayments prior to maturity (or, in the case of an ARD loan, its anticipated repayment date), defaults or losses; (ii) there are no extensions of maturity dates of any mortgage loans in the pool; and (iii) each mortgage loan in the pool is paid in full on its stated maturity date (or, in the case of an ARD loan, its anticipated repayment date). Each Class of Certificates, including the Class A-2 Certificates, evidences undivided ownership interests in the entire pool of mortgage loans. Debt service coverage ratio, debt yield and loan-to-value ratio information takes no account of subordinate debt (whether or not secured by the mortgaged property), if any, that is allowed under the terms of any mortgage loan. See Annex A-1 to the Free Writing Prospectus. |
| (2) | Reflects the percentage equal to the Mortgage Loan Balance at Maturity divided by the initial Class A-2 Certificate Principal Balance. |
THE INFORMATION IN THIS STRUCTURAL AND COLLATERAL TERM SHEET IS NOT COMPLETE AND MAY BE AMENDED PRIOR TO THE TIME OF SALE. THIS TERM SHEET IS NOT AN OFFER TO SELL THESE SECURITIES AND IT IS NOT A SOLICITATION OF AN OFFER TO BUY THESE SECURITIES IN ANY JURISDICTION WHERE THE OFFER OR SALE IS NOT PERMITTED.
11
| WFRBS Commercial Mortgage Trust 2014-C20 | Characteristics of the Mortgage Pool |
Class A-3(1) | ||||||||||||||||
| Loan No. | Mortgage Loan Seller | Mortgage Loan Name | State | Property Type | Mortgage Loan Cut-off Date Balance ($) | % of Cut-off Date Pool Balance (%) | Mortgage Loan Balance at Maturity ($) | % of Class A-3 Certificate Principal Balance (%)(2) | SF/ Rooms | Loan per SF/Room ($) | U/W NCF DSCR (x) | U/W NOI Debt Yield (%) | Cut-off Date LTV Ratio (%) | Balloon or ARD LTV Ratio (%) | Rem. IO Period (mos.) | Rem. Term to Maturity (mos.) |
| 7 | RBS | Hilton DFW Lakes Hotel and Conference Center | TX | Hospitality | $45,943,116 | 3.7% | $40,584,297 | 89.1% | 393 | $116,904 | 1.59x | 12.4% | 70.0% | 61.9% | 0 | 83 |
| 60 | RBS | 1430 Lee Trevino | TX | Retail | 5,593,278 | 0.4 | 4,958,258 | 10.9 | 108,653 | 51 | 1.59 | 11.3 | 69.1 | 61.2 | 0 | 83 |
| Total/Weighted Average | $51,536,393 | 4.1% | $45,542,555 | 100.0% | 1.59x | 12.3% | 69.9% | 61.8% | 0 | 83 | ||||||
| (1) | The table above presents the mortgage loan(s) whose balloon payments would be applied to pay down the principal balance of the Class A-3 Certificates, assuming a 0% CPR and applying the “Structuring Assumptions” described in the Free Writing Prospectus, including the assumptions that (i) none of the mortgage loans in the pool experience prepayments, defaults or losses; (ii) there are no extensions of maturity dates of any mortgage loans in the pool; and (iii) each mortgage loan in the pool is paid in full on its stated maturity date. Each Class of Certificates, including the Class A-3 Certificates, evidences undivided ownership interests in the entire pool of mortgage loans. Debt service coverage ratio, debt yield and loan-to-value ratio information takes no account of subordinate debt (whether or not secured by the mortgaged property), if any, that is allowed under the terms of any mortgage loan. See Annex A-1 to the Free Writing Prospectus. |
| (2) | Reflects the percentage equal to the Mortgage Loan Balance at Maturity divided by the initial Class A-3 Certificate Principal Balance. |
THE INFORMATION IN THIS STRUCTURAL AND COLLATERAL TERM SHEET IS NOT COMPLETE AND MAY BE AMENDED PRIOR TO THE TIME OF SALE. THIS TERM SHEET IS NOT AN OFFER TO SELL THESE SECURITIES AND IT IS NOT A SOLICITATION OF AN OFFER TO BUY THESE SECURITIES IN ANY JURISDICTION WHERE THE OFFER OR SALE IS NOT PERMITTED.
12
(THIS PAGE INTENTIONALLY LEFT BLANK)
13
| WFRBS Commercial Mortgage Trust 2014-C20 | Characteristics of the Mortgage Pool |
| F. | Property Type Distribution(1) |
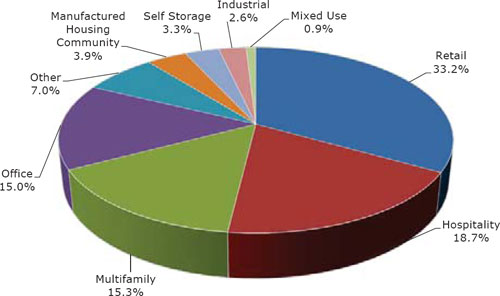
| Property Type | Number of Mortgaged Properties | Aggregate Cut- off Date Balance ($) | % of Cut- off Date Balance (%) | Weighted Average Cut-off Date LTV Ratio (%) | Weighted Average Balloon or ARD LTV Ratio (%) | Weighted Average U/W NCF DSCR (x) | Weighted Average U/W NOI Debt Yield (%) | Weighted Average U/W NCF Debt Yield (%) | Weighted Average Mortgage Rate (%) | ||
| Retail | 28 | $415,339,712 | 33.2% | 66.2% | 56.9% | 1.46x | 9.7% | 9.2% | 4.846 | % | |
| Regional Mall | 2 | 176,888,781 | 14.1 | 68.2 | 59.0 | 1.45 | 9.6 | 9.2 | 4.796 | ||
| Anchored | 8 | 131,680,473 | 10.5 | 71.4 | 60.3 | 1.37 | 9.4 | 8.8 | 4.904 | ||
| Unanchored | 9 | 67,283,683 | 5.4 | 53.4 | 45.6 | 1.57 | 10.5 | 10.0 | 4.809 | ||
| Single Tenant | 5 | 24,966,197 | 2.0 | 59.1 | 54.3 | 1.56 | 9.0 | 8.9 | 4.944 | ||
| Shadow Anchored | 4 | 14,520,578 | 1.2 | 66.2 | 55.9 | 1.56 | 11.0 | 10.0 | 4.951 | ||
| Hospitality | 20 | 234,451,461 | 18.7 | 64.8 | 53.8 | 1.62 | 12.5 | 10.9 | 5.078 | ||
| Limited Service | 14 | 109,249,849 | 8.7 | 63.3 | 50.0 | 1.58 | 12.7 | 11.2 | 5.300 | ||
| Full Service | 2 | 64,599,874 | 5.2 | 66.7 | 56.8 | 1.58 | 12.6 | 10.4 | 4.981 | ||
| Extended Stay | 4 | 60,601,738 | 4.8 | 65.4 | 57.4 | 1.71 | 12.0 | 10.8 | 4.780 | ||
| Multifamily | 59 | 192,034,517 | 15.3 | 57.8 | 49.7 | 3.29 | 19.9 | 19.4 | 4.820 | ||
| Garden | 47 | 142,312,355 | 11.4 | 71.4 | 61.5 | 1.38 | 9.6 | 9.0 | 5.011 | ||
| Cooperative | 11 | 44,528,668 | 3.6 | 12.7 | 11.0 | 9.57 | 53.9 | 53.9 | 4.215 | ||
| Mid Rise | 1 | 5,193,494 | 0.4 | 68.8 | 56.2 | 1.56 | 10.5 | 9.8 | 4.780 | ||
| Office | 9 | 187,447,367 | 15.0 | 68.5 | 62.1 | 1.73 | 11.2 | 10.4 | 4.749 | ||
| Suburban | 8 | 138,901,867 | 11.1 | 69.2 | 62.6 | 1.61 | 10.7 | 9.6 | 4.819 | ||
| CBD | 1 | 48,545,500 | 3.9 | 66.3 | 60.7 | 2.07 | 12.8 | 12.7 | 4.550 | ||
| Other | 1 | 87,847,310 | 7.0 | 64.1 | 47.6 | 1.74 | 12.1 | 11.9 | 4.780 | ||
| Data Center | 1 | 87,847,310 | 7.0 | 64.1 | 47.6 | 1.74 | 12.1 | 11.9 | 4.780 | ||
| Manufactured Housing Community | 10 | 48,431,834 | 3.9 | 69.7 | 60.1 | 1.48 | 9.8 | 9.6 | 4.852 | ||
| Manufactured Housing Community | 10 | 48,431,834 | 3.9 | 69.7 | 60.1 | 1.48 | 9.8 | 9.6 | 4.852 | ||
| Self Storage | 9 | 41,363,896 | 3.3 | 65.8 | 54.5 | 1.54 | 10.5 | 10.2 | 4.991 | ||
| Self Storage | 9 | 41,363,896 | 3.3 | 65.8 | 54.5 | 1.54 | 10.5 | 10.2 | 4.991 | ||
| Industrial | 4 | 32,934,594 | 2.6 | 64.6 | 53.1 | 1.49 | 10.8 | 9.5 | 4.895 | ||
| Warehouse | 3 | 22,871,478 | 1.8 | 64.6 | 52.9 | 1.46 | 10.3 | 9.2 | 4.805 | ||
| Flex | 1 | 10,063,117 | 0.8 | 64.7 | 53.4 | 1.56 | 12.0 | 10.2 | 5.100 | ||
| Mixed Use | 2 | 11,821,810 | 0.9 | 46.2 | 39.4 | 1.63 | 10.5 | 10.1 | 4.654 | ||
| Multifamily/Retail/Office | 1 | 7,526,882 | 0.6 | 37.6 | 32.9 | 1.74 | 10.8 | 10.5 | 4.400 | ||
| Office/Retail | 1 | 4,294,928 | 0.3 | 61.4 | 50.7 | 1.45 | 9.9 | 9.5 | 5.100 | ||
| Total/Weighted Average | 142 | $1,251,672,501 | 100.0% | 64.7% | 55.1% | 1.83x | 12.2% | 11.5% | 4.871 | % | |
(1) | Because this table presents information relating to the mortgaged properties and not the mortgage loans, the information for mortgage loans secured by more than one mortgaged property (other than through cross-collateralization with other mortgage loans) is based on allocated amounts (allocating the mortgage loan principal balance to each of those properties according to the relative appraised values of the mortgaged properties or the allocated loan amounts or property-specific release prices set forth in the related mortgage loan documents or such other allocation as the related mortgage loan seller deemed appropriate). The information for each mortgaged property that relates to a mortgage loan that is cross-collateralized with other mortgage loans is based upon the principal balance of that mortgage loan, except that the applicable loan-to-value ratio, debt service coverage ratio or debt yield for each such mortgaged property is based upon the ratio or yield (as applicable) for the aggregate indebtedness evidenced by all loans in the group. On an individual basis, without regard to the cross-collateralization feature, any mortgaged property securing a mortgage loan that is part of a cross-collateralized group of mortgage loans may have a higher loan-to-value ratio, lower debt service coverage ratio and/or lower debt yield than is presented herein. For mortgaged properties securing residential cooperative mortgage loans, the debt service coverage ratio or debt yield for each such mortgaged property is calculated using underwritten net cash flow for the related residential cooperative property which is the projected net cash flow reflected in the most recent appraisal obtained by or otherwise in the possession of the related mortgage loan seller as of the cut-off date, and the loan-to-value ratio is calculated based upon the appraised value of the residential cooperative property determined as if such residential cooperative property is operated as a residential cooperative. With respect to the Woodbridge Center mortgage loan and the Brunswick Square mortgage loan, loan-to-value ratio, debt service coverage ratio and debt yield calculations include the related pari passu companion loan(s) (unless otherwise stated). Debt service coverage ratio, debt yield and loan-to-value ratio information takes no account of subordinate debt (whether or not secured by the related mortgaged property) that is allowed under the terms of any mortgage loan. See Annex A-1 to the Free Writing Prospectus. |
THE INFORMATION IN THIS STRUCTURAL AND COLLATERAL TERM SHEET IS NOT COMPLETE AND MAY BE AMENDED PRIOR TO THE TIME OF SALE. THIS TERM SHEET IS NOT AN OFFER TO SELL THESE SECURITIES AND IT IS NOT A SOLICITATION OF AN OFFER TO BUY THESE SECURITIES IN ANY JURISDICTION WHERE THE OFFER OR SALE IS NOT PERMITTED.
14
| WFRBS Commercial Mortgage Trust 2014-C20 | Characteristics of the Mortgage Pool |
| G. | Geographic Distribution(1)(2) |
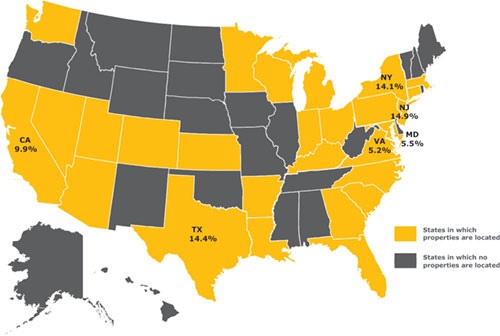
| Location | Number of Mortgaged Properties | Aggregate Cut- off Date Balance ($) | % of Cut- off Date Balance (%) | Weighted Average Cut-off Date LTV Ratio (%) | Weighted Average Balloon or ARD LTV Ratio (%) | Weighted Average U/W NCF DSCR (x) | Weighted Average U/W NOI Debt Yield (%) | Weighted Average U/W NCF Debt Yield (%) | Weighted Average Mortgage Rate (%) |
| New Jersey | 3 | $187,040,882 | 14.9% | 68.6% | 59.2% | 1.45x | 9.7% | 9.2% | 4.816% |
| Texas | 15 | 180,725,889 | 14.4 | 70.2 | 61.2 | 1.52 | 11.3 | 9.9 | 4.942 |
| New York | 16 | 176,112,866 | 14.1 | 46.2 | 36.0 | 3.70 | 22.3 | 22.1 | 4.584 |
| California | 32 | 123,928,595 | 9.9 | 65.8 | 55.6 | 1.45 | 9.8 | 9.4 | 4.878 |
| Southern | 29 | 105,958,227 | 8.5 | 67.1 | 57.3 | 1.42 | 9.5 | 9.1 | 4.842 |
| Northern | 3 | 17,970,368 | 1.4 | 58.0 | 45.6 | 1.63 | 11.5 | 11.2 | 5.088 |
| Maryland | 2 | 68,545,500 | 5.5 | 61.5 | 57.6 | 2.15 | 12.5 | 12.1 | 4.518 |
| Virginia | 1 | 65,000,000 | 5.2 | 73.4 | 59.9 | 1.30 | 8.7 | 8.2 | 4.740 |
Other(3) | 73 | 450,318,770 | 36.0 | 67.1 | 57.2 | 1.52 | 10.9 | 9.9 | 5.049 |
| Total/Weighted Average | 142 | $1,251,672,501 | 100.0% | 64.7% | 55.1% | 1.83x | 12.2% | 11.5% | 4.871% |
| (1) | The Mortgaged Properties are located in 27 states and the District of Columbia. |
| (2) | Because this table presents information relating to the mortgaged properties and not the mortgage loans, the information for mortgage loans secured by more than one mortgaged property (other than through cross-collateralization with other mortgage loans) is based on allocated amounts (allocating the mortgage loan principal balance to each of those properties according to the relative appraised values of the mortgaged properties or the allocated loan amounts or property-specific release prices set forth in the related mortgage loan documents or such other allocation as the related mortgage loan seller deemed appropriate). The information for each mortgaged property that relates to a mortgage loan that is cross-collateralized with other mortgage loans is based upon the principal balance of that mortgage loan, except that the applicable loan-to-value ratio, debt service coverage ratio or debt yield for each such mortgaged property is based upon the ratio or yield (as applicable) for the aggregate indebtedness evidenced by all loans in the group. On an individual basis, without regard to the cross-collateralization feature, any mortgaged property securing a mortgage loan that is part of a cross-collateralized group of mortgage loans may have a higher loan-to-value ratio, lower debt service coverage ratio and/or lower debt yield than is presented herein. For mortgaged properties securing residential cooperative mortgage loans, the debt service coverage ratio or debt yield for each such mortgaged property is calculated using underwritten net cash flow for the related residential cooperative property which is the projected net cash flow reflected in the most recent appraisal obtained by or otherwise in the possession of the related mortgage loan seller as of the cut-off date, and the loan-to-value ratio is calculated based upon the appraised value of the residential cooperative property determined as if such residential cooperative property is operated as a residential cooperative. With respect to the Woodbridge Center mortgage loan and the Brunswick Square mortgage loan, loan-to-value ratio, debt service coverage ratio and debt yield calculations include the related pari passu companion loan(s) (unless otherwise stated). Debt service coverage ratio, debt yield and loan-to-value ratio information takes no account of subordinate debt (whether or not secured by the related mortgaged property), if any, that is allowed under the terms of any mortgage loan. See Annex A-1 to the Free Writing Prospectus. |
| (3) | Includes 21 other states and the District of Columbia. |
THE INFORMATION IN THIS STRUCTURAL AND COLLATERAL TERM SHEET IS NOT COMPLETE AND MAY BE AMENDED PRIOR TO THE TIME OF SALE. THIS TERM SHEET IS NOT AN OFFER TO SELL THESE SECURITIES AND IT IS NOT A SOLICITATION OF AN OFFER TO BUY THESE SECURITIES IN ANY JURISDICTION WHERE THE OFFER OR SALE IS NOT PERMITTED.
15
WFRBS Commercial Mortgage Trust 2014-C20 | Characteristics of the Mortgage Pool |
H. Characteristics of the Mortgage Pool(1)
| CUT-OFF DATE BALANCE | ||||
Range of Cut-off Date Balances ($) | Number of Mortgage Loans | Aggregate Cut- off Date Balance | % of Cut-off Date Balance | |
| 827,847 - 1,000,000 | 1 | $827,847 | 0.1% | |
| 1,000,001 - 2,000,000 | 7 | 11,053,999 | 0.9 | |
| 2,000,001 - 3,000,000 | 8 | 21,605,698 | 1.7 | |
| 3,000,001 - 4,000,000 | 13 | 45,204,745 | 3.6 | |
| 4,000,001 - 5,000,000 | 11 | 49,964,598 | 4.0 | |
| 5,000,001 - 6,000,000 | 8 | 43,473,667 | 3.5 | |
| 6,000,001 - 7,000,000 | 5 | 32,117,080 | 2.6 | |
| 7,000,001 - 8,000,000 | 5 | 37,872,240 | 3.0 | |
| 8,000,001 - 9,000,000 | 3 | 25,410,979 | 2.0 | |
| 9,000,001 - 10,000,000 | 5 | 47,919,170 | 3.8 | |
| 10,000,001 - 15,000,000 | 12 | 134,321,529 | 10.7 | |
| 15,000,001 - 20,000,000 | 4 | 76,011,758 | 6.1 | |
| 20,000,001 - 30,000,000 | 7 | 165,589,945 | 13.2 | |
| 30,000,001 - 50,000,000 | 5 | 214,826,936 | 17.2 | |
| 50,000,001 - 70,000,000 | 2 | 127,625,000 | 10.2 | |
| 70,000,001 - 90,000,000 | 1 | 87,847,310 | 7.0 | |
| 90,000,001 - 130,000,000 | 1 | 130,000,000 | 10.4 | |
| Total: | 98 | $1,251,672,501 | 100.0% | |
| Average: | $12,772,168 | |||
| UNDERWRITTEN NOI DEBT SERVICE COVERAGE RATIO | ||||
Range of U/W NOI DSCRs (x) | Number of Mortgage Loans | Aggregate Cut- off Date Balance | % of Cut-off Date Balance | |
| 1.23 - 1.30 | 1 | $23,485,000 | 1.9% | |
| 1.31 - 1.40 | 8 | 111,151,848 | 8.9 | |
| 1.41 - 1.50 | 14 | 287,708,491 | 23.0 | |
| 1.51 - 1.60 | 15 | 88,153,144 | 7.0 | |
| 1.61 - 1.70 | 17 | 229,038,376 | 18.3 | |
| 1.71 - 1.80 | 11 | 182,179,278 | 14.6 | |
| 1.81 - 1.90 | 11 | 109,297,521 | 8.7 | |
| 1.91 - 2.00 | 3 | 77,509,057 | 6.2 | |
| 2.01 - 2.25 | 5 | 75,824,654 | 6.1 | |
| 2.26 - 2.75 | 1 | 20,000,000 | 1.6 | |
| 2.76 - 3.00 | 1 | 2,796,464 | 0.2 | |
| 3.01 - 24.04 | 11 | 44,528,668 | 3.6 | |
| Total: | 98 | $1,251,672,501 | 100.0% | |
| Weighted Average: | 1.95x | |||
| UNDERWRITTEN NCF DEBT SERVICE COVERAGE RATIO | ||||
Range of U/W NCF DSCRs (x) | Number of Mortgage Loans | Aggregate Cut- off Date Balance | % of Cut-off Date Balance | |
| 1.20 | 1 | $23,485,000 | 1.9% | |
| 1.21 - 1.30 | 3 | 81,577,591 | 6.5 | |
| 1.31 - 1.40 | 15 | 164,394,668 | 13.1 | |
| 1.41 - 1.50 | 32 | 349,218,562 | 27.9 | |
| 1.51 - 1.60 | 16 | 246,658,344 | 19.7 | |
| 1.61 - 1.70 | 8 | 74,063,101 | 5.9 | |
| 1.71 - 1.80 | 5 | 169,125,449 | 13.5 | |
| 1.81 - 1.90 | 3 | 25,855,791 | 2.1 | |
| 1.91 - 2.25 | 2 | 49,968,862 | 4.0 | |
| 2.26 - 2.50 | 1 | 20,000,000 | 1.6 | |
| 2.51 - 2.75 | 1 | 2,796,464 | 0.2 | |
| 2.76 - 24.04 | 11 | 44,528,668 | 3.6 | |
| Total: | 98 | $1,251,672,501 | 100.0% | |
| Weighted Average: | 1.83x | |||
| LOAN PURPOSE | ||||
| Loan Purpose | Number of Mortgage Loans | Aggregate Cut- off Date Balance | % of Cut-off Date Balance | |
| Refinance | 77 | $974,270,778 | 77.8% | |
| Acquisition | 21 | 277,401,724 | 22.2 | |
| Total: | 98 | $1,251,672,501 | 100.0% | |
| MORTGAGE RATE | ||||
Range of Mortgage Rates (%) | Number of Mortgage Loans | Aggregate Cut- off Date Balance | % of Cut-off Date Balance | |
| 4.160 - 4.250 | 6 | $33,413,671 | 2.7% | |
| 4.251 - 4.500 | 8 | 70,447,197 | 5.6 | |
| 4.501 - 4.750 | 11 | 274,076,786 | 21.9 | |
| 4.751 - 5.000 | 25 | 496,083,868 | 39.6 | |
| 5.001 - 5.250 | 31 | 248,347,558 | 19.8 | |
| 5.251 - 5.500 | 11 | 83,451,271 | 6.7 | |
| 5.501 - 5.750 | 2 | 26,215,941 | 2.1 | |
| 5.751 - 5.780 | 4 | 19,636,208 | 1.6 | |
| Total: | 98 | $1,251,672,501 | 100.0% | |
| Weighted Average: | 4.871% | |||
UNDERWRITTEN NOI DEBT YIELD | ||||
Range of U/W NOI Debt Yields (%) | Number of Mortgage Loans | Aggregate Cut- off Date Balance | % of Cut-off Date Balance | |
| 7.8 - 8.0 | 1 | $23,485,000 | 1.9% | |
| 8.1 - 9.0 | 10 | 171,329,513 | 13.7 | |
| 9.1 - 10.0 | 20 | 326,949,829 | 26.1 | |
| 10.1 - 11.0 | 15 | 188,868,885 | 15.1 | |
| 11.1 - 12.0 | 19 | 183,707,621 | 14.7 | |
| 12.1 - 13.0 | 11 | 224,412,741 | 17.9 | |
| 13.1 - 14.0 | 8 | 62,204,476 | 5.0 | |
| 14.1 - 15.0 | 2 | 23,389,304 | 1.9 | |
| 15.1 - 19.0 | 1 | 2,796,464 | 0.2 | |
| 19.1 - 163.2 | 11 | 44,528,668 | 3.6 | |
| Total: | 98 | $1,251,672,501 | 100.0% | |
| Weighted Average: | 12.2% | |||
UNDERWRITTEN NCF DEBT YIELD | ||||
Range of U/W NCF Debt Yields (%) | Number of Mortgage Loans | Aggregate Cut- off Date Balance | % of Cut-off Date Balance | |
| 7.6 - 8.0 | 1 | $23,485,000 | 1.9% | |
| 8.1 - 9.0 | 15 | 336,641,826 | 26.9 | |
| 9.1 - 10.0 | 33 | 399,514,218 | 31.9 | |
| 10.1 - 11.0 | 17 | 171,760,675 | 13.7 | |
| 11.1 - 12.0 | 11 | 164,331,456 | 13.1 | |
| 12.1 - 13.0 | 8 | 107,190,831 | 8.6 | |
| 13.1 - 14.0 | 1 | 1,423,362 | 0.1 | |
| 14.1 - 17.0 | 1 | 2,796,464 | 0.2 | |
| 17.1 - 163.2 | 11 | 44,528,668 | 3.6 | |
| Total: | 98 | $1,251,672,501 | 100.0% | |
| Weighted Average: | 11.5% | |||
(1) | For mortgaged properties securing residential cooperative mortgage loans, the debt service coverage ratio or debt yield for each such mortgaged property are calculated using underwritten net cash flow for the related residential cooperative property which is the projected net cash flow reflected in the most recent appraisal obtained by or otherwise in the possession of the related mortgage loan seller as of the cut-off date, and the loan-to-value ratio is calculated based upon the appraised value of the residential cooperative property determined as if such residential cooperative property is operated as a residential cooperative. The information for each mortgaged property that relates to a mortgage loan that is cross-collateralized with other mortgage loans is based upon the principal balance of that mortgage loan, except that the applicable loan-to-value ratio, debt service coverage ratio or debt yield for each such mortgaged property is based upon the ratio or yield (as applicable) for the aggregate indebtedness evidenced by all loans in the group. On an individual basis, without regard to the cross-collateralization feature, any mortgaged property securing a mortgage loan that is part of a cross-collateralized group of mortgage loans may have a higher loan-to-value ratio, lower debt service coverage ratio and/or lower debt yield than is presented herein. With respect to the Woodbridge Center mortgage loan and the Brunswick Square mortgage loan loan-to-value ratio, debt service coverage ratio and debt yield calculations include the related pari passu companion loan (unless otherwise stated). Debt service coverage ratio, debt yield and loan-to-value ratio information takes no account of subordinate debt (whether or not secured by the related mortgaged property), if any, that is allowed under the terms of any mortgage loan. See Annex A-1 to the Free Writing Prospectus. |
THE INFORMATION IN THIS STRUCTURAL AND COLLATERAL TERM SHEET IS NOT COMPLETE AND MAY BE AMENDED PRIOR TO THE TIME OF SALE. THIS TERM SHEET IS NOT AN OFFER TO SELL THESE SECURITIES AND IT IS NOT A SOLICITATION OF AN OFFER TO BUY THESE SECURITIES IN ANY JURISDICTION WHERE THE OFFER OR SALE IS NOT PERMITTED.
16
WFRBS Commercial Mortgage Trust 2014-C20 | Characteristics of the Mortgage Pool |
| ORIGINAL TERM TO MATURITY OR ARD | ||||
Range of Original Terms to Maturity or ARD (months) | Number of Mortgage Loans | Aggregate Cut- off Date Balance | % of Cut-off Date Balance | |
| 60 | 9 | $96,529,602 | 7.7% | |
| 84 | 2 | 51,536,393 | 4.1 | |
| 120 | 87 | 1,103,606,506 | 88.2 | |
| Total: | 98 | $1,251,672,501 | 100.0% | |
| Weighted Average: | 114 months | |||
REMAINING TERM TO MATURITY OR ARD | ||||
Range of Remaining Terms to Maturity or ARD (months) | Number of Mortgage Loans | Aggregate Cut- off Date Balance | % of Cut-off Date Balance | |
| 57 - 60 | 9 | $96,529,602 | 7.7% | |
| 61 - 84 | 2 | 51,536,393 | 4.1 | |
| 85 - 120 | 87 | 1,103,606,506 | 88.2 | |
| Total: | 98 | $1,251,672,501 | 100.0% | |
| Weighted Average: | 113 months | |||
ORIGINAL AMORTIZATION TERM(2) | ||||
Range of Original Amortization Terms (months) | Number of Mortgage Loans | Aggregate Cut- off Date Balance | % of Cut-off Date Balance | |
| Interest-Only | 2 | $33,200,000 | 2.7% | |
| 240 | 1 | 827,847 | 0.1 | |
| 241 - 300 | 22 | 234,142,912 | 18.7 | |
| 301 - 360 | 70 | 955,973,915 | 76.4 | |
| 361 - 480 | 3 | 27,527,828 | 2.2 | |
| Total: | 98 | $1,251,672,501 | 100.0% | |
Weighted Average(3): | 351 months | |||
(2) The original amortization term shown for any mortgage loan that is interest-only for part of its term does not include the number of months in its interest-only period and reflects only the number of months as of the commencement of amortization remaining from the end of such interest-only period. (3) Excludes the non-amortizing loans. | ||||
REMAINING AMORTIZATION TERM(4) | ||||
Range of Remaining Amortization Terms (months) | Number of Mortgage Loans | Aggregate Cut- off Date Balance | % of Cut-off Date Balance | |
| Interest-Only | 2 | $33,200,000 | 2.7% | |
| 239 - 240 | 1 | 827,847 | 0.1 | |
| 241 - 300 | 22 | 234,142,912 | 18.7 | |
| 301 - 360 | 70 | 955,973,915 | 76.4 | |
| 361 - 479 | 3 | 27,527,828 | 2.2 | |
| Total: | 98 | $1,251,672,501 | 100.0% | |
Weighted Average(5): | 350 months | |||
(4) The remaining amortization term shown for any mortgage loan that is interest-only for part of its term does not include the number of months in its interest-only period and reflects only the number of months as of the commencement of amortization remaining from the end of such interest-only period. (5) Excludes the non-amortizing loans. | ||||
LOCKBOXES | ||||
| Type of Lockbox | Number of Mortgage Loans | Aggregate Cut- off Date Balance | % of Cut-off Date Balance | |
| Hard/Springing Cash Management | 28 | $507,144,815 | 40.5% | |
| Springing (W/Out Estab. Account) | 36 | 256,799,837 | 20.5 | |
| Hard/Upfront Cash Management | 6 | 202,783,804 | 16.2 | |
| Soft/Springing Cash Management | 7 | 151,851,580 | 12.1 | |
| None | 21 | 133,092,464 | 10.6 | |
| Total: | 98 | $1,251,672,501 | 100.0% | |
PREPAYMENT PROVISION SUMMARY | ||||
| Prepayment Provision | Number of Mortgage Loans | Aggregate Cut- off Date Balance | % of Cut- off Date Balance | |
| Lockout/Defeasance/Open | 77 | $1,015,469,796 | 81.1% | |
| Lockout/YM%/Open | 9 | 183,903,669 | 14.7 | |
| YM%/1%/Open | 11 | 44,528,668 | 3.6 | |
| Lockout/YM% Defeasance/Open | 1 | 7,770,368 | 0.6 | |
| Total: | 98 | $1,251,672,501 | 100.0% | |
| CUT-OFF DATE LOAN-TO-VALUE RATIO | ||||
Range of Cut-off Date LTV Ratios (%) | Number of Mortgage Loans | Aggregate Cut- off Date Balance | % of Cut-off Date Balance | |
| 2.0 - 25.0 | 10 | $42,181,831 | 3.4% | |
| 25.1 - 30.0 | 1 | 2,346,837 | 0.2 | |
| 30.1 - 40.0 | 1 | 35,000,000 | 2.8 | |
| 40.1 - 50.0 | 2 | 41,965,941 | 3.4 | |
| 50.1 - 55.0 | 6 | 34,392,042 | 2.7 | |
| 55.1 - 60.0 | 3 | 28,307,822 | 2.3 | |
| 60.1 - 65.0 | 21 | 238,284,163 | 19.0 | |
| 65.1 - 70.0 | 31 | 532,131,477 | 42.5 | |
| 70.1 - 75.0 | 22 | 270,562,388 | 21.6 | |
| 75.1 - 76.0 | 1 | 26,500,000 | 2.1 | |
| Total: | 98 | $1,251,672,501 | 100.0% | |
| Weighted Average: | 64.7% | |||
| BALLOON OR ARD LOAN-TO-VALUE RATIO | ||||
| Range of Balloon LTV Ratios (%) | Number of Mortgage Loans | Aggregate Cut- off Date Balance | % of Cut-off Date Balance | |
| 1.2 - 20.0 | 10 | $42,181,831 | 3.4% | |
| 20.1 - 25.0 | 1 | 2,346,837 | 0.2 | |
| 25.1 - 35.0 | 1 | 35,000,000 | 2.8 | |
| 35.1 - 40.0 | 1 | 21,965,941 | 1.8 | |
| 40.1 - 45.0 | 6 | 39,848,800 | 3.2 | |
| 45.1 - 50.0 | 12 | 155,137,518 | 12.4 | |
| 50.1 - 55.0 | 19 | 153,513,857 | 12.3 | |
| 55.1 - 60.0 | 17 | 280,634,171 | 22.4 | |
| 60.1 - 65.0 | 24 | 376,851,046 | 30.1 | |
| 65.1 - 68.9 | 7 | 144,192,500 | 11.5 | |
| Total: | 98 | $1,251,672,501 | 100.0% | |
| Weighted Average: | 55.1% | |||
| AMORTIZATION TYPE | ||||
| Type of Amortization | Number of Mortgage Loans | Aggregate Cut- off Date Balance | % of Cut-off Date Balance | |
| Amortizing Balloon | 72 | $717,517,871 | 57.3% | |
| Interest-only, Amortizing Balloon | 20 | 406,589,375 | 32.5 | |
| Interest-only, Amortizing ARD | 2 | 65,900,500 | 5.3 | |
| Interest-only, Balloon | 2 | 33,200,000 | 2.7 | |
| Amortizing ARD | 2 | 28,464,755 | 2.3 | |
| Total: | 98 | $1,251,672,501 | 100.0% | |
ORIGINAL TERM OF INTEREST-ONLY PERIOD FOR PARTIAL IO LOANS | ||||
| IO Term (months) | Number of Mortgage Loans | Aggregate Cut- off Date Balance | % of Cut-off Date Balance | |
| 24 | 11 | $101,316,875 | 8.1% | |
| 25 - 36 | 5 | 186,682,500 | 14.9 | |
| 37 - 48 | 1 | 26,000,000 | 2.1 | |
| 49 - 60 | 5 | 158,490,500 | 12.7 | |
| Total: | 22 | $472,489,875 | 37.7% | |
| Weighted Average: | 42 months | |||
SEASONING | ||||
| Seasoning (months) | Number of Mortgage Loans | Aggregate Cut- off Date Balance | % of Cut-off Date Balance | |
| 0 | 22 | $267,466,875 | 21.4% | |
| 1 - 3 | 74 | 961,861,050 | 76.8 | |
| 4 | 2 | 22,344,576 | 1.8 | |
| Total: | 98 | $1,251,672,501 | 100.0% | |
| Weighted Average: | 1 month | |||
THE INFORMATION IN THIS STRUCTURAL AND COLLATERAL TERM SHEET IS NOT COMPLETE AND MAY BE AMENDED PRIOR TO THE TIME OF SALE. THIS TERM SHEET IS NOT AN OFFER TO SELL THESE SECURITIES AND IT IS NOT A SOLICITATION OF AN OFFER TO BUY THESE SECURITIES IN ANY JURISDICTION WHERE THE OFFER OR SALE IS NOT PERMITTED.
17
| WFRBS Commercial Mortgage Trust 2014-C20 | Certain Terms and Conditions |
V. Certain Terms and Conditions
| Interest Entitlements: | The interest entitlement of each Class of Offered Certificates on each Distribution Date generally will be the interest accrued during the related Interest Accrual Period on the related Certificate Principal Balance or Notional Amount at the related pass-through rate, net of any prepayment interest shortfalls allocated to that Class for such Distribution Date as described below. If prepayment interest shortfalls arise from voluntary prepayments (without applicable Special Servicer consent) on particular non-specially serviced mortgage loans during any collection period, the applicable Master Servicer is required to make a compensating interest payment to offset those shortfalls, generally up to an amount equal to the portion of its master servicing fees that accrue at one basis point per annum. The remaining amount of prepayment interest shortfalls will be allocated to reduce the interest entitlement on all Classes of Certificates (other than the Class X-A, X-B and X-C Certificates), pro rata, based on their respective amounts of accrued interest for the related Distribution Date (except with respect to the allocation among the Class A-S, B, C and PEX Certificates as described below under “Allocations and Distributions on the Class A-S, B, C and PEX Certificates”). If a Class receives less than the entirety of its interest entitlement on any Distribution Date, then the shortfall, excluding any shortfall due to prepayment interest shortfalls, will be added to its interest entitlement for the next succeeding Distribution Date. Interest entitlements on the Class E and D Certificates and the Class C and B regular interests, in that order, may be reduced by certain Trust Advisor expenses (subject to the discussion below under “Allocations and Distributions on the Class A-S, B, C and PEX Certificates”). | |||
| Principal Distribution Amount: | The Principal Distribution Amount for each Distribution Date generally will be the aggregate amount of principal received or advanced in respect of the mortgage loans, net of any non-recoverable advances and interest thereon that are reimbursed to the applicable Master Servicer, the applicable Special Servicer or the Trustee during the related collection period. Non-recoverable advances and interest thereon are reimbursable from principal collections and advances before reimbursement from other amounts. The Principal Distribution Amount may also be reduced, with a corresponding loss, to the Class E and D Certificates and the Class C, B and A-S regular interests, then to the Class A-1, A-2, A-3, A-4, A-5 and A-SB Certificates (with any losses on the Class A-1, A-2, A-3, A-4, A-5 and A-SB Certificates allocated pro rata according to their respective Certificate Principal Balances immediately prior to that Distribution Date), in that order, in connection with certain Trust Advisor expenses to the extent that interest entitlements on the Class B and C regular interests and the Class D and E Certificates are insufficient to absorb the effect of the expense on any particular Distribution Date. For a discussion on the allocation of amounts distributable in respect of the Class A-S, B and C regular interests, see “Allocations and Distributions on the Class A-S, B, C and PEX Certificates” below. | |||
| Distributions: | On each Distribution Date, funds available for distribution from the mortgage loans, net of specified trust fees, expenses and reimbursements will generally be distributed in the following amounts and order of priority (in each case to the extent of remaining available funds): | |||
| 1. | Class A-1, A-2, A-3, A-4, A-5, A-SB, X-A, X-B and X-C Certificates: To interest on the Class A-1, A-2, A-3, A-4, A-5, A-SB, X-A, X-B and X-C Certificates, pro rata, according to their respective interest entitlements. | |||
| 2. | Class A-1, A-2, A-3, A-4, A-5 and A-SB Certificates: To principal on the Class A-1, A-2, A-3, A-4, A-5 and A-SB Certificates in the following amounts and order of priority: (i) first, to principal on the Class A-SB Certificates, in an amount up to the Principal Distribution Amount for such Distribution Date until their Certificate Principal Balance is reduced to the Class A-SB Planned Principal Balance for such Distribution Date; (ii) second, to principal on the Class A-1 Certificates until their Certificate Principal Balance is reduced to zero, up to the remainder of the Principal Distribution Amount for such Distribution Date; (iii) third, to principal on the Class A-2 Certificates until their Certificate Principal Balance is reduced to zero, up to the remainder of the Principal Distribution Amount for such Distribution Date; (iv) fourth, to principal on the Class A-3 Certificates until their Certificate Principal Balance is reduced to zero, up to the remainder of the Principal Distribution Amount for such Distribution Date; (v) fifth, to principal on the Class A-4 Certificates until their Certificate Principal Balance is reduced to zero, up to the remainder of the Principal Distribution Amount for such Distribution Date; (vi) sixth, to principal on the Class A-5 Certificates until their Certificate Principal Balance is reduced to zero, up to the remainder of the Principal Distribution Amount for such Distribution Date; and (vii) seventh, to principal on the Class A-SB Certificates until their Certificate Principal Balance is reduced to zero, up to the remainder of the Principal Distribution Amount for such Distribution Date. However, if the Certificate Principal Balance of each and every Class of Principal Balance Certificates, other than the Class A-1, A-2, A-3, A-4, A-5 and A-SB Certificates, has been reduced to zero as a result of the allocation of Mortgage Loan | |||
THE INFORMATION IN THIS STRUCTURAL AND COLLATERAL TERM SHEET IS NOT COMPLETE AND MAY BE AMENDED PRIOR TO THE TIME OF SALE. THIS TERM SHEET IS NOT AN OFFER TO SELL THESE SECURITIES AND IT IS NOT A SOLICITATION OF AN OFFER TO BUY THESE SECURITIES IN ANY JURISDICTION WHERE THE OFFER OR SALE IS NOT PERMITTED.
18
| WFRBS Commercial Mortgage Trust 2014-C20 | Certain Terms and Conditions |
| losses and expenses and any of the Class A-1, A-2, A-3, A-4, A-5 and A-SB Certificates remains outstanding, then the Principal Distribution Amount will be distributed on the Class A-1, A-2, A-3, A-4, A-5 and A-SB Certificates, pro rata, based on their respective outstanding Certificate Principal Balances, until their Certificate Principal Balances have been reduced to zero. | ||||
| 3. | Class A-1, A-2, A-3, A-4, A-5 and A-SB Certificates: To reimburse the holders of the Class A-1, A-2, A-3, A-4, A-5 and A-SB Certificates, pro rata, for any previously unreimbursed losses (other than certain Trust Advisor expenses) on the mortgage loans that were previously allocated in reduction of the Certificate Principal Balances of such Classes. | |||
| 4. | Class A-S regular interest: To make distributions on the Class A-S regular interest as follows: (a) first, to interest on Class A-S regular interest in the amount of the interest entitlement for that Class; (b) next, to the extent of the portion of the Principal Distribution Amount remaining after distributions in respect of principal to each Class with a higher distribution priority (in this case, the Class A-1, A-2, A-3, A-4, A-5 and A-SB Certificates), to principal on the Class A-S regular interest until its principal balance is reduced to zero; and (c) next, to reimburse the holders of the Class A-S regular interest for any previously unreimbursed losses (other than certain Trust Advisor expenses) on the mortgage loans that were previously allocated to that Class in reduction of its principal balance. | |||
| 5. | Class B regular interest: To make distributions on the Class B regular interest as follows: (a) first, to interest on Class B regular interest in the amount of the interest entitlement for that Class; (b) next, to the extent of the portion of the Principal Distribution Amount remaining after distributions in respect of principal to each Class with a higher distribution priority (in this case, the Class A-1, A-2, A-3, A-4, A-5 and A-SB Certificates and the Class A-S regular interest), to principal on the Class B regular interest until its principal balance is reduced to zero; and (c) next, to reimburse the holders of the Class B regular interest for any previously unreimbursed losses (other than certain Trust Advisor expenses) on the mortgage loans that were previously allocated to that Class in reduction of its principal balance. | |||
| 6. | Class C regular interest: To make distributions on the Class C regular interest as follows: (a) first, to interest on Class C regular interest in the amount of the interest entitlement for that Class; (b) next, to the extent of the portion of the Principal Distribution Amount remaining after distributions in respect of principal to each Class with a higher distribution priority (in this case, the Class A-1, A-2, A-3, A-4, A-5 and A-SB Certificates and the Class A-S and B regular interests), to principal on the Class C regular interest until its principal balance is reduced to zero; and (c) next, to reimburse the holders of the Class C regular interest for any previously unreimbursed losses (other than certain Trust Advisor expenses) on the mortgage loans that were previously allocated to that Class in reduction of its principal balance. | |||
| 7. | Class D Certificates: To make distributions on the Class D Certificates as follows: (a) first, to interest on Class D Certificates in the amount of the interest entitlement for that Class; (b) next, to the extent of the portion of the Principal Distribution Amount remaining after distributions in respect of principal to each Class with a higher distribution priority (in this case, the Class A-1, A-2, A-3, A-4, A-5 and A-SB Certificates and the Class A-S, B and C regular interests), to principal on the Class D Certificates until its principal balance is reduced to zero; and (c) next, to reimburse the holders of the Class D Certificates for any previously unreimbursed losses (other than certain Trust Advisor expenses) on the mortgage loans that were previously allocated to that Class in reduction of its principal balance. | |||
| 8. | After the Class A-1, A-2, A-3, A-4, A-5 and A-SB Certificates, the Class A-S, B and C regular interests and the Class D Certificates are paid all amounts to which they are entitled, the remaining funds available for distribution will be used to pay interest, principal and loss reimbursement amounts (other than certain Trust Advisor expenses) on the Class E, F and G Certificates sequentially in that order in a manner analogous to the Class D Certificates. | |||
| Allocations and Distributions on the Class A-S, B, C and PEX Certificates: | On the closing date, the upper-tier REMIC of the issuing entity will issue the Class A-S, Class B and Class C regular interests (each a “regular interest”) which will have outstanding principal balances on the closing date of $62,584,000, $95,440,000 and $45,373,000, respectively. The regular interests will be held in a grantor trust for the benefit of the holders of the Class A-S, B, C | |||
THE INFORMATION IN THIS STRUCTURAL AND COLLATERAL TERM SHEET IS NOT COMPLETE AND MAY BE AMENDED PRIOR TO THE TIME OF SALE. THIS TERM SHEET IS NOT AN OFFER TO SELL THESE SECURITIES AND IT IS NOT A SOLICITATION OF AN OFFER TO BUY THESE SECURITIES IN ANY JURISDICTION WHERE THE OFFER OR SALE IS NOT PERMITTED.
19
| WFRBS Commercial Mortgage Trust 2014-C20 | Certain Terms and Conditions |
| and PEX Certificates. The Class A-S, B, C and PEX Certificates will, at all times, represent undivided beneficial ownership interests in a grantor trust that will hold those regular interests. Each class of the Class A-S, B, C and PEX Certificates will, at all times, represent an undivided beneficial ownership interest in a percentage of the outstanding principal balance of the regular interest with the same alphabetical class designation. The Class PEX Certificates will, at all times, represent an undivided beneficial ownership interest in the remaining percentages of the outstanding principal balances of the Class A-S, B and C regular interests and which percentage interests are referred to in this Term Sheet as the “Class PEX Component A-S, Class PEX Component B and Class PEX Component C” (collectively, the “Class PEX Components”). | ||
| Interest, principal, prepayment premiums, yield maintenance charges and voting rights that are allocated to the Class A-S, B or C regular interest will be distributed or allocated, as applicable, as between the Class A-S, B or C Certificates, as applicable, on the one hand, and Class PEX Component A-S, Class PEX Component B or Class PEX Component C, as applicable (and correspondingly, the Class PEX Certificates), on the other hand, pro rata, based on their respective percentage interests in the Class A-S, Class B or Class C regular interest, as applicable. In addition, any losses (including, without limitation, as a result of Trust Advisor expenses) that are allocated to the Class A-S, Class B or Class C regular interest will correspondingly be allocated as between the Class A-S, B or C Certificates, as applicable, on the one hand, and Class PEX Component A-S, Class PEX Component B or Class PEX Component C, as applicable (and correspondingly, the Class PEX Certificates), on the other hand, pro rata, based on their respective percentage interests in the Class A-S, Class B or Class C regular interest, as applicable. For a complete description of the allocations and distributions with respect to the Class A-S regular interest, the Class B regular interest and the Class C regular interest (and correspondingly the Class A-S, B, C and PEX Certificates and the Class PEX Component A-S, Class PEX Component B and Class PEX Component C), see “Description of the Offered Certificates” in the Free Writing Prospectus. See “Material Federal Income Tax Consequences” in the Free Writing Prospectus for a discussion of the tax treatment of the Exchangeable Certificates. | ||
Exchanging Certificates through Combination and Recombination: | If you own Class A-S, B and C Certificates, you will be able to exchange them for a proportionate interest in the Class PEX Certificates, and vice versa, as described in the Free Writing Prospectus. You can exchange your Exchangeable Certificates by notifying the Certificate Administrator. If Exchangeable Certificates are outstanding and held by certificateholders, those certificates will receive principal and interest that would otherwise have been payable on the same proportion of certificates exchanged therefor if those certificates were outstanding and held by certificateholders. Any such allocations of principal and interest between classes of Exchangeable Certificates will have no effect on the principal or interest entitlements of any other class of certificates. The Free Writing Prospectus describes the available combinations of Exchangeable Certificates eligible for exchange. | |
| Allocation of Yield Maintenance and Prepayment Premiums: | If any yield maintenance charges and prepayment premiums are collected during any particular collection period with respect to any mortgage loan, then on the distribution date corresponding to that collection period, the certificate administrator will pay a portion of the yield maintenance charges and prepayment premiums (net of liquidation fees payable therefrom) in the following manner: (1) pro rata, between (x) the group (“YM Group A”) of the Class A-1, A-2, A-3, A-4, A-5, A-SB and X-A Certificates and the Class A-S regular interest and (y) the group (“YM Group B” and, collectively with the YM Group A, the “YM Groups”) of Class B and C regular interests and the Class D and Class X-B Certificates, based upon the aggregate amount of principal distributed to the applicable classes of principal balance certificates (other than the Class A-S, B, C and PEX Certificates) and the Class A-S, B and C regular interests, as applicable, in each YM Group for that distribution date, and (2) among the classes of certificates and regular interest(s) in each YM Group, in the following manner, up to an amount equal to the product of (a) the yield maintenance or prepayment premium allocated to such YM Group, (b) the related Base Interest Fraction (as defined in the Free Writing Prospectus), and (c) a fraction, which in no event may be greater than 1.0, the numerator of which is equal to the amount of principal distributed to the holder(s) of such class or regular interest for that distribution date, and the denominator of which is the aggregate amount of principal distributed to all the certificates and the regular interests in that YM Group for that distribution date. Any yield maintenance charges or prepayment premium allocated to such YM Group remaining after such distributions to Principal Balance Certificates or regular interest(s) described above will be distributed to the Class X-A or Class X-B Certificates as applicable, in such YM Group. |
THE INFORMATION IN THIS STRUCTURAL AND COLLATERAL TERM SHEET IS NOT COMPLETE AND MAY BE AMENDED PRIOR TO THE TIME OF SALE. THIS TERM SHEET IS NOT AN OFFER TO SELL THESE SECURITIES AND IT IS NOT A SOLICITATION OF AN OFFER TO BUY THESE SECURITIES IN ANY JURISDICTION WHERE THE OFFER OR SALE IS NOT PERMITTED.
20
| WFRBS Commercial Mortgage Trust 2014-C20 | Certain Terms and Conditions |
| No prepayment premiums or yield maintenance charges will be distributed to the holders of the Class X-C, E, F, G, V or R Certificates. The holders of the Class X-B Certificates will be entitled to receive all yield maintenance charges and prepayment premiums after the Class A-1, A-2, A-3, A-4, A-5, X-A, A-SB and D Certificates and the Class A-S, B and C regular interests (and, therefore, the Class A-S, B, C and PEX Certificates) have been retired. For a description of when prepayment premiums and yield maintenance charges are generally required on the mortgage loans, see Annex A-1 to the Free Writing Prospectus. See also “Risk Factors—Prepayments and Repurchases of the Mortgage Assets Will Affect the Timing of Your Cash Flow and May Affect Your Yield” in the prospectus attached to the Free Writing Prospectus. Prepayment premiums and yield maintenance charges will be distributed on each Distribution Date only to the extent they are actually received on the mortgage loans as of the related Determination Date. | ||
| Realized Losses: | The Certificate Principal Balances of the Class A-1, A-2, A-3, A-4, A-5, A-SB, D, E, F and G Certificates, and the Class A-S, B and C regular interests will be reduced without distribution on any Distribution Date as a write-off to the extent of any losses realized on the mortgage loans allocated to such Class or regular interest on such Distribution Date. Such losses (other than certain Trust Advisor expenses) will be applied in the following order, in each case until the related Certificate Principal Balance is reduced to zero: first, to Class G; second, to Class F; third, to Class E; fourth, to Class D; fifth, to the Class C regular interest; sixth, to the Class B regular interest; seventh, to the Class A-S regular interest; and, finally, pro rata, to Classes A-1, A-2, A-3, A-4, A-5 and A-SB based on their outstanding Certificate Principal Balances. Certain Trust Advisor expenses (if not absorbed by reductions of interest entitlements on the Class E and D Certificates and the Class C and B regular interests) will be applied as write-offs in a similar manner, except that such write-offs will be applied only to the Class E and D Certificates, the Class C, B and A-S regular interests, and the Class A-1, A-2, A-3, A-4, A-5 and A-SB Certificates (with any write-offs on the Class A-1, A-2, A-3, A-4, A-5 and A-SB Certificates to be allocated pro rata according to their respective Certificate Principal Balances immediately prior to that Distribution Date), in that order. Any realized losses allocated to the Class A-S, B and C regular interests will, in turn, be allocated to the Class A-S, B, C and PEX Certificates as described above in “Allocations and Distributions on the Class A-S, B, C and PEX Certificates”. | |
| The notional amount of the Class X-A Certificates will be reduced by the amount of all losses that are allocated to the Class A-1, A-2, A-3, A-4, A-5 or A-SB Certificates or the Class A-S regular interest as write-offs in reduction of their Certificate Principal Balances. The notional amount of the Class X-B Certificates will be reduced by the amount of all losses that are allocated to the Class B and C regular interests and the Class D Certificates as write-offs in reduction of their Certificate Principal Balances. The notional amount of the Class X-C Certificates will be reduced by the amount of all losses that are allocated to the Class E, F or G Certificates as write-offs in reduction of their Certificate Principal Balances. | ||
| Debt Service Advances: | The related Master Servicer or, if such Master Servicer fails to do so, the Trustee, will be obligated to advance delinquent debt service payments (other than balloon payments and default interest) and assumed debt service payments on the mortgage loans (including each pari passu mortgage loan but not its related pari passu companion loans), except to the extent any such advance is deemed non-recoverable from collections on the related mortgage loan. In addition, if an Appraisal Reduction Amount exists for a given mortgage loan, the interest portion of any debt service advance for such mortgage loan will be reduced, which will have the effect of reducing the amount of interest available for distribution to the Certificates in reverse alphabetical order of their Class designations (except that interest payments on the Class A-1, A-2, A-3, A-4, A-5, A-SB, X-A, X-B and X-C Certificates would be affected on a pari passu basis). | |
| Servicing Advances: | The related Master Servicer or, if such Master Servicer fails to do so, the Trustee, will be obligated to make servicing advances with respect to each mortgage loan it services, including the payment of delinquent property taxes, insurance premiums and ground rent, except to the extent that those advances are deemed non-recoverable from collections on the related mortgage loan. | |
| Appraisal Reduction Amounts: | An Appraisal Reduction Amount generally will be created in the amount, if any, by which the principal balance of a required appraisal loan (which is a mortgage loan with respect to which certain defaults, modifications or insolvency events have occurred as further described in the Free Writing Prospectus) plus other amounts overdue or advanced in connection with such mortgage loan exceeds 90% of the appraised value of the related mortgaged property plus certain escrows and reserves (including letters of credit) held with respect to the mortgage loan. | |
| A mortgage loan will cease to be a required appraisal loan when the same has ceased to be a specially serviced mortgage loan (if applicable), has been brought current for at least three consecutive months and no other circumstances exist that would cause such mortgage loan to be a required appraisal loan. |
THE INFORMATION IN THIS STRUCTURAL AND COLLATERAL TERM SHEET IS NOT COMPLETE AND MAY BE AMENDED PRIOR TO THE TIME OF SALE. THIS TERM SHEET IS NOT AN OFFER TO SELL THESE SECURITIES AND IT IS NOT A SOLICITATION OF AN OFFER TO BUY THESE SECURITIES IN ANY JURISDICTION WHERE THE OFFER OR SALE IS NOT PERMITTED.
21
| WFRBS Commercial Mortgage Trust 2014-C20 | Certain Terms and Conditions |
| Appraisal Reduction Amounts will affect the amount of debt service advances on the related mortgage loan. Appraisal Reduction Amounts will also be taken into account in the determination of the identity of the Class whose majority constitutes the “majority subordinate certificateholder” and is entitled to appoint the subordinate class representative. | ||
| Clean-Up Call and Exchange Termination: | On each Distribution Date occurring after the aggregate unpaid principal balance of the mortgage loans is reduced below 1% of the initial aggregate principal balance of the mortgage loans as of the Cut-off Date, certain specified persons will have the option to purchase all of the remaining mortgage loans (and the trust’s interest in all property acquired through exercise of remedies in respect of any mortgage loan) at the price specified in the Free Writing Prospectus. Exercise of the option will terminate the trust and retire the then-outstanding certificates. | |
| If the aggregate Certificate Principal Balances of each of the Class A-1, A-2, A-3, A-4, A-5, A-SB, PEX and D Certificates and the Class A-S, B and C regular interests have been reduced to zero, the trust may also be terminated in connection with an exchange of all the then-outstanding certificates, for the mortgage loans and REO properties then remaining in the issuing entity, but all of the holders of those Classes of outstanding certificates would have to voluntarily participate in the exchange. | ||
| Liquidation Loan Waterfall: | Following the liquidation of any loan or property, the net liquidation proceeds generally will be applied (after reimbursement of advances and certain trust fund expenses), first, as a recovery of accrued interest, other than delinquent interest that was not advanced as a result of Appraisal Reduction Amounts, second, as a recovery of principal until all principal has been recovered, and then as a recovery of delinquent interest that was not advanced as a result of Appraisal Reduction Amounts. Please see “Description of the Offered Certificates—Distributions—Application of Mortgage Loan Collections” in the Free Writing Prospectus. | |
| Majority Subordinate Certificateholder and Subordinate Class Representative: | A subordinate class representative may be appointed by the “majority subordinate certificate-holder”, which will be the holder(s) of a majority of: (a) during a “subordinate control period”, the most subordinate class among the Class F and G Certificates that has a Certificate Principal Balance, as notionally reduced by any Appraisal Reduction Amounts allocable to that class, that is at least equal to 25% of its total initial principal balance and (b) during a “collective consultation period”, the most subordinate class among the Class F and G Certificates that has a total principal balance, without regard to Appraisal Reduction Amounts, that is at least equal to 25% of its initial Certificate Principal Balance. The majority subordinate certificateholder will have a continuing right to appoint, remove or replace the subordinate class representative in its sole discretion. This right may be exercised at any time and from time to time. See “Servicing of the Mortgage Loans and Administration of the Trust Fund—The Majority Subordinate Certificateholder and the Subordinate Class Representative” in the Free Writing Prospectus. | |
| Control and Consultation: | The rights of various parties to replace each Special Servicer and approve or consult with respect to major actions of each Special Servicer will vary according to defined periods. A “subordinate control period” will exist as long as the Class F Certificates have a Certificate Principal Balance, net of any Appraisal Reduction Amounts allocable to that class, that is not less than 25% of the initial principal balance of that class (unless a senior consultation period is deemed to occur generally or with respect to a particular mortgage loan, pursuant to clause (ii) of the definition of “senior consultation period”). In general, during a subordinate control period, (i) the subordinate class representative will be entitled to grant or withhold approval of asset status reports prepared, and material servicing actions proposed, by either Special Servicer, and (ii) the majority subordinate certificateholder, or the subordinate class representative on its behalf, will be entitled to terminate and replace each Special Servicer with or without cause, and appoint itself or another person as the applicable successor special servicer. It will be a condition to such appointment that DBRS, KBRA and Moody’s confirm that the appointment would not result in a qualification, downgrade or withdrawal of any of their then-current ratings of certificates. A “collective consultation period” will exist as long as the Class F Certificates have a Certificate Principal Balance that both (i) as notionally reduced by any Appraisal Reduction Amounts allocable to that class, is less than 25% of its initial principal balance and (ii) without regard to any Appraisal Reduction Amounts allocable to that class, is 25% or more of its initial Certificate Principal Balance (unless a senior consultation period is deemed to occur generally or with respect to a particular mortgage loan, pursuant to clause (ii) of the definition of “senior consultation period”). In general, during a collective consultation period, each Special Servicer will be required to consult with the Trust Advisor (in addition to the subordinate class representative, during a collective consultation period) in connection with asset status reports and material special servicing actions. A “senior consultation period” will exist as long as either (i) the Class F certificates have an aggregate principal balance, without regard to any Appraisal Reduction Amounts allocable to that class, that is less than 25% of its initial principal balance or (ii) during such time as the Class F certificates are the most subordinate class of control-eligible certificates that have a then outstanding principal balance, net of Appraisal Reduction Amounts, at least equal |
THE INFORMATION IN THIS STRUCTURAL AND COLLATERAL TERM SHEET IS NOT COMPLETE AND MAY BE AMENDED PRIOR TO THE TIME OF SALE. THIS TERM SHEET IS NOT AN OFFER TO SELL THESE SECURITIES AND IT IS NOT A SOLICITATION OF AN OFFER TO BUY THESE SECURITIES IN ANY JURISDICTION WHERE THE OFFER OR SALE IS NOT PERMITTED.
22
| WFRBS Commercial Mortgage Trust 2014-C20 | Certain Terms and Conditions |
| to 25% of its initial principal balance, the then-majority subordinate certificateholder has irrevocably waived its right to appoint a subordinate class representative and to exercise any of the rights of the majority subordinate certificateholder or cause the exercise of the rights of the subordinate class representative and such rights have not been reinstated to a successor majority subordinate certificateholder as set forth in the pooling and servicing agreement. In general, during a senior consultation period, each Special Servicer must seek to consult with the Trust Advisor in connection with asset status reports and material special servicing actions, and, in general, no subordinate class representative will be recognized or have any right to terminate either Special Servicer or approve, direct or consult with respect to servicing matters. With respect to the Woodbridge Center loan combination and the Brunswick Square loan combination, the rights of the subordinate class representative described above will be subject to the consultation rights of each holder of a related pari passu companion loan described under “Loan Combinations” below. | ||
| In general, loan combination control rights also include the right, in certain circumstances, to direct the replacement of the applicable special servicer for the related loan combination only. | ||
| Replacement of Special Servicer by General Vote of Certificateholders: | During any “collective consultation period” or “senior consultation period”, each Special Servicer may be terminated and replaced upon the affirmative direction of certificate owners holding not less than 75% of the appraisal-reduced voting rights of all certificates, following a proposal from certificate owners holding not less than 25% of the appraisal-reduced voting rights of all certificates. The certificateholders who initiate a vote on a termination and replacement of either Special Servicer without cause must cause DBRS, KBRA and Moody’s to confirm the then-current ratings of the certificates (or decline to review the matter) and cause the payment of the fees and expenses incurred in the replacement. | |
| Appraisal Remedy: | Solely for purposes of determining whether a “subordinate control period” is in effect, whenever either Special Servicer obtains an appraisal or updated appraisal under the pooling and servicing agreement, the subordinate class representative, with respect to the mortgage loans serviced by either Special Servicer will have the right (at its or their expense) to direct such Special Servicer to hire a qualified appraiser to prepare a second appraisal of the mortgaged property. The applicable Special Servicer must thereafter determine whether, based on its assessment of such second appraisal, any recalculation of the Appraisal Reduction Amount is warranted. The Appraisal Reduction Amount, whether based on the first or the second appraisal, will become effective following the second appraisal, except that the Appraisal Reduction Amount based on the first appraisal shall become effective if the subordinate class representative declines to demand a second appraisal within a specified number of business days, or if a second appraisal is not received within 90 days after the direction of the subordinate class representative. In addition, for the same purposes, if there is a material change in the mortgaged property securing any mortgage loan for which an Appraisal Reduction Amount has been calculated, the majority certificateholder of the Class F or G Certificates or other designed certificateholders will be entitled (at its expense) to present an additional appraisal to such Special Servicer, which will generally be required to recalculate the Appraisal Reduction Amount based upon such additional appraisal. This latter right may not be exercised more frequently than once in any 12-month period for each mortgage loan for which an Appraisal Reduction Amount was calculated and can only be exercised during a subordinate control period or a collective consultation period as further described in the Free Writing Prospectus. | |
| Sale of Defaulted Assets: | There will be no “fair value” purchase option. Instead, the pooling and servicing agreement will authorize each Special Servicer to sell defaulted mortgage loans serviced by such Special Servicer to the highest bidder in a manner generally similar to sales of REO properties. Subject to certain limitations set forth in the related intercreditor agreement, neither the Woodbridge Center mortgaged loan nor the Brunswick Square mortgage loan may be sold unless that mortgage loan and the related pari passu companion loan(s) are sold together as one whole loan. The sale of a defaulted loan for less than par plus accrued interest and certain other fees and expenses owed on the loan will be subject to consent or consultation rights of the subordinate class representative and/or Trust Advisor and, in the case of the Woodbridge Center mortgage loan and the Brunswick Square mortgage loan, consultation rights of the holder of the related pari passu companion loan, as described in the Free Writing Prospectus. | |
| “As-Is” Appraisals: | Appraisals must be conducted on an “as-is” basis, and must be no more than 9 months old, for purposes of determining Appraisal Reduction Amounts, market value in connection with REO sales, etc. Required appraisals may consist of updates of prior appraisals. Internal valuations by the applicable Special Servicer are permitted if the principal balance of a mortgage loan is less than $2,000,000. | |
| Trust Advisor: | The Trust Advisor will perform certain review duties that will generally include a limited annual review of and report regarding each Special Servicer to the Certificate Administrator. The review and report generally will be based on: (a) during a collective consultation period or senior |
THE INFORMATION IN THIS STRUCTURAL AND COLLATERAL TERM SHEET IS NOT COMPLETE AND MAY BE AMENDED PRIOR TO THE TIME OF SALE. THIS TERM SHEET IS NOT AN OFFER TO SELL THESE SECURITIES AND IT IS NOT A SOLICITATION OF AN OFFER TO BUY THESE SECURITIES IN ANY JURISDICTION WHERE THE OFFER OR SALE IS NOT PERMITTED.
23
| WFRBS Commercial Mortgage Trust 2014-C20 | Certain Terms and Conditions |
| consultation period, any asset status reports and additional information delivered to the Trust Advisor by either Special Servicer with respect to any mortgage loan serviced by such Special Servicer, and/or (b) during a senior consultation period, in addition to the applicable information described above, a meeting with each Special Servicer to conduct a limited review of such Special Servicer’s operational practices on a platform basis in light of the servicing standard. In addition, during any collective consultation period or senior consultation period, each Special Servicer must seek to consult with the Trust Advisor (in addition to the subordinate class representative during a collective consultation period) in connection with material special servicing actions with respect to specially serviced mortgage loans serviced by such Special Servicer. Furthermore, under certain circumstances, but only during a senior consultation period, the Trust Advisor may recommend the replacement of either Special Servicer, in which case the Certificate Administrator will deliver notice of such recommendation to the certificateholders, and certificateholders with specified percentages of the voting rights may direct the replacement of such Special Servicer at their expense. | ||
| The Trust Advisor may be removed and replaced without cause upon the affirmative direction of certificates owners holding not less than 75% of the appraisal-reduced voting rights of all certificates, following a proposal from certificate owners holding not less than 25% of the appraisal-reduced voting rights of all certificates. The certificateholders who initiate a vote on a termination and replacement of the Trust Advisor without cause must cause DBRS, KBRA and Moody’s to confirm the then-current ratings of the certificates (or decline to review the matter) and cause the payment of the fees and expenses incurred in the replacement. During any “subordinate control period”, the proposed replacement trust advisor will be subject to the subordinate class representative’s consent (such consent not to be unreasonably withheld). If a proposed termination and replacement of the Trust Advisor is not consummated within 180 days following the initial request of the certificateholders who requested a vote, the proposed termination and replacement shall have no further force or effect. The Trust Advisor generally may be discharged from its duties if and when the Class A-1, A-2, A-3, A-4, A-5, A-SB, A-S, B, C, PEX, D and E Certificates are retired. | ||
| Certain Fee Offsets: | If a workout fee is earned by either Special Servicer following a loan default with respect to any mortgage loan that it services, then certain limitations will apply to the collection and retention of a modification fee from the borrower. The modification fee generally must not exceed 1% of the principal balance of the loan as modified. In addition, if the loan re-defaults within a specified period of months and other conditions are satisfied, any subsequent workout or liquidation fee on that loan must be reduced by a portion of the previously-collected modification fee. Furthermore, workout fees, liquidation fees and modification fees collected with respect to any workout, liquidation and/or partial liquidation of a mortgage loan or loan combination that is serviced by a Special Servicer will be subject to an aggregate cap equal to the greater of (i) $1,000,000 and (ii) 1.00% of the stated principal balance of the subject mortgage loan or loan combination. | |
| Deal Website: | The Certificate Administrator will be required to maintain a deal website which will include, among other items: (a) summaries of asset status reports prepared by each Special Servicer, (b) inspection reports, (c) appraisals, (d) various “special notices” described in the Free Writing Prospectus, (e) the “Investor Q&A Forum” and (f) a voluntary “Investor Registry”. Investors may access the deal website following execution of a certification and confidentiality agreement. | |
| Initial Majority Subordinate Certificateholder: | It is expected that Rialto CMBS II, LLC or another affiliate of Rialto Capital Advisors, LLC will be the initial majority subordinate certificateholder. | |
| Loan Combinations: | Each of the mortgaged properties identified on Annex A-1 to the Free Writing Prospectus as Woodbridge Center and Brunswick Square secure both a mortgage loan to be included in the trust fund and one or more other mortgage loans that will not be included in the trust fund, which will be pari passu in right of payment with the trust mortgage loan. With respect to each group of mortgage loans, which we refer to as a “loan combination” both the Woodbridge Center loan combination and the Brunswick Square mortgage loan will be principally serviced under the pooling and servicing agreement. | |
| As of the closing date, the pari passu companion loans in such loan combinations will be held by the parties identified above under “IV. Characteristics of the Mortgage Pool—B. Summary of Pari Passu Split Loan Structures”. |
THE INFORMATION IN THIS STRUCTURAL AND COLLATERAL TERM SHEET IS NOT COMPLETE AND MAY BE AMENDED PRIOR TO THE TIME OF SALE. THIS TERM SHEET IS NOT AN OFFER TO SELL THESE SECURITIES AND IT IS NOT A SOLICITATION OF AN OFFER TO BUY THESE SECURITIES IN ANY JURISDICTION WHERE THE OFFER OR SALE IS NOT PERMITTED.
24
(THIS PAGE INTENTIONALLY LEFT BLANK)
25
(THIS PAGE INTENTIONALLY LEFT BLANK)
26
| WOODBRIDGE CENTER |
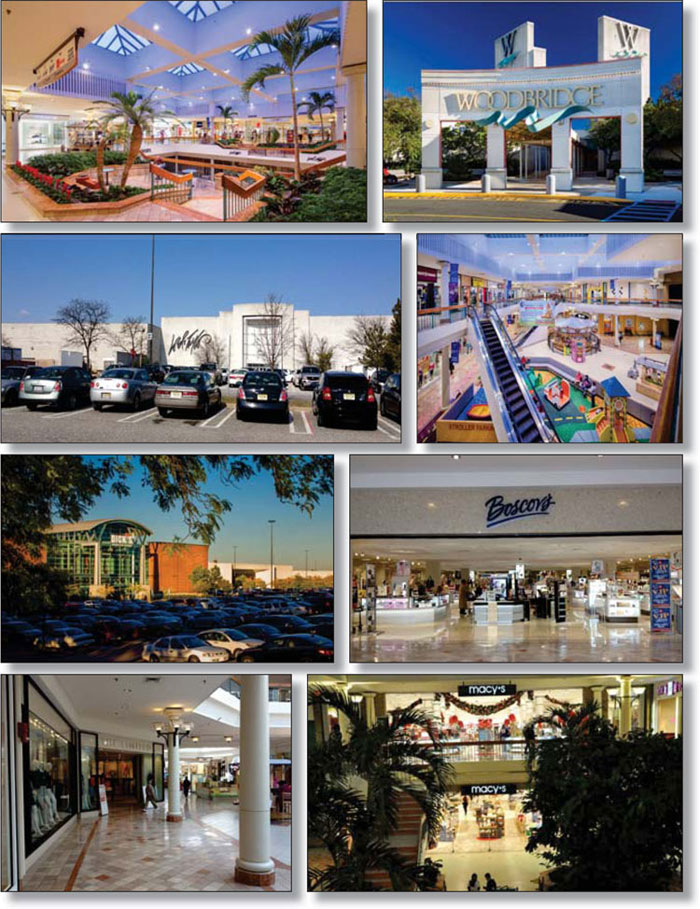
THE INFORMATION IN THIS STRUCTURAL AND COLLATERAL TERM SHEET IS NOT COMPLETE AND MAY BE AMENDED PRIOR TO THE TIME OF SALE. THIS TERM SHEET IS NOT AN OFFER TO SELL THESE SECURITIES AND IT IS NOT A SOLICITATION OF AN OFFER TO BUY THESE SECURITIES IN ANY JURISDICTION WHERE THE OFFER OR SALE IS NOT PERMITTED.
27
| WOODBRIDGE CENTER |
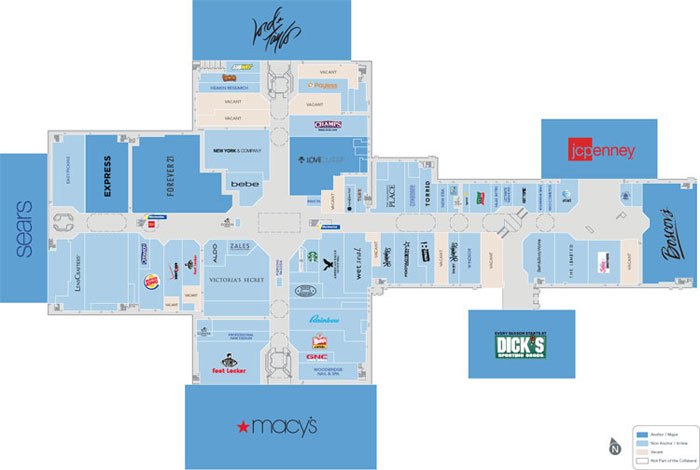
THE INFORMATION IN THIS STRUCTURAL AND COLLATERAL TERM SHEET IS NOT COMPLETE AND MAY BE AMENDED PRIOR TO THE TIME OF SALE. THIS TERM SHEET IS NOT AN OFFER TO SELL THESE SECURITIES AND IT IS NOT A SOLICITATION OF AN OFFER TO BUY THESE SECURITIES IN ANY JURISDICTION WHERE THE OFFER OR SALE IS NOT PERMITTED.
28
| WOODBRIDGE CENTER |
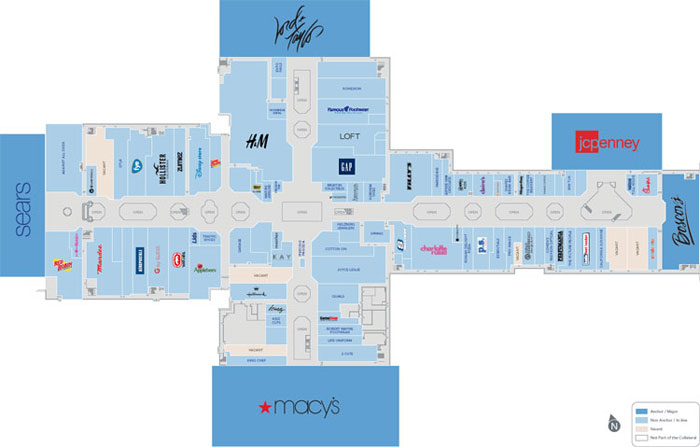
THE INFORMATION IN THIS STRUCTURAL AND COLLATERAL TERM SHEET IS NOT COMPLETE AND MAY BE AMENDED PRIOR TO THE TIME OF SALE. THIS TERM SHEET IS NOT AN OFFER TO SELL THESE SECURITIES AND IT IS NOT A SOLICITATION OF AN OFFER TO BUY THESE SECURITIES IN ANY JURISDICTION WHERE THE OFFER OR SALE IS NOT PERMITTED.
29
| WOODBRIDGE CENTER |
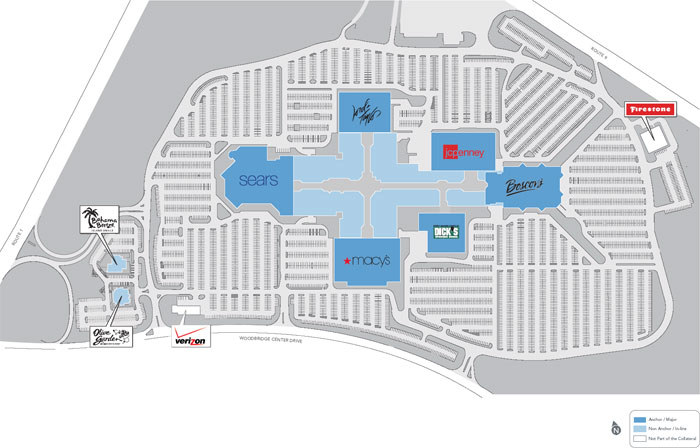
THE INFORMATION IN THIS STRUCTURAL AND COLLATERAL TERM SHEET IS NOT COMPLETE AND MAY BE AMENDED PRIOR TO THE TIME OF SALE. THIS TERM SHEET IS NOT AN OFFER TO SELL THESE SECURITIES AND IT IS NOT A SOLICITATION OF AN OFFER TO BUY THESE SECURITIES IN ANY JURISDICTION WHERE THE OFFER OR SALE IS NOT PERMITTED.
30
| WOODBRIDGE CENTER |
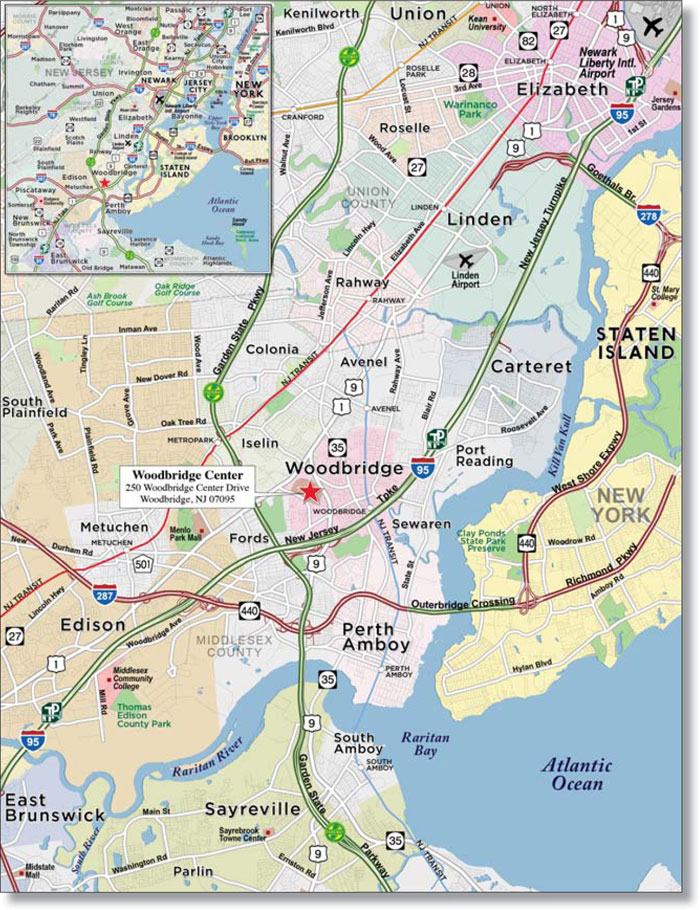
THE INFORMATION IN THIS STRUCTURAL AND COLLATERAL TERM SHEET IS NOT COMPLETE AND MAY BE AMENDED PRIOR TO THE TIME OF SALE. THIS TERM SHEET IS NOT AN OFFER TO SELL THESE SECURITIES AND IT IS NOT A SOLICITATION OF AN OFFER TO BUY THESE SECURITIES IN ANY JURISDICTION WHERE THE OFFER OR SALE IS NOT PERMITTED.
31
| No. 1 – Woodbridge Center | |||||||
| Loan Information | Property Information | ||||||
| Mortgage Loan Seller: | The Royal Bank of Scotland | Single Asset/Portfolio: | Single Asset | ||||
Credit Assessment (DBRS/KBRA/Moody’s): | NR/NR/NR | Property Type: | Retail | ||||
Original Principal Balance(1): | $130,000,000 | Specific Property Type: | Regional Mall | ||||
Cut-off Date Principal Balance(1): | $130,000,000 | Location: | Woodbridge, NJ | ||||
| % of Initial Pool Balance: | 10.4% | Size: | 1,105,409 SF | ||||
| Loan Purpose: | Refinance | Cut-off Date Principal Balance Per SF(1): | $226 | ||||
| Borrower Name: | Woodbridge Center Property LLC | Year Built/Renovated: | 1971/2011 | ||||
| Sponsor: | GGP Real Estate Holding I, Inc. | Title Vesting: | Fee | ||||
| Mortgage Rate: | 4.796% | Property Manager: | Self-managed | ||||
| Note Date: | March 3, 2014 | 3rd Most Recent Occupancy (As of)(4)(5): | 81.6% (12/31/2010) | ||||
| Anticipated Repayment Date: | NAP | 2nd Most Recent Occupancy (As of)(4)(5): | 82.0% (12/31/2011) | ||||
| Maturity Date: | April 1, 2024 | Most Recent Occupancy (As of)(4)(5): | 81.6% (12/31/2012) | ||||
| IO Period: | 36 months | Current Occupancy (As of)(4)(5): | 97.1% (12/31/2013) | ||||
| Loan Term (Original): | 120 months | ||||||
| Seasoning: | 1 month | Underwriting and Financial Information: | |||||
| Amortization Term (Original): | 360 months | ||||||
| Loan Amortization Type: | Interest-only, Amortizing Balloon | 3rd Most Recent NOI (As of): | $24,213,756 (12/31/2011) | ||||
| Interest Accrual Method: | Actual/360 | 2nd Most Recent NOI (As of): | $22,795,131 (12/31/2012) | ||||
| Call Protection: | L(25),D(91),O(4) | Most Recent NOI (As of): | $25,678,456 (12/31/2013) | ||||
| Lockbox Type: | Hard/Springing Cash Management | ||||||
Additional Debt(1)(2): | Yes | U/W Revenues: | $40,755,370 | ||||
Additional Debt Type(1)(2): | Pari Passu and Future Mezzanine | U/W Expenses: | $17,427,834 | ||||
| U/W NOI: | $23,327,536 | ||||||
| U/W NCF: | $22,410,585 | ||||||
U/W NOI DSCR(1): | 1.48x | ||||||
Escrows and Reserves(3): | U/W NCF DSCR(1): | 1.42x | |||||
U/W NOI Debt Yield(1): | 9.3% | ||||||
| Type: | Initial | Monthly | Cap (If Any) | U/W NCF Debt Yield(1): | 9.0% | ||
| Taxes | $0 | Springing | NAP | As-Is Appraised Value: | $366,000,000 | ||
| Insurance | $0 | Springing | NAP | As-Is Appraisal Valuation Date: | January 31, 2014 | ||
| Replacement Reserves | $0 | Springing | $276,352 | Cut-off Date LTV Ratio(1): | 68.3% | ||
| TI/LC Reserve | $0 | Springing | $649,670 | LTV Ratio at Maturity or ARD(1): | 60.2% | ||
| (1) | The Woodbridge Center Loan Combination, totaling $250,000,000, is comprised of three pari passu notes (Notes A-1, A-2, and A-3). The controlling Note A-1 had an original principal balance of $130,000,000, has an outstanding principal balance of $130,000,000 as of the Cut-off Date and will be contributed to the WFRBS 2014-C20 Trust. The non-controlling Notes A-2 and A-3 each had an original principal balance of $60,000,000, each have an outstanding principal balance as of the Cut-off Date of $60,000,000 and are expected to be contributed to future trusts. All statistical financial information related to balances per square foot, loan-to-value ratios, debt service coverage ratios and debt yields are based on the Woodbridge Center Loan Combination. |
| (2) | See “Subordinate and Mezzanine Indebtedness” section. |
| (3) | See “Escrows” section. |
| (4) | Historical and current occupancy includes temporary and seasonal tenants. In-line occupancy inclusive of temporary tenants has ranged from 91.9% to 96.1% over the last four years. |
| (5) | Former anchor tenant Fortunoff’s declared bankruptcy and vacated the property in 2009. Boscov’s executed a lease in August 2013 for a term through 2029. |
The Mortgage Loan. The mortgage loan (the “Woodbridge Center Loan Combination”) is evidenced by three pari passu notes (Notes A-1, A-2, and A-3) secured by a first mortgage encumbering a regional mall located in Woodbridge, New Jersey (the “Woodbridge Center Property”). The Woodbridge Center Loan Combination was originated on March 3, 2014 by The Royal Bank of Scotland. The Woodbridge Center Loan Combination had an original principal balance of $250,000,000, has an outstanding principal balance as of the Cut-off Date of $250,000,000 and accrues interest at an interest rate of 4.796% per annum. The Woodbridge Center Loan Combination had an initial term of 120 months, has a remaining term of 119 months as of the Cut-off Date, and requires interest-only payments for the first 36 payments following origination and, thereafter, requires payments of principal and interest based on a 30-year amortization schedule. The Woodbridge Center Loan Combination matures on April 1, 2024.
Note A-1, which represents the controlling interest in the Woodbridge Center Loan Combination and will be contributed to the WFRBS 2014-C20 Trust, had an original principal balance of $130,000,000 and has an outstanding principal balance as of the Cut-off Date of $130,000,000. Each of Note A-2 and Note A-3 (the “Woodbridge Center Companion Loans”) had an original principal balance of $60,000,000, are expected to be contributed to future trusts, and each represents a non-controlling interest in the Woodbridge Center Loan Combination. The lender provides no assurances that Note A-2 or Note A-3 will not be split further. See “Description of the
THE INFORMATION IN THIS STRUCTURAL AND COLLATERAL TERM SHEET IS NOT COMPLETE AND MAY BE AMENDED PRIOR TO THE TIME OF SALE. THIS TERM SHEET IS NOT AN OFFER TO SELL THESE SECURITIES AND IT IS NOT A SOLICITATION OF AN OFFER TO BUY THESE SECURITIES IN ANY JURISDICTION WHERE THE OFFER OR SALE IS NOT PERMITTED.
32
| WOODBRIDGE CENTER |
Mortgage Pool - Split Loan Structures - The Woodbridge Center Loan Combination” and “The Pooling and Servicing Agreement” in the Free Writing Prospectus.
Following the lockout period, the borrower has the right to defease the Woodbridge Center Loan Combination in whole, but not in part, on any due date before January 1, 2024. In addition, the Woodbridge Center Loan Combination is prepayable without penalty on or after January 1, 2024.
Sources and Uses
| Sources | Uses | ||||||||
| Original loan combination amount | $250,000,000 | 100.0% | Loan payoff | $183,807,658 | 73.5 | % | |||
| Closing costs | 1,783,845 | 0.7 | |||||||
| Return of equity | 64,408,497 | 25.8 | |||||||
| Total Sources | $250,000,000 | 100.0% | Total Uses | $250,000,000 | 100.0 | % | |||
The Property. The Woodbridge Center Property is a two-story regional mall located along Woodbridge Center Drive, east of US Route 1 in Woodbridge, New Jersey. Woodbridge is approximately 28 miles southwest of New York City. The Woodbridge Center Property contains 1,666,344 square feet of retail space, of which 1,105,409 square feet serve as collateral for the Woodbridge Center Loan Combination, and is situated on a 125.7-acre parcel of land, of which 83.4-acres serve as collateral. The Woodbridge Center Property is anchored by Macy’s, JC Penney, Lord & Taylor, Boscov’s, Dick’s Sporting Goods and Sears, (Macy’s, JC Penney and Lord & Taylor are not part of the collateral). Sears and Boscov’s are national retail department stores. The Woodbridge Center Property contains 8,140 parking spaces, resulting in a parking ratio of 4.9 spaces per 1,000 square feet of rentable area. The Woodbridge Center Property was constructed in 1971 and renovated in 2011 to add dining options Olive Garden, Bahama Breeze, and Red Robin. As of December 2013, tenants occupying 10,000 square feet or less had trailing 12-month in-line sales of $340 per square foot with an average occupancy cost of 19.4%. As of December 31, 2013, the Woodbridge Center Property was 97.1% occupied (including temporary tenants) by 157 tenants.
THE INFORMATION IN THIS STRUCTURAL AND COLLATERAL TERM SHEET IS NOT COMPLETE AND MAY BE AMENDED PRIOR TO THE TIME OF SALE. THIS TERM SHEET IS NOT AN OFFER TO SELL THESE SECURITIES AND IT IS NOT A SOLICITATION OF AN OFFER TO BUY THESE SECURITIES IN ANY JURISDICTION WHERE THE OFFER OR SALE IS NOT PERMITTED.
33
| WOODBRIDGE CENTER |
The following table presents certain information relating to tenancy at the Woodbridge Center Property:
Major Tenants
| Tenant Name | Credit Rating (Fitch/Moody’s /S&P)(1) | Tenant NRSF | % of NRSF | Annual U/W Base Rent PSF(2) | Annual U/W Base Rent(2) | % of Total Annual U/W Base Rent | Sales PSF(3) | Occupancy Cost(3)(4) | Lease Expiration Date | |||
| Anchor Tenants - Not Part of Collateral | ||||||||||||
| Macy’s | BBB/Baa2/BBB+ | 267,341 | ANCHOR OWNED - NOT PART OF THE COLLATERAL | |||||||||
| JC Penney | NR/Caa1/CCC+ | 173,594 | ANCHOR OWNED - NOT PART OF THE COLLATERAL | |||||||||
| Lord & Taylor | NR/NR/NR | 120,000 | ANCHOR OWNED - NOT PART OF THE COLLATERAL | |||||||||
| Anchor Tenants - Collateral | ||||||||||||
| Boscov’s | NR/NR/NR | 181,639 | 16.4% | $4.95 | $900,000 | 4.5% | (5) | (5) | 1/31/2029(6) | |||
| Dick’s Sporting Goods | NR/NR/NR | 100,000 | 9.0% | $5.50 | $550,000 | 2.8% | $138 | 8.2% | 1/31/2024 | |||
| Sears | B-/Caa1/CCC+ | 274,100 | 24.8% | $0.60 | $165,184 | 0.8% | $120 | 5.2% | 8/5/2016(7) | |||
| Total Anchor Tenants - Collateral | 555,739 | 50.3% | $2.91 | $1,615,184 | 8.1% | |||||||
| Other Major Tenants - Collateral | ||||||||||||
| Forever 21 | NR/NR/NR | 21,687 | 2.0% | $44.99 | $975,797 | 4.9% | $240 | 18.7% | 8/31/2021 | |||
| Express Fashion Operations | NR/NR/NR | 11,410 | 1.0% | $58.86 | $671,593 | 3.4% | $390 | 17.0% | 1/31/2021 | |||
| Victoria’s Secret | NR/NR/NR | 10,000 | 0.9% | $41.00 | $410,000 | 2.1% | $697 | 11.3% | 1/31/2018 | |||
| Love Culture | NR/NR/NR | 12,119 | 1.1% | $11.34 | $137,396 | 0.7% | $138 | 17.0% | 11/30/2021 | |||
| Total Other Major Tenants - Collateral | 45,216 | 4.1% | $39.47 | $1,784,786 | 8.9% | |||||||
Non-Major Retail Tenants - Collateral(8) | 462,394 | 41.8% | $45.83 | $16,176,574 | 81.4% | |||||||
Total Occupied Collateral(8) | 1,073,349 | 97.1% | $20.73 | $19,986,543 | 100.0% | |||||||
| Total Vacant Space | 32,060 | 2.9% | ||||||||||
| Collateral Total | 1,105,409 | 100.0% | ||||||||||
| (1) | Certain ratings are those of the parent company whether or not the parent guarantees the lease. |
| (2) | Annual U/W Base Rent PSF and Annual U/W Base Rent include contractual rent steps through March 2015. |
| (3) | Sales and occupancy costs are for the trailing 12-month period ending December 31, 2013. |
| (4) | Occupancy costs include base rent, reimbursements and percentage rent, as applicable. |
| (5) | Boscov’s has not officially reported sales but they are estimated at approximately $35.0 million ($193 per square foot) for its first 12 months of operations. |
| (6) | Boscov’s has three, 5-year lease renewal options. |
| (7) | Sears has five, 10-year lease renewal options and is currently in its first renewal period. |
| (8) | Includes 58,200 square feet attributed to temporary tenants that were not included in the Annual U/W Base Rent, along with 51,218 square feet attributed to tenants paying a percentage of sales in lieu of base rent, for a total of 109,418 square feet. The Annual U/W Base Rent PSF for Non-Major Retail Tenants - Collateral and Total Occupied Collateral exclude the square footage attributed to these tenants. |
THE INFORMATION IN THIS STRUCTURAL AND COLLATERAL TERM SHEET IS NOT COMPLETE AND MAY BE AMENDED PRIOR TO THE TIME OF SALE. THIS TERM SHEET IS NOT AN OFFER TO SELL THESE SECURITIES AND IT IS NOT A SOLICITATION OF AN OFFER TO BUY THESE SECURITIES IN ANY JURISDICTION WHERE THE OFFER OR SALE IS NOT PERMITTED.
34
| WOODBRIDGE CENTER |
The following table presents certain information relating to the historical sales and occupancy costs at the Woodbridge Center Property:
Historical Sales (PSF) and Occupancy Costs(1)
| Tenant Name | 2010 | 2011 | 2012 | 2013 |
| Sears | NAP | $135 | $128 | $120 |
| Boscov’s | NAP | NAP | NAP | (3) |
| Dick’s Sporting Goods | $131 | $138 | $138 | $138 |
| H&M | $220 | $220 | $210 | $208 |
Forever 21(2) | $526 | $370 | $266 | $233 |
| Love Culture | NAP | NAP | $217 | $120 |
| Express Fashion Operations | $394 | $376 | $396 | $399 |
| Victoria’s Secret | $593 | $651 | $667 | $697 |
| Total In-line (<10,000 square feet) | $328 | $336 | $332 | $340 |
| Occupancy Costs | 19.4% | 19.3% | 19.2% | 19.4% |
| (1) | Historical Sales (PSF) and Occupancy Costs were provided by the borrower. |
| (2) | Forever 21 increased their store size from 9,742 square feet to 21,687 square feet in August 2011. |
| (3) | Boscov’s has not officially reported sales (they have only been open since August 2013) but they are estimated at approximately $35.0 million ($193 per square foot) for its first 12 months of operations. |
The following table presents certain information relating to the lease rollover schedule at the Woodbridge Center Property:
Lease Expiration Schedule(1)(2)
Year Ending December 31, | No. of Leases Expiring | Expiring NRSF | % of Total NRSF | Cumulative of Total NRSF | Cumulative % of Total NRSF | Annual U/W Base Rent | % of Annual U/W Base Rent | Annual U/W Base Rent PSF(3) | |||||||||
MTM(4) | 25 | 85,523 | 7.7% | 85,523 | 7.7% | $207,898 | 1.0% | $41.48 | |||||||||
| 2014 | 6 | 16,078 | 1.5% | 101,601 | 9.2% | $635,825 | 3.2% | $39.55 | |||||||||
| 2015 | 14 | 36,320 | 3.3% | 137,921 | 12.5% | $1,371,670 | 6.9% | $37.77 | |||||||||
| 2016 | 22 | 328,967 | 29.8% | 466,888 | 42.2% | $2,844,634 | 14.2% | $8.65 | |||||||||
| 2017 | 20 | 58,146 | 5.3% | 525,034 | 47.5% | $2,812,402 | 14.1% | $48.37 | |||||||||
| 2018 | 18 | 66,330 | 6.0% | 591,364 | 53.5% | $2,458,029 | 12.3% | $37.06 | |||||||||
| 2019 | 9 | 19,531 | 1.8% | 610,895 | 55.3% | $858,340 | 4.3% | $43.95 | |||||||||
| 2020 | 5 | 19,460 | 1.8% | 630,355 | 57.0% | $558,612 | 2.8% | $28.71 | |||||||||
| 2021 | 10 | 81,021 | 7.3% | 711,376 | 64.4% | $2,860,585 | 14.3% | $35.31 | |||||||||
| 2022 | 12 | 34,521 | 3.1% | 745,897 | 67.5% | $1,755,135 | 8.8% | $50.84 | |||||||||
| 2023 | 9 | 27,722 | 2.5% | 773,619 | 70.0% | $1,308,101 | 6.5% | $47.19 | |||||||||
| 2024 | 6 | 118,091 | 10.7% | 891,710 | 80.7% | $1,415,313 | 7.1% | $11.98 | |||||||||
| Thereafter | 1 | 181,639 | 16.4% | 1,073,349 | 97.1% | $900,000 | 4.5% | $4.95 | |||||||||
Vacant(5) | 0 | 32,060 | 2.9% | 1,105,409 | 100.0% | $0 | 0.0% | $0.00 | |||||||||
| Total / Weighted Average | 157 | 1,105,409 | 100.0% | $19,986,543 | 100.0% | $20.73 |
| (1) | Information obtained from the underwritten rent roll. |
| (2) | Certain tenants may have lease termination options that are exercisable prior to the originally stated expiration date of the subject lease and that are not considered in the Lease Expiration Schedule. |
| (3) | The annual and Total/Weighted Average Annual U/W Base Rent PSF excludes vacant space, square feet attributed to tenants paying percentage rent in lieu of base rent and square footage attributed to temporary tenants. These rents were included in the underwritten percentage rent and other income. |
| (4) | Includes 23 temporary tenants. The rent for temporary tenants has been included in the underwritten other income. |
| (5) | Occupancy includes temporary and seasonal tenants. |
The following table presents historical occupancy percentages at the Woodbridge Center Property:
Historical Occupancy(1)(2)(3)
12/31/2009 | 12/31/2010 | 12/31/2011 | 12/31/2012 | 12/31/2013 | ||||
| 95.0% | 81.6% | 82.0% | 81.6% | 97.1% |
(1) | Occupancy includes temporary and seasonal tenants. In-line occupancy inclusive of temporary tenants has ranged from 91.9% to 96.1% since 2010. |
| (2) | Information obtained from the borrower. |
| (3) | Former anchor tenant Fortunoff’s declared bankruptcy and vacated the property in 2009. Boscov’s executed a lease in August 2013 for a term through 2029. Boscov’s estimated sales for its first twelve months of operations are approximately $35.0 million ($193 per square foot). |
THE INFORMATION IN THIS STRUCTURAL AND COLLATERAL TERM SHEET IS NOT COMPLETE AND MAY BE AMENDED PRIOR TO THE TIME OF SALE. THIS TERM SHEET IS NOT AN OFFER TO SELL THESE SECURITIES AND IT IS NOT A SOLICITATION OF AN OFFER TO BUY THESE SECURITIES IN ANY JURISDICTION WHERE THE OFFER OR SALE IS NOT PERMITTED.
35
| WOODBRIDGE CENTER |
The following table presents historical base rent per square foot at the Woodbridge Center Property:
Historical Average Base Rent (PSF)(1)
12/31/2009 | 12/31/2010 | 12/31/2011 | 12/31/2012 | 12/31/2013 | ||||
| $17.82 | $17.05 | $17.81 | $17.91 | $18.35 |
(1) | Information obtained from the borrower’s operating statements. The average base rent is based on the reported base rent divided by the total square footage and does not take into account temporary tenants or tenants paying percentage rent in lieu of base rent. |
Operating History and Underwritten Net Cash Flow. The following table presents certain information relating to the historical operating performance and the Underwritten Net Cash Flow at the Woodbridge Center Property:
Cash Flow Analysis
| 2011 | 2012 | 2013 | U/W | U/W $ per SF | |||||||
| Base Rent | $19,692,647 | $19,792,548 | $20,278,792 | $19,986,543 | $18.08 | ||||||
| Grossed Up Vacant Space | 0 | 0 | 0 | 6,047,928 | 5.47 | ||||||
| Percentage Rent | 383,502 | 537,056 | 655,824 | 1,226,449(1) | 1.11 | ||||||
| Total Reimbursables | 15,376,539 | 14,935,917 | 15,359,494 | 15,378,822 | 13.91 | ||||||
| Other Income | 4,998,847 | 4,219,528 | 5,174,957 | 4,163,555 | 3.77 | ||||||
| Less Vacancy & Credit Loss | (99,314) | (381,095) | 243,346 | (6,047,928)(2) | (5.47) | ||||||
| Effective Gross Income | $40,352,221 | $39,103,954 | $41,712,413 | $40,755,370 | $36.87 | ||||||
| Total Operating Expenses | $16,138,465 | $16,308,823 | $16,033,957 | $17,427,834 | $15.77 | ||||||
| Net Operating Income | $24,213,756 | $22,795,131 | $25,678,456 | $23,327,536 | $21.10 | ||||||
| TI/LC | 0 | 0 | 0 | 640,599 | 0.58 | ||||||
| Replacement Reserves | 0 | 0 | 0 | 276,352 | 0.25 | ||||||
| Net Cash Flow | $24,213,756 | $22,795,131 | $25,678,456 | $22,410,585 | $20.27 | ||||||
NOI DSCR(3) | 1.54x | 1.45x | 1.63x | 1.48x | |||||||
NCF DSCR(3) | 1.54x | 1.45x | 1.63x | 1.42x | |||||||
NOI DY(3) | 9.7% | 9.1% | 10.3% | 9.3% | |||||||
NCF DY(3) | 9.7% | 9.1% | 10.3% | 9.0% | |||||||
(1) | H&M has been a tenant since 2003 on a lease that expired in 2013. They switched to paying percentage rent while they negotiate a new lease with the borrower. |
| (2) | The underwritten economic vacancy is 13.4%. The Woodbridge Center Property was 97.1% physically occupied inclusive of seasonal and temporary tenants as of December 31, 2013. |
| (3) | DSCRs and debt yields are based on the Woodbridge Center Loan Combination. |
Appraisal. As of the appraisal valuation date of January 31, 2014, the Woodbridge Center Property had an “as-is” appraised value of $366,000,000.
Environmental Matters. According to a Phase I environmental site assessment dated February 5, 2014, there was no evidence of any recognized environmental conditions at the Woodbridge Center Property.
Market Overview and Competition. The Woodbridge Center Property is located along Woodbridge Center Drive, east of US Route 1. Woodbridge Center Drive leads to US Route 9, the Garden State Parkway and the New Jersey Turnpike. The Woodbridge Center Property is located in the southern portion of the Middlesex-Somerset-Hunterdon metropolitan statistical area, situated northeast of New Brunswick and Edison, New Jersey. According to the appraisal, the Woodbridge Center Property has a primary trade area that encompasses a seven-mile radius. The 2013 population within a seven-mile and 10-mile radius were reported at approximately 582,211 and 1,307,049, respectively, and average household income within a seven-mile and ten-mile radius were reported at approximately $98,250, and $93,023, respectively.
The appraiser estimated market rent for in-line tenants to be $37.83 per square foot on a triple net basis and concluded to an estimate of $4.50 per square foot for anchor tenants on a modified gross basis. Additionally, based on the historical occupancy of the Woodbridge Center Property, the current vacancy in the market, and perception of future market vacancy, the appraiser projected a stabilized vacancy rate of 2.0%.
THE INFORMATION IN THIS STRUCTURAL AND COLLATERAL TERM SHEET IS NOT COMPLETE AND MAY BE AMENDED PRIOR TO THE TIME OF SALE. THIS TERM SHEET IS NOT AN OFFER TO SELL THESE SECURITIES AND IT IS NOT A SOLICITATION OF AN OFFER TO BUY THESE SECURITIES IN ANY JURISDICTION WHERE THE OFFER OR SALE IS NOT PERMITTED.
36
| WOODBRIDGE CENTER |
The following table presents certain information relating to some comparable retail centers provided in the appraisal for the Woodbridge Center Property:
Competitive Set(1)
| Woodbridge Center (subject) | Menlo Park Mall | Brunswick Square | Staten Island Mall | The Outlet Collection Jersey Gardens | Bridgewater Commons | |||||||
| Market | Woodbridge, NJ | Edison, NJ | East Brunswick, NJ | Staten Island, NY | Elizabeth, NJ | Bridgewater, NJ | ||||||
| Distance from Subject | -- | 2 miles | 12 miles | 11 miles | 15 miles | 20 miles | ||||||
| Property Type | Regional Mall | Super Regional Mall | Regional Mall | Super Regional Mall | Super Regional Mall | Super Regional Mall | ||||||
| Year Built/Renovated | 1971/2011 | 1960/2003 | 1973/1999,2012 | 1973/1993 | 1999/NAP | 1988/NAP | ||||||
| Anchors | Macy’s, Sears, Boscov’s, Dick’s Sporting Goods, JC Penney, Lord & Taylor | Macy’s, Nordstrom | Macy’s, JC Penney | Macy’s, JC Penney, Sears, Macy’s Home | Burlington Coat, Cohoes, Lord & Taylor, Marshalls, Cinema, Saks Off 5th Avenue, VF Outlet, Neiman Marcus Last Call, Group USA, Bed, Bath & Beyond, Forever XXI | Bloomingdales, Lord & Taylor, Macy’s | ||||||
| Total GLA | 1,666,344 SF(2) | 1,323,156 SF | 760,311 SF | 1,275,627 SF | 1,301,776 SF | 962,188 SF | ||||||
| Total Occupancy | 98%(2) | 98% | 99% | 96% | 99% | 97% |
| (1) | Information obtained from the appraisal. |
| (2) | Total GLA and Total Occupancy are inclusive of non-collateral anchors. |
The Borrower. The borrower is Woodbridge Center Property LLC, a Delaware limited liability company and a single purpose entity with two independent directors. Legal counsel to the borrower delivered a non-consolidation opinion in connection with the origination of the Woodbridge Center Loan Combination. GGP Real Estate Holding I, Inc. is the guarantor of the nonrecourse carveouts under the Woodbridge Center Loan Combination.
The Sponsor. The sponsor, GGP Real Estate Holding I, Inc. is an affiliate of General Growth Properties, Inc. (NYSE: GGP) (“GGP”), a real estate investment trust headquartered in Chicago, Illinois. GGP has interests in 120 regional malls in the United States totaling approximately 125 million square feet. As of December 31, 2013, GGP’s portfolio was 96.4% leased and generated an average of $564 sales per square foot for all regional malls. See “Risk Factors—Risks Related to the Mortgage Loans—Prior Bankruptcies or Other Proceedings May Be Relevant to Future Performance” and “Description of the Mortgage Pool – Default History, Bankruptcy Issues and Other Proceedings” in the Free Writing Prospectus.
Escrows. No ongoing monthly escrows are required for real estate taxes, insurance, replacement or rollover reserves so long as no Cash Management Period (as defined below) has occurred and is continuing under the Woodbridge Center Loan Combination. In the event that a Cash Management Period has occurred, the borrower is required to make monthly deposits: (i) for the payment of real estate taxes in an amount equal to one-twelfth of the estimated annual taxes payable and for the payment of insurance in an amount equal to one-twelfth of the estimated annual insurance premiums payable; provided that so long as no event of default or Cash Management Period has occurred and is continuing, the borrower will not be required to make such deposits for so long as the borrower provides satisfactory evidence to the lender that the taxes have been paid prior to delinquency and the insurance policies are being maintained as part of a reasonably acceptable blanket insurance policy; (ii) for replacement reserves in an amount equal to $23,029 (subject to a cap of $276,352); and (iii) for tenant improvement and leasing commissions in an amount equal to $54,139 (subject to a cap of $649,670).
A “Cash Management Period” will commence upon the earlier to occur of (i) an event of default and (ii) the amortizing debt service coverage ratio falling below 1.15x as of the end of any calendar quarter. A Cash Management Period will end with respect to clause (i), when such event of default has been cured and with respect to clause (ii), when an amortizing debt service coverage ratio of at least 1.15x has been achieved for two consecutive calendar quarters.
Lockbox and Cash Management. The Woodbridge Center Loan Combination requires a lender controlled lockbox, which is already in place, and requires that the borrower direct tenants to deposit all rents directly into the lockbox account and that the borrower and the property manager deposit all rents received into the lockbox account within two business days of receipt. Prior to the occurrence of a Cash Management Period, all funds on deposit in the lockbox account will be swept into the borrower’s operating account on a daily basis. During a Cash Management Period, all funds on deposit in the lockbox account will be swept on a daily basis into a cash management account under control of the lender.
Property Management. The Woodbridge Center Property is self-managed by the borrower.
Assumption. The borrower has the right to transfer the Woodbridge Center Property in whole, but not in part, subject to customary conditions set forth in the loan documents, including but not limited to: (i) no event of default has occurred and is continuing; (ii) the proposed transferee, replacement property manager and management agreement are satisfactory to the lender and applicable rating agencies; and (iii) rating agency confirmation from each of DBRS, KBRA and Moody’s that the transfer will not result in a downgrade, withdrawal or qualification of the respective ratings assigned to the Series 2014-C20 Certificates (and similar confirmations with respect to the ratings of any securities backed by the Woodbridge Center Companion Loans) or the requirement for such rating agency confirmation has been waived by each of DBRS, KBRA and Moody’s.
THE INFORMATION IN THIS STRUCTURAL AND COLLATERAL TERM SHEET IS NOT COMPLETE AND MAY BE AMENDED PRIOR TO THE TIME OF SALE. THIS TERM SHEET IS NOT AN OFFER TO SELL THESE SECURITIES AND IT IS NOT A SOLICITATION OF AN OFFER TO BUY THESE SECURITIES IN ANY JURISDICTION WHERE THE OFFER OR SALE IS NOT PERMITTED.
37
| WOODBRIDGE CENTER |
Free Release. The borrower is permitted to obtain a release of either certain immaterial or non-income producing portions of the Woodbridge Center Property or Acquired Expansion Parcels (as defined below) from the lien of the mortgage upon the satisfaction of certain conditions, including but not limited to: (i) no event of default has occurred and is continuing; (ii) the borrower has certified to the lender that the release of the parcel will not materially and adversely affect the use, operations or economic value of the remaining improvements; and (iii) prepayment of the principal balance of the Woodbridge Center Loan Combination by a “qualified amount” in accordance with REMIC requirements.
An “Acquired Expansion Parcel” is a parcel of land that the borrower may acquire as additional collateral for the Woodbridge Center Loan Combination subject to customary conditions set forth in the loan documents including, but not limited to: (i) no event of default has occurred and is continuing; (ii) the borrower has delivered to the lender a copy of the deed or ground lease conveying the borrower’s ownership interest in the Acquired Expansion Parcel; (iii) the borrower must have paid all reasonable out-of-pocket costs and expenses incurred by the lender in connection with the acquisition of the expansion parcel; and (iv) the guarantor will deliver to the lender a reaffirmation of its obligations under the related guaranty agreement under the Woodbridge Center Loan Combination.
Real Estate Substitution. The borrower may obtain a release of one or more portions of the Woodbridge Center Property from the lien of the Woodbridge Center Loan Combination by simultaneously substituting another property for the released parcel, subject to certain conditions, including, but not limited to: (i) no event of default has occurred or is continuing; (ii) the substituted parcel is an Acquired Expansion Parcel or vacant, non-income producing and unimproved; (iii) delivery to the lender of evidence reasonably satisfactory to the lender which states the substitution does not diminish the value of the Woodbridge Center Property; and (iv) delivery to the lender of an acceptable Phase I report (as defined in the loan documents) and a property condition report (if the substitution parcel is improved).
Subordinate and Mezzanine Indebtedness. The borrower has the right to incur future mezzanine financing subject to the satisfaction of certain conditions, including: (i) execution of an intercreditor agreement in form and substance reasonably acceptable to the lender and each of DBRS, KBRA and Moody’s (and similar confirmations with respect to the ratings of any securities backed by the Woodbridge Center Companion Loans); (ii) the combined amortizing debt service coverage ratio will not be less than 1.47x; and (iii) the combined loan-to-value ratio will not be greater than 68.3%.
Additional Indebtedness. The loan documents permit certain sponsor affiliates to pledge their indirect ownership interests in the borrower to an institutional lender providing a corporate line of credit or corporate credit facility to such sponsor affiliates, subject to certain conditions, including that such sponsor affiliates pledging such indirect ownership interests under such corporate line of credit or corporate credit facility will be required to (i) have an aggregate net worth of at least $500,000,000 and (ii) pledge, grant a security interest in or otherwise encumber all or substantially all of their assets in connection with such corporate line of credit or corporate credit facility.
Ground Lease. None.
Terrorism Insurance. The loan documents require that the “all risk” insurance policy required to be maintained by the borrower provides coverage from terrorism in an amount equal to the full replacement cost of the Woodbridge Center Property or, if the Terrorism Risk Insurance Program Reauthorization Act is not in effect, the borrower will be required to obtain a stand-alone policy providing the same coverage for terrorism; provided that the borrower will not be required to pay annual premiums in excess of two times the then-current annual “all risk” insurance premiums. The loan documents also require business interruption insurance covering no less than the 18-month period following the occurrence of a casualty event, together with a six-month extended period of indemnity.
THE INFORMATION IN THIS STRUCTURAL AND COLLATERAL TERM SHEET IS NOT COMPLETE AND MAY BE AMENDED PRIOR TO THE TIME OF SALE. THIS TERM SHEET IS NOT AN OFFER TO SELL THESE SECURITIES AND IT IS NOT A SOLICITATION OF AN OFFER TO BUY THESE SECURITIES IN ANY JURISDICTION WHERE THE OFFER OR SALE IS NOT PERMITTED.
38
(THIS PAGE INTENTIONALLY LEFT BLANK)
39
| BLOOMBERG DATA CENTER |
The pictures below are artist’s renderings of the Bloomberg Data Center Property as it is generally proposed to be completed, and are not actual photographs or depictions of the current construction status of the related improvements. Furthermore, such renderings may differ in material respects from the final design or the final, as-built condition of the completed improvements. See “The Property” section below for further detail on the current construction status of the Bloomberg Data Center Property.

THE INFORMATION IN THIS STRUCTURAL AND COLLATERAL TERM SHEET IS NOT COMPLETE AND MAY BE AMENDED PRIOR TO THE TIME OF SALE. THIS TERM SHEET IS NOT AN OFFER TO SELL THESE SECURITIES AND IT IS NOT A SOLICITATION OF AN OFFER TO BUY THESE SECURITIES IN ANY JURISDICTION WHERE THE OFFER OR SALE IS NOT PERMITTED.
40
| BLOOMBERG DATA CENTER |
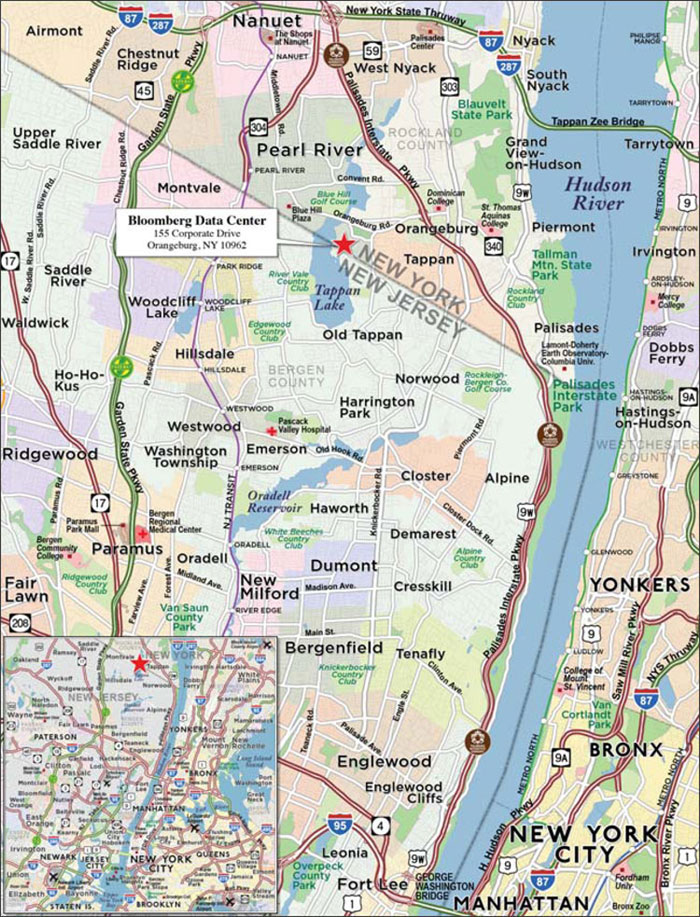
THE INFORMATION IN THIS STRUCTURAL AND COLLATERAL TERM SHEET IS NOT COMPLETE AND MAY BE AMENDED PRIOR TO THE TIME OF SALE. THIS TERM SHEET IS NOT AN OFFER TO SELL THESE SECURITIES AND IT IS NOT A SOLICITATION OF AN OFFER TO BUY THESE SECURITIES IN ANY JURISDICTION WHERE THE OFFER OR SALE IS NOT PERMITTED.
41
| No. 2 – Bloomberg Data Center | |||||||
| Loan Information | Property Information | ||||||
| Mortgage Loan Seller: | Wells Fargo Bank, National Association | Single Asset/Portfolio: | Single Asset | ||||
Credit Assessment (DBRS/KBRA/Moody’s): | NR/NR/NR | Property Type: | Other | ||||
| Original Principal Balance: | $88,000,000 | Specific Property Type: | Data Center | ||||
| Cut-off Date Principal Balance: | $87,847,310 | Location: | Orangeburg, NY | ||||
| % of Initial Pool Balance: | 7.0% | Size: | 131,805 SF | ||||
| Loan Purpose: | Refinance | Cut-off Date Principal Balance Per SF: | $666.49 | ||||
| Borrower Name: | 155 Corporate Drive, LLC | Year Built/Renovated: | 2014/NAP | ||||
| Sponsors: | Edward Russo; Joshua Rabina; Todd Aaron | Title Vesting: | Fee | ||||
| Mortgage Rate: | 4.780% | Property Manager: | Self-managed | ||||
| Note Date: | April 1, 2014 | 3rd Most Recent Occupancy(3): | NAP | ||||
| Anticipated Repayment Date: | NAP | 2nd Most Recent Occupancy(3): | NAP | ||||
| Maturity Date: | April 1, 2024 | Most Recent Occupancy(3): | NAP | ||||
| IO Period: | None | Current Occupancy (As of): | 100.0% (5/1/2014) | ||||
| Loan Term (Original): | 120 months | ||||||
| Seasoning: | 1 month | Underwriting and Financial Information: | |||||
| Amortization Term (Original): | 300 months | ||||||
| Loan Amortization Type: | Amortizing Balloon | 3rd Most Recent NOI(3): | NAP | ||||
| Interest Accrual Method: | Actual/360 | 2nd Most Recent NOI(3): | NAP | ||||
| Call Protection: | L(24),GRTR 1% or YM(92),O(4) | Most Recent NOI(3): | NAP | ||||
| Lockbox Type: | Hard/Upfront Cash Management | ||||||
| Additional Debt: | None | ||||||
| Additional Debt Type: | NAP | U/W Revenues: | $12,752,767 | ||||
| U/W Expenses: | $2,165,571 | ||||||
| U/W NOI: | $10,587,196 | ||||||
| U/W NCF: | $10,488,342 | ||||||
U/W NOI DSCR(4): | 1.75x | ||||||
Escrows and Reserves(1): | U/W NCF DSCR(4): | 1.74x | |||||
U/W NOI Debt Yield(4): | 12.1% | ||||||
Type: | Initial | Monthly | Cap (If Any) | U/W NCF Debt Yield(4): | 11.9% | ||
| Taxes | $0 | Springing | NAP | As-Stabilized Appraised Value(5): | $137,000,000 | ||
| Insurance | $0 | Springing | NAP | As-Stabilized Appraisal Valuation Date(5): | August 1, 2014 | ||
| Replacement Reserve | $0 | Springing | NAP | Cut-off Date LTV Ratio(5): | 64.1% | ||
Immediate Repair Reserve(2) | $8,562,127 | $0 | NAP | LTV Ratio at Maturity or ARD(5): | 47.6% | ||
| (1) | See “Escrows” section. |
| (2) | The upfront Immediate Repair Reserve is for remaining landlord work. See “Escrows” section for further detail on Bloomberg, LP’s $29,056,464 letter of credit posted as security for the remaining landlord work. |
| (3) | Historical occupancy and financial statements are not available, as the Bloomberg Data Center property was constructed in 2014. |
| (4) | Underwritten DSCRs and debt yields are based on the average rent over the Bloomberg Data Center Mortgage Loan term. See “Cash Flow Analysis” section. |
| (5) | The As-Is Appraised Value is $94,000,000 as of January 16, 2014, equating to a Cut-off Date LTV Ratio and LTV Ratio at Maturity of 93.5% and 69.4%, respectively. See “Appraisal” section. |
The Mortgage Loan. The mortgage loan (the “Bloomberg Data Center Mortgage Loan”) is evidenced by a single promissory note that is secured by a first mortgage encumbering a single-tenant data center located in Orangeburg, New York (the “Bloomberg Data Center Property”). The Bloomberg Data Center Mortgage Loan was originated on April 1, 2014 by Wells Fargo Bank, National Association. The Bloomberg Data Center Mortgage Loan had an original principal balance of $88,000,000, has an outstanding principal balance as of the Cut-off Date of $87,847,310 and accrues interest at an interest rate of 4.780% per annum. The Bloomberg Data Center Mortgage Loan had an initial term of 120 months, has a remaining term of 119 months as of the Cut-off Date and requires payments of principal and interest based on a 25-year amortization schedule. The Bloomberg Data Center Mortgage Loan matures on April 1, 2024.
Following the lockout period, the borrower has the right to prepay the Bloomberg Data Center Mortgage Loan in whole, but not in part, provided that the borrower pays the greater of a yield maintenance premium or a prepayment premium equal to 1.0% of the principal amount being prepaid, on any date prior to January 1, 2024. In addition, the Bloomberg Data Center Mortgage Loan is prepayable without penalty on or after January 1, 2024.
THE INFORMATION IN THIS STRUCTURAL AND COLLATERAL TERM SHEET IS NOT COMPLETE AND MAY BE AMENDED PRIOR TO THE TIME OF SALE. THIS TERM SHEET IS NOT AN OFFER TO SELL THESE SECURITIES AND IT IS NOT A SOLICITATION OF AN OFFER TO BUY THESE SECURITIES IN ANY JURISDICTION WHERE THE OFFER OR SALE IS NOT PERMITTED.
42
| BLOOMBERG DATA CENTER |
Sources and Uses
| Sources | Uses | ||||||||
| Original loan amount | $88,000,000 | 100.0% | Loan payoff | $48,075,965 | 54.6 | % | |||
| Reserves | 8,562,127 | 9.7 | |||||||
Bloomberg, LP letter of credit(1) | 21,751,227 | 24.7 | |||||||
| Closing costs | 659,512 | 0.7 | |||||||
| Return of equity | 8,951,169 | 10.2 | |||||||
| Total Sources | $88,000,000 | 100.0% | Total Uses | $88,000,000 | 100.0 | % | |||
| (1) | See “Escrows” section for further detail on the Bloomberg, LP letter of credit. |
The Property. The Bloomberg Data Center Property is a wholesale “turnkey” (move-in ready) data center containing approximately 131,805 square feet located in Orangeburg, New York. The Bloomberg Data Center Property was constructed in 2014 to Bloomberg, LP’s (“Bloomberg”) specifications. Bloomberg is expected to invest $700 million over the 15-year lease term, which expires in March 2029. The Bloomberg Data Center Property was constructed for a total cost of $123.2 million ($935 per square foot), with the borrower contributing $84.2 million and Bloomberg contributing $39.0 million, resulting in $35.2 million of cash equity ahead of the Bloomberg Data Center Mortgage Loan. The Bloomberg Data Center Property is located adjacent to the Rockland Utility substation (constructed in 2010) and the site is served by all utilities (electric, sewer, water, gas and telecom) with no requirements for off-site improvements or extensions to create additional capacity. Building systems feature ample chilled water capacity and an uninterruptable power supply, as well as backup generation capacity. There are two data center halls, totaling 39,058 square feet, featuring 42-inch raised flooring and 26-foot clear heights. The Bloomberg Data Center Property is considered to be equivalent to a Tier III+ data center (based on third-party data center research and consulting organization criteria), with Tier IV being the highest possible rating for reliability and redundancy. The Bloomberg Data Center Property contains 99 surface parking spaces, and can be expanded to accommodate 178 spaces, equating to a parking ratio of 1.4 spaces per 1,000 square feet of net rentable area.
Bloomberg is a private, multi-national mass media company that provides business data, news and analytics for business and financial professionals globally. The company is majority-owned by former New York City mayor Michael Bloomberg. Bloomberg employs more than 15,000 people in 192 locations worldwide, who support their approximately 315,000 professional service subscribers. Bloomberg’s absolute, triple net lease contains 2.5% annual rent increases through lease expiration. The lease has renewal options that can be exercised for a total of 20 years beyond the initial lease expiration date, in five or 10-year increments.
The Bloomberg Data Center Property is not yet complete and Bloomberg’s operations have not yet commenced. “Substantial Completion” (as defined below) occurred on March 1, 2014 and Bloomberg commenced rental payments April 1, 2014. Substantial Completion is defined as completion of the installation of all equipment, power distribution, lighting, water piping/valves, fire sprinklers, raised flooring, paint and all other improvements needed for Bloomberg to commence setup of information technology equipment. “Final Substantial Completion” is defined as completion of all improvements (other than warranty work or punchlist items) including final commissioning and obtaining temporary certificates of occupancy. Final Substantial Completion is required to and expected to occur on June 27, 2014. See “Escrows” section for further detail on the Bloomberg Data Center Mortgage Loan structure and reserves. As of May 1, 2014, the Bloomberg Data Center Property was 100.0% leased by Bloomberg.
The following table presents certain information relating to the tenant at the Bloomberg Data Center Property:
Major Tenant
| Tenant Name | Credit Rating (Fitch/ Moody’s/S&P) | Tenant NRSF | % of NRSF | Annual U/W Base Rent PSF | Annual U/W Base Rent | % of Total Annual U/W Base Rent | Lease Expiration Date | |||||
| Major Tenant | ||||||||||||
| Bloomberg, LP | NR/NR/NR | 131,805 | 100.0% | $80.32(1)(2) | $10,587,196(1)(2) | 100.0% | 3/31/2029(3) | |||||
| Total Major Tenant | 131,805 | 100.0% | $80.32 | $10,587,196 | 100.0% | |||||||
| Vacant Space | 0 | 0.0% | ||||||||||
| Collateral Total | 131,805 | 100.0% | ||||||||||
| (1) | Bloomberg’s in-place annual rent is $9,450,000 ($71.70 per square foot) and increases 2.5% annually. Annual U/W Base Rent PSF and Annual U/W Base Rent are based on the average rent over the Bloomberg Data Center Mortgage Loan term. |
| (2) | Bloomberg has tenant self-help rights if the borrower does not timely complete the work for Final Substantial Completion. Bloomberg can perform the remaining work and deduct such costs plus a 10% administrative cost from the base rent due. The Bloomberg Data Center Mortgage Loan sponsors have provided joint and several guarantees totaling $105 million to Bloomberg to secure the lien free completion of the improvements. |
| (3) | Bloomberg has 20 years of lease extension options, renewable in periods of 5 or 10 years. |
THE INFORMATION IN THIS STRUCTURAL AND COLLATERAL TERM SHEET IS NOT COMPLETE AND MAY BE AMENDED PRIOR TO THE TIME OF SALE. THIS TERM SHEET IS NOT AN OFFER TO SELL THESE SECURITIES AND IT IS NOT A SOLICITATION OF AN OFFER TO BUY THESE SECURITIES IN ANY JURISDICTION WHERE THE OFFER OR SALE IS NOT PERMITTED.
43
| BLOOMBERG DATA CENTER |
The following table presents certain information relating to the lease rollover schedule at the Bloomberg Data Center Property:
Lease Expiration Schedule(1)
Year Ending December 31, | No. of Leases Expiring | Expiring NRSF | % of Total NRSF | Cumulative Expiring NRSF | Cumulative % of Total NRSF | Annual U/W Base Rent | Annual U/W Base Rent PSF | ||||||
| MTM | 0 | 0 | 0.0% | 0 | 0.0% | $0 | $0.00 | ||||||
| 2014 | 0 | 0 | 0.0% | 0 | 0.0% | $0 | $0.00 | ||||||
| 2015 | 0 | 0 | 0.0% | 0 | 0.0% | $0 | $0.00 | ||||||
| 2016 | 0 | 0 | 0.0% | 0 | 0.0% | $0 | $0.00 | ||||||
| 2017 | 0 | 0 | 0.0% | 0 | 0.0% | $0 | $0.00 | ||||||
| 2018 | 0 | 0 | 0.0% | 0 | 0.0% | $0 | $0.00 | ||||||
| 2019 | 0 | 0 | 0.0% | 0 | 0.0% | $0 | $0.00 | ||||||
| 2020 | 0 | 0 | 0.0% | 0 | 0.0% | $0 | $0.00 | ||||||
| 2021 | 0 | 0 | 0.0% | 0 | 0.0% | $0 | $0.00 | ||||||
| 2022 | 0 | 0 | 0.0% | 0 | 0.0% | $0 | $0.00 | ||||||
| 2023 | 0 | 0 | 0.0% | 0 | 0.0% | $0 | $0.00 | ||||||
| 2024 | 0 | 0 | 0.0% | 0 | 0.0% | $0 | $0.00 | ||||||
| Thereafter | 1 | 131,805 | 100.0% | 131,805 | 100.0% | $10,587,196 | $80.32 | ||||||
| Vacant | 0 | 0 | 0.0% | 131,805 | 100.0% | $0 | $0.00 | ||||||
| Total/Weighted Average | 1 | 131,805 | 100.0% | $10,587,196 | $80.32 | ||||||||
| (1) | Information obtained from the underwritten rent roll. |
The following table presents historical occupancy percentages at the Bloomberg Data Center Property:
Historical Occupancy
12/31/2011(1) | 12/31/2012(1) | 12/31/2013(1) | 5/1/2014(2) | |||
| NAP | NAP | NAP | 100.0% |
| (1) | Historical occupancy is not available as the Bloomberg Data Center Property was constructed in 2014. |
| (2) | Information obtained from the underwritten rent roll. |
Operating History and Underwritten Net Cash Flow. The following table presents certain information relating to the Underwritten Net Cash Flow at the Bloomberg Data Center Property:
Cash Flow Analysis(1)
| In Place | Year 10 | U/W | U/W $ per SF | ||||||
| Base Rent | $9,450,000 | $11,801,755(2) | $10,587,196(3) | $80.32 | |||||
| Grossed Up Vacant Space | 0 | 0 | 0 | 0.00 | |||||
| Total Reimbursables | 0 | 0 | 2,165,571 | 16.43 | |||||
| Other Income | 0 | 0 | 0 | 0.00 | |||||
| Less Vacancy & Credit Loss | 0(4) | 0(4) | 0(4) | 0.00 | |||||
| Effective Gross Income | $9,450,000 | $11,801,755 | $12,752,767 | $96.75 | |||||
| Total Operating Expenses | $0 | $0 | $2,165,571 | $16.43 | |||||
| Net Operating Income | $9,450,000 | $11,801,755 | $10,587,196 | $80.32 | |||||
| TI/LC | 0(4) | 0(4) | 0(4) | 0.00 | |||||
| Capital Expenditures | 0 | 0 | 98,854 | 0.75 | |||||
| Net Cash Flow | $9,450,000 | $11,801,755 | $10,488,342 | $79.57 | |||||
| NOI DSCR | 1.56x | 1.95x | 1.75x | ||||||
| NCF DSCR | 1.56x | 1.95x | 1.74x | ||||||
| NOI DY | 10.8% | 13.4% | 12.1% | ||||||
| NCF DY | 10.8% | 13.4% | 11.9% |
| (1) | Historical financial statements are not available as the Bloomberg Data Center Property was constructed in 2014. |
| (2) | Represents the annual rent due in year 10 of the Bloomberg lease term based on 2.5% annual rent increases. |
| (3) | Bloomberg’s in-place annual rent is $9,450,000 ($71.70 per square foot) and increases 2.5% annually. Annual U/W Base Rent PSF and Annual U/W Base Rent are based on the average rent over the Bloomberg Data Center Mortgage Loan term. |
| (4) | No economic vacancy or TI/LC costs were underwritten due to Bloomberg’s significant financial wherewithal, the long term lease maturing in 2029 (five years beyond the Bloomberg Data Center Mortgage Loan maturity date) and the substantial investment by Bloomberg in the Bloomberg Data Center Property. The Bloomberg Data Center Property was 100.0% leased as of May 1, 2014. |
THE INFORMATION IN THIS STRUCTURAL AND COLLATERAL TERM SHEET IS NOT COMPLETE AND MAY BE AMENDED PRIOR TO THE TIME OF SALE. THIS TERM SHEET IS NOT AN OFFER TO SELL THESE SECURITIES AND IT IS NOT A SOLICITATION OF AN OFFER TO BUY THESE SECURITIES IN ANY JURISDICTION WHERE THE OFFER OR SALE IS NOT PERMITTED.
44
| BLOOMBERG DATA CENTER |
Appraisal. As of the appraisal valuation date of August 1, 2014, the Bloomberg Data Center Property has an “as-stabilized” appraised value of $137,000,000. The stabilized value is based on Final Substantial Completion and completion of all required landlord work, for which an upfront reserve of $8,562,127 was established. See “Escrows” section for further detail on Bloomberg’s letter of credit posted as security for the remaining landlord work. As of the appraisal valuation date of January 16, 2014, the Bloomberg Data Center Property had an “as-is” appraised value of $94,000,000. The as-is value is based on the stabilized value conclusion of $137,000,000, less the remaining construction costs at the time of the appraisal ($35,274,434), less the net operating income “shortfall” ($3,560,638), less a 10% “risk/profit” adjustment, equating to a total deduction of $42,718,579. The “as-stabilized” value was relied upon as (i) $30,313,354 of work remains outstanding as of April 1, 2014, for which there is an upfront reserve and Bloomberg’s letter of credit (“LOC”); (ii) Bloomberg commenced rental payments April 1, 2014 and there are no termination options in the lease, and (iii) Substantial Completion has occurred and Bloomberg has taken possession of a portion of the space. The appraiser also concluded to a “go dark” value of $114,800,000.
Environmental Matters. According to the Phase I environmental assessment dated January 29, 2014, there was no evidence of any recognized environmental conditions at the Bloomberg Data Center Property.
Market Overview and Competition. The Bloomberg Data Center Property is located in Orangeburg, Rockland County, New York, less than one-quarter of a mile north of the border of New York and New Jersey and approximately 20 miles north of Midtown Manhattan. The Bloomberg Data Center Property is located on the south side of Corporate Drive, in close proximity to an industrial and office development with nearly 1.1 million square feet, including the 225,000 square foot office/data center for Verizon Wireless. According to a local newspaper, Verizon Wireless plans on hiring 100 inside sales positions at this location before the end of May 2014. On the east side of Blaisdell Road, one-half of a mile east of the Bloomberg Data Center Property, there is approximately 900,000 square feet of office and industrial space. As of 2013, the population within a three- and five-mile radius of the Bloomberg Data Center Property was 65,591 and 159,327, respectively. The estimated median household income within the same three- and five-mile radii was $141,050 and $136,276, respectively.
According to the appraiser, the top five data center markets in the United States are 1) Los Angeles / Silicon Valley, California, 2) Dallas, Texas, 3) Northern Virginia, 4) New York / New Jersey, and 5) Chicago, Illinois. Availability of power, optical fiber routing, existence of one or more major Internet Exchange Points (“IXPs”), and major centers of population are the key characteristics in driving growth in each of these top markets. According to a data center research company, telecom demand in the New York City market can be divided into four market segments: (i) small and midsized Internet enterprise and hosting firms; (ii) financial, insurance and pharmaceutical firms that demand large amounts of data center capacity with very specific requirements (these tenants occupy purpose built facilities); (iii) multi-national companies originating in Europe searching to establish points of presence in New York (New York is the key point of confluence for North American and European fiber networks) and (iv) high frequency or low-latency trading enablement facilities, which were traditionally located in Manhattan, however banks and trading firms have begun to deploy resources in New Jersey and outside of New York City. There are primarily three types of telecommunications infrastructure buildings: (a) data centers, such as the Bloomberg Data Center Property, which are physical locations designed to store redundant copies of data that can be continuously updated, (b) telecommunications facilities, such as One Wilshire in Los Angeles, which are used primarily for switching and connecting two or more parties, but can support data storage and (c) carrier-neutral hotels, such as 60 Hudson in New York, which provide both of these services, typically on a multi-tenant basis – they allow any fiber carrier to connect into the facility and to connect to other third parties in the facility.
According to the appraiser, the competitive data center market is more national in scale, as users are more interested in the available infrastructure and layout of a data center asset rather than its specific location. The lease rates for this type of space vary based on the infrastructure of the building, the availability of power in the building and the cost of power in the market (power is one of the key occupancy expense drivers for data center tenants), and the connectivity available in the building. Rental rates for turnkey space are well in excess of typical rents for other types of real estate. The appraiser analyzed recent leases negotiated in competitive turnkey data centers. The comparables range in size from 2,500 to 19,073 “USF” (which stands for raised floor area square footage); the Bloomberg Data Center Property has approximately 39,000 USF. All of the buildings are similar in class to the Bloomberg Data Center Property and average rents ranging from $16.48 per USF to $36.83 per USF per month, with an average of $24.21 per USF per month. Bloomberg pays a starting rent of $20.16 per USF per month and the underwritten rent is $22.59 per USF per month.
The Borrower. The borrower is 155 Corporate Drive, LLC, a limited liability company and single purpose entity with two independent directors. Legal counsel to the borrower provided a non-consolidation opinion in connection with the origination of the Bloomberg Data Center Mortgage Loan. Edward Russo, Joshua Rabina and Todd Aaron are the guarantors of certain nonrecourse carveouts under the Bloomberg Data Center Mortgage Loan.
The Sponsors. The sponsors are Edward Russo, Joshua Rabina and Todd Aaron. Edward Russo is the chief executive officer of Russo Development, which has developed more than seven million square feet of commercial space throughout northern New Jersey. Projects completed under his tenure include over 1.7 million square feet of mission critical space for various clients including SunGard, JP Morgan Chase, NYSE Euronext, and Credit Suisse. Russo Development previously partnered with Sentinel-Data Centers in 2012 for a Tier III multi-tenant data center in Somerset, New Jersey.
Joshua Rabina and Todd Aaron are co-presidents and co-founders of Sentinel-Data Centers (“Sentinel”), founded in 2001. Sentinel is a leading owner, developer and operator of data centers for large-footprint users. Sentinel has developed approximately 1.6 million square feet of primary production and failover data centers for an array of Fortune 500 companies.
Escrows. The loan documents provide for upfront escrows in the amount of $8,562,127 for the borrower’s portion of the remaining construction work at the Bloomberg Data Center Property. The cost to complete the work for Final Substantial Completion is estimated to be $30,313,354, and a portion of the cost ($21,751,228) is the obligation of Bloomberg. Bloomberg has provided the borrower with an LOC in the amount of $29,056,464 (in excess of their remaining portion of the cost) as security for Bloomberg’s
THE INFORMATION IN THIS STRUCTURAL AND COLLATERAL TERM SHEET IS NOT COMPLETE AND MAY BE AMENDED PRIOR TO THE TIME OF SALE. THIS TERM SHEET IS NOT AN OFFER TO SELL THESE SECURITIES AND IT IS NOT A SOLICITATION OF AN OFFER TO BUY THESE SECURITIES IN ANY JURISDICTION WHERE THE OFFER OR SALE IS NOT PERMITTED.
45
| BLOOMBERG DATA CENTER |
remaining payment obligations for the related work. The LOC has been delivered to the lender and, upon conditions satisfied in the Bloomberg lease, may be drawn upon to pay Bloomberg’s obligations in the event it fails to disburse the required amounts directly to the borrower. The borrower’s portion of the related work is set aside in the immediate repair reserve. If the borrower does not timely complete the work for Final Substantial Completion by June 27, 2014, Bloomberg’s sole remedy is the self-help right to perform the work itself and deduct the costs (plus a 10% administrative fee) from base rent due under its lease. The Bloomberg Data Center Mortgage Loan sponsors have provided joint and several guarantees totaling $105 million to Bloomberg to secure the lien-free completion of the improvements. Further, the Bloomberg Data Center Mortgage Loan sponsors provided a recourse carveout for any losses related to the failure of the borrower to obtain Final Substantial Completion on or before June 27, 2014. See “Descriptions of the Mortgage Pool – Other Matters” in the Free Writing Prospectus.
The loan documents do not require monthly escrows for real estate taxes provided the following conditions are met: (i) no event of default has occurred and is continuing; (ii) the Bloomberg lease is in full force and effect; (iii) the tenant is making tax payments directly to the taxing authorities in accordance with its leases (see “Ground Lease and Payment in Lieu of Taxes (“PILOT”)” below); and (iv) the borrower provides the lender with timely proof of payment. The loan documents do not require monthly escrows for insurance provided the following conditions are met (a) no event of default has occurred and is continuing; (b) the Bloomberg lease is in full force and effect; (c) the tenant maintains insurance in accordance with the loan documents and its leases; and (d) the borrower provides the lender with timely proof of payment of insurance premiums. The loan documents do not require monthly escrows for replacement reserves provided no event of default has occurred and is continuing.
Lockbox and Cash Management. The Bloomberg Data Center Mortgage Loan requires a lender-controlled lockbox account, which is already in place, and the borrower to direct the tenant to pay its rent directly into such lockbox account. The loan documents also require that all rents and other income received by the borrower be deposited in the lockbox account within three business days of receipt. Funds are then swept to a cash management account controlled by the lender and, prior to the occurrence of a Cash Trap Event Period (as defined below), all excess cash flow after application in accordance with the loan documents is distributed to the borrower’s operating account. During a Cash Trap Event Period, all excess cash flow is retained in the cash management account.
A “Bloomberg Cash Trap Event Period” will commence upon the earlier of (i) the occurrence and continuance of an event of default under the Bloomberg lease; (ii) Bloomberg filing bankruptcy or otherwise being subject to an insolvency proceeding and (iii) (a) to the extent Bloomberg is publicly rated at the time of determination, (I) Bloomberg “Going Dark” (as defined below) at any time during the three years prior to April 1, 2024 and (II) Bloomberg failing to have an investment grade rating at the time it “Goes Dark” (as defined below) or (b) if Bloomberg is not publicly rated, Bloomberg Going Dark at any time during the two-year period prior to April 1, 2024.
A Bloomberg Cash Trap Event Period will end, with regard to clause (i), upon the cure of such event of default; with regard to clause (ii), upon Bloomberg no longer being subject to any bankruptcy or insolvency proceeding and affirming the lease, and with regard to clause (iii), Bloomberg increasing its physical occupancy to at least 75% of the gross floor area Bloomberg Data Center Property, increasing its electrical power load to at least 1.0 megawatts for at least two consecutive calendar quarters and increasing the number of employees so that there are at least five engaged in the data center use for the Bloomberg Data Center Property for at least two consecutive calendar quarters.
“Going Dark” or “Goes Dark” shall mean (a) Bloomberg reducing its actual physical occupancy to less than 25% of the gross floor area Bloomberg Data Center Property and fully decommissioning the remaining gross floor area, (b) Bloomberg reducing its electrical power load to less than 1.0 megawatts for 60 continuous days and (c) Bloomberg reducing the number of employees engaged in the data center related use of the Bloomberg Data Center Property to less than five employees for sixty continuous days, all as determined by the lender in its commercially reasonable discretion.
A “Cash Trap Event Period” will commence upon the earlier of (i) the occurrence and continuance of an event of default and (ii) a Bloomberg Cash Trap Event Period. A Cash Trap Event Period will end, with regard to clause (i), upon the cure of such event of default and with regard to clause (ii), upon the cure of such events as outlined above (provided that a Cash Trap Event Period with regard to clause (i) has not occurred).
Property Management. The Bloomberg Data Center Property is managed by an affiliate of the borrower.
Assumption. The borrower has a two-time right to transfer the Bloomberg Data Center Property, provided that no event of default has occurred and is continuing and certain other conditions are satisfied, including (i) the lender’s reasonable determination that the proposed transferee and guarantor satisfy the lender’s credit review and underwriting standards, taking into consideration transferee experience, financial strength and general business standing; (ii) execution of a recourse guaranty and an environmental indemnity by an affiliate of the transferee; and (iii) if requested by the lender, rating agency confirmation from DBRS, KBRA and Moody’s that the transfer will not result in a downgrade, withdrawal or qualification of the respective ratings assigned to the Series 2014-C20 Certificates.
Right of First Offer. Bloomberg has a right of first offer (“ROFO”) to purchase the Bloomberg Data Center Property, although Bloomberg has agreed not to exercise the ROFO while the Bloomberg Data Center Mortgage Loan is outstanding. The ROFO is not extinguished by a foreclosure of the Bloomberg Data Center Property; however, the ROFO does not apply to a foreclosure or deed-in-lieu thereof.
Partial Release. Not Permitted.
Real Estate Substitution. Not Permitted.
Subordinate and Mezzanine Indebtedness. Not permitted.
THE INFORMATION IN THIS STRUCTURAL AND COLLATERAL TERM SHEET IS NOT COMPLETE AND MAY BE AMENDED PRIOR TO THE TIME OF SALE. THIS TERM SHEET IS NOT AN OFFER TO SELL THESE SECURITIES AND IT IS NOT A SOLICITATION OF AN OFFER TO BUY THESE SECURITIES IN ANY JURISDICTION WHERE THE OFFER OR SALE IS NOT PERMITTED.
46
| BLOOMBERG DATA CENTER |
Ground Lease and Payment in Lieu of Taxes (“PILOT”). In order to qualify for property tax reductions afforded by the PILOT agreement, the Bloomberg Data Center Property interests are structured as follows: (i) the borrower leased the ground to the County of Rockland Industrial Development Agency (“IDA”) until August 2028 for a one-time payment of $10; (ii) the IDA subleases its interest back to the borrower for a coterminous period for a one-time payment of $1 plus the related PILOT payment; and (iii) the borrower sub-subleases the interest to Bloomberg at an initial annual rent of $9.45 million through March 31, 2029. The remaining PILOT obligations during the loan term range from $303,761 in 2014 through $502,459 in 2024, and the PILOT payments continue until August 27, 2028. The Bloomberg Data Center Mortgage Loan underwriting was based on market rate property taxes of $665,928 (as estimated in the appraisal); no benefits from the PILOT were underwritten. As of the Note Date, the PILOT agreement had not been executed by all parties. The borrower advised the lender that all approvals have been obtained and the draft of the PILOT agreement was final. See “Risks Related To Mortgage Loans and Mortgaged Properties - Increases in Real Estate Taxes May Reduce Net Operating Income” and “Description of the Mortgage Pool – Other Matters” in the Free Writing Prospectus.
Terrorism Insurance. The loan documents require that the “all risk” insurance policy required to be maintained by the borrower provide coverage for terrorism in an amount equal to the full replacement cost of the Bloomberg Data Center Property; provided, however, that the borrower will not be required to spend more than 200% of the cost of property coverage immediately prior to the date that Terrorism Risk Insurance Act or a similar government backstop is no longer in effect. The loan documents also require business interruption insurance covering no less than the 18-month period following the occurrence of a casualty event, together with a six-month extended period of indemnity.
THE INFORMATION IN THIS STRUCTURAL AND COLLATERAL TERM SHEET IS NOT COMPLETE AND MAY BE AMENDED PRIOR TO THE TIME OF SALE. THIS TERM SHEET IS NOT AN OFFER TO SELL THESE SECURITIES AND IT IS NOT A SOLICITATION OF AN OFFER TO BUY THESE SECURITIES IN ANY JURISDICTION WHERE THE OFFER OR SALE IS NOT PERMITTED.
47
(THIS PAGE INTENTIONALLY LEFT BLANK)
48
| WORLDGATE CENTRE |
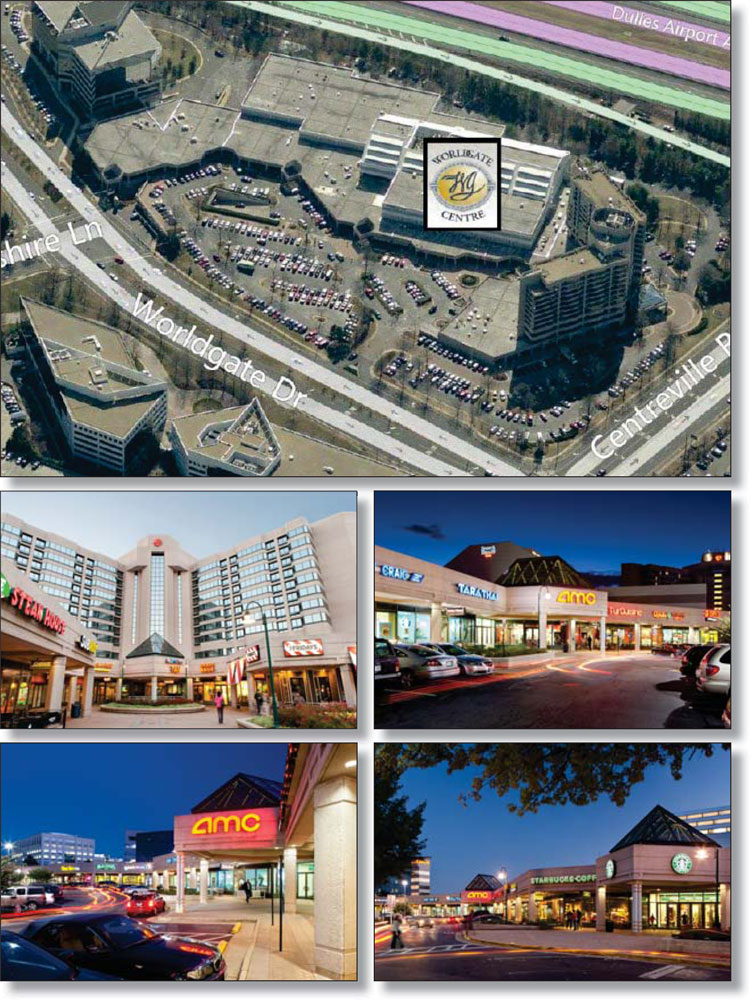
THE INFORMATION IN THIS STRUCTURAL AND COLLATERAL TERM SHEET IS NOT COMPLETE AND MAY BE AMENDED PRIOR TO THE TIME OF SALE. THIS TERM SHEET IS NOT AN OFFER TO SELL THESE SECURITIES AND IT IS NOT A SOLICITATION OF AN OFFER TO BUY THESE SECURITIES IN ANY JURISDICTION WHERE THE OFFER OR SALE IS NOT PERMITTED.
49
| WORLDGATE CENTRE |
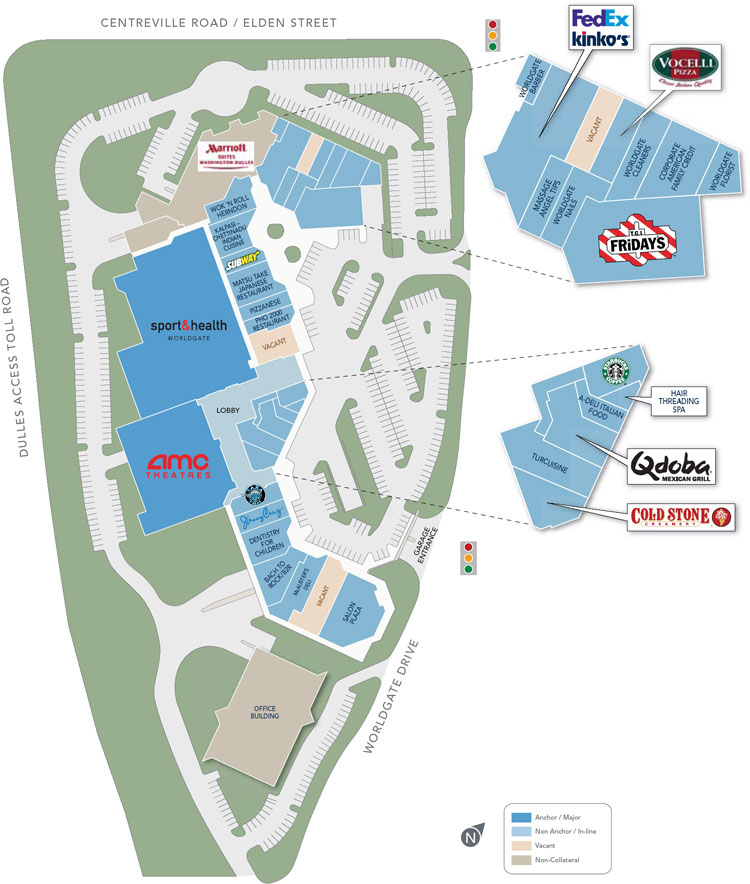
THE INFORMATION IN THIS STRUCTURAL AND COLLATERAL TERM SHEET IS NOT COMPLETE AND MAY BE AMENDED PRIOR TO THE TIME OF SALE. THIS TERM SHEET IS NOT AN OFFER TO SELL THESE SECURITIES AND IT IS NOT A SOLICITATION OF AN OFFER TO BUY THESE SECURITIES IN ANY JURISDICTION WHERE THE OFFER OR SALE IS NOT PERMITTED.
50
| WORLDGATE CENTRE |

THE INFORMATION IN THIS STRUCTURAL AND COLLATERAL TERM SHEET IS NOT COMPLETE AND MAY BE AMENDED PRIOR TO THE TIME OF SALE. THIS TERM SHEET IS NOT AN OFFER TO SELL THESE SECURITIES AND IT IS NOT A SOLICITATION OF AN OFFER TO BUY THESE SECURITIES IN ANY JURISDICTION WHERE THE OFFER OR SALE IS NOT PERMITTED.
51
| No. 3 – Worldgate Centre | |||||||
| Loan Information | Property Information | ||||||
| Mortgage Loan Seller: | Wells Fargo Bank, National Association | Single Asset/Portfolio: | Single Asset | ||||
Credit Assessment (DBRS/KBRA/Moody’s): | NR/NR/NR | Property Type: | Retail | ||||
| Original Principal Balance: | $65,000,000 | Specific Property Type: | Anchored | ||||
| Cut-off Date Principal Balance: | $65,000,000 | Location: | Herndon, VA | ||||
| % of Initial Pool Balance: | 5.2% | Size: | 229,326 SF | ||||
| Loan Purpose: | Refinance | Cut-off Date Principal Balance Per SF: | $283.44 | ||||
| Borrower Name: | Worldgate Centre Owner, LLC | Year Built/Renovated: | 1990/2001 | ||||
| Sponsor: | Gary D. Rappaport | Title Vesting(3): | Fee | ||||
| Mortgage Rate: | 4.740% | Property Manager: | Self-managed | ||||
| Note Date: | April 4, 2014 | 3rd Most Recent Occupancy (As of): | 100.0% (12/31/2010) | ||||
| Anticipated Repayment Date: | NAP | 2nd Most Recent Occupancy (As of): | 100.0% (12/31/2011) | ||||
| Maturity Date: | May 1, 2024 | Most Recent Occupancy (As of): | 98.0% (12/31/2012) | ||||
| IO Period: | None | Current Occupancy (As of)(2): | 95.0% (2/25/2014) | ||||
| Loan Term (Original): | 120 months | ||||||
| Seasoning: | 0 months | Underwriting and Financial Information: | |||||
| Amortization Term (Original): | 360 months | ||||||
| Loan Amortization Type: | Amortizing Balloon | 3rd Most Recent NOI (As of): | $5,640,816 (12/31/2011) | ||||
| Interest Accrual Method: | Actual/360 | 2nd Most Recent NOI (As of): | $5,604,814 (12/31/2012) | ||||
| Call Protection: | L(24),D(92),O(4) | Most Recent NOI (As of): | $5,481,921 (12/31/2013) | ||||
| Lockbox Type: | Soft/Springing Cash Management | ||||||
| Additional Debt: | None | ||||||
| Additional Debt Type: | NAP | U/W Revenues: | $8,169,368 | ||||
| U/W Expenses: | $2,544,973 | ||||||
| U/W NOI: | $5,624,395 | ||||||
Escrows and Reserves(1): | U/W NCF: | $5,298,045 | |||||
| U/W NOI DSCR: | 1.38x | ||||||
Type: | Initial | Monthly | Cap (If Any) | U/W NCF DSCR: | 1.30x | ||
| Taxes | $529,770 | $88,295 | NAP | U/W NOI Debt Yield: | 8.7% | ||
| Insurance | $0 | Springing | NAP | U/W NCF Debt Yield: | 8.2% | ||
| Replacement Reserves | $0 | $3,822 | NAP | As-Is Appraised Value: | $88,500,000 | ||
| TI/LC Reserve | $0 | $10,833 | $260,000 | As-Is Appraisal Valuation Date: | February 26, 2014 | ||
Rent Concession(2) | $116,454 | $0 | NAP | Cut-off Date LTV Ratio: | 73.4% | ||
| Outstanding TI/LC Reserve | $423,768 | $0 | NAP | LTV Ratio at Maturity or ARD: | 59.9% | ||
| (1) | See “Escrows” section. |
| (2) | Three tenants totalling 12,954 square feet (5.6% of net rentable area) are not in occupancy and have not yet commenced rental payments. Current Occupancy excluding these tenants is 89.3%. Upfront reserves have been taken for two of the tenants. See “Major Tenants” table. |
| (3) | See “Property” section. |
The Mortgage Loan. The mortgage loan (the “Worldgate Centre Mortgage Loan”) is evidenced by a single promissory note that is secured by a first mortgage encumbering an anchored retail center located in Herndon, Virginia (the “Worldgate Centre Property”). The Worldgate Centre Mortgage Loan was originated on April 4, 2014 by Wells Fargo Bank, National Association. The Worldgate Centre Mortgage Loan had an original principal balance of $65,000,000, has an outstanding principal balance as of the Cut-off Date of $65,000,000 and accrues interest at an interest rate of 4.740% per annum. The Worldgate Centre Mortgage Loan had an initial term of 120 months, has a remaining term of 120 months as of the Cut-off Date and requires payments of principal and interest based on a 30-year amortization schedule. The Worldgate Centre Mortgage Loan matures on May 1, 2024.
Following the lockout period, the borrower has the right to defease the Worldgate Centre Mortgage Loan in whole, but not in part, on any date before February 1, 2024. In addition, the Worldgate Centre Mortgage Loan is prepayable without penalty on or after February 1, 2024.
THE INFORMATION IN THIS STRUCTURAL AND COLLATERAL TERM SHEET IS NOT COMPLETE AND MAY BE AMENDED PRIOR TO THE TIME OF SALE. THIS TERM SHEET IS NOT AN OFFER TO SELL THESE SECURITIES AND IT IS NOT A SOLICITATION OF AN OFFER TO BUY THESE SECURITIES IN ANY JURISDICTION WHERE THE OFFER OR SALE IS NOT PERMITTED.
52
| WORLDGATE CENTRE |
Sources and Uses
| Sources | Uses | ||||||||
| Original loan amount | $65,000,000 | 100.0% | Loan payoff(1) | $40,863,118 | 62.9 | % | |||
| Reserves | 1,069,992 | 1.6 | |||||||
| Closing costs | 754,673 | 1.2 | |||||||
| Return of equity | 22,312,217 | 34.3 | |||||||
| Total Sources | $65,000,000 | 100.0% | Total Uses | $65,000,000 | 100.0 | % |
| (1) | The Worldgate Centre Property was previously securitized in MLMT 2004-BPC1. |
The Property. The Worldgate Centre Property is an anchored retail center containing approximately 229,326 square feet located in Herndon, Virginia, approximately three miles east of Dulles International Airport. A portion of the Worldgate Centre Property containing 19,325 square feet (8.4% of the total net rentable square feet) is located within a perpetual easement granted to the borrower that is also collateral for the Worldgate Centre Mortgage Loan. Built in 1990 and renovated in 2001, the Worldgate Centre Property is situated on a 7.2 acre site and is part of a larger development that also contains the 253-room Washington Dulles Marriott Suites hotel and a 100% occupied, 167,285 square foot single tenant office building (Exelis’ headquarters for their information systems business). Neither the hotel nor the office building are part of the collateral. The Worldgate Centre Property consists of one multi-tenant U-shaped building with a central lobby, which provides access to the two anchor spaces: Worldgate Sport & Health and AMC Worldgate 9 Theater (“AMC”). Worldgate Sport & Health, the flagship location for Washington DC’s largest health club, was founded in 1973, has 23 locations (including the Worldgate Centre Property) and has been a tenant at the Worldgate Centre Property since 1994. Worldgate Sport & Health completed a $2 million renovation in 2011 which included the addition of a tennis court, a multi-purpose room and new flooring, among other improvements. AMC opened in May 2013 after an independent theater operator vacated at lease expiration. AMC immediately began a $4 million renovation. Renovations included upgrades to luxury lounge seating, restrooms and concession area work and installation of a full-service bar. The remainder of the Worldgate Centre Property is comprised of restaurant and service-oriented tenants including TGI Friday’s, Subway, Cold Stone Creamery and Starbucks. The Worldgate Centre Property provides a total of 1,170 parking spaces, including 973 spaces located in a bi-level basement garage and 197 in surface spaces, resulting in a parking ratio of 5.1 spaces per 1,000 square feet of rentable area. The Worldgate Centre Property has never been less than 92% occupied over the last 10 years and has averaged 97.9% occupancy since 2006. As of February 25, 2014, the Worldgate Centre Property was 95.0% leased to 29 tenants.
THE INFORMATION IN THIS STRUCTURAL AND COLLATERAL TERM SHEET IS NOT COMPLETE AND MAY BE AMENDED PRIOR TO THE TIME OF SALE. THIS TERM SHEET IS NOT AN OFFER TO SELL THESE SECURITIES AND IT IS NOT A SOLICITATION OF AN OFFER TO BUY THESE SECURITIES IN ANY JURISDICTION WHERE THE OFFER OR SALE IS NOT PERMITTED.
53
| WORLDGATE CENTRE |
The following table presents certain information relating to the tenancy at the Worldgate Centre Property:
Major Tenants
| Tenant Name | Credit Rating (Fitch/ Moody’s/ S&P)(1) | Tenant NRSF | % of NRSF | Annual U/W Base Rent PSF | Annual U/W Base Rent | % of Total Annual U/W Base Rent | Sales PSF(2) | Occupancy Cost(2) | Lease Expiration Date | |||
| Anchor Tenants | ||||||||||||
| Worldgate Sport & Health | NR/NR/NR | 108,670 | 47.4% | $29.53 | $3,209,415 | 55.1% | NAP | NAP | 12/31/2030 | |||
| AMC Worldgate 9 Theater | NR/NR/NR | 38,238 | 16.7% | $17.00 | $650,046 | 11.2% | NAV(3) | NAV(3) | 5/31/2028 | |||
| Total Anchor Tenants | 146,908 | 64.1% | $26.27 | $3,859,461 | 66.2% | |||||||
| Major Tenants | ||||||||||||
| TGI Fridays | NR/NR/NR | 7,000 | 3.1% | $26.00 | $182,000 | 3.1% | $389 | 8.5% | 10/31/2020 | |||
| Inchin’s Bamboo Garden | NR/NR/NR | 4,500 | 2.0% | $33.43 | $150,451 | 2.6% | $118 | 34.4% | 8/31/2018 | |||
Salon Plaza(4) | NR/NR/NR | 7,659 | 3.3% | $19.00 | $145,521 | 2.5% | NAV | NAV | 7/31/2024 | |||
| FedEx Kinko’s Inc. | NR/Baa1/BBB | 4,788 | 2.1% | $25.00 | $119,700 | 2.1% | NAV | NAV | 4/30/2018 | |||
| Matsu Take Japanese Restaurant | NR/NR/NR | 4,275 | 1.9% | $23.00 | $98,325 | 1.7% | $272 | 11.0% | 6/30/2015 | |||
| Total Major Tenants | 28,222 | 12.3% | $24.66 | $695,997 | 11.9% | |||||||
| Non-Major Tenants | 42,708 | 18.6% | $29.80 | $1,272,910 | 21.8% | |||||||
Occupied Collateral Total(5) | 217,838 | 95.0% | $26.76 | $5,828,368 | 100.0% | |||||||
| Vacant Space | 11,488 | 5.0% | ||||||||||
| Collateral Total | 229,326 | 100.0% | ||||||||||
| (1) | Credit Ratings are those of the parent company whether or not the parent guarantees the lease. |
| (2) | Sales PSF and Occupancy Costs represent the trailing 12-month period ending February 28, 2014. Tenants showing ‘NAV’ are not required to report sales. |
| (3) | Sales PSF and Occupancy Costs are not available for AMC, as they opened in May 2013 and subsequently took the screens offline for a $4 million renovation that concluded at year-end. |
| (4) | Salon Plaza has executed a lease but is not yet in occupancy or paying rent. The borrower expects to deliver their space on June 15, 2014 with an estimated rent commencement date of October 15, 2014. All outstanding tenant improvements, leasing commissions and nine months of rent were reserved upfront, totalling $465,274. |
| (5) | Two tenants (Massage & Angeltips - 1,170 square feet; $29,250 Annual U/W Base Rent and Dentistry for Children – 4,125 square feet; $90,750 Annual U/W Base Rent) totalling 5,295 square feet (2.3% net rentable area) are not in occupancy and have not yet commenced rental payments. Current Occupancy excluding these two tenants and Salon Plaza is 89.3%. A reserve of $23,663 was taken for Massage & Angeltips outstanding TI/LC costs and free rent. |
THE INFORMATION IN THIS STRUCTURAL AND COLLATERAL TERM SHEET IS NOT COMPLETE AND MAY BE AMENDED PRIOR TO THE TIME OF SALE. THIS TERM SHEET IS NOT AN OFFER TO SELL THESE SECURITIES AND IT IS NOT A SOLICITATION OF AN OFFER TO BUY THESE SECURITIES IN ANY JURISDICTION WHERE THE OFFER OR SALE IS NOT PERMITTED.
54
| WORLDGATE CENTRE |
The following table presents certain information relating to the lease rollover schedule at the Worldgate Centre Property:
Lease Expiration Schedule(1)(2)
Year Ending December 31, | No. of Leases Expiring | Expiring NRSF | % of Total NRSF | Cumulative Expiring NRSF | Cumulative % of Total NRSF | Annual U/W Base Rent | Annual U/W Base Rent PSF(3) | ||||||
| MTM | 0 | 0 | 0.0% | 0 | 0.0% | $0 | $0.00 | ||||||
| 2014 | 2 | 3,548 | 1.5% | 3,548 | 1.5% | $114,686 | $32.32 | ||||||
| 2015 | 3 | 6,652 | 2.9% | 10,200 | 4.4% | $173,409 | $26.07 | ||||||
| 2016 | 3 | 6,249 | 2.7% | 16,449 | 7.2% | $174,341 | $27.90 | ||||||
| 2017 | 2 | 3,176 | 1.4% | 19,625 | 8.6% | $129,470 | $40.77 | ||||||
| 2018 | 3 | 11,654 | 5.1% | 31,279 | 13.6% | $366,471 | $31.45 | ||||||
| 2019 | 5 | 6,978 | 3.0% | 38,257 | 16.7% | $219,906 | $31.51 | ||||||
| 2020 | 4 | 12,555 | 5.5% | 50,812 | 22.2% | $338,457 | $26.96 | ||||||
| 2021 | 0 | 0 | 0.0% | 50,812 | 22.2% | $0 | $0.00 | ||||||
| 2022 | 1 | 4,117 | 1.8% | 54,929 | 24.0% | $74,857 | $18.18 | ||||||
| 2023 | 2 | 4,217 | 1.8% | 59,146 | 25.8% | $141,039 | $33.45 | ||||||
| 2024 | 2 | 11,784 | 5.1% | 70,930 | 30.9% | $236,271 | $20.05 | ||||||
| Thereafter | 2 | 146,908 | 64.1% | 217,838 | 95.0% | $3,859,461 | $26.27 | ||||||
| Vacant | 0 | 11,488 | 5.0% | 229,326 | 100.0% | $0 | $0.00 | ||||||
| Total/Weighted Average | 29 | 229,326 | 100.0% | $5,828,368 | $26.76 |
| (1) | Information obtained from the underwritten rent roll. | |
| (2) | Certain tenants may have lease termination options that are exercisable prior to the originally stated expiration date of the subject lease and that are not considered in the Lease Expiration Schedule. | |
| (3) | Weighted Average Annual U/W Base Rent PSF excludes vacant space. |
The following table presents historical occupancy percentages at the Worldgate Centre Property:
Historical Occupancy
12/31/2010(1) | 12/31/2011(1) | 12/31/2012(1) | 2/25/2014(2)(3) | |||
| 100.0% | 100.0% | 98.0% | 95.0% |
| (1) | Information obtained from the borrower. |
| (2) | Three tenants totaling 12,954 square feet (5.6% net rentable area) are not in occupancy and have not yet commenced rental payments. Current Occupancy excluding these tenants is 89.3%. Upfront reserves have been taken for two of the tenants. |
| (3) | Information obtained from the underwritten rent roll. |
Operating History and Underwritten Net Cash Flow. The following table presents certain information relating to the historical operating performance and Underwritten Net Cash Flow at the Worldgate Centre Property:
Cash Flow Analysis
| 2011 | 2012 | 2013 | U/W | U/W $ per SF | |||||||
| Base Rent | $5,867,763 | $5,740,388 | $5,572,595 | $5,828,368 | $25.42 | ||||||
| Grossed Up Vacant Space | 0 | 0 | 0 | 378,099 | 1.65 | ||||||
| Percentage Rent | 0 | 0 | 0 | 0 | 0.00 | ||||||
| Total Reimbursables | 2,186,856 | 2,401,720 | 2,398,129 | 2,334,000 | 10.18 | ||||||
| Other Income | 10,567 | 9,919 | 7,654 | 7,000 | 0.03 | ||||||
| Less Vacancy & Credit Loss | 0 | 0 | 0 | (378,099)(1) | (1.65) | ||||||
| Effective Gross Income | $8,065,186 | $8,152,026 | $7,978,378 | $8,169,368 | $35.62 | ||||||
| Total Operating Expenses | $2,424,371 | $2,547,212 | $2,496,457 | $2,544,973 | $11.10 | ||||||
| Net Operating Income | $5,640,816 | $5,604,814 | $5,481,921 | $5,624,395 | $24.53 | ||||||
| TI/LC | 0 | 0 | 0 | 291,951 | 1.27 | ||||||
| Capital Expenditures | 0 | 0 | 0 | 34,399 | 0.15 | ||||||
| Net Cash Flow | $5,640,816 | $5,604,814 | $5,481,921 | $5,298,045 | $23.10 | ||||||
| NOI DSCR | 1.39x | 1.38x | 1.35x | 1.38x | |||||||
| NCF DSCR | 1.39x | 1.38x | 1.35x | 1.30x | |||||||
| NOI DY | 8.7% | 8.6% | 8.4% | 8.7% | |||||||
| NCF DY | 8.7% | 8.6% | 8.4% | 8.2% |
| (1) | The underwritten economic vacancy is 6.1%. The Worldgate Centre Property was 95.0% leased as of February 25, 2014. |
Appraisal. As of the appraisal valuation date of February 26, 2014, the Worldgate Centre Property had an “as-is” appraised value of $88,500,000.
THE INFORMATION IN THIS STRUCTURAL AND COLLATERAL TERM SHEET IS NOT COMPLETE AND MAY BE AMENDED PRIOR TO THE TIME OF SALE. THIS TERM SHEET IS NOT AN OFFER TO SELL THESE SECURITIES AND IT IS NOT A SOLICITATION OF AN OFFER TO BUY THESE SECURITIES IN ANY JURISDICTION WHERE THE OFFER OR SALE IS NOT PERMITTED.
55
| WORLDGATE CENTRE |
Environmental Matters. According to the Phase I environmental site assessment dated March 5, 2014, there was no evidence of any recognized environmental conditions at the Worldgate Centre Property, however there was evidence of an environmental issue. The Worldgate Centre Property is equipped with one 550 gallon underground storage tank (“UST”). The UST is approximately 23 years in age, of double-wall steel construction, and is equipped with spill containing and overfill protection devices. The UST passed the most recent tightness test conducted in September 2012. Given the age of the tank, the Phase I environmental site assessment recommended that the UST should be removed and replaced with an above ground storage tank that can provide the same function. Given the lack of any recorded issues, the minimal suggested cost of removal (estimated to be $15,000 - $20,000), the substantial financial strength of the sponsor and an ongoing Tank Pollution Liability policy held by the sponsor, no environmental reserve or UST removal was required.
Market Overview and Competition. The Worldgate Centre Property is located in Herndon, Virginia, at the intersection of Worldgate Drive, Centreville Road and the Dulles Access Toll Road, approximately three miles east of Dulles International Airport and 25 miles west of Washington, D.C. The Worldgate Centre Property is located directly off exit 10 of the Dulles Toll Road, the major east-west artery providing access from Washington, D.C. to Dulles International Airport and the surrounding suburbs. The traffic count at the intersection of Centreville Road and the Dulles Toll Road is approximately 94,000 vehicles per day. Further, the Worldgate Centre Property will be within walking distance (approximately 2 miles west) of the Silver Line Herndon-Monroe station. The Silver Line is a new $5.6 billion, 23.1 mile Dulles Corridor Metrorail extension expected to be completed in 2018.
According to a government agency, Fairfax County reported a 3.7% unemployment rate as of November 2013, which is well below the national average of 6.6%. According to the appraisal, as of 2013, the population within a three- and five-mile radius of the Worldgate Centre Property was 115,234 and 205,667, respectively. The estimated average household income within the same three- and five-mile radius was $131,974 and $146,351, respectively. Fairfax County is also the fourth richest county in the United States, according to a March 25, 2013 business news magazine. The Worldgate Centre Property’s surrounding uses include multiple anchored retail centers and many office buildings. The area has a dense office population of approximately 88,000 employees within a three-mile radius including Amazon’s Web Services Group, which plans to add 500 jobs at 12900 Worldgate Drive (directly west of the Worldgate Centre Property across Worldgate Drive) with an average salary of $114,000, in addition to investing $9.5 million in the building according to a local business newspaper. According to the appraisal, the Worldgate Centre Property is located in the Suburban Fairfax retail submarket. As of year-end 2013, the submarket reported an inventory of approximately 12.9 million square feet with a 5.4% vacancy rate and an average lease rate of $28.41, on a triple net basis.
The following table presents certain information relating to comparable retail properties for the Worldgate Centre Property:
Competitive Set(1)
Worldgate Centre (Subject) | Village Center at Dulles | Woodland Park Crossing | Reston Town Center | Plaza America | Dulles Park Shopping Center | |
| Location | Herndon, VA | Herndon, VA | Herndon, VA | Reston, VA | Reston, VA | Herndon, VA |
| Distance from Subject | -- | 1.4 miles | 1.5 miles | 3.2 miles | 3.8 miles | 0.9 miles |
| Property Type | Anchored Retail | Neighborhood Retail | Lifestyle Center | Lifestyle Center | Neighborhood Retail | Neighborhood Retail |
| Year Built/Renovated | 1990/2001 | 1991/NAP | 2007/NAP | 1988/NAP | 1995/NAP | 1965/1997 |
| Anchors | Worldgate Sport & Health, AMC Worldgate 9 Theater | Frugal Fannies, Shoppers Food Warehouse, Staples | Harris Teeter | Clydes of Reston, Pottery Barn | Michael’s, Whole Foods Market, Books-A-Million | Bloom, CVS |
| Total GLA | 229,326 SF | 305,087 SF | 137,038 SF | 218,664 SF | 222,692 SF | 98,479 SF |
| Total Occupancy | 95% | 88% | 97% | 100% | 100% | 93% |
| (1) | Information obtained from the appraisal. |
The Borrower. The borrower is Worldgate Centre Owner, LLC, a single purpose entity with one independent director. Legal counsel to the borrower delivered a non-consolidation opinion in connection with the origination of the Worldgate Centre Mortgage Loan. Gary D. Rappaport and the Gary D. Rappaport Revocable Trust are the guarantors of certain nonrecourse carveouts under the Worldgate Centre Mortgage Loan.
The Sponsor. The loan sponsor is Gary D. Rappaport, the founder and CEO of the Rappaport Companies. Founded in 1984, the Rappaport Companies are headquartered approximately 10 miles east of the Worldgate Centre Property and specialize exclusively on the management and operation of retail properties. The Rappaport Companies’ portfolio totals more than 13 million square feet of retail space in urban and suburban locations throughout Washington, D.C., Maryland and Virginia. Gary Rappaport is a former Chairman and Trustee of the International Council of Shopping Centers, serves on the Washington, D.C. Economic Partnership Board and served as an Entrepreneur in Residence at the Wharton School of Business. Gary Rappaport was involved in a loan default in 2009 where he owned an indirect, non-controlling interest in the borrower. See “Description of the Mortgage Pool – Default History, Bankruptcy Issues and Other Proceedings” in the Free Writing Prospectus for further detail.
Escrows. The loan documents provide for upfront escrows in the amount of $529,770 for real estate taxes, $116,454 for tenants that have not yet commenced rental payments ($109,141 for Salon Plaza and $7,313 for Massage & Angeltips) and $423,768 for outstanding tenant improvement and leasing commission obligations ($356,133 for Salon Plaza, $51,285 for Kalpasi and $16,350 for Massage & Angeltips). The loan documents also provide for ongoing monthly escrow deposits of $88,295 for real estate taxes, $3,822
THE INFORMATION IN THIS STRUCTURAL AND COLLATERAL TERM SHEET IS NOT COMPLETE AND MAY BE AMENDED PRIOR TO THE TIME OF SALE. THIS TERM SHEET IS NOT AN OFFER TO SELL THESE SECURITIES AND IT IS NOT A SOLICITATION OF AN OFFER TO BUY THESE SECURITIES IN ANY JURISDICTION WHERE THE OFFER OR SALE IS NOT PERMITTED.
56
| WORLDGATE CENTRE |
for replacement reserves and $10,833 for tenant improvements and leasing commissions, subject to a cap of $260,000. The loan documents do not require monthly escrows for insurance provided (i) no event of default has occurred and is continuing; (ii) the insurance required to be maintained by the borrower is maintained pursuant to one or more blanket polices; and (iii) the borrower provides the lender with timely proof of payment of insurance premiums.
Lockbox and Cash Management. The Worldgate Centre Mortgage Loan requires a lender-controlled lockbox account, which is already in place, and that all rents received by the borrower or the property manager be deposited into the lockbox account within one business day of receipt. Prior to the occurrence of a Cash Trap Event Period (as defined below), all funds on deposit in the lockbox account are swept into the borrower’s operating account on a daily basis. During a Cash Trap Event Period, all excess cash flow is swept on a monthly basis to a cash management account under control of the lender.
A “Cash Trap Event Period” will commence upon the earlier of (i) the occurrence and continuance of an event of default; (ii) Worldgate Sport & Health (a) declaring bankruptcy or being subject to a similar insolvency proceeding, (b) going dark or (c) failing to be open during customary business hours; (iii) AMC declaring bankruptcy or being subject to a similar insolvency proceeding and (iv) the DSCR falling below 1.10x. A Cash Trap Event Period will end, with regard to clause (i), upon the cure of such event of default; with regard to clause (ii), upon the date an acceptable replacement tenant (or tenants) is open for business in the former Worldgate Sport & Health space and paying a minimum aggregate rent (including reimbursements) of $4,286,241; with regard to clause (iii), upon the date an acceptable replacement tenant (or tenants) is open for business in the former AMC space and paying a minimum aggregate rent (including reimbursements) of $989,249; and with regard to clause (iv), upon the date that the debt service coverage ratio is equal to or greater than 1.15x for two consecutive calendar quarters.
Property Management. The Worldgate Centre Property is managed by an affiliate of the borrower.
Assumption. The borrower has a two-time right to transfer the Worldgate Centre Property, provided that no event of default has occurred and is continuing and certain other conditions are satisfied, including, but not limited to the following: (i) the lender’s reasonable determination that the proposed transferee and guarantor satisfy the lender’s credit review and underwriting standards, taking into consideration the transferee’s experience, financial strength and general business standing; (ii) execution of a recourse guaranty and an environmental indemnity by an affiliate of the transferee; and (iii) if requested by the lender, rating agency confirmation from DBRS, KBRA and Moody’s that the transfer will not result in a downgrade, withdrawal or qualification of the respective ratings assigned to the Series 2014-C20 Certificates.
Partial Release. Not permitted.
Real Estate Substitution. Not permitted.
Subordinate and Mezzanine Indebtedness. Not permitted.
Ground Lease. None.
Terrorism Insurance. The loan documents require that the “all risk” insurance policy required to be maintained by the borrower provide coverage for terrorism in an amount equal to the full replacement cost of the Worldgate Centre Property. The loan documents also require business interruption insurance covering no less than the 18-month period following the occurrence of a casualty event, together with a six-month extended period of indemnity.
THE INFORMATION IN THIS STRUCTURAL AND COLLATERAL TERM SHEET IS NOT COMPLETE AND MAY BE AMENDED PRIOR TO THE TIME OF SALE. THIS TERM SHEET IS NOT AN OFFER TO SELL THESE SECURITIES AND IT IS NOT A SOLICITATION OF AN OFFER TO BUY THESE SECURITIES IN ANY JURISDICTION WHERE THE OFFER OR SALE IS NOT PERMITTED.
57
| SUGAR CREEK I & II |
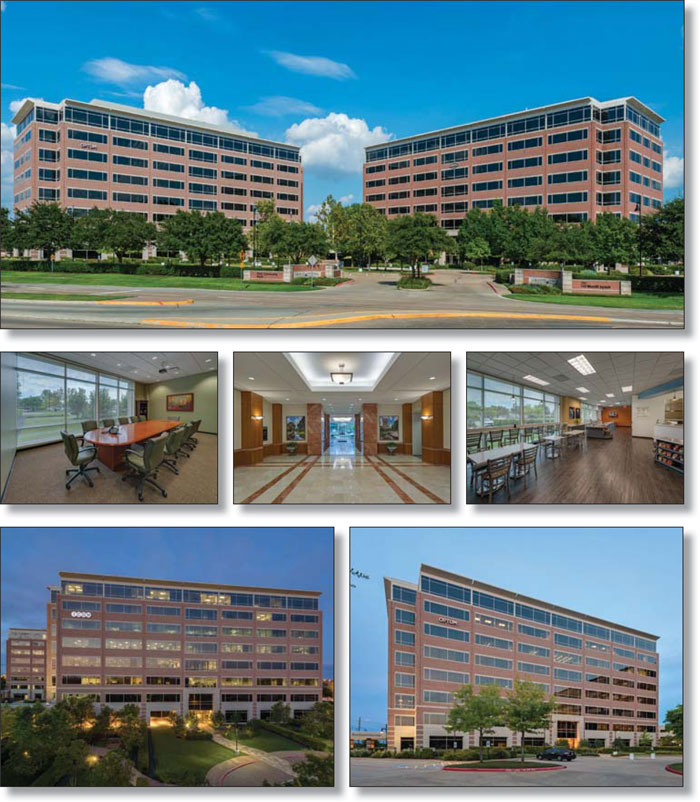
THE INFORMATION IN THIS STRUCTURAL AND COLLATERAL TERM SHEET IS NOT COMPLETE AND MAY BE AMENDED PRIOR TO THE TIME OF SALE. THIS TERM SHEET IS NOT AN OFFER TO SELL THESE SECURITIES AND IT IS NOT A SOLICITATION OF AN OFFER TO BUY THESE SECURITIES IN ANY JURISDICTION WHERE THE OFFER OR SALE IS NOT PERMITTED.
58
| SUGAR CREEK I & II |
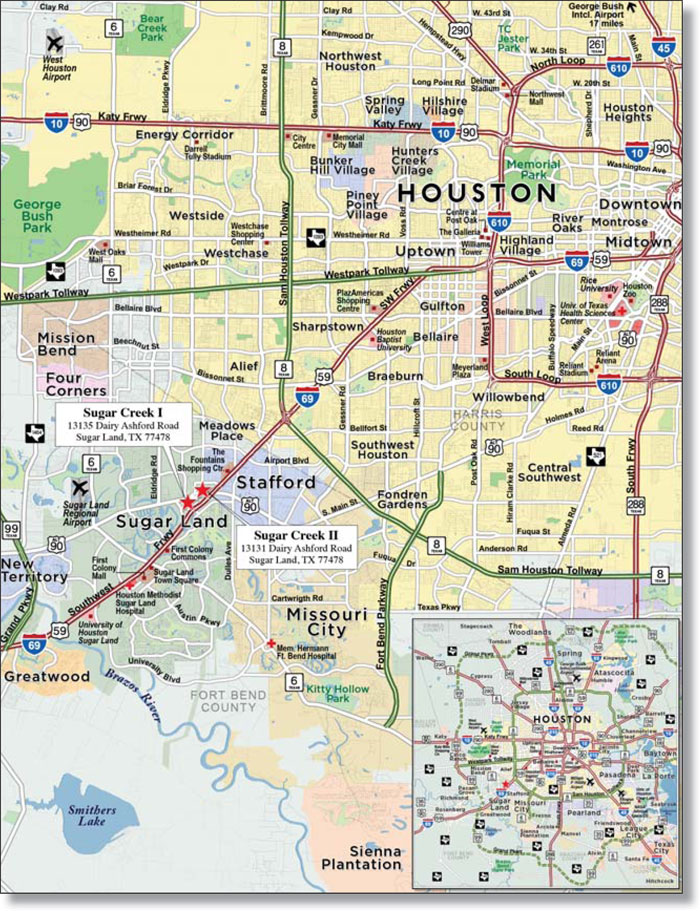
THE INFORMATION IN THIS STRUCTURAL AND COLLATERAL TERM SHEET IS NOT COMPLETE AND MAY BE AMENDED PRIOR TO THE TIME OF SALE. THIS TERM SHEET IS NOT AN OFFER TO SELL THESE SECURITIES AND IT IS NOT A SOLICITATION OF AN OFFER TO BUY THESE SECURITIES IN ANY JURISDICTION WHERE THE OFFER OR SALE IS NOT PERMITTED.
59
| No. 4 – Sugar Creek I & II | |||||||
| Loan Information | Property Information | ||||||
| Mortgage Loan Seller: | Wells Fargo Bank, National Association | Single Asset/Portfolio: | Portfolio | ||||
Credit Assessment (DBRS/KBRA/Moody’s): | NR/NR/NR | Property Type: | Office | ||||
| Original Principal Balance: | $62,625,000 | Specific Property Type: | Suburban | ||||
| Cut-off Date Principal Balance: | $62,625,000 | Location: | Sugar Land, TX | ||||
| % of Initial Pool Balance: | 5.0% | Size: | 409,168 SF | ||||
| Loan Purpose: | Acquisition | Cut-off Date Principal Balance Per SF(2): | $153.05 | ||||
Borrower Names(1): | Sugar Creek TIC Investors, LLC; Sugar Creek/EPG, LLC | Year Built/Renovated(6): | Various/NAP | ||||
| Sponsors: | Steven Yari; Gabriel Brener | Title Vesting: | Fee | ||||
| Mortgage Rate: | 4.710% | Property Manager: | Self-managed | ||||
| Note Date: | April 15, 2014 | 3rd Most Recent Occupancy (As of)(7): | 71.0% (12/31/2011) | ||||
| Anticipated Repayment Date: | NAP | 2nd Most Recent Occupancy (As of): | 91.2% (12/31/2012) | ||||
| Maturity Date: | May 1, 2024 | Most Recent Occupancy (As of): | 94.9% (12/31/2013) | ||||
| IO Period: | 60 months | Current Occupancy (As of)(8): | 95.0% (3/1/2014) | ||||
| Loan Term (Original): | 120 months | ||||||
| Seasoning: | 0 months | Underwriting and Financial Information: | |||||
| Amortization Term (Original): | 360 months | ||||||
| Loan Amortization Type: | Interest-only, Amortizing Balloon | 3rd Most Recent NOI (As of): | $3,620,233 (12/31/2011) | ||||
| Interest Accrual Method: | Actual/360 | 2nd Most Recent NOI (As of)(9): | $4,185,020 (12/31/2012) | ||||
| Call Protection: | L(24),D(92),O(4) | Most Recent NOI (As of)(9): | $5,909,340 (12/31/2013) | ||||
| Lockbox Type: | Hard/Upfront Cash Management | ||||||
Additional Debt(2): | Yes | ||||||
Additional Debt Type(2): | Mezzanine | U/W Revenues: | $10,773,649 | ||||
| U/W Expenses: | $4,489,587 | ||||||
Escrows and Reserves(3): | U/W NOI: | $6,284,062 | |||||
| U/W NCF: | $5,920,730 | ||||||
| Type: | Initial | Monthly | Cap (If Any) | U/W NOI DSCR(2): | 1.61x | ||
| Taxes | $379,930 | $75,896 | NAP | U/W NCF DSCR(2): | 1.52x | ||
| Insurance | $0 | Springing | NAP | U/W NOI Debt Yield(2): | 10.0% | ||
| Replacement Reserves | $0 | $6,820 | NAP | U/W NCF Debt Yield(2): | 9.5% | ||
| TI/LC | $212,955 | $8,834(4) | NAP | As-Is Appraised Value: | $83,500,000 | ||
| ICON Leasing Reserve | $0 | Springing | NAP | As-Is Appraisal Valuation Date: | March 17, 2014 | ||
| Noble Drilling Leasing Reserve | $0 | 35,334(3) | (3) | Cut-off Date LTV Ratio(2): | 75.0% | ||
| Debt Service Reserve | $0 | $75,000(5) | $900,000(3) | LTV Ratio at Maturity or ARD(2): | 68.9% | ||
| (1) | The borrower is comprised of two tenants-in-common (“TIC”). See “The Borrowers” section. |
| (2) | See “Subordinate and Mezzanine Indebtedness” section. The equity interests in the Sugar Creek I & II Mortgage Loan borrower have been pledged to secure non-pooled subordinate mezzanine indebtedness with a balance as of the Cut-off Date of $8,562,500. All LTV, DSCR, debt yield and Cut-off Date Balance Per SF numbers shown in the chart above are based solely on the $62,625,000 mortgage loan financing. As of the Cut-off Date, the combined U/W NCF DSCR is 1.22x (based on an 11% interest rate on the mezzanine indebtedness), the combined LTV ratio is 85.3% and the combined U/W NCF Debt Yield is 8.3%. |
| (3) | See “Escrows” section. |
| (4) | The Monthly TI/LC reserve may increase from $8,834 initially to $44,168 based on the conditions outlined in the “Escrows” section. |
| (5) | Monthly deposits will commence June 1, 2018 based on the conditions outlined in the “Escrows” section. |
| (6) | The Sugar Creek I & II Property comprises two buildings that were built in 2000 and 2008. |
| (7) | See “Historical Occupancy” section. |
| (8) | One tenant comprising 3,615 square feet (0.9% of net rentable square feet) is not in occupancy and has not yet commenced rental payments. Current occupancy excluding this tenant is 94.1%. |
| (9) | See “Cash Flow Analysis” section for details on the increase from 2nd Most Recent NOI to Most Recent NOI. |
The Mortgage Loan. The mortgage loan (the “Sugar Creek I & II Mortgage Loan”) is evidenced by a single promissory note that is secured by a first mortgage encumbering two adjacent office buildings located in Sugar Land, Texas (the “Sugar Creek I & II Property”). The Sugar Creek I & II Mortgage Loan was originated on April 15, 2014 by Wells Fargo Bank, National Association. The Sugar Creek I & II Mortgage Loan had an original principal balance of $62,625,000, has an outstanding principal balance as of the Cut-off Date of $62,625,000 and accrues interest at an interest rate of 4.710% per annum. The Sugar Creek I & II Mortgage Loan had an initial term of 120 months, has a remaining term of 120 months as of the Cut-off Date and requires payments of interest-only for the first 60 payments following origination and, thereafter, requires payments of principal and interest based on a 30-year amortization schedule. The Sugar Creek I & II Mortgage Loan matures on May 1, 2024.
THE INFORMATION IN THIS STRUCTURAL AND COLLATERAL TERM SHEET IS NOT COMPLETE AND MAY BE AMENDED PRIOR TO THE TIME OF SALE. THIS TERM SHEET IS NOT AN OFFER TO SELL THESE SECURITIES AND IT IS NOT A SOLICITATION OF AN OFFER TO BUY THESE SECURITIES IN ANY JURISDICTION WHERE THE OFFER OR SALE IS NOT PERMITTED.
60
| SUGAR CREEK I & II |
Following the lockout period, the borrowers have the right to defease the Sugar Creek I & II Mortgage Loan in whole, but not in part, on any due date before February 1, 2024. In addition, the Sugar Creek I & II Mortgage Loan is prepayable without penalty on or after February 1, 2024.
Sources and Uses
| Sources | Uses | |||||||||
| Original loan amount | $62,625,000 | 74.0 | % | Purchase Price | $82,750,000 | 97.8 | % | |||
| Mezzanine Loan | 8,562,500 | 10.1 | Reserves | 592,885 | 0.7 | |||||
| Sponsor’s new cash contribution | 13,430,667 | 15.9 | Closing costs | 1,275,282 | 1.5 | |||||
| Total Sources | $84,618,167 | 100.0 | % | Total Uses | $84,618,167 | 100.0 | % |
The Property. The Sugar Creek I & II Property is comprised of two adjacent eight-story class A office buildings situated on approximately 11.6 acres located in Sugar Land, Texas, approximately 19 miles southwest of the Houston central business district. The Sugar Creek I building was constructed in 2000, contains 204,377 square feet and is currently 97.5% leased to six tenants. The Sugar Creek II building was constructed in 2008, features 204,791 square feet and is currently 92.5% leased to 18 tenants. Amenities at the Sugar Creek I & II Property include a fitness center, deli (with catering), on-site bank with drive-thru, 24-hour security and a building conference center. The Sugar Creek I & II Property also features a four-story, 1,198 space parking garage, in addition to 326 surface spaces, resulting in a total parking ratio of 3.7 spaces per 1,000 square feet of net rentable area.
Investment-grade rated tenants comprise 62.8% of the net rentable square feet and 65.0% of the annual underwritten base rent at the Sugar Creek I & II Property. Noble Drilling Services’ (“Noble”; NYSE: NE) U.S. headquarters are located at the Sugar Creek I & II Property, occupying 82.1% of the rentable square feet at the Sugar Creek I building (along with 8,725 square feet at the Sugar Creek II building). Noble is an offshore drilling contractor for the oil and gas industry; it performs contract drilling services with a fleet of 79 offshore drilling units (including five ultra-deepwater rigs and six jackup drilling rigs currently under construction). Additionally, Noble houses its corporate aircraft at the Sugar Land Regional Airport, approximately 3.5 miles west of the Sugar Creek I & II Property. Also, Team, Inc. (NYSE: TISI), an industrial services company providing inspection and assessment services for energy companies, operates its corporate headquarters at the Sugar Creek I & II Property. As of March 1, 2014 the Sugar Creek I & II Property was 95.0% leased to 22 tenants.
THE INFORMATION IN THIS STRUCTURAL AND COLLATERAL TERM SHEET IS NOT COMPLETE AND MAY BE AMENDED PRIOR TO THE TIME OF SALE. THIS TERM SHEET IS NOT AN OFFER TO SELL THESE SECURITIES AND IT IS NOT A SOLICITATION OF AN OFFER TO BUY THESE SECURITIES IN ANY JURISDICTION WHERE THE OFFER OR SALE IS NOT PERMITTED.
61
| SUGAR CREEK I & II |
The following table presents certain information relating to the tenancy at the Sugar Creek I & II Property:
Major Tenants
| Tenant Name | Credit Rating (Fitch/ Moody’s/ S&P)(1) | Tenant NRSF | % of NRSF | Annual U/W Base Rent PSF(2) | Annual U/W Base Rent(2) | % of Total Annual U/W Base Rent | Lease Expiration Date | |||||||||
| Major Tenants | ||||||||||||||||
| Noble Drilling Services, Inc. | BBB+/Baa2/BBB+ | 176,461 | 43.1% | $17.38 | $3,067,028 | 43.7% | Various(3) | |||||||||
| United Healthcare Services, Inc. | A/A3/A | 52,984 | 12.9% | $19.00 | $1,006,696 | 14.4% | 4/30/2019(4) | |||||||||
| ICON Clinical Research, Inc. | NR/NR/NR | 51,781(5) | 12.7% | $19.00 | $983,839 | 14.0% | 1/31/2017 | |||||||||
| Team, Inc. | NR/NR/NR | 26,492 | 6.5% | $18.50 | $490,102 | 7.0% | 5/31/2023(6) | |||||||||
| Merrill Lynch, Pierce, Fenner and Smith Incorporated | A/Baa2/NR | 13,671 | 3.3% | $17.50 | $239,243 | 3.4% | 8/31/2018(7) | |||||||||
| Total Major Tenants | 321,389 | 78.5% | $18.01 | $5,786,908 | 82.5% | |||||||||||
Non-Major Tenants(8) | 67,257 | 16.4% | $18.25 | $1,227,315 | 17.5% | |||||||||||
| Occupied Collateral Total | 388,646 | 95.0% | $18.05 | $7,014,223 | 100.0% | |||||||||||
| Vacant Space | 20,522 | 5.0% | ||||||||||||||
| Collateral Total | 409,168 | 100.0% | ||||||||||||||
| (1) | Certain ratings are those of the parent company whether or not the parent guarantees the lease. |
| (2) | Annual U/W Base Rent PSF and Annual U/W Base Rent include contractual rent steps through February 2015. |
| (3) | Noble occupies 18 spaces totaling 167,736 square feet (41.0% of net rentable square feet) with a lease expiration date of January 31, 2020 and one space totaling 8,725 square feet (2.1% of net rentable square feet) with a lease expiration date of July 31, 2014. |
| (4) | United Healthcare Services, Inc. has the right to terminate its lease on April 30, 2017 with nine months’ notice and the payment of a termination fee equal to three months’ base rent plus unamortized tenant improvements and leasing commissions (“TI/LCs”). |
| (5) | ICON Clinical Research, Inc. is not fully utilizing their eighth floor space, totaling 25,289 net rentable square feet (6.2% of net rentable square feet). A reserve of $250,000 is required to be deposited by the borrower on June 1, 2015 and June 1, 2016 ($500,000 total), representing anticipated TI/LCs for the space. See “Escrows” section. |
| (6) | Team, Inc. has the right to terminate its lease if the tenant requests an additional 10,000 square feet of space and the borrowers cannot provide it within 180 days. In addition, Team, Inc. has the right to terminate its lease on November 30, 2019 with one years’ notice and the payment of a termination fee equal to three months’ base rent plus unamortized TI/LCs. |
| (7) | Merrill Lynch, Pierce, Fenner and Smith Incorporated has the right to terminate its lease on September 1, 2016 with nine months notice and the payment of a termination fee equal to three months’ base rent plus unamortized TI/LCs. |
| (8) | One tenant comprising 3,615 square feet (0.9% of net rentable square feet) is not in occupancy and has not yet commenced rental payments. Current occupancy excluding this tenant is 94.1%. |
THE INFORMATION IN THIS STRUCTURAL AND COLLATERAL TERM SHEET IS NOT COMPLETE AND MAY BE AMENDED PRIOR TO THE TIME OF SALE. THIS TERM SHEET IS NOT AN OFFER TO SELL THESE SECURITIES AND IT IS NOT A SOLICITATION OF AN OFFER TO BUY THESE SECURITIES IN ANY JURISDICTION WHERE THE OFFER OR SALE IS NOT PERMITTED.
62
| SUGAR CREEK I & II |
The following table presents certain information relating to the lease rollover schedule at the Sugar Creek I & II Property:
Lease Expiration Schedule(1)(2)
Year Ending December 31, | No. of Leases Expiring | Expiring NRSF | % of Total NRSF | Cumulative Expiring NRSF | Cumulative % of Total NRSF | Annual U/W Base Rent | Annual U/W Base Rent PSF(3) | ||||||||
| MTM | 0 | 0 | 0.0% | 0 | 0.0% | $0 | $0.00 | ||||||||
| 2014 | 4 | 12,936 | 3.2% | 12,936 | 3.2% | $255,985 | $19.79 | ||||||||
| 2015 | 3 | 11,523 | 2.8% | 24,459 | 6.0% | $197,694 | $17.16 | ||||||||
| 2016 | 7 | 22,423 | 5.5% | 46,882 | 11.5% | $413,205 | $18.43 | ||||||||
| 2017 | 7 | 67,262 | 16.4% | 114,144 | 27.9% | $1,254,586 | $18.65 | ||||||||
| 2018 | 1 | 13,671 | 3.3% | 127,815 | 31.2% | $239,243 | $17.50 | ||||||||
| 2019 | 4 | 66,603 | 16.3% | 194,418 | 47.5% | $1,270,880 | $19.08 | ||||||||
| 2020 | 18 | 167,736 | 41.0% | 362,154 | 88.5% | $2,892,528 | $17.24 | ||||||||
| 2021 | 0 | 0 | 0.0% | 362,154 | 88.5% | $0 | $0.00 | ||||||||
| 2022 | 0 | 0 | 0.0% | 362,154 | 88.5% | $0 | $0.00 | ||||||||
| 2023 | 2 | 26,492 | 6.5% | 388,646 | 95.0% | $490,102 | $18.50 | ||||||||
| 2024 | 0 | 0 | 0.0% | 388,646 | 95.0% | $0 | $0.00 | ||||||||
| Thereafter | 0 | 0 | 0.0% | 388,646 | 95.0% | $0 | $0.00 | ||||||||
| Vacant | 0 | 20,522 | 5.0% | 409,168 | 100.0% | $0 | $0.00 | ||||||||
| Total/Weighted Average | 46(4) | 409,168 | 100.0% | $7,014,223 | $18.05 |
| (1) | Information obtained from the underwritten rent roll. |
| (2) | Certain tenants may have lease termination options that are exercisable prior to the originally stated expiration date of the subject lease and that are not considered in the Lease Expiration Schedule. |
| (3) | Weighted Average Annual U/W Base Rent PSF excludes vacant space. |
| (4) | Multiple tenants operate under more than one lease. There are 22 tenants and 46 leases. |
The following table presents historical occupancy percentages at the Sugar Creek I & II Property:
Historical Occupancy
12/31/2011(1)(2) | 12/31/2012(1) | 12/31/2013(1) | 3/1/2014(3) | |||
| 87.3% | 94.9% | 96.1% | 95.0% |
| (1) | Information obtained from the borrowers. |
| (2) | The Sugar Creek II building was built in 2008 and was still undergoing lease-up in 2011; average monthly occupancy for 2011 was 71.0%. |
| (3) | Information obtained from the underwritten rent roll. |
Operating History and Underwritten Net Cash Flow. The following table presents certain information relating to the historical operating performance and Underwritten Net Cash Flow at the Sugar Creek I & II Property:
Cash Flow Analysis
| 2011 | 2012 | 2013(1) | U/W | U/W $ per SF | |||||||
| Base Rent | $4,681,655 | $5,675,745 | $6,442,639 | $7,014,223 | $17.14 | ||||||
| Grossed Up Vacant Space | 0 | 0 | 0 | 389,918 | 0.95 | ||||||
| Total Reimbursables | 2,167,186 | 2,431,774 | 3,221,127 | 3,812,588 | 9.32 | ||||||
| Other Income | 214,713 | 225,466 | 238,101 | 238,101 | 0.58 | ||||||
| Less Vacancy & Credit Loss | (40,982) | (644,555) | (223,102) | (681,181)(2) | (1.66) | ||||||
| Effective Gross Income | $7,022,572 | $7,688,430 | $9,678,765 | $10,773,649 | $26.33 | ||||||
| Total Operating Expenses | $3,402,339 | $3,503,410 | $3,769,425 | $4,489,587 | $10.97 | ||||||
| Net Operating Income | $3,620,233 | $4,185,020 | $5,909,340 | $6,284,062 | $15.36 | ||||||
| TI/LC | 0 | 0 | 0 | 281,498 | 0.69 | ||||||
| Capital Expenditures | 0 | 0 | 0 | 81,834 | 0.20 | ||||||
| Net Cash Flow | $3,620,233 | $4,185,020 | $5,909,340 | $5,920,730 | $14.47 | ||||||
| NOI DSCR | 0.93x | 1.07x | 1.51x | 1.61x | |||||||
| NCF DSCR | 0.93x | 1.07x | 1.51x | 1.52x | |||||||
| NOI DY | 5.8% | 6.7% | 9.4% | 10.0% | |||||||
| NCF DY | 5.8% | 6.7% | 9.4% | 9.5% | |||||||
| (1) | Increase in Effective Gross Income from 2012 to 2013 is primarily attributable to new leases signed with United Healthcare Services, Inc., Team, Inc., New York Life Insurance Company and Noble expansion. These tenants totaled 96,669 square feet (23.6% of rentable area) and $1.8 million in annualized base rent (25.6% of Annual U/W Base Rent). |
| (2) | The underwritten economic vacancy is 9.2%. The Sugar Creek I & II Property was 95.0% physically occupied as of March 1, 2014. |
THE INFORMATION IN THIS STRUCTURAL AND COLLATERAL TERM SHEET IS NOT COMPLETE AND MAY BE AMENDED PRIOR TO THE TIME OF SALE. THIS TERM SHEET IS NOT AN OFFER TO SELL THESE SECURITIES AND IT IS NOT A SOLICITATION OF AN OFFER TO BUY THESE SECURITIES IN ANY JURISDICTION WHERE THE OFFER OR SALE IS NOT PERMITTED.
63
| SUGAR CREEK I & II |
Appraisal. As of the appraisal valuation date of March 17, 2014, the Sugar Creek I & II Property had an “as-is” appraised value of $83,500,000.
Environmental Matters. According to the Phase I environmental report dated March 20, 2014, there was no evidence of any recognized environmental conditions at the Sugar Creek I & II Property.
Market Overview and Competition. The Sugar Creek I & II Property is located in Sugar Land, Texas, near the intersection of Highway 90 and the Southwest Freeway (U.S. Highway 59), which provides direct access to the Houston central business district approximately 19 miles to the northeast. U.S. Highway 59 links Sugar Land directly with four of the largest employment centers in Houston – Westchase, Galleria/Upton, Greenway Plaza and the Houston central business district. Further, the Sugar Creek I & II Property is located 3.5 miles east of the Sugar Land Regional Airport. Since 1990, the Sugar Land Regional Airport has undergone approximately $100 million in expansions; is the fourth largest airport in the Houston metro area; and a $10 million relocation of a main runway is expected to increase commuter services. The City of Sugar Land has an active economic development department that helped secure the relocation of Coca-Cola’s Minute Maid headquarters from the Galleria submarket in 2009. Minute Maid leased 115,000 square feet and relocated 250 jobs to Sugar Land.
Over the last seven years, popular media outlets have named Sugar Land one of America’s safest cities and one of the best affordable suburbs in the U.S. The 1,200 acre Sugar Creek master-planned community is located adjacent to the Sugar Creek I & II Property. The community features two private country clubs, each with a 27-hole and 18-hole golf course, and is home to 1,592 households. The Sugar Creek I & II Property is three miles north of Sugar Land Town Square, which includes over 500,000 square feet of office space with structured parking, a 250,000 square foot lifestyle retail development, a 300-room full-service Marriott hotel, a 55,000 square foot convention center, a variety of restaurants, and a 167 unit mid-rise luxury condominium community. According to the appraisal, as of 2013, the population within a three- and five-mile radius of the Sugar Creek I & II Property was 89,447 and 302,962, respectively. The estimated average household income within the same three- and five-mile radius was $88,450 and $84,059, respectively. According to a third party market research report, the Sugar Creek I & II Property is located in the East Fort Bend County/Sugar Land office submarket of Houston. As of year-end 2013, the submarket reported an inventory of 9.4 million square feet with a 12.8% vacancy rate; a 13.1% vacancy rate for class A space and an average lease rate of $26.72 per square foot, on a gross basis. Rents at the Sugar Creek I & II Property are quoted on triple-net basis; the Weighted Average Annual U/W Base Rent PSF on a gross-basis at the Sugar Creek I & II Property equals $27.37 per square foot, inclusive of $9.32 per square foot in reimbursements.
The following table presents certain information relating to comparable office properties for the Sugar Creek I & II Property:
Competitive Set(1)
Sugar Creek I & II (Subject) | Comerica Bank Building | 101 Parklane Blvd | Three Sugar Creek | Two Sugar Creek Center | Sugar Creek Place II | |||||||
| Location | Sugar Land, TX | Sugar Land, TX | Sugar Land, TX | Sugar Land, TX | Sugar Land, TX | Sugar Land, TX | ||||||
| Distance from Subject | -- | 0.5 miles | 0.4 miles | 0.5 miles | 0.7 miles | 0.9 miles | ||||||
| Property Type | Office | Office | Office | Office | Office | Office | ||||||
| Year Built/Renovated | Various | 1983/NAV | 2008/NAV | 2007/NAV | 1999/NAV | 2001/NAV | ||||||
| Stories | 8 | 11 | 3 | 6 | 6 | 4 | ||||||
| Total GLA | 409,168 SF | 192,111 SF | 36,980 SF | 153,345 SF | 143,410 SF | 69,104 SF | ||||||
| Total Occupancy | 95% | 95% | 82% | 79% | 85% | 76% |
| (1) | Information obtained from the appraisal. |
The Borrowers. The borrowers are Sugar Creek TIC Investors, LLC and Sugar Creek/EPG, LLC, as tenants in common. Both borrowers are single purpose entities each with two independent directors. Legal counsel to the borrowers delivered a non-consolidation opinion in connection with the origination of the Sugar Creek I & II Mortgage Loan. Steven Yari and Gabriel Brener are the guarantors of certain nonrecourse carveouts under the Sugar Creek I & II Mortgage Loan. Gabriel Brener is the guarantor of only the recourse carveouts for losses related to bankruptcy filings and permitted transfer provisions.
The Sponsor. The loan sponsors are Steven Yari and Gabriel Brener. Steven Yari is the co-founder of Triyar Companies and managing partner of Stockdale Capital Partners. Mr. Yari has established a diversified portfolio represented by high-rise commercial and residential buildings, industrial business centers, enclosed shopping malls, retail centers, hotels and single family housing tracts representing nearly $500 million in total transaction value for a family portfolio of over $1.25 billion in asset value. As of December 31, 2012, Mr. Yari’s commercial real estate portfolio consisted of 33 properties (including the Sugar Creek I & II Property) totaling approximately 3.5 million square feet. Gabriel Brener has been the Chairman and Chief Executive Officer of Brener International Group LLC since 1998. At Brener International Group, Mr. Brener coordinates deal sourcing, manages daily operations and determines all major investment decisions. Brener International Group is also a part owner of Major League Soccer’s Houston Dynamo. Mr. Brener is also the President, Chief Executive Officer, and Chairman of the Board of Directors of Azteca Acquisition Holdings, LLC. Steven Yari has been involved in numerous defaults, deeds-in-lieu of foreclosure and restructurings and also one tax lien. See “Description of the Mortgage Pool – Default History, Bankruptcy Issues and Other Proceedings” and “Description of the Mortgage Loan Pool – Litigation Considerations” in the Free Writing Prospectus.
Escrows. The loan documents provide for an upfront reserve in the amount of $379,930 for real estate taxes and $212,955 for outstanding TI/LC obligations ($144,600 for Bank of America and $68,355 for Merrill Lynch, Pierce Fenner & Smith Incorporated). The
THE INFORMATION IN THIS STRUCTURAL AND COLLATERAL TERM SHEET IS NOT COMPLETE AND MAY BE AMENDED PRIOR TO THE TIME OF SALE. THIS TERM SHEET IS NOT AN OFFER TO SELL THESE SECURITIES AND IT IS NOT A SOLICITATION OF AN OFFER TO BUY THESE SECURITIES IN ANY JURISDICTION WHERE THE OFFER OR SALE IS NOT PERMITTED.
64
| SUGAR CREEK I & II |
loan documents provide for ongoing monthly reserves in the amount of $75,896 for real estate taxes and $6,820 for replacement reserves. Monthly TI/LC reserves are required in the amount of $8,834 on each monthly payment date prior to January 1, 2018, $17,667 from January 1, 2018 through December 31, 2018 and from January 1, 2019 through Sugar Creek I & II Mortgage Loan maturity, either (i) $8,834 if Noble has not extended their lease and the Noble space has not been released to acceptable replacement tenants, or (ii) if Noble has extended their lease or the Noble space has been released to acceptable replacement tenants, the lesser of (x) $44,168 and (y) the amount by which the TI/LC reserve plus the Noble Drilling Leasing Reserve plus the debt service reserve are less than $3,500,000 in aggregate. Additionally, any excess cash flow in addition to the amount required to be deposited in the Noble Drilling Leasing Reserve (as described below) shall be deposited in the general TI/LC reserve.
The loan documents require a deposit in an amount equal to $250,000 into the ICON leasing reserve on June 1, 2015 and unless the ICON space (51,781 square feet, 12.7% of net rentable square feet) has been re-tenanted and the new tenant(s) is in occupancy and paying full rent, an additional $250,000 on June 1, 2016 for TI/LC costs. The loan documents require a monthly Noble Drilling Leasing Reserve in an amount equal to $35,334 on each monthly payment date prior to January 1, 2018 and $70,667 on each monthly payment date on or after January 1, 2018 until such time Noble extends or terminates its lease or the Noble space has been released to acceptable replacement tenants. If, at the time of Noble’s lease expiration (January 31, 2020), the balance in the Noble Drilling Leasing Reserve (together with any funds from a cash flow sweep triggered by Noble, as further described in the “Lockbox and Cash Management” section) does not equal $23.00 per square foot of Noble square footage expiring or being terminated, the borrowers will be required to deposit a sum so that amount is achieved. If Noble has extended its lease pursuant to its lease renewal option or pursuant to a modified lease acceptable to lender, or if the Noble space has been released to one or more acceptable replacement tenants subject to terms acceptable to the lender, deposits into the Noble Drilling Leasing Reserve will not be required. The loan documents require a monthly debt service reserve beginning June 1, 2018 in an amount equal to $75,000 per month until the earlier to occur of (i) a Noble lease extension or if the Noble space has been released to one or more acceptable replacement tenants subject to terms acceptable to the lender or (ii) June 1, 2019. Further, if Noble fails to renew its’ lease or terminates its’ lease as a result of a bankruptcy or insolvency proceeding, the borrower is required to deposit an additional $900,000.
The loan documents do not require monthly escrows for insurance provided (i) no event of default has occurred and is continuing; (ii) the insurance required to be maintained by the borrowers is maintained pursuant to one or more blanket insurance policies; and (iii) the borrowers provide the lender with timely proof of payment of insurance premiums.
Lockbox and Cash Management. The Sugar Creek I & II Mortgage Loan requires a lender-controlled lockbox account, which is already in place, and that the borrowers direct the tenants to pay their rents directly into such lockbox account. The loan documents also require that all cash revenues and all other monies received by the borrowers or manager relating to the Sugar Creek I & II Property be deposited into the lockbox account within two business days after receipt. Prior to the occurrence of a Cash Trap Event Period (as defined below), all excess funds on deposit in the lockbox account are swept into the borrowers’ operating account on a monthly basis. During a Cash Trap Event Period, all funds on deposit in the lockbox account are swept to a lender-controlled cash management account on a monthly basis.
A “Cash Trap Event Period” will commence upon the earlier of (i) the occurrence and continuance of an event of default on the Sugar Creek I & II Mortgage Loan or the Sugar Creek I & II Mezzanine Loan (as defined below) or (ii) Noble (or an acceptable replacement tenant(s)) (a) declaring bankruptcy or being subject to a similar insolvency proceeding, (b) Noble failing to exercise its lease extension option on or before January 1, 2019 or (c) the occurrence of a default under the Noble lease or if the Noble space has been released to one or more acceptable replacement tenants, a default under the replacement tenant(s) lease(s) that continues beyond any applicable notice and cure period.
A Cash Trap Event Period will end, with regard to clause (i), upon the cure of such event of default and with regard to clause (ii), in the case of clause (a) Noble (or the acceptable replacement tenant(s)) has emerged from bankruptcy or the insolvency proceeding has been terminated and Noble (or the acceptable replacement tenant(s)) has affirmed the lease; in the case of clause (b) if Noble has extended their lease pursuant to their lease renewal option or pursuant to a modified lease acceptable to lender; or if the Noble space has been released to one or more acceptable replacement tenants subject to terms acceptable to the lender, and in the case of clause (c), cure of the default under the Noble lease (or the acceptable replacement tenant(s) lease(s)). A Cash Trap Event Period will also end with regard to clause (ii) in the event the net cash flow is equal to or greater than $5,340,000 for two consecutive calendar quarters.
Property Management. The Sugar Creek I & II Property is managed by an affiliate of the borrowers.
Assumption. The borrowers have a two-time right to transfer the Sugar Creek I & II Property, provided that no event of default has occurred and is continuing and certain other conditions are satisfied, including (i) the lender’s reasonable determination that the proposed transferee and guarantor satisfy the lender’s credit review and underwriting standards, taking into consideration transferee experience, financial strength and general business standing; (ii) execution of a recourse guaranty and an environmental indemnity by an affiliate of the transferee; and (iii) if requested by the lender, rating agency confirmation from DBRS, KBRA and Moody’s that the transfer will not result in a downgrade, withdrawal or qualification of the respective ratings assigned to the Series 2014-C20 Certificates.
Partial Release. Not permitted.
Real Estate Substitution. Not permitted.
Subordinate and Mezzanine Indebtedness. Mach I Hillcrest Lender, LLC (the “Sugar Creek I & II Mezzanine Lender”) has made a $8,562,500 mezzanine loan (the “Sugar Creek I & II Mezzanine Loan”) to Carolwood Sugar Creek Mezz Borrower, LLC and Sugar
THE INFORMATION IN THIS STRUCTURAL AND COLLATERAL TERM SHEET IS NOT COMPLETE AND MAY BE AMENDED PRIOR TO THE TIME OF SALE. THIS TERM SHEET IS NOT AN OFFER TO SELL THESE SECURITIES AND IT IS NOT A SOLICITATION OF AN OFFER TO BUY THESE SECURITIES IN ANY JURISDICTION WHERE THE OFFER OR SALE IS NOT PERMITTED.
65
| SUGAR CREEK I & II |
Creek/EPG Mezz Borrower, LLC, both limited liability companies that collectively own 100% of the borrowers under the Sugar Creek I & II Mortgage Loan, which is secured by a pledge by Carolwood Sugar Creek Mezz Borrower, LLC and Sugar Creek/EPG Mezz Borrower, LLC of 100% of their limited liability interests in the borrowers under the Sugar Creek I & II Mortgage Loan. The Sugar Creek I & II Mezzanine Loan accrues interest at an interest rate of 11.000% per annum and requires payments of interest-only for the entire term. The Sugar Creek I & II Mezzanine Loan borrowers may elect to defer and accrue interest of up to 3.000% per annum over the first five years of the Sugar Creek I & II Mezzanine Loan. The rights of the Sugar Creek I & II Mezzanine Lender are further described under “Description of the Mortgage Pool—Subordinate and/or Other Financing—Existing (Secured Financing and Mezzanine and Similar Financing)” in the Free Writing Prospectus.
Ground Lease. None.
Terrorism Insurance. The loan documents require that the “all risk” insurance policy required to be maintained by the borrowers provide coverage for terrorism in an amount equal to the full replacement cost of the Sugar Creek I & II Property; provided, however, that the borrowers will not be required to spend more than 200% of the cost of property coverage immediately prior to the date that the Terrorism Risk Insurance Act or a similar government backstop is no longer in effect. The loan documents also require business interruption insurance covering no less than the 18-month period following the occurrence of a casualty event, together with a six-month extended period of indemnity.
THE INFORMATION IN THIS STRUCTURAL AND COLLATERAL TERM SHEET IS NOT COMPLETE AND MAY BE AMENDED PRIOR TO THE TIME OF SALE. THIS TERM SHEET IS NOT AN OFFER TO SELL THESE SECURITIES AND IT IS NOT A SOLICITATION OF AN OFFER TO BUY THESE SECURITIES IN ANY JURISDICTION WHERE THE OFFER OR SALE IS NOT PERMITTED.
66
(THIS PAGE INTENTIONALLY LEFT BLANK)
67
| ROCKWELL – ARINC HQ |
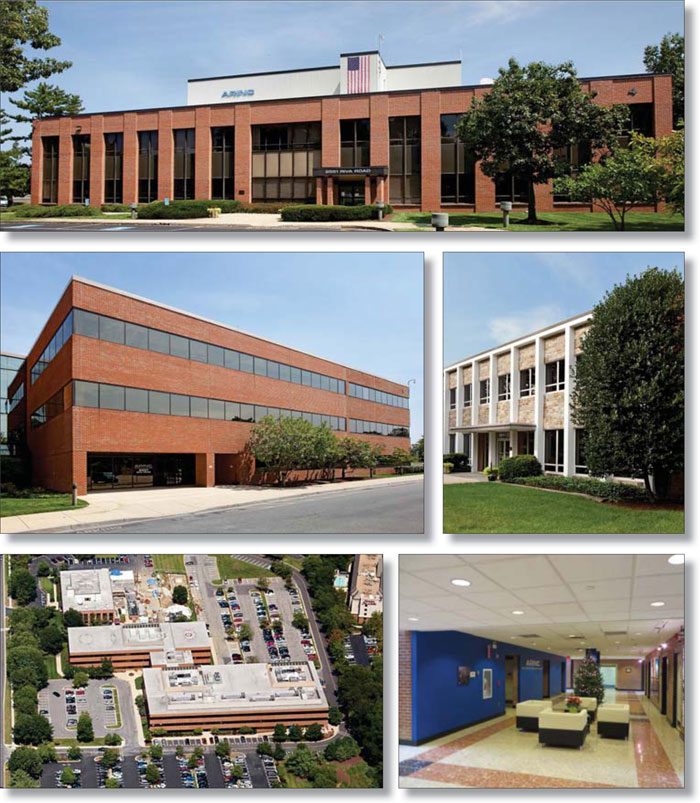
THE INFORMATION IN THIS STRUCTURAL AND COLLATERAL TERM SHEET IS NOT COMPLETE AND MAY BE AMENDED PRIOR TO THE TIME OF SALE. THIS TERM SHEET IS NOT AN OFFER TO SELL THESE SECURITIES AND IT IS NOT A SOLICITATION OF AN OFFER TO BUY THESE SECURITIES IN ANY JURISDICTION WHERE THE OFFER OR SALE IS NOT PERMITTED.
68
| ROCKWELL – ARINC HQ |
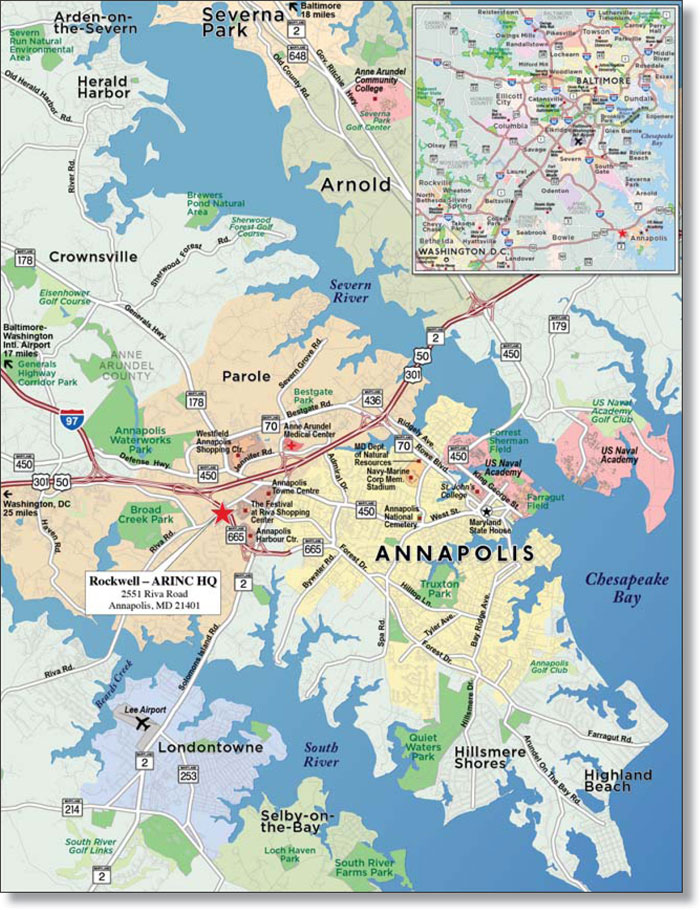
THE INFORMATION IN THIS STRUCTURAL AND COLLATERAL TERM SHEET IS NOT COMPLETE AND MAY BE AMENDED PRIOR TO THE TIME OF SALE. THIS TERM SHEET IS NOT AN OFFER TO SELL THESE SECURITIES AND IT IS NOT A SOLICITATION OF AN OFFER TO BUY THESE SECURITIES IN ANY JURISDICTION WHERE THE OFFER OR SALE IS NOT PERMITTED.
69
| No. 5 – Rockwell - ARINC HQ | |||||||
| Loan Information | Property Information | ||||||
| Mortgage Loan Seller: | The Royal Bank of Scotland | Single Asset/Portfolio: | Single Asset | ||||
Credit Assessment (DBRS/KBRA/Moody’s): | (A (low)/NR/NR) | Property Type: | Office | ||||
| Original Principal Balance: | $48,545,500 | Specific Property Type: | CBD | ||||
| Cut-off Date Principal Balance: | $48,545,500 | Location: | Annapolis, MD | ||||
| % of Initial Pool Balance: | 3.9% | Size: | 271,303 SF | ||||
| Loan Purpose: | Acquisition | Cut-off Date Principal Balance Per SF: | $178.93 | ||||
| Borrower Name: | AGNL Datalink, L.L.C. | Year Built/Renovated: | 1969/2013 | ||||
| Sponsors: | AG Net Lease III Corp.; AG Net Lease III (SO) Corp. | Title Vesting: | Fee | ||||
| Mortgage Rate: | 4.550% | Property Manager: | Tenant-managed | ||||
| Note Date: | March 28, 2014 | 3rd Most Recent Occupancy (As of): | 100.0% (12/31/2011) | ||||
| Anticipated Repayment Date: | April 6, 2024 | 2nd Most Recent Occupancy (As of): | 100.0% (12/31/2012) | ||||
| Maturity Date: | April 6, 2044 | Most Recent Occupancy (As of): | 100.0% (12/31/2013) | ||||
| IO Period: | 60 months | Current Occupancy (As of): | 100.0% (5/1/2014) | ||||
| Loan Term (Original): | 120 months | ||||||
| Seasoning: | 1 month | Underwriting and Financial Information: | |||||
| Amortization Term (Original): | 360 months | ||||||
| Loan Amortization Type: | Interest-only, Amortizing ARD | 3rd Most Recent NOI(3): | NAV | ||||
| Interest Accrual Method: | Actual/360 | 2nd Most Recent NOI(3): | NAV | ||||
| Call Protection: | L(25),GRTR 1% or YM(88),O(7) | Most Recent NOI(3): | NAV | ||||
| Lockbox Type: | Hard/Springing Cash Management | ||||||
Additional Debt(1): | Yes | ||||||
Additional Debt Type(1): | Future Mezzanine | ||||||
U/W Revenues(4): | $6,412,636 | ||||||
U/W Expenses(4): | $192,379 | ||||||
U/W NOI(4): | $6,220,257 | ||||||
U/W NCF(4): | $6,152,431 | ||||||
U/W NOI DSCR(4): | 2.10x | ||||||
Escrows and Reserves(2): | U/W NCF DSCR(4): | 2.07x | |||||
U/W NOI Debt Yield(4): | 12.8% | ||||||
Type: | Initial | Monthly | Cap (If Any) | U/W NCF Debt Yield(4): | 12.7% | ||
| Taxes | $0 | Springing | NAP | As-Is Appraised Value: | $73,200,000 | ||
| Insurance | $0 | Springing | NAP | As-Is Appraisal Valuation Date: | February 7, 2014 | ||
| Replacement Reserve | $0 | Springing | $750,000 | Cut-off Date LTV Ratio: | 66.3% | ||
| TI/LC Reserve | $0 | Springing | $1,500,000 | LTV Ratio at Maturity or ARD: | 60.7% | ||
| (1) | See “Subordinate and Mezzanine Indebtedness” section. |
| (2) | See “Escrows” section. |
| (3) | No historical financial information is available as the borrower recently acquired the property and the tenant is responsible for all operating expenses. The Rockwell - ARINC HQ Property has been 100% occupied by ARINC, Inc. since each building was constructed. The ARINC lease commenced in 2004. |
| (4) | See “Cash Flow Analysis” section. |
The Mortgage Loan. The mortgage loan (the “Rockwell - ARINC HQ Mortgage Loan”) is evidenced by a single promissory note secured by a first mortgage encumbering three buildings of a six-building office complex and a parcel to the east that will be used for parking located in Annapolis, Maryland (the “Rockwell - ARINC HQ Property”). The Rockwell - ARINC HQ Mortgage Loan was originated on March 28, 2014 by The Royal Bank of Scotland. The Rockwell - ARINC HQ Mortgage Loan had an original principal balance of $48,545,500, has an outstanding principal balance as of the Cut-off Date of $48,545,500 and accrues interest at an interest rate of 4.550% per annum. The Rockwell - ARINC HQ Mortgage Loan had an initial term of 120 months, has a remaining term of 119 months as of the Cut-off Date, and requires interest only payments for the first 60 payments following origination, and thereafter, requires payments of principal and interest based on a 30-year amortization schedule. The Anticipated Repayment Date (“ARD”) is April 6, 2024, and the final maturity date is April 6, 2044. If the Rockwell - ARINC HQ Mortgage Loan is not paid in full on or before the ARD, the Rockwell - ARINC HQ Mortgage Loan will have a remaining term of 240 months and will accrue interest at a rate equal to the greater of (i) 7.550% and (ii) the interpolated 20-year treasury rate as of the ARD plus 3.0%. The failure of the borrower to pay the outstanding principal balance of the Rockwell - ARINC HQ Mortgage Loan on the ARD will trigger a full cash flow sweep whereby all excess cash flow will be used to pay down the principal balance.
Following the lockout period, the borrower has the right to prepay the Rockwell - ARINC HQ Mortgage Loan in whole, but not in part, provided that the borrower pays the greater of a yield maintenance premium or a prepayment premium equal to 1.0% of the principal
THE INFORMATION IN THIS STRUCTURAL AND COLLATERAL TERM SHEET IS NOT COMPLETE AND MAY BE AMENDED PRIOR TO THE TIME OF SALE. THIS TERM SHEET IS NOT AN OFFER TO SELL THESE SECURITIES AND IT IS NOT A SOLICITATION OF AN OFFER TO BUY THESE SECURITIES IN ANY JURISDICTION WHERE THE OFFER OR SALE IS NOT PERMITTED.
70
| ROCKWELL – ARINC HQ |
amount being prepaid, on any date prior to October 6, 2023. In addition, the Rockwell - ARINC HQ Mortgage Loan is prepayable without penalty on or after October 6, 2023.
Sources and Uses
| Sources | Uses | |||||||||
| Original loan amount | $48,545,500 | 63.1 | % | Purchase price | $76,508,600 | 99.4 | % | |||
| Sponsor’s new cash contribution | 28,417,347 | 36.9 | Closing costs | 454,247 | 0.6 | |||||
| Total Sources | $76,962,847 | 100.0 | % | Total Uses | $76,962,847 | 100.0 | % |
The Property. The Rockwell - ARINC HQ Property serves as ARINC, Inc.’s (“ARINC”) corporate headquarters and has a 15-year remaining, triple-net lease term fully guaranteed by Rockwell Collins Inc. (NYSE: COL), ARINC’s parent company and rated A/A3/A- by Fitch/Moody’s/S&P, respectively. The Rockwell - ARINC HQ Property is comprised of three buildings (Buildings 4, 5, and 6) within a six-building office complex and an additional parcel used for parking. The Rockwell - ARINC HQ Property comprises approximately 271,303 square feet of net rentable area, and the entire complex is situated on 21.1 acres and serves approximately 750 employees. The Rockwell - ARINC HQ Property buildings are each two to four stories and were constructed between 1969 and 2000. Buildings 5 and 6 were built in 1984 and 2000, respectively, and along with Building 4 are the center of activity at the complex, and have access to data center labs, a cafeteria and conference center. The buildings consist primarily of office, lab and data center space that is used by ARINC to provide 24-hour communication services to clients worldwide. The parking parcel provides 1,300 parking spaces, resulting in a parking ratio of 4.8 spaces per 1,000 square feet of net rentable area. In 2013, ARINC spent approximately $5.4 million to upgrade the Rockwell – ARINC HQ’s uninterruptible power supply, HVAC and generator systems. As of May 1, 2014, the Rockwell - ARINC HQ Property was 100.0% triple-net leased to ARINC on a 15-year remaining lease term through March 2029 with no termination options.
In 2013, Rockwell Collins Inc. acquired ARINC from the Carlyle Group, which had owned the company since 2007. Founded in 1929, ARINC is a provider of transportation communication systems for aviation, government, healthcare and transportation industries. Rockwell Collins Inc. reported 2013 revenue and net income of $4.6 billion and $632.0 million, respectively.
The following table presents certain information relating to the tenant at the Rockwell - ARINC HQ Property:
Major Tenant
| Tenant Name | Credit Rating (Fitch/Moody’s/ S&P)(1) | Tenant NRSF | % of NRSF | Annual U/W Base Rent PSF(2) | Annual U/W Base Rent(2) | % of Total Annual U/W Base Rent | Lease Expiration Date | |||||||||
ARINC Inc. | A/A3/A- | 271,303 | 100.0% | $24.37 | $6,610,965 | 100.0% | 3/31/2029 | |||||||||
| Total Major Tenant | 271,303 | 100.0% | $24.37 | $6,610,965 | 100.0% | |||||||||||
| (1) | Credit rating is that of the parent company, Rockwell Collins Inc (NYSE: COL). Rockwell Collins Inc. guarantees the lease. |
| (2) | Annual U/W Base Rent PSF and Annual U/W Base Rent are based on the average contractual rent over the loan term. The borrower acquired three neighboring buildings adjacent to the Rockwell - ARINC HQ Property, which are also occupied by ARINC under a separate lease. The neighboring buildings do not serve as collateral for the Rockwell - ARINC HQ Mortgage Loan. If the borrower sells the non-collateral buildings, ARINC’s annual rent at the Rockwell - ARINC HQ Property will be reduced by $150,000. |
The following table presents certain information relating to the lease rollover schedule at the Rockwell - ARINC HQ Property:
Lease Expiration Schedule(1)
Year Ending December 31, | No. of Leases Expiring | Expiring NRSF | % of Total NRSF | Cumulative Expiring NRSF | Cumulative % of Total NRSF | Annual U/W Base Rent | Annual U/W Base Rent PSF | |||||||||||||
| MTM | 0 | 0 | 0.0% | 0 | 0.0% | $0 | $0.00 | |||||||||||||
| 2014 | 0 | 0 | 0.0% | 0 | 0.0% | $0 | $0.00 | |||||||||||||
| 2015 | 0 | 0 | 0.0% | 0 | 0.0% | $0 | $0.00 | |||||||||||||
| 2016 | 0 | 0 | 0.0% | 0 | 0.0% | $0 | $0.00 | |||||||||||||
| 2017 | 0 | 0 | 0.0% | 0 | 0.0% | $0 | $0.00 | |||||||||||||
| 2018 | 0 | 0 | 0.0% | 0 | 0.0% | $0 | $0.00 | |||||||||||||
| 2019 | 0 | 0 | 0.0% | 0 | 0.0% | $0 | $0.00 | |||||||||||||
| 2020 | 0 | 0 | 0.0% | 0 | 0.0% | $0 | $0.00 | |||||||||||||
| 2021 | 0 | 0 | 0.0% | 0 | 0.0% | $0 | $0.00 | |||||||||||||
| 2022 | 0 | 0 | 0.0% | 0 | 0.0% | $0 | $0.00 | |||||||||||||
| 2023 | 0 | 0 | 0.0% | 0 | 0.0% | $0 | $0.00 | |||||||||||||
| 2024 | 0 | 0 | 0.0% | 0 | 0.0% | $0 | $0.00 | |||||||||||||
| Thereafter | 1 | 271,303 | 100.0% | 271,303 | 100.0% | $6,610,965 | $24.37 | |||||||||||||
| Vacant | 0 | 0 | 0.0% | 271,303 | 100.0% | $0 | $0.00 | |||||||||||||
| Total/Weighted Average | 1 | 271,303 | 100.0% | $6,610,965 | $24.37 | |||||||||||||||
| (1) | Information obtained from the underwritten rent roll. |
THE INFORMATION IN THIS STRUCTURAL AND COLLATERAL TERM SHEET IS NOT COMPLETE AND MAY BE AMENDED PRIOR TO THE TIME OF SALE. THIS TERM SHEET IS NOT AN OFFER TO SELL THESE SECURITIES AND IT IS NOT A SOLICITATION OF AN OFFER TO BUY THESE SECURITIES IN ANY JURISDICTION WHERE THE OFFER OR SALE IS NOT PERMITTED.
71
| ROCKWELL – ARINC HQ |
The following table presents historical occupancy percentages at the Rockwell - ARINC HQ Property:
Historical Occupancy(1)
12/31/2010 | 12/31/2011 | 12/31/2012 | 5/1/2014(2) | |||
| 100.0% | 100.0% | 100.0% | 100.0% |
| (1) | The Rockwell – ARINC HQ Property has been 100% leased to ARINC since each building was constructed. |
| (2) | Information obtained from the underwritten rent roll. |
Underwritten Net Cash Flow. The following table presents certain information relating to the historical operating performance and the Underwritten Net Cash Flow at the Rockwell - ARINC HQ Property:
Cash Flow Analysis(1)
| In Place | Year 10(2) | U/W | U/W $ per SF | ||||||||||
| Base Rent | $5,530,051 | $6,906,276 | $6,610,965(3) | $24.37 | |||||||||
| Less Vacancy & Credit Loss | 0 | 0 | (198,329)(4) | (0.73 | ) | ||||||||
| Effective Gross Income | $5,530,051 | $6,906,276 | $6,412,636 | $23.64 | |||||||||
| Total Operating Expenses | $0 | $0 | $192,379(5) | $0.71 | |||||||||
| Net Operating Income | $5,530,051 | $6,906,276 | $6,220,257 | $22.93 | |||||||||
| Capital Expenditures | 0 | 0 | 67,826 | 0.25 | |||||||||
| Net Cash Flow | $5,530,051 | $6,906,276 | $6,152,431 | $22.68 | |||||||||
| NOI DSCR | 1.86x | 2.33x | 2.10x | ||||||||||
| NCF DSCR | 1.86x | 2.33x | 2.07x | ||||||||||
| NOI DY | 11.4% | 14.2% | 12.8% | ||||||||||
| NCF DY | 11.4% | 14.2% | 12.7% |
| (1) | No historical financial information is available as the borrower recently acquired the property and the tenant is responsible for all operating expenses. |
| (2) | Represents the expected annual rent in the tenth year of the loan term based on a contractual 2.5% annual rent increase. |
| (3) | Annual U/W Base Rent is based on the average contractual rent over the loan term. The borrower acquired three neighboring buildings adjacent to the Rockwell - ARINC HQ Property, which are also occupied by ARINC under a separate lease. The neighboring buildings do not serve as collateral for the Rockwell - ARINC HQ Mortgage Loan. If borrower sells the non-collateral buildings, ARINC’s annual rent at the Rockwell - ARINC HQ Property will be reduced by $150,000 annually. |
| (4) | The underwritten economic vacancy is 3.0%. The Rockwell - ARINC HQ Property was 100.0% physically occupied as of May 1, 2014. |
| (5) | The only underwritten operating expense is a management fee of 3.0% of effective gross income. |
Appraisal. As of the appraisal valuation date of February 7, 2014, the Rockwell - ARINC HQ Property had an “as-is” appraised value of $73,200,000 and a dark value of $51,200,000.
Environmental Matters. According to the Phase I environmental assessment dated December 19, 2013, there was no evidence of any recognized environmental conditions at the Rockwell - ARINC HQ Property.
Market Overview and Competition. The Rockwell - ARINC HQ Property is located in Anne Arundel County in Annapolis, Maryland, approximately 26 miles south of Baltimore and 29 miles east of Washington, D.C. The Rockwell - ARINC HQ Property is situated less than a mile from the Annapolis Towne Centre, a mixed-use development with numerous retail stores including Target and Whole Foods, and is within close proximity to the United States Naval Academy and Chesapeake Bay. According to the appraisal, the Rockwell - ARINC HQ Property is located in the Baltimore-Columbia-Towson metropolitan statistical area, which had an estimated 2013 population and median household income of 2,938,104 and $66,970, respectively, and an average unemployment rate in July 2013 of 7.5% compared to the national average of 7.7%.
According to a third party market research report, the Southern Anne Arundel office market contains approximately 8.6 million square feet of office space with an overall vacancy rate of 11.5%, as of the third quarter 2013. The Rockwell - ARINC HQ Property is located in the Annapolis submarket, which contains approximately 6.8 million square feet of office space with an overall class A vacancy rate of 10.6%, as of the third quarter 2013. The Southern Anne Arundel overall market rent was $23.86 per square foot and the appraiser concluded average rent for the Annapolis submarket to be $28.13 per square foot, on a triple net basis.
THE INFORMATION IN THIS STRUCTURAL AND COLLATERAL TERM SHEET IS NOT COMPLETE AND MAY BE AMENDED PRIOR TO THE TIME OF SALE. THIS TERM SHEET IS NOT AN OFFER TO SELL THESE SECURITIES AND IT IS NOT A SOLICITATION OF AN OFFER TO BUY THESE SECURITIES IN ANY JURISDICTION WHERE THE OFFER OR SALE IS NOT PERMITTED.
72
| ROCKWELL – ARINC HQ |
Competitive Set(1)
Rockwell - ARINC HQ | 180 Admiral Cochrane Drive | 1 Park Place | 7134 Columbia Gateway Drive | 5200 Auth Road | 4 Taft Court | 55 Corporate Drive | |
| Market | Annapolis, MD | Annapolis, MD | Annapolis, MD | Columbia, MD | Camp Springs, MD | Rockville, MD | Bridgewater, NJ |
| Distance from Subject | –– | <1 mile | 3 miles | 20 miles | 22 miles | 32 miles | 154 miles |
| Property Type | Office | Office | Office | Office | Office | Office | Office |
| Year Built | 1969 | 1988 | 2007 | 1990 | 1973 | 1983 | 1987 |
| Total GLA | 271,303 SF | 128,703 SF | 157,943 SF | 21,900 SF | 140,000 SF | 51,052 SF | 674,325 SF |
| Total Occupancy | 100% | 91% | 100% | 0% | 100% | <1% | 100% |
| (1) | Information obtained from the appraisal and third party market research reports. |
The Borrower. The borrower is AGNL Datalink, L.L.C., a Delaware limited liability company and single purpose entity with two independent directors. Legal counsel to the borrower delivered a non-consolidation opinion in connection with the origination of the Rockwell - ARINC HQ Mortgage Loan. AG Net Lease III Corp. and AG Net Lease III (SO) Corp. are the guarantors of certain nonrecourse carveouts under the Rockwell - ARINC HQ Mortgage Loan.
The Sponsors. The sponsors are AG Net Lease III Corp. and AG Net Lease III (SO) Corp., subsidiaries of Angelo, Gordon & Co. Angelo, Gordon & Co. has over 305 employees, including more than 116 investment professionals, and has offices in New York, Los Angeles, Hong Kong, Seoul, Tokyo, and Shanghai. Angelo, Gordon & Company has been investing in commercial real estate since 1993 and has acquired over $13 billion of properties. The sponsors have extensive experience in real estate investment and management, including acquisition, financing, disposition, leasing, and construction management, and specializes in sub-performing real estate properties across a broad range of geographical markets and product types. The sponsors provide real estate sale-leaseback financing to less-than-investment grade owner-occupiers of corporate real estate as well as to financial sponsors and their portfolio companies. The sponsors focus on office, industrial, distribution, retail, R&D, and warehouse properties, targeting transactions between $5 million and $200 million.
Escrows. Monthly escrow deposits for taxes and insurance are waived provided the following conditions are satisfied (i) ARINC is not in default under the lease; (ii) the borrower delivers satisfactory evidence that direct payment of taxes and insurance premiums are being made by ARINC in a timely manner; and (iii) the ARINC lease continues to be in full effect. No replacement reserve escrow is required so long as no Cash Management Period (as defined below) has occurred and is continuing and ARINC is maintaining such the Rockwell - ARINC HQ Property in accordance with the terms of its lease. No monthly deposits for tenant improvement and leasing commission reserves are required so long as no Cash Management Period is continuing (other than a Cash Management Period triggered solely as a result of a Lease Sweep Period).
A “Cash Management Period” will commence upon the earlier to occur of (i) the ARD; (ii) an event of default under the Rockwell - ARINC HQ Mortgage Loan; (iii) the amortizing debt service coverage ratio falling below 1.20x as of the end of any calendar quarter; (iv) the commencement of a Lease Sweep Period; or (v) the entering into of any approved mezzanine loan. A Cash Management Period will end with respect to clause (ii), when such event of default has been cured; with respect to clause (iii), when an amortizing debt service coverage ratio of at least 1.20x has been achieved for two consecutive calendar quarters; or with respect to clause (iv), when such Lease Sweep Period has ended.
A “Lease Sweep Period” will commence on the first payment date following the occurrence of any of the following: (i) any Major Lease (as defined below) at the Rockwell - ARINC HQ Property is surrendered, cancelled or terminated prior to its then-current expiration date; (ii) any major tenant under a Major Lease discontinues its business at the premises or gives notice that it intends to discontinue its business; or (iii) upon the occurrence of an insolvency proceeding by any major tenant under a Major Lease. A Lease Sweep Period will end with respect to clause (i), on the date which such space has been fully leased pursuant to a replacement lease and all associated expenses have been paid in full; with respect to clause (ii), when the tenant under the Major Lease commences operations again at its premises in accordance with the terms of the Major Lease; and with respect to clause (iii), when the applicable insolvency proceeding regarding the tenant under the applicable Major Lease has terminated within 90 days of commencement and the major lease has been affirmed, assumed or assigned in accordance with the applicable bankruptcy code.
A “Major Lease” means the ARINC lease and any other lease entered into which demises more than twenty percent (20%) of the leasable area (excluding subleases from ARINC).
Lockbox and Cash Management. The Rockwell - ARINC HQ Mortgage Loan requires a hard lockbox and springing cash management. The Rockwell - ARINC HQ Mortgage Loan documents require all rents to be deposited directly into a lockbox account. Prior to the occurrence of a Cash Management Period, all funds in the lockbox account will be released to the borrower. Upon the occurrence and continuation of a Cash Management Period, funds in the lockbox account will be swept daily into a lender controlled cash management account.
Property Management. The Rockwell - ARINC HQ Property is managed by the tenant under the ARINC lease.
Partial Release. Not permitted.
THE INFORMATION IN THIS STRUCTURAL AND COLLATERAL TERM SHEET IS NOT COMPLETE AND MAY BE AMENDED PRIOR TO THE TIME OF SALE. THIS TERM SHEET IS NOT AN OFFER TO SELL THESE SECURITIES AND IT IS NOT A SOLICITATION OF AN OFFER TO BUY THESE SECURITIES IN ANY JURISDICTION WHERE THE OFFER OR SALE IS NOT PERMITTED.
73
| ROCKWELL – ARINC HQ |
Right of First Offer. ARINC Inc. has a right of first offer to purchase the Rockwell - ARINC HQ Property (the “ROFO”) if the landlord elects to (a) market the Rockwell - ARINC HQ Property to unaffiliated third parties or (b) transfer the Rockwell - ARINC HQ Property to a third party pursuant to a bona fide unsolicited offer received by the landlord. The ROFO is not extinguished by a foreclosure of the Rockwell - ARINC HQ Property; however the ROFO does not apply to a foreclosure or a deed-in-lieu thereof.
Assumption. The borrower has the right to transfer the Rockwell - ARINC HQ Property, in whole but not in part, subject to customary conditions set forth in the loan documents, including but not limited to: (i) no event of default has occurred and is continuing, (ii) the proposed transferee, replacement property manager and management agreement are satisfactory to the lender and applicable rating agencies, and (iii) receipt of rating agency confirmation from each of DBRS, KBRA and Moody’s that the transfer will not result in a downgrade, withdrawal or qualification of the respective ratings assigned to the Series 2014-C20 Certificates or the requirement for such rating agency confirmation has been waived by each of DBRS, KBRA and Moody’s. If Angelo Gordon & Co., L.P. controls the transferee and owns at least 51% of all equity interests (direct or indirect) in such transferee borrower, rating agency confirmation will not be required.
Real Estate Substitution. Not permitted.
Subordinate and Mezzanine Indebtedness. The borrower has the right to incur future mezzanine financing subject to the satisfaction of certain conditions, including: (i) no event of default has occurred and is continuing; (ii) execution of an intercreditor agreement in form and substance reasonably acceptable to the lender and each of DBRS, KBRA and Moody’s; (iii) the combined amortizing debt service coverage ratio will not be less than 1.30x; (iv) the combined loan-to-value ratio will not be greater than 72.5%; (v) the combined debt yield will not be less than 9.50%; (vi) the mezzanine loan documents are reasonably acceptable to the lender; and (vii) receipt of rating agency confirmation from each of DBRS, KBRA and Moody’s that such mezzanine financing will not result in a downgrade, withdrawal or qualification of the respective ratings assigned to the Series 2014-C20 Certificates.
Ground Lease. None.
Terrorism Insurance. The loan documents require that the “all risk” insurance policy required to be maintained by the borrower provide coverage for terrorism in an amount equal to the full replacement cost of the Rockwell - ARINC HQ Property. The loan documents also require business interruption insurance covering up to the 18-month period following the occurrence of a casualty event, together with a six-month extended period of indemnity.
THE INFORMATION IN THIS STRUCTURAL AND COLLATERAL TERM SHEET IS NOT COMPLETE AND MAY BE AMENDED PRIOR TO THE TIME OF SALE. THIS TERM SHEET IS NOT AN OFFER TO SELL THESE SECURITIES AND IT IS NOT A SOLICITATION OF AN OFFER TO BUY THESE SECURITIES IN ANY JURISDICTION WHERE THE OFFER OR SALE IS NOT PERMITTED.
74
(THIS PAGE INTENTIONALLY LEFT BLANK)
75
(THIS PAGE INTENTIONALLY LEFT BLANK)
76
| BRUNSWICK SQUARE |
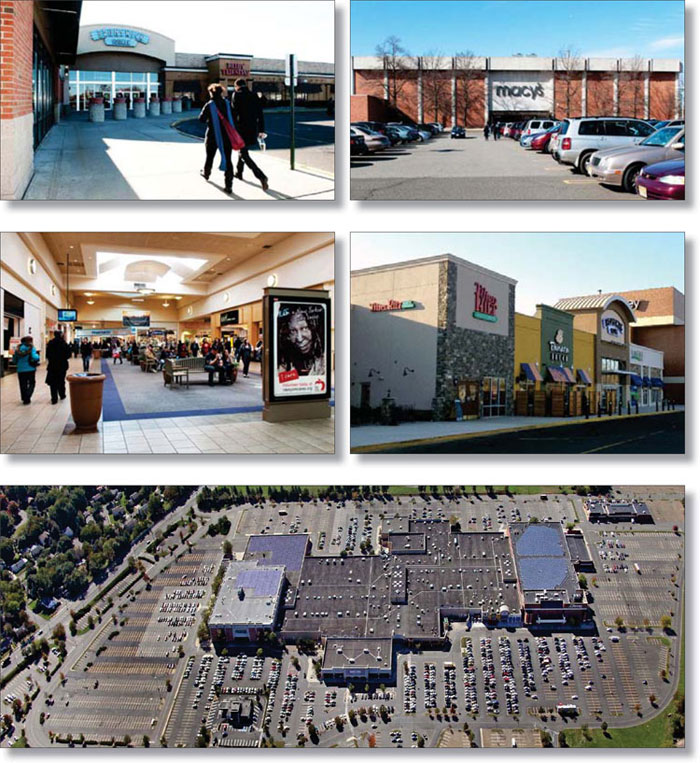
THE INFORMATION IN THIS STRUCTURAL AND COLLATERAL TERM SHEET IS NOT COMPLETE AND MAY BE AMENDED PRIOR TO THE TIME OF SALE. THIS TERM SHEET IS NOT AN OFFER TO SELL THESE SECURITIES AND IT IS NOT A SOLICITATION OF AN OFFER TO BUY THESE SECURITIES IN ANY JURISDICTION WHERE THE OFFER OR SALE IS NOT PERMITTED.
77
| BRUNSWICK SQUARE |
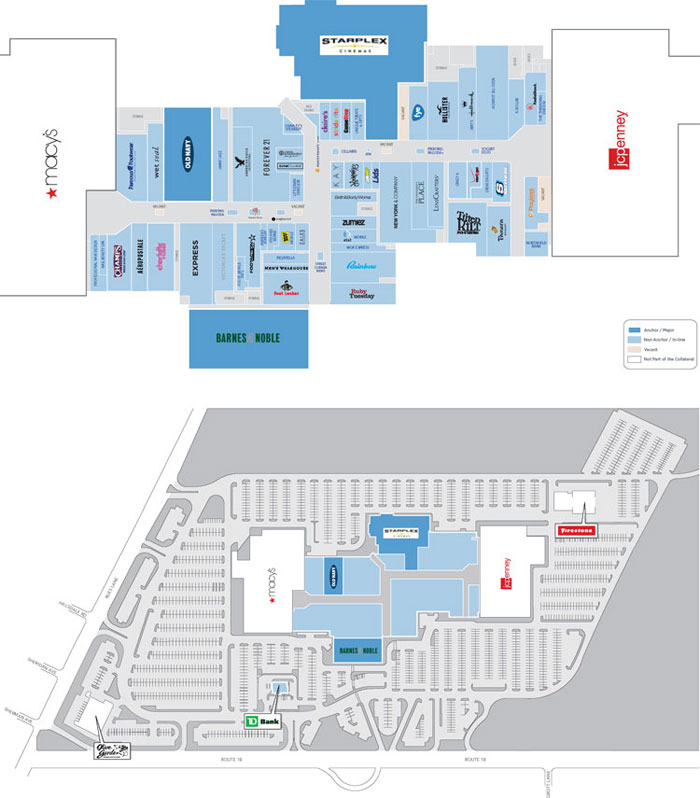
THE INFORMATION IN THIS STRUCTURAL AND COLLATERAL TERM SHEET IS NOT COMPLETE AND MAY BE AMENDED PRIOR TO THE TIME OF SALE. THIS TERM SHEET IS NOT AN OFFER TO SELL THESE SECURITIES AND IT IS NOT A SOLICITATION OF AN OFFER TO BUY THESE SECURITIES IN ANY JURISDICTION WHERE THE OFFER OR SALE IS NOT PERMITTED.
78
| BRUNSWICK SQUARE |
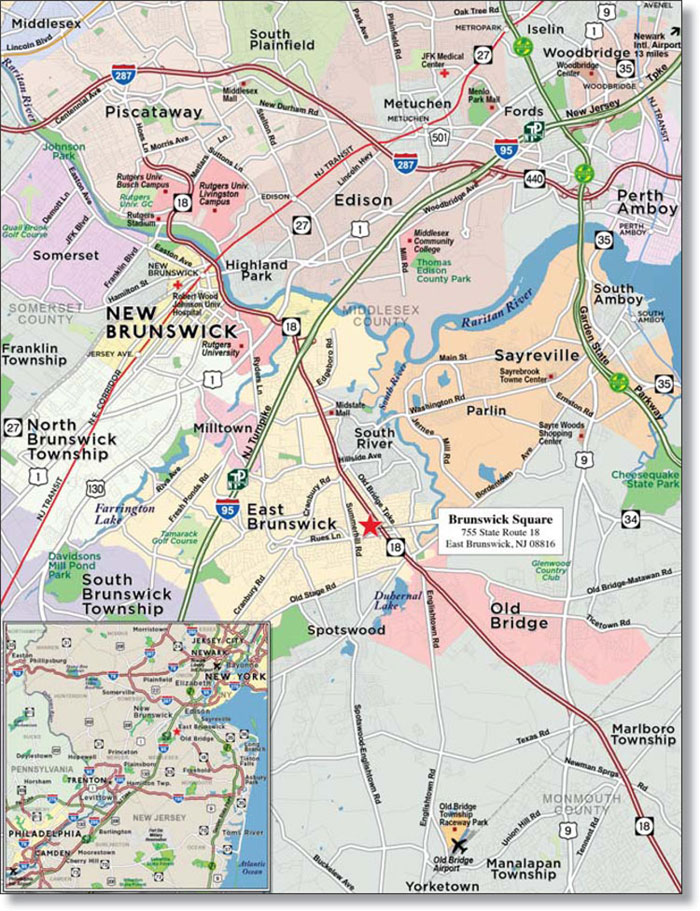
THE INFORMATION IN THIS STRUCTURAL AND COLLATERAL TERM SHEET IS NOT COMPLETE AND MAY BE AMENDED PRIOR TO THE TIME OF SALE. THIS TERM SHEET IS NOT AN OFFER TO SELL THESE SECURITIES AND IT IS NOT A SOLICITATION OF AN OFFER TO BUY THESE SECURITIES IN ANY JURISDICTION WHERE THE OFFER OR SALE IS NOT PERMITTED.
79
| No. 6 – Brunswick Square | ||||||||
| Loan Information | Property Information | |||||||
| Mortgage Loan Seller: | The Royal Bank of Scotland | Single Asset/Portfolio: | Single Asset | |||||
Credit Assessment (DBRS/KBRA/Moody’s): | NR/NR/NR | Property Type: | Retail | |||||
Original Principal Balance(1): | $47,000,000 | Specific Property Type: | Regional Mall | |||||
Cut-off Date Principal Balance(1): | $46,888,781 | Location: | East Brunswick, NJ | |||||
| % of Initial Pool Balance: | 3.7% | Size: | 292,685 SF | |||||
| Loan Purpose: | Refinance | Cut-off Date Principal Balance Per SF(1): | $262.46 | |||||
| Borrower Name: | Brunswick Square Mall, LLC | Year Built/Renovated: | 1973/2012 | |||||
| Sponsor: | Simon Property Group | Title Vesting: | Fee | |||||
| Mortgage Rate: | 4.796% | Property Manager: | Self-managed | |||||
| Note Date: | February 11, 2014 | 3rd Most Recent Occupancy (As of)(3): | 97.4% (12/31/2010) | |||||
| Anticipated Repayment Date: | NAP | 2nd Most Recent Occupancy (As of)(3): | 98.1% (12/31/2011) | |||||
| Maturity Date: | March 1, 2024 | Most Recent Occupancy (As of)(3): | 99.3% (12/31/2012) | |||||
| IO Period: | None | Current Occupancy (As of)(3): | 99.2% (1/9/2014) | |||||
| Loan Term (Original): | 120 months | |||||||
| Seasoning: | 2 months | Underwriting and Financial Information: | ||||||
| Amortization Term (Original): | 360 months | |||||||
| Loan Amortization Type: | Amortizing Balloon | 3rd Most Recent NOI (As of): | $7,339,255 (12/31/2011) | |||||
| Interest Accrual Method: | Actual/360 | 2nd Most Recent NOI (As of): | $7,455,862 (12/31/2012) | |||||
| Call Protection: | L(26),D(87),O(7) | Most Recent NOI (As of): | $8,213,357 (TTM 11/30/2013) | |||||
| Lockbox Type: | Hard/Springing Cash Management | |||||||
Additional Debt(1): | Yes | U/W Revenues: | $12,242,344 | |||||
Additional Debt Type(1): | Pari Passu | U/W Expenses: | $4,275,457 | |||||
| U/W NOI: | $7,966,887 | |||||||
| U/W NCF: | $7,473,300 | |||||||
U/W NOI DSCR(1): | 1.64x | |||||||
Escrows and Reserves(2): | U/W NCF DSCR(1): | 1.54x | ||||||
U/W NOI Debt Yield(1): | 10.4% | |||||||
Type: | Initial | Monthly | Cap (If Any) | U/W NCF Debt Yield(1): | 9.7% | |||
| Taxes | $0 | Springing | NAP | As-Is Appraised Value: | $113,000,000 | |||
| Insurance | $0 | Springing | NAP | As-Is Appraisal Valuation Date: | January 15, 2014 | |||
| Replacement Reserves | $0 | Springing | $273,600 | Cut-off Date LTV Ratio(1): | 68.0% | |||
| TI/LC Reserve | $0 | Springing | $711,600 | LTV Ratio at Maturity or ARD(1): | 55.7% | |||
| (1) | The Brunswick Square Loan Combination, totalling $77,000,000, is comprised of two pari passu notes (Notes A-1 and A-2). The controlling Note A-1 had an original balance of $47,000,000, has an outstanding principal balance as of the Cut-off Date of $46,888,781 and will be contributed to the WFRBS 2014-C20 Trust. The non-controlling Note A-2 had an original principal balance of $30,000,000 and was contributed to the WFRBS 2014-C19 Trust. All statistical financial information related to balances per square foot, loan-to-value ratios, debt service coverage ratios and debt yields are based on the Brunswick Square Loan Combination. |
| (2) | See “Escrows” section. |
| (3) | Historical and current occupancy includes temporary and seasonal tenants. |
The Mortgage Loan. The mortgage loan (the “Brunswick Square Loan Combination”) is evidenced by two pari passu notes (Note A-1 and Note A-2) secured by a first mortgage encumbering a regional mall located in East Brunswick, New Jersey (the “Brunswick Square Property”). The Brunswick Square Loan Combination was originated on February 11, 2014 by The Royal Bank of Scotland. The Brunswick Square Loan Combination had an original principal balance of $77,000,000, has an outstanding principal balance as of the Cut-off Date of $76,817,790 and accrues interest at an interest rate of 4.796% per annum. The Brunswick Square Loan Combination had an initial term of 120 months, has a remaining term of 118 months as of the Cut-off Date and requires payments of principal and interest based on a 30 year amortization schedule. The Brunswick Square Loan Combination matures on March 1, 2024.
Note A-1, which represents the controlling interest in the Brunswick Square Loan Combination and will be contributed to the WFRBS 2014-C20 Trust, had an original principal balance of $47,000,000 and has an outstanding principal balance as of the Cut-off Date of $46,888,781. Note A-2 (the “Brunswick Square Companion Loan”) had an original principal balance of $30,000,000, was contributed to the WFRBS 2014-C19 Trust and represents the non-controlling interest in the Brunswick Square Loan Combination. See “Description of the Mortgage Pool - Split Loan Structures - The Brunswick Square Loan Combination” and “The Pooling and Servicing Agreement” in the Free Writing Prospectus.
Prior to the open period (prior to, and including August 1, 2023), the borrower may voluntarily prepay the Brunswick Square Loan Combination, in full or in part, which the lender may accept, in its sole discretion, upon payment of a prepayment penalty amount equal to the greater of (a) 3% of the outstanding principal balance of the Brunswick Square Loan Combination and (b) the excess, if any, of (i) the sum of the present values of all then-scheduled payments of principal and interest remaining, assuming that all
THE INFORMATION IN THIS STRUCTURAL AND COLLATERAL TERM SHEET IS NOT COMPLETE AND MAY BE AMENDED PRIOR TO THE TIME OF SALE. THIS TERM SHEET IS NOT AN OFFER TO SELL THESE SECURITIES AND IT IS NOT A SOLICITATION OF AN OFFER TO BUY THESE SECURITIES IN ANY JURISDICTION WHERE THE OFFER OR SALE IS NOT PERMITTED.
80
| BRUNSWICK SQUARE |
scheduled payments are made timely and that the remaining outstanding principal and interest is paid on the maturity date, over (ii) the principal amount being prepaid.
Following the lockout period, the borrower has the right to defease the Brunswick Square Loan Combination in whole, but not in part, on any due date before September 1, 2023. In addition, the Brunswick Square Loan Combination is prepayable without penalty on or after September 1, 2023.
Sources and Uses
| Sources | Uses | |||||||
| Original loan combination amount | $77,000,000 | 99.3% | Loan payoff(1) | $76,923,676 | 99.2% | |||
| Sponsor’s new cash contribution | 544,775 | 0.7 | Closing costs | 621,099 | 0.8 | |||
| Total Sources | $77,544,775 | 100.0% | Total Uses | $77,544,775 | 100.0% |
| (1) | The Brunswick Square Property was previously securitized in CSFB 2004-C4. |
The Property. The Brunswick Square Property is a single story regional mall located on Route 18 in East Brunswick, New Jersey, approximately four miles south of exit nine on the New Jersey Turnpike and 30 miles southwest of New York City. The Brunswick Square mall contains 760,311 square feet of retail space, of which 292,685 square feet serve as collateral for the Brunswick Square Mortgage Loan, and is situated on an 81.1-acre parcel of land. The Brunswick Square Property is anchored by Macy’s, JC Penney (neither of which is part of the collateral), and a 13-screen Starplex Cinemas (part of the collateral). The Brunswick Square Property contains 4,400 parking spaces, resulting in a parking ratio of 5.8 spaces per 1,000 square feet of rentable area. The Brunswick Square Property was constructed in 1973 and renovated in 1999 and 2012. The 1999 renovation included new floors, lighting, ceilings and a new entrance. Barnes & Noble was also added in 1999 and the existing theater was expanded to a 13-screen cinema with stadium seating. The 2012 renovation included an upgrade of the mall entrances and parking lot, as well as a reconfiguration in which two new food tenants, Panera Bread and Tilted Kilt, were added. In addition, Starplex Cinemas added luxury seating and is currently undergoing additional renovations to concession stands, restrooms and the lobby. As of year-end 2013, tenants occupying 10,000 square feet or less had comparable in-line sales of $326 per square foot with an average occupancy cost of 15.6%. As of January 9, 2014, the Brunswick Square Property was 99.2% occupied by 71 tenants.
THE INFORMATION IN THIS STRUCTURAL AND COLLATERAL TERM SHEET IS NOT COMPLETE AND MAY BE AMENDED PRIOR TO THE TIME OF SALE. THIS TERM SHEET IS NOT AN OFFER TO SELL THESE SECURITIES AND IT IS NOT A SOLICITATION OF AN OFFER TO BUY THESE SECURITIES IN ANY JURISDICTION WHERE THE OFFER OR SALE IS NOT PERMITTED.
81
| BRUNSWICK SQUARE |
The following table presents certain information relating to tenancy at the Brunswick Square Property:
Major Tenants
| Tenant Name | Credit Rating (Fitch/Moody’s /S&P)(1) | Tenant NRSF | % of NRSF | Annual U/W Base Rent PSF(2) | Annual U/W Base Rent(2) | % of Total Annual U/W Base Rent | Sales PSF(3) | Occupancy Cost(3)(4) | Lease Expiration Date | |||||||
| Anchor Tenants - Not Part of Collateral | ||||||||||||||||
| Macy’s | BBB/Baa2/BBB+ | 244,000 | ANCHOR OWNED - NOT PART OF THE COLLATERAL | |||||||||||||
| JC Penney | CCC/Caa1/CCC+ | 223,626 | ANCHOR OWNED - NOT PART OF THE COLLATERAL | |||||||||||||
| Anchor Tenants - Collateral | ||||||||||||||||
| Starplex Cinemas | NR/NR/NR | 49,313 | 16.8% | $10.00 | $493,130 | 6.5% | (5) | 24.8% | 5/31/2022 | |||||||
| Total Anchor Tenants - Collateral | 49,313 | 16.8% | $10.00 | $493,130 | 6.5% | |||||||||||
| Other Major Tenants - Collateral | ||||||||||||||||
| Forever 21 | NR/NR/NR | 12,508 | 4.3% | $37.10 | $464,006 | 6.2% | $234 | 16.3% | 1/31/2020 | |||||||
| Barnes & Noble | NR/NR/NR | 24,833 | 8.5% | $16.11 | $400,000 | 5.3% | $168 | 10.2% | 7/31/2019 | |||||||
| New York & Company | NR/NR/NR | 10,248 | 3.5% | $14.64 | $150,000 | 2.0% | $123 | 12.0% | 1/31/2015 | |||||||
| Against All Odds | NR/NR/NR | 10,594 | 3.6% | $12.74 | $135,000 | 1.8% | $104 | 12.3% | 8/31/2015 | |||||||
Old Navy(6) | BBB-/Baa3/BBB- | 15,856 | 5.4% | $0.00 | $0 | 0.0% | $243 | 6.0% | MTM | |||||||
| Total Other Major Tenants - Collateral | 74,039 | 25.3% | $15.52 | $1,149,006 | 15.3% | |||||||||||
| Non-Major Retail Tenants - Collateral | 167,128 | 57.1% | $35.24 | $5,889,097 | 78.2% | |||||||||||
Total Occupied Collateral(7) | 290,480 | 99.2% | $25.93 | $7,531,234 | 100.0% | |||||||||||
| Total Vacant Space | 2,205 | 0.8% | ||||||||||||||
| Collateral Total | 292,685 | 100.0% | ||||||||||||||
| (1) | Certain ratings are those of the parent company whether or not the parent guarantees the lease. |
| (2) | Annual U/W Base Rent PSF and Annual U/W Base Rent include contractual rent steps through December 2014. |
| (3) | Sales PSF and occupancy costs are for the trailing 12-month period ending December 31, 2013. |
| (4) | Occupancy costs include base rent, reimbursements and percentage rent, as applicable. |
| (5) | Starplex Cinemas began its lease in May 2012, and underwent a renovation including the addition of luxury seating. Starplex Cinemas currently operates with 13 screens at the Brunswick Square Property and reported sales per screen of $271,308 resulting in an occupancy cost of 24.8% for 2013, although the theater was not open for business for all of the year. |
| (6) | Old Navy is in negotiations with management to renew its lease through January 2018. Old Navy currently pays rent on a month-to-month basis. |
| (7) | Occupancy includes temporary and seasonal tenants. |
The following table presents certain information relating to the historical sales and occupancy costs at the Brunswick Square Property:
Historical Sales (PSF) and Occupancy Costs(1)
| Tenant Name | 2010 | 2011 | 2012 | 2013 |
| Starplex Cinemas | NAP | NAP | NAP | $271,308(2) |
| Forever 21 | $248 | $229 | $236 | $234 |
| Barnes & Noble | $199 | $192 | $185 | $168 |
| New York and Company | $157 | $135 | $128 | $123 |
| Against All Odds | $96 | $110 | $111 | $104 |
| Old Navy | $234 | $219 | $232 | $243 |
Total In-line (<10,000 square feet)(3) | $283 | $307 | $334 | $326 |
Occupancy Costs(3) | 16.9% | 17.3% | 15.0% | 15.6% |
| (1) | Historical Sales (PSF) and Occupancy Costs are based on historical statements provided by the borrower. |
| (2) | Starplex Cinemas began its lease in May 2012, and underwent a renovation including the addition of luxury seating. Historical Sales for Starplex Cinemas are reported on a per screen basis. Starplex Cinemas operates with 13 screens at the Brunswick Square Property and reported sales per screen of $271,308 for 2013, although the theater was not open for business for the entire year. |
| (3) | Represents tenants occupying less than 10,000 square feet. |
THE INFORMATION IN THIS STRUCTURAL AND COLLATERAL TERM SHEET IS NOT COMPLETE AND MAY BE AMENDED PRIOR TO THE TIME OF SALE. THIS TERM SHEET IS NOT AN OFFER TO SELL THESE SECURITIES AND IT IS NOT A SOLICITATION OF AN OFFER TO BUY THESE SECURITIES IN ANY JURISDICTION WHERE THE OFFER OR SALE IS NOT PERMITTED.
82
| BRUNSWICK SQUARE |
The following table presents certain information relating to the lease rollover schedule at the Brunswick Square Property:
Lease Expiration Schedule(1)(2)
Year Ending December 31, | No. of Leases Expiring | Expiring NRSF | % of Total NRSF | Cumulative of Total NRSF | Cumulative % of Total NRSF | Annual U/W Base Rent | Annual U/W Base Rent PSF(3) | |||||||||||||
| MTM | 2 | 17,165 | 5.9% | 17,165 | 5.9% | $120,000 | $6.99 | |||||||||||||
| 2014 | 0 | 0 | 0.0% | 17,165 | 5.9% | $0 | $0.00 | |||||||||||||
| 2015 | 18 | 63,396 | 21.7% | 80,561 | 27.5% | $1,934,483 | $30.51 | |||||||||||||
| 2016 | 8 | 14,765 | 5.0% | 95,326 | 32.6% | $534,539 | $36.20 | |||||||||||||
| 2017 | 12 | 35,824 | 12.2% | 131,150 | 44.8% | $915,185 | $25.55 | |||||||||||||
| 2018 | 3 | 5,178 | 1.8% | 136,328 | 46.6% | $262,333 | $50.66 | |||||||||||||
| 2019 | 8 | 51,646 | 17.6% | 187,974 | 64.2% | $1,292,583 | $25.03 | |||||||||||||
| 2020 | 2 | 12,776 | 4.4% | 200,750 | 68.6% | $513,008 | $40.15 | |||||||||||||
| 2021 | 1 | 632 | 0.2% | 201,382 | 68.8% | $117,229 | $185.49 | |||||||||||||
| 2022 | 11 | 75,782 | 25.9% | 277,164 | 94.7% | $1,348,593 | $17.80 | |||||||||||||
| 2023 | 4 | 5,699 | 1.9% | 282,863 | 96.6% | $292,790 | $51.38 | |||||||||||||
| 2024 | 2 | 7,617 | 2.6% | 290,480 | 99.2% | $200,490 | $26.32 | |||||||||||||
| Thereafter | 0 | 0 | 0% | 290,480 | 99.2% | $0 | $0.00 | |||||||||||||
Vacant(4) | 0 | 2,205 | 0.8% | 292,685 | 100.0% | $0 | $0.00 | |||||||||||||
| Total/Weighted Average | 71 | 292,685 | 100.0% | $7,531,234 | $25.93 | |||||||||||||||
| (1) | Information obtained from the underwritten rent roll. |
| (2) | Certain tenants may have lease termination options that are exercisable prior to the originally stated expiration date of the subject lease and that are not considered in the Lease Expiration Schedule. |
| (3) | Weighted Average Annual U/W Base Rent PSF excludes vacant space. |
| (4) | Occupancy includes temporary and seasonal tenants. |
The following table presents historical occupancy percentages at the Brunswick Square Property:
Historical Occupancy(1)
12/31/2010(2) | 12/31/2011(2) | 12/31/2012(2) | 1/9/2014(3) | |||
| 97.4% | 98.1% | 99.3% | 99.2% |
| (1) | Occupancy includes temporary and seasonal tenants. |
| (2) | Information obtained from the borrower. |
| (3) | Information obtained from the underwritten rent roll. |
Operating History and Underwritten Net Cash Flow. The following table presents certain information relating to the historic operating performance and the Underwritten Net Cash Flow at the Brunswick Square Property:
Cash Flow Analysis
| 2011 | 2012 | TTM 11/30/2013 | U/W | U/W $ per SF | |||||||
| Base Rent | $6,123,850 | $6,799,547 | $7,219,905 | $7,531,234 | $25.73 | ||||||
| Grossed Up Vacant Space | 0 | 0 | 0 | 169,585 | 0.58 | ||||||
| Percentage Rent | 804,368 | 665,459 | 562,768 | 485,033(1) | 1.66 | ||||||
| Total Reimbursables | 3,670,290 | 3,598,651 | 3,388,058 | 3,788,753 | 12.94 | ||||||
| Other Income | 1,081,756 | 879,245 | 857,441 | 857,441 | 2.93 | ||||||
| Less Vacancy & Credit Loss | (74,984) | (154,634) | (11,113) | (589,701)(2) | (2.01) | ||||||
| Effective Gross Income | $11,605,280 | $11,788,268 | $12,017,059 | $12,242,344 | $41.83 | ||||||
| Total Operating Expenses | $4,266,025 | $4,332,406 | $3,803,702 | $4,275,457 | $14.61 | ||||||
| Net Operating Income | $7,339,255 | $7,455,862 | $8,213,357 | $7,966,887 | $27.22 | ||||||
| TI/LC | 0 | 0 | 0 | 356,026 | 1.22 | ||||||
| Replacement Reserves | 0 | 0 | 0 | 137,562 | 0.47 | ||||||
| Net Cash Flow | $7,339,255 | $7,455,862 | $8,213,357 | $7,473,300 | $25.53 | ||||||
NOI DSCR(3) | 1.51x | 1.54x | 1.69x | 1.64x | |||||||
NCF DSCR(3) | 1.51x | 1.54x | 1.69x | 1.54x | |||||||
NOI DY(3) | 9.6% | 9.7% | 10.7% | 10.4% | |||||||
NCF DY(3) | 9.6% | 9.7% | 10.7% | 9.7% | |||||||
| (1) | Underwritten Percentage Rent is based on individual tenant sales for the trailing 12 months ending November 2013. |
| (2) | The underwritten economic vacancy is 5.0%. The Brunswick Square Property was 99.2% physically occupied inclusive of seasonal and temporary tenants as of January 9, 2014. |
| (3) | DSCRs and debt yields are based on the Brunswick Square Loan Combination. |
THE INFORMATION IN THIS STRUCTURAL AND COLLATERAL TERM SHEET IS NOT COMPLETE AND MAY BE AMENDED PRIOR TO THE TIME OF SALE. THIS TERM SHEET IS NOT AN OFFER TO SELL THESE SECURITIES AND IT IS NOT A SOLICITATION OF AN OFFER TO BUY THESE SECURITIES IN ANY JURISDICTION WHERE THE OFFER OR SALE IS NOT PERMITTED.
83
| BRUNSWICK SQUARE |
Appraisal. As of the appraisal valuation date of January 15, 2014, the Brunswick Square Property had an “as-is” appraised value of $113,000,000.
Environmental Matters. According to a Phase I environmental site assessment dated January 23, 2014, there was no evidence of any recognized environmental conditions at the Brunswick Square Property.
Market Overview and Competition. The Brunswick Square Property is located in East Brunswick, New Jersey, on the west side of State Route 18, and approximately four miles south of the New Jersey Turnpike (I-95). The Brunswick Square Property is located within Middlesex County, in the Central New Jersey region approximately 30 miles southwest of New York City. The Central New Jersey region comprises six New Jersey counties in which the transportation and utilities industry has the largest employment share. According to the appraisal, the Brunswick Square Property has a primary trade area that encompasses a 10-mile radius within the New York/New Jersey core based statistical area. The 2013 population and average household income for the 10-mile trade area were reported at approximately 746,706 and $100,032, respectively.
The appraiser estimated market rent for in-line tenants under 10,000 square feet to be $28.99 per square foot on a triple net basis and used an estimate of $2.00 per square foot for anchor tenants on a modified gross basis. Additionally, based on an average of comparable properties, the appraiser estimated the local market vacancy rate to be 2.5% within the primary trade area.
The following table presents certain information relating to some comparable retail centers provided in the appraisal for the Brunswick Square Property:
Competitive Set(1)
| Brunswick Square (Subject) | Menlo Park Mall | Woodbridge Center | Freehold Raceway | Bridgewater Commons | |
| Market | East Brunswick, NJ | Edison, NJ | Woodbridge, NJ | Freehold, NJ | Bridgewater, NJ |
| Distance from Subject | -- | 12 miles | 14 miles | 14 miles | 20 miles |
| Property Type | Regional Mall | Super Regional Mall | Regional Mall | Super Regional Mall | Super Regional Mall |
| Year Built/Renovated | 1973/1999,2012 | 1942/2003 | 1971/2011 | 1990/2007 | 1988/2005 |
| Anchors | Macy’s, JC Penney | Macy’s, Nordstrom, AMC Movie Theaters | Macy’s, JC Penney, Sears, Lord & Taylor, Boscov’s | Macy’s, JC Penney, Sears, Lord & Taylor, Nordstrom | Macy’s, Lord & Taylor, Bloomingdale’s |
| Total GLA | 760,311 SF(2) | 1,243,361 SF | 1,666,344 SF | 1,665,399 SF | 992,000 SF |
| Total Occupancy | 99%(2) | 95% | 98% | 97% | 99% |
| (1) | Information obtained from the borrower’s rent roll and the appraisal. |
| (2) | Total GLA and Total Occupancy are inclusive of non-collateral anchors. |
The Borrower. The borrower is Brunswick Square Mall, LLC, a Delaware limited liability company and a single purpose entity with two independent directors. Legal counsel to the borrower delivered a non-consolidation opinion in connection with the origination of the Brunswick Square Loan Combination. Simon Property Group, L.P. is the guarantor of the nonrecourse carveouts under the Brunswick Square Loan Combination.
The Sponsor. The sponsor, Simon Property Group (NYSE: SPG) (“SPG”), is an S&P 100 company and currently has an interest in more than 325 retail real estate properties in North America, Europe, and Asia comprising approximately 243 million square feet. SPG is headquartered in Indianapolis, Indiana and employs approximately 5,500 people in the United States. SPG has the right to transfer sponsorship to its proposed SpinCo REIT (“SpinCo”), to be known as Washington Prime Group (“WPG”), which is expected to initially own or have an interest in 54 strip centers and 44 malls. WPG is expected to operate a large, diversified portfolio of strip centers and malls in the United States, having 53 million total square feet in 23 states. Occupancy at these strip centers and malls was 94.2% and 90.4%, respectively, as of September 30, 2013. See “Description of the Mortgage Pool – Default History, Bankruptcy Issues and Other Proceedings” in the Free Writing Prospectus.
Escrows. No ongoing monthly escrows are required for real estate taxes, insurance, replacement or rollover reserves so long as no Lockbox Event (as defined below) has occurred and is continuing under the Brunswick Square Loan Combination. In the event that a Lockbox Event has occurred, the borrower is required to make monthly deposits: (i) for the payment of real estate taxes in an amount equal to one-twelfth of the estimated annual taxes payable and for the payment of insurance in an amount equal to one-twelfth of the estimated annual insurance premiums payable; provided that so long as no event of default has occurred and is continuing, the borrower will not be required to make such deposits for so long as the borrower provides satisfactory evidence to the lender that the taxes have been paid prior to delinquency and the insurance policies are being maintained as part of a reasonably acceptable blanket insurance policy providing coverage to substantially all of the other properties managed by the property manager or its affiliates; (ii) for replacements and repairs in an amount equal to $11,400 (subject to a cap of $273,600); and (iii) for tenant improvement and leasing commission in an amount equal to $29,650 (subject to a cap of $711,600).
A “Lockbox Event” will commence upon the occurrence of (i) an event of default; (ii) any bankruptcy or insolvency proceeding of the borrower or the property manager (if the property manager is an affiliate of the borrower); or (iii) the debt service coverage ratio falling below 1.20x for two consecutive calendar quarters. A Lockbox Event will end with respect to clause (i), upon the acceptance by the lender of a cure of such event of default (which cure the lender is not obligated to accept and may reject or accept in its sole and absolute discretion), provided that the lender has not accelerated the Brunswick Square Loan Combination, moved for a receiver or commenced foreclosure proceedings; with respect to clause (ii), if the borrower replaces the property manager with a replacement property manager pursuant to a replacement management agreement, each qualified pursuant to the terms of the Brunswick Square
THE INFORMATION IN THIS STRUCTURAL AND COLLATERAL TERM SHEET IS NOT COMPLETE AND MAY BE AMENDED PRIOR TO THE TIME OF SALE. THIS TERM SHEET IS NOT AN OFFER TO SELL THESE SECURITIES AND IT IS NOT A SOLICITATION OF AN OFFER TO BUY THESE SECURITIES IN ANY JURISDICTION WHERE THE OFFER OR SALE IS NOT PERMITTED.
84
| BRUNSWICK SQUARE |
Loan Combination documents or such bankruptcy or insolvency proceeding of the property manager is discharged or dismissed within 90 days; or with respect to clause (iii), when a debt service coverage ratio of at least 1.20x has been achieved for two consecutive calendar quarters; provided, however, that (x) no event of default has occurred and is continuing under the loan agreement or any of the other Brunswick Square Loan Combination documents; (y) the borrower has paid all of the lender’s reasonable out-of-pocket expenses actually incurred in connection with such Lockbox Event including, reasonable attorney’s fees and expenses; and (z) a Lockbox Event may not be cured more than five times in the aggregate during the term of the Brunswick Square Loan Combination.
Lockbox and Cash Management. The Brunswick Square Loan Combination requires a lender controlled lockbox, which is already in place, and springing cash management. The Brunswick Square Loan Combination documents require that the borrower direct tenants to deposit all rents directly into the lockbox account and that the borrower and the property manager deposit all rents received into the lockbox account within two business days of receipt. Prior to the occurrence of a Lockbox Event, all funds on deposit in the lockbox account will be released to the borrower on a weekly basis. From and after the occurrence and continuation of a Lockbox Event, funds on deposit in the lockbox account will be swept on a weekly basis (or each business day, during the continuance of an event of default into a lender controlled cash management account).
Property Management. The Brunswick Square Property is managed by an affiliate of the borrower.
Assumption. The borrower has the right to transfer the Brunswick Square Property, or greater than 50% of the aggregate interests in the borrower, in one or a series of related transactions to one or more Qualified Transferees (as defined below), 60 days after the Series 2014-C20 Trust closing date upon at least 30 days’ prior notice to the lender, provided that no event of default has occurred and is continuing and certain other conditions are satisfied, including, but not limited to delivery of an additional insolvency opinion.
The borrower also has the right to transfer the Brunswick Square Property or 100% of the aggregate interests in the borrower to a non-Qualified Transferee, provided that no event of default has occurred and is continuing, the conditions with respect to transfers to non-Qualified Transferee’s and certain additional conditions are satisfied, including, but not limited to receipt of a rating agency confirmation from DBRS, KBRA and Moody’s that the transfer will not result in a downgrade, withdrawal or qualification of the respective ratings assigned to the Series 2014-C20 Certificates and similar confirmations with respect to the ratings of any securities backed by the Brunswick Square Companion Loan.
A “Qualified Transferee” is (a) any person or its affiliate (provided such person owns, directly or indirectly, not less than 51% of such affiliate) who owns and operates (i) at least five “shopping centers” and (ii) retail properties and shopping centers totaling in the aggregate at least 3,000,000 square feet of gross area; (b) any person who has a net worth in excess of $250,000,000; or (c) any person, provided the lender has received written confirmation by DBRS, KBRA and Moody’s that the transfer to such person will not, in and of itself, cause a downgrade withdrawal or qualification of the then current ratings of the Series 2014-C20 Certificates and similar confirmations with respect to ratings of any securities backed by the Brunswick Square Companion Loan; provided, however, that no person will be deemed to be a Qualified Transferee if such person (x) is an embargoed person, (y) except for General Growth Properties or its affiliates, is or has during the previous seven years been the subject of a bankruptcy or insolvency proceeding or (z) has been convicted in a criminal proceeding for a felony or any crime involving moral turpitude or is an organized crime figure or is reputed to have substantial business or other affiliations with any organized crime figure.
Free Release. Provided that no event of default has occurred and is continuing, the borrower may: (i) make transfers of immaterial or non-income producing portions of the Brunswick Square Property in connection with takings or condemnations of any portion of the Brunswick Square Property; (ii) make transfers of non-income producing portions of the Brunswick Square Property to third parties or affiliates of the borrower; and (iii) dedicate portions of the Brunswick Square Property or grant easements, restrictions, covenants, reservations and rights of way in the ordinary course of business; subject to certain conditions, including: (a) evidence that the transferee is not an affiliate of the borrower; (b) with respect to any of the transfers described in (ii) and (iii), delivery of an officer’s certificate evidencing that such transfer, conveyance or encumbrance will not result in a material adverse effect on the value of the Brunswick Square Property, the business operations or financial condition of the borrower or the ability of the borrower to repay the Brunswick Square Loan Combination; and (c) delivery of an opinion of counsel that the REMIC trust will not fail to maintain its REMIC status due to the partial release.
Real Estate Substitution. Not Permitted.
Subordinate and Mezzanine Indebtedness. Not Permitted.
Ground Lease. None.
Terrorism Insurance. The loan documents require that the “all risk” insurance policy required to be maintained by the borrower provides coverage for terrorism in an amount equal to the full replacement cost of the Brunswick Square Property or if TRIPRA is no longer in effect, the borrower will be required to obtain a stand alone policy providing the same coverage for terrorism; provided, however (a) that the borrower will not be required to pay annual premiums in excess of two times the then-current annual premiums for the “all risk” insurance policy (excluding the catastrophic coverage of flood, earthquake and wind) and (b) that such stand-alone policy may have a deductible that is reasonable for such stand-alone policies with respect to properties similar to and reasonable for the geographic region where the Brunswick Square Property is located, so long as in no event shall such deductible exceed 5% of the total insured values. The loan documents also require business interruption insurance covering no less than the 18-month period following the occurrence of a casualty event, together with an extended period of indemnity, which shall continue for the lesser of (i) the period of time until income returns to the same level as it was prior to loss and (ii) 365 days from the date that the Brunswick Square Property is repaired or replaced and operations are resumed.
THE INFORMATION IN THIS STRUCTURAL AND COLLATERAL TERM SHEET IS NOT COMPLETE AND MAY BE AMENDED PRIOR TO THE TIME OF SALE. THIS TERM SHEET IS NOT AN OFFER TO SELL THESE SECURITIES AND IT IS NOT A SOLICITATION OF AN OFFER TO BUY THESE SECURITIES IN ANY JURISDICTION WHERE THE OFFER OR SALE IS NOT PERMITTED.
85
| HILTON DFW LAKES HOTEL AND CONFERENCE CENTER |

THE INFORMATION IN THIS STRUCTURAL AND COLLATERAL TERM SHEET IS NOT COMPLETE AND MAY BE AMENDED PRIOR TO THE TIME OF SALE. THIS TERM SHEET IS NOT AN OFFER TO SELL THESE SECURITIES AND IT IS NOT A SOLICITATION OF AN OFFER TO BUY THESE SECURITIES IN ANY JURISDICTION WHERE THE OFFER OR SALE IS NOT PERMITTED.
86
| HILTON DFW LAKES HOTEL AND CONFERENCE CENTER |

THE INFORMATION IN THIS STRUCTURAL AND COLLATERAL TERM SHEET IS NOT COMPLETE AND MAY BE AMENDED PRIOR TO THE TIME OF SALE. THIS TERM SHEET IS NOT AN OFFER TO SELL THESE SECURITIES AND IT IS NOT A SOLICITATION OF AN OFFER TO BUY THESE SECURITIES IN ANY JURISDICTION WHERE THE OFFER OR SALE IS NOT PERMITTED.
87
| No. 7 – Hilton DFW Lakes Hotel and Conference Center | |||||||
| Loan Information | Property Information | ||||||
| Mortgage Loan Seller: | The Royal Bank of Scotland | Single Asset/Portfolio: | Single Asset | ||||
Credit Assessment (DBRS/KBRA/Moody’s): | NR/NR/NR | Property Type: | Hospitality | ||||
| Original Principal Balance: | $46,000,000 | Specific Property Type: | Full Service | ||||
| Cut-off Date Principal Balance: | $45,943,116 | Location: | Grapevine, TX | ||||
| % of Initial Pool Balance: | 3.7% | Size: | 393 rooms | ||||
| Loan Purpose: | Refinance | Cut-off Date Principal Balance Per Room: | $116,904 | ||||
| Borrower Name: | DFW Lakes Owner, LLC | Year Built/Renovated: | 1983/2012 | ||||
| Sponsors: | Somera Capital Management and Zelman Realty Partners | Title Vesting: | Fee | ||||
| Mortgage Rate: | 4.844% | Property Manager: | Quorum Hotel Advisors, LLC | ||||
| Note Date: | March 6, 2014 | 3rd Most Recent Occupancy (As of): | 65.6% (12/31/2011) | ||||
| Anticipated Repayment Date: | NAP | 2nd Most Recent Occupancy (As of): | 66.4% (12/31/2012) | ||||
| Maturity Date: | April 1, 2021 | Most Recent Occupancy (As of): | 70.1% (12/31/2013) | ||||
| IO Period: | None | Current Occupancy (As of): | 70.2% (TTM 1/31/2014) | ||||
| Loan Term (Original): | 84 months | ||||||
| Seasoning: | 1 month | Underwriting and Financial Information: | |||||
| Amortization Term (Original): | 360 months | ||||||
| Loan Amortization Type: | Amortizing Balloon | 3rd Most Recent NOI (As of): | $5,227,652 (12/31/2012) | ||||
| Interest Accrual Method: | Actual/360 | 2nd Most Recent NOI (As of): | $5,640,107 (12/31/2013) | ||||
| Call Protection: | L(25),D(55),O(4) | Most Recent NOI (As of): | $5,812,267 (TTM 1/31/2014) | ||||
| Lockbox Type: | Hard/Springing Cash Management | ||||||
| Additional Debt: | Yes | ||||||
Additional Debt Type(1): | Future Mezzanine | U/W Revenues: | $28,119,922 | ||||
| U/W Expenses: | $22,438,651 | ||||||
| U/W NOI: | $5,681,271 | ||||||
| U/W NCF: | $4,614,090 | ||||||
Escrows and Reserves(2): | U/W NOI DSCR: | 1.95x | |||||
| U/W NCF DSCR: | 1.59x | ||||||
Type: | Initial | Monthly | Cap (If Any) | U/W NOI Debt Yield: | 12.4% | ||
| Taxes | $199,070 | $66,357 | NAP | U/W NCF Debt Yield: | 10.0% | ||
| Insurance | $0 | Springing | NAP | As-Is Appraised Value: | $65,600,000 | ||
| FF&E | $88,932 | $88,932 | NAP | As-Is Appraisal Valuation Date: | January 16, 2014 | ||
Deferred Maintenance(3) | $1,079,375 | $0 | NAP | Cut-off Date LTV Ratio: | 70.0% | ||
Texas Grande Reserve(4) | $1,100,000 | $0 | NAP | LTV Ratio at Maturity or ARD: | 61.9% | ||
| (1) | See “Subordinate and Mezzanine Indebtedness” section. |
| (2) | See “Escrows” section. |
| (3) | Initial escrow will be used to fund immediate repairs to be completed in 2014, including upgrades to pavement and parking, interior finishes & components, HVAC, and elevators. |
| (4) | Initial escrow will be used to fund a remodeling of the Texas Grande Hall, the Hilton DFW Property’s largest meeting space consisting of 14,400 square feet. |
The Mortgage Loan. The mortgage loan (the Hilton DFW Lakes Hotel and Conference Center Mortgage Loan, herein referred to as the “Hilton DFW Mortgage Loan”) is evidenced by a single promissory note that is secured by a first mortgage encumbering a full service hotel and conference center located in Grapevine, Texas (the Hilton DFW Lakes Hotel and Conference Center Property, herein referred to as the “Hilton DFW Property”). The Hilton DFW Mortgage Loan was originated on March 6, 2014 by The Royal Bank of Scotland. The Hilton DFW Mortgage Loan had an original principal balance of $46,000,000, has an outstanding principal balance as of the Cut-off Date of $45,943,116 and accrues interest at an interest rate of 4.844% per annum. The Hilton DFW Mortgage Loan had an initial term of 84 months, has a remaining term of 83 months as of the Cut-off Date and requires payments of principal and interest based on a 30-year amortization schedule. The Hilton DFW Mortgage Loan matures on April 1, 2021.
Following the lockout period, the borrower has the right to defease the Hilton DFW Mortgage Loan in whole, but not in part, on any date before January 1, 2021. In addition, the Hilton DFW Mortgage Loan is prepayable without penalty on or after January 1, 2021.
Sources and Uses
| Sources | Uses | |||||||||
| Original loan amount | $46,000,000 | 99.7 | % | Loan payoff | $43,332,505 | 93.9 | % | |||
| Sponsor’s new cash contribution | 142,490 | 0.3 | Closing costs | 342,608 | 0.7 | |||||
| Reserves | 2,467,377 | 5.3 | ||||||||
| Total Sources | $46,142,490 | 100.0 | % | Total Uses | $46,142,490 | 100.0 | % |
THE INFORMATION IN THIS STRUCTURAL AND COLLATERAL TERM SHEET IS NOT COMPLETE AND MAY BE AMENDED PRIOR TO THE TIME OF SALE. THIS TERM SHEET IS NOT AN OFFER TO SELL THESE SECURITIES AND IT IS NOT A SOLICITATION OF AN OFFER TO BUY THESE SECURITIES IN ANY JURISDICTION WHERE THE OFFER OR SALE IS NOT PERMITTED.
88
| HILTON DFW LAKES HOTEL AND CONFERENCE CENTER |
The Property. The Hilton DFW Property is a 393-room, 10-story full service hotel located in Grapevine, Texas approximately 3.1 miles from the Dallas/Fort Worth International Airport. The Hilton DFW Property was constructed in 1983 and renovated in 2006 and 2012. The 2006 renovation included improvements to the lobby. Additionally, in 2007 all guestrooms (except casegoods) were refurbished and in 2012 additional upgrades were made as select casegoods in many of the guestrooms were refurbished. The Texas Grande Reserve of $1.1 million will be used to fund renovations to the Texas Grande Hall, which are expected to take place in 2014 and will involve relocating the HVAC units and updating the lighting, sound, and aesthetics of the room. This renovation should allow the hotel to capture larger groups and one-night events such as wedding receptions and other banquets. Due to its conference center design and orientation, the Hilton DFW Property generates the majority of its revenue from meeting & group business. The Hilton DFW Property features 234 queen guestrooms, 151 king guestrooms, and eight suite guestrooms. Amenities at the Hilton DFW Property include a grill and bar, conference dining room, full-service restaurant that serves breakfast, lunch and dinner for conference guests, café, pool, fitness center, gift shop, and over 48,951 square feet of meeting space. The Hilton DFW Property also features tennis courts, racquetball courts, volleyball court, outdoor basketball court, and a ten-acre lake. The Hilton DFW Property has 527 surface parking spaces and is an International Association of Conference Centers (IACC) certified conference center. The franchise agreement with Hilton expires in December 2025.
Operating History and Underwritten Net Cash Flow. The following table represents certain information relating to the historical operating performance and the Underwritten Net Cash Flow at the Hilton DFW Property:
Cash Flow Analysis
2011(1) | 2012 | 2013 | TTM 1/31/2014 | U/W | U/W $ per Room | |||||||
| Occupancy | 65.6% | 66.4% | 70.1% | 70.2% | 70.2% | |||||||
| ADR | $142.10 | $138.49 | $139.47 | $139.74 | $139.74 | |||||||
| RevPAR | $93.22 | $91.96 | $97.77 | $98.10 | $98.10 | |||||||
| Total Revenue | $26,639,573 | $26,976,525 | $27,764,330 | $28,121,593 | $28,119,922 | $71,552 | ||||||
| Total Department Expenses | 9,424,664 | 9,466,599 | 9,447,145 | 9,527,642 | 9,527,646 | 24,243 | ||||||
| Gross Operating Profit | $17,214,909 | $17,509,926 | $18,317,185 | $18,593,951 | $18,592,277 | $47,309 | ||||||
| Total Undistributed Expenses | 11,531,852 | 11,532,665 | 11,773,328 | 11,887,131 | 11,905,383 | 30,294 | ||||||
| Profit Before Fixed Charges | $5,683,057 | $5,977,261 | $6,543,857 | $6,706,820 | $6,686,893 | $17,015 | ||||||
| Total Fixed Charges | 1,107,054 | 749,609 | 903,750 | 894,553 | 1,005,622 | 2,559 | ||||||
| Net Operating Income | $4,576,003 | $5,227,652 | $5,640,107 | $5,812,267 | $5,681,271 | $14,456 | ||||||
| FF&E | 0 | 0 | 0 | 0 | 1,067,181 | 2,715 | ||||||
| Net Cash Flow | 4,576,003 | $5,227,652 | $5,640,107 | $5,812,267 | $4,614,090 | $11,741 | ||||||
| NOI DSCR | 1.57x | 1.80x | 1.94x | 2.00x | 1.95x | |||||||
| NCF DSCR | 1.57x | 1.80x | 1.94x | 2.00x | 1.59x | |||||||
| NOI DY | 10.0% | 11.4% | 12.3% | 12.7% | 12.4% | |||||||
| NCF DY | 10.0% | 11.4% | 12.3% | 12.7% | 10.0% | |||||||
| (1) | The 2011 RevPAR is higher than 2012 RevPAR partially due to the NFL Super Bowl taking place in Dallas in February 2011. |
Appraisal. As of the appraisal valuation date of January 16, 2014, the Hilton DFW Property had an “as-is” appraised value of $65,600,000.
Environmental Matters. According to the Phase I environmental site assessment dated January 23, 2014, there was no evidence of any recognized environmental conditions at the Hilton DFW Property.
Market Overview and Competition. The Hilton DFW Property is located in Grapevine, Texas, directly south of the Grapevine Mills Mall, and to the west of the intersection formed by Grapevine Mills Boulevard and Anderson Gibson Road. The Hilton DFW Property is served by the Dallas/Fort Worth International Airport, which is located less than five miles south. State Highway 121 is an arterial route providing access to the north portion of the Dallas/Fort Worth Metroplex and is accessible from the area’s primary regional access routes. Grapevine, Texas is part of the greater Dallas metropolitan area, and is less than 30 miles from neighboring Fort Worth. Dallas’ economy is a diverse commercial, marketing, and industrial center in the southwest. Major industries include defense, financial services, information technology and data, life sciences, telecommunications, and transportation. It has been reported that approximately 50% of jobs in the region are service‐oriented, belonging to such fields as healthcare, recreation and tourism, and financing. The Dallas/Fort Worth International Airport generates significant levels of demand for area hotels, as global and national corporations and organizations find the airport’s central location convenient for hosting meetings in the Dallas/Fort Worth Metroplex. The Hilton DFW Property benefits from other local demand generators such as the Gaylord Texan Resort & Convention Center and the Grapevine Mills Mall, which features a 45,000 square foot Legoland Discovery Center and $15 million Sea Life Center Aquarium, both of which are within two miles of the Hilton DFW Property. Additionally, the Hilton DFW Property benefits from the prevalence of aviation-related businesses in the area, including the headquarters of recently merged American Airlines and US Airways.
THE INFORMATION IN THIS STRUCTURAL AND COLLATERAL TERM SHEET IS NOT COMPLETE AND MAY BE AMENDED PRIOR TO THE TIME OF SALE. THIS TERM SHEET IS NOT AN OFFER TO SELL THESE SECURITIES AND IT IS NOT A SOLICITATION OF AN OFFER TO BUY THESE SECURITIES IN ANY JURISDICTION WHERE THE OFFER OR SALE IS NOT PERMITTED.
89
| HILTON DFW LAKES HOTEL AND CONFERENCE CENTER |
The following table presents certain information relating to the Hilton DFW Property’s competitive set:
Subject and Market Historical Occupancy, ADR and RevPAR(1)
| Competitive Set | Hilton DFW | Penetration Factor | |||||||||||||||||
| Year | Occupancy | ADR | RevPAR | Occupancy | ADR | RevPAR | Occupancy | ADR | RevPAR | ||||||||||
| 12/31/2013 TTM | 73.5% | $138.85 | $102.04 | 68.2% | $143.58 | $97.91 | 92.8% | 103.4% | 96.0% | ||||||||||
| 12/31/2012 TTM | 70.9% | $133.13 | $94.35 | 66.0% | $139.42 | $91.96 | 93.1% | 104.7% | 97.5% | ||||||||||
| 12/31/2011 TTM | 70.2% | $131.85 | $92.51 | 65.6% | $142.13 | $93.22 | 93.5% | 107.8% | 100.8% | ||||||||||
| (1) | Information obtained from a third party hospitality report dated January 17, 2014. According to such third party hospitality report, the competitive set includes the following hotels: Hyatt Regency DFW Airport, Marriott Dallas Fort Worth Airport North, Westin Dallas Fort Worth Airport, Omni Dallas Hotel Park West, Embassy Suites DFW Airport North Outdoor World, Grand Hyatt Dallas Fort Worth Airport and Hilton Dallas Southlake Town Square. |
The Borrower. The borrower is DFW Lakes Owner, LLC, a Delaware limited liability company and a single purpose entity with two independent directors. Legal counsel to the borrower delivered a non-consolidation opinion in connection with the origination of the Hilton DFW Mortgage Loan. Somera Capital Management, LLC, Ben Reiling as trustee of the Revocable Trust of Ben and Judith Reiling, and Ben Reiling, collectively, are the guarantors of certain nonrecourse carveouts under the Hilton DFW Mortgage Loan.
The Sponsor. The sponsors for the Hilton DFW Mortgage Loan are Somera Capital Management and Zelman Retail Partners. Somera Capital Management is a boutique real estate investment firm founded in 1994. Somera Capital Management’s management team has significant experience in real estate acquisitions, financing, dispositions, and asset and property management and has an average of 20 years of experience in the real estate industry. The company’s diversified real estate portfolio is located primarily in the western United States and includes commercial, industrial, retail and hospitality properties. Somera has acquired in excess of 70 properties with an original cost basis of $1.8 billion. Somera Capital Management has partnered with Zelman Retail Partners on various development and investment projects, and together they have successfully developed over 1.5 million square feet of retail properties. Zelman Development Co. conducts many of its business activities under the name Zelman Retail Partners. Zelman Development Co. is a privately owned commercial real estate development company headquartered in Los Angeles, California. Zelman Development Co. was founded in 1965 and has been developing commercial real estate properties for over 35 years, including over 8,000,000 leasable square feet of retail, industrial and office properties worth over $1 billion. See “Risk Factors—Risks Related to the Mortgage Loans—Prior Bankruptcies or Other Proceedings May Be Relevant to Future Performance” and “Description of the Mortgage Pool – Default History, Bankruptcy Issues and Other Proceedings” in the Free Writing Prospectus.
Escrows. The loan documents provide for upfront escrows in the amount of $199,070 for real estate taxes, $88,932 for FF&E and $1,079,375 for deferred maintenance associated with immediate repairs to be completed in 2014, including upgrades to pavement and parking, interior finishes and components, HVAC, and elevators. The loan documents provide for monthly escrows in the amount of $66,357 for real estate taxes and $88,932 for FF&E. Ongoing monthly insurance reserves are not required as long as (i) no event of default has occurred and is continuing; and (ii) the Hilton DFW Property is covered by an acceptable blanket policy. The loan documents also require an initial escrow in the amount of $1,100,000 to fund a remodeling of the Texas Grande Hall, the Hilton DFW Property’s largest meeting space consisting of 14,400 square feet.
Lockbox and Cash Management. The Hilton DFW Mortgage Loan requires a lender-controlled operating account, which is already in place. Prior to the occurrence of a Cash Management Period (as defined below), all funds on deposit in the operating account may be used by the borrower. During a Cash Management Period, all funds on deposit in the operating account are swept to a lender-controlled cash management account on a daily basis.
A “Cash Management Period” will commence upon the earlier of (i) the occurrence and continuance of an event of default or (ii) the debt service coverage ratio falling below 1.20x as of the last day of the calendar quarter. A Cash Management Period will expire upon (a) with respect to clause (i), upon the cure of such event of default or (b) with respect to clause (ii), the debt service coverage ratio being at least 1.20x for two consecutive calendar quarters.
A Cash Management Period will also commence upon a “Franchise Sweep Period”, which is defined as beginning on the first payment date following the (i) date that is 12 months prior to the expiration of the stated term of any franchise agreement, or (ii) any franchise agreement being surrendered, cancelled or terminated. A Franchise Sweep Period will expire upon: (a) the date the franchise agreement has been irrevocably renewed or reinstated, or in lender’s reasonable judgment, sufficient funds have been accumulated in the property improvement plan (“PIP”) subaccount to pay for all anticipated PIPs or similar capital improvements in connection with such renewal or reinstatement, or (b) the date on which a replacement franchise agreement reasonably acceptable to lender is executed and is in full force and effect and, in lender’s reasonable judgment, sufficient funds have been accumulated in the PIP subaccount to pay for all anticipated PIPs or similar capital improvements in connection with such replacement franchise agreement.
Property Management. The Hilton DFW Property is managed by Quorum Hotel Advisors, LLC, as assignee and owner of DFW Operating Company.
Assumption. The borrower has the right to transfer the Hilton DFW Property and cause an assumption of the Hilton DFW Mortgage Loan, provided that certain conditions are satisfied, including but not limited to: (i) no event of default has occurred and is continuing; (ii) the proposed transferee, the property manager and management agreement are satisfactory to the lender and the applicable rating
THE INFORMATION IN THIS STRUCTURAL AND COLLATERAL TERM SHEET IS NOT COMPLETE AND MAY BE AMENDED PRIOR TO THE TIME OF SALE. THIS TERM SHEET IS NOT AN OFFER TO SELL THESE SECURITIES AND IT IS NOT A SOLICITATION OF AN OFFER TO BUY THESE SECURITIES IN ANY JURISDICTION WHERE THE OFFER OR SALE IS NOT PERMITTED.
90
| HILTON DFW LAKES HOTEL AND CONFERENCE CENTER |
agencies; and (iii) the lender has received confirmation from DBRS, KBRA and Moody’s that such assumption will not result in a downgrade, withdrawal or qualification of the respective ratings assigned to the Series 2014-C20 Certificates.
Partial Release. The borrower may obtain the release of two unimproved, non-income producing outparcels from the Hilton DFW Mortgage Loan, at any time, subject to certain conditions including: (x) with respect to the western outparcel, (i) the transfer is to an affiliate of the borrower for the development of an event facility or other amenity to the Hilton DFW Property and (ii) borrower executes and delivers to the lender a leasehold deed of trust encumbering the borrower’s leasehold estate in the western outparcel in a form substantially similar to the deed of trust delivered in connection with the Hilton DFW Mortgage Loan and (y) with respect to both the northeastern outparcel and the western outparcel, (i) no event of default has occurred and is continuing; (ii) the borrower has certified to the lender that the release of the parcel will not materially and adversely affect the use, operations or economic value of the remaining improvements; and (iii) following the release, the loan-to-value ratio of the remaining properties must satisfy REMIC requirements.
Right of First Offer. The franchise licensor has a 45-day right of first offer to purchase or lease the Hilton DFW Property (the “ROFO”) in any sale or lease of the hotel or sale of the entity that owns the Hilton DFW Property or controlling interest in that entity, or sale of a controlling affiliate or controlling interest in a controlling affiliate. The ROFO is not extinguished by a foreclosure of the Hilton DFW Property; however, the ROFO does not apply to a foreclosure or a deed-in-lieu thereof.
Real Estate Substitution. Not permitted.
Subordinate and Mezzanine Indebtedness. The borrower has the right to incur mezzanine financing subject to the satisfaction of certain conditions, including: (i) execution of an intercreditor agreement in form and substance reasonably acceptable to the lender and each of DBRS, KBRA and Moody’s; (ii) the combined loan-to-value ratio is not greater than 70.0%; (iii) the combined amortizing debt service coverage ratio is not less than 1.25x; (iv) mezzanine loan documents that are reasonably acceptable to the lender; and (v) receipt of rating agency confirmation from DBRS, KBRA and Moody’s that the mezzanine financing will not result in a downgrade, withdrawal or qualification of the respective ratings assigned to the Series 2014-C20 Certificates.
Ground Lease. None.
Terrorism Insurance. The loan documents require that the “all risk” insurance policy required to be maintained by the borrower provide coverage for terrorism in an amount equal to the full replacement cost of the Hilton DFW Property, as well as business interruption insurance covering no less than the 18-month period following the occurrence of a casualty event, together with a six-month extended period of indemnity.
THE INFORMATION IN THIS STRUCTURAL AND COLLATERAL TERM SHEET IS NOT COMPLETE AND MAY BE AMENDED PRIOR TO THE TIME OF SALE. THIS TERM SHEET IS NOT AN OFFER TO SELL THESE SECURITIES AND IT IS NOT A SOLICITATION OF AN OFFER TO BUY THESE SECURITIES IN ANY JURISDICTION WHERE THE OFFER OR SALE IS NOT PERMITTED.
91
| RESIDENCE INN AVENTURA |

THE INFORMATION IN THIS STRUCTURAL AND COLLATERAL TERM SHEET IS NOT COMPLETE AND MAY BE AMENDED PRIOR TO THE TIME OF SALE. THIS TERM SHEET IS NOT AN OFFER TO SELL THESE SECURITIES AND IT IS NOT A SOLICITATION OF AN OFFER TO BUY THESE SECURITIES IN ANY JURISDICTION WHERE THE OFFER OR SALE IS NOT PERMITTED.
92
| RESIDENCE INN AVENTURA |
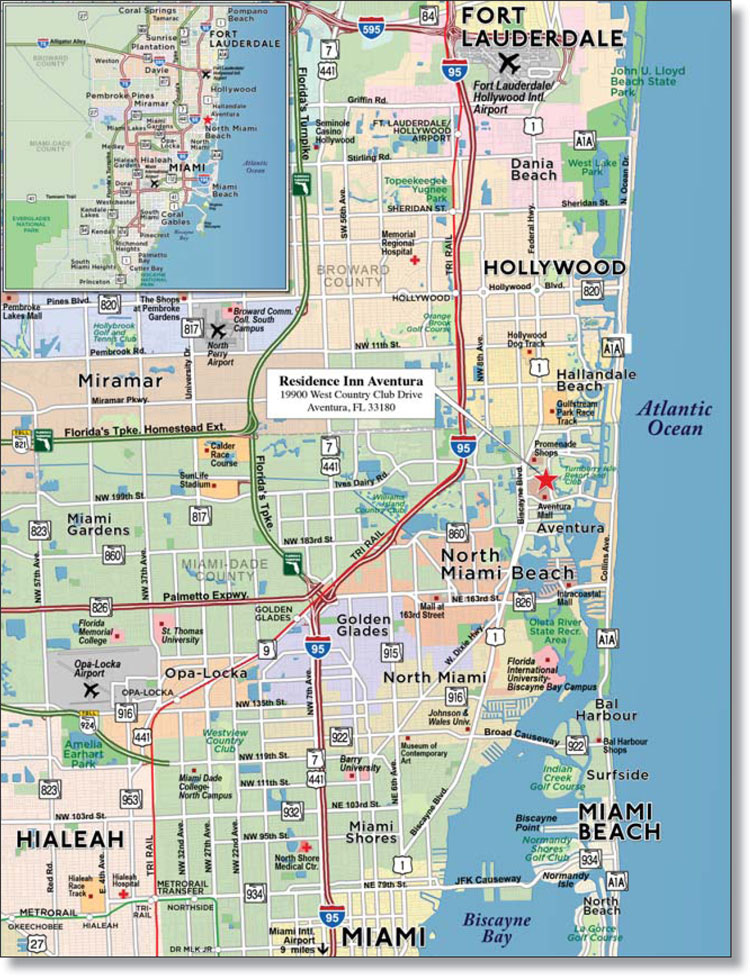
THE INFORMATION IN THIS STRUCTURAL AND COLLATERAL TERM SHEET IS NOT COMPLETE AND MAY BE AMENDED PRIOR TO THE TIME OF SALE. THIS TERM SHEET IS NOT AN OFFER TO SELL THESE SECURITIES AND IT IS NOT A SOLICITATION OF AN OFFER TO BUY THESE SECURITIES IN ANY JURISDICTION WHERE THE OFFER OR SALE IS NOT PERMITTED.
93
| Loan Information | Property Information | |||||||
| Mortgage Loan Seller: | Rialto Mortgage Finance, LLC | Single Asset/Portfolio: | Single Asset | |||||
Credit Assessment (DBRS/KBRA/Moody’s): | NR/NR/NR | Property Type: | Hospitality | |||||
| Original Principal Balance: | Specific Property Type: | Extended Stay | ||||||
| Cut-off Date Principal Balance: | Location: | |||||||
| % of Initial Pool Balance: | 3.1% | Size: | ||||||
| Loan Purpose: | Cut-off Date Principal Balance Per Room: | |||||||
| Borrower Name: | Year Built/Renovated: | |||||||
| Sponsor: | Title Vesting(2): | |||||||
| Mortgage Rate: | Property Manager: | Self-managed | ||||||
| Note Date: | 3rd Most Recent Occupancy (As of): | |||||||
| Anticipated Repayment Date: | NAP | 2nd Most Recent Occupancy (As of): | ||||||
| Maturity Date: | April 6, 2019 | Most Recent Occupancy (As of): | ||||||
| IO Period: | None | Current Occupancy (As of): | ||||||
| Loan Term (Original): | ||||||||
| Seasoning: | 1 month | Underwriting and Financial Information: | ||||||
| Amortization Term (Original): | ||||||||
| Loan Amortization Type: | Amortizing Balloon | 3rd Most Recent NOI (As of): | ||||||
| Interest Accrual Method: | Actual/360 | 2nd Most Recent NOI (As of): | ||||||
| Call Protection: | L(25),D(31),O(4) | Most Recent NOI (As of): | ||||||
| Lockbox Type: | ||||||||
| Additional Debt: | None | U/W Revenues: | ||||||
| Additional Debt Type: | NAP | U/W Expenses: | ||||||
| U/W NOI: | ||||||||
| U/W NCF: | ||||||||
Escrows and Reserves(1): | U/W NOI DSCR: | |||||||
| U/W NCF DSCR: | ||||||||
Type: | Initial | Monthly | Cap (If Any) | U/W NOI Debt Yield: | ||||
| Taxes | NAP | U/W NCF Debt Yield: | ||||||
| Insurance | Springing | NAP | As-Is Appraised Value: | |||||
| FF&E | NAP | As-Is Appraisal Valuation Date: | ||||||
| Seasonality Reserve | $0 | Springing | $500,000 | Cut-off Date LTV Ratio: | ||||
| Construction Reserve Funds | Springing | NAP | LTV Ratio at Maturity or ARD: | 59.7% | ||||
| (1) | See “Escrows” section. |
| (2) | The borrower owns the leasehold interest and an affiliate of the borrower owns the underlying fee interest, which interest was pledged to the lender in connection with the Residence Inn Aventura Mortgage Loan origination. See “Ground Lease” section. |
The Mortgage Loan. The mortgage loan (the “Residence Inn Aventura Mortgage Loan”) is evidenced by a single promissory note secured by a first mortgage encumbering both fee and leasehold interests in an extended stay hotel located in Aventura, Florida (the “Residence Inn Aventura Property”). The Residence Inn Aventura Mortgage Loan was originated on March 7, 2014 by Rialto Mortgage Finance, LLC. The Residence Inn Aventura Mortgage Loan had an original principal balance of $38,500,000, has an outstanding principal balance as of the Cut-off Date of $38,449,540 and accrues interest at an interest rate of 4.526% per annum. The Residence Inn Aventura Mortgage Loan had an initial term of 60 months, has a remaining term of 59 months as of the Cut-off Date and requires payments of principal and interest based on a 30-year amortization schedule. The Residence Inn Aventura Mortgage Loan matures on April 6, 2019.
Following the lockout period, the borrower has the right to defease the Residence Inn Aventura Mortgage Loan in whole, but not in part, on any date before January 6, 2019. In addition, the Residence Inn Aventura Mortgage Loan is prepayable without penalty on or after January 6, 2019.
Sources and Uses
THE INFORMATION IN THIS STRUCTURAL AND COLLATERAL TERM SHEET IS NOT COMPLETE AND MAY BE AMENDED PRIOR TO THE TIME OF SALE. THIS TERM SHEET IS NOT AN OFFER TO SELL THESE SECURITIES AND IT IS NOT A SOLICITATION OF AN OFFER TO BUY THESE SECURITIES IN ANY JURISDICTION WHERE THE OFFER OR SALE IS NOT PERMITTED.
94
| RESIDENCE INN AVENTURA |
The Property. The Residence Inn Aventura Property is a 191-room, nine-story full service extended stay hotel located in Aventura, Florida, approximately 15 miles north of downtown Miami and 10 miles south of downtown Fort Lauderdale. The Residence Inn Aventura Property was constructed in 2002 and renovated in 2009. Since 2009, the borrower has invested approximately $3.5 million ($18,324 per room) in capital expenditures, including replacing carpets, furnishings, televisions, wall coverings, bedding and lighting fixtures in rooms; resurfacing the parking lot, roof and pool area in 2012; and replacing the fitness center equipment and the telephones, top sheets and pillows in the rooms in 2013. The Residence Inn Aventura Property features 35 two-bedroom suites, 96 one-bedroom suites, and 60 studio suites. The Residence Inn Aventura Property amenities include 2,566 square feet of meeting space, breakfast area with buffet, business center, outdoor pool with whirlpool, outdoor gazebo with barbeque grill area and fitness center. The franchise agreement expires in October 2022, with one 10-year extension option.
Operating History and Underwritten Net Cash Flow. The following table presents certain information relating to the historical operating performance and Underwritten Net Cash Flow at the Residence Inn Aventura Property:
Cash Flow Analysis
2/28/2014 | U/W | U/W $ per Room | ||||||||
| Occupancy | ||||||||||
| ADR | ||||||||||
| RevPAR | ||||||||||
| Total Revenue | ||||||||||
| Total Department Expenses | ||||||||||
| Gross Operating Profit | ||||||||||
| Total Undistributed Expenses | ||||||||||
| Profit Before Fixed Charges | ||||||||||
| Total Fixed Charges | ||||||||||
| Net Operating Income | ||||||||||
| FF&E | ||||||||||
| Net Cash Flow | ||||||||||
| NOI DSCR | ||||||||||
| NCF DSCR | ||||||||||
| NOI DY | ||||||||||
| NCF DY | ||||||||||
Appraisal. As of the appraisal valuation date of January 27, 2014, the Residence Inn Aventura Property had an “as-is” appraised value of $59,000,000.
Environmental Matters. According to a Phase I environmental assessment dated February 21, 2014, there was no evidence of any recognized environmental conditions at the Residence Inn Aventura Property.
Market Overview and Competition. The Residence Inn Aventura Property is located in Aventura, Florida approximately 15 miles north of downtown Miami and 10 miles south of downtown Fort Lauderdale. The Residence Inn Aventura Property is located adjacent to an area known as Turnberry Isle, which includes a mixture of high-rise residential condominium buildings and gated townhouse communities. The Residence Inn Aventura Property is also adjacent to Turnberry Isle Resort (a Marriott Autograph Collection hotel) and the Aventura Mall. Other nearby attractions include beaches, Sun Life Stadium (home of the NFL’s Miami Dolphins), the Village at Gulfstream Park (a part of the Gulfstream Park Racetrack and Casino, which also provides shopping and dining) and Calder Race track. Aventura Mall is the largest conventional shopping mall in Florida at over 2.7 million square feet and is anchored by Bloomingdale’s, Macy’s, Nordstrom, JC Penney, a 24-screen AMC Movie Theatre and Sears, and contains approximately 250 specialty stores as well as restaurants including Bella Luna, the Cheesecake Factory, La Valentina, Rosalia’s and Sushi Siam. Aventura Mall also contains a large nautical themed indoor playground known as Adventurer’s Cove and attracts nearly 30 million visitors annually. Luxury boutiques at the Aventura Mall include Louis Vuitton, Cartier, Burberry, Red Valentino, Emilio Pucci and Breitling.
THE INFORMATION IN THIS STRUCTURAL AND COLLATERAL TERM SHEET IS NOT COMPLETE AND MAY BE AMENDED PRIOR TO THE TIME OF SALE. THIS TERM SHEET IS NOT AN OFFER TO SELL THESE SECURITIES AND IT IS NOT A SOLICITATION OF AN OFFER TO BUY THESE SECURITIES IN ANY JURISDICTION WHERE THE OFFER OR SALE IS NOT PERMITTED.
95
| RESIDENCE INN AVENTURA |
The following table presents certain information relating to the Residence Inn Aventura Property’s competitive set:
Subject and Market Historical Occupancy, ADR and RevPAR(1)
| Competitive Set | Residence Inn Aventura | Penetration Factor | |||||||||||||||||
Year | Occupancy | ADR | RevPAR | Occupancy | ADR | RevPAR | Occupancy | ADR | RevPAR | ||||||||||
| 2013 | 82.3% | $133.01 | $109.48 | 83.1% | $176.84 | $146.92 | 100.9% | 132.9% | 134.2% | ||||||||||
| 2012 | 79.1% | $125.12 | $98.92 | 81.1% | $178.70 | $144.97 | 102.6% | 142.8% | 146.6% | ||||||||||
| 2011 | 78.7% | $120.93 | $95.17 | 84.1% | $165.06 | $138.83 | 106.9% | 136.5% | 145.9% | ||||||||||
| (1) | Information obtained from a third party hospitality research report dated January 17, 2014. According to such third party hospitality report, the competitive set includes the following hotels: Hampton Inn & Suites Fort Lauderdale Airport South Cruise Port, Holiday Inn Fort Lauderdale Hollywood Airport, Springhill Suites Fort Lauderdale Airport & Cruise Port, Courtyard Miami Aventura Mall, Doubletree Ocean Point Resort & Spa Miami, Hampton Inn Hallandale Beach Aventura, Hilton Garden Inn Fort Lauderdale Hollywood Airport, Courtyard Fort Lauderdale Airport & Cruise Port. |
The Borrower. The borrower is N-Site Limited Partnership, a single purpose entity with two independent directors. Legal counsel to the borrower delivered a non-consolidation opinion in connection with the origination of the Residence Inn Aventura Mortgage Loan. Jeffrey Soffer is the guarantor of certain nonrecourse carveouts under the Residence Inn Aventura Mortgage Loan.
The Sponsor. The sponsor, Turnberry Associates, is a real estate development and property management group of companies founded in 1967 that has developed approximately 20 million square feet of retail space, more than 7,000 apartment and condominium units, 1.5 million square feet of office space, and in excess of 2,000 hotel and resort rooms. Jeffrey Soffer currently serves as CEO and chairman of Turnberry Associates. Turnberry Associates owns two of the properties within the competitive set of the Residence Inn Aventura Property, the Hampton Inn Hallandale Beach Aventura and the Courtyard Miami Aventura Mall, as well as the Aventura Mall. Jeffery Soffer and other parties are parties to ongoing litigation and is affiliated with one or more entities that filed for bankruptcy protection. For additional information, see “Description of the Mortgage Pool—Litigation Considerations” and “—Default History, Bankruptcy Issues and Other Proceedings” in the Free Writing Prospectus.
Escrows. The loan documents provide for upfront reserves in the amount of $42,624 for real estate taxes. The loan documents provide for monthly escrows in the amount of $40,594 for real estate taxes and $36,829 for FF&E. Ongoing monthly reserves for insurance are not required as long as the Residence Inn Aventura Property is covered by an acceptable blanket insurance policy. During a Cash Management Period (as defined below), all excess cash flow will be swept into a seasonality reserve account subject to a cap of $500,000. Prior to the undertaking of an Expansion Project (see “Expansion Project” section), the loan documents require the deposit of 125% of the amount of the project related costs, provided that if the project cost budget includes a contingency for not less than 10% of all costs, the required deposit will be reduced to 110% of the project related costs.
Lockbox and Cash Management. The Residence Inn Aventura Mortgage Loan requires a lender-controlled lockbox account, which is already in place, and the borrower is required to instruct credit card companies to cause all amounts to be delivered directly into the lockbox account. The loan documents also require that all revenues received by the borrower or the property manager be deposited into the lockbox account within one business day of receipt. Prior to the occurrence of a Cash Management Period, all funds on deposit in the lockbox account are released to the borrower. During a Cash Management Period, all funds on deposit in the lockbox account are swept to a lender-controlled cash management account. During a Cash Sweep Event Period (as defined below) all excess cash flow will be swept into a lender-controlled account and held as additional collateral.
A “Cash Management Period” will commence upon the occurrence of any of the following events: (i) an event of default, (ii) any bankruptcy action of the borrower, guarantor, or property manager, (iii) the lender determines on any date the debt service coverage ratio is less than 1.20x, or (iv) if the debt service coverage ratio falls below 1.40x and the balance in the seasonality reserve account is less than $500,000. A Cash Management Period will end upon, in the case of clause (i), the cure of such event of default; in the case of clause (ii), the discharge of such bankruptcy; in the case of clause (iii), the debt service coverage ratio being at least 1.20x for two consecutive calendar quarters; or in the case of clause (iv), the debt service coverage ratio being at least 1.40x or the balance in the seasonality reserve account exceeding $500,000.
A “Cash Sweep Event Period” will commence upon the occurrence of any of the following events: (i) an event of default, (ii) any bankruptcy action of the borrower, guarantor or property manager, or (iii) if the lender determines on any date the debt service coverage ratio falls below 1.10x. A Cash Sweep Event Period will end upon, in the case of clause (i), the cure of such event of default; in the case of clause (ii), the discharge of such bankruptcy; or in the case of clause (iii), the debt service coverage ratio being at least 1.10x for two consecutive calendar quarters.
Property Management. The Residence Inn Aventura Property is managed by an affiliate of the borrower.
Assumption. The borrower has the right to transfer the Residence Inn Aventura Property, provided that no event of default has occurred and is continuing and certain other conditions are satisfied, including (i) the lender’s reasonable determination that the proposed transferee and guarantor satisfy the credit review and underwriting standards set forth in the Residence Inn Aventura Mortgage Loan documents, including, transferee experience, financial strength and general business standing; (ii) execution of a recourse guaranty and an environmental indemnity by an affiliate of the transferee; and (iii) if requested by the lender, rating agency confirmation from DBRS, KBRA and Moody’s that the transfer will not result in a downgrade, withdrawal or qualification of the respective ratings assigned to the Series 2014-C20 Certificates.
THE INFORMATION IN THIS STRUCTURAL AND COLLATERAL TERM SHEET IS NOT COMPLETE AND MAY BE AMENDED PRIOR TO THE TIME OF SALE. THIS TERM SHEET IS NOT AN OFFER TO SELL THESE SECURITIES AND IT IS NOT A SOLICITATION OF AN OFFER TO BUY THESE SECURITIES IN ANY JURISDICTION WHERE THE OFFER OR SALE IS NOT PERMITTED.
96
| RESIDENCE INN AVENTURA |
Expansion Project. Pursuant to the Residence Inn Aventura Mortgage Loan documents, the borrower may expand the Residence Inn Aventura Property by approximately 100 rooms (the “Expansion Project”) if certain conditions are satisfied, including, but not limited to (i) the borrower depositing an amount equal to 125% of the direct and indirect costs and expenses for the Expansion Project; provided that if the project cost budget includes a contingency of not less than 10% of all costs, the required deposit must be 110% of the direct and indirect costs and expenses for the Expansion Project; (ii) the guarantor executing and delivering to the lender a completion guaranty in form and substance acceptable to the lender; and (iii) the lender determining that any alterations with respect to the Expansion Project would not have a material adverse effect upon (a) the business operations, economic performance, assets, condition, equity, contingent liabilities, prospects, material agreements or results of operations of the borrower, the guarantor or the Residence Inn Aventura Property, (b) the ability of the borrower or guarantor to perform its obligations under the related loan documents, (c) the enforceability or validity of any related loan document, the perfection or priority of any lien created thereunder or the rights, interest and remedies of the lender under any related loan document, or (d) the value, use or operation of the Residence Inn Aventura Property or any material amenities or services provided therewith or the cash flows from the Residence Inn Aventura Property.
Partial Release. Not permitted.
Real Estate Substitution. Not permitted.
Subordinate and Mezzanine Indebtedness. Not permitted.
Ground Lease. The Residence Inn Aventura Property is subject to a ground lease dated March 27, 2001, as amended on March 7, 2014 (the “Ground Lease”), which expires on March 31, 2051, with four 10-year renewal options. The lessor under the ground lease is N-Site Fee Owner LLC, a single purpose entity and an affiliate of the borrower. The fee interest is also encumbered by the Residence Inn Aventura Mortgage Loan. The current annual ground rent payment is $350,000. Commencing April 1, 2016, and on each fifth anniversary thereafter until expiration, the annual rental rate shall increase by $25,000.
Terrorism Insurance. The loan documents require that the “all risk” insurance policy required to be maintained by the borrower provide coverage for terrorism in an amount equal to the full replacement cost of the Residence Inn Aventura Property. The loan documents also require business interruption insurance covering no less than the 18-month period following the occurrence of a casualty event, together with a 12-month extended period of indemnity.
THE INFORMATION IN THIS STRUCTURAL AND COLLATERAL TERM SHEET IS NOT COMPLETE AND MAY BE AMENDED PRIOR TO THE TIME OF SALE. THIS TERM SHEET IS NOT AN OFFER TO SELL THESE SECURITIES AND IT IS NOT A SOLICITATION OF AN OFFER TO BUY THESE SECURITIES IN ANY JURISDICTION WHERE THE OFFER OR SALE IS NOT PERMITTED.
97
(THIS PAGE INTENTIONALLY LEFT BLANK)
98
| SAVOY RETAIL & 60TH STREET RESIDENTIAL |
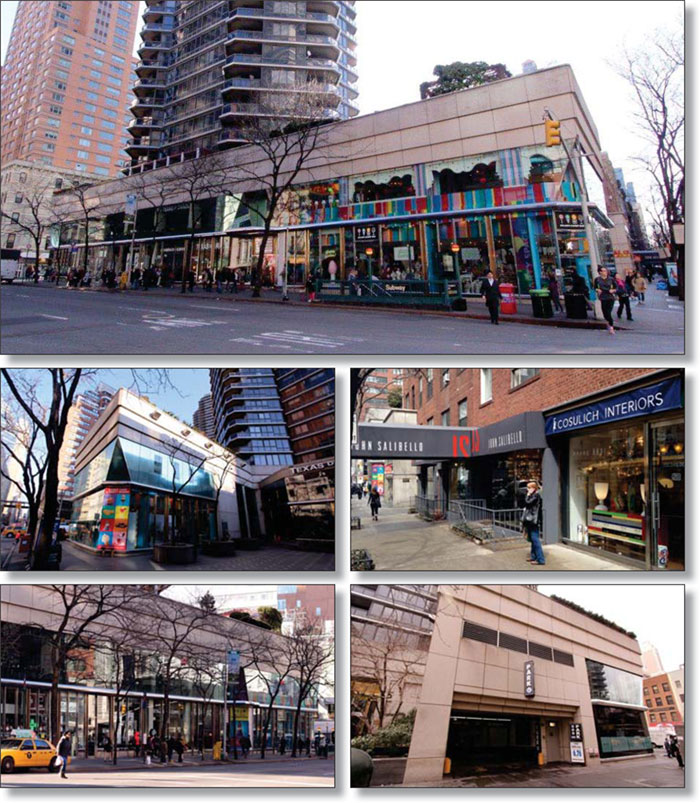
THE INFORMATION IN THIS STRUCTURAL AND COLLATERAL TERM SHEET IS NOT COMPLETE AND MAY BE AMENDED PRIOR TO THE TIME OF SALE. THIS TERM SHEET IS NOT AN OFFER TO SELL THESE SECURITIES AND IT IS NOT A SOLICITATION OF AN OFFER TO BUY THESE SECURITIES IN ANY JURISDICTION WHERE THE OFFER OR SALE IS NOT PERMITTED.
99
| SAVOY RETAIL & 60TH STREET RESIDENTIAL |
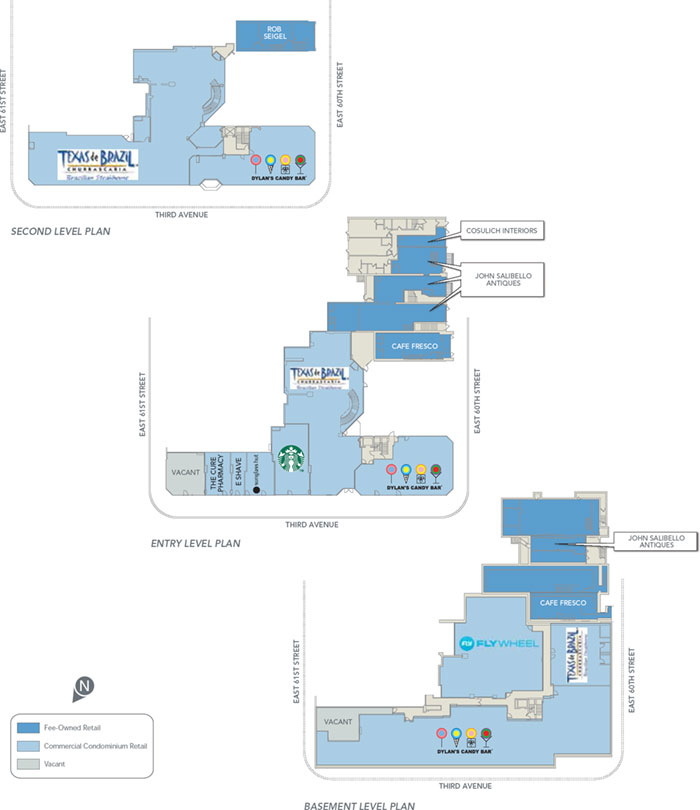
THE INFORMATION IN THIS STRUCTURAL AND COLLATERAL TERM SHEET IS NOT COMPLETE AND MAY BE AMENDED PRIOR TO THE TIME OF SALE. THIS TERM SHEET IS NOT AN OFFER TO SELL THESE SECURITIES AND IT IS NOT A SOLICITATION OF AN OFFER TO BUY THESE SECURITIES IN ANY JURISDICTION WHERE THE OFFER OR SALE IS NOT PERMITTED.
100
| SAVOY RETAIL & 60TH STREET RESIDENTIAL |
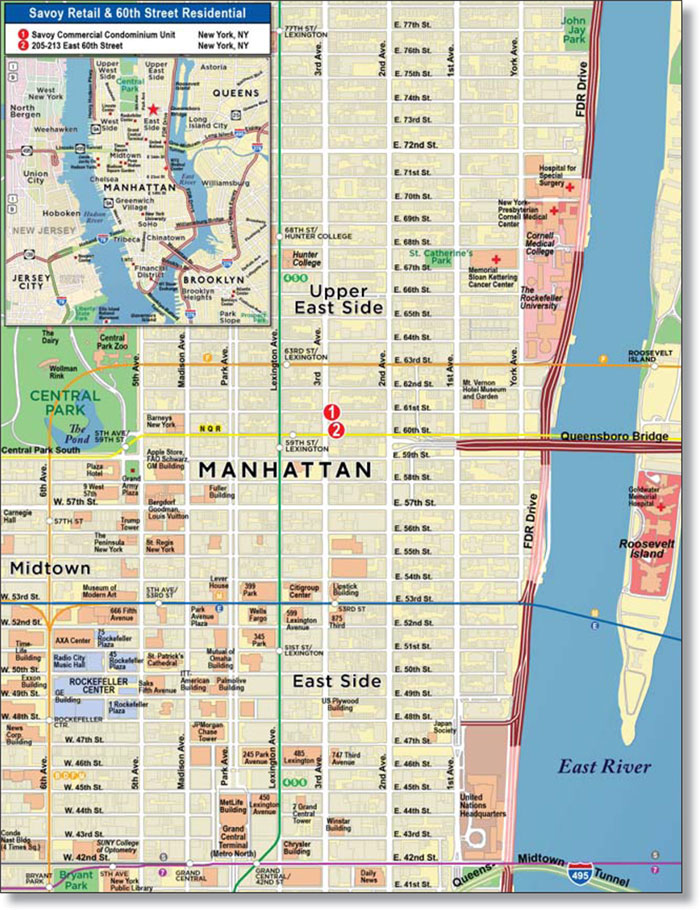
THE INFORMATION IN THIS STRUCTURAL AND COLLATERAL TERM SHEET IS NOT COMPLETE AND MAY BE AMENDED PRIOR TO THE TIME OF SALE. THIS TERM SHEET IS NOT AN OFFER TO SELL THESE SECURITIES AND IT IS NOT A SOLICITATION OF AN OFFER TO BUY THESE SECURITIES IN ANY JURISDICTION WHERE THE OFFER OR SALE IS NOT PERMITTED.
101
| No. 9 – Savoy Retail & 60th Street Residential | ||||||
| Loan Information | Property Information | |||||
| Mortgage Loan Seller: | Rialto Mortgage Finance, LLC | Single Asset/Portfolio: | Portfolio | |||
| Credit Assessment (DBRS/KBRA/Moody’s): | (BBB (low)/BBB-/NR) | Property Type: | Various | |||
| Original Principal Balance: | $35,000,000 | Specific Property Type: | ||||
| Cut-off Date Principal Balance: | $35,000,000 | Location: | New York, NY | |||
| % of Initial Pool Balance: | 2.8% | Size(2): | 71,355 SF | |||
| Loan Purpose: | Refinance | Cut-off Date Principal Balance Per SF: | $490.51 | |||
| Borrower Name: | 3rd and 60th Associates Sub LLC | Year Built/Renovated: | 1910, 1930, 1986/NAP | |||
| Sponsor: | Morton L. Olshan | Title Vesting: | Fee | |||
| Mortgage Rate: | 4.400% | Property Manager: | Self-managed | |||
| Note Date: | February 28, 2014 | 3rd Most Recent Occupancy (As of)(3): | 97.1% (12/31/2010) | |||
| Anticipated Repayment Date: | NAP | 2nd Most Recent Occupancy (As of)(3): | 97.8% (12/31/2011) | |||
| Maturity Date: | Most Recent Occupancy (As of)(3): | 86.0% (12/31/2012) | ||||
| IO Period: | Current Occupancy (As of)(3)(4): | 98.2% (Various) | ||||
| Loan Term (Original): | 120 months | |||||
| Seasoning: | 2 months | Underwriting and Financial Information: | ||||
| Amortization Term (Original): | 360 months | |||||
| Loan Amortization Type: | 3rd Most Recent NOI (As of): | |||||
| Interest Accrual Method: | 2nd Most Recent NOI (As of): | |||||
| Call Protection: | Most Recent NOI (As of): | |||||
| Lockbox Type: | Soft/Springing Cash Management | |||||
| Additional Debt: | None | U/W Revenues: | $6,157,520 | |||
| Additional Debt Type: | NAP | U/W Expenses: | $2,378,112 | |||
U/W NOI(5): | $3,779,408 | |||||
| U/W NCF: | $3,665,354 | |||||
Escrows and Reserves(1): | U/W NOI DSCR: | 1.80x | ||||
| U/W NCF DSCR: | 1.74x | |||||
Type: | Initial | Monthly | Cap (If Any) | U/W NOI Debt Yield: | ||
| Taxes | $369,229 | $123,076 | NAP | U/W NCF Debt Yield: | 10.5% | |
| Insurance | $0 | Springing | NAP | As-Is Appraised Value: | $93,000,000 | |
| Replacement Reserves | $0 | $1,011 | NAP | As-Is Appraisal Valuation Date: | January 21, 2014 | |
| TI/LC Reserve | Springing | $500,000 | Cut-off Date LTV Ratio: | 37.6% | ||
| Free Rent Reserve | $140,000 | NAP | LTV Ratio at Maturity or ARD: | 32.9% | ||
| (1) | See “Escrows” section. |
| (2) | The total square footage includes 56,611 square feet of retail space and 24 multifamily units totaling 14,744 square feet. |
| (3) | Reflects total occupancy based on square footage. Retail occupancy is 98.6% as of February 1, 2014, and multifamily occupancy is 95.8%, based on units, as of December 23, 2013. |
| (4) | Current Occupancy includes 4,674 square feet for Flywheel, which has executed a lease and is expected to take occupancy in July 2014. A free rent reserve in the amount of $140,000 was taken at closing. |
| (5) | See “Cash Flow Analysis” section. |
The Mortgage Loan. The mortgage loan (the “Savoy Retail & 60th Street Residential Mortgage Loan”) is evidenced by a single promissory note that is secured by a first mortgage encumbering a retail condominium and mixed-use property located in New York, New York (the “Savoy Retail & 60th Street Residential Properties”). The Savoy Retail & 60th Street Residential Mortgage Loan was originated on February 28, 2014 by Rialto Mortgage Finance, LLC. The Savoy Retail & 60th Street Residential Mortgage Loan had an original principal balance of $35,000,000, has an outstanding principal balance as of the Cut-off Date of $35,000,000 and accrues interest at an interest rate of 4.400% per annum. The Savoy Retail & 60th Street Residential Mortgage Loan had an initial term of 120 months, has a remaining term of 118 months as of the Cut-off Date and requires interest-only payments for the first 36 payments following origination and, thereafter, requires payments of principal and interest based on a 30-year amortization schedule. The Savoy Retail & 60th Street Residential Mortgage Loan matures on March 6, 2024.
Following the lockout period, the borrower has the right to defease the Savoy Retail & 60th Street Residential Mortgage Loan in whole, but not in part, on any date before December 6, 2023. In addition, the Savoy Retail & 60th Street Residential Mortgage Loan is prepayable without penalty on or after December 6, 2023.
THE INFORMATION IN THIS STRUCTURAL AND COLLATERAL TERM SHEET IS NOT COMPLETE AND MAY BE AMENDED PRIOR TO THE TIME OF SALE. THIS TERM SHEET IS NOT AN OFFER TO SELL THESE SECURITIES AND IT IS NOT A SOLICITATION OF AN OFFER TO BUY THESE SECURITIES IN ANY JURISDICTION WHERE THE OFFER OR SALE IS NOT PERMITTED.
102
| SAVOY RETAIL & 60TH STREET RESIDENTIAL |
Sources and Uses
| Sources | Uses | ||||||||
| Original loan amount | $35,000,000 | 100.0% | Loan payoff | $17,946,917 | 51.3 | % | |||
| Reserves | 509,229 | 1.5 | |||||||
| Closing costs | 749,843 | ||||||||
| Return of equity | 15,794,011 | 45.1 | |||||||
| Total Sources | $35,000,000 | 100.0% | Total Uses | $35,000,000 | 100.0 | % |
The Properties. The Savoy Retail & 60th Street Residential Properties consist of a retail condominium and four mixed-use retail and multifamily buildings located contiguously in New York, New York. Built in 1910, 1930 and 1986, the Savoy Retail & 60th Street Residential Properties consist of 56,611 square feet of retail space and 24 multifamily units. The retail condominium is located within a 43-story, 252,000 square foot mixed-use residential condominium building known as the Savoy. The Savoy Retail & 60th Street Residential Properties feature two levels of frontage along the entire block-front on the east side of Third Avenue between 60th Street and 61st Street, as well as frontage along 60th Street. The Savoy Retail & 60th Street Residential Properties include major tenants Texas de Brazil and Dylan’s Candy Bar, and national tenants Starbucks and Sunglass Hut, as well as a 70-space underground parking garage. As of February 1, 2014, the retail portion of the Savoy Retail & 60th Street Residential Properties was 98.6% leased by 14 tenants; the multifamily portion was 95.8% occupied as of December 23, 2013; and the overall blended occupancy was 98.2% on a square foot basis. Flywheel, a retail tenant, has executed a lease for 4,674 square feet and is expected to take occupancy in July 2014.
The following table presents certain information relating to the tenancies at the retail portion of the Savoy Retail & 60th Street Residential Properties:
Major Tenants
| Tenant Name | Credit Rating (Fitch/ Moody’s/ S&P) | Tenant NRSF | % of NRSF | Annual U/W Base Rent PSF(1) | Annual U/W Base Rent(1) | % of Total Annual U/W Base Rent | Sales PSF | Occupancy Cost | Lease Expiration Date | |
| Major Tenants | ||||||||||
| Dylan’s Candy Bar, LLC | NR/NR/NR | 12,669 | 22.4% | $128.56 | $1,628,759 | 31.3% | NAV | NAV | 1/31/2017 | |
| Total Major Tenants | 27,029 | |||||||||
Non-Major Tenants(2) | 28,816 | |||||||||
| Occupied Collateral Total | 100.0% | |||||||||
| Vacant Space | ||||||||||
| Collateral Total | 100.0% | |||||||||
| (1) |
| (2) | Flywheel, a retail tenant, has executed a lease for 4,674 square feet (8.3% of the retail net rentable area) and is expected to take occupancy in July 2014. |
The following table presents certain information relating to the unit mix of the residential portion of the Savoy Retail & 60th Street Residential Properties:
Unit Mix Summary(1)
| Unit Type | No. of Units | % of Total Units | Average Unit Size (SF) | Average In- Place Monthly Rent per Unit | ||
| Studio | 4 | 16.7% | 437 | $1,218 | ||
| 1 Bedroom/1 Bath | 11 | 45.8% | 523 | $2,126 | ||
| 1 Bedroom/1 Bath, Backyard | 1 | 4.2% | 417 | $2,047 | ||
| 1 Bedroom/1 Bath, Terrace | 6 | 25.0% | 688 | $1,976 | ||
| 2 Bedroom/2 Bath | 1 | 4.2% | 1,148 | $4,095 | ||
| 4 Bedroom/2 Bath | 1 | 4.2% | 1,551 | $6,016 | ||
| Total/Weighted Average | 24 | 100.0% | 614 | $2,180 | ||
| (1) | Information obtained from the underwritten rent roll. |
THE INFORMATION IN THIS STRUCTURAL AND COLLATERAL TERM SHEET IS NOT COMPLETE AND MAY BE AMENDED PRIOR TO THE TIME OF SALE. THIS TERM SHEET IS NOT AN OFFER TO SELL THESE SECURITIES AND IT IS NOT A SOLICITATION OF AN OFFER TO BUY THESE SECURITIES IN ANY JURISDICTION WHERE THE OFFER OR SALE IS NOT PERMITTED.
103
| SAVOY RETAIL & 60TH STREET RESIDENTIAL |
The following table presents certain information relating to the lease rollover schedule at the retail portion of the Savoy Retail & 60th Street Residential Properties:
Lease Expiration Schedule(1)
Year Ending December 31, | No. of Leases Expiring | Expiring NRSF | % of Total NRSF | Cumulative Expiring NRSF | Cumulative % of Total NRSF | Annual U/W Base Rent | Annual U/W Base Rent PSF(2) | ||||||
| MTM | 1.4% | 1.4% | |||||||||||
| 2014 | 1.8% | 3.2% | |||||||||||
| 0.0% | |||||||||||||
| 2.1% | |||||||||||||
| 22.4% | 27.7% | ||||||||||||
| 11.3% | 39.1% | ||||||||||||
| 0.0% | |||||||||||||
| 21.2% | |||||||||||||
| 0.6% | |||||||||||||
| 0.0% | |||||||||||||
| 1.1% | |||||||||||||
| 8.3% | |||||||||||||
| Thereafter | 28.4% | ||||||||||||
| Vacant | 0 | 1.4% | $0 | $0.00 | |||||||||
| Total/Weighted Average | 100.0% | ||||||||||||
| (1) | Information obtained from the underwritten rent roll. |
| (2) | Weighted Average Annual U/W Base Rent PSF excludes vacant space. |
The following table presents historical occupancy percentages at the Savoy Retail & 60th Street Residential Properties:
Historical Occupancy (Retail)
| (1) | Information obtained from the borrower. |
| (2) | Information obtained from the underwritten rent roll. |
Historical Occupancy (Residential)
12/31/2010(1) | 12/31/2011(1) | 12/31/2012(1) | 12/23/2013(2) | |||
| 100.0% | 100.0% | 95.8% | 95.8% |
| (1) | Information obtained from the borrower. |
| (2) | Information obtained from the underwritten rent roll. |
THE INFORMATION IN THIS STRUCTURAL AND COLLATERAL TERM SHEET IS NOT COMPLETE AND MAY BE AMENDED PRIOR TO THE TIME OF SALE. THIS TERM SHEET IS NOT AN OFFER TO SELL THESE SECURITIES AND IT IS NOT A SOLICITATION OF AN OFFER TO BUY THESE SECURITIES IN ANY JURISDICTION WHERE THE OFFER OR SALE IS NOT PERMITTED.
104
| SAVOY RETAIL & 60TH STREET RESIDENTIAL |
Operating History and Underwritten Net Cash Flow. The following table presents certain information relating to the historical operating performance and Underwritten Net Cash Flow at the Savoy Retail & 60th Street Residential Properties:
Cash Flow Analysis
2011 | 2012 | 2013 | U/W(1) | U/W $ per SF | ||||||||||||
| Base Rent - Retail | (2) | $73.02 | ||||||||||||||
| Base Rent - Multifamily | 561,286 | 619,453 | 563,269 | 601,734 | 8.43 | (3) | ||||||||||
| Grossed Up Vacant Space | 283,740 | 3.98 | ||||||||||||||
| Total Reimbursables | ||||||||||||||||
| Other Income | ||||||||||||||||
| Less Vacancy & Credit Loss | ) | ) | ) | (4) | ) | |||||||||||
| Effective Gross Income | ||||||||||||||||
| Total Operating Expenses | ||||||||||||||||
| Net Operating Income | $3,254,490 | $2,995,660 | $2,307,440 | $3,779,408 | $52.97 | |||||||||||
| TI/LC | ||||||||||||||||
| Capital Expenditures | 0 | 0 | 0 | 12,130 | 0.17 | |||||||||||
| Net Cash Flow | $3,254,490 | $2,995,660 | $2,307,440 | $3,665,354 | $51.37 | |||||||||||
| NOI DSCR | 1.55x | 1.42x | 1.10x | 1.80x | ||||||||||||
| NCF DSCR | 1.55x | 1.42x | 1.10x | 1.74x | ||||||||||||
| NOI DY | 9.3% | 8.6% | 6.6% | 10.8% | ||||||||||||
| NCF DY | 9.3% | 8.6% | 6.6% | 10.5% | ||||||||||||
| (1) | Underwritten base rent and net operating income are higher than historical net operating income and base rent due to recent leasing at the Savoy Retail & 60th Street Residential Properties in 2014 including Texas de Brazil (25.4% of net rentable area, 23.0% of underwritten retail base rent and $83.57 underwritten base rent per square foot), Flywheel (8.3% of net rentable area, 5.4% of underwritten retail base rent and $60.00 underwritten base rent per square foot) and Sunglass Hut (1.1% of net rentable area, 4.3% of underwritten retail base rent and $343.33 underwritten base rent per square foot). |
| (2) | Includes contractual rent steps through February 1, 2015, accounting for an increase of $85,208 in Base Rent – Retail. |
(3) | Base Rent – Multifamily is $25,072 per unit, based on 24 units. |
(4) | The underwritten economic vacancy is 4.4%. As of February 1, 2014, the retail portion of the Savoy Retail & 60th Street Residential Properties was 98.6% leased, the multifamily portion was 95.8% physically occupied (as of December 28, 2013), and the overall blended occupancy was 98.2% on a square foot basis. |
Appraisal. As of the appraisal valuation date of January 21, 2014, the Savoy Retail & 60th Street Residential Properties had an aggregate “as-is” appraised value of $93,000,000.
Environmental Matters. According to a Phase I environmental assessment dated January 31, 2014, there was no evidence of any recognized environmental conditions at the Savoy Retail & 60th Street Residential Properties.
Market Overview. The Savoy Retail & 60th Street Residential Properties are located in the Upper East Side market of New York, New York and feature two levels of frontage along the entire block-front on the east side of Third Avenue between 60th Street and 61st Street, as well as frontage along 60th Street. Mass transit access to the Savoy Retail & 60th Street Residential Properties is provided by the N, Q, R, 4, 5, and 6 subway lines located in front of the Dylan’s Candy Bar space on the corner of Third Avenue and 60th Street. Dylan’s Candy Bar attracts over 2.5 million visitors each year on average and the Bloomingdale’s flagship Manhattan department store is located across Third Avenue at 60th Street. According to a third party market research report, as of the fourth quarter of 2013, the estimated population within a one-mile radius was 170,718 and the estimated average household income within a one-mile radius was $164,206.
According to a third party market research report, the Savoy Retail & 60th Street Residential Properties are located within the Upper East Side retail submarket, which has an estimated inventory of 327 retail properties totaling approximately 3.1 million square feet. As of the fourth quarter of 2013, the submarket retail vacancy was 1.7% with an average asking rent of $69.36 per square foot on a triple net basis. According to a third party market research report, The Savoy Retail & 60th Street Residential Properties are located within the Upper East Side multifamily submarket, which has an estimated inventory of 16,237 units. As of the fourth quarter of 2013, the submarket multifamily vacancy was 0.5% with an average asking rent of $3,915 per unit per month.
The Borrower. The borrower is 3rd and 60th Associates Sub LLC, a single purpose entity with one independent director. Morton L. Olshan is the guarantor of certain nonrecourse carveouts under the Savoy Retail & 60th Street Residential Mortgage Loan.
The Sponsor. The sponsor is Morton L. Olshan of Olshan Properties, formerly known as MPI – Mall Properties, Inc. Olshan Properties is a privately owned real estate firm which specializes in development, acquisition, leasing and management of commercial real estate. Olshan Properties was founded in 1959 by Morton L. Olshan and has grown to own and/or operate a portfolio encompassing 11 million square feet of retail space, 19,000 multifamily units, 865 hotel rooms and 5 million square feet of office space.
Escrows. The loan documents provide for upfront reserves in the amount of $369,229 for real estate taxes; and $140,000 for free rent related to a new tenant, Flywheel, who is expected to take occupancy and begin rental payments in July 2014. The loan documents also provide for ongoing monthly reserves in the amount of $123,076 for taxes, $1,011 for replacement reserves and springing (see “Lockbox and Cash Management” section) monthly deposits for tenant improvements and leasing commissions of $9,453, subject to a cap of $500,000. Monthly escrow deposits for insurance are waived provided a blanket insurance policy, subject to lender approval, is in place.
THE INFORMATION IN THIS STRUCTURAL AND COLLATERAL TERM SHEET IS NOT COMPLETE AND MAY BE AMENDED PRIOR TO THE TIME OF SALE. THIS TERM SHEET IS NOT AN OFFER TO SELL THESE SECURITIES AND IT IS NOT A SOLICITATION OF AN OFFER TO BUY THESE SECURITIES IN ANY JURISDICTION WHERE THE OFFER OR SALE IS NOT PERMITTED.
105
| SAVOY RETAIL & 60TH STREET RESIDENTIAL |
Lockbox and Cash Management. The Savoy Retail & 60th Street Residential Mortgage Loan requires a lender-controlled lockbox account, which is already in place, and requires that all rents received by the borrower or the property manager be deposited into the lockbox account within one business day after receipt. Prior to the occurrence of a Cash Management Trigger Event Period (as defined below), all funds on deposit in the lockbox account are disbursed to the borrower. Upon the occurrence of a Cash Management Trigger Event Period, the borrower is required to direct tenants of the Savoy Retail & 60th Street Residential Properties to deposit all rent into a designated lockbox account, and all amounts on deposit in the lockbox account are swept on a daily basis into a lender-controlled cash management account. Upon the occurrence of a Cash Sweep Event Period (as defined below), all excess funds remaining on deposit in the cash management account (after application to debt service, required reserves and any other required amounts) will be swept into lender controlled accounts and held as additional collateral for the Savoy Retail & 60th Street Residential Mortgage Loan.
A “Cash Management Trigger Event Period” will commence (i) if an event of default has occurred or is continuing, (ii) upon the occurrence of a bankruptcy action of the borrower, the guarantor or the property manager, or (iii) if the debt service coverage ratio is less than 1.20x at the end of any calendar quarter. A Cash Management Trigger Event Period will end upon, in the case of clause (i), the cure of such event of default; in the case of clause (ii), the discharge of such bankruptcy; or in the case of clause (iii), the debt service coverage ratio based on the trailing twelve month period being at least 1.20x for two consecutive calendar quarters.
A “Cash Sweep Event Period” will commence (i) if an event of default has occurred or is continuing, (ii) upon the occurrence of a bankruptcy action of the borrower, the guarantor or the property manager, or (iii) if the debt service coverage ratio is less than 1.10x at the end of any calendar quarter. A Cash Sweep Event Period will end upon, in the case of clause (i), the cure of such event of default, in the case of clause (ii), the discharge of such bankruptcy; or in the case of clause (iii), the debt service coverage ratio based on the trailing twelve month period being at least 1.10x for two consecutive calendar quarters.
Property Management. The Savoy Retail & 60th Street Residential Properties are managed by an affiliate of the borrower.
Assumption. The borrower has the right to transfer the Savoy Retail & 60th Street Residential Properties, provided that no event of default has occurred and is continuing and certain other conditions are satisfied, including, but not limited to (i) the lender’s reasonable determination that the proposed transferee and guarantor satisfy the lender’s credit review and underwriting standards, taking into consideration transferee experience, financial strength and general business standing; (ii) execution of a recourse guaranty and an environmental indemnity by an affiliate of the transferee; and (iii) if requested by the lender, rating agency confirmation from DBRS, KBRA and Moody’s that the transfer will not result in a downgrade, withdrawal or qualification of the respective ratings assigned to the Series 2014-C20 Certificates.
Partial Release. Not permitted.
Real Estate Substitution. Not permitted.
Subordinate and Mezzanine Indebtedness. Not permitted.
Ground Lease. None.
Terrorism Insurance. The loan documents require that the “all risk” insurance policy required to be maintained by the borrower provide coverage for terrorism in an amount equal to the full replacement cost of the Savoy Retail & 60th Street Residential Properties; provided, however, that if Terrorism Risk Insurance Act or a similar government backstop is no longer in effect, the borrower shall not be required to spend more than 200% of the costs of a stand-alone policy for terrorism insurance as of the date of origination of the Savoy Retail & 60th Street Residential Mortgage Loan. The loan documents also require business interruption insurance covering no less than the 18-month period following the occurrence of a casualty event, together with a 12-month extended period of indemnity.
THE INFORMATION IN THIS STRUCTURAL AND COLLATERAL TERM SHEET IS NOT COMPLETE AND MAY BE AMENDED PRIOR TO THE TIME OF SALE. THIS TERM SHEET IS NOT AN OFFER TO SELL THESE SECURITIES AND IT IS NOT A SOLICITATION OF AN OFFER TO BUY THESE SECURITIES IN ANY JURISDICTION WHERE THE OFFER OR SALE IS NOT PERMITTED.
106
(THIS PAGE INTENTIONALLY LEFT BLANK)
107
| MINNEAPOLIS APARTMENT PORTFOLIO |
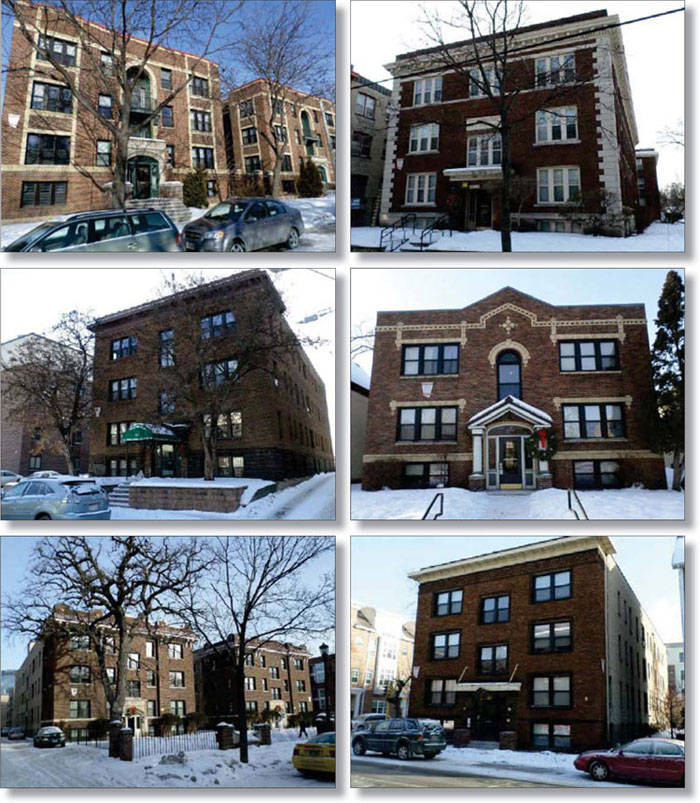
THE INFORMATION IN THIS STRUCTURAL AND COLLATERAL TERM SHEET IS NOT COMPLETE AND MAY BE AMENDED PRIOR TO THE TIME OF SALE. THIS TERM SHEET IS NOT AN OFFER TO SELL THESE SECURITIES AND IT IS NOT A SOLICITATION OF AN OFFER TO BUY THESE SECURITIES IN ANY JURISDICTION WHERE THE OFFER OR SALE IS NOT PERMITTED.
108
| MINNEAPOLIS APARTMENT PORTFOLIO |
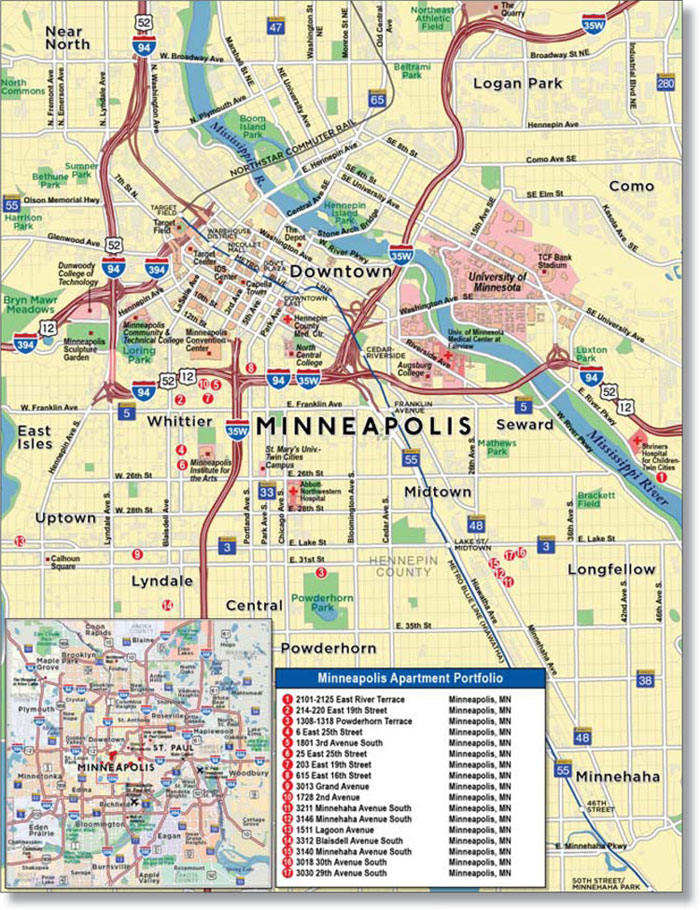
THE INFORMATION IN THIS STRUCTURAL AND COLLATERAL TERM SHEET IS NOT COMPLETE AND MAY BE AMENDED PRIOR TO THE TIME OF SALE. THIS TERM SHEET IS NOT AN OFFER TO SELL THESE SECURITIES AND IT IS NOT A SOLICITATION OF AN OFFER TO BUY THESE SECURITIES IN ANY JURISDICTION WHERE THE OFFER OR SALE IS NOT PERMITTED.
109
| No. 10 – Minneapolis Apartment Portfolio | ||||||||
| Loan Information | Properties Information | |||||||
| Mortgage Loan Seller: | Rialto Mortgage Finance, LLC | Single Asset/Portfolio: | Portfolio | |||||
| Credit Assessment (DBRS/KBRA/Moody’s): | NR/NR/NR | Properties Type: | Multifamily | |||||
| Original Principal Balance: | $26,500,000 | Specific Properties Type: | ||||||
| Cut-off Date Principal Balance: | $26,500,000 | Location: | Minneapolis, MN | |||||
| % of Initial Pool Balance: | 2.1% | Size(3): | 437 units | |||||
| Loan Purpose: | Refinance | Cut-off Date Principal Balance Per Unit: | $60,641 | |||||
| Borrower Name: | National Housing Fund, LLC | Year Built/Renovated: | Various – See Table | |||||
| Sponsors: | Stephen A. Frenz; Jennifer J. Frenz | Title Vesting: | Fee | |||||
| Mortgage Rate: | 5.227% | Properties Manager: | Self-managed | |||||
| Note Date: | March 21, 2014 | 3rd Most Recent Occupancy (As of): | 90.2% (12/31/2011) | |||||
| Anticipated Repayment Date: | NAP | 2nd Most Recent Occupancy (As of)(4): | 90.6% (12/31/2012) | |||||
| Maturity Date: | April 6, 2024 | Most Recent Occupancy (As of)(4): | 95.2% (12/31/2013) | |||||
| IO Period: | 24 months | Current Occupancy (As of): | 95.0% (3/13/2014) | |||||
| Loan Term (Original): | 120 months | |||||||
| Seasoning: | 1 month | Underwriting and Financial Information: | ||||||
| Amortization Term (Original): | 360 months | |||||||
| Loan Amortization Type: | Interest-only, Amortizing Balloon | 3rd Most Recent NOI (As of): | $2,159,155 (12/31/2012) | |||||
| Interest Accrual Method: | Actual/360 | 2nd Most Recent NOI (As of): | $2,306,967 (12/31/2013) | |||||
| Call Protection: | L(25),D(91),O(4) | Most Recent NOI (As of): | $2,339,014 (TTM 2/28/2014) | |||||
| Lockbox Type: | Springing (Without Established Account) | |||||||
| Additional Debt: | Yes | U/W Revenues: | $4,272,413 | |||||
Additional Debt Type(1): | Future Mezzanine | U/W Expenses: | $1,744,030 | |||||
U/W NOI(5): | $2,528,383 | |||||||
| U/W NCF: | $2,420,883 | |||||||
Escrows and Reserves(2): | U/W NOI DSCR: | 1.44x | ||||||
| U/W NCF DSCR: | 1.38x | |||||||
Type: | Initial | Monthly | Cap (If Any) | U/W NOI Debt Yield: | 9.5% | |||
| Taxes | $40,574 | $40,574 | NAP | U/W NCF Debt Yield: | 9.1% | |||
| Insurance | $49,238 | $9,848 | NAP | As-Is Appraised Value: | $34,890,000 | |||
| Replacement Reserves | $0 | $8,958 | NAP | As-Is Appraisal Valuation Date: | January 6, 2014 | |||
| Deferred Maintenance: | $286,813 | $0 | NAP | Cut-off Date LTV Ratio: | 76.0% | |||
| Working Capital: | $500,000 | $0 | NAP | LTV Ratio at Maturity or ARD: | 66.1% | |||
| (1) | See “Subordinate and Mezzanine Indebtedness” section. |
| (2) | See “Escrows” section. |
| (3) | Size includes 430 multifamily units and seven retail units. Retail rents are included in the underwriting. |
| (4) | Most Recent Occupancy and 2nd Most Recent Occupancy figures were lower due to ongoing renovations at the 3146 Minnehaha Avenue South property and the 3211 Minnehaha Avenue South property that were completed in 2013. Excluding these two properties, the occupancy at the remaining properties was 97.3% as of December 31, 2013 and 94.0% as of December 31, 2012. |
| (5) | See “Cash Flow Analysis” section. |
The Mortgage Loan. The mortgage loan (the “Minneapolis Apartment Portfolio Mortgage Loan”) is evidenced by a single promissory note that is secured by a first mortgage encumbering 17 garden apartment properties totaling 430 multifamily units and seven retail units located in the Minneapolis, Minnesota (the “Minneapolis Apartment Portfolio Properties”). The Minneapolis Apartment Portfolio Mortgage Loan was originated on March 21, 2014 by Rialto Mortgage Finance, LLC. The Minneapolis Apartment Portfolio Mortgage Loan had an original principal balance of $26,500,000, has an outstanding principal balance as of the Cut-off Date of $26,500,000 and accrues interest at an interest rate of 5.227% per annum. The Minneapolis Apartment Portfolio Mortgage Loan had an initial term of 120 months, has a remaining term of 119 months as of the Cut-off Date and requires interest-only payments for the first 24 payments following origination and, thereafter, requires payments of principal and interest based on a 30-year amortization schedule. The Minneapolis Apartment Portfolio Mortgage Loan matures on April 6, 2024.
Following the lockout period, the borrower has the right to defease the Minneapolis Apartment Portfolio Mortgage Loan in whole, but not in part, on any due date before January 6, 2024. In addition, the Minneapolis Apartment Portfolio Mortgage Loan is prepayable without penalty on or after January 6, 2024.
THE INFORMATION IN THIS STRUCTURAL AND COLLATERAL TERM SHEET IS NOT COMPLETE AND MAY BE AMENDED PRIOR TO THE TIME OF SALE. THIS TERM SHEET IS NOT AN OFFER TO SELL THESE SECURITIES AND IT IS NOT A SOLICITATION OF AN OFFER TO BUY THESE SECURITIES IN ANY JURISDICTION WHERE THE OFFER OR SALE IS NOT PERMITTED.
110
| MINNEAPOLIS APARTMENT PORTFOLIO |
Sources and Uses
| Sources | Uses | ||||||||
| Original loan amount | $26,500,000 | 100.0% | Loan payoff | $21,754,509 | 82.1 | % | |||
| Reserves | 876,625 | 3.3 | |||||||
| Closing costs | 945,161 | 3.6 | |||||||
| Return of equity | 2,923,706 | 11.0 | |||||||
| Total Sources | $26,500,000 | 100.0% | Total Uses | $26,500,000 | 100.0 | % | |||
The Properties. The Minneapolis Apartment Portfolio Properties consist of 17 properties, containing 430 multifamily units and seven retail units, located within three miles of downtown Minneapolis, Minnesota and situated within the Minneapolis-St. Paul Metropolitan Statistical Area (the “Minneapolis MSA”). The Minneapolis Apartment Portfolio Properties were built between 1908 and 1965 and the unit mix is made up of 149 studio units, 253 one-bedroom units and 28 two-bedroom units, with the seven retail spaces totaling 7,641 square feet. As of March 13, 2014, the Minneapolis Apartment Portfolio Properties were 95.0% occupied.
The following table presents certain information relating to the Minneapolis Apartment Portfolio Properties:
| Property Name | Allocated Cut-off Date Principal Balance | % of Portfolio Cut-off Date Principal Balance | Occupancy | Year Built /Renovated | No. of Units | ||||||
| 2101 East River Terrace | $7,762,396 | 29.3% | 94.0% | 1950/2011 | 100 | ||||||
| 214-220 East 19th Street | $2,871,023 | 10.8% | 96.3% | 1922/2010 | 54(1) | ||||||
| 1308 Powderhorn Terrace | $1,982,373 | 7.5% | 100.0% | 1922/NAP | 37 | ||||||
| 6 East 25th Street | $1,914,015 | 7.2% | 100.0% | 1926/1999 | 30(2) | ||||||
| 1801 3rd Avenue South | $1,420,321 | 5.4% | 96.2% | 1919/1996 | 26 | ||||||
| 25 East 25th Street | $1,283,606 | 4.8% | 95.8% | 1908/NAP | 24 | ||||||
| 203 East 19th Street | $1,268,415 | 4.8% | 100.0% | 1913/2001 | 21 | ||||||
| 615 East 16th Street | $1,207,653 | 4.6% | 100.0% | 1918/2010 | 22 | ||||||
| 3013 Grand Avenue South | $1,139,295 | 4.3% | 94.1% | 1963/2009 | 17 | ||||||
| 1728 2nd Avenue | $1,010,175 | 3.8% | 100.0% | 1939/NAP | 19 | ||||||
| 3211 Minnehaha Avenue South | $896,245 | 3.4% | 70.6% | 1962/2013 | 17 | ||||||
| 3146 Minnehaha Avenue South | $873,459 | 3.3% | 82.4% | 1961/2013 | 17 | ||||||
| 1511 Lagoon Avenue | $721,553 | 2.7% | 88.9% | 1915/NAP | 9 | ||||||
| 3312 Blaisdell Avenue South | $653,196 | 2.5% | 100.0% | 1927/NAP | 10 | ||||||
| 3140 Minnehaha Avenue South | $524,076 | 2.0% | 100.0% | 1962/2011 | 11 | ||||||
| 3018 30th Avenue South | $501,290 | 1.9% | 100.0% | 1965/NAP | 12 | ||||||
| 3030 29th Avenue South | $470,909 | 1.8% | 81.8% | 1963/NAP | 11 | ||||||
| Total/Weighted Average | $26,500,000 | 100.0% | 95.0% | 437 | |||||||
| (1) | Includes one retail unit. |
| (2) | Includes six retail units. |
The following table presents certain information relating to the unit mix of the Minneapolis Apartment Portfolio Properties:
Apartment Unit Summary(1)
| Unit Type | No. of Units | % of Total Units | Average Unit Size (SF) | Average In-Place Monthly Rent per Unit | |||||
| Studio | 149 | 34.1% | 423 | $682 | |||||
| 1 Bedroom | 253 | 57.9% | 570 | $795 | |||||
| 2 Bedroom | 28 | 6.4% | 1,084 | $1,071 | |||||
| Retail | 7 | 1.6% | 1,092 | $1,429 | |||||
| Total/Weighted Average | 437 | 100.0% | 561 | $786 | |||||
| (1) | Information obtained from the underwritten rent roll. |
The following table presents historical occupancy percentages at the Minneapolis Apartment Portfolio Properties:
Historical Occupancy
12/31/2011(1) | 12/31/2012(1)(2) | 12/31/2013(1)(2) | 3/13/2014(3) | |||
| 90.2% | 90.6% | 95.2% | 95.0% |
| (1) | Information obtained from the borrower. | |
| (2) | Historical Occupancy figures were lower due to ongoing renovations at the 3146 Minnehaha Avenue South Property and the 3211 Minnehaha Avenue South Property that were completed in 2013. Excluding these two properties, the occupancy at the remaining properties was 97.3% as of December 31, 2013 and 94.0% as of December 31, 2012. | |
| (3) | Information obtained from the underwritten rent roll. |
THE INFORMATION IN THIS STRUCTURAL AND COLLATERAL TERM SHEET IS NOT COMPLETE AND MAY BE AMENDED PRIOR TO THE TIME OF SALE. THIS TERM SHEET IS NOT AN OFFER TO SELL THESE SECURITIES AND IT IS NOT A SOLICITATION OF AN OFFER TO BUY THESE SECURITIES IN ANY JURISDICTION WHERE THE OFFER OR SALE IS NOT PERMITTED.
111
| MINNEAPOLIS APARTMENT PORTFOLIO |
Operating History and Underwritten Net Cash Flow. The following table presents certain information relating to the historical operating performance and Underwritten Net Cash Flow at the Minneapolis Apartment Portfolio Properties:
Cash Flow Analysis
| 2013 | TTM 2/28/2014 | U/W | U/W $ per Unit | ||||||||||||
| Base Rent | $3,522,635 | $3,604,624 | $3,668,025 | $3,912,835 | $8,954 | ||||||||||
| Grossed Up Vacant Space | 0 | 0 | 454 | ||||||||||||
| Other Income | 339,613 | 366,892 | 366,892 | 840 | |||||||||||
| Less Vacancy & Credit Loss | 0 | 0 | (205,554) | (1) | (470) | ||||||||||
| Effective Gross Income | $3,944,237 | $4,034,917 | $4,272,413 | $9,777 | |||||||||||
| Total Operating Expenses | $1,637,270 | $1,695,903 | $1,744,030 | $3,991 | |||||||||||
| Net Operating Income | (2) | $2,306,967 | (2) | $2,339,014 | $2,528,383 | $5,786 | |||||||||
| Capital Expenditures | 0 | 0 | 107,500 | 246 | |||||||||||
| Net Cash Flow | $2,159,155 | $2,306,967 | $2,339,014 | $2,420,883 | $5,540 | ||||||||||
| NOI DSCR | 1.32x | 1.34x | 1.44x | ||||||||||||
| NCF DSCR | 1.23x | 1.32x | 1.34x | 1.38x | |||||||||||
| NOI DY | 8.7% | 8.8% | 9.5% | ||||||||||||
| NCF DY | 8.1% | 8.7% | 8.8% | 9.1% |
| (1) | The underwritten vacancy is 5.0%. The Minneapolis Apartment Portfolio Properties were 95.0% physically occupied as of March 13, 2014. |
| (2) | Ongoing renovations at the 3146 Minnehaha Avenue South Property and 3211 Minnehaha Avenue South Property that were completed in 2013 resulted in lower occupancy and net operating income while the Minneapolis Apartment Portfolio Properties leased up to stabilization. |
Appraisal. As of the appraisal valuation date of January 6, 2014, the Minneapolis Apartment Portfolio Property had an aggregate “as-is” appraised value of $34,890,000.
Environmental Matters. According to Phase I environmental assessments dated January 6, 2014 or January 7, 2014, there was no evidence of any recognized environmental conditions at the Minneapolis Apartment Portfolio Properties, except as identified below, and the only recommendations were the implementation of an operations and maintenance plan for asbestos, a lead-based paint operations and maintenance plan, and in certain cases a mold/moisture control plan, which are already in place. At the 615 East 16th Street Property, a Phase II assessment completed on March 20, 2014, relating to a heating oil underground storage tank (“UST”) that was reportedly removed in 1999 (although no additional documentation of the removal of the UST was found), recommended no further action. The 2101 East River Terrace Property is listed as a leaking underground storage tank site related to the removal of seven fuel oil underground storage tanks that on March 4, 2003. All of the cases were closed on November 24, 2009. The Phase I environmental assessment recommends the implementation of a soil management plan, which is already in place.
Market Overview and Competition. The Minneapolis MSA is the most populous area in the state of Minnesota, includes the state capital and is a regional center for business, transportation and culture. The Minneapolis MSA is home to 18 Fortune 500 companies including United Health Group, Target and Best Buy, as well as several colleges, universities and professional schools with an estimated total enrollment of over 180,000 students. The largest university in the area is the University of Minnesota with 50,000 students. According to a third party market research report, as of 2014 the Minneapolis MSA had an estimated population of 3.5 million, an increase of 3.3% from 2010. According to the appraisal, as of 2013 the Minneapolis MSA had an unemployment rate of 4.9%, a decrease from 5.5% in 2012 and down from its peak of 7.8% in 2009.
According to a third party market research report, the Minneapolis Apartment Portfolio Properties are located in the Minneapolis market and the Minneapolis submarket, the largest of the eight submarkets identified. As of the third quarter 2013, the Minneapolis market reported an inventory of 158,190 units. The market vacancy rate and asking rent per unit was 2.2% and $1,039 per month as of the third quarter 2013 compared to 2.5% and $1,008 per month as of the third quarter 2012, respectively. In regards to the Minneapolis submarket, as of the third quarter 2013, the submarket reported an inventory of 28,962 units. The submarket vacancy rate and asking rent per unit was 3.6% and $1,208 per month as of the third quarter 2013 compared to 2.9% and $1,151 per month as of the third quarter 2012, respectively.
The Borrower. The borrower is National Housing Fund, LLC, a single purpose entity with two independent directors. Stephen Frenz and Jennifer Frenz are the guarantors of certain nonrecourse carveouts under the Minneapolis Apartment Portfolio Mortgage Loan.
The Sponsors. The sponsors are Stephen A. Frenz and Jennifer J. Frenz. Stephen A. Frenz is the president and CEO of a multifamily management company known as The Apartment Shop, LLC and has over 20 years of experience in the Minneapolis and Duluth, Minnesota apartment markets. The Apartment Shop, LLC specializes in the redevelopment of historic apartment buildings. Stephen Frenz has ownership interests in 58 multifamily properties containing over 1,500 units in Minneapolis and Duluth. Certain affiliated companies of the sponsor filed for bankruptcy protection in 2009. See “Description of the Mortgage Pool – Default History, Bankruptcy Issues and Other Proceedings” in the Free Writing Prospectus.
Escrows. The loan documents provide for upfront reserves in the amount of $40,574 for real estate taxes; $49,238 for insurance; $286,813 for deferred maintenance; and $500,000 for working capital. The loan documents also provide for ongoing monthly reserves in the amount of $40,574 for taxes; $9,848 for insurance; and $8,958 for replacement reserves.
THE INFORMATION IN THIS STRUCTURAL AND COLLATERAL TERM SHEET IS NOT COMPLETE AND MAY BE AMENDED PRIOR TO THE TIME OF SALE. THIS TERM SHEET IS NOT AN OFFER TO SELL THESE SECURITIES AND IT IS NOT A SOLICITATION OF AN OFFER TO BUY THESE SECURITIES IN ANY JURISDICTION WHERE THE OFFER OR SALE IS NOT PERMITTED.
112
| MINNEAPOLIS APARTMENT PORTFOLIO |
Lockbox and Cash Management. Upon the occurrence of a Cash Management Trigger Event Period (as defined below), the borrower is required to establish a lender-controlled lockbox account into which (i) with respect to all residential tenants, the borrower and/or manager will collect all rents and deposit them into the lockbox account within one business day of receipt, and (ii) with respect to all non-residential tenants or any residential leases that represent more than 5% of the total rental income or 5% of the total number of residential units at the Minneapolis Apartment Portfolio Properties, the borrower and/or the manager will direct such tenants to deposit all rents directly into the lockbox account. Upon the occurrence of a Cash Management Trigger Event Period all amounts on deposit in the lockbox account are swept on a daily basis into a lender-controlled cash management account. Upon the occurrence of a Cash Sweep Event Period (as defined below), all excess funds remaining on deposit in the cash management account (after application to debt service, required reserves and any other required amounts) will be swept into the excess cash flow account and held as additional collateral for the Minneapolis Apartment Portfolio Mortgage Loan.
A “Cash Management Trigger Event Period” will commence (i) if an event of default has occurred or is continuing, (ii) upon the occurrence of a bankruptcy action of the borrower, the guarantor or the property manager, or (iii) if the amortizing debt service coverage ratio is less than 1.25x based on the trailing twelve month period. A Cash Management Trigger Event Period will end upon, in the case of clause (i), the cure of such event of default; in the case of clause (ii), the timely discharge of such bankruptcy; or in the case of clause (iii), the amortizing debt service coverage ratio based on the trailing twelve month period being greater than 1.25x.
A “Cash Sweep Event Period” will commence (i) if an event of default has occurred or is continuing, (ii) upon the occurrence of a bankruptcy action of the borrower, the guarantor or the property manager, or (iii) if the amortizing debt service coverage ratio is less than 1.20x based on the trailing twelve month period. A Cash Sweep Event Period will end upon, in the case of clause (i), the cure of such event of default, in the case of clause (ii), the discharge of such bankruptcy (if the bankruptcy was involuntary); or in the case of clause (iii, the amortizing debt service coverage ratio based on the trailing twelve month period being greater than 1.20x.
Property Management. The Minneapolis Apartment Portfolio Properties are managed by an affiliate of the borrower.
Assumption. The borrower has the right to transfer the Minneapolis Multifamily Portfolio Properties, provided that no event of default has occurred and is continuing and certain other conditions are satisfied, including, but not limited to (i) the lender’s reasonable determination that the proposed transferee and guarantor satisfy the lender’s credit review and underwriting standards, taking into consideration transferee experience, financial strength and general business standing; (ii) execution of a recourse guaranty and an environmental indemnity by an affiliate of the transferee; and (iii) if requested by the lender, rating agency confirmation from DBRS, KBRA and Moody’s that the transfer will not result in a downgrade, withdrawal or qualification of the respective ratings assigned to the Series 2014-C20 Certificates.
Partial Release. Not permitted.
Real Estate Substitution. Not permitted.
Subordinate and Mezzanine Indebtedness. The borrower has the right to incur future mezzanine financing subject to the satisfaction of certain conditions, including (i) the execution of an intercreditor agreement in form and substance reasonably acceptable to the lender; (ii) the combined amortizing debt service coverage ratio will not be less than 1.38x; (iii) the combined loan-to-value ratio will not be greater than 76.0%; (iv) the mezzanine loan documents as reasonably acceptable to the lender; and (v) receipt of rating agency confirmation from DBRS, KBRA, and Moody’s that that such mezzanine financing will not result in a downgrade, withdrawal or qualification of the respective ratings assigned to the Series 2014-C20 Certificates.
Ground Lease. None.
Terrorism Insurance. The loan documents require that the “all risk” insurance policy required to be maintained by the borrower provide coverage for terrorism in an amount equal to the full replacement cost of the Minneapolis Apartment Portfolio Properties. The loan documents also require business interruption insurance covering no less than the 12-month period following the occurrence of a casualty event.
THE INFORMATION IN THIS STRUCTURAL AND COLLATERAL TERM SHEET IS NOT COMPLETE AND MAY BE AMENDED PRIOR TO THE TIME OF SALE. THIS TERM SHEET IS NOT AN OFFER TO SELL THESE SECURITIES AND IT IS NOT A SOLICITATION OF AN OFFER TO BUY THESE SECURITIES IN ANY JURISDICTION WHERE THE OFFER OR SALE IS NOT PERMITTED.
113
| No. 11 – Lacey Market Square | |||||||
| Loan Information | Property Information | ||||||
| Mortgage Loan Seller: | Rialto Mortgage Finance, LLC | Single Asset/Portfolio: | Single Asset | ||||
| Credit Assessment (DBRS/KBRA/Moody’s): | NR/NR/NR | Property Type: | Retail | ||||
| Original Principal Balance: | $26,000,000 | Specific Property Type: | Anchored | ||||
| Cut-off Date Principal Balance: | $26,000,000 | Location: | Lacey, WA | ||||
| % of Initial Pool Balance: | 2.1% | Size: | 276,400 SF | ||||
Loan Purpose(1): | Refinance | Cut-off Date Principal Balance Per SF: | $94.07 | ||||
Borrower Names(1): | Lacey Marketsquare I, LLC, Lacey Marketsquare II, LLC | Year Built/Renovated: | 1978/2000 | ||||
| Sponsor: | A. Stuart Rubin | Title Vesting: | Fee | ||||
| Mortgage Rate: | 5.244% | Property Manager: | Self-managed | ||||
| Note Date: | April 9, 2014 | 3rd Most Recent Occupancy (As of): | 94.2% (12/31/2011) | ||||
| Anticipated Repayment Date: | NAP | 2nd Most Recent Occupancy (As of): | 92.4% (12/31/2012) | ||||
| Maturity Date: | May 6, 2024 | Most Recent Occupancy (As of): | 90.2% (12/31/2013) | ||||
| IO Period: | 48 months | Current Occupancy (As of)(3): | 95.8% (3/1/2014) | ||||
| Loan Term (Original): | 120 months | ||||||
| Seasoning: | Underwriting and Financial Information: | ||||||
| Amortization Term (Original): | 360 months | ||||||
| Loan Amortization Type: | Interest-only, Amortizing Balloon | 3rd Most Recent NOI (As of): | $2,493,270 (12/31/2012) | ||||
| Interest Accrual Method: | Actual/360 | 2nd Most Recent NOI (As of): | $2,305,610 (12/31/2013) | ||||
| Call Protection: | L(24),D(92),O(4) | Most Recent NOI (As of): | $2,291,470 (TTM 1/31/2014) | ||||
| Lockbox Type: | None | ||||||
| Additional Debt: | None | ||||||
| Additional Debt Type: | NAP | U/W Revenues: | $3,354,269 | ||||
| U/W Expenses: | $783,508 | ||||||
Escrows and Reserves: | U/W NOI(3): | $2,570,761 | |||||
U/W NCF(3): | $2,471,581 | ||||||
| Type: | Initial | Monthly | Cap (If Any) | U/W NOI DSCR: | 1.49x | ||
| Taxes | $23,580 | $23,580 | NAP | U/W NCF DSCR(3): | 1.44x | ||
Insurance(2) | $0 | Springing | NAP | U/W NOI Debt Yield: | 9.9% | ||
| Replacement Reserves | $0 | $3,455 | NAP | U/W NCF Debt Yield(3): | 9.5% | ||
| TI/LC Reserve | $0 | $4,810 | NAP | As-Is Appraised Value: | $37,800,000 | ||
| Deferred Maintenance | $147,281 | NAP | As-Is Appraisal Valuation Date: | January 24, 2014 | |||
| DSCR Trigger Funds | $0 | Springing | NAP | Cut-off Date LTV Ratio: | 68.8% | ||
| Critical Tenant TI/LC Funds | $0 | Springing | NAP | LTV Ratio at Maturity or ARD: | 62.5% | ||
| (1) | The borrowers own the Lacey Market Square Property as tenants-in-common. After loan closing, the borrowers transferred the property to affiliates and in connection with the transfer, the borrowers are the holders of a subordinate note secured by a subordinate mortgage. See “Description of the Mortgage Pool—Other Matters” in the Free Writing Prospectus. |
| (2) | Monthly insurance escrow deposits are not required as long as the Lacey Market Square Property is covered by an acceptable blanket insurance policy. |
| (3) | Planet Fitness, the second largest tenant (20,413 square feet) representing 7.4% of net rentable square feet, has signed a lease and is expected to take occupancy in the second half of 2014. Excluding this tenant from the rent roll and underwriting, the property would be 88.4% occupied and the loan would have an U/W NCF of $2,195,212, U/W NCF DSCR of 1.28x and an U/W NCF debt yield of 8.4%. Rent is fully abated the first 6 months of the lease term followed by a 50% rent abatement in months 7 through 12 of the lease term. |
The Lacey Market Square mortgage loan is evidenced by a single promissory note that is secured by a first mortgage encumbering a 276,400 square foot anchored retail center located in Lacey, Washington (the “Lacey Market Square Property”). The Lacey Market Square Property is situated on a 19.6-acre site along the city limits of Olympia and Lacey at the intersection of Sleater Kinney Road Southeast and Pacific Avenue Southeast, approximately 0.5 miles south of Interstate 5. Interstate 5 is a major north-south thoroughfare and connects Seattle with Olympia and Portland. The Lacey Market Square Property is anchored by Fred Meyer, a 196,996 square foot supercenter providing a full service grocery, pharmacy and department store with apparel, hardware, home goods, toys, outdoor goods, sporting goods and plant nursery. Fred Meyer stores serve consumers in the Pacific Northwest and Alaska and are a wholly-owned subsidiary of The Kroger Co (rated BBB/Baa2/BBB by Fitch/Moody’s/S&P). Fred Meyer has been in occupancy at the Lacey Market Square Property since 1990 and executed an early lease renewal in April 2012 that extended its lease term by ten years from January 2020 to January 2030. In connection with extending its lease term, Fred Meyer constructed a fueling station on an adjacent parcel that is owned and operated by Fred Meyer and is not part of the Lacey Market Square Property. The Lacey Market Square Property contains 1,175 parking spaces, resulting in a parking ratio of 4.3 spaces per 1,000 square feet of rentable area. The Lacey Market Square Property is occupied by approximately 26 inline and outparcel tenants, including Starbucks, JPMorgan Chase, Edward Jones, and Olympia Credit Union and was 95.8% leased as of March 1, 2014.
THE INFORMATION IN THIS STRUCTURAL AND COLLATERAL TERM SHEET IS NOT COMPLETE AND MAY BE AMENDED PRIOR TO THE TIME OF SALE. THIS TERM SHEET IS NOT AN OFFER TO SELL THESE SECURITIES AND IT IS NOT A SOLICITATION OF AN OFFER TO BUY THESE SECURITIES IN ANY JURISDICTION WHERE THE OFFER OR SALE IS NOT PERMITTED.
114
| LACEY MARKET SQUARE |
Sources and Uses
| Sources | Uses | |||||||
| Original loan amount | $26,000,000 | 67.8% | $37,800,000 | 98.5% | ||||
| Sponsor’s new cash contribution | Reserves | $170,862 | 0.4 | |||||
| Closing costs | $391,979 | 1.0 | ||||||
| Total Sources | $38,362,841 | 100.0% | Total Uses | $38,362,841 | 100.0% |
| (1) | The borrowers own the Lacey Market Square Property as tenants-in-common. After loan closing, the borrowers transferred the property to affiliates and in connection with the transfer, the borrowers are the holders of a subordinate note secured by a subordinate mortgage. |
The following table presents certain information relating to the tenancies at the Lacey Market Square Property:
Major Tenants
| Tenant Name | Credit Rating (Fitch/Moody’s/S&P)(1) | Tenant NRSF | % of NRSF | Annual U/W Base Rent PSF(2) | Annual U/W Base Rent(2) | % of Total Annual U/W Base Rent | Sales PSF | Occupancy Cost | Lease Expiration Date | |||||||
| Anchor Tenant | ||||||||||||||||
| Fred Meyer | BBB/Baa2/BBB | 196,996 | 71.3% | $7.75 | $1,526,719 | 54.7% | NAV | NAV | 1/31/2030(3) | |||||||
| Total Anchor Tenant | ||||||||||||||||
| Major Tenant | ||||||||||||||||
Planet Fitness(4) | NR/NR/NR | 20,413 | 7.4% | $11.00 | $224,544 | 8.0% | NAV | NAV | 7/31/2026(5) | |||||||
| Total Major Tenant | 20,413 | 7.4% | $11.00 | $224,544 | 8.0% | |||||||||||
| Non-Major Tenants | 17.2% | $21.97 | $1,041,615 | 37.3% | ||||||||||||
| Occupied Total | 264,816 | 95.8% | $10.55 | $2,792,878 | 100.0% | |||||||||||
| Vacant Space | 11,584 | 4.2% | ||||||||||||||
| Collateral Total | 276,400 | 100.0% | ||||||||||||||
| (1) | Certain ratings are those of the parent company whether or not the parent guarantees the lease. |
| (2) | Annual U/W Base Rent PSF and Annual U/W Base Rent include contractual rent escalations through March 31, 2015. |
| (3) | Fred Meyer has one 10-year renewal option and two five-year renewal options remaining. |
| (4) | Planet Fitness has signed a lease and is expected to take occupancy in the second half of 2014. |
| (5) | Planet Fitness has four 5-year renewal options remaining. |
The following table presents certain information relating to the lease rollover schedule at the Lacey Market Square Property:
Lease Expiration Schedule(1)(2)
Year Ending December 31, | No. of Leases Expiring | Expiring NRSF | % of Total NRSF | Cumulative Expiring NRSF | Cumulative % of Total NRSF | Annual U/W Base Rent | Annual U/W Base Rent PSF(3) | |||||||
| MTM | 4 | 4,137 | 1.5% | 4,137 | $56,959 | $13.77 | ||||||||
| 2014 | 5 | 2,130 | 0.8% | 6,267 | $42,083 | $19.76 | ||||||||
| 2015 | 4 | 5,982 | 2.2% | 12,249 | 4.4% | $162,150 | $27.11 | |||||||
| 2016 | 2 | 4,125 | 1.5% | 16,374 | 5.9% | $82,542 | $20.01 | |||||||
| 2017 | 5 | 8,698 | 3.1% | 25,072 | $232,873 | $26.77 | ||||||||
| 2018 | 8 | 12,358 | 4.5% | 37,430 | $228,537 | $18.49 | ||||||||
| 2019 | 5 | 7,998 | 2.9% | 45,428 | 16.4% | $200,848 | $25.11 | |||||||
| 2020 | 0 | 0 | 0.0% | 45,428 | 16.4% | $0 | $0.00 | |||||||
| 2021 | 1 | 1,979 | 0.7% | 47,407 | 17.2% | $35,622 | $18.00 | |||||||
| 2022 | 0 | 0 | 0.0% | 47,407 | 17.2% | $0 | $0.00 | |||||||
| 2023 | 0 | 0 | 0.0% | 47,407 | 17.2% | $0 | $0.00 | |||||||
| 2024 | 0 | 0 | 0.0% | 47,407 | 17.2% | $0 | $0.00 | |||||||
| Thereafter | 2 | 217,409 | 78.7% | 264,816 | 95.8% | $1,751,263 | $8.06 | |||||||
| Vacant | 0 | 11,584 | 4.2% | 276,400 | 100.0% | $0 | $0.00 | |||||||
| Total/Weighted Average | 36 | 276,400 | 100.0% | $2,792,878 | $10.55 | |||||||||
| (1) | Information obtained from the underwritten rent roll. |
| (2) | Certain tenants may have lease termination options that are exercisable prior to the originally stated expiration date of the subject lease and that are not considered in the Lease Expiration Schedule. |
| (3) | Weighted Average Annual U/W Base Rent PSF excludes vacant space. |
THE INFORMATION IN THIS STRUCTURAL AND COLLATERAL TERM SHEET IS NOT COMPLETE AND MAY BE AMENDED PRIOR TO THE TIME OF SALE. THIS TERM SHEET IS NOT AN OFFER TO SELL THESE SECURITIES AND IT IS NOT A SOLICITATION OF AN OFFER TO BUY THESE SECURITIES IN ANY JURISDICTION WHERE THE OFFER OR SALE IS NOT PERMITTED.
115
| LACEY MARKET SQUARE |
The following table presents historical occupancy percentages at the Lacey Market Square Property:
Historical Occupancy
| (1) | Information obtained from the borrower. |
| (2) | Information obtained from the underwritten rent roll. |
Operating History and Underwritten Net Cash Flow. The following table presents certain information relating to the historical operating performance and Underwritten Net Cash Flow at the Lacey Market Square Property:
Cash Flow Analysis
| TTM | |||||||||||||||||||
| 2011 | 2012 | 2013 | 1/31/2014 | U/W(1) | U/W $ per SF | ||||||||||||||
| Base Rent | $2,959,147 | $2,744,673 | $2,528,389 | $2,516,270 | $2,681,545 | $9.70 | |||||||||||||
| Rent Steps | 0 | 0 | 0 | 0 | 111,333 | 0.40 | |||||||||||||
| Grossed Up Vacant Space | 0 | 0 | 0 | 0 | 238,660 | 0.86 | |||||||||||||
| Total Reimbursables | 377,603 | 380,960 | 444,099 | 445,399 | 595,496 | 2.15 | |||||||||||||
| Other Income | 3,041 | 2,288 | (1,051) | (1,051) | 0 | 0.00 | |||||||||||||
| Less Vacancy & Credit Loss | 0 | 0 | 0 | 0 | (272,764)(2) | (0.99 | ) | ||||||||||||
| Effective Gross Income | $3,339,792 | $3,127,922 | $2,971,437 | $2,960,619 | $3,354,269 | $12.14 | |||||||||||||
| Total Operating Expenses | $626,970 | $634,651 | $665,826 | $669,148 | $783,508 | $2.83 | |||||||||||||
| Net Operating Income | $2,712,822 | $2,493,270 | $2,305,610 | $2,291,470 | $2,570,761 | $9.30 | |||||||||||||
| TI/LC | 0 | 0 | 0 | 0 | 57,721 | 0.21 | |||||||||||||
| Capital Expenditures | 0 | 0 | 0 | 0 | 41,460 | 0.15 | |||||||||||||
| Net Cash Flow | $2,712,822 | $2,493,270 | $2,305,610 | $2,291,470 | $2,471,581 | $8.94 | |||||||||||||
| NOI DSCR | 1.58x | 1.45x | 1.34x | 1.33x | 1.49x | ||||||||||||||
| NCF DSCR | 1.58x | 1.45x | 1.34x | 1.33x | 1.44x | ||||||||||||||
| NOI DY | 10.4% | 9.6% | 8.9% | 8.8% | 9.9% | ||||||||||||||
| NCF DY | 10.4% | 9.6% | 8.9% | 8.8% | 9.5% | ||||||||||||||
| (1) | Planet Fitness, the second largest tenant (20,413 square feet) representing 7.4% of net rentable square feet, has signed a lease and is expected to take occupancy in the second half of 2014. Excluding this tenant from the rent roll and underwriting, the property would be 88.4% occupied and the loan would have an U/W NCF of $2,195,212, U/W NCF DSCR of 1.28x and an U/W NCF debt yield of 8.4%. Rent is fully abated the first 6 months of the lease term followed by a 50% rent abatement in months 7 through 12 of the lease term. |
| (2) | The underwritten economic vacancy is 7.9%. The Lacey Market Square Property was 95.8% physically occupied as of March 1, 2014. |
THE INFORMATION IN THIS STRUCTURAL AND COLLATERAL TERM SHEET IS NOT COMPLETE AND MAY BE AMENDED PRIOR TO THE TIME OF SALE. THIS TERM SHEET IS NOT AN OFFER TO SELL THESE SECURITIES AND IT IS NOT A SOLICITATION OF AN OFFER TO BUY THESE SECURITIES IN ANY JURISDICTION WHERE THE OFFER OR SALE IS NOT PERMITTED.
116
(THIS PAGE INTENTIONALLY LEFT BLANK)
117
| No. 12 – Woodland Apartments | |||||||
| Loan Information | Property Information | ||||||
| Mortgage Loan Seller: | Rialto Mortgage Finance, LLC | Single Asset/Portfolio: | Single Asset | ||||
| Credit Assessment (DBRS/KBRA/Moody’s): | NR/NR/NR | Property Type: | Multifamily | ||||
| Original Principal Balance: | $23,485,000 | Specific Property Type: | Garden | ||||
| Cut-off Date Principal Balance: | $23,485,000 | Location: | Olympia, WA | ||||
| % of Initial Pool Balance: | 1.9% | Size: | 224 units | ||||
| Loan Purpose: | Refinance | Cut-off Date Principal Balance Per Unit: | $104,844 | ||||
| Borrower Name: | Woodland Apartment Associates II, LLC | Year Built/Renovated: | 2012/NAP | ||||
| Sponsors: | Jon Wood; Roger Kuula | Title Vesting: | Fee | ||||
| Mortgage Rate: | 4.830% | Property Manager: | Self-managed | ||||
| Note Date: | February 26, 2014 | 3rd Most Recent Occupancy (As of)(1): | NAV | ||||
| Anticipated Repayment Date: | NAP | 2nd Most Recent Occupancy (As of)(2): | 25.0% (12/31/2012) | ||||
| Maturity Date: | March 6, 2024 | Most Recent Occupancy (As of): | 80.1% (12/31/2013) | ||||
| IO Period: | 60 months | Current Occupancy (As of): | 93.8% (1/2/2014) | ||||
| Loan Term (Original): | 120 months | ||||||
| Seasoning: | 2 months | Underwriting and Financial Information: | |||||
| Amortization Term (Original): | 360 months | ||||||
| Loan Amortization Type: | Interest-only, Amortizing Balloon | 3rd Most Recent NOI (As of)(1): | NAV | ||||
| Interest Accrual Method: | Actual/360 | 2nd Most Recent NOI (As of)(2): | $47,017 (12/31/2012) | ||||
| Call Protection: | L(26),D(90),O(4) | Most Recent NOI (As of)(3): | $1,337,558 (TTM 1/31/2014) | ||||
| Lockbox Type: | Springing (Without Established Account) | ||||||
| Additional Debt: | None | U/W Revenues: | $2,838,632 | ||||
| Additional Debt Type: | NAP | U/W Expenses: | $1,013,344 | ||||
U/W NOI(3): | $1,825,288 | ||||||
| U/W NCF: | $1,780,488 | ||||||
| U/W NOI DSCR: | 1.23x | ||||||
| U/W NCF DSCR: | 1.20x | ||||||
Escrows and Reserves: | U/W NOI Debt Yield: | 7.8% | |||||
| U/W NCF Debt Yield: | 7.6% | ||||||
Type: | Initial | Monthly | Cap (If Any) | As-Is Appraised Value: | $32,000,000 | ||
| Taxes | $0 | NAP | As-Is Appraisal Valuation Date: | December 31, 2013 | |||
| Insurance | $23,938 | $2,850 | NAP | Cut-off Date LTV Ratio: | 73.4% | ||
| Replacement Reserves | $0 | $3,733 | NAP | LTV Ratio at Maturity or ARD: | 67.5% | ||
| (1) | 3rd Most Recent Occupancy and 3rd Most Recent NOI not available as the Woodland Apartments Property was constructed in 2012. |
| (2) | 2nd Most Recent Occupancy and 2nd Most Recent NOI reflect lease-up phase since the Woodland Apartments Property was constructed in 2012. |
| (3) | See “Cash Flow Analysis” section. |
The Woodland Apartments mortgage loan is evidenced by a single promissory note that is secured by a first mortgage encumbering a 224-unit garden-style multifamily property located in Olympia, Washington (the “Woodland Apartments Property”). The Woodland Apartments Property is situated on a 12.5 acre site located approximately three miles west of the Olympia central business district. Olympia is the state capital of Washington and together with the rest of Thurston County forms the Olympia metropolitan statistical area. According to a third party market research report Thurston County had a 2013 population of 260,488. The Woodland Apartments Property is located approximately 0.5 miles west of the Westfield Capital Mall, which is anchored by Macy’s and JC Penney, and approximately 0.5 miles north of Highway 101, which provides regional access to Seattle and Portland via Interstate 5. The Woodland Apartments Property was built in 2012 and consists of 24 studio units, 64 one-bedroom/one-bathroom units and 136 two-bedroom/two-bath units. Unit amenities include a private deck/patio, storage unit and washer/dryers. Community amenities include a playground, heated outdoor pool, sauna, barbecue pits, outdoor fireplace and clubhouse. The clubhouse features a fitness center, fully equipped kitchen, billiards room and business center.
Sources and Uses
| Sources | Uses | |||||||
| Original loan amount | $23,485,000 | 97.9% | Loan payoff | $23,068,468 | 96.2% | |||
| Sponsor’s new cash contribution | 494,794 | 2.1 | Reserves | 23,938 | 0.1 | |||
| Closing costs | 887,388 | 3.7 | ||||||
| Total Sources | $23,979,794 | 100.0% | Total Uses | $23,979,794 | 100.0% |
THE INFORMATION IN THIS STRUCTURAL AND COLLATERAL TERM SHEET IS NOT COMPLETE AND MAY BE AMENDED PRIOR TO THE TIME OF SALE. THIS TERM SHEET IS NOT AN OFFER TO SELL THESE SECURITIES AND IT IS NOT A SOLICITATION OF AN OFFER TO BUY THESE SECURITIES IN ANY JURISDICTION WHERE THE OFFER OR SALE IS NOT PERMITTED.
118
| WOODLAND APARTMENTS |
The following table presents certain information relating to the unit mix of the Woodland Apartments Property:
Unit Mix Summary(1)
| Unit Type | No. of Units | % of Total Units | Average Unit Size (SF) | Average In-Place Monthly Rent per Unit |
| 1 Bedroom/1 Bathroom | 64 | 800 | ||
| 2 Bedroom/2 Bathroom | ||||
| Total/Weighted Average | 100.0% |
| (1) | Information obtained from the underwritten rent roll. |
The following table presents historical occupancy percentages at the Woodland Apartments Property:
Historical Occupancy
12/31/2011(1)(2) | 12/31/2012(1)(3) | 12/31/2013(1) | 1/2/2014(4) | |||
| NAV | 25.0% | 80.1% | 93.8% |
| (1) | Information obtained from the borrower. |
| (2) | Historical occupancy is not available as the Woodland Apartments Property was constructed in 2012. |
| (3) | Occupancy reflects a lease-up phase since the Woodland Apartments Property was constructed in 2012. |
| (4) | Information obtained from the underwritten rent roll. |
Operating History and Underwritten Net Cash Flow. The following table presents certain information relating to the historical operating performance and Underwritten Net Cash Flow at the Woodland Apartments Property:
Cash Flow Analysis
| (1) | The underwritten economic vacancy is 8.2%. The Woodland Apartments Property was 93.8% physically occupied as of January 2, 2014. |
| (2) | Underwritten NOI is higher than historicals since the Woodland Apartments Property opened in April 2012, and was stabilizing through 2012 and 2013. |
THE INFORMATION IN THIS STRUCTURAL AND COLLATERAL TERM SHEET IS NOT COMPLETE AND MAY BE AMENDED PRIOR TO THE TIME OF SALE. THIS TERM SHEET IS NOT AN OFFER TO SELL THESE SECURITIES AND IT IS NOT A SOLICITATION OF AN OFFER TO BUY THESE SECURITIES IN ANY JURISDICTION WHERE THE OFFER OR SALE IS NOT PERMITTED.
119
| No. 13 – Westland Multifamily Portfolio I | |||||||
| Loan Information | Property Information | ||||||
| Mortgage Loan Seller: | Wells Fargo Bank, National Association | Single Asset/Portfolio: | Portfolio | ||||
Credit Assessment (DBRS/KBRA/Moody’s): | NR/NR/NR | Property Type: | Multifamily | ||||
| Original Principal Balance: | $23,285,000 | Specific Property Type: | Garden | ||||
| Cut-off Date Principal Balance: | $23,285,000 | Location: | Various – See Table | ||||
| % of Initial Pool Balance: | 1.9% | Size: | 292 units | ||||
| Loan Purpose: | Refinance | Cut-off Date Principal Balance Per Unit: | $79,743 | ||||
| Borrower Name: | Westland Properties Thirteen LLC | Year Built/Renovated: | Various – See Table | ||||
Sponsors(1): | Various | Title Vesting: | Fee | ||||
| Mortgage Rate: | 4.790% | Property Manager: | Self-managed | ||||
| Note Date: | April 2, 2014 | 3rd Most Recent Occupancy (As of): | 93.6% (12/31/2011) | ||||
| Anticipated Repayment Date: | NAP | 2nd Most Recent Occupancy (As of): | 95.7% (12/31/2012) | ||||
| Maturity Date: | May 1, 2024 | Most Recent Occupancy (As of): | 98.2% (12/31/2013) | ||||
| IO Period: | None | Current Occupancy (As of): | 99.3% (3/31/2014) | ||||
| Loan Term (Original): | 120 months | ||||||
| Seasoning: | 0 months | Underwriting and Financial Information: | |||||
| Amortization Term (Original): | 360 months | ||||||
| Loan Amortization Type: | Amortizing Balloon | 3rd Most Recent NOI: | $2,186,959 (12/31/2011) | ||||
| Interest Accrual Method: | Actual/360 | 2nd Most Recent NOI: | $2,185,703 (12/31/2012) | ||||
| Call Protection: | L(24),D(91),O(5) | Most Recent NOI: | $2,222,878 (12/31/2013) | ||||
| Lockbox Type: | Soft/Springing Cash Management | ||||||
| Additional Debt: | None | ||||||
| Additional Debt Type: | NAP | ||||||
| U/W Revenues: | $3,334,075 | ||||||
| U/W Expenses: | $1,254,357 | ||||||
| U/W NOI: | $2,079,718 | ||||||
| U/W NCF: | $2,002,908 | ||||||
| U/W NOI DSCR: | 1.42x | ||||||
| U/W NCF DSCR: | 1.37x | ||||||
Escrows and Reserves: | U/W NOI Debt Yield: | 8.9% | |||||
| U/W NCF Debt Yield: | 8.6% | ||||||
Type: | Initial | Monthly | Cap (If Any) | As-Is Appraised Value: | $33,570,000 | ||
| Taxes | $62,640 | $20,880 | NAP | As-Is Appraisal Valuation Dates(2): | Various | ||
| Insurance | $66,407 | $6,037 | NAP | Cut-off Date LTV Ratio: | 69.4% | ||
| Replacement Reserves | $0 | $6,401 | NAP | LTV Ratio at Maturity or ARD: | 56.6% | ||
| (1) | The loan sponsors are Allen Alevy and Deanna Alevy as individuals and as co-trustees of the Alevy Family Trust, who also serve as loan sponsors for the Westland Multifamily Portfolio II mortgage loan, identified as loan number 26 in the Annex A-1, which has a Cut-off Date Principal Balance of $12,000,000 and is being contributed to the WFRBS 2014-C20 Trust. See “Description of the Mortgage Pool – Certain Characteristics of the Mortgage Pool – Multi-Property Mortgage Loans; Mortgage Loans with Affiliated Borrowers” in the Free Writing Prospectus. |
| (2) | The As-Is Appraisal Valuation Dates range from February 21, 2014 to February 27, 2014. |
The Westland Multifamily Portfolio I mortgage loan is evidenced by a single promissory note that is secured by a first mortgage encumbering 13 multifamily properties comprising 292 units and located in Los Angeles, Long Beach and Inglewood, California (the “Westland Multifamily Portfolio I Properties”). The Westland Multifamily Portfolio I Properties contain one studio unit, 82 one-bedroom units, 197 two-bedroom units and 12 three-bedroom units. The Westland Multifamily Portfolio I Properties were built between 1948 and 1979 and are situated on parcels ranging from 0.2 to 0.9 acres. As of March 31, 2014, the Westland Multifamily Portfolio I Properties were 99.3% occupied.
THE INFORMATION IN THIS STRUCTURAL AND COLLATERAL TERM SHEET IS NOT COMPLETE AND MAY BE AMENDED PRIOR TO THE TIME OF SALE. THIS TERM SHEET IS NOT AN OFFER TO SELL THESE SECURITIES AND IT IS NOT A SOLICITATION OF AN OFFER TO BUY THESE SECURITIES IN ANY JURISDICTION WHERE THE OFFER OR SALE IS NOT PERMITTED.
120
WESTLAND MULTIFAMILY PORTFOLIO I |
Sources and Uses
| Sources | Uses | ||||||||
| Original loan amount | $23,285,000 | 100.0% | Loan payoff | $22,521,256 | 96.7 | % | |||
| Reserves | 129,047 | 0.6 | |||||||
| Closing costs | 422,388 | 1.8 | |||||||
| Return of equity | 212,309 | 0.9 | |||||||
| Total Sources | $23,285,000 | 100.0% | Total Uses | $23,285,000 | 100.0 | % | |||
The following table presents certain information relating to the Westland Multifamily Portfolio I Properties:
| Property Name – Location | Allocated Cut-off Date Principal Balance(1) | % of Portfolio Cut- off Date Principal Balance | Current Occupancy | Year Built/ Renovated | Units | Appraised Value | ||||||||||
102nd Street Apartments – Inglewood, CA | $2,628,840 | 11.3% | 100.0% | 1964/NAP | 37 | $3,790,000 | ||||||||||
| Poppy Street Apartments – Long Beach, CA | $2,552,541 | 11.0% | 100.0% | 1979/NAP | 27 | $3,680,000 | ||||||||||
| Cordova Street Apartments – Los Angeles, CA | $2,559,477 | 11.0% | 100.0% | 1957/NAP | 32 | $3,690,000 | ||||||||||
| Daisy Avenue Apartments – Long Beach, CA | $1,956,023 | 8.4% | 96.4% | 1963/NAP | 28 | $2,820,000 | ||||||||||
| Santa Rosalia Apartments – Los Angeles, CA | $2,025,386 | 8.7% | 100.0% | 1948/NAP | 24 | $2,920,000 | ||||||||||
39th Street Apartments – Los Angeles, CA | $1,962,959 | 8.4% | 100.0% | 1959/NAP | 28 | $2,830,000 | ||||||||||
| 828 Beach Avenue Apartments – Inglewood, CA | $1,893,597 | 8.1% | 100.0% | 1960/NAP | 25 | $2,730,000 | ||||||||||
| Harvard Apartments – Los Angeles, CA | $1,654,296 | 7.1% | 100.0% | 1961/NAP | 20 | $2,385,000 | ||||||||||
| Dawson Apartments – Long Beach, CA | $1,491,294 | 6.4% | 94.4% | 1963/NAP | 18 | $2,150,000 | ||||||||||
| Orange Avenue Apartments – Long Beach, CA | $1,234,653 | 5.3% | 100.0% | 1979/NAP | 13 | $1,780,000 | ||||||||||
| Chestnut Apartments – Long Beach, CA | $1,231,185 | 5.3% | 100.0% | 1963/NAP | 16 | $1,775,000 | ||||||||||
| 610 East Hyde Park Apartments – Inglewood, CA | $1,116,737 | 4.8% | 100.0% | 1963/NAP | 12 | $1,610,000 | ||||||||||
| Linden Apartments – Long Beach, CA | $978,012 | 4.2% | 100.0% | 1963/NAP | 12 | $1,410,000 | ||||||||||
| Total/Weighted Average | $23,285,000 | 100.0% | 99.3% | 292 | $33,570,000 | |||||||||||
| (1) | Allocated Cut-off Date Principal Balances are reflective based on appraised values. There are no property release provisions. |
The following table presents certain information relating to the unit mix of the Westland Multifamily Portfolio I Properties:
Apartment Unit Summary(1)
| Unit Type | No. of Units | % of Total Units | Average Unit Size (SF) | Average Monthly U/W Base Rent | ||||
| Studio/1 Bathroom | 1 | 0.3% | 450 | $900 | ||||
| 1 Bedroom/1 Bathroom | 82 | 28.1% | 587 | $833 | ||||
| 2 Bedroom/1 Bathroom | 138 | 47.3% | 660 | $1,013 | ||||
| 2 Bedroom/2 Bathroom | 59 | 20.2% | 877 | $1,110 | ||||
| 3 Bedroom/1 Bathroom | 4 | 1.4% | 889 | $1,269 | ||||
| 3 Bedroom/2 Bathroom | 8 | 2.7% | 1,061 | $1,278 | ||||
| Total/Weighted Average | 292 | 100.0% | 697 | $992 | ||||
| (1) | Information obtained from the underwritten rent roll. |
The following table presents historical occupancy percentages at the Westland Multifamily Portfolio I Properties:
Historical Occupancy
12/31/2011(1) | 12/31/2012(1) | 12/31/2013(1) | 3/31/2014(2) | |||
| 93.6% | 95.7% | 98.2% | 99.3% |
| (1) | Information obtained from the borrower. |
| (2) | Information obtained from the underwritten rent roll. |
THE INFORMATION IN THIS STRUCTURAL AND COLLATERAL TERM SHEET IS NOT COMPLETE AND MAY BE AMENDED PRIOR TO THE TIME OF SALE. THIS TERM SHEET IS NOT AN OFFER TO SELL THESE SECURITIES AND IT IS NOT A SOLICITATION OF AN OFFER TO BUY THESE SECURITIES IN ANY JURISDICTION WHERE THE OFFER OR SALE IS NOT PERMITTED.
121
WESTLAND MULTIFAMILY PORTFOLIO I |
Operating History and Underwritten Net Cash Flow. The following table presents certain information relating to the historical operating performance and Underwritten Net Cash Flow at the Westland Multifamily Portfolio I Properties:
Cash Flow Analysis(1)
| 2011 | 2012 | 2013 | U/W | U/W $ per Unit | |||||||
| Base Rent | $3,144,046 | $3,158,656 | $3,319,765 | $3,450,576 | $11,817 | ||||||
| Grossed Up Vacant Space | 0 | 0 | 0 | 21,540 | 74 | ||||||
| Other Income | 79,556 | 85,771 | 90,664 | 90,664 | 310 | ||||||
| Less Concessions | (15,058) | (16,713) | (16,228) | (12,285) | (42) | ||||||
| Less Credit Loss | 0 | 0 | (22,198) | (42,814) | (147) | ||||||
| Less Vacancy | 0 | 0 | 0 | (173,606) | (595) | ||||||
| Effective Gross Income | $3,208,544 | $3,227,714 | $3,372,003 | $3,334,075 | $11,418 | ||||||
| Total Operating Expenses | $1,021,585 | $1,042,011 | $1,149,125 | $1,254,357 | $4,296 | ||||||
| Net Operating Income | $2,186,959 | $2,185,703 | $2,222,878 | $2,079,718 | $7,122 | ||||||
| Capital Expenditures | 0 | 0 | 0 | 76,810 | 263 | ||||||
| Net Cash Flow | $2,186,959 | $2,185,703 | $2,222,878 | $2,002,908 | $6,859 | ||||||
| NOI DSCR | 1.49x | 1.49x | 1.52x | 1.42x | |||||||
| NCF DSCR | 1.49x | 1.49x | 1.52x | 1.37x | |||||||
| NOI DY | 9.4% | 9.4% | 9.5% | 8.9% | |||||||
| NCF DY | 9.4% | 9.4% | 9.5% | 8.6% |
| (1) | The underwritten economic vacancy is 5.0%. The Westland Multifamily Portfolio I Properties were 99.3% physically occupied as of March 31, 2014. |
THE INFORMATION IN THIS STRUCTURAL AND COLLATERAL TERM SHEET IS NOT COMPLETE AND MAY BE AMENDED PRIOR TO THE TIME OF SALE. THIS TERM SHEET IS NOT AN OFFER TO SELL THESE SECURITIES AND IT IS NOT A SOLICITATION OF AN OFFER TO BUY THESE SECURITIES IN ANY JURISDICTION WHERE THE OFFER OR SALE IS NOT PERMITTED.
122
(THIS PAGE INTENTIONALLY LEFT BLANK)
123
| No. 14 – Vintage Parts Portfolio | |||||||
| Loan Information | Property Information | ||||||
| Mortgage Asset Seller: | The Royal Bank of Scotland | Single Asset/Portfolio: | Portfolio | ||||
| Credit Assessment (DBRS/KBRA/Moody’s): | NR/NR/NR | Property Type: | Industrial | ||||
| Original Principal Balance: | $22,900,000 | Specific Property Type: | Warehouse | ||||
| Cut-off Date Principal Balance: | $22,871,478 | Location: | Various – See Table | ||||
| % of Initial Pool Balance: | 1.8% | Size: | 682,092 SF | ||||
| Loan Purpose: | Acquisition | Cut-off Date Principal Balance Per SF: | $33.53 | ||||
| Borrower Name: | LCN VP, LLC | Year Built/Year Renovated: | Various – See Table | ||||
| Sponsor: | LCN Capital Partners | Title Vesting: | Fee | ||||
| Mortgage Rate: | 4.805% | Property Manager: | Tenant-managed | ||||
| Note Date: | March 13, 2014 | 3rd Most Recent Occupancy(As of): | 100.0% (12/31/2011) | ||||
| Anticipated Repayment Date: | April 1, 2024 | 2nd Most Recent Occupancy(As of): | 100.0% (12/31/2012) | ||||
| Maturity Date: | April 1, 2044 | Most Recent Occupancy (As of): | 100.0% (12/31/2013) | ||||
| IO Period: | None | Current Occupancy (As of): | 100.0% (5/1/2014) | ||||
| Loan Term (Original): | 120 months | �� | |||||
| Seasoning: | 1 month | ||||||
| Amortization Term (Original): | 360 months | ||||||
| Loan Amortization Type: | Amortizing ARD | Underwriting and Financial Information: | |||||
| Interest Accrual Method: | Actual/360 | ||||||
| Call Protection: | L(25),D(91),O(4) | 3rd Most Recent NOI (As of)(1): | NAV | ||||
| Lockbox Type: | Hard/Upfront Cash Management | 2nd Most Recent NOI (As of)(1): | NAV | ||||
| Additional Debt: | None | Most Recent NOI (As of)(1): | NAV | ||||
| Additional Debt Type: | NAP | ||||||
| U/W Revenues: | $2,432,000 | ||||||
| U/W Expenses: | $72,960 | ||||||
| U/W NOI: | $2,359,040 | ||||||
| U/W NCF: | $2,106,445 | ||||||
Escrows and Reserves: | U/W NOI DSCR: | 1.64x | |||||
| U/W NCF DSCR: | 1.46x | ||||||
Type: | Initial | Monthly | Cap (If Any) | U/W NOI Debt Yield: | 10.3% | ||
| Taxes | $0 | Springing | NAP | U/W NCF Debt Yield: | 9.2% | ||
| Insurance | $0 | Springing | NAP | As-Is Appraised Value: | $35,400,000 | ||
| Deferred Maintenance | $43,770 | $0 | NAP | As-Is Appraisal Valuation Date: | February 12, 2014 | ||
| Replacement Reserves | $0 | Springing | NAP | Cut-off Date LTV Ratio: | 64.6% | ||
| TI/LC Reserve | $0 | Springing | NAP | LTV Ratio at Maturity or ARD: | 52.9% | ||
| (1) | Historical financial data is unavailable because the Vintage Parts Portfolio Properties were acquired in March 2014 in a sale-leaseback transaction. |
The Vintage Parts Portfolio mortgage loan is evidenced by a single promissory note that is secured by a first mortgage encumbering three industrial warehouse campuses totaling 682,092 square feet and located in Beaver Dam, Wisconsin and Columbus, Wisconsin (the “Vintage Parts Portfolio Properties”). The Corporate Campus property is located in Beaver Dam, Wisconsin and consists of five industrial warehouse buildings and one office building, collectively totaling 394,500 square feet. The Green Valley Campus property is located in Beaver Dam, Wisconsin and consists of seven industrial warehouse buildings, collectively totaling 208,000 square feet. The Columbus Campus property is located in Columbus, Wisconsin and consists of three industrial warehouse buildings, collectively totaling 79,592 square feet. The Vintage Parts Portfolio Properties were built between 1980 and 2000. Vintage Parts, Inc. is a distributor of slow moving and inactive service parts to manufacturers in the automobile, construction, transportation equipment, mining and material handling industries. On March 13, 2014, the borrower and Vintage Parts, Inc. completed a sale-leaseback transaction. In connection therewith, Vintage Parts, Inc. entered into a 20-year triple-net lease. As of May 1, 2014, the Vintage Parts Portfolio Properties were 100.0% occupied.
Sources and Uses
| Sources | Uses | |||||||
| Original loan amount | $22,900,000 | 63.4% | Purchase price(1) | $35,175,000 | 97.3% | |||
| Sponsor’s new cash contribution | 13,239,378 | 36.6 | Reserves | 43,770 | 0.1 | |||
| Closing costs | 920,608 | 2.5 | ||||||
| Total Sources | $36,139,378 | 100.0% | Total Uses | $36,139,378 | 100.0% |
| (1) | The Vintage Parts Portfolio were acquired in March 2014 in a sale-leaseback transaction. |
THE INFORMATION IN THIS STRUCTURAL AND COLLATERAL TERM SHEET IS NOT COMPLETE AND MAY BE AMENDED PRIOR TO THE TIME OF SALE. THIS TERM SHEET IS NOT AN OFFER TO SELL THESE SECURITIES AND IT IS NOT A SOLICITATION OF AN OFFER TO BUY THESE SECURITIES IN ANY JURISDICTION WHERE THE OFFER OR SALE IS NOT PERMITTED.
124
VINTAGE PARTS PORTFOLIO |
The following table presents certain information relating to the Vintage Parts Portfolio Properties:
| Property Name | Location | Allocated Cut-off Date Principal Balance | % of Portfolio Cut-off Date Principal Balance | Occupancy | Year Built/ Renovated | Net Rentable Area (SF) | Appraised Value | ||||||||||
| Corporate Campus | Beaver Dam, WI | $15,893,740 | 69.5 | % | 100.0 | % | 2000/NAP | 394,500 | $24,600,000 | ||||||||
| Green Valley Campus | Beaver Dam, WI | 5,427,130 | 23.7 | 100.0 | 1980/NAP | 208,000 | 8,400,000 | ||||||||||
| Columbus Campus | Columbus, WI | 1,550,608 | 6.8 | 100.0 | 1986/NAP | 79,592 | 2,400,000 | ||||||||||
| Total/Weighted Average | $22,871,478 | 100.0 | % | 100.0 | % | 682,092 | $35,400,000 | ||||||||||
The following table presents certain information relating to the tenant at Vintage Parts Portfolio Properties:
Major Tenant(1)
| Tenant Name | Credit Rating(Fitch/Moody’s /S&P) | Tenant NRSF | % of NRSF | Annual U/W Base Rent PSF | Annual U/W Base Rent | % of Total Annual U/W Base Rent | Lease Expiration Date |
| Major Tenant | |||||||
| Vintage Parts, Inc. | NR/NR/NR | 682,092 | 100.0% | $3.75 | $2,560,000 | 100.0% | 3/12/2034 |
| Occupied Collateral Total | 682,092 | 100.0% | $3.75 | $2,560,000 | 100.0% | ||
| (1) | Information obtained from the underwritten rent roll. |
The following table presents certain information relating to the lease rollover schedule at the Vintage Parts Portfolio Properties:
Lease Expiration Schedule(1)
Year Ending December 31, | No. of Leases Expiring(2) | Expiring NRSF | % of Total NRSF | Cumulative Expiring NRSF | Cumulative % of Total NRSF | Annual U/W Base Rent | Annual U/W Base Rent PSF | |||||||
| MTM | 0 | 0 | 0.0% | 0 | 0.0% | $0 | $0.00 | |||||||
| 2014 | 0 | 0 | 0.0% | 0 | 0.0% | $0 | $0.00 | |||||||
| 2015 | 0 | 0 | 0.0% | 0 | 0.0% | $0 | $0.00 | |||||||
| 2016 | 0 | 0 | 0.0% | 0 | 0.0% | $0 | $0.00 | |||||||
| 2017 | 0 | 0 | 0.0% | 0 | 0.0% | $0 | $0.00 | |||||||
| 2018 | 0 | 0 | 0.0% | 0 | 0.0% | $0 | $0.00 | |||||||
| 2019 | 0 | 0 | 0.0% | 0 | 0.0% | $0 | $0.00 | |||||||
| 2020 | 0 | 0 | 0.0% | 0 | 0.0% | $0 | $0.00 | |||||||
| 2021 | 0 | 0 | 0.0% | 0 | 0.0% | $0 | $0.00 | |||||||
| 2022 | 0 | 0 | 0.0% | 0 | 0.0% | $0 | $0.00 | |||||||
| 2023 | 0 | 0 | 0.0% | 0 | 0.0% | $0 | $0.00 | |||||||
| 2024 | 0 | 0 | 0.0% | 0 | 0.0% | $0 | $0.00 | |||||||
| Thereafter | 1 | 682,092 | 100.0% | 682,092 | 100.0% | $2,560,000 | $3.75 | |||||||
| Vacant | 0 | 0 | 0.0% | 682,092 | 100.0% | $0 | $0.00 | |||||||
| Total/Weighted Average | 1 | 682,092 | 100.0% | $2,560,000 | $3.75 |
| (1) | Information obtained from the underwritten rent roll. |
| (2) | The Vintage Parts Portfolio Properties consist of three single-tenant industrial warehouse campuses. The leased premises are under a triple-net lease between Vintage Parts, Inc. and the borrower. |
The following table presents the most recent occupancy percentage at the Vintage Parts Portfolio Properties:
Historical Occupancy(1)
12/31/2011 | 12/31/2012 | 12/31/2013 | 5/1/2014(2) | |||
| 100.0% | 100.0% | 100.0% | 100.0% |
| (1) | The Vintage Parts Portfolio Properties were acquired in March 2014 in a sale-leaseback transaction. Vintage Parts, Inc. has been an occupant at each of the Vintage Parts Portfolio Properties for over 15 years. |
| (2) | Information obtained from the underwritten rent roll. |
THE INFORMATION IN THIS STRUCTURAL AND COLLATERAL TERM SHEET IS NOT COMPLETE AND MAY BE AMENDED PRIOR TO THE TIME OF SALE. THIS TERM SHEET IS NOT AN OFFER TO SELL THESE SECURITIES AND IT IS NOT A SOLICITATION OF AN OFFER TO BUY THESE SECURITIES IN ANY JURISDICTION WHERE THE OFFER OR SALE IS NOT PERMITTED.
125
VINTAGE PARTS PORTFOLIO |
Operating History and Underwritten Net Cash Flow. The following table presents certain information relating to the Underwritten Net Cash Flow for the Vintage Parts Portfolio Properties:
Cash Flow Analysis(1)(2)
| In Place | U/W | U/W $ per SF | |||||
| Base Rent | $2,560,000 | $2,560,000 | $3.75 | ||||
| Grossed Up Vacant Space | 0 | 0 | 0.00 | ||||
| Total Reimbursables | 0 | 0 | 0.00 | ||||
| Other Income | 0 | 0 | 0.00 | ||||
| Less Vacancy & Credit Loss | 0 | (128,000)(3) | (0.19) | ||||
| Effective Gross Income | $2,560,000 | $2,432,000 | $3.57 | ||||
| Total Operating Expenses | 0 | $72,960 | $0.11 | ||||
| Net Operating Income | $2,560,000 | $2,359,040 | $3.46 | ||||
| TI/LC | 0 | 150,281 | 0.22 | ||||
| Capital Expenditures | 0 | 102,314 | 0.15 | ||||
| Net Cash Flow | $2,560,000 | $2,106,445 | $3.09 | ||||
| NOI DSCR | 1.77x | 1.64x | |||||
| NCF DSCR | 1.77x | 1.46x | |||||
| NOI DY | 11.2% | 10.3% | |||||
| NCF DY | 11.2% | 9.2% |
| (1) | Cash Flow Analysis is based upon leases in-place as of May 1, 2014 for all three of the Vintage Parts Portfolio Properties. |
| (2) | Historical financial information is unavailable because the Vintage Parts Portfolio Properties were acquired in March 2014 in a sale-leaseback transaction. |
| (3) | The underwritten economic vacancy is 5.0%. The Vintage Parts Portfolio Properties were 100.0% physically occupied as of May 1, 2014. |
THE INFORMATION IN THIS STRUCTURAL AND COLLATERAL TERM SHEET IS NOT COMPLETE AND MAY BE AMENDED PRIOR TO THE TIME OF SALE. THIS TERM SHEET IS NOT AN OFFER TO SELL THESE SECURITIES AND IT IS NOT A SOLICITATION OF AN OFFER TO BUY THESE SECURITIES IN ANY JURISDICTION WHERE THE OFFER OR SALE IS NOT PERMITTED.
126
(THIS PAGE INTENTIONALLY LEFT BLANK)
127
| No. 15 – Foxwoods Hotel Portfolio | |||||||
| Loan Information | Property Information | ||||||
| Mortgage Loan Seller: | Rialto Mortgage Finance, LLC | Single Asset/Portfolio: | Portfolio | ||||
| Credit Assessment (DBRS/KBRA/Moody’s): | NR/NR/NR | Property Type: | Hospitality | ||||
| Original Principal Balance: | $22,000,000 | Specific Property Type: | Limited Service | ||||
| Cut-off Date Principal Balance: | $21,965,941 | Location: | Various – See Table | ||||
| % of Initial Pool Balance: | 1.8% | Size: | 329 Rooms | ||||
| Loan Purpose: | Refinance | Cut-off Date Principal Balance Per Room: | $66,766 | ||||
| Borrower Names: | Julia Tate Holding, LLC; Raspberry Junction Holding, LLC | Year Built/Renovated: | Various/NAP | ||||
| Sponsor: | Patrick Levantino | Title Vesting: | Fee | ||||
| Mortgage Rate: | 5.540% | Property Manager: | Self-managed | ||||
| Note Date: | April 8, 2014 | 3rd Most Recent Occupancy (As of)(2): | 58.9% (12/31/2011) | ||||
| Anticipated Repayment Date: | NAP | 2nd Most Recent Occupancy (As of)(2): | 55.8% (12/31/2012) | ||||
| Maturity Date: | April 6, 2024 | Most Recent Occupancy (As of)(2): | 47.3% (12/31/2013) | ||||
| IO Period: | None | Current Occupancy (As of): | 48.9% (2/28/2014) | ||||
| Loan Term (Original): | 120 months | ||||||
| Seasoning: | 1 month | Underwriting and Financial Information: | |||||
| Amortization Term (Original): | 300 months | ||||||
| Loan Amortization Type: | Amortizing Balloon | 3rd Most Recent NOI (As of)(3): | $2,854,328 (12/31/2012) | ||||
| Interest Accrual Method: | Actual/360 | 2nd Most Recent NOI (As of): | $3,690,284 (12/31/2013) | ||||
| Call Protection: | L(25),D(91),O(4) | Most Recent NOI (As of): | $3,986,676 (TTM 2/28/2014) | ||||
| Lockbox Type: | Hard/Upfront Cash Management | ||||||
| Additional Debt: | None | U/W Revenues: | $8,657,969 | ||||
| Additional Debt Type: | NAP | U/W Expenses: | $5,552,462 | ||||
| U/W NOI: | $3,105,507 | ||||||
| U/W NCF: | $2,759,189 | ||||||
| U/W NOI DSCR: | 1.91x | ||||||
Escrows and Reserves: | U/W NCF DSCR: | 1.70x | |||||
| U/W NOI Debt Yield: | 14.1% | ||||||
Type: | Initial | Monthly | Cap (If Any) | U/W NCF Debt Yield: | 12.6% | ||
| Taxes | $90,674 | $21,589 | NAP | As-Is Appraised Value: | $44,300,000 | ||
| Insurance | $51,264 | $16,274 | NAP | As-Is Appraisal Valuation Date: | Various | ||
| FF&E | $0 | $28,860 | NAP | Cut-off Date LTV Ratio: | 49.6% | ||
Franchise PIP Funds(1) | $0 | Springing | NAP | LTV Ratio at Maturity or ARD: | 37.9% | ||
| (1) | Upon the execution of a new or replacement franchise agreement by and between the borrower and a franchisor, the mortgage loan documents require the borrower to deposit an amount equal to 110% of the estimated property improvement plan costs into the Franchise PIP Funds reserve. |
| (2) | Occupancy as of December 31, 2011 and December 31, 2012 include only the Bellissimo Grand property, as the Hilton Garden Inn Preston property was built in 2013. Occupancy as of December 31, 2013 includes a full year for the Bellissimo Grande property and a partial year for the Hilton Garden Inn Preston property, which was completed in 2013. |
| (3) | Includes only the Bellissimo Grande property. |
The Foxwoods Hotel Portfolio mortgage loan is evidenced by a single promissory note that is secured by a first mortgage encumbering two limited service hotels, the Hilton Garden Inn Preston property, located in Preston, Connecticut, and the Bellissimo Grande property, located in North Stonington, Connecticut (the “Foxwoods Hotel Portfolio Properties”). The Foxwoods Hotel Portfolio Properties offer complimentary shuttle service to the Foxwoods Resort and Casino. The Hilton Garden Inn Preston property is a four-story, 165-room hotel situated on an 8.5 acre site located approximately 1.0 mile west of the Foxwoods Resort and Casino, 8.9 miles east of the Mohegan Sun casino, and 10.8 miles north of Mystic, Connecticut. The Hilton Garden Inn Preston property was built in 2013 and consists of 70 king rooms, 66 double queen rooms, 21 suites and eight handicap accessible rooms. Hilton Garden Inn property amenities include the Great American Grill, serving breakfast, lunch, dinner and room service, the Pavilion Lounge, 24-hour Pavilion Pantry Market, 4,175 square feet of meeting space including a ballroom, ATM, fitness room, indoor heated swimming pool and outdoor spa, children’s play area and business center. The Hilton Garden Inn Preston property currently operates under a franchise agreement with Hilton Garden Inns Franchise LLC, which expires on April 30, 2033. The Bellissimo Grande property is a three-story, 164-room hotel situated on a 7.5 acre site located approximately 3.9 miles southeast of the Foxwoods Resort and Casino, 14.4 miles east of the Mohegan Sun casino, and 8.7 miles north of Mystic, Connecticut. The Bellissimo Grande property operates as an independent hotel, was built in 2007 and consists of 48 king rooms, 50 double queen rooms, 58 suites, and 8 handicap accessible rooms. The Bellissimo Grande property amenities include a bar area, breakfast dining area, Starbucks kiosk, event catering, fitness room, full-service health spa, room service and indoor heated pool.
THE INFORMATION IN THIS STRUCTURAL AND COLLATERAL TERM SHEET IS NOT COMPLETE AND MAY BE AMENDED PRIOR TO THE TIME OF SALE. THIS TERM SHEET IS NOT AN OFFER TO SELL THESE SECURITIES AND IT IS NOT A SOLICITATION OF AN OFFER TO BUY THESE SECURITIES IN ANY JURISDICTION WHERE THE OFFER OR SALE IS NOT PERMITTED.
128
| FOXWOODS HOTEL PORTFOLIO |
Sources and Uses
| Sources | Uses | ||||||||
Original loan amount | $22,000,000 | 100.0% | Loan payoff | $19,138,614 | 87.0 | % | |||
Reserves | $141,938 | 0.6 | % | ||||||
Closing costs | $271,231 | 1.2 | % | ||||||
Return of equity | $2,448,217 | 11.1 | % | ||||||
Total Sources | $22,000,000 | 100.0% | Total Uses | $22,000,000 | 100.0 | % | |||
The following table presents certain information relating to the Foxwoods Hotel Portfolio Properties:
| Property Name – Location | Hotel Property Type | Allocated Cut-off Date Principal Balance | % of Portfolio Cut-off Date Principal Balance | Rooms | Cut-off Date Balance Per Room | Year Built/ Renovated | Appraised Value | |||||||
| Hilton Garden Inn Preston – Preston, CT | Limited Service | $11,981,423 | 54.5% | 165 | $72,615 | 2013/NAP | $24,100,000 | |||||||
| Bellissimo Grande – North Stonington, CT | Limited Service | $9,984,519 | 45.5% | 164 | $60,881 | 2007/NAP | $20,200,000 | |||||||
| Total/Weighted Average | $21,965,941 | 100.0% | 329 | $66,766 | $44,300,000 |
Subject and Market Historical Occupancy, ADR and RevPAR
(Hilton Garden Inn Preston)(1)
(Hilton Garden Inn Preston)(1)
Competitive Set | Hilton Garden Inn Preston(2) | Penetration Factor | |||||||||||||||||
Year | Occupancy | ADR | RevPAR | Occupancy | ADR | RevPAR | Occupancy | ADR | RevPAR | ||||||||||
| 2/28/2014 TTM | 61.2% | $123.03 | $75.26 | 47.1% | $144.51 | $68.04 | 77.0% | 117.5% | 90.4% | ||||||||||
| (1) | Information obtained from a third party hospitality research report dated March 19, 2014.The competitive set includes the following hotels: Courtyard Norwich, Hilton Garden Inn Mystic Groton, Bellissimo Grande (part of the Foxwoods Hotel Portfolio Properties), Hampton Inn Suites Mystic and Hyatt Place Uncasville. |
| (2) | The Hilton Garden Inn Preston property opened in 2013. |
Subject and Market Historical Occupancy, ADR and RevPAR
(Bellissimo Grande)(1)
| �� | Competitive Set | Bellissimo Grande | Penetration Factor | ||||||||||||||||
Year | Occupancy | ADR | RevPAR | Occupancy | ADR | RevPAR | Occupancy | ADR | RevPAR | ||||||||||
| 2/28/2014 TTM | 42.9% | $109.69 | $47.07 | 46.9% | $135.40 | $63.52 | 109.3% | 123.4% | 134.9% | ||||||||||
| 12/31/2012 | 46.9% | $108.60 | $50.97 | 55.7% | $134.89 | $75.16 | 118.7% | 124.2% | 147.4% | ||||||||||
| 12/31/2011 | 63.0% | $127.24 | $80.15 | 58.9% | $135.69 | $79.87 | 93.5% | 106.6% | 99.7% | ||||||||||
| (1) | Information obtained from a third party hospitality research report dated January 18, 2012, January 17, 2013, and March 18, 2014 for 12/31/2011, 12/31/2012, and 2/28/2014 TTM, respectively. The competitive set includes the following hotels: Days Inn Mystic, Quality Inn Mystic, Comfort Inn Mystic, Best Western Plus Cristata Inn, Microtel Inn & Suites by Wyndham Montville Uncasville, Holiday Inn Express Mystic and La Quinta Inns & Suites Stonington. |
THE INFORMATION IN THIS STRUCTURAL AND COLLATERAL TERM SHEET IS NOT COMPLETE AND MAY BE AMENDED PRIOR TO THE TIME OF SALE. THIS TERM SHEET IS NOT AN OFFER TO SELL THESE SECURITIES AND IT IS NOT A SOLICITATION OF AN OFFER TO BUY THESE SECURITIES IN ANY JURISDICTION WHERE THE OFFER OR SALE IS NOT PERMITTED.
129
| FOXWOODS HOTEL PORTFOLIO |
Operating History and Underwritten Net Cash Flow. The following table presents certain information relating to the historical operating performance and Underwritten Net Cash Flow at the Foxwoods Hotel Portfolio Properties:
Cash Flow Analysis
2012(1) | 2013(2) | TTM 2/28/2014 | U/W | U/W $ per Room | |||||||||||
| Occupancy | 55.8% | 47.3% | 48.9% | 47.0% | |||||||||||
| ADR | $131.00 | $137.11 | $137.35 | $137.35 | |||||||||||
| RevPAR | $73.09 | $64.79 | $67.20 | $64.55 | |||||||||||
| Total Revenue | $4,944,285 | $8,037,772 | $8,657,969 | $8,657,969 | $26,316 | ||||||||||
| Total Department Expenses | 1,269,045 | 2,286,554 | 2,426,976 | 2,434,257 | 7,399 | ||||||||||
| Gross Operating Profit | $3,675,240 | $5,751,218 | $6,230,993 | $6,223,712 | $18,917 | ||||||||||
| Total Undistributed Expenses | 676,356 | 1,801,866 | 1,985,254 | 2,616,868 | 7,954 | ||||||||||
| Profit Before Fixed Charges | $2,998,883 | $3,949,352 | $4,245,739 | $3,606,844 | $10,963 | ||||||||||
| / | |||||||||||||||
| Total Fixed Charges | 144,555 | 259,068 | 259,063 | 501,337 | 1,524 | ||||||||||
| Net Operating Income | $2,854,328 | $3,690,284 | $3,986,676 | $3,105,507 | $9,439 | ||||||||||
| FF&E | 197,771 | 321,511 | 346,319 | 346,319 | 1,053 | ||||||||||
| Net Cash Flow | $2,656,557 | $3,368,773 | $3,640,357 | $2,759,189 | $8,387 | ||||||||||
| NOI DSCR | 1.75x | 2.27x | 2.45x | 1.91x | |||||||||||
| NCF DSCR | 1.63x | 2.07x | 2.24x | 1.70x | |||||||||||
| NOI DY | 13.0% | 16.8% | 18.1% | 14.1% | |||||||||||
| NCF DY | 12.1% | 15.3% | 16.6% | 12.6% | |||||||||||
| (1) | Historical financials presented in 2012 reflect only the Bellissimo Grande property because the Hilton Garden Inn Preston property was built in 2013. |
| (2) | Historical financials presented in 2013 reflect a full year of Bellissimo Grande property and a partial year of Hilton Garden Inn Preston property. |
THE INFORMATION IN THIS STRUCTURAL AND COLLATERAL TERM SHEET IS NOT COMPLETE AND MAY BE AMENDED PRIOR TO THE TIME OF SALE. THIS TERM SHEET IS NOT AN OFFER TO SELL THESE SECURITIES AND IT IS NOT A SOLICITATION OF AN OFFER TO BUY THESE SECURITIES IN ANY JURISDICTION WHERE THE OFFER OR SALE IS NOT PERMITTED.
130
(THIS PAGE INTENTIONALLY LEFT BLANK)
131
WFRBS Commercial Mortgage Trust 2014-C20 | Transaction Contact Information |
VI. Transaction Contact Information
Questions regarding this Structural and Collateral Term Sheet may be directed to any of the following individuals:
| Wells Fargo Securities, LLC | RBS Securities Inc. | |||||
| Brigid Mattingly | Tel. (312) 269-3062 | Todd Jaeger - Trading | Tel. (203) 897-2900 | |||
| Fax (312) 658-0140 | ||||||
| A.J. Sfarra | Tel. (212) 214-5613 | Adam Ansaldi | Tel. (203) 897-0881 | |||
| Fax (212) 214-8970 | Fax (203) 873-3542 | |||||
| Alex Wong | Tel. (212) 214-5615 | Jim Barnard | Tel. (203) 897-4417 | |||
| Fax (212) 214-8970 | Fax (203) 873-4310 | |||||
THE INFORMATION IN THIS STRUCTURAL AND COLLATERAL TERM SHEET IS NOT COMPLETE AND MAY BE AMENDED PRIOR TO THE TIME OF SALE. THIS TERM SHEET IS NOT AN OFFER TO SELL THESE SECURITIES AND IT IS NOT A SOLICITATION OF AN OFFER TO BUY THESE SECURITIES IN ANY JURISDICTION WHERE THE OFFER OR SALE IS NOT PERMITTED.
132