Exhibit 99.2

168,84,0 218,109,0 108,54,0 230,230,230 127,127,127 255,151,47 255,194,13 3 78,66,49 CONFIDENTIAL GRUPO COLOMBO Management Presentation December 2015
168,84,0 218,109,0 108,54,0 230,230,230 127,127,127 255,151,47 255,194,13 3 78,66,49 1 Safe Harbor This presentation was filed with the Securities and Exchange Commission on December 21 , 2015 as an exhibit to a Form 8 - K filed by Garnero Group Acquisition Company (“GGAC”) . GGAC is holding presentations for certain of its shareholders, as well as other persons who might be interested in purchasing GGAC's securities, regarding its business combination with Q 1 Comercial de Roupas S . A . (“Colombo” or the “Company”) . The attached presentation will be distributed to attendees at these presentations . EarlyBirdCapital , Inc . (“EBC”), the managing underwriter of GGAC's initial public offering (“IPO”) consummated on June 26 , 2014 , is acting as GGAC’s advisor in these efforts, for which EBC will receive a fee of up to $ 4 , 600 , 000 if the business combination is successfully consummated . GGAC, its directors and executive officers and EBC may be deemed to be participants in the solicitation of proxies for the extraordinary general meeting of GGAC’s shareholders to be held to approve the business combination . SHAREHOLDERS OF GGAC AND OTHER INTERESTED PERSONS ARE ADVISED TO READ, WHEN AVAILABLE, GGAC’S PROXY STATEMENT FOR THE EXTRAORDINARY GENERAL MEETING (THE “PROXY STATEMENT”), WHICH WILL CONTAIN IMPORTANT INFORMATION . Such persons may read the Proxy Statement, GGAC’S final prospectus, dated June 25 , 2014 , for its initial public offering and GGAC’S annual report on Form 10 - K for the period ended June 30 , 2014 for a description of the security holdings of GGAC’S officers and directors and of EBC and their respective interests in the successful consummation of the business combination . The Proxy Statement will be mailed to shareholders as of a record date to be established for voting on the business combination . Shareholders will also be able to obtain a copy of the Proxy Statement, without charge, by directing a request to : Garnero Group Acquisition Company, Av Brig . Faria Lima, 1485 - 19 Andar , Brasilinvest Plaza CEP 01452 - 002 , Sao Paulo, Brazil, Attn : Secretary, or email : jmriva@garnerogroup . com . The Proxy Statement, once available, and the final prospectus and annual report on Form 10 - K can also be obtained, without charge, at the Securities and Exchange Commission’s internet site (http : // www . sec . gov ) . This presentation may contain forward - looking statements within the meaning of the Private Securities Litigation Reform Act of 1995 , about GGAC, Grupo Colombo and their combined business after completion of the proposed acquisition . Forward - looking statements are all statements other than historical facts . Such forward - looking statements, based upon the current beliefs and expectations of GGAC’s and Grupo Colombo management, are subject to risks, uncertainties and other factors, which could cause actual results to differ from the forward - looking statements . In some cases, you can identify forward - looking statements by terminology such as “may,” “will,” “should,” “expects,” “plans,” “anticipates,” “believes,” “estimates,” “predicts,” “potential” or “continue” or the negative of these terms or other comparable terminology . These statements are only current predictions and are subject to known and unknown risks, uncertainties and other factors that may cause our or our industry’s actual results, levels of activity, performance or achievements to be materially different from those anticipated by the forward - looking statements . The following factors, among others, could cause actual results to differ from those set forth in the forward - looking statements : business conditions ; customer acceptance of new products ; changing interpretations of generally accepted accounting principles ; outcomes of government reviews ; inquiries and investigations and related litigation ; continued compliance with government regulations ; legislation or regulatory environments ; requirements or changes adversely affecting the businesses in which Grupo Colombo is engaged ; fluctuations in customer demand ; management of rapid growth ; general economic conditions ; community relations ; geopolitical events and regulatory changes, as well as other relevant risks detailed in GGAC’s filings with the Securities and Exchange Commission . Certain of Grupo Colombo’s financial information and data contained in this presentation is unaudited and/or are prepared by Grupo Colombo as a private company and do not conform to SEC Regulation S - X . Moreover, they contain certain financial information (EBITDA) not derived in accordance with US GAAP . Accordingly, such information and data will be adjusted and presented differently in GGAC’s Proxy Statement and other filings with the SEC . GGAC and Grupo Colombo believe that the presentation of non - GAAP measures provides information that is useful to investors as it indicates more clearly the ability of Grupo Colombo to meet capital expenditures and working capital requirements and otherwise meet its obligations as they become due . The financial estimates and projections for Grupo Colombo contained in this presentation are forward - looking statements that are based on assumptions that are inherently subject to significant uncertainties and contingencies, many of which are beyond Grupo Colombo’s control . While all estimates and projections are necessarily speculative, Grupo Colombo believes that the prospective financial information covering periods beyond twelve months from its date of preparation carries increasingly higher levels of uncertainty and should be read in that context . There will be differences between actual and projected results, and actual results may be materially greater or materially less than those contained in the estimates and projections . The inclusion of the estimates and projections in this presentation should not be regarded as an indication that Grupo Colombo, or its representatives, considered or consider the estimates or projections to be a reliable prediction of future events . Grupo Colombo is not warranting the accuracy, reliability, appropriateness or completeness of the estimates or projections to anyone . Neither Grupo Colombo s management nor any of its representatives has made or makes any representation to any person regarding the ultimate performance of Grupo Colombo compared to the information contained in the estimates and projections, and none of them undertakes or intends to undertake any obligation to update or otherwise revise the estimates or projections to reflect circumstances existing after the date when made or to reflect the occurrence of future events in the event that any or all of the assumptions underlying the estimates and projections are shown to be in error . Accordingly, they should not be looked upon as “guidance” of any sort . Grupo Colombo will not refer back to these estimates and forecasts in future periodic reports filed under the Securities Exchange Act of 1934 .
168,84,0 218,109,0 108,54,0 230,230,230 127,127,127 255,151,47 255,194,13 3 78,66,49 Section 1 Transaction Overview
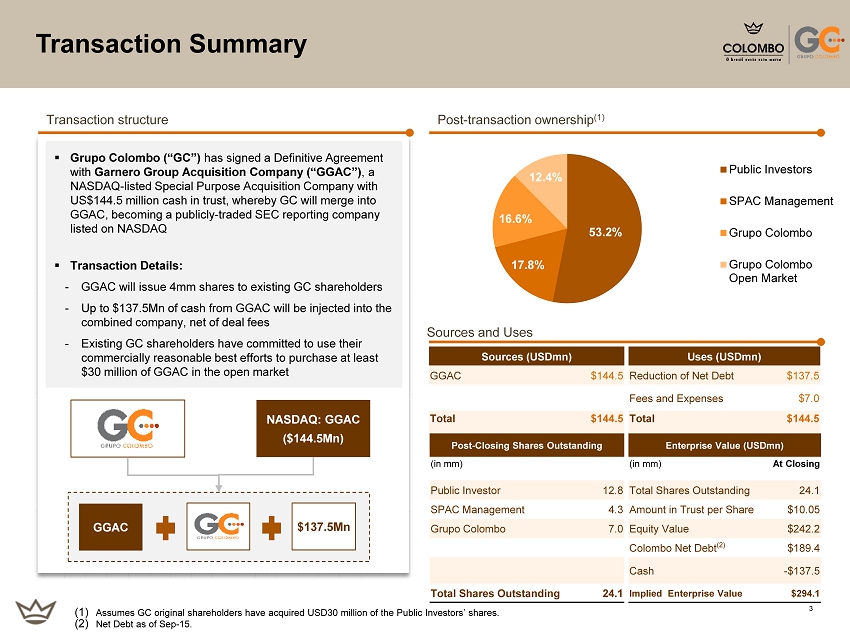
168,84,0 218,109,0 108,54,0 230,230,230 127,127,127 255,151,47 255,194,13 3 78,66,49 3 Sources (USDmn) Uses (USDmn) GGAC $ 144.5 Reduction of Net Debt $137.5 Fees and Expenses $7.0 Total $144.5 Total $144.5 Transaction Summary Post - transaction ownership (1) Transaction structure Sources and Uses NASDAQ: GGAC ($144.5Mn) GGAC $137.5Mn ▪ Grupo Colombo (“GC”) has signed a Definitive Agreement with Garnero Group Acquisition Company (“GGAC”) , a NASDAQ - listed Special Purpose Acquisition Company with US$144.5 million cash in trust, whereby GC will merge into GGAC , becoming a publicly - traded SEC reporting company listed on NASDAQ ▪ Transaction Details: - GGAC will issue 4mm shares to existing GC shareholders - Up to $137.5Mn of cash from GGAC will be injected into the combined company, net of deal fees - Existing GC shareholders have committed to use their commercially reasonable best efforts to purchase at least $30 million of GGAC in the open market Post - Closing Shares Outstanding Enterprise Value ( USDmn ) (in mm) (in mm) At Closing Public Investor 12.8 Total Shares Outstanding 24.1 SPAC Management 4.3 Amount in Trust per Share $10.05 Grupo Colombo 7.0 Equity Value $ 242.2 Colombo Net Debt (2) $ 189.4 Cash - $ 137.5 Total Shares Outstanding 24.1 Implied Enterprise Value $ 294.1 (1) Assumes GC original shareholders have acquired USD30 million of the Public Investors’ shares. (2) Net Debt as of Sep - 15. 53.2% 17.8% 16.6% 12.4% Public Investors SPAC Management Grupo Colombo Grupo Colombo Open Market
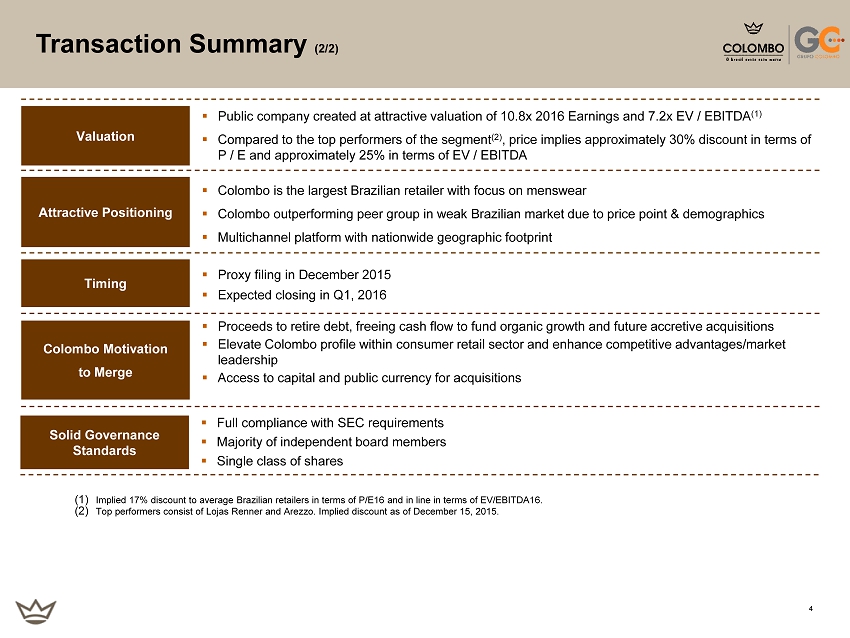
168,84,0 218,109,0 108,54,0 230,230,230 127,127,127 255,151,47 255,194,13 3 78,66,49 4 Valuation ▪ Public company created at attractive valuation of 10.8x 2016 Earnings and 7.2x EV / EBITDA (1) ▪ Compared to the top performers of the segment (2) , price implies approximately 30% discount in terms of P / E and approximately 25% in terms of EV / EBITDA ▪ Proceeds to retire debt, freeing cash flow to fund organic growth and future accretive acquisitions ▪ Elevate Colombo profile within consumer retail sector and enhance competitive advantages/market leadership ▪ Access to capital and public currency for acquisitions Colombo Motivation to Merge Timing ▪ Proxy filing in December 2015 ▪ Expected closing in Q1, 2016 Attractive Positioning ▪ Colombo is the largest Brazilian retailer with focus on menswear ▪ Colombo outperforming peer group in weak Brazilian market due to price point & demographics ▪ Multichannel platform with nationwide geographic footprint (1) Implied 17% discount to average Brazilian retailers in terms of P/E16 and in line in terms of EV/EBITDA16. (2) Top performers consist of Lojas Renner and Arezzo. Implied discount as of December 15, 2015. Transaction Summary (2/2) Solid Governance Standards ▪ Full compliance with SEC requirements ▪ Majority of independent board members ▪ Single class of shares
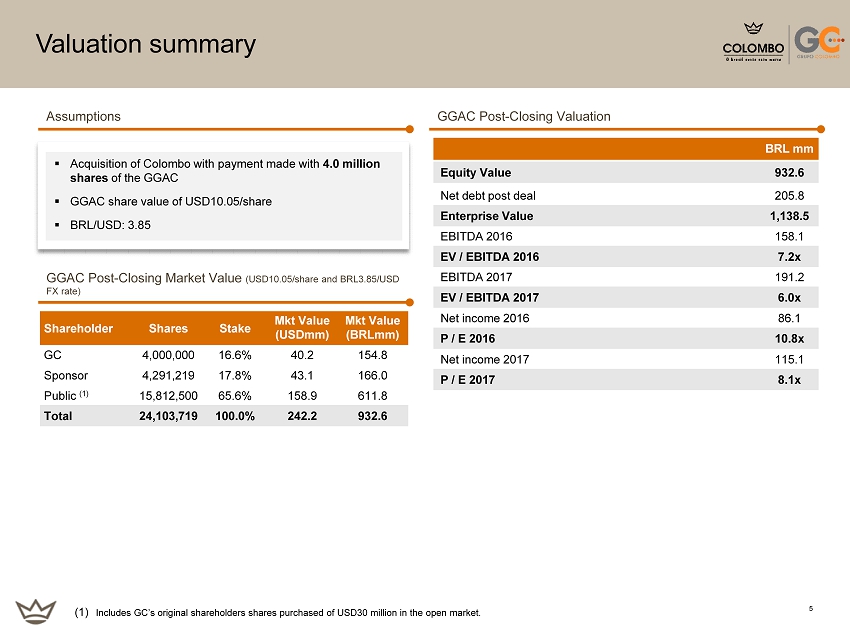
168,84,0 218,109,0 108,54,0 230,230,230 127,127,127 255,151,47 255,194,13 3 78,66,49 5 GGAC Post - Closing Valuation GGAC Post - Closing Market Value (USD10.05/share and BRL3.85/USD FX rate) ▪ Acquisition of Colombo with payment made with 4.0 million shares of the GGAC ▪ GGAC share value of USD10.05/share ▪ BRL/USD: 3.85 Assumptions Valuation summary Shareholder Shares Stake Mkt Value (USDmm ) Mkt Value (BRLmm ) GC 4,000,000 16.6% 40.2 154.8 Sponsor 4,291,219 17.8% 43.1 166.0 Public (1) 15,812,500 65.6% 158.9 611.8 Total 24,103,719 100.0% 242.2 932.6 BRL mm Equity Value 932.6 Net debt post deal 205.8 Enterprise Value 1,138.5 EBITDA 2016 158.1 EV / EBITDA 2016 7.2x EBITDA 2017 191.2 EV / EBITDA 2017 6.0x Net income 2016 86.1 P / E 2016 10.8x Net income 2017 115.1 P / E 2017 8.1x (1) Includes GC’s original shareholders shares purchased of USD30 million in the open market.

168,84,0 218,109,0 108,54,0 230,230,230 127,127,127 255,151,47 255,194,13 3 78,66,49 SECTION 2 Company Overview
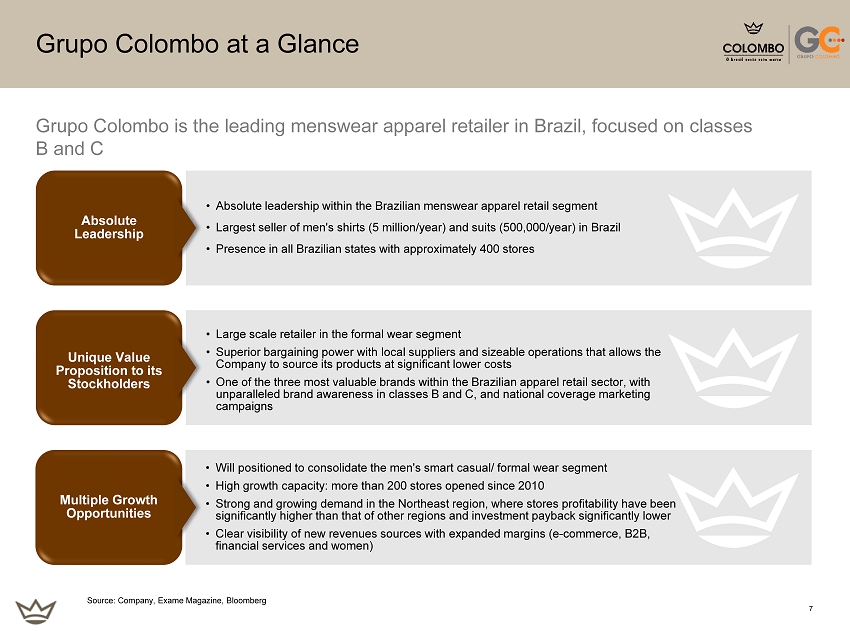
168,84,0 218,109,0 108,54,0 230,230,230 127,127,127 255,151,47 255,194,13 3 78,66,49 7 Grupo Colombo at a Glance • Absolute leadership within the Brazilian menswear apparel retail segment • Largest seller of men's shirts (5 million/year) and suits (500,000/year) in Brazil • Presence in all Brazilian states with approximately 400 stores • L arge scale retailer in the formal wear segment • Superior bargaining power with local suppliers and sizeable operations that allows the Company to source its products at significant lower costs • One of the three most valuable brands within the Brazilian apparel retail sector, with unparalleled brand awareness in classes B and C, and national coverage marketing campaigns • Will positioned to consolidate the men's smart casual/ formal wear segment • High growth capacity: more than 200 stores opened since 2010 • Strong and growing demand in the Northeast region, where stores profitability have been significantly higher than that of other regions and investment payback significantly lower • Clear visibility of new revenues sources with expanded margins (e - commerce, B2B, financial services and women) Grupo Colombo is the leading menswear apparel retailer in Brazil, focused on classes B and C Absolute Leadership Unique Value Proposition to its Stockholders Multiple Growth Opportunities Source: Company, Exame Magazine, Bloomberg
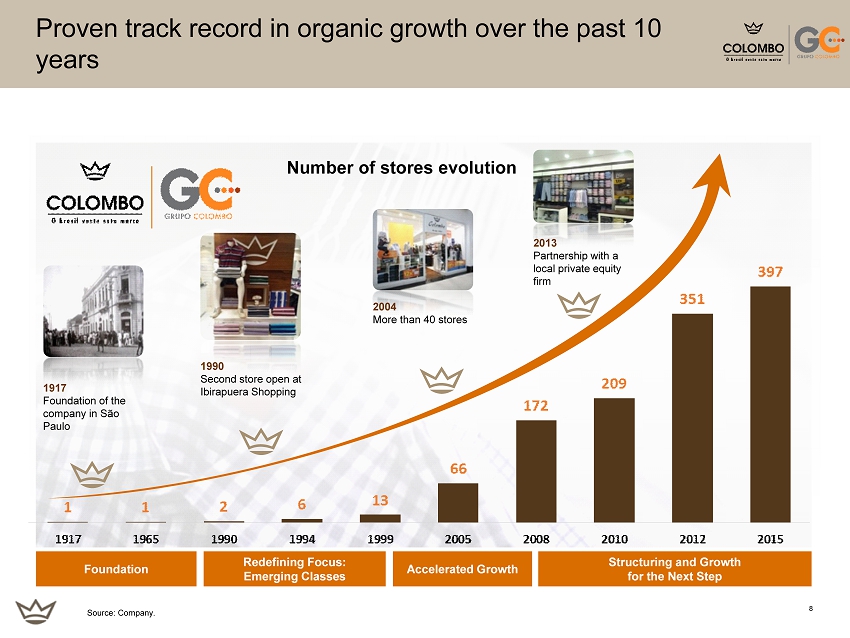
168,84,0 218,109,0 108,54,0 230,230,230 127,127,127 255,151,47 255,194,13 3 78,66,49 8 Proven track record in organic growth over the past 10 years 1917 Foundation of the company in São Paulo Foundation Redefining Focus: Emerging Classes Accelerated Growth Structuring and Growth for the Next Step 2013 Partnership with a local private equity firm Source: Company. Number of stores evolution 1990 Second store open at Ibirapuera Shopping 2004 More than 40 stores
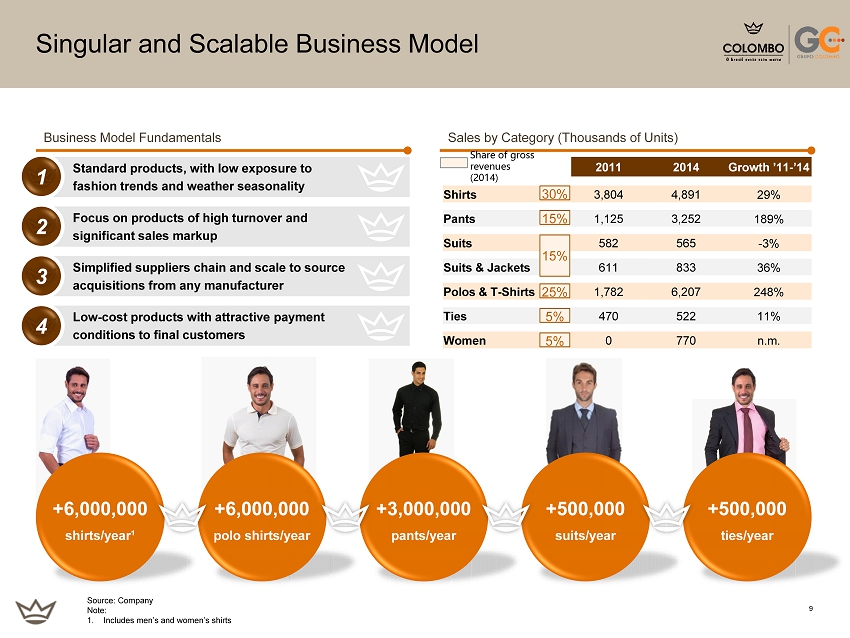
168,84,0 218,109,0 108,54,0 230,230,230 127,127,127 255,151,47 255,194,13 3 78,66,49 9 2011 2014 Growth ’11 - ’14 Shirts 3,804 4,891 29% Pants 1,125 3,252 189% Suits 582 565 - 3% Suits & Jackets 611 833 36% Polos & T - Shirts 1,782 6,207 248% Ties 470 522 11% Women 0 770 n.m. Singular and Scalable Business Model +3,000,000 pants/year +500,000 suits/year +500,000 ties/year Sales by Category (Thousands of Units) Business Model Fundamentals Standard products, with low exposure to fashion trends and weather seasonality Focus on products of high turnover and significant sales markup Simplified suppliers chain and scale to source acquisitions from any manufacturer Low - cost products with attractive payment conditions to final customers +6,000,000 shirts/year¹ +6,000,000 polo shirts/year Source: Company Note: 1. Includes men’s and women’s shirts 1 2 3 4 30% 15% 15% 25% 5 % 5% Share of gross revenues (2014)
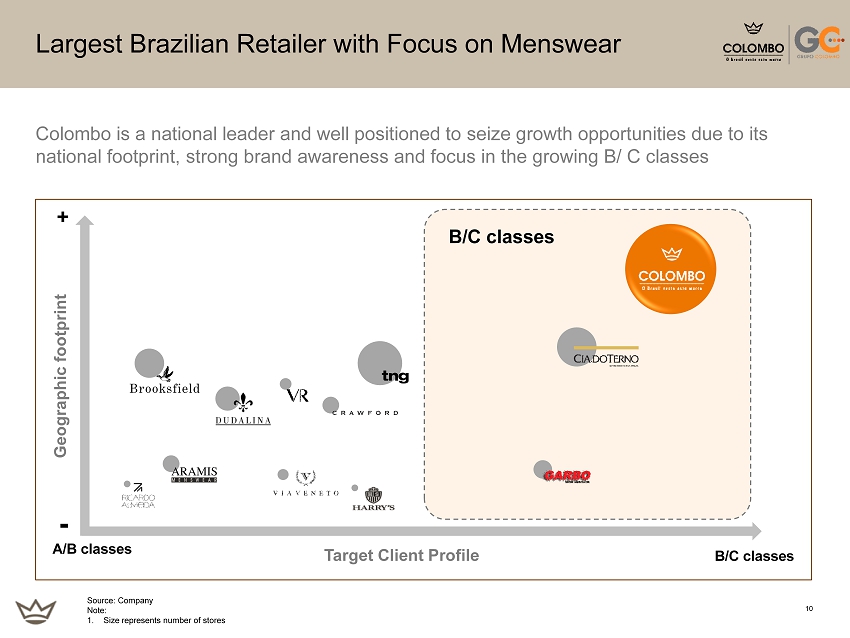
168,84,0 218,109,0 108,54,0 230,230,230 127,127,127 255,151,47 255,194,13 3 78,66,49 10 Largest Brazilian Retailer with Focus on Menswear Target Client Profile - B/C classes + Geographic footprint A/B classes B/C classes Colombo is a national leader and well positioned to seize growth opportunities due to its national footprint, strong brand awareness and focus in the growing B/ C classes Source: Company Note: 1. Size represents number of stores
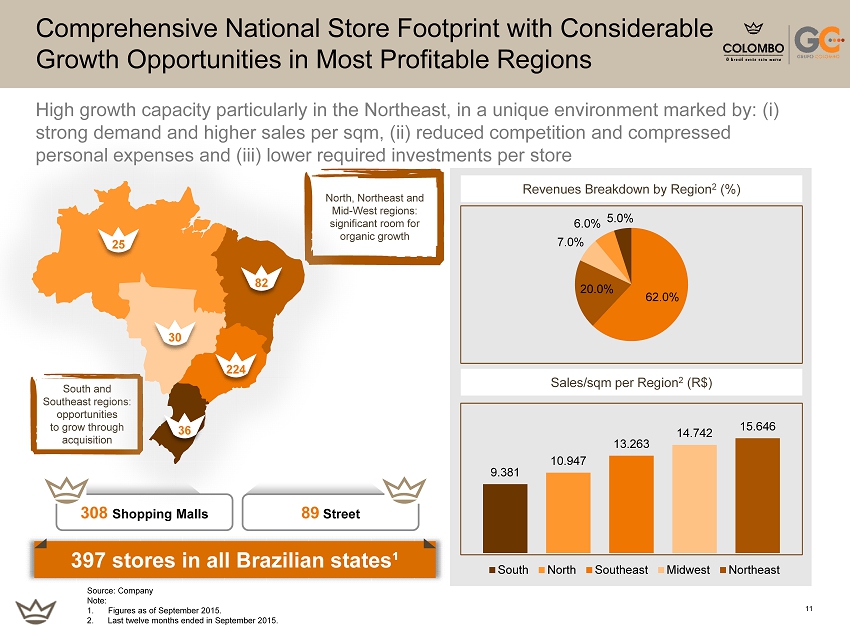
168,84,0 218,109,0 108,54,0 230,230,230 127,127,127 255,151,47 255,194,13 3 78,66,49 11 Comprehensive National Store Footprint with Considerable Growth Opportunities in Most Profitable Regions 397 stores in all Brazilian states¹ Revenues Breakdown by Region 2 (%) 308 Shopping Malls 89 Street Sales/ sqm per Region 2 (R$) Source: Company Note: 1. Figures as of September 2015. 2. Last twelve months ended in September 2015. South and Southeast regions: opportunities to grow through acquisition North, Northeast and Mid - West regions: significant room for organic growth 25 82 30 224 36 High growth capacity particularly in the Northeast, in a unique environment marked by: (i) strong demand and higher sales per sqm , (ii) reduced competition and compressed personal expenses and (iii) lower required investments per store 62.0% 20.0% 7.0% 6.0% 5.0% 9.381 10.947 13.263 14.742 15.646 South North Southeast Midwest Northeast

168,84,0 218,109,0 108,54,0 230,230,230 127,127,127 255,151,47 255,194,13 3 78,66,49 SECTION 3 Investment Highlights
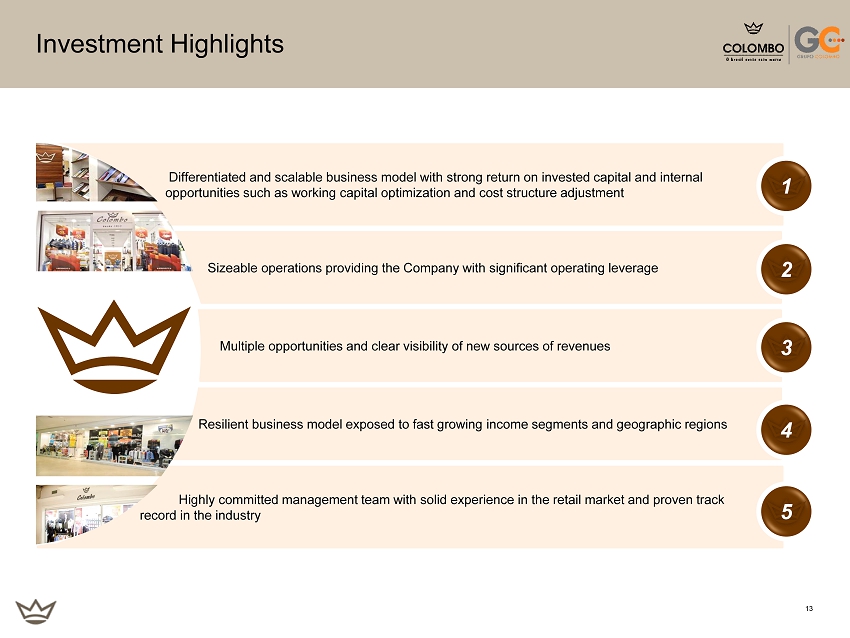
168,84,0 218,109,0 108,54,0 230,230,230 127,127,127 255,151,47 255,194,13 3 78,66,49 13 Multiple opportunities and clear visibility of new sources of revenues Resilient business model exposed to fast growing income segments and geographic regions Differentiated and scalable business model with strong return on invested capital and internal opportunities such as working capital optimization and cost structure adjustment Sizeable operations providing the Company with significant operating leverage Highly committed management team with solid experience in the retail market and proven track record in the industry 3 4 Investment Highlights 1 2 5
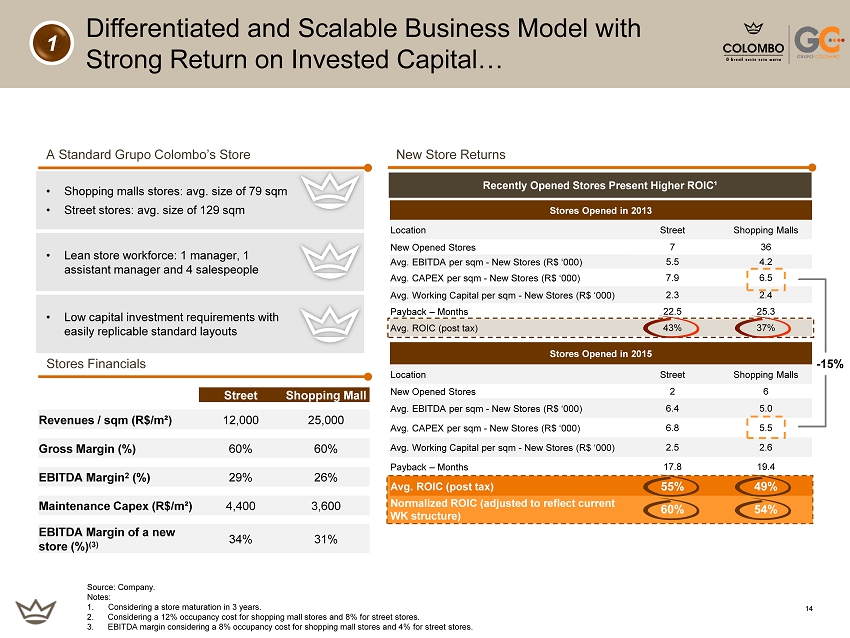
168,84,0 218,109,0 108,54,0 230,230,230 127,127,127 255,151,47 255,194,13 3 78,66,49 14 A Standard Grupo Colombo’s Store • Shopping malls stores: avg. size of 79 sqm • Street stores: avg. size of 129 sqm • Lean store workforce: 1 manager, 1 assistant manager and 4 salespeople Stores Financials • Low capital investment requirements with easily replicable standard layouts Differentiated and Scalable Business Model with Strong Return on Invested Capital… 1 Street Shopping Mall Revenues / sqm (R$/m²) 12,000 25,000 Gross Margin (%) 60% 60% EBITDA Margin 2 (%) 29% 26% Maintenance Capex (R$/m²) 4,400 3,600 EBITDA Margin of a new store (%) (3) 34% 31% Recently Opened Stores Present Higher ROIC¹ Stores Opened in 2013 Location Street Shopping Malls New Opened Stores 7 36 Avg. EBITDA per sqm - New Stores (R $ ‘000) 5.5 4.2 Avg. CAPEX per sqm - New Stores (R $ ‘000) 7.9 6.5 Avg. Working Capital per sqm - New Stores (R$ ‘000) 2.3 2.4 Payback – Months 22.5 25.3 Avg . ROIC (post tax ) 43% 37 % Stores Opened in 2015 Location Street Shopping Malls New Opened Stores 2 6 Avg. EBITDA per sqm - New Stores (R $ ‘000) 6.4 5.0 Avg. CAPEX per sqm - New Stores (R $ ‘000) 6.8 5.5 Avg. Working Capital per sqm - New Stores (R$ ‘000) 2.5 2.6 Payback – Months 17.8 19.4 Avg . ROIC (post tax ) 55% 49% Normalized ROIC (adjusted to reflect current WK structure) 60% 54% Source: Company. Notes: 1. Considering a store maturation in 3 years. 2. Considering a 12% occupancy cost for shopping mall stores and 8% for street stores. 3. EBITDA margin considering a 8 % occupancy cost for shopping mall stores and 4% for street stores. - 15% New Store Returns
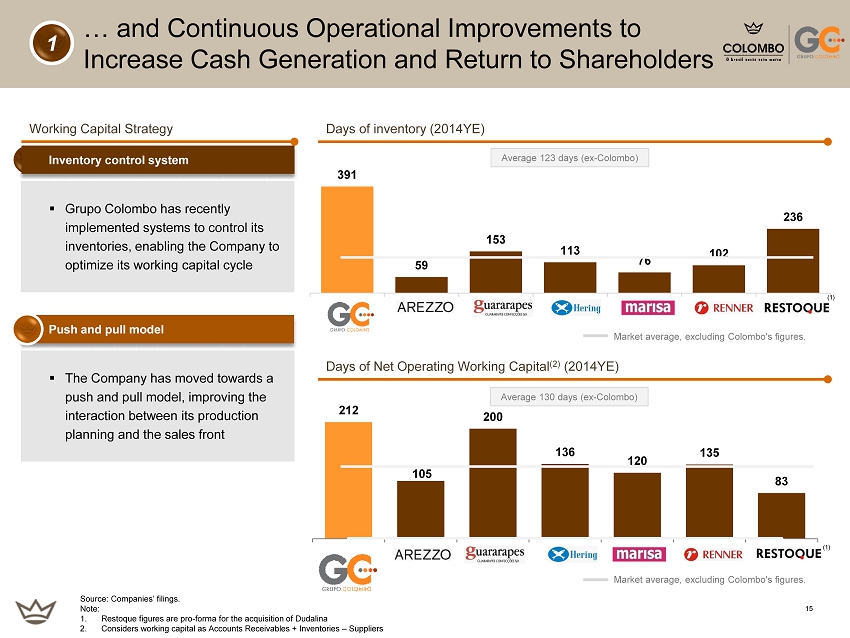
168,84,0 218,109,0 108,54,0 230,230,230 127,127,127 255,151,47 255,194,13 3 78,66,49 15 391 59 153 113 76 102 236 0 100 200 300 400 500 1 2 3 4 5 6 7 212 105 200 136 120 135 83 0% 0 50 100 150 200 250 1 2 3 4 5 6 7 … and Continuous Operational Improvements to Increase Cash Generation and Return to Shareholders Days of inventory (2014YE) Days of Net Operating Working Capital (2) (2014YE) Working Capital Strategy (1) (1) Source: Companies’ filings. Note: 1. Restoque figures are pro - forma for the acquisition of Dudalina 2. Considers working capital as Accounts Receivables + Inventories – Suppliers 1 Push and pull model Market average, excluding Colombo's figures. Market average, excluding Colombo's figures. Average 123 days (ex - C olombo) Average 130 days (ex - C olombo) ▪ The Company has moved towards a push and pull model, improving the interaction between its production planning and the sales front ▪ Grupo Colombo has recently implemented systems to control its inventories, enabling the Company to optimize its working capital cycle Inventory control system
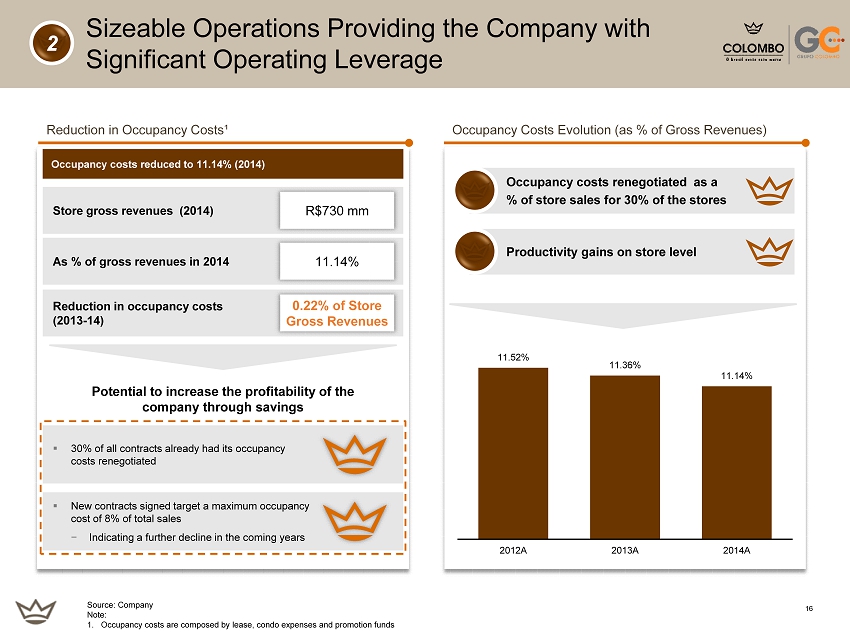
168,84,0 218,109,0 108,54,0 230,230,230 127,127,127 255,151,47 255,194,13 3 78,66,49 16 ▪ New contracts signed target a maximum occupancy cost of 8% of total sales − Indicating a further decline in the coming years ▪ 30% of all contracts already had its occupancy costs renegotiated Sizeable Operations Providing the Company with Significant Operating Leverage Occupancy costs reduced to 11.14% (2014) Reduction in Occupancy Costs¹ Occupancy Costs Evolution (as % of Gross Revenues) Store gross revenues (2014) A s % of gross revenues in 2014 Reduction in occupancy costs (2013 - 14) R$730 mm 11.14% 0.22% of Store Gross Revenues 2 Source: Company Note: 1. Occupancy costs are composed by lease, condo expenses and promotion funds Occupancy costs renegotiated as a % of store sales for 30% of the stores Productivity gains on store level Potential to increase the profitability of the company through savings 11.52% 11.36% 11.14% 2012A 2013A 2014A
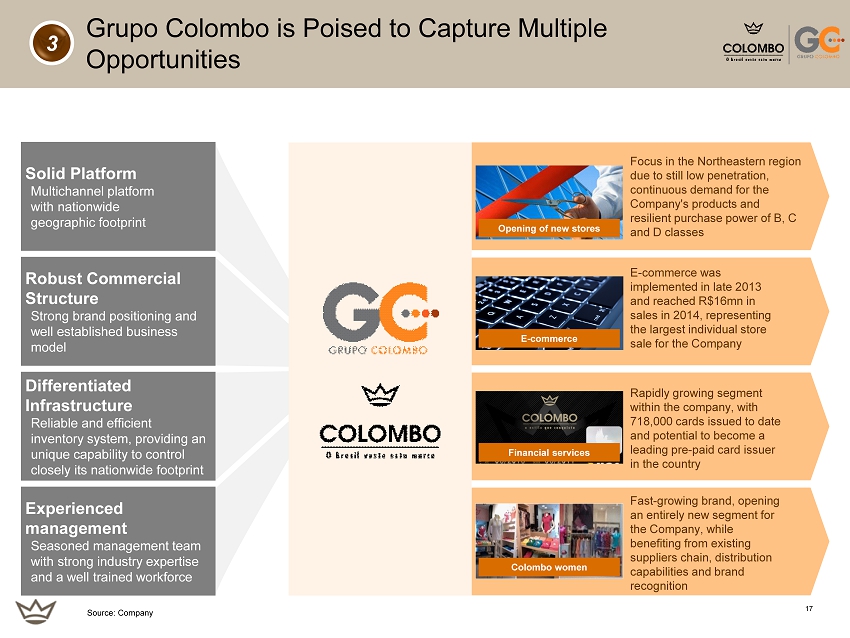
168,84,0 218,109,0 108,54,0 230,230,230 127,127,127 255,151,47 255,194,13 3 78,66,49 17 Solid Platform Multichannel platform with nationwide geographic footprint Robust Commercial Structure Strong brand positioning and well established business model Experienced management Seasoned management team with strong industry expertise and a well trained workforce Differentiated Infrastructure Reliable and efficient inventory system, providing an unique capability to control closely its nationwide footprint Focus in the Northeastern region due to still low penetration, continuous demand for the Company's products and resilient purchase power of B, C and D classes Opening of new stores Fast - growing brand, opening an entirely new segment for the Company, while benefiting from existing suppliers chain, distribution capabilities and brand recognition Colombo women Rapidly growing segment within the company, with 718,000 cards issued to date and potential to become a leading pre - paid card issuer in the country Financial services E - commerce was implemented in late 2013 and reached R$16mn in sales in 2014, representing the largest individual store sale for the Company E - commerce 3 Grupo Colombo is Poised to Capture Multiple Opportunities Source: Company
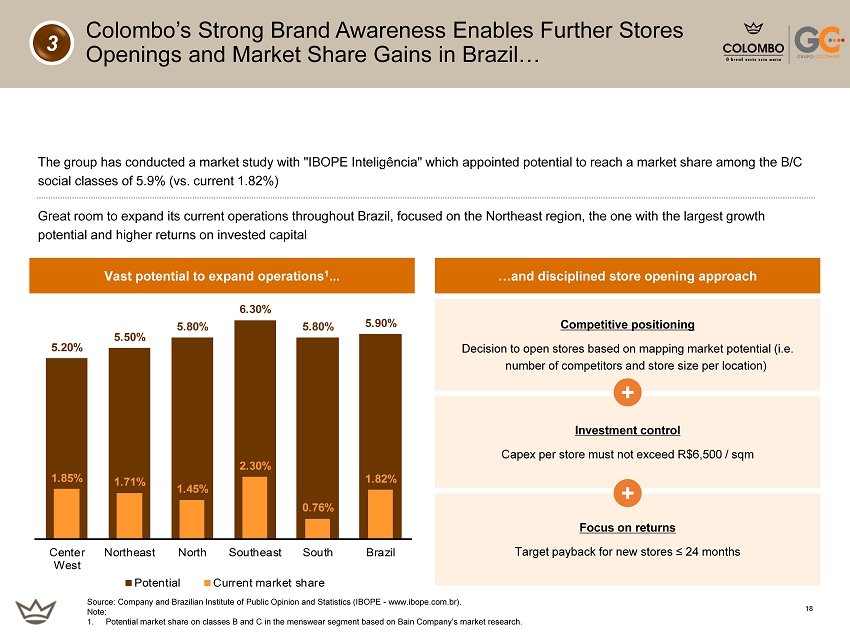
168,84,0 218,109,0 108,54,0 230,230,230 127,127,127 255,151,47 255,194,13 3 78,66,49 18 The group has conducted a market study with "IBOPE Inteligência " which appointed potential to reach a market share among the B/C social classes of 5.9% (vs. current 1.82%) Great room to expand its current operations throughout Brazil, focused on the Northeast region, the one with the largest grow th potential and higher returns on invested capital 3 Colombo’s Strong Brand Awareness Enables Further Stores Openings and Market Share Gains in Brazil… Source: Company and Brazilian Institute of Public Opinion and Statistics (IBOPE - www.ibope.com.br). Note: 1. Potential market share on classes B and C in the menswear segment based on Bain Company’s market research. 5.20% 5.50% 5.80% 6.30% 5.80% 5.90% 1.85% 1.71% 1.45% 2.30% 0.76% 1.82% Center West Northeast North Southeast South Brazil Potential Current market share Vast potential to expand operations 1 ... …and disciplined store opening approach Competitive positioning Decision to open stores based on mapping market potential ( i.e. number of competitors and store size per location) Investment control Capex per store must not exceed R$6,500 / sqm Focus on returns Target payback for new stores ≤ 24 months + +
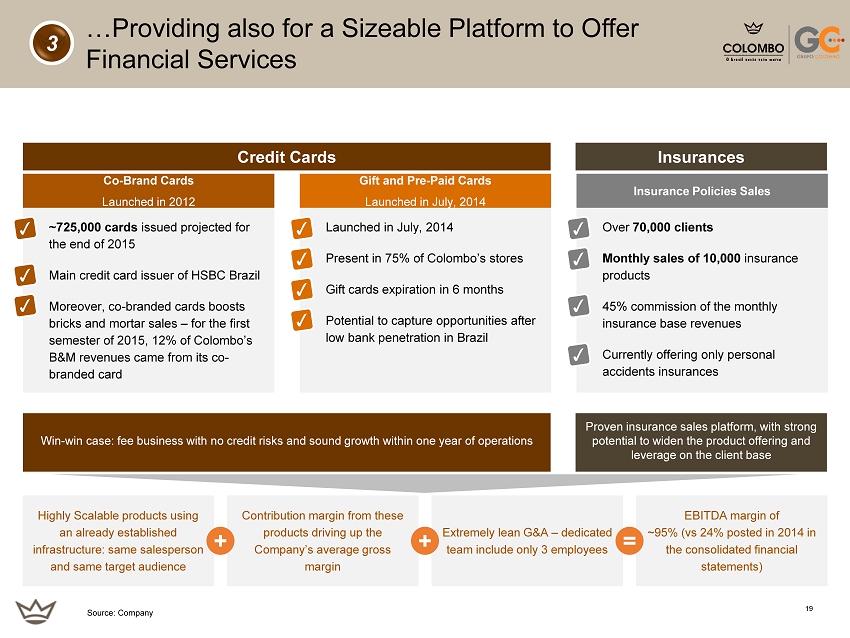
168,84,0 218,109,0 108,54,0 230,230,230 127,127,127 255,151,47 255,194,13 3 78,66,49 19 Credit Cards Insurances 3 …Providing also for a Sizeable Platform to Offer Financial Services Source: Company Insurance Policies Sales Over 70,000 clients Monthly sales of 10,000 insurance products 45% commission of the monthly insurance base revenues Currently offering only personal accidents insurances Launched in July, 2014 Present in 75% of Colombo’s stores Gift cards expiration in 6 months Potential to capture opportunities after low bank penetration in Brazil Gift and Pre - Paid Cards Launched in July, 2014 ~725,000 cards issued projected for the end of 2015 Main credit card issuer of HSBC Brazil Moreover, co - branded cards boosts bricks and mortar sales – for the first semester of 2015, 12% of Colombo’s B&M revenues came from its co - branded card Co - Brand Cards Launched in 2012 Highly Scalable products using an already established infrastructure: same salesperson and same target audience Contribution margin from these products driving up the Company’s average gross margin Extremely lean G&A – dedicated team include only 3 employees EBITDA margin of ~95% (vs 24% posted in 2014 in the consolidated financial statements) + + = Win - win case: fee business with no credit risks and sound growth within one year of operations Proven insurance sales platform, with strong potential to widen the product offering and leverage on the client base
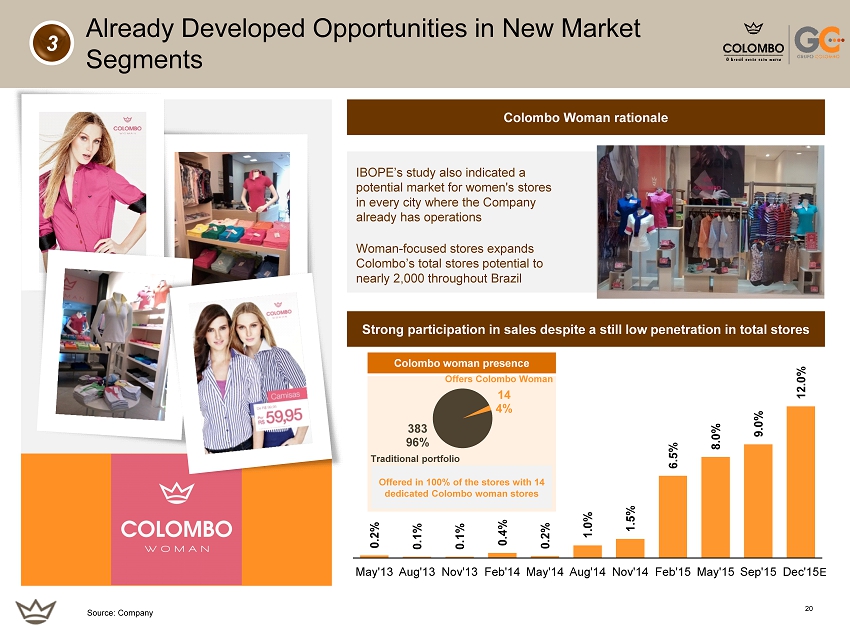
168,84,0 218,109,0 108,54,0 230,230,230 127,127,127 255,151,47 255,194,13 3 78,66,49 20 0.2% 0.1% 0.1% 0.4% 0.2% 1.0% 1.5% 6.5% 8.0% 9.0% 12.0% May'13 Aug'13 Nov'13 Feb'14 May'14 Aug'14 Nov'14 Feb'15 May'15 Sep'15 Dec'15 3 Already Developed Opportunities in New Market Segments Source: Company Strong participation in sales despite a still low penetration in total stores Colombo Woman rationale IBOPE’s study also indicated a potential market for women's stores in every city where the Company already has operations Woman - focused stores expands Colombo’s total stores potential to nearly 2,000 throughout Brazil Colombo woman presence Offered in 100% of the stores with 14 dedicated Colombo woman stores Traditional portfolio Offers Colombo Woman 14 4% 383 96% E
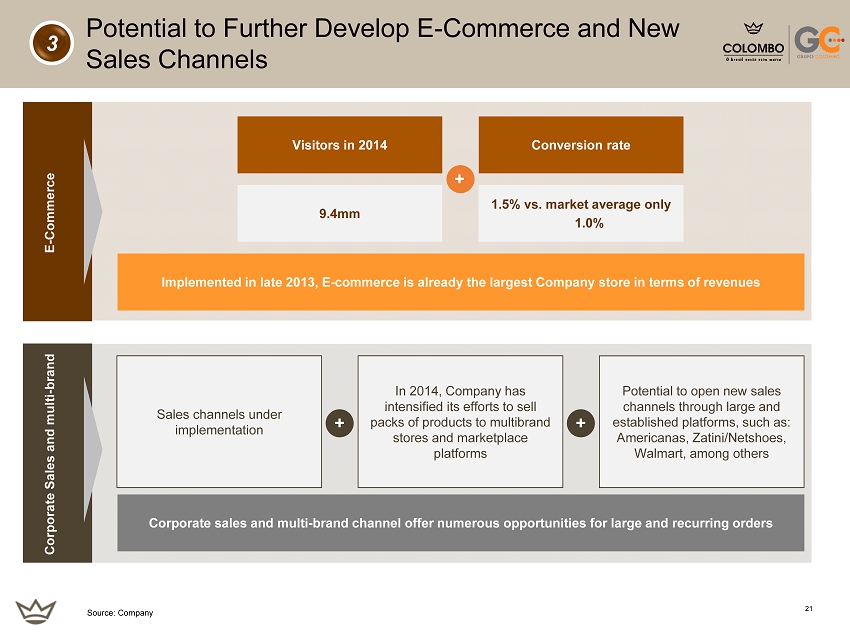
168,84,0 218,109,0 108,54,0 230,230,230 127,127,127 255,151,47 255,194,13 3 78,66,49 21 3 Potential to Further Develop E - Commerce and New Sales Channels Source: Company E - Commerce Corporate Sales and multi - brand 9 .4mm Visitors in 2014 + 1.5% vs. market average only 1.0% Conversion rate Implemented in late 2013, E - commerce is already the largest Company store in terms of revenues Sales channels under implementation In 2014, Company has intensified its efforts to sell packs of products to multibrand stores and marketplace platforms Potential to open new sales channels through large and established platforms, such as: Americanas , Zatini / Netshoes , Walmart, among others + Corporate sales and multi - brand channel offer numerous opportunities for large and recurring orders +
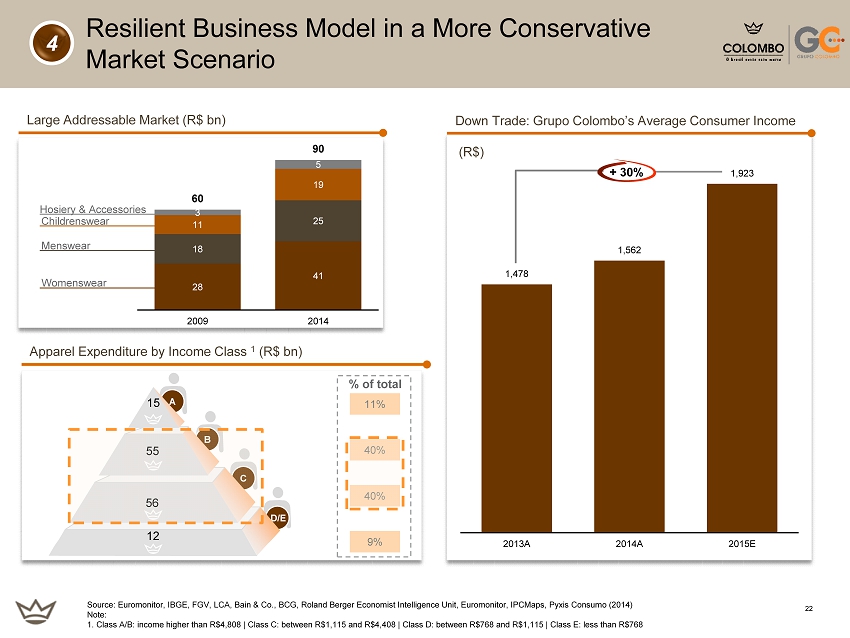
168,84,0 218,109,0 108,54,0 230,230,230 127,127,127 255,151,47 255,194,13 3 78,66,49 22 Womenswear Menswear Childrenswear Hosiery & Accessories 28 41 18 25 11 19 3 5 60 90 2009 2014 Large Addressable Market (R$ bn ) Resilient Business Model in a More Conservative Market Scenario Source: Euromonitor , IBGE, FGV, LCA, Bain & Co., BCG, Roland Berger Economist Intelligence Unit, Euromonitor , IPCMaps , Pyxis Consumo (2014) Note: 1. Class A/B: income higher than R$4,808 | Class C: between R$1,115 and R$4,408 | Class D: between R$768 and R$1,115 | Class E: less than R$768 4 11% 40% 40% 9% % of total D/E C B A 12 56 15 55 Apparel Expenditure by Income Class 1 (R$ bn ) Down Trade: Grupo Colombo’s Average Consumer Income (R$) 1,478 1,562 1,923 2013A 2014A 2015E + 30%

168,84,0 218,109,0 108,54,0 230,230,230 127,127,127 255,151,47 255,194,13 3 78,66,49 SECTION 4 Financial Highlights
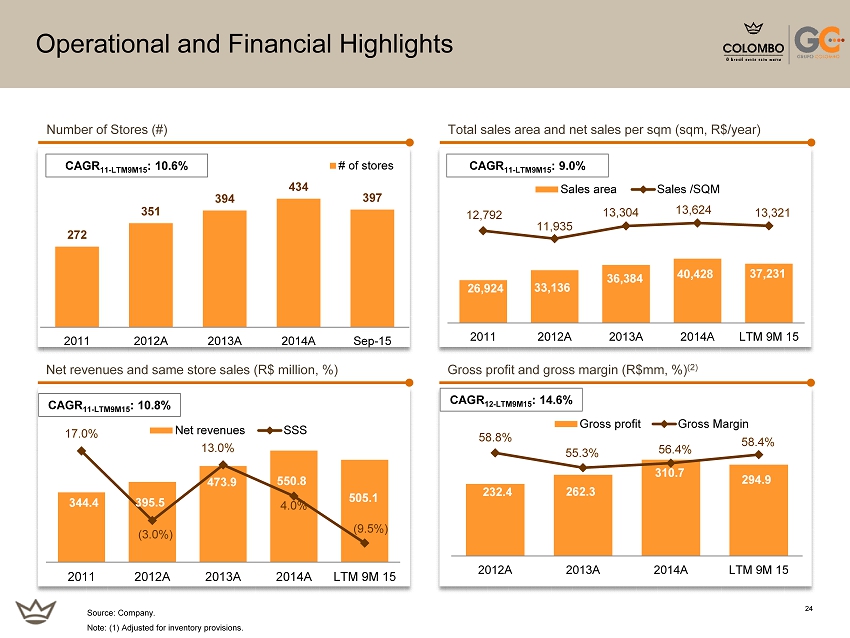
168,84,0 218,109,0 108,54,0 230,230,230 127,127,127 255,151,47 255,194,13 3 78,66,49 24 272 351 394 434 397 2011 2012A 2013A 2014A Sep-15 # of stores Operational and Financial Highlights Total sales area and net sales per sqm ( sqm , R$/year) Number of Stores (#) Gross profit and gross margin ( R$mm , %) (2) Net revenues and same store sales (R$ million, %) Source: Company. Note: (1) Adjusted for inventory provisions. CAGR 11 - LTM9M15 : 9.0% CAGR 11 - LTM9M15 : 10.6% CAGR 11 - LTM9M15 : 10.8% CAGR 12 - LTM9M15 : 14.6% 26,924 33,136 36,384 40,428 37,231 12,792 11,935 13,304 13,624 13,321 2011 2012A 2013A 2014A LTM 9M 15 Sales area Sales /SQM 344.4 395.5 473.9 550.8 505.1 17.0% (3.0%) 13.0% 4.0% (9.5%) 2011 2012A 2013A 2014A LTM 9M 15 Net revenues SSS 232.4 262.3 310.7 294.9 58.8% 55.3% 56.4% 58.4% 2012A 2013A 2014A LTM 9M 15 Gross profit Gross Margin
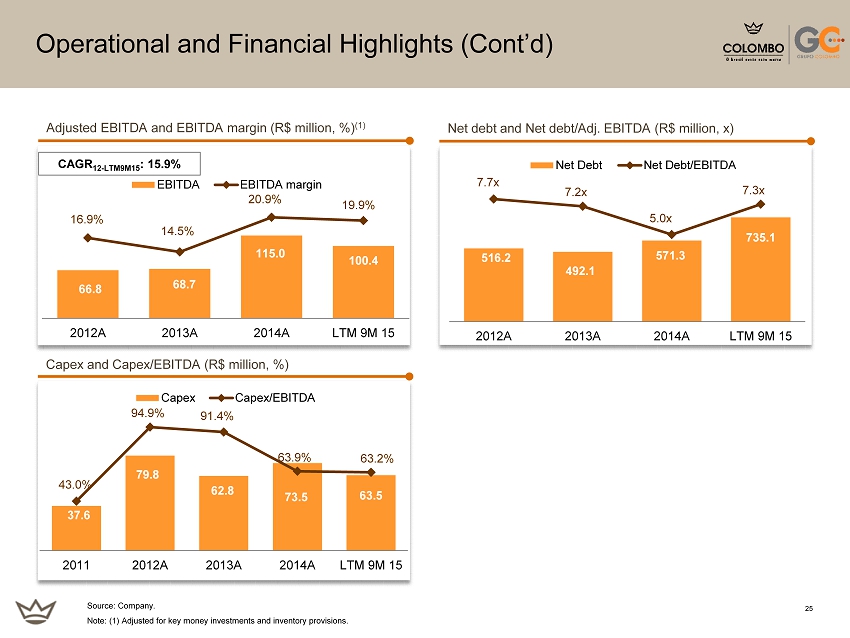
168,84,0 218,109,0 108,54,0 230,230,230 127,127,127 255,151,47 255,194,13 3 78,66,49 25 Operational and Financial Highlights (Cont’d) Adjusted EBITDA and EBITDA margin (R$ million, %) (1) Net debt and Net debt/Adj. EBITDA (R$ million, x) Capex and Capex/EBITDA (R$ million, %) CAGR 12 - LTM9M15 : 15.9% 37.6 79.8 62.8 73.5 63.5 43.0% 94.9% 91.4% 63.9% 63.2% 2011 2012A 2013A 2014A LTM 9M 15 Capex Capex/EBITDA 66.8 68.7 115.0 100.4 16.9% 14.5% 20.9% 19.9% 2012A 2013A 2014A LTM 9M 15 EBITDA EBITDA margin 516.2 492.1 571.3 735.1 7.7x 7.2x 5.0x 7.3x 2012A 2013A 2014A LTM 9M 15 Net Debt Net Debt/EBITDA Source: Company. Note: (1) Adjusted for key money investments and inventory provisions.
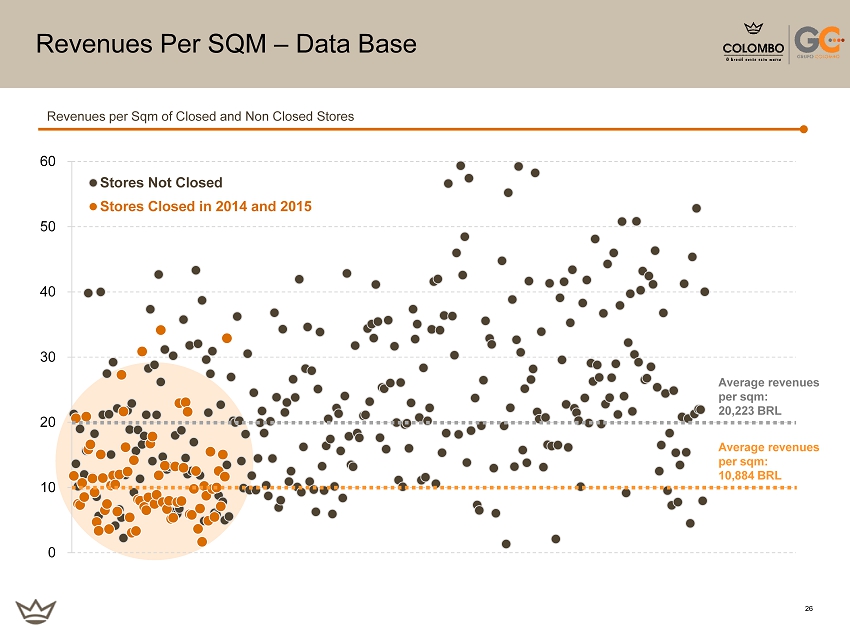
168,84,0 218,109,0 108,54,0 230,230,230 127,127,127 255,151,47 255,194,13 3 78,66,49 26 Revenues Per SQM – Data Base 0 10 20 30 40 50 60 Stores Not Closed Stores Closed in 2014 and 2015 Revenues per Sqm of Closed and Non Closed Stores Average revenues per sqm: 20,223 BRL Average revenues per sqm: 10,884 BRL