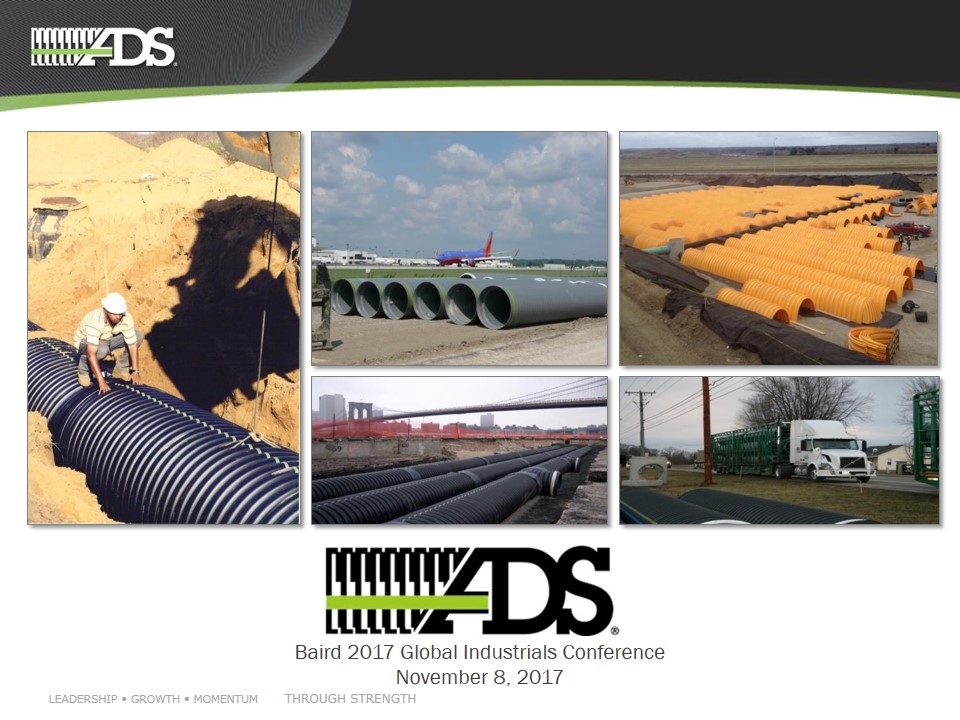
Baird 2017 Global Industrials Conference November 8, 2017
Safe Harbor and Non-GAAP Financial Metrics Certain statements in this presentation may be deemed to be forward-looking statements within the meaning of Section 27A of the Securities Act of 1933, as amended, and Section 21E of the Securities Exchange Act of 1934, as amended. These statements are not historical facts but rather are based on the Company’s current expectations, estimates and projections regarding the Company’s business, operations and other factors relating thereto. Words such as “may,” “will,” “could,” “would,” “should,” “anticipate,” “predict,” “potential,” “continue,” “expects,” “intends,” “plans,” “projects,” “believes,” “estimates,” “confident” and similar expressions are used to identify these forward-looking statements. Factors that could cause actual results to differ from those reflected in forward-looking statements relating to our operations and business include: fluctuations in the price and availability of resins and other raw materials and our ability to pass any increased costs of raw materials on to our customers in a timely manner; volatility in general business and economic conditions in the markets in which we operate, including, without limitation, factors relating to availability of credit, interest rates, fluctuations in capital and business and consumer confidence; cyclicality and seasonality of the non-residential and residential construction markets and infrastructure spending; the risks of increasing competition in our existing and future markets, including competition from both manufacturers of high performance thermoplastic corrugated pipe and manufacturers of products using alternative materials; our ability to continue to convert current demand for concrete, steel and PVC pipe products into demand for our high performance thermoplastic corrugated pipe and Allied Products; the effect of weather or seasonality; the loss of any of our significant customers; the risks of doing business internationally; the risks of conducting a portion of our operations through joint ventures; our ability to expand into new geographic or product markets; our ability to achieve the acquisition component of our growth strategy; the risk associated with manufacturing processes; our ability to manage our assets; the risks associated with our product warranties; our ability to manage our supply purchasing and customer credit policies; the risks associated with our self-insured programs; our ability to control labor costs and to attract, train and retain highly-qualified employees and key personnel; our ability to protect our intellectual property rights; changes in laws and regulations, including environmental laws and regulations; our ability to project product mix; the risks associated with our current levels of indebtedness; our ability to meet future capital requirements and fund our liquidity needs; a conclusion that the Company’s disclosure controls and procedures (as defined in Rules 13a-15(e) and 15d-15(e) of the Exchange Act) were ineffective; the review of potential weaknesses or deficiencies in the Company’s disclosure controls and procedures, and discovering further weaknesses of which we are not currently aware or which have not been detected; additional uncertainties related to accounting issues generally and other risks and uncertainties described in the Company’s filings with the Securities and Exchange Commission. New risks and uncertainties emerge from time to time and it is not possible for the Company to predict all risks and uncertainties that could have an impact on the forward-looking statements contained in this press release. In light of the significant uncertainties inherent in the forward-looking information included herein, the inclusion of such information should not be regarded as a representation by the Company or any other person that the Company’s expectations, objectives or plans will be achieved in the timeframe anticipated or at all. Investors are cautioned not to place undue reliance on the Company’s forward-looking statements and the Company undertakes no obligation to publicly update or revise any forward-looking statements, whether as a result of new information, future events or otherwise, except as required by law. This presentation includes certain non-GAAP financial measures to describe the Company’s performance. The reconciliation of those measures to GAAP measures are provided within the appendix of the presentation. Those disclosures should not be viewed as a substitute for operating results determined in accordance with GAAP, nor are they necessarily comparable to non-GAAP performance measures that may be presented by other companies.
Agenda ADS at a Glance Track Record of Innovation and Growth Competitive Advantages Strategy and “SPP” Overview Appendix
ADS at a Glance
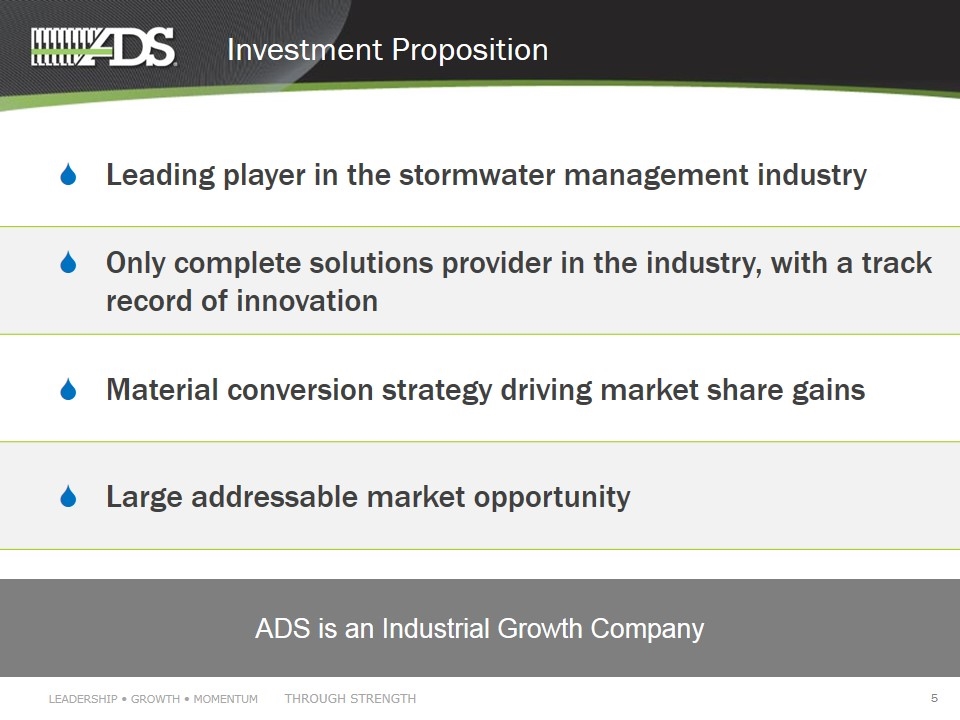
Investment Proposition ADS is an Industrial Growth Company Leading player in the stormwater management industry Only complete solutions provider in the industry, with a track record of innovation Material conversion strategy driving market share gains Large addressable market opportunity
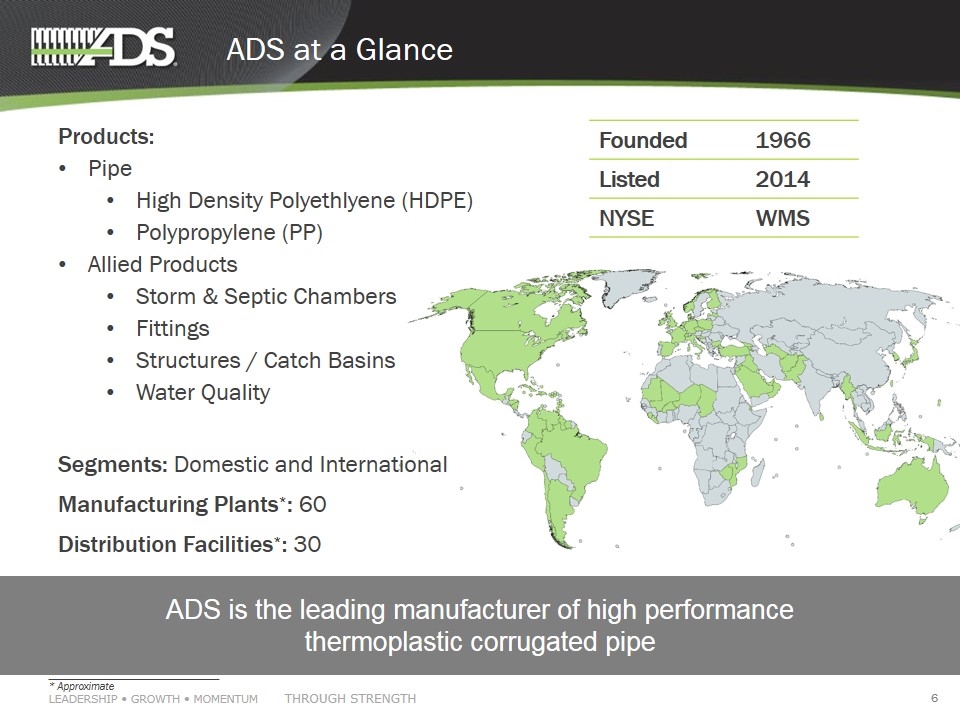
ADS at a Glance Founded 1966 Listed 2014 NYSE WMS Products: Pipe High Density Polyethlyene (HDPE) Polypropylene (PP) Allied Products Storm & Septic Chambers Fittings Structures / Catch Basins Water Quality Segments: Domestic and International Manufacturing Plants*: 60 Distribution Facilities*: 30 ADS is the leading manufacturer of high performance thermoplastic corrugated pipe ________________________________ * Approximate
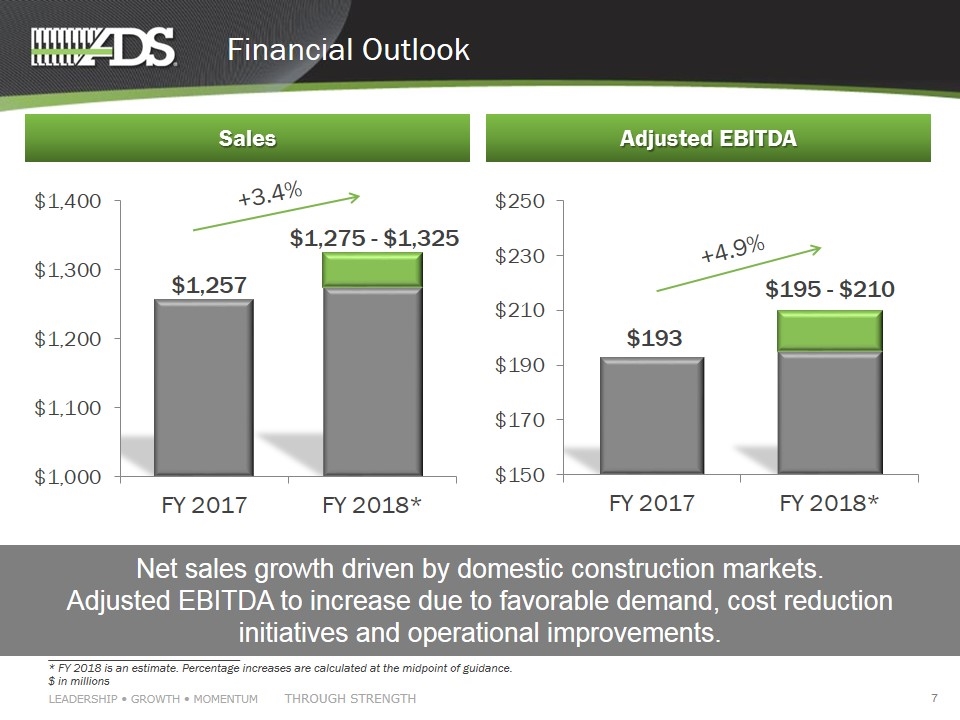
Financial Outlook Net sales growth driven by domestic construction markets. Adjusted EBITDA to increase due to favorable demand, cost reduction initiatives and operational improvements. +3.4% +4.9% ________________________________ * FY 2018 is an estimate. Percentage increases are calculated at the midpoint of guidance. $ in millions Sales Adjusted EBITDA
Track Record of Innovation and Growth

Corrugated HDPE pipe proved far superior to materials used at the time A Strong History … Introduced in 1966 Agriculture market converted by late 1970s N-12 HDPE pipe introduced in 1980s
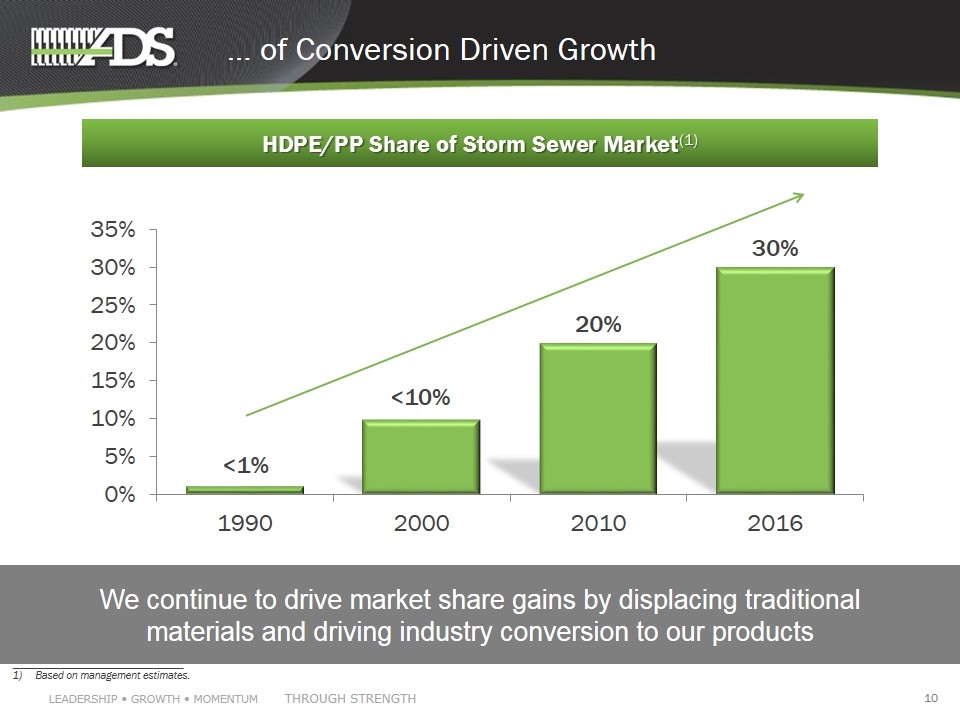
… of Conversion Driven Growth HDPE/PP Share of Storm Sewer Market(1) <1% <10% ________________________________ 1) Based on management estimates. We continue to drive market share gains by displacing traditional materials and driving industry conversion to our products
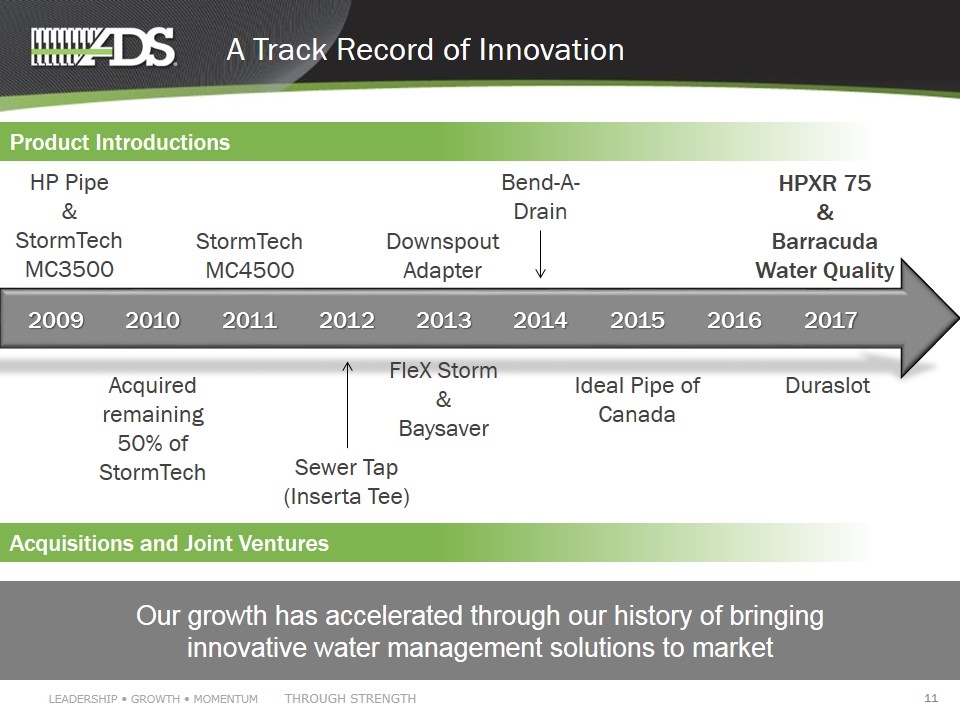
A Track Record of Innovation Our growth has accelerated through our history of bringing innovative water management solutions to market 2009 2010 2011 2012 2013 2014 2015 2016 2017 Downspout Adapter Bend-A-Drain StormTech MC4500 HP Pipe & StormTech MC3500 HPXR 75 & Barracuda Water Quality Acquired remaining 50% of StormTech Sewer Tap (Inserta Tee) FleX Storm & Baysaver Ideal Pipe of Canada Product Introductions Acquisitions and Joint Ventures Duraslot
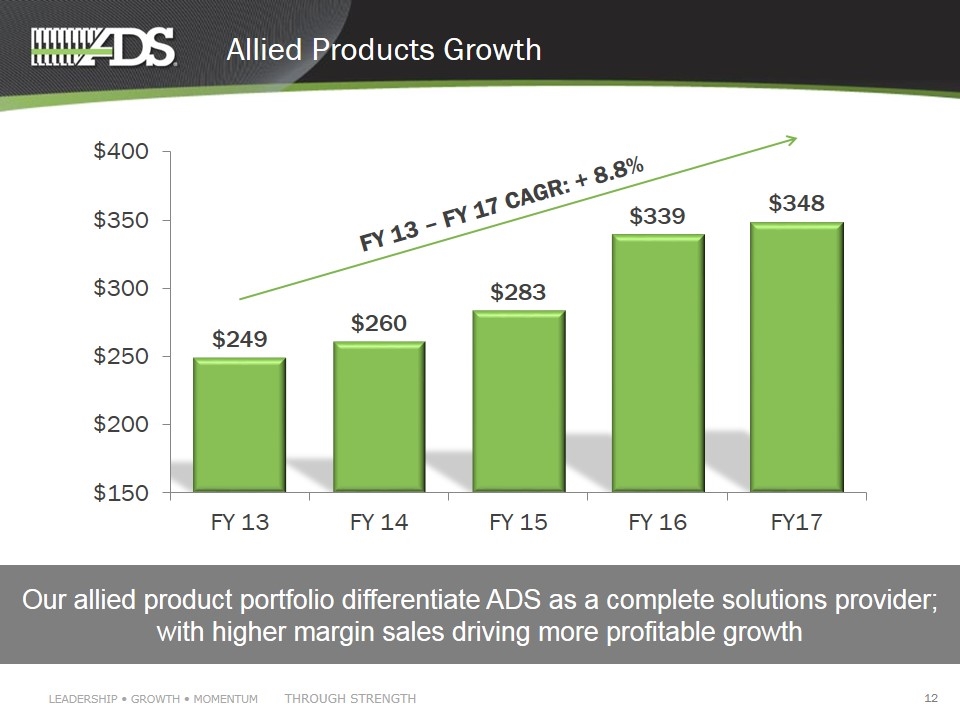
Allied Products Growth Our allied product portfolio differentiate ADS as a complete solutions provider; with higher margin sales driving more profitable growth FY 13 – FY 17 CAGR: + 8.8%
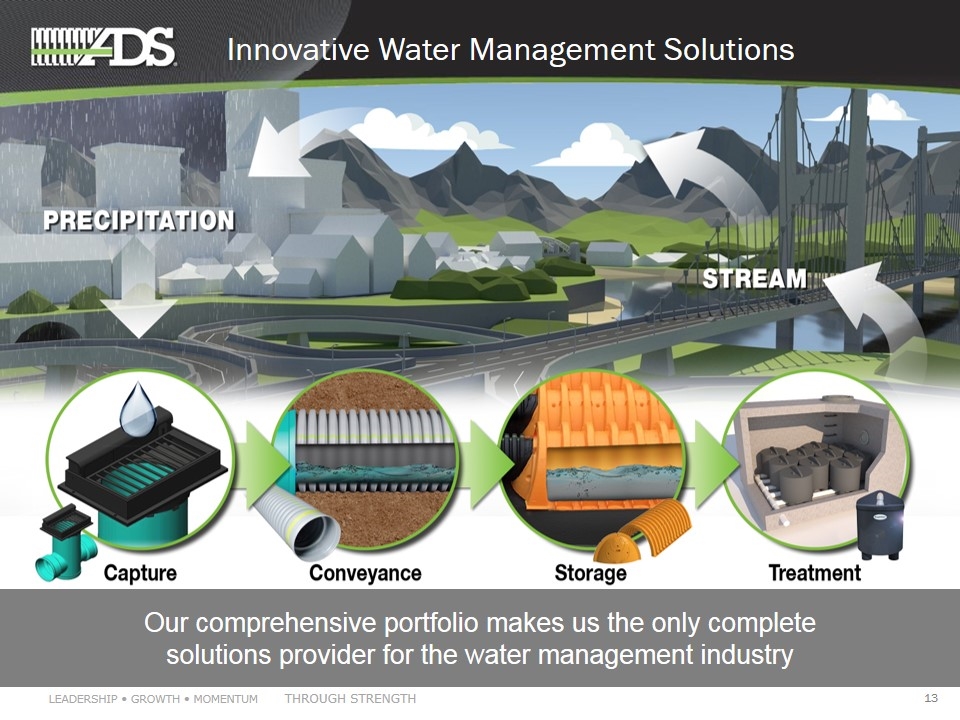
Our comprehensive portfolio makes us the only complete solutions provider for the water management industry Innovative Water Management Solutions

Our Competitive Advantages
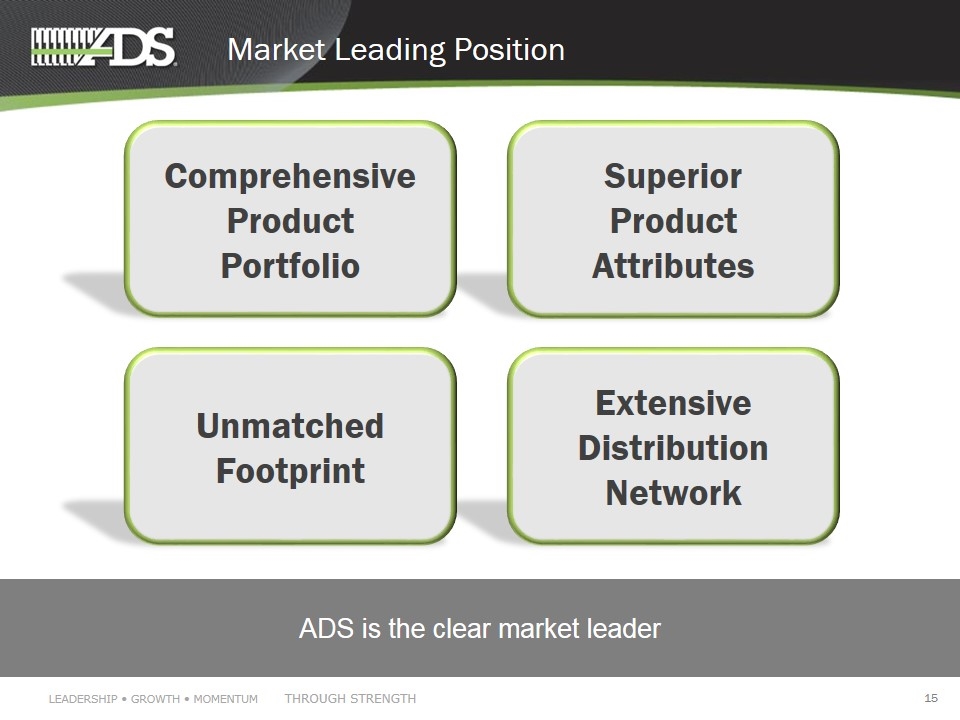
Market Leading Position Superior Product Attributes Extensive Distribution Network ADS is the clear market leader Comprehensive Product Portfolio Unmatched Footprint
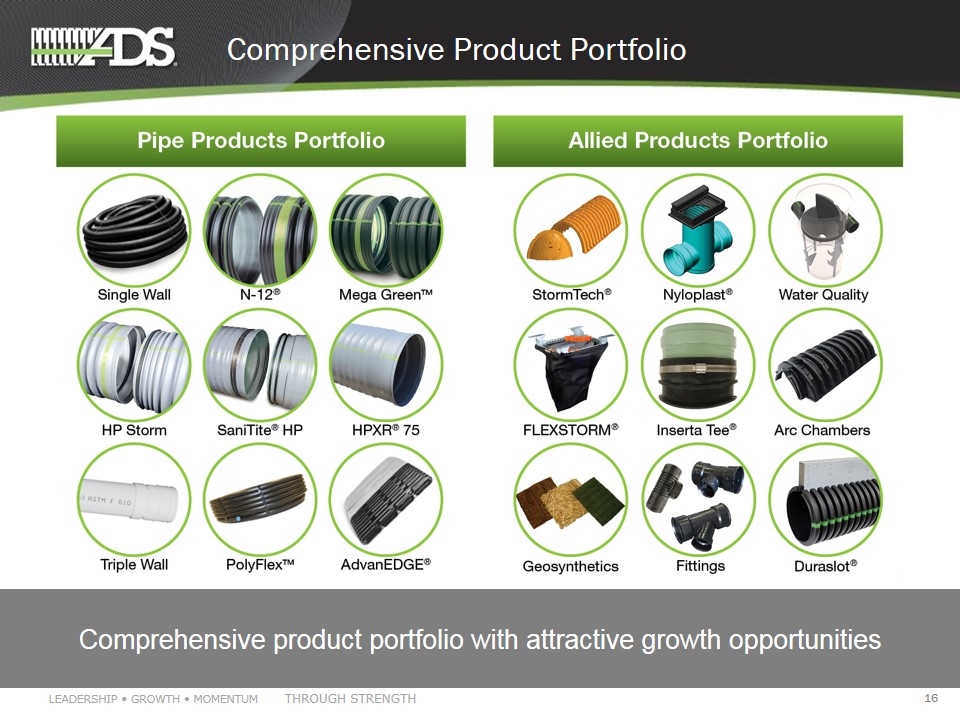
Comprehensive Product Portfolio Comprehensive product portfolio with attractive growth opportunities
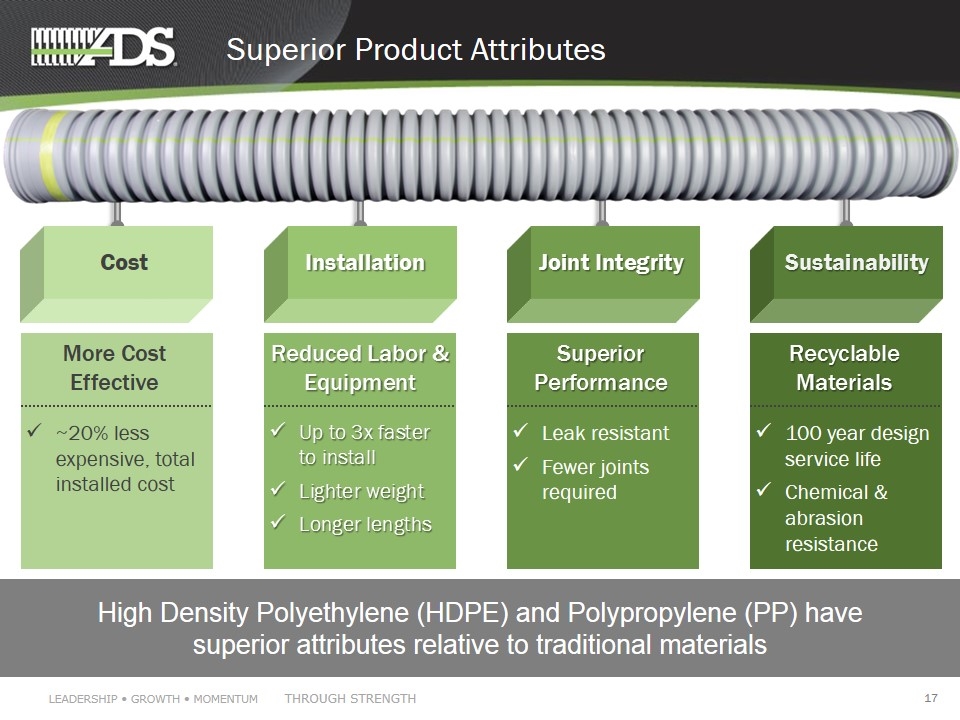
Superior Product Attributes High Density Polyethylene (HDPE) and Polypropylene (PP) have superior attributes relative to traditional materials Cost Installation Joint Integrity Sustainability More Cost Effective ~20% less expensive, total installed cost Reduced Labor & Equipment Up to 3x faster to install Lighter weight Longer lengths Superior Performance Leak resistant Fewer joints required Recyclable Materials 100 year design service life Chemical & abrasion resistance
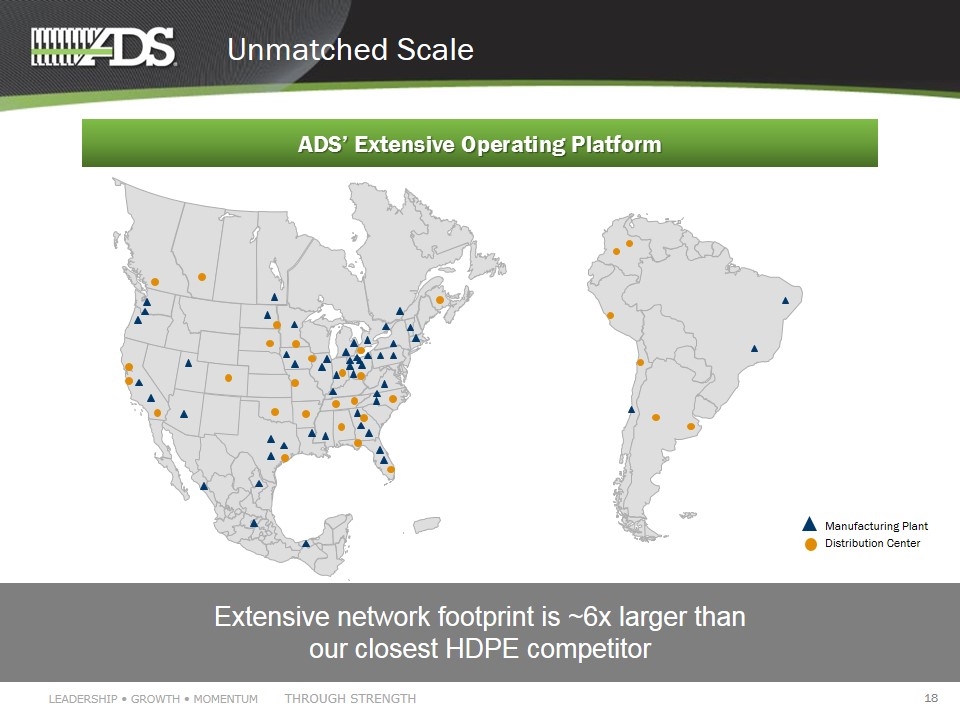
Unmatched Scale Extensive network footprint is ~6x larger than our closest HDPE competitor ADS’ Extensive Operating Platform Manufacturing Plant Distribution Center
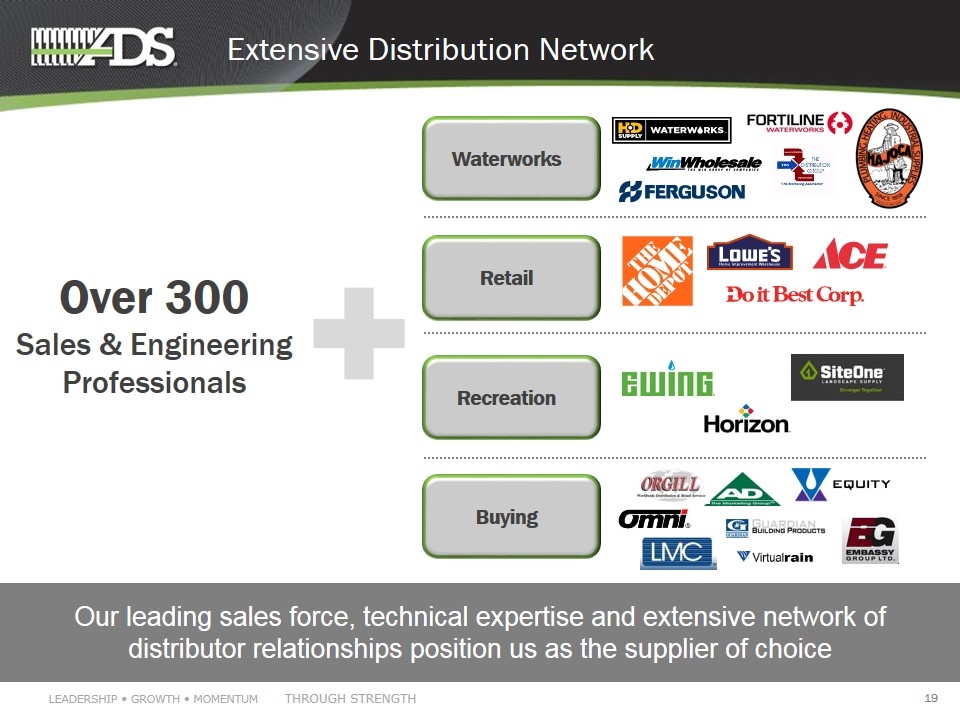
Extensive Distribution Network Our leading sales force, technical expertise and extensive network of distributor relationships position us as the supplier of choice Over 300 Sales & Engineering Professionals Waterworks Retail Recreation Buying
Our Strategy

Our Strategy Outpace domestic construction end market growth by 200+ basis points Operate more efficiently and drive margin expansion Generate strong earnings and cash flow Disciplined capital allocation plan
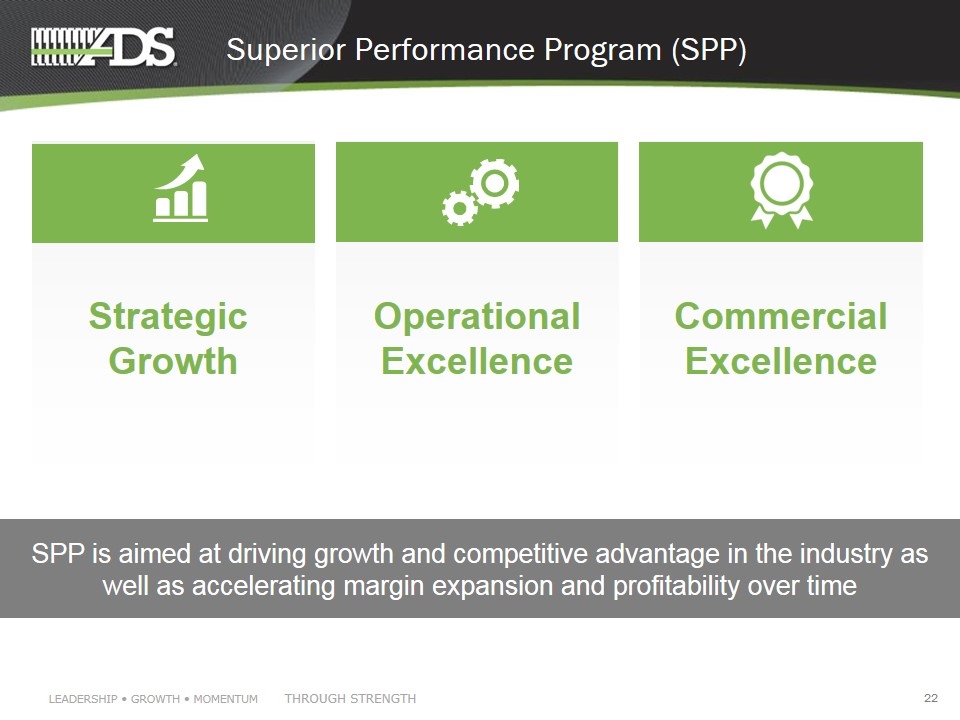
Operational Excellence Commercial Excellence Strategic Growth Superior Performance Program (SPP) SPP is aimed at driving growth and competitive advantage in the industry as well as accelerating margin expansion and profitability over time
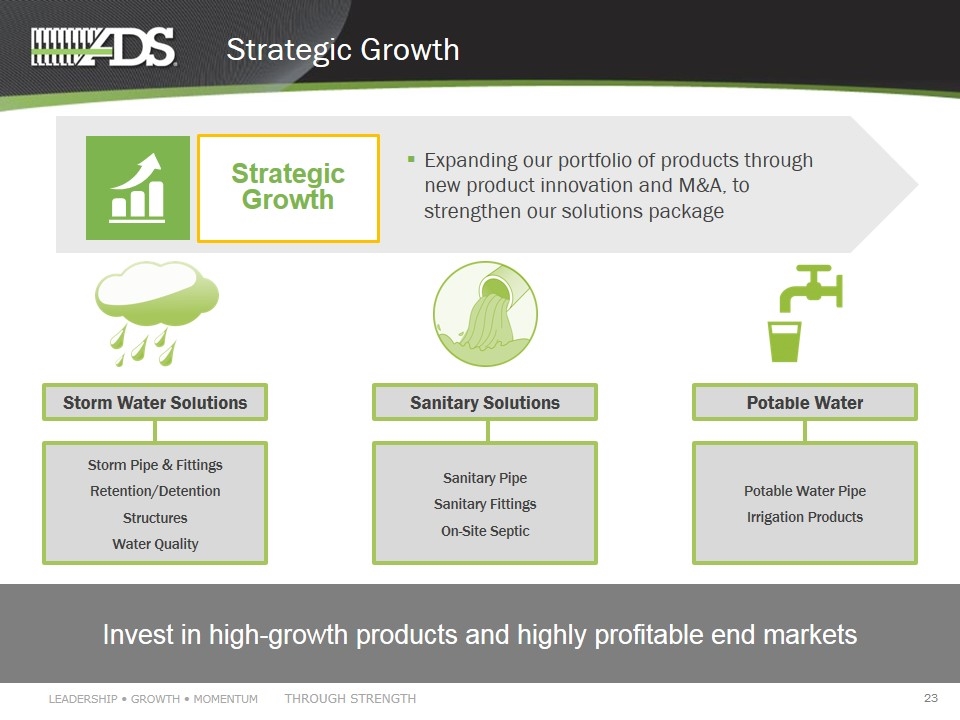
Strategic Growth Strategic Growth Expanding our portfolio of products through new product innovation and M&A, to strengthen our solutions package Invest in high-growth products and highly profitable end markets Storm Water Solutions Sanitary Solutions Potable Water Storm Pipe & Fittings Retention/Detention Structures Water Quality Sanitary Pipe Sanitary Fittings On-Site Septic Potable Water Pipe Irrigation Products
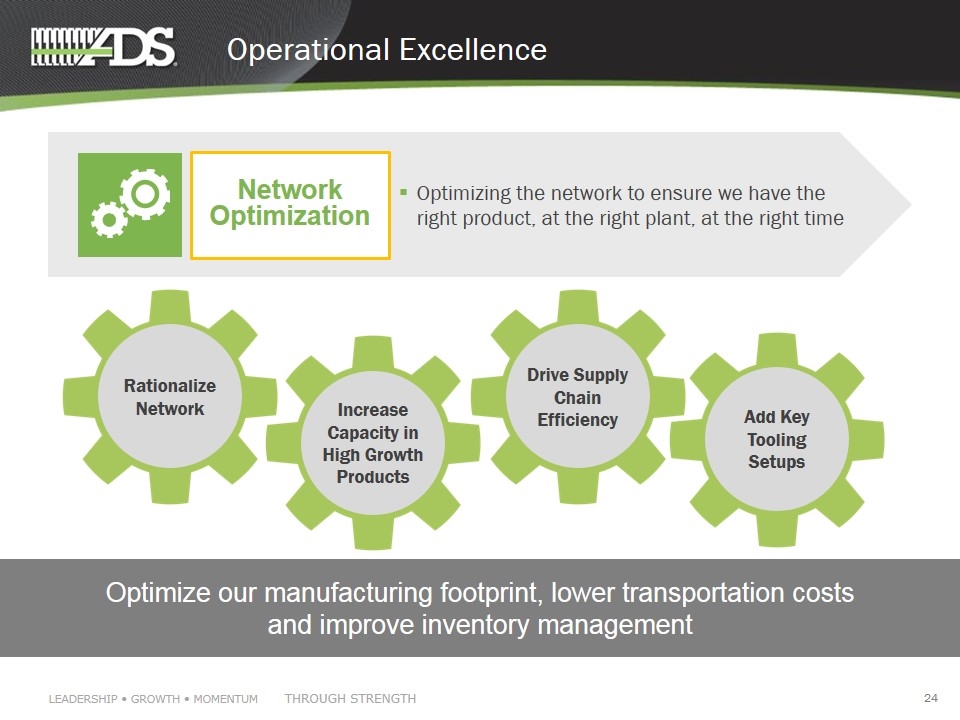
Operational Excellence Network Optimization Optimizing the network to ensure we have the right product, at the right plant, at the right time Drive Supply Chain Efficiency Add Key Tooling Setups Increase Capacity in High Growth Products Optimize our manufacturing footprint, lower transportation costs and improve inventory management Rationalize Network
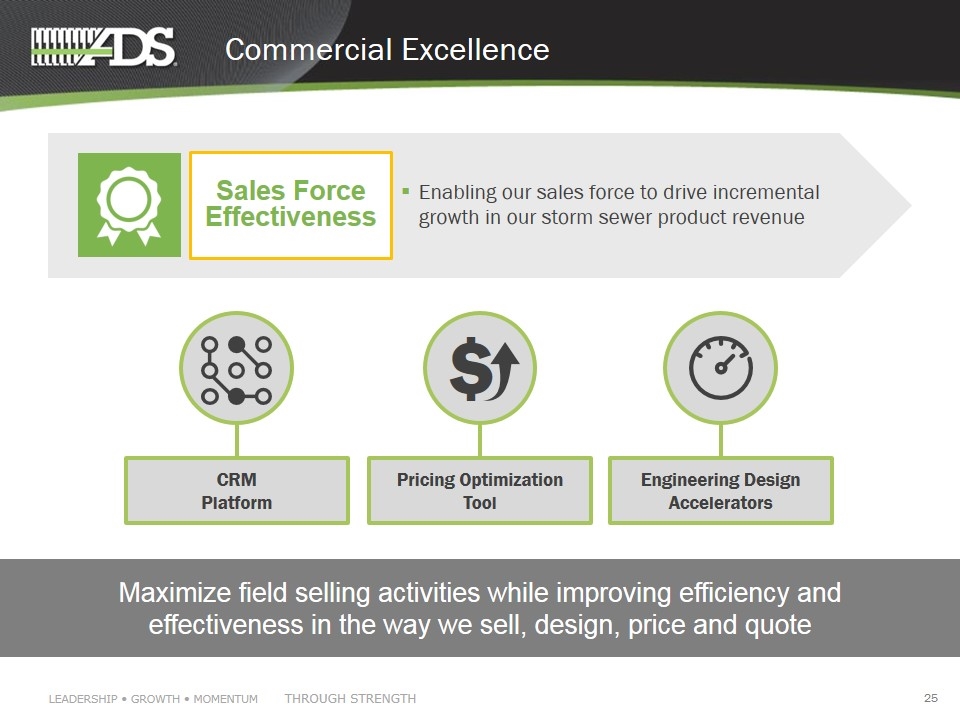
Commercial Excellence Sales Force Effectiveness Enabling our sales force to drive incremental growth in our storm sewer product revenue Maximize field selling activities while improving efficiency and effectiveness in the way we sell, design, price and quote Pricing Optimization Tool CRM Platform Engineering Design Accelerators $
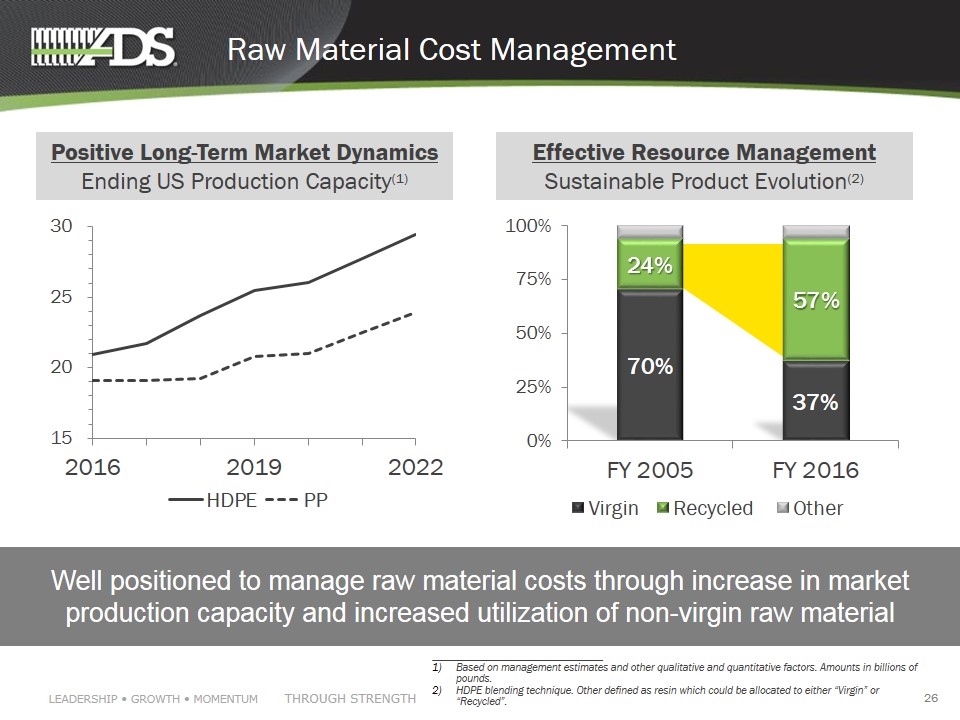
Raw Material Cost Management ________________________________ Based on management estimates and other qualitative and quantitative factors. Amounts in billions of pounds. HDPE blending technique. Other defined as resin which could be allocated to either “Virgin” or “Recycled”. Well positioned to manage raw material costs through increase in market production capacity and increased utilization of non-virgin raw material Positive Long-Term Market Dynamics Ending US Production Capacity(1) Effective Resource Management Sustainable Product Evolution(2)
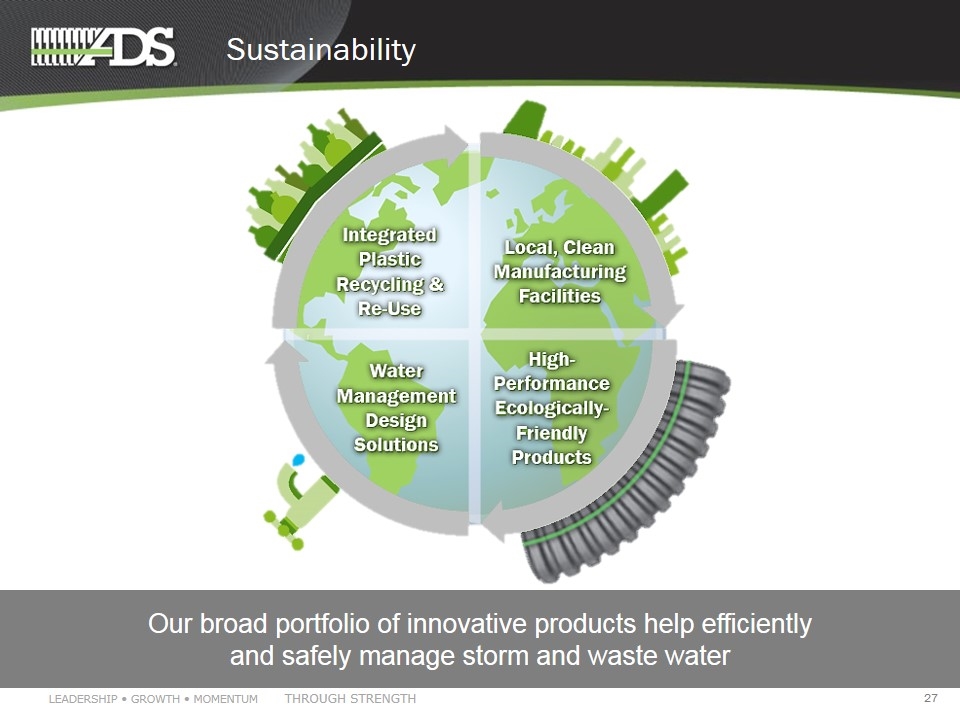
Sustainability Our broad portfolio of innovative products help efficiently and safely manage storm and waste water
ADS: An Industrial Growth Company Leading player in the stormwater management industry Only complete solutions provider in the industry, with a track record of innovation Material conversion strategy driving market share gains Large addressable market opportunity
Appendix

End Markets
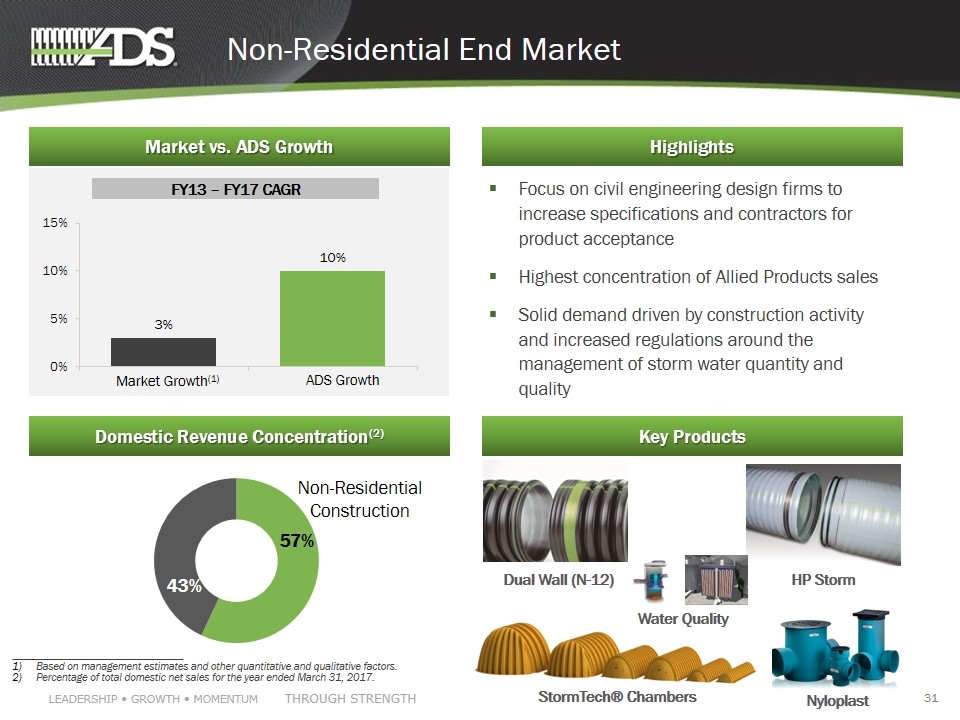
Non-Residential End Market Focus on civil engineering design firms to increase specifications and contractors for product acceptance Highest concentration of Allied Products sales Solid demand driven by construction activity and increased regulations around the management of storm water quantity and quality Market vs. ADS Growth Highlights Domestic Revenue Concentration(2) Market Growth(1) FY13 – FY17 CAGR ADS Growth Non-Residential Construction Key Products Dual Wall (N-12) HP Storm StormTech® Chambers Nyloplast ________________________________ Based on management estimates and other quantitative and qualitative factors. Percentage of total domestic net sales for the year ended March 31, 2017. Water Quality
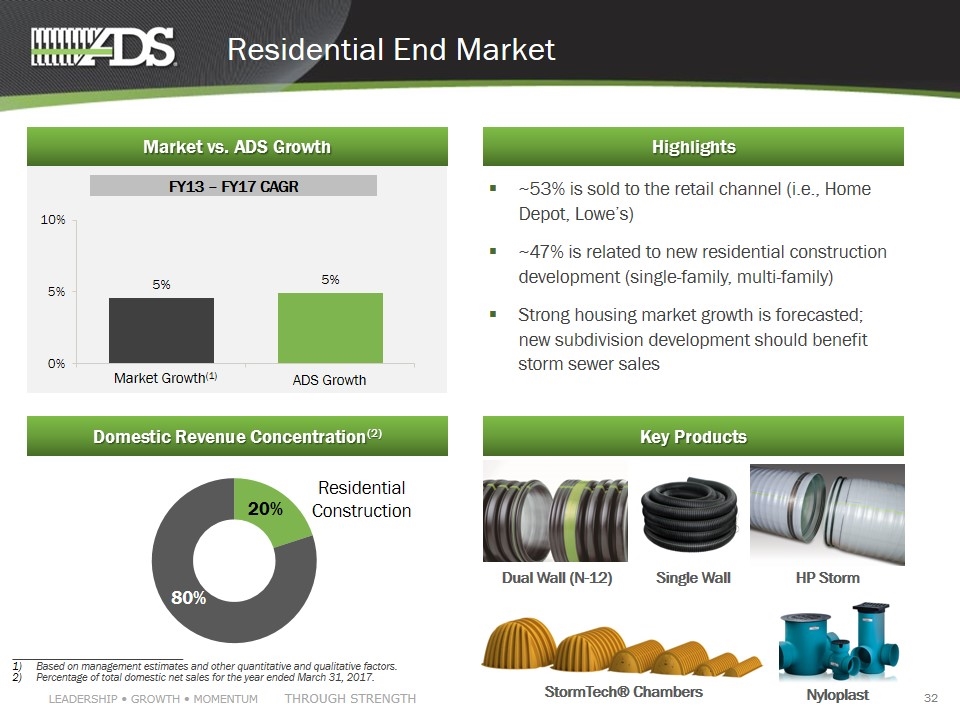
Market Growth(1) FY13 – FY17 CAGR Residential End Market ~53% is sold to the retail channel (i.e., Home Depot, Lowe’s) ~47% is related to new residential construction development (single-family, multi-family) Strong housing market growth is forecasted; new subdivision development should benefit storm sewer sales Market vs. ADS Growth Highlights Domestic Revenue Concentration(2) ADS Growth Residential Construction Key Products Dual Wall (N-12) HP Storm StormTech® Chambers Nyloplast ________________________________ Based on management estimates and other quantitative and qualitative factors. Percentage of total domestic net sales for the year ended March 31, 2017. Single Wall
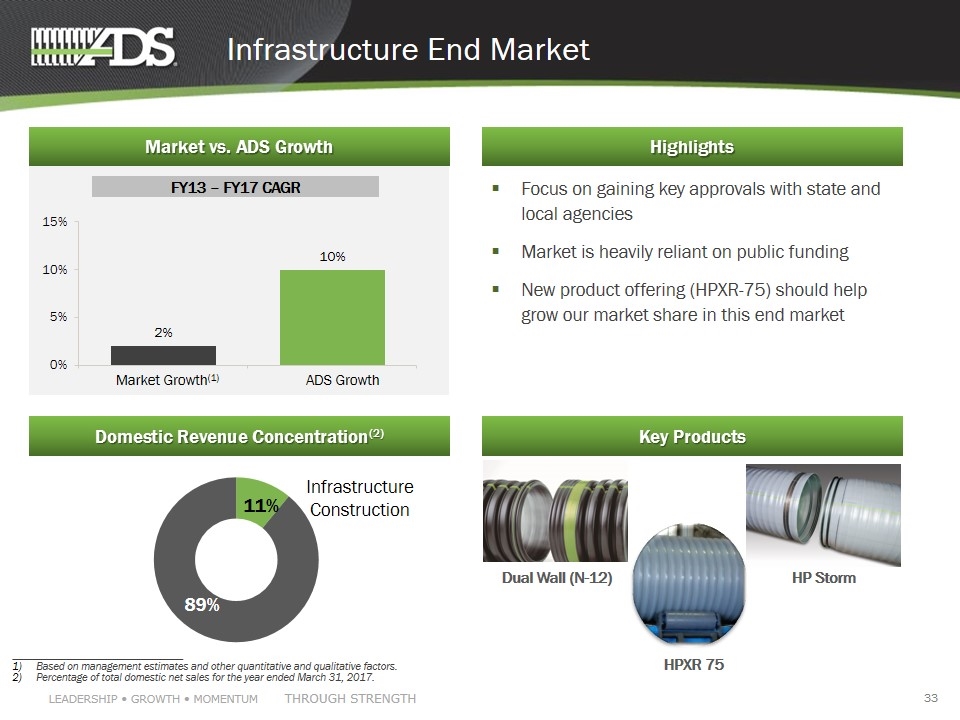
Market Growth(1) FY13 – FY17 CAGR Infrastructure End Market Focus on gaining key approvals with state and local agencies Market is heavily reliant on public funding New product offering (HPXR-75) should help grow our market share in this end market Market vs. ADS Growth Highlights Domestic Revenue Concentration(2) ADS Growth Infrastructure Construction Key Products Dual Wall (N-12) HP Storm ________________________________ Based on management estimates and other quantitative and qualitative factors. Percentage of total domestic net sales for the year ended March 31, 2017. HPXR 75

Market Growth(1) FY13 – FY17 CAGR Agriculture End Market Systematic drainage has been proven to increase crop yields Key economic drivers are farm income and crop prices; specifically corn and soybeans Sales are concentrated in the Midwest Market vs. ADS Growth Highlights Domestic Revenue Concentration(2) ADS Growth Agriculture Key Products ________________________________ Based on management estimates and other quantitative and qualitative factors. Percentage of total domestic net sales for the year ended March 31, 2017. Single Wall

Financials
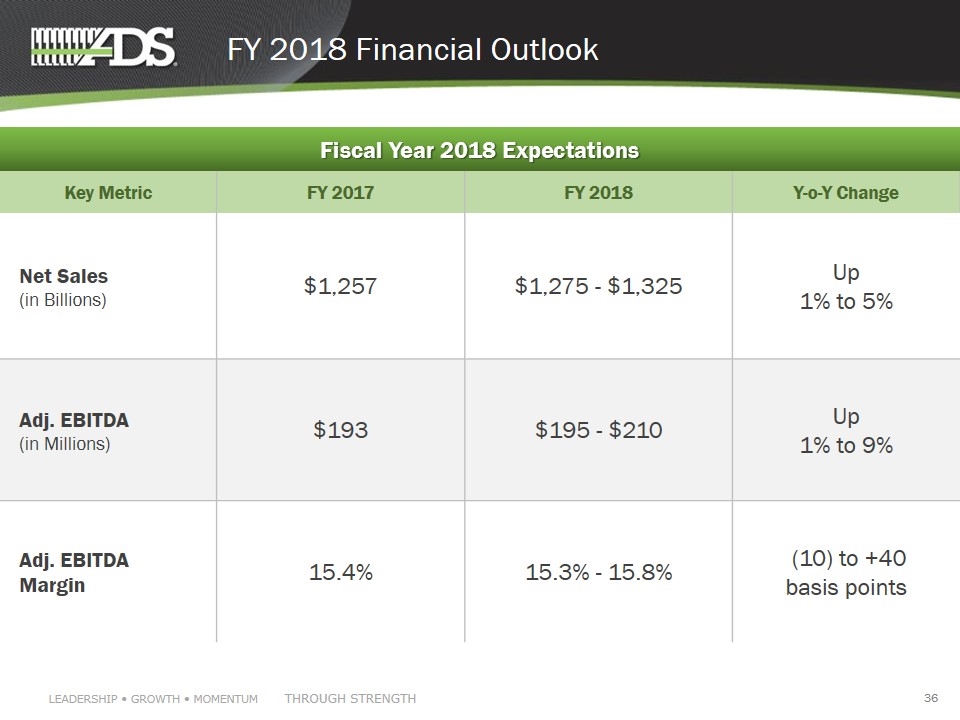
FY 2018 Financial Outlook Key Metric FY 2017 FY 2018 Y-o-Y Change Net Sales (in Billions) $1,257 $1,275 - $1,325 Up 1% to 5% Adj. EBITDA (in Millions) $193 $195 - $210 Up 1% to 9% Adj. EBITDA Margin 15.4% 15.3% - 15.8% (10) to +40 basis points Fiscal Year 2018 Expectations
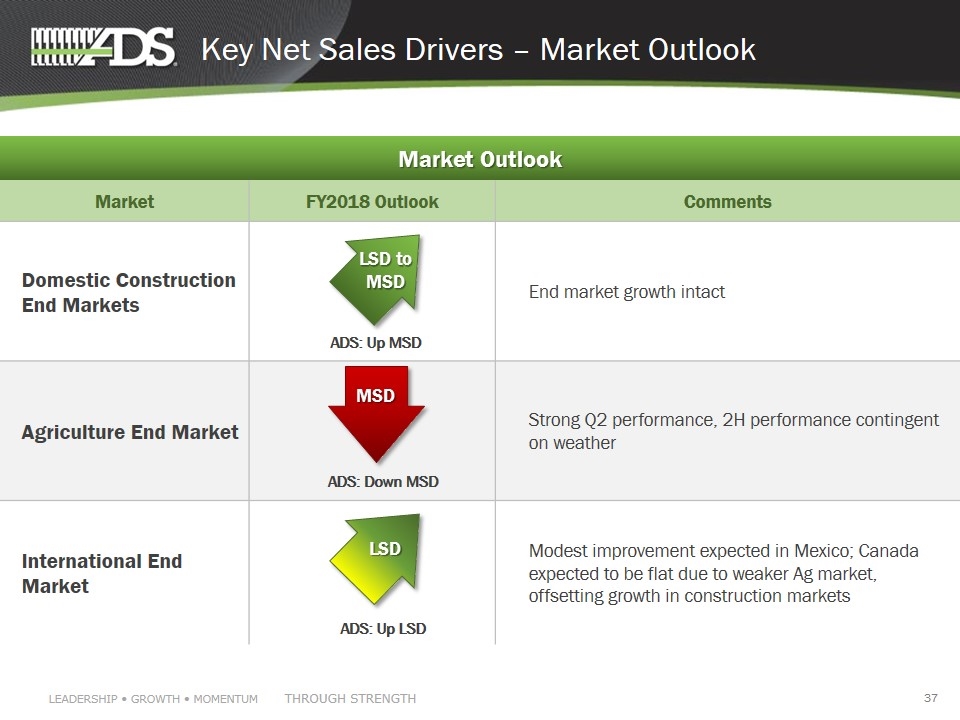
Market FY2018 Outlook Comments Domestic Construction End Markets End market growth intact Agriculture End Market Strong Q2 performance, 2H performance contingent on weather International End Market Modest improvement expected in Mexico; Canada expected to be flat due to weaker Ag market, offsetting growth in construction markets Key Net Sales Drivers – Market Outlook Market Outlook LSD to MSD MSD LSD ADS: Up MSD ADS: Down MSD ADS: Up LSD
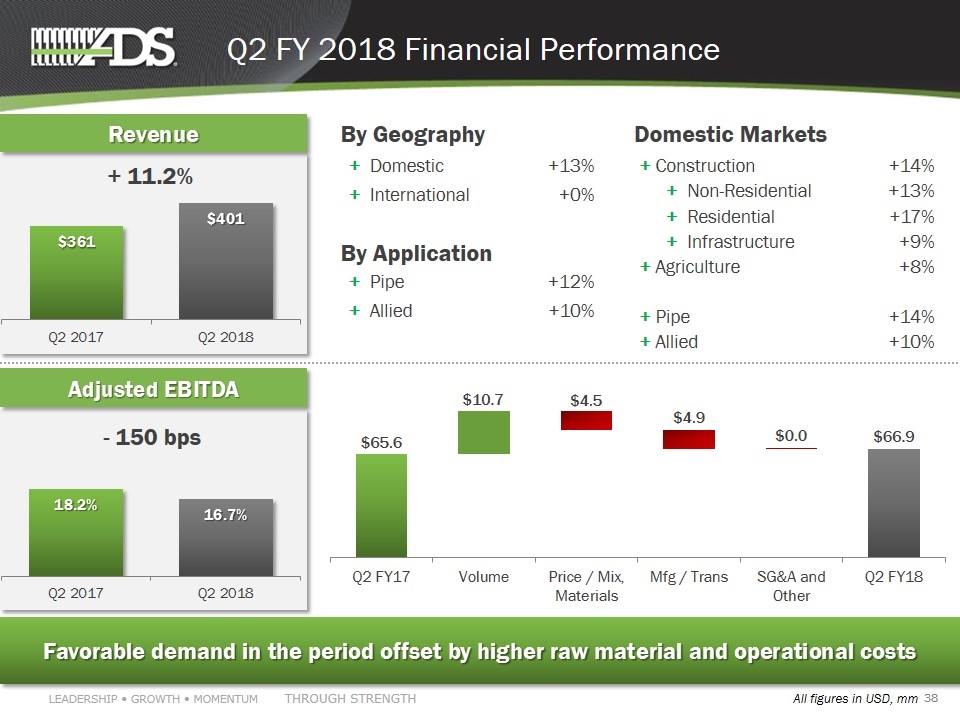
Q2 FY 2018 Financial Performance Favorable demand in the period offset by higher raw material and operational costs - 150 bps (USD, in millions) Adjusted EBITDA + 11.2% Domestic Markets + Construction +14% + Non-Residential +13% + Residential +17% + Infrastructure +9% + Agriculture +8% + Pipe +14% + Allied +10% By Geography + Domestic +13% + International +0% By Application + Pipe +12% + Allied +10% Revenue $65.6 $10.7 $4.5 $4.9 $0.0 $66.9 All figures in USD, mm
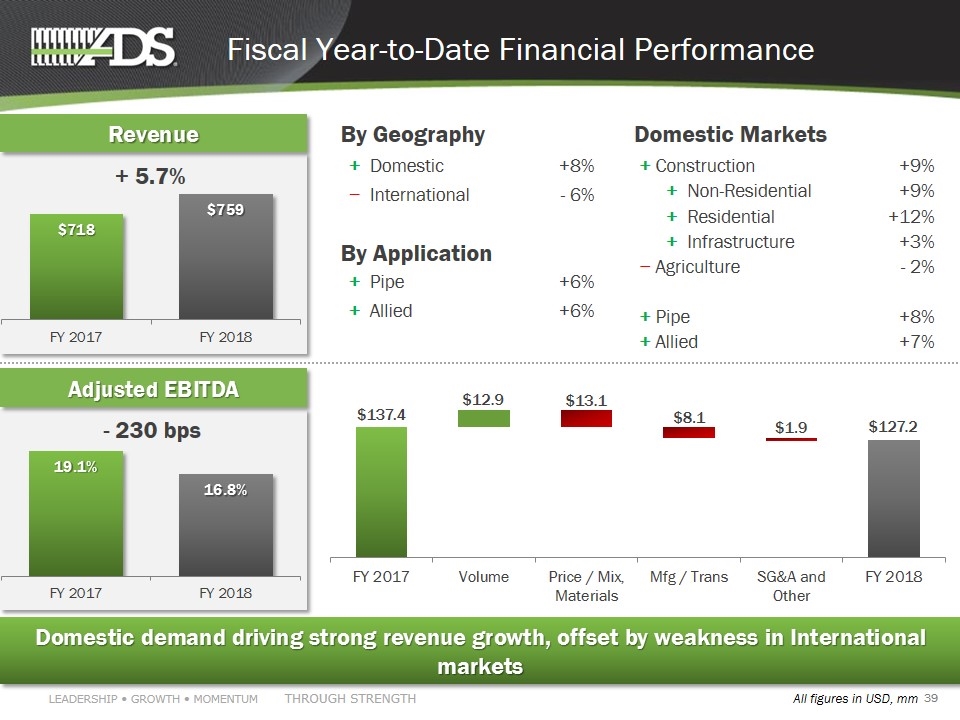
Fiscal Year-to-Date Financial Performance Domestic demand driving strong revenue growth, offset by weakness in International markets - 230 bps (USD, in millions) Adjusted EBITDA + 5.7% Domestic Markets + Construction +9% + Non-Residential +9% + Residential +12% + Infrastructure +3% − Agriculture - 2% + Pipe +8% + Allied +7% By Geography + Domestic +8% − International - 6% By Application + Pipe +6% + Allied +6% Revenue $137.4 $12.9 $13.1 $8.1 $1.9 $127.2 All figures in USD, mm
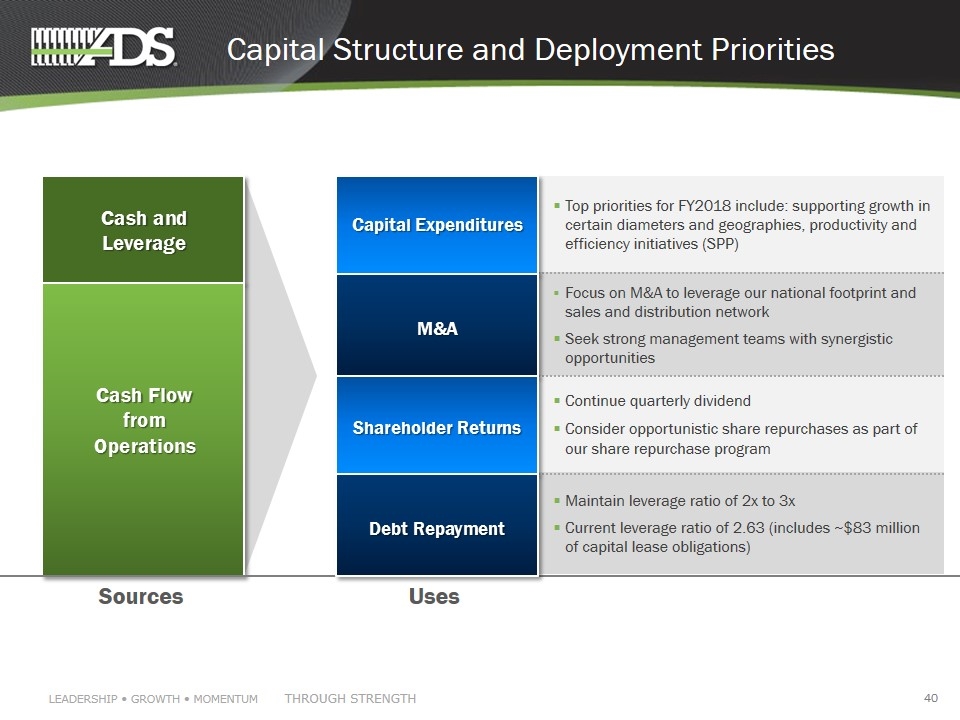
Capital Structure and Deployment Priorities Cash and Leverage Cash Flow from Operations Sources Uses Top priorities for FY2018 include: supporting growth in certain diameters and geographies, productivity and efficiency initiatives (SPP) Focus on M&A to leverage our national footprint and sales and distribution network Seek strong management teams with synergistic opportunities Continue quarterly dividend Consider opportunistic share repurchases as part of our share repurchase program Maintain leverage ratio of 2x to 3x Current leverage ratio of 2.63 (includes ~$83 million of capital lease obligations) Capital Expenditures M&A Shareholder Returns Debt Repayment
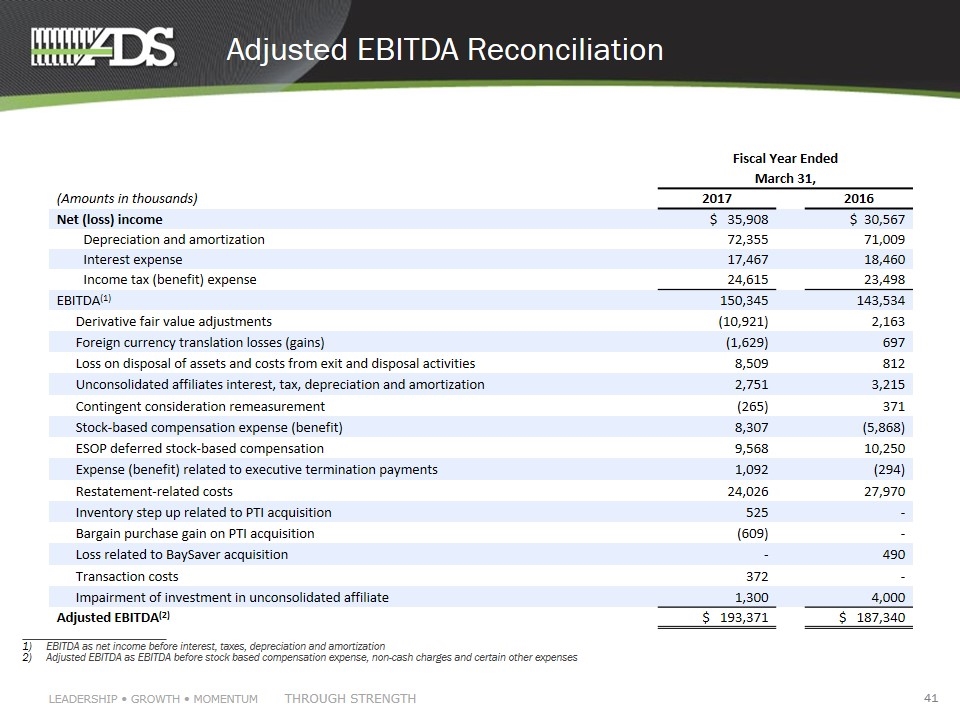
Adjusted EBITDA Reconciliation ___________________________ EBITDA as net income before interest, taxes, depreciation and amortization Adjusted EBITDA as EBITDA before stock based compensation expense, non-cash charges and certain other expenses Fiscal Year Ended March 31, (Amounts in thousands) 2017 2016 Net (loss) income $ 35,908 $ 30,567 Depreciation and amortization 72,355 71,009 Interest expense 17,467 18,460 Income tax (benefit) expense 24,615 23,498 EBITDA(1) 150,345 143,534 Derivative fair value adjustments (10,921) 2,163 Foreign currency translation losses (gains) (1,629) 697 Loss on disposal of assets and costs from exit and disposal activities 8,509 812 Unconsolidated affiliates interest, tax, depreciation and amortization 2,751 3,215 Contingent consideration remeasurement (265) 371 Stock-based compensation expense (benefit) 8,307 (5,868) ESOP deferred stock-based compensation 9,568 10,250 Expense (benefit) related to executive termination payments 1,092 (294) Restatement-related costs 24,026 27,970 Inventory step up related to PTI acquisition 525 - Bargain purchase gain on PTI acquisition (609) - Loss related to BaySaver acquisition - 490 Transaction costs 372 - Impairment of investment in unconsolidated affiliate 1,300 4,000 Adjusted EBITDA(2) $ 193,371 $ 187,340
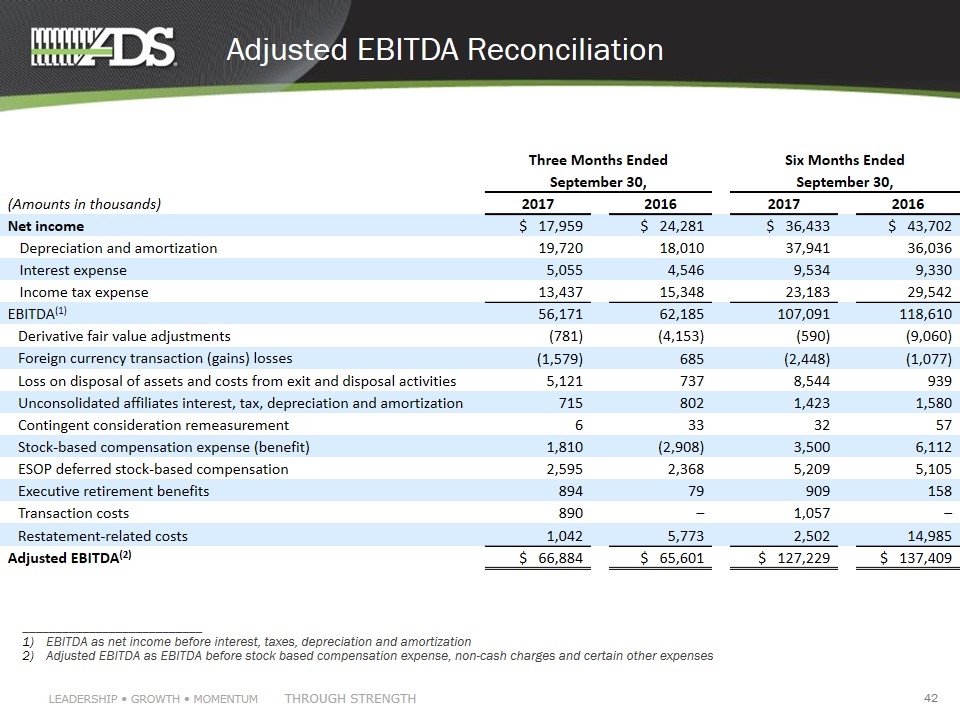
Adjusted EBITDA Reconciliation ___________________________ EBITDA as net income before interest, taxes, depreciation and amortization Adjusted EBITDA as EBITDA before stock based compensation expense, non-cash charges and certain other expenses Three Months Ended Six Months Ended September 30, September 30, (Amounts in thousands) 2017 2016 2017 2016 Net income $ 17,959 $ 24,281 $ 36,433 $ 43,702 Depreciation and amortization 19,720 18,010 37,941 36,036 Interest expense 5,055 4,546 9,534 9,330 Income tax expense 13,437 15,348 23,183 29,542 EBITDA(1) 56,171 62,185 107,091 118,610 Derivative fair value adjustments (781) (4,153) (590) (9,060) Foreign currency transaction (gains) losses (1,579) 685 (2,448) (1,077) Loss on disposal of assets and costs from exit and disposal activities 5,121 737 8,544 939 Unconsolidated affiliates interest, tax, depreciation and amortization 715 802 1,423 1,580 Contingent consideration remeasurement 6 33 32 57 Stock-based compensation expense (benefit) 1,810 (2,908) 3,500 6,112 ESOP deferred stock-based compensation 2,595 2,368 5,209 5,105 Executive retirement benefits 894 79 909 158 Transaction costs 890 ─ 1,057 ─ Restatement-related costs 1,042 5,773 2,502 14,985 Adjusted EBITDA(2) $ 66,884 $ 65,601 $ 127,229 $ 137,409