Advanced Drainage Systems Investor Presentation June 2019
Forward Looking Statements and Non-GAAP Financial Metrics Certain statements in this presentation may be deemed to be forward-looking statements. Such statements include, but are not limited to, statements regarding the anticipated timing for the issuance of additional historic and future financial information and related filings. These statements are not historical facts but rather are based on the Company’s current expectations, estimates and projections regarding the Company’s business, operations and other factors relating thereto. Words such as “may,” “will,” “could,” “would,” “should,” “anticipate,” “predict,” “potential,” “continue,” “expects,” “intends,” “plans,” “projects,” “believes,” “estimates,” “confident” and similar expressions are used to identify these forward-looking statements. Factors that could cause actual results to differ from those reflected in forward-looking statements relating to our operations and business include: fluctuations in the price and availability of resins and other raw materials and our ability to pass any increased costs of raw materials on to our customers in a timely manner; volatility in general business and economic conditions in the markets in which we operate, including, without limitation, factors relating to availability of credit, interest rates, fluctuations in capital and business and consumer confidence; cyclicality and seasonality of the non-residential and residential construction markets and infrastructure spending; the risks of increasing competition in our existing and future markets, including competition from both manufacturers of high performance thermoplastic corrugated pipe and manufacturers of products using alternative materials; our ability to continue to convert current demand for concrete, steel and PVC pipe products into demand for our high performance thermoplastic corrugated pipe and Allied Products; the effect of weather or seasonality; the loss of any of our significant customers; the risks of doing business internationally; the risks of conducting a portion of our operations through joint ventures; our ability to expand into new geographic or product markets; our ability to achieve the acquisition component of our growth strategy; the risk associated with manufacturing processes; our ability to manage our assets; the risks associated with our product warranties; our ability to manage our supply purchasing and customer credit policies; the risks associated with our self-insured programs; our ability to control labor costs and to attract, train and retain highly-qualified employees and key personnel; our ability to protect our intellectual property rights; changes in laws and regulations, including environmental laws and regulations; our ability to project product mix; the risks associated with our current levels of indebtedness; fluctuations in our effective tax rate, including from the recently enacted Tax Cuts and Jobs Act; changes to our operating results, cash flows and financial condition attributable to the recently enacted Tax Cuts and Jobs Act; our ability to meet future capital requirements and fund our liquidity needs; the risk that additional information may arise during the course of the Company’s ongoing accounting review that would require the Company to make additional adjustments or revisions or to restate the financial statements and other financial data for certain prior periods and any future periods; a conclusion that the Company’s disclosure controls and procedures (as defined in Rules 13a-15(e) and 15d-15(e) of the Exchange Act) were ineffective; the review of potential weaknesses or deficiencies in the Company’s disclosure controls and procedures, and discovering further weaknesses of which we are not currently aware or which have not been detected; additional uncertainties related to accounting issues generally and other risks and uncertainties described in the Company’s filings with the Securities and Exchange Commission. New risks and uncertainties emerge from time to time and it is not possible for the Company to predict all risks and uncertainties that could have an impact on the forward-looking statements contained in this press release. In light of the significant uncertainties inherent in the forward-looking information included herein, the inclusion of such information should not be regarded as a representation by the Company or any other person that the Company’s expectations, objectives or plans will be achieved in the timeframe anticipated or at all. Investors are cautioned not to place undue reliance on the Company’s forward-looking statements and the Company undertakes no obligation to publicly update or revise any forward-looking statements, whether as a result of new information, future events or otherwise, except as required by law. This presentation includes certain non-GAAP financial measures to describe the Company’s performance. The reconciliation of those measures to GAAP measures are provided within the appendix of the presentation. Those disclosures should not be viewed as a substitute for operating results determined in accordance with GAAP, nor are they necessarily comparable to non-GAAP performance measures that may be presented by other companies.
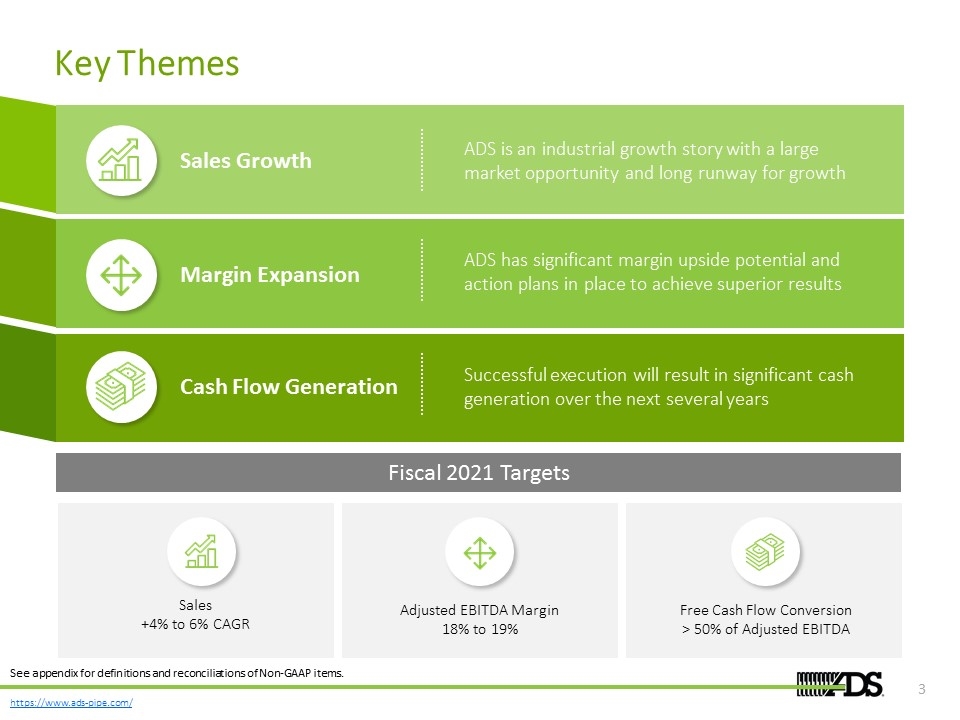
Key Themes Cash Flow Generation Successful execution will result in significant cash generation over the next several years Margin Expansion ADS has significant margin upside potential and action plans in place to achieve superior results ADS is an industrial growth story with a large market opportunity and long runway for growth Sales Growth Sales +4% to 6% CAGR Adjusted EBITDA Margin 18% to 19% Free Cash Flow Conversion > 50% of Adjusted EBITDA See appendix for definitions and reconciliations of Non-GAAP items. Fiscal 2021 Targets
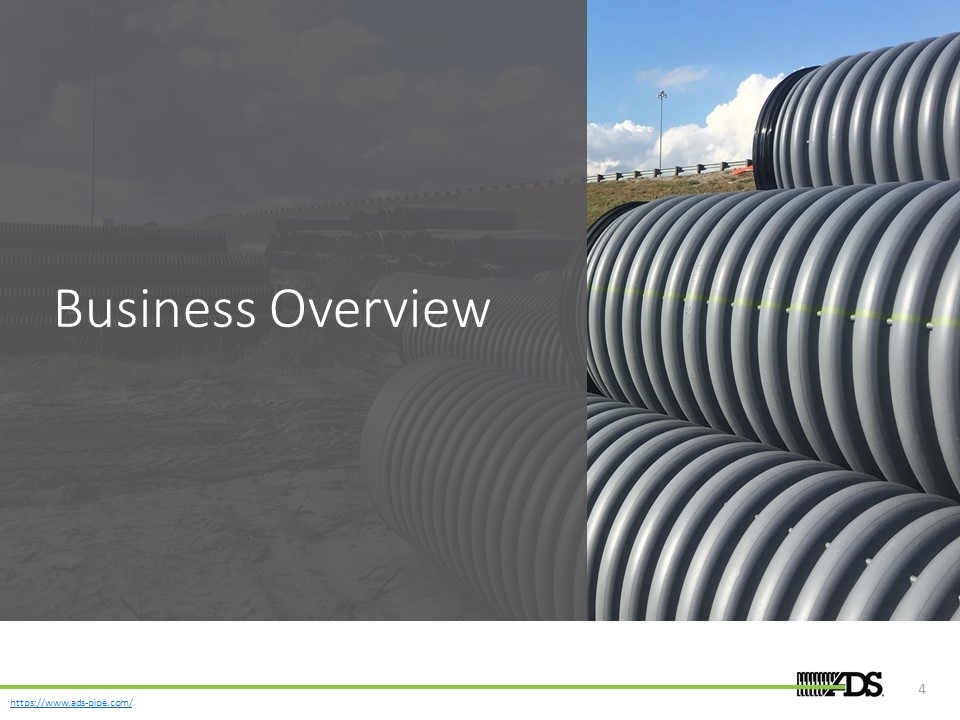
Business Overview
ADS provides innovative water management solutions, protecting a precious natural resource, while keeping millions of pounds of plastic out of landfills each year Innovative Management of a Precious Resource ADS’ solutions are managing billions of gallons of storm water runoff, protecting bodies of water, making cities more livable and improving quality of life
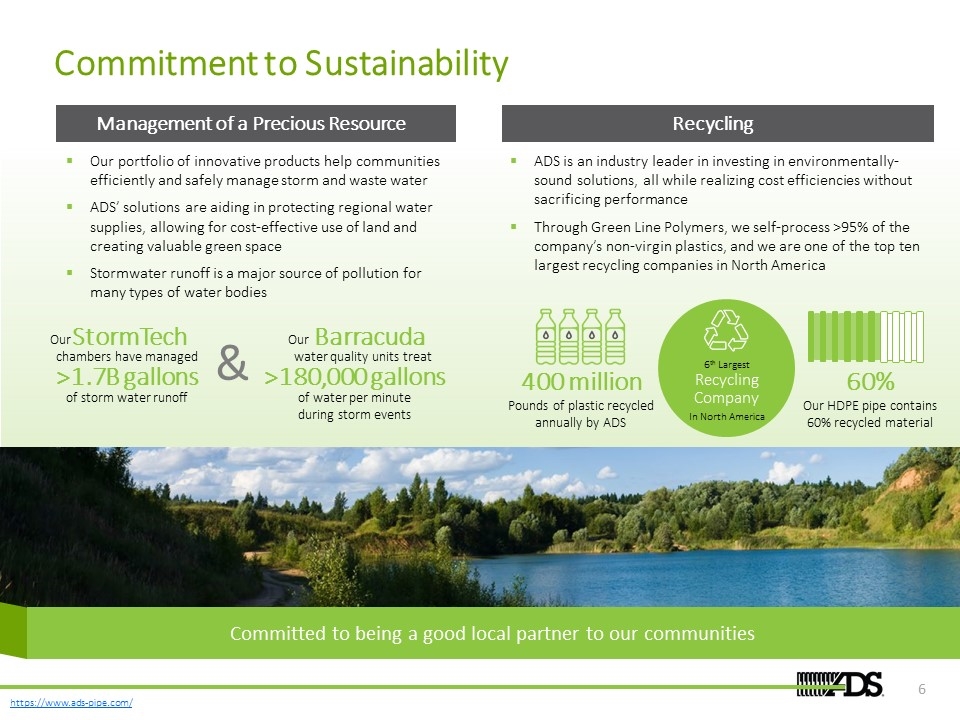
>180,000 gallons Management of a Precious Resource Recycling Commitment to Sustainability Our portfolio of innovative products help communities efficiently and safely manage storm and waste water ADS’ solutions are aiding in protecting regional water supplies, allowing for cost-effective use of land and creating valuable green space Stormwater runoff is a major source of pollution for many types of water bodies ADS is an industry leader in investing in environmentally-sound solutions, all while realizing cost efficiencies without sacrificing performance Through Green Line Polymers, we self-process >95% of the company’s non-virgin plastics, and we are one of the top ten largest recycling companies in North America 400 million Pounds of plastic recycled annually by ADS Committed to being a good local partner to our communities 6th Largest Recycling Company In North America chambers have managed StormTech Our >1.7B gallons of storm water runoff water quality units treat Barracuda Our of water per minute during storm events & 60% Our HDPE pipe contains 60% recycled material
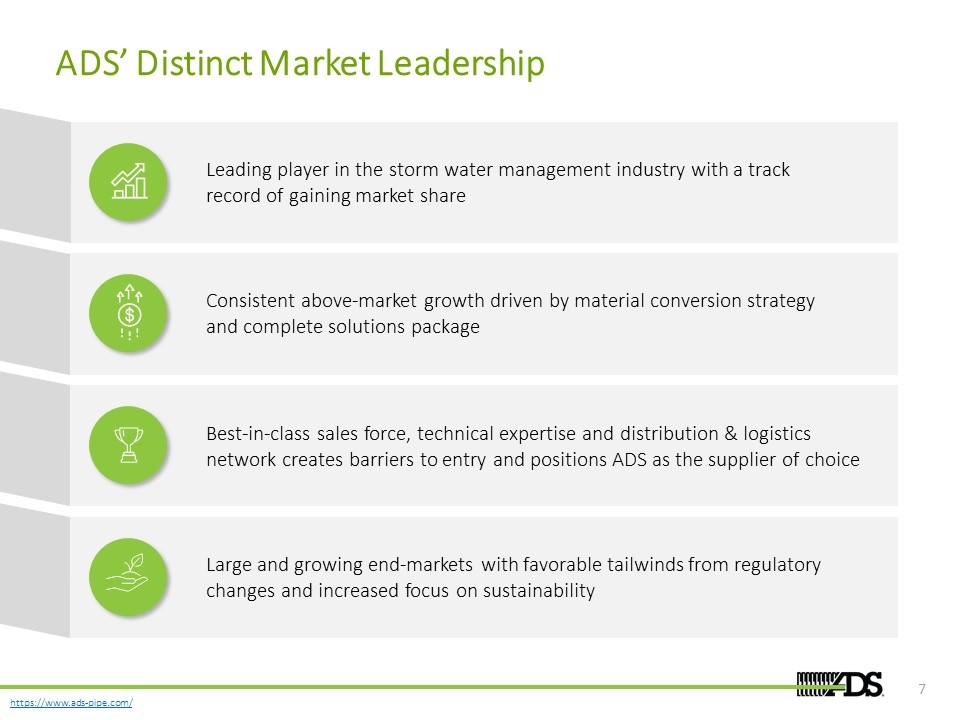
ADS’ Distinct Market Leadership Leading player in the storm water management industry with a track record of gaining market share Consistent above-market growth driven by material conversion strategy and complete solutions package Best-in-class sales force, technical expertise and distribution & logistics network creates barriers to entry and positions ADS as the supplier of choice Large and growing end-markets with favorable tailwinds from regulatory changes and increased focus on sustainability
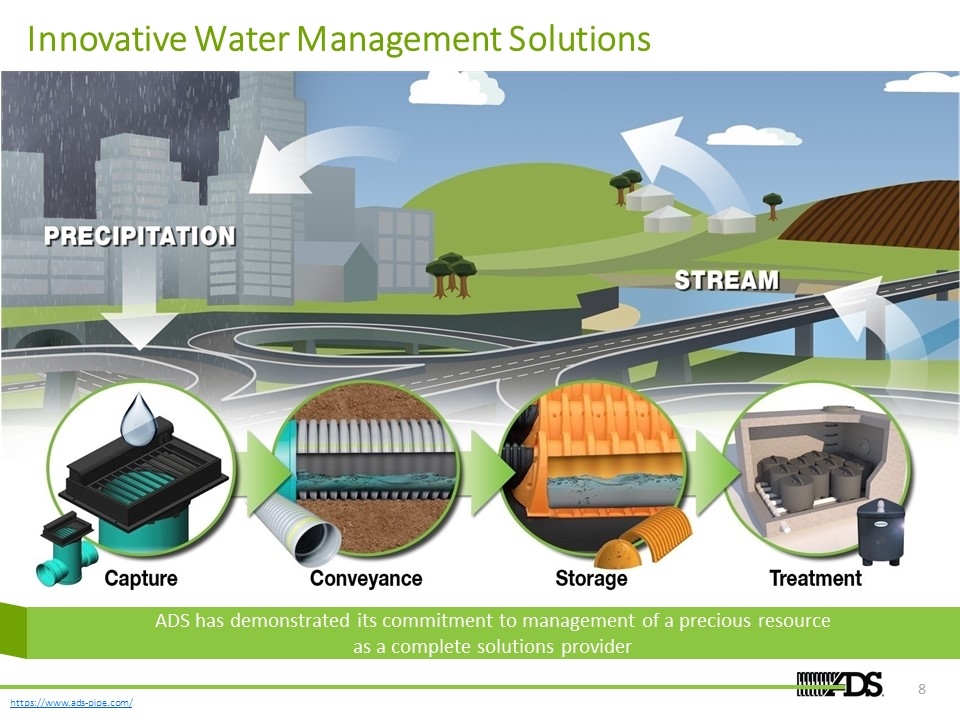
Innovative Water Management Solutions ADS has demonstrated its commitment to management of a precious resource as a complete solutions provider
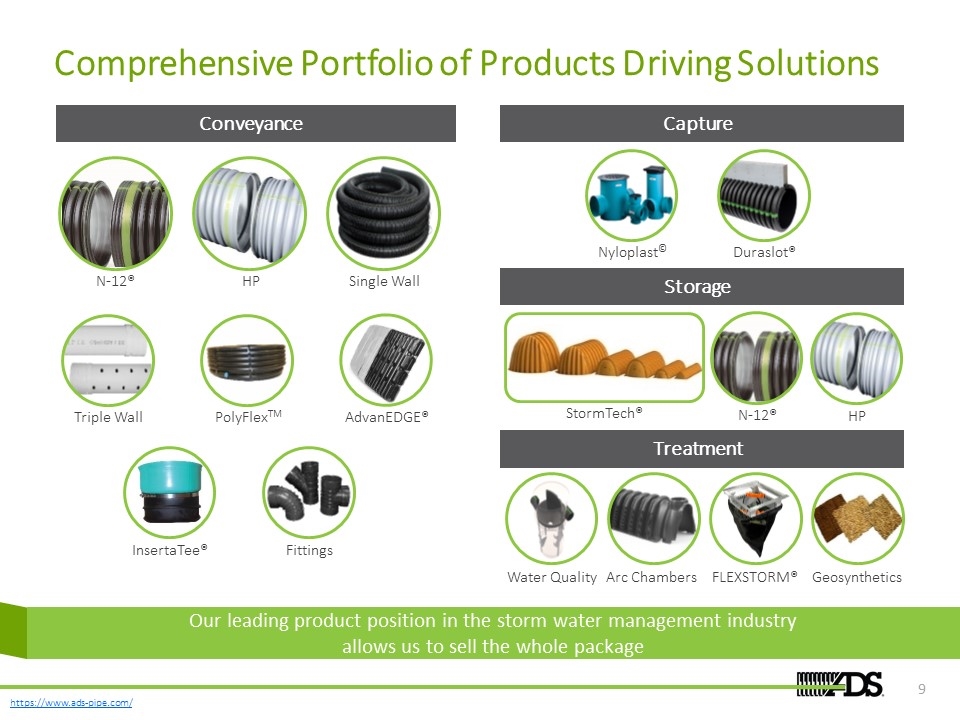
Comprehensive Portfolio of Products Driving Solutions Conveyance Capture Storage Treatment StormTech® Arc Chambers Duraslot® Nyloplast© FLEXSTORM® Geosynthetics Water Quality Single Wall N-12® HP Triple Wall PolyFlexTM AdvanEDGE® Our leading product position in the storm water management industry allows us to sell the whole package Fittings InsertaTee® N-12® HP
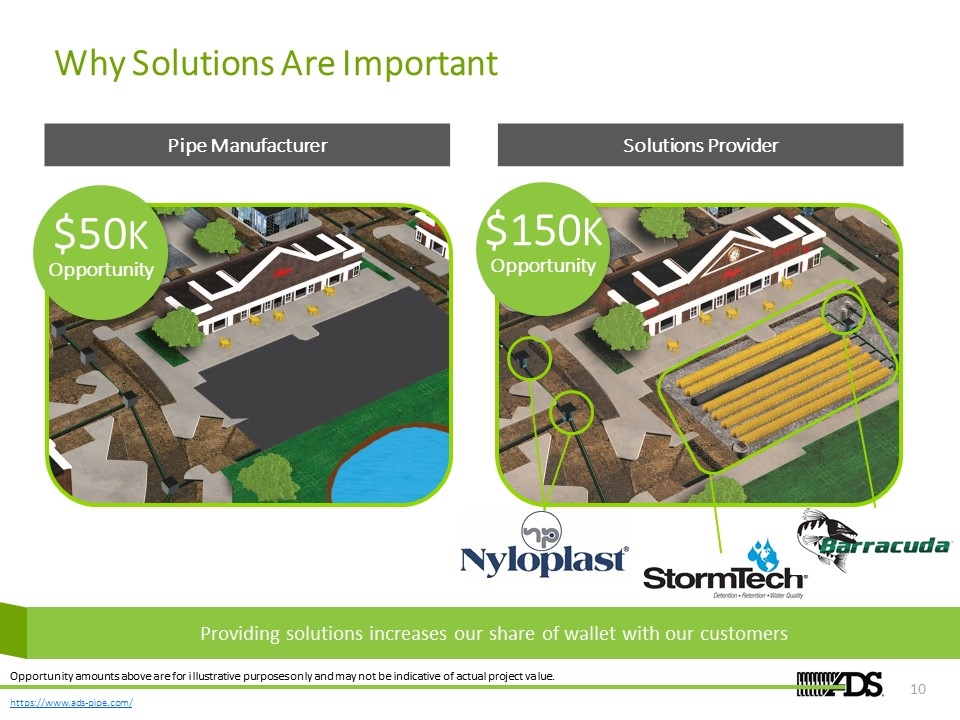
Why Solutions Are Important Pipe Manufacturer Solutions Provider $50K Opportunity $150K Opportunity Providing solutions increases our share of wallet with our customers Opportunity amounts above are for illustrative purposes only and may not be indicative of actual project value.
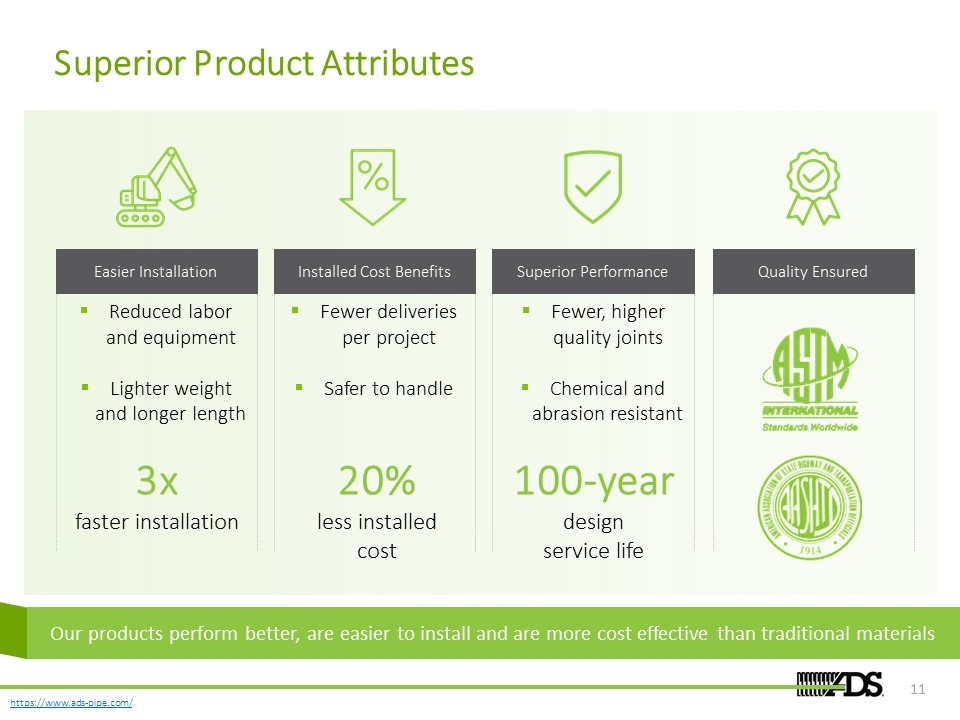
Superior Product Attributes 100-year design service life Superior Performance Our products perform better, are easier to install and are more cost effective than traditional materials 3x faster installation Easier Installation Reduced labor and equipment Lighter weight and longer length 20% less installed cost Installed Cost Benefits Fewer deliveries per project Safer to handle Fewer, higher quality joints Chemical and abrasion resistant Quality Ensured
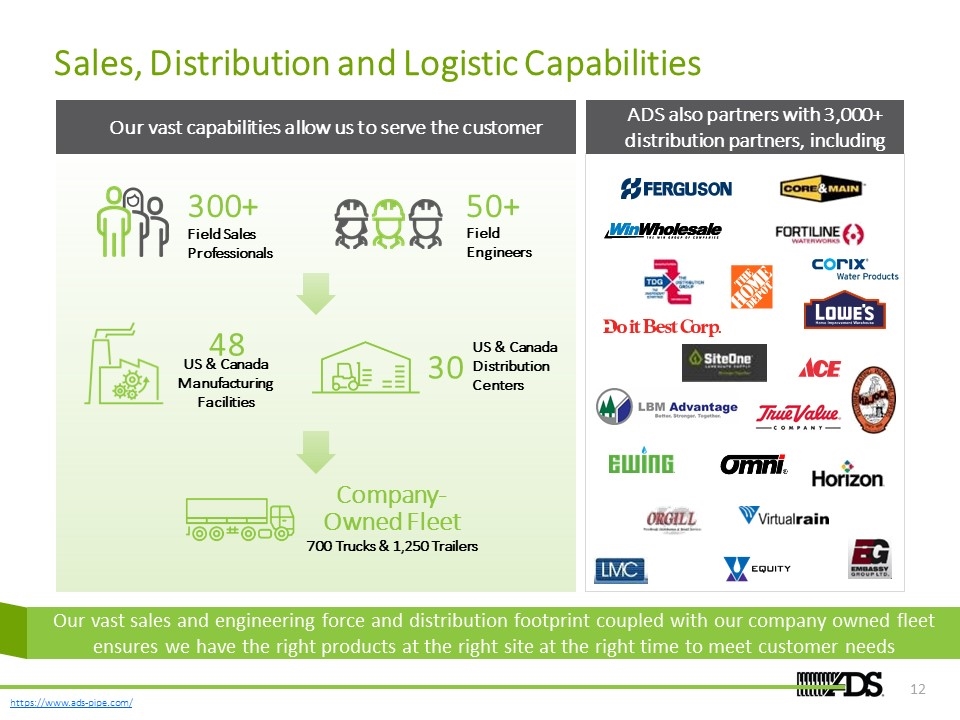
Sales, Distribution and Logistic Capabilities 48 US & Canada Manufacturing Facilities Company-Owned Fleet 700 Trucks & 1,250 Trailers Our vast capabilities allow us to serve the customer 30 US & Canada Distribution Centers ADS also partners with 3,000+ distribution partners, including 300+ Field Sales Professionals 50+ Field Engineers Our vast sales and engineering force and distribution footprint coupled with our company owned fleet ensures we have the right products at the right site at the right time to meet customer needs
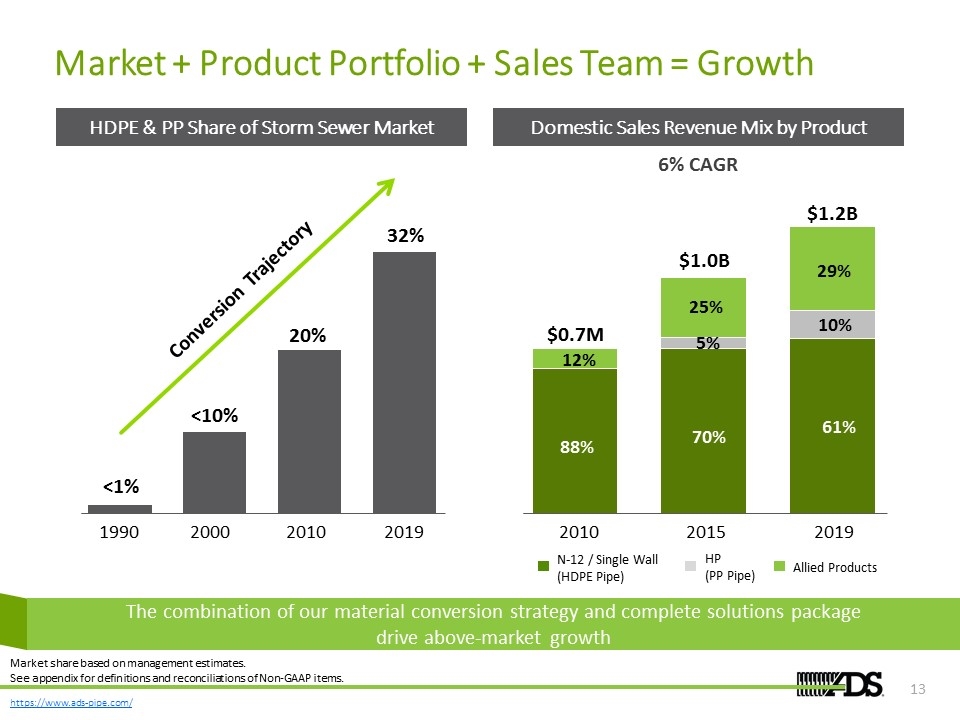
Market + Product Portfolio + Sales Team = Growth <1% <10% HDPE & PP Share of Storm Sewer Market Domestic Sales Revenue Mix by Product 88% 70% 61% 12% 25% 29% 5% 10% Our pipe products have been displacing traditional materials across an expanding range of end markets and our Allied Products allow us to provide a complete storm water management solution, when combined, drive above market growth 1990 2000 2010 2019 2010 2015 2019 N-12 / Single Wall (HDPE Pipe) HP (PP Pipe) Allied Products $1.2B $1.0B $0.7M The combination of our material conversion strategy and complete solutions package drive above-market growth Market share based on management estimates. See appendix for definitions and reconciliations of Non-GAAP items. Conversion Trajectory 6% CAGR
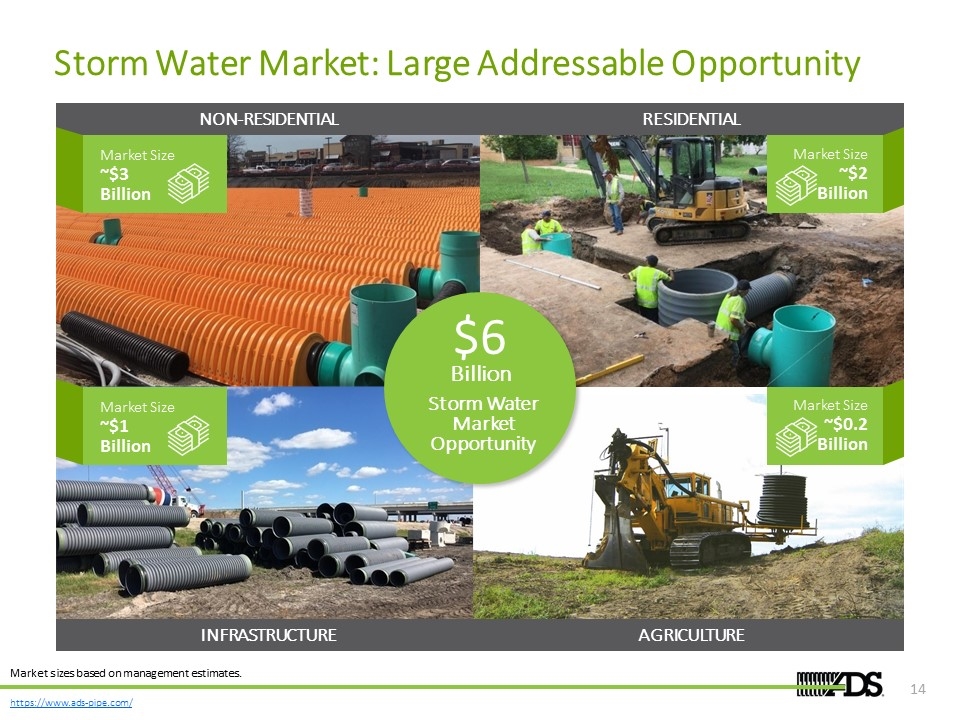
Storm Water Market: Large Addressable Opportunity NON-RESIDENTIAL INFRASTRUCTURE RESIDENTIAL AGRICULTURE Storm Water Market Opportunity $6 Billion Market Size ~$3 Billion Market Size ~$1 Billion Market Size ~$0.2 Billion Market Size ~$2 Billion Market sizes based on management estimates.
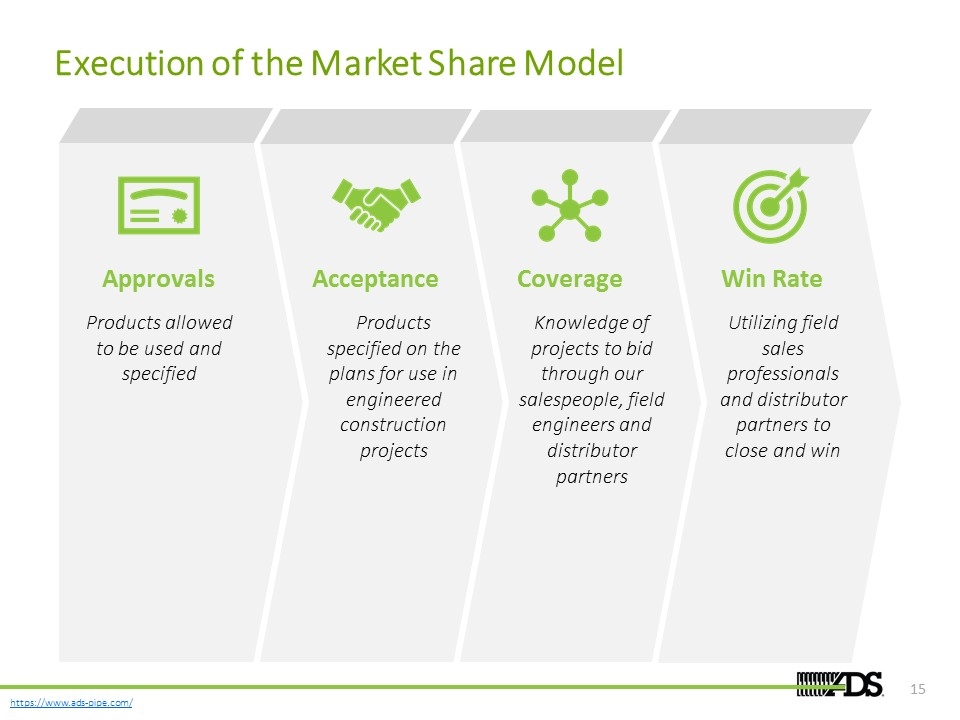
Execution of the Market Share Model Products allowed to be used and specified Products specified on the plans for use in engineered construction projects Knowledge of projects to bid through our salespeople, field engineers and distributor partners Utilizing field sales professionals and distributor partners to close and win Approvals Acceptance Win Rate Coverage
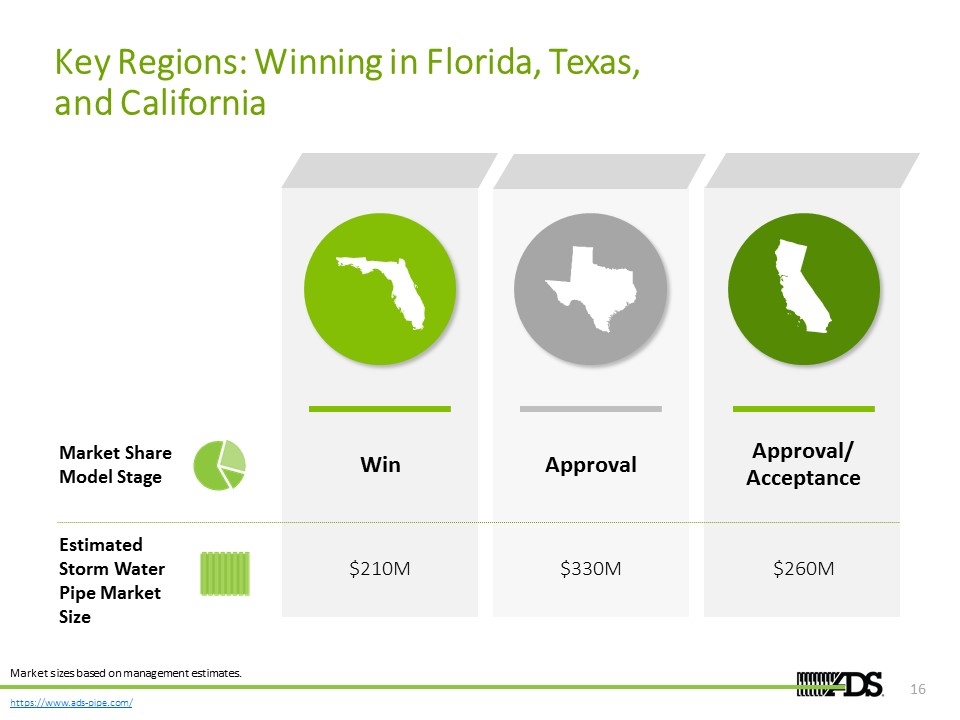
Key Regions: Winning in Florida, Texas, and California Win $210M Approval/ Acceptance $260M Estimated Storm Water Pipe Market Size Market Share Model Stage Approval $330M Market sizes based on management estimates.
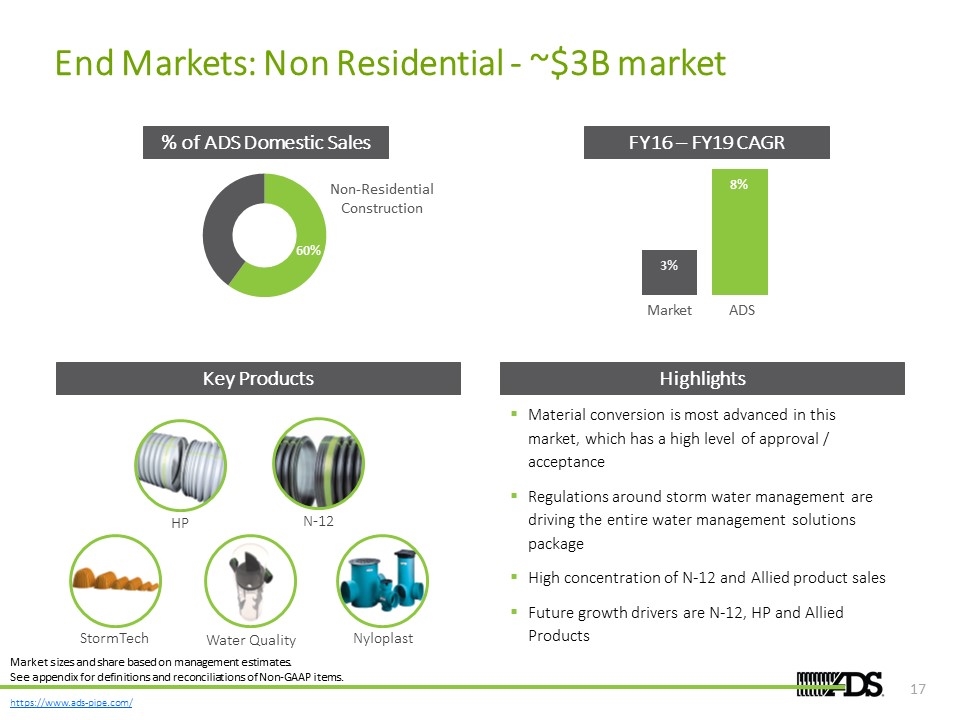
End Markets: Non Residential - ~$3B market % of ADS Domestic Sales FY16 – FY19 CAGR Non-Residential Construction Market ADS Key Products HP N-12 StormTech Nyloplast Water Quality Highlights Material conversion is most advanced in this market, which has a high level of approval / acceptance Regulations around storm water management are driving the entire water management solutions package High concentration of N-12 and Allied product sales Future growth drivers are N-12, HP and Allied Products Market sizes and share based on management estimates. See appendix for definitions and reconciliations of Non-GAAP items.
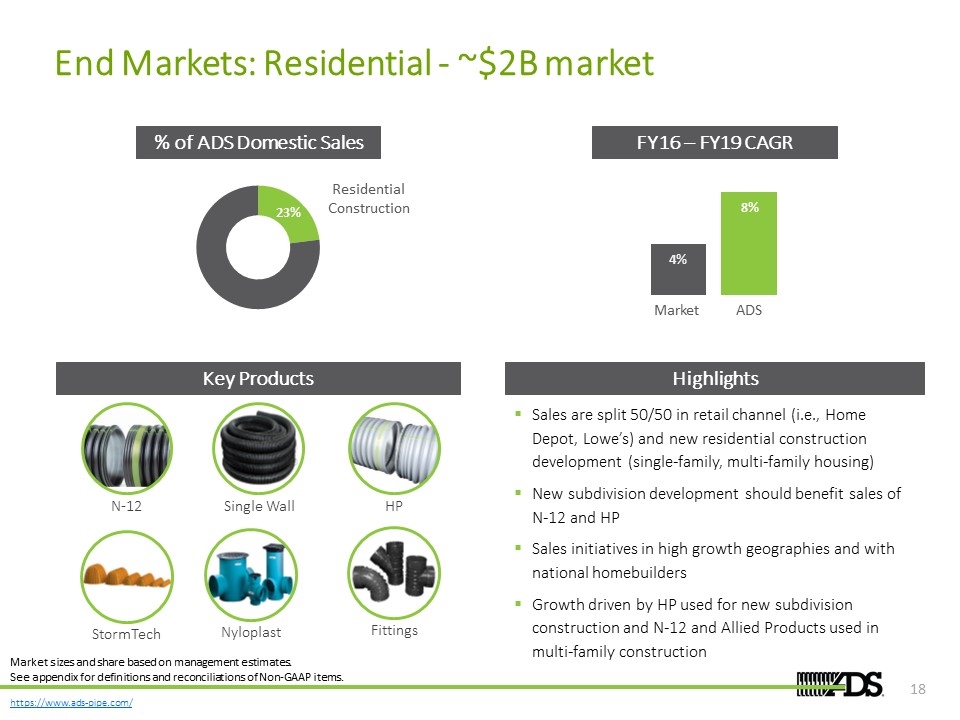
End Markets: Residential - ~$2B market % of ADS Domestic Sales FY16 – FY19 CAGR Residential Construction Market ADS Key Products Highlights Sales are split 50/50 in retail channel (i.e., Home Depot, Lowe’s) and new residential construction development (single-family, multi-family housing) New subdivision development should benefit sales of N-12 and HP Sales initiatives in high growth geographies and with national homebuilders Growth driven by HP used for new subdivision construction and N-12 and Allied Products used in multi-family construction N-12 StormTech Nyloplast HP Single Wall Fittings Market sizes and share based on management estimates. See appendix for definitions and reconciliations of Non-GAAP items.
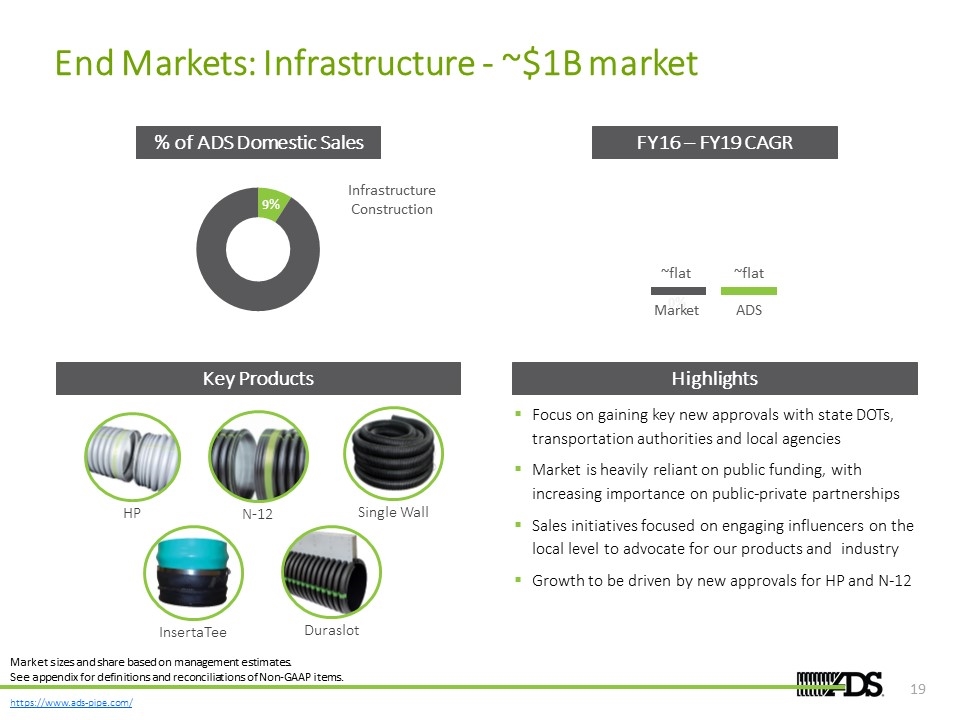
End Markets: Infrastructure - ~$1B market Infrastructure Construction Market ADS Key Products N-12 Highlights Focus on gaining key new approvals with state DOTs, transportation authorities and local agencies Market is heavily reliant on public funding, with increasing importance on public-private partnerships Sales initiatives focused on engaging influencers on the local level to advocate for our products and industry Growth to be driven by new approvals for HP and N-12 HP InsertaTee Single Wall Duraslot % of ADS Domestic Sales FY16 – FY19 CAGR Market sizes and share based on management estimates. See appendix for definitions and reconciliations of Non-GAAP items. ~flat ~flat
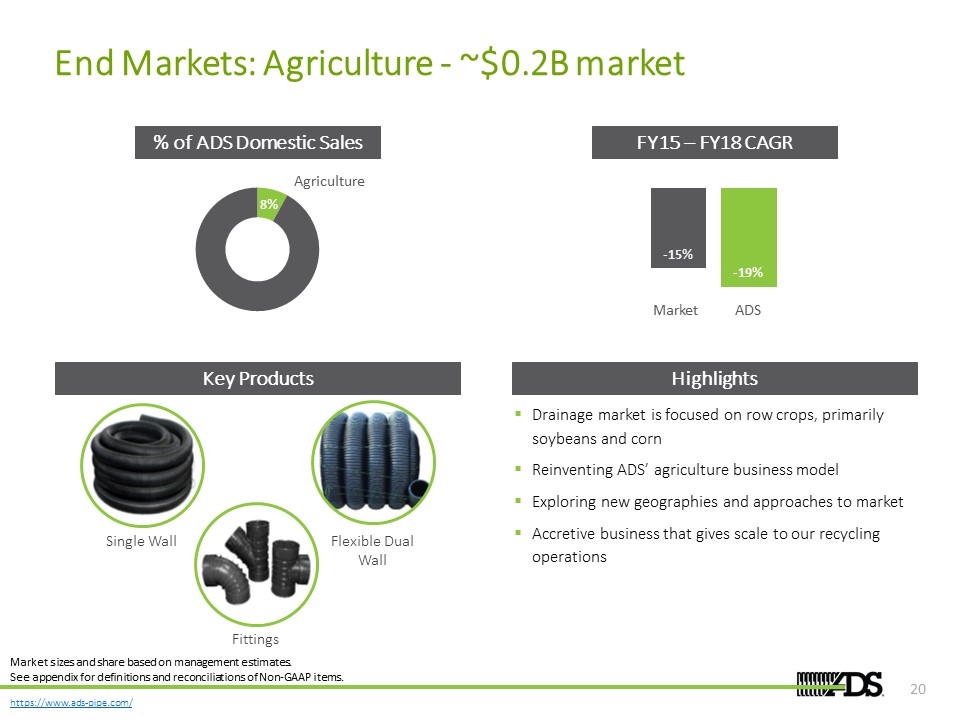
End Markets: Agriculture - ~$0.2B market Agriculture Market ADS Key Products Highlights Single Wall Fittings Flexible Dual Wall % of ADS Domestic Sales FY15 – FY18 CAGR Drainage market is focused on row crops, primarily soybeans and corn Reinventing ADS’ agriculture business model Exploring new geographies and approaches to market Accretive business that gives scale to our recycling operations Market sizes and share based on management estimates. See appendix for definitions and reconciliations of Non-GAAP items.

International Markets Canada Exports Mexico Leading HDPE producer in Canada, with large opportunity for conversion Business is evenly split between agriculture and construction markets Accelerating construction market share by executing our Market Share Model and selling the complete storm water solutions package Manufacturing Plant Distribution Center Primarily focused on StormTech® chambers, which are transportation efficient Europe: Coverage from distribution and local ADS sales engineers High awareness of storm water management issues Good acceptance for plastic products Middle East Construction activity in Qatar related to 2020 World Cup Urbanization has brought increased awareness of flooding issues 15-Year Joint Venture with local partner Leading producer in Mexico Business is 60% Infrastructure and 40% Wiring Protection Conduit Primary competition is PVC pipe and other HDPE producers 30+ territory distribution agreements Highlighted countries have distribution coverage
Operations Overview
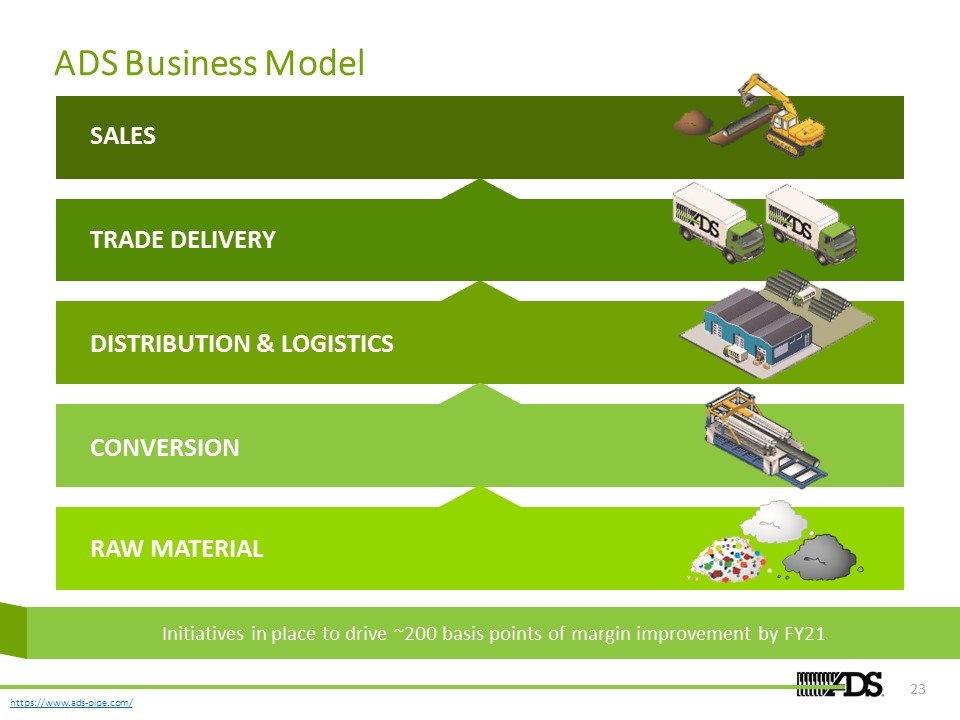
ADS Business Model SALES TRADE DELIVERY DISTRIBUTION & LOGISTICS CONVERSION RAW MATERIAL Initiatives in place to drive ~200 basis points of margin improvement by FY21
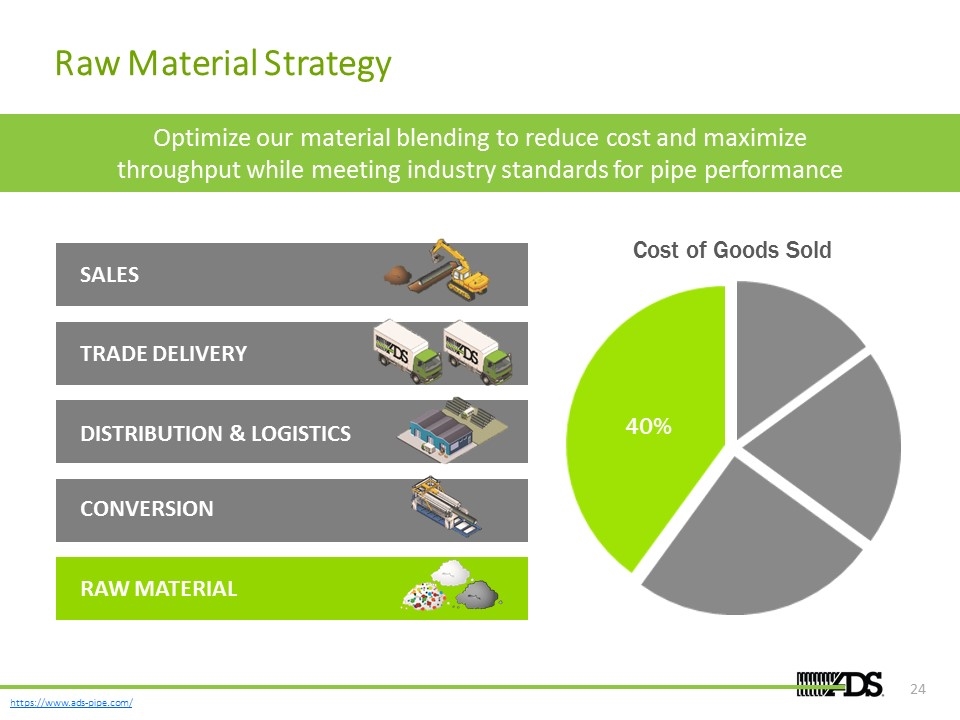
Raw Material Strategy 40% SALES TRADE DELIVERY DISTRIBUTION & LOGISTICS CONVERSION RAW MATERIAL Optimize our material blending to reduce cost and maximize throughput while meeting industry standards for pipe performance
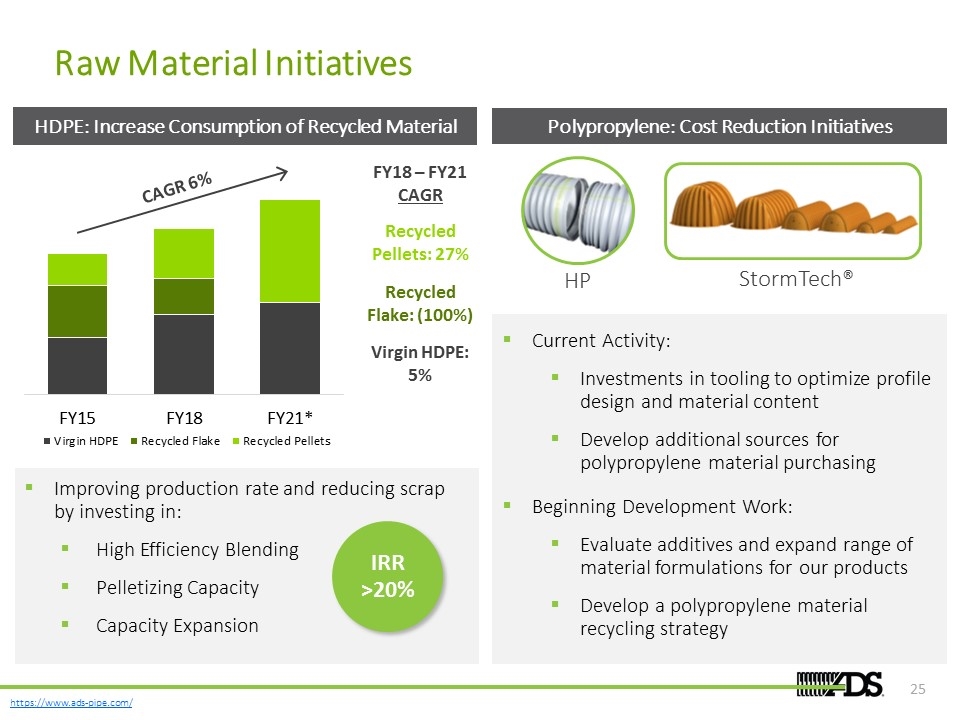
Raw Material Initiatives Polypropylene: Cost Reduction Initiatives HDPE: Increase Consumption of Recycled Material CAGR 6% FY18 – FY21 CAGR Recycled Pellets: 27% Virgin HDPE: 5% Recycled Flake: (100%) Improving production rate and reducing scrap by investing in: High Efficiency Blending Pelletizing Capacity Capacity Expansion IRR >20% HP StormTech® Current Activity: Investments in tooling to optimize profile design and material content Develop additional sources for polypropylene material purchasing Beginning Development Work: Evaluate additives and expand range of material formulations for our products Develop a polypropylene material recycling strategy
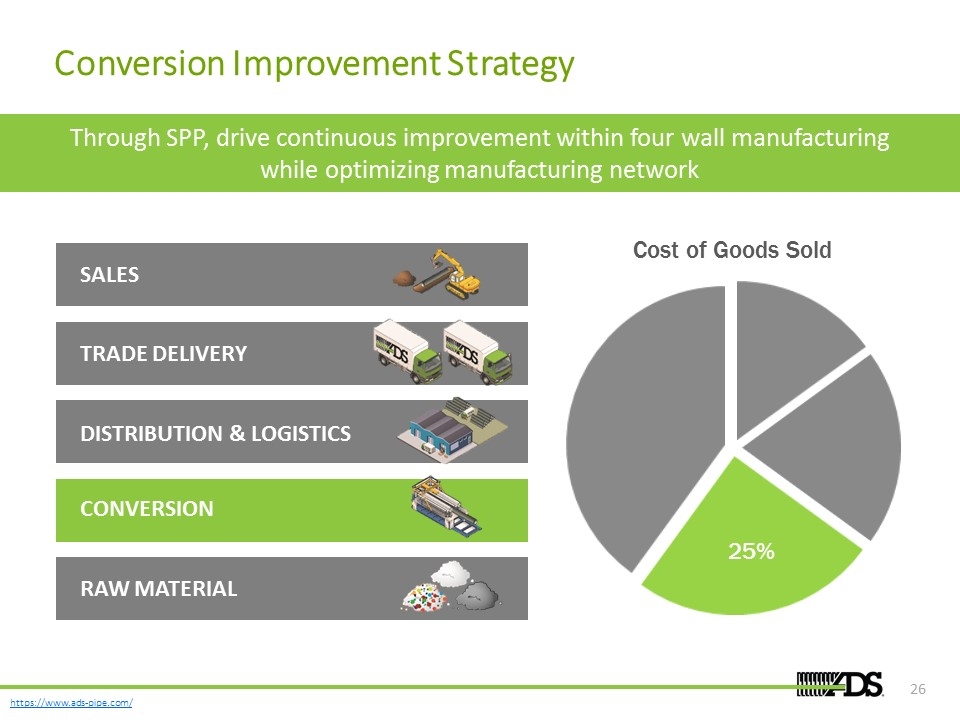
Conversion Improvement Strategy 25% SALES TRADE DELIVERY DISTRIBUTION & LOGISTICS CONVERSION RAW MATERIAL Through SPP, drive continuous improvement within four wall manufacturing while optimizing manufacturing network

Conversion Improvement Strategy Continuous Improvement Startups & Changeovers Machine Maintenance & Upgrades Automation Network Rationalization Integrated Supply Chain Planning Tooling & Capacity Investments Manufacturing Network Optimization Inside the Four Walls
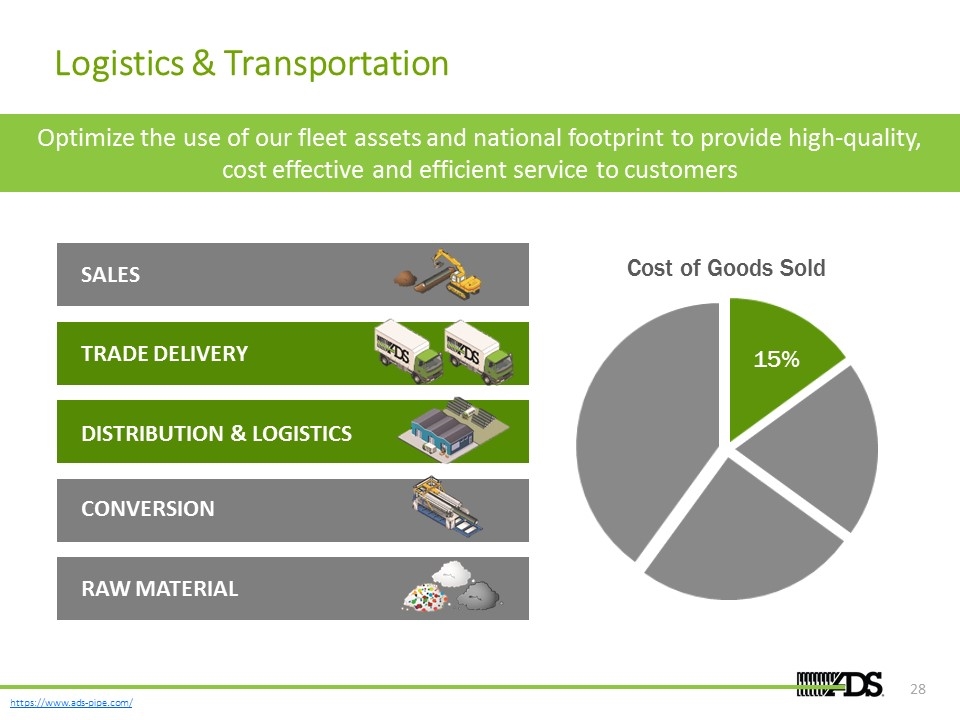
Logistics & Transportation 15% SALES TRADE DELIVERY DISTRIBUTION & LOGISTICS CONVERSION RAW MATERIAL Optimize the use of our fleet assets and national footprint to provide high-quality, cost effective and efficient service to customers
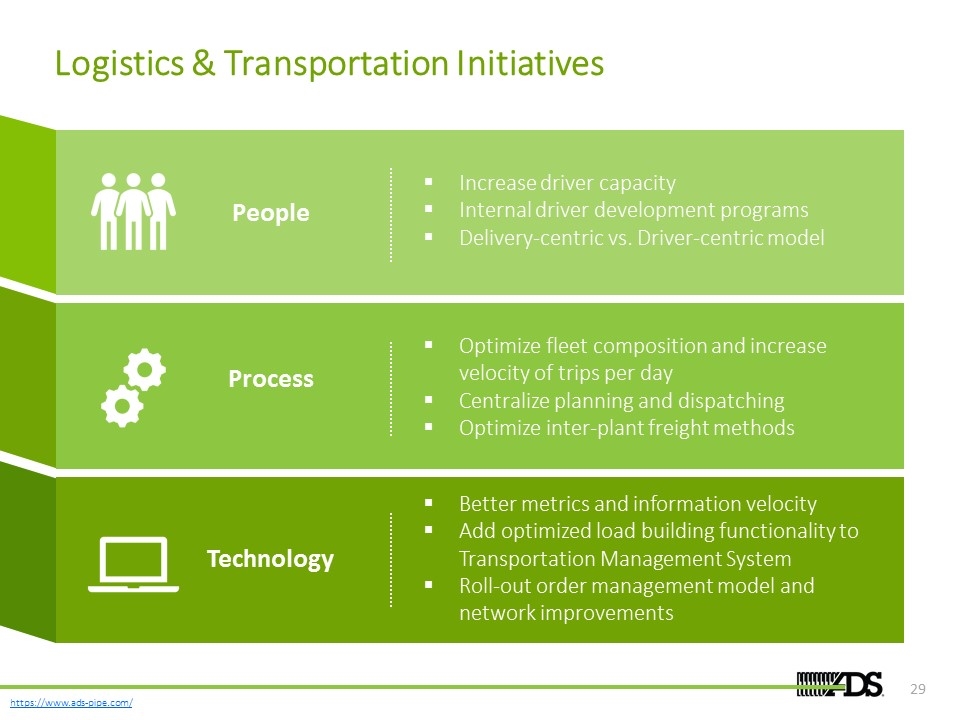
Logistics & Transportation Initiatives People Process Technology Increase driver capacity Internal driver development programs Delivery-centric vs. Driver-centric model Optimize fleet composition and increase velocity of trips per day Centralize planning and dispatching Optimize inter-plant freight methods Better metrics and information velocity Add optimized load building functionality to Transportation Management System Roll-out order management model and network improvements
Financial Overview
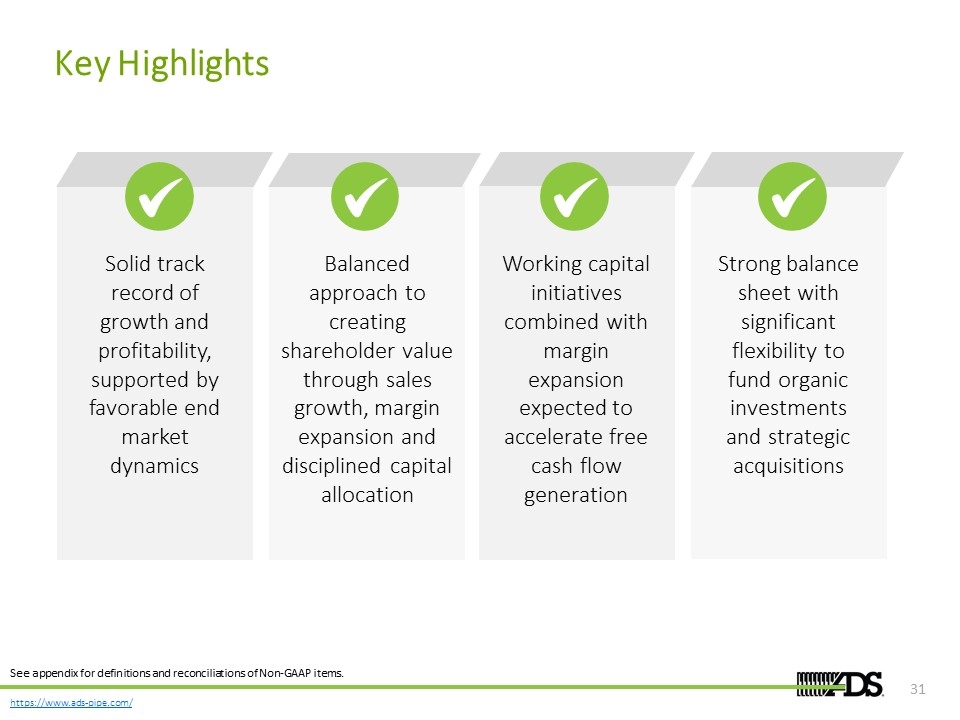
Key Highlights Solid track record of growth and profitability, supported by favorable end market dynamics Balanced approach to creating shareholder value through sales growth, margin expansion and disciplined capital allocation Working capital initiatives combined with margin expansion expected to accelerate free cash flow generation Strong balance sheet with significant flexibility to fund organic investments and strategic acquisitions See appendix for definitions and reconciliations of Non-GAAP items.

Building Shareholder Value Sales Growth Margin Expansion Balanced Approach to Creating Shareholder Value Disciplined Capital Allocation
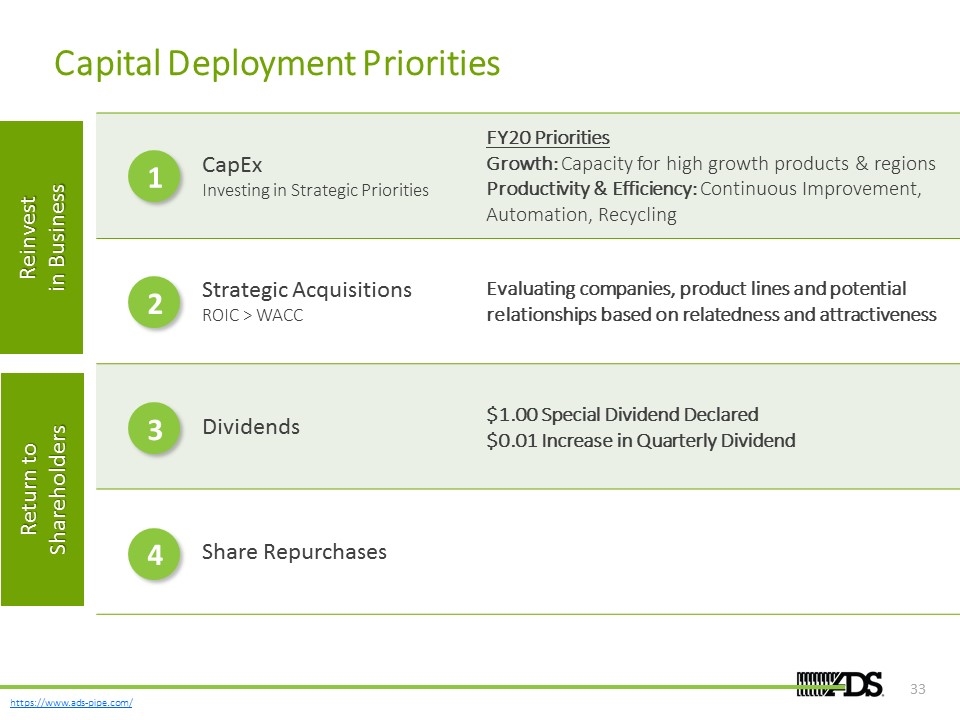
Capital Deployment Priorities CapEx Investing in Strategic Priorities FY20 Priorities Growth: Capacity for high growth products & regions Productivity & Efficiency: Continuous Improvement, Automation, Recycling Strategic Acquisitions ROIC > WACC Evaluating companies, product lines and potential relationships based on relatedness and attractiveness Dividends $1.00 Special Dividend Declared $0.01 Increase in Quarterly Dividend Share Repurchases 1 2 3 4 Reinvest in Business Return to Shareholders
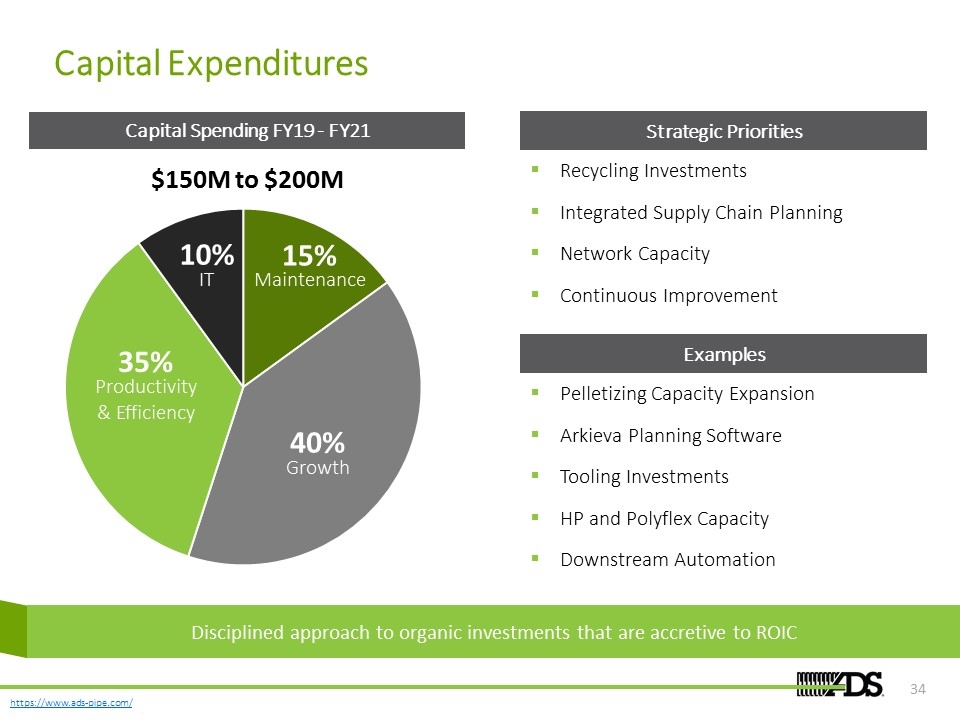
Capital Expenditures Capital Spending FY19 - FY21 Strategic Priorities Examples Recycling Investments Integrated Supply Chain Planning Network Capacity Continuous Improvement Pelletizing Capacity Expansion Arkieva Planning Software Tooling Investments HP and Polyflex Capacity Downstream Automation Disciplined approach to organic investments that are accretive to ROIC Growth 40% Productivity & Efficiency 35% IT 10% Maintenance 15% $150M to $200M
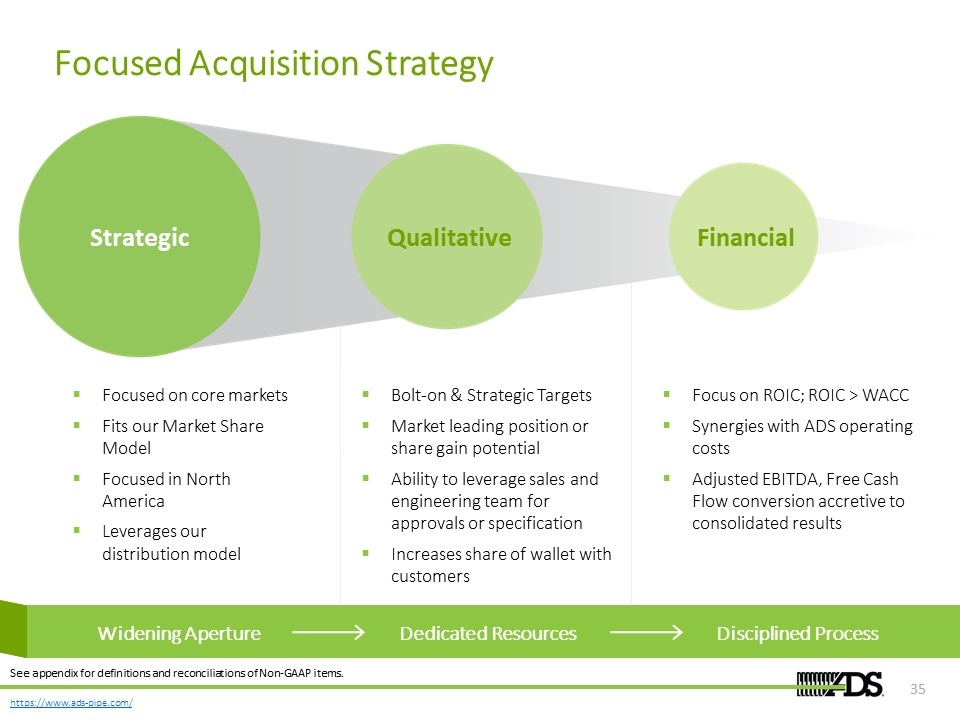
Qualitative Financial Strategic Focused Acquisition Strategy See appendix for definitions and reconciliations of Non-GAAP items. Widening Aperture Dedicated Resources Disciplined Process Focused on core markets Fits our Market Share Model Focused in North America Leverages our distribution model Focus on ROIC; ROIC > WACC Synergies with ADS operating costs Adjusted EBITDA, Free Cash Flow conversion accretive to consolidated results Bolt-on & Strategic Targets Market leading position or share gain potential Ability to leverage sales and engineering team for approvals or specification Increases share of wallet with customers Widening Aperture Dedicated Resources Disciplined Process
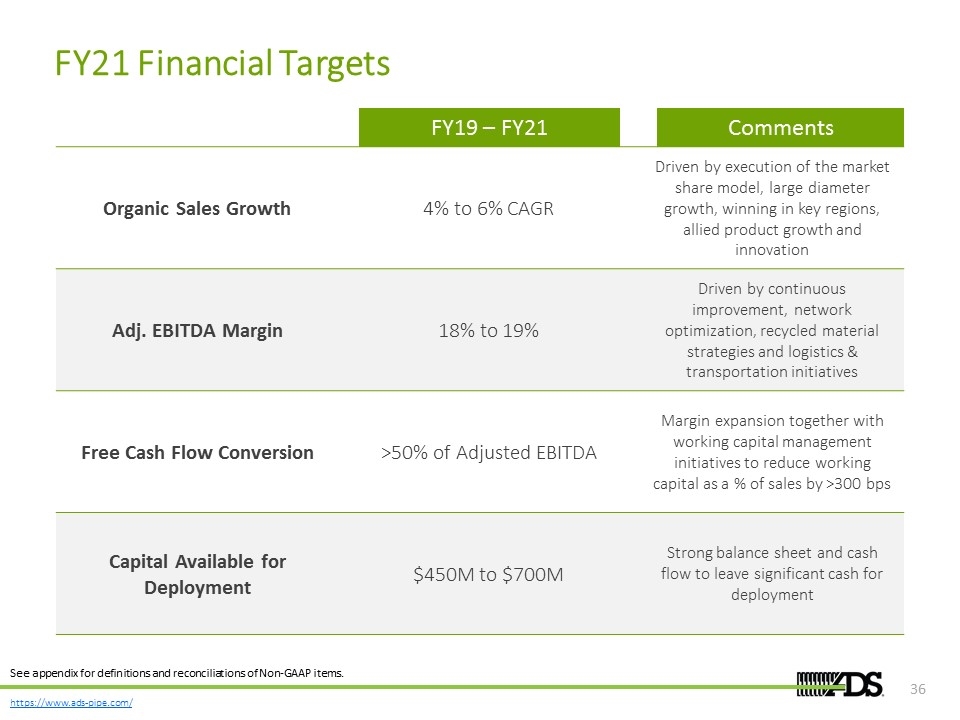
FY21 Financial Targets Organic Sales Growth 4% to 6% CAGR Driven by execution of the market share model, large diameter growth, winning in key regions, allied product growth and innovation Adj. EBITDA Margin 18% to 19% Driven by continuous improvement, network optimization, recycled material strategies and logistics & transportation initiatives Free Cash Flow Conversion >50% of Adjusted EBITDA Margin expansion together with working capital management initiatives to reduce working capital as a % of sales by >300 bps Capital Available for Deployment $450M to $700M Strong balance sheet and cash flow to leave significant cash for deployment FY19 – FY21 Comments See appendix for definitions and reconciliations of Non-GAAP items.
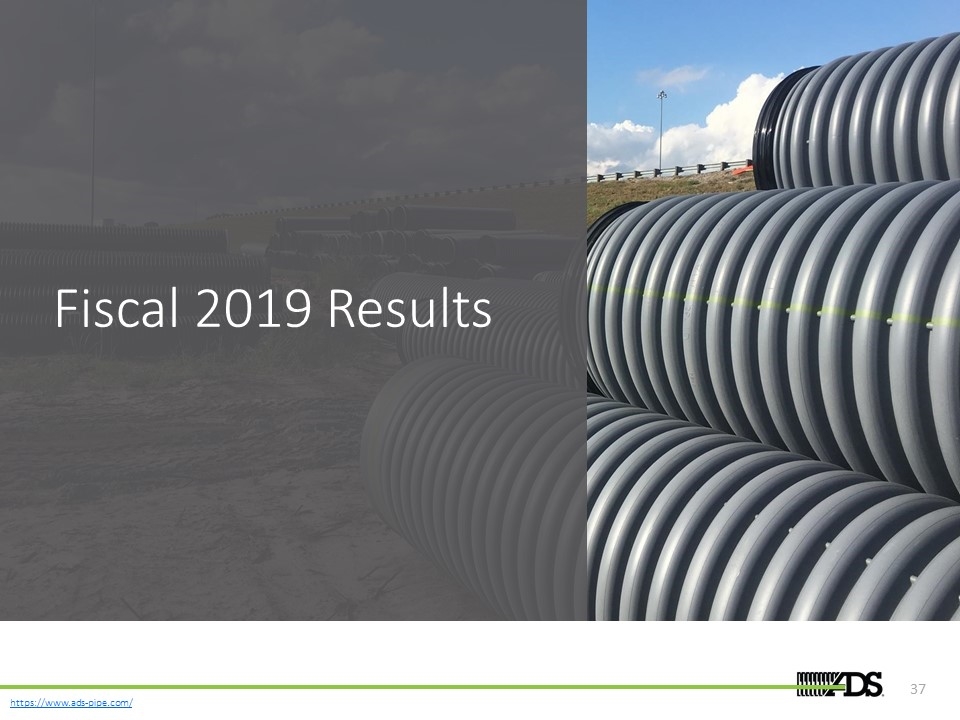
Fiscal 2019 Results
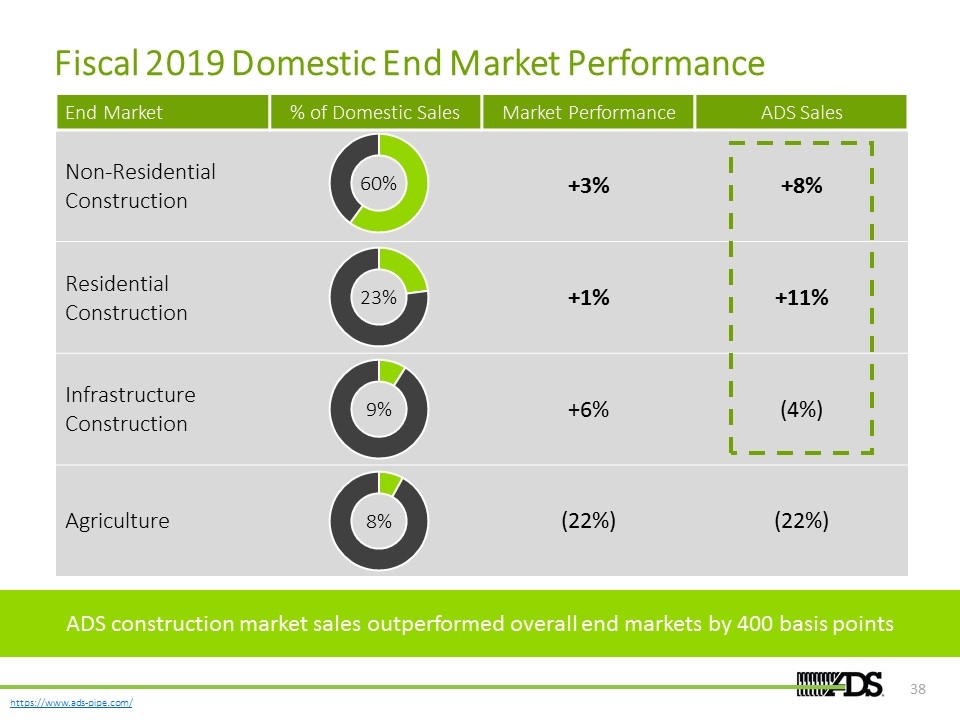
Fiscal 2019 Domestic End Market Performance End Market % of Domestic Sales Market Performance ADS Sales Non-Residential Construction +3% +8% Residential Construction +1% +11% Infrastructure Construction +6% (4%) Agriculture (22%) (22%) 60% 23% 9% 8% ADS construction market sales outperformed overall end markets by 400 basis points
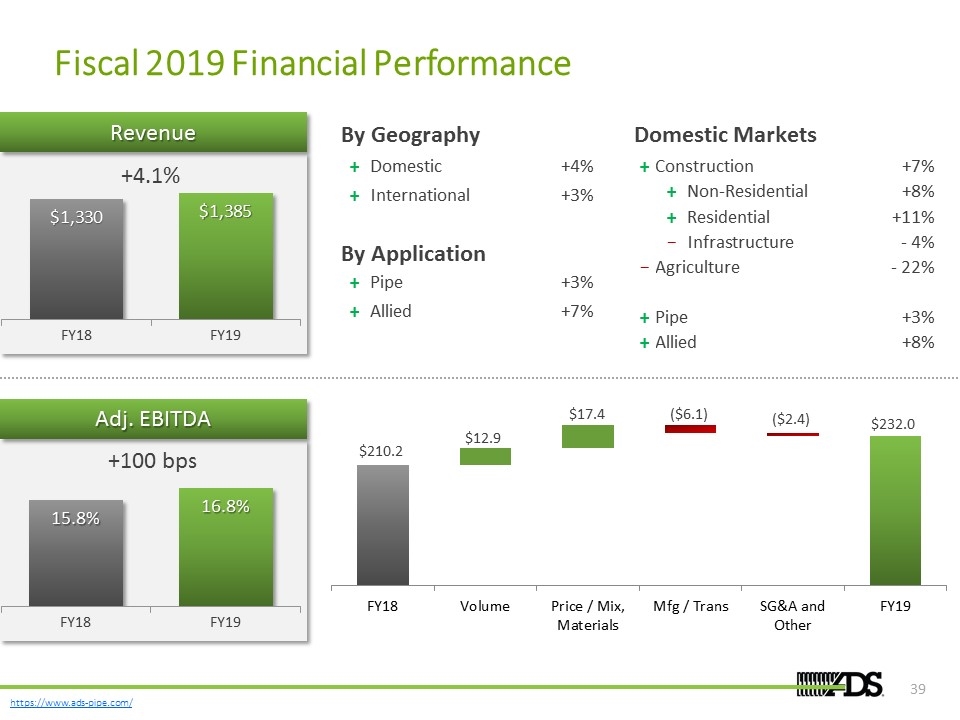
Fiscal 2019 Financial Performance +100 bps (USD, in millions) +4.1% Domestic Markets + Construction +7% + Non-Residential +8% + Residential +11% − Infrastructure - 4% − Agriculture - 22% + Pipe +3% + Allied +8% By Geography + Domestic +4% + International +3% By Application + Pipe +3% + Allied +7% $210.2 $12.9 $17.4 ($6.1) ($2.4) $232.0 Revenue Adj. EBITDA
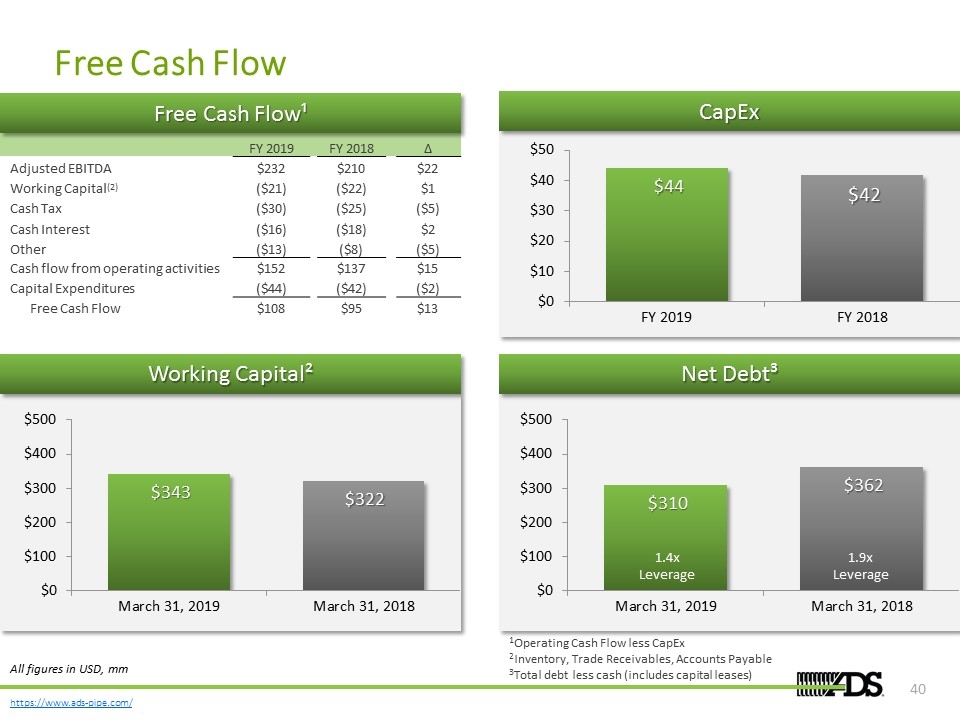
Free Cash Flow % of Sales 2.7% 3.5% All figures in USD, mm Net Debt³ 1Operating Cash Flow less CapEx 2Inventory, Trade Receivables, Accounts Payable 3Total debt less cash (includes capital leases) 1.4x Leverage 1.9x Leverage CapEx Working Capital² FY 2019 FY 2018 ∆ Adjusted EBITDA $232 $210 $22 Working Capital(2) ($21) ($22) $1 Cash Tax ($30) ($25) ($5) Cash Interest ($16) ($18) $2 Other ($13) ($8) ($5) Cash flow from operating activities $152 $137 $15 Capital Expenditures ($44) ($42) ($2) Free Cash Flow $108 $95 $13 Free Cash Flow¹
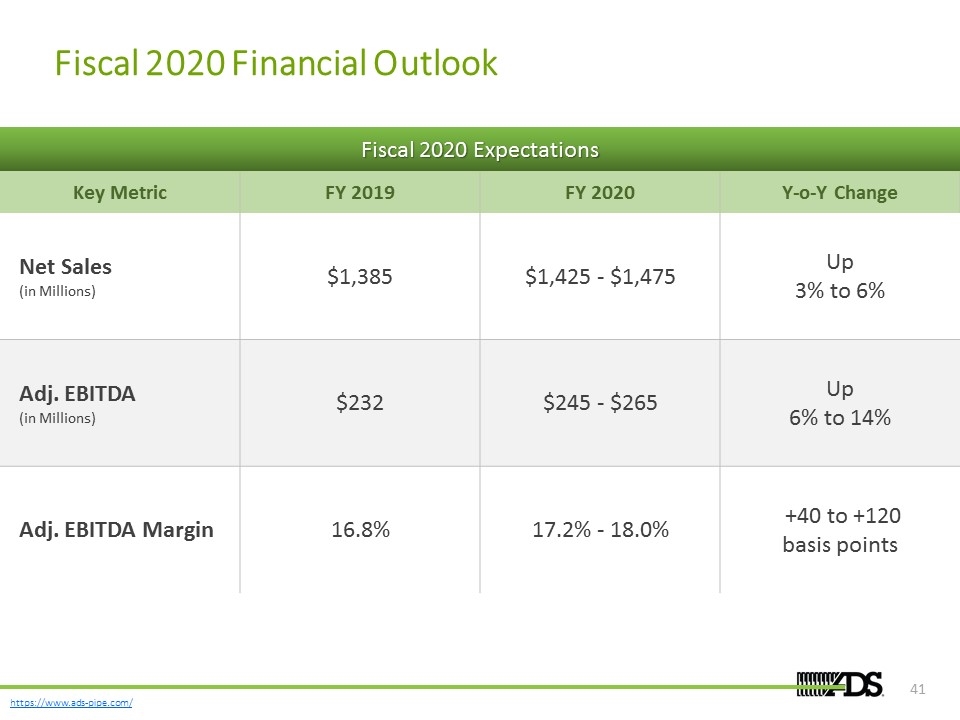
Fiscal 2020 Financial Outlook Key Metric FY 2019 FY 2020 Y-o-Y Change Net Sales (in Millions) $1,385 $1,425 - $1,475 Up 3% to 6% Adj. EBITDA (in Millions) $232 $245 - $265 Up 6% to 14% Adj. EBITDA Margin 16.8% 17.2% - 18.0% +40 to +120 basis points Fiscal 2020 Expectations
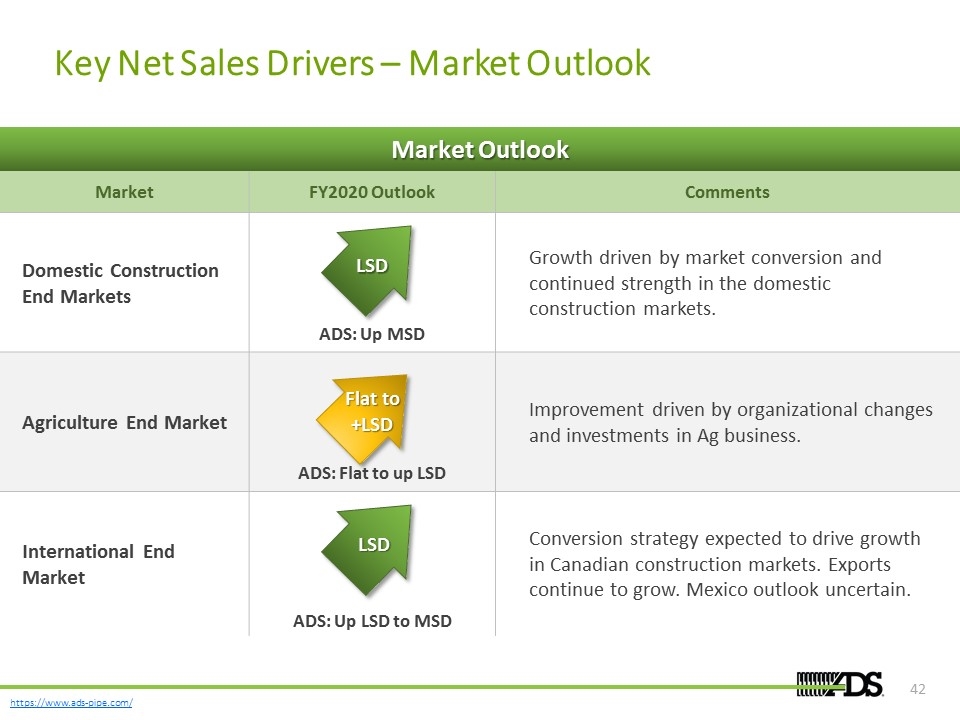
Key Net Sales Drivers – Market Outlook Market FY2020 Outlook Comments Domestic Construction End Markets Growth driven by market conversion and continued strength in the domestic construction markets. Agriculture End Market Improvement driven by organizational changes and investments in Ag business. International End Market Conversion strategy expected to drive growth in Canadian construction markets. Exports continue to grow. Mexico outlook uncertain. LSD Flat to +LSD LSD ADS: Up MSD ADS: Flat to up LSD ADS: Up LSD to MSD Market Outlook
Appendix
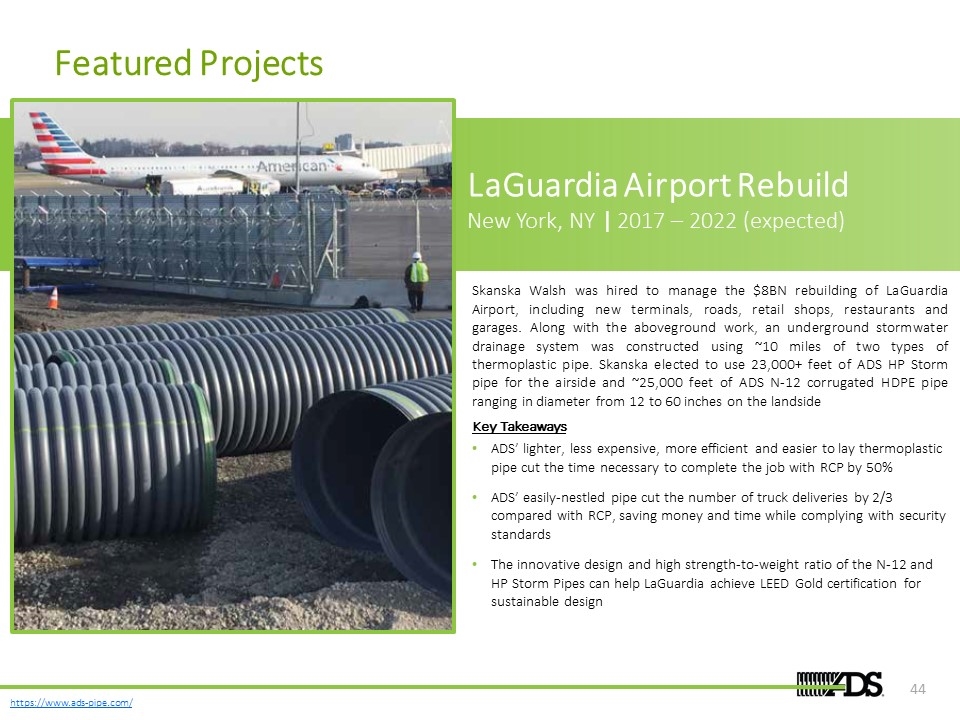
Featured Projects Skanska Walsh was hired to manage the $8BN rebuilding of LaGuardia Airport, including new terminals, roads, retail shops, restaurants and garages. Along with the aboveground work, an underground stormwater drainage system was constructed using ~10 miles of two types of thermoplastic pipe. Skanska elected to use 23,000+ feet of ADS HP Storm pipe for the airside and ~25,000 feet of ADS N-12 corrugated HDPE pipe ranging in diameter from 12 to 60 inches on the landside Key Takeaways ADS’ lighter, less expensive, more efficient and easier to lay thermoplastic pipe cut the time necessary to complete the job with RCP by 50% ADS’ easily-nestled pipe cut the number of truck deliveries by 2/3 compared with RCP, saving money and time while complying with security standards The innovative design and high strength-to-weight ratio of the N-12 and HP Storm Pipes can help LaGuardia achieve LEED Gold certification for sustainable design LaGuardia Airport Rebuild New York, NY | 2017 – 2022 (expected)
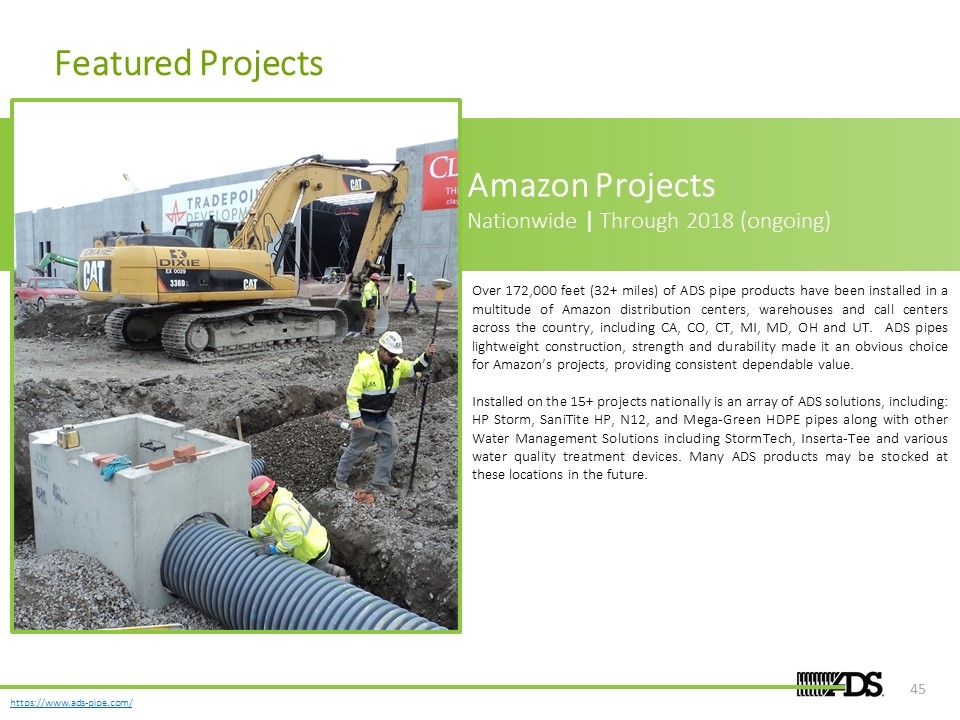
Featured Projects Over 172,000 feet (32+ miles) of ADS pipe products have been installed in a multitude of Amazon distribution centers, warehouses and call centers across the country, including CA, CO, CT, MI, MD, OH and UT. ADS pipes lightweight construction, strength and durability made it an obvious choice for Amazon’s projects, providing consistent dependable value. Installed on the 15+ projects nationally is an array of ADS solutions, including: HP Storm, SaniTite HP, N12, and Mega-Green HDPE pipes along with other Water Management Solutions including StormTech, Inserta-Tee and various water quality treatment devices. Many ADS products may be stocked at these locations in the future. Amazon Projects Nationwide | Through 2018 (ongoing)
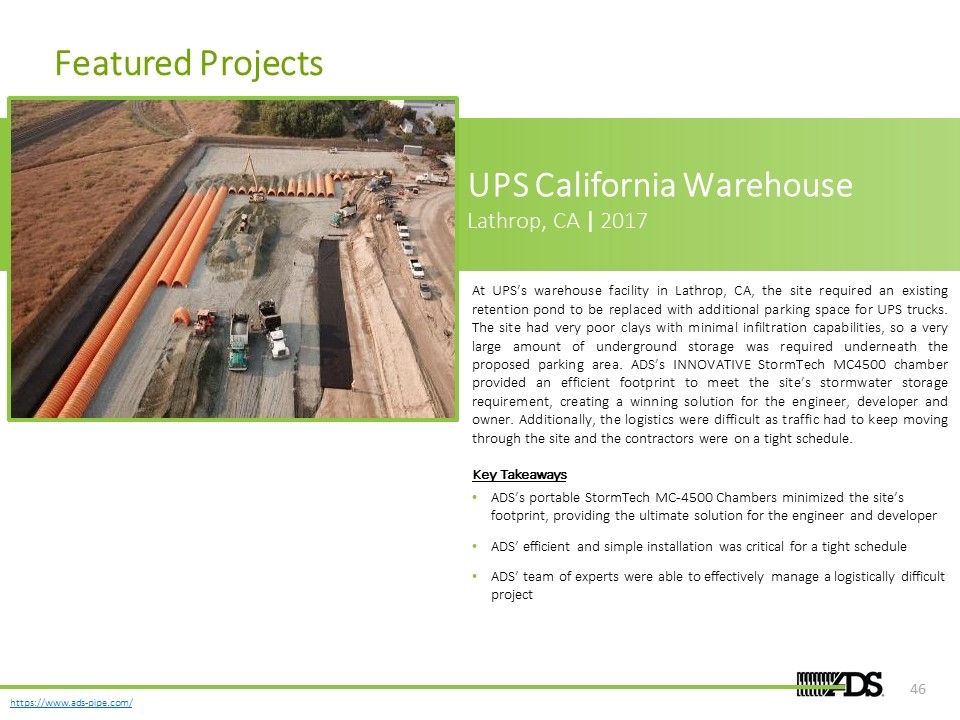
Featured Projects At UPS’s warehouse facility in Lathrop, CA, the site required an existing retention pond to be replaced with additional parking space for UPS trucks. The site had very poor clays with minimal infiltration capabilities, so a very large amount of underground storage was required underneath the proposed parking area. ADS’s INNOVATIVE StormTech MC4500 chamber provided an efficient footprint to meet the site’s stormwater storage requirement, creating a winning solution for the engineer, developer and owner. Additionally, the logistics were difficult as traffic had to keep moving through the site and the contractors were on a tight schedule. Key Takeaways ADS’s portable StormTech MC-4500 Chambers minimized the site’s footprint, providing the ultimate solution for the engineer and developer ADS’ efficient and simple installation was critical for a tight schedule ADS’ team of experts were able to effectively manage a logistically difficult project UPS California Warehouse Lathrop, CA | 2017
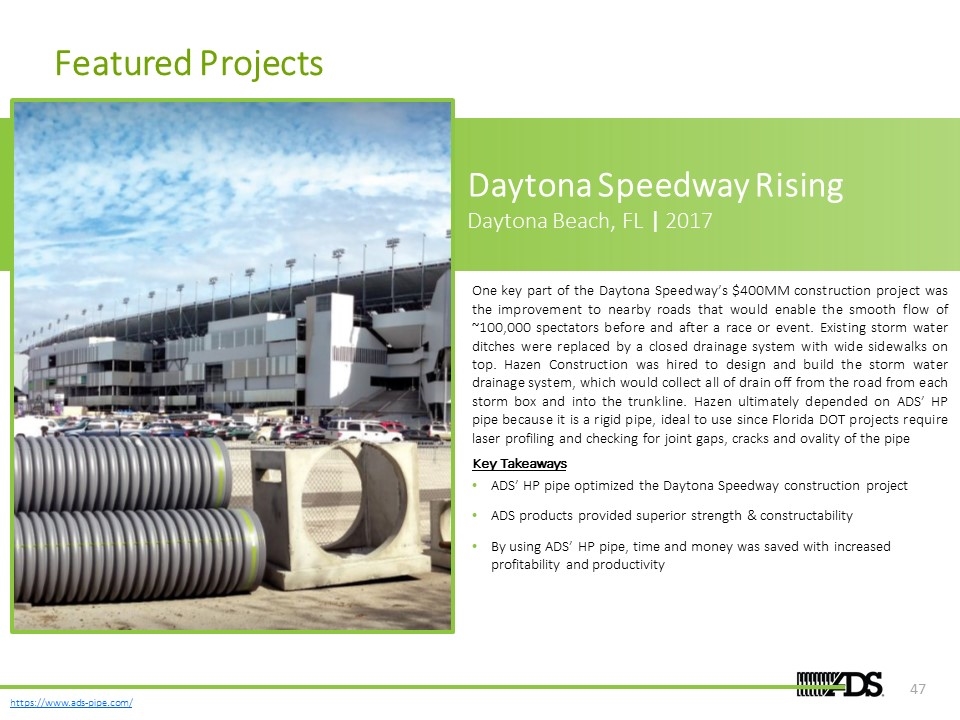
Featured Projects One key part of the Daytona Speedway’s $400MM construction project was the improvement to nearby roads that would enable the smooth flow of ~100,000 spectators before and after a race or event. Existing storm water ditches were replaced by a closed drainage system with wide sidewalks on top. Hazen Construction was hired to design and build the storm water drainage system, which would collect all of drain off from the road from each storm box and into the trunkline. Hazen ultimately depended on ADS’ HP pipe because it is a rigid pipe, ideal to use since Florida DOT projects require laser profiling and checking for joint gaps, cracks and ovality of the pipe Key Takeaways ADS’ HP pipe optimized the Daytona Speedway construction project ADS products provided superior strength & constructability By using ADS’ HP pipe, time and money was saved with increased profitability and productivity Daytona Speedway Rising Daytona Beach, FL | 2017
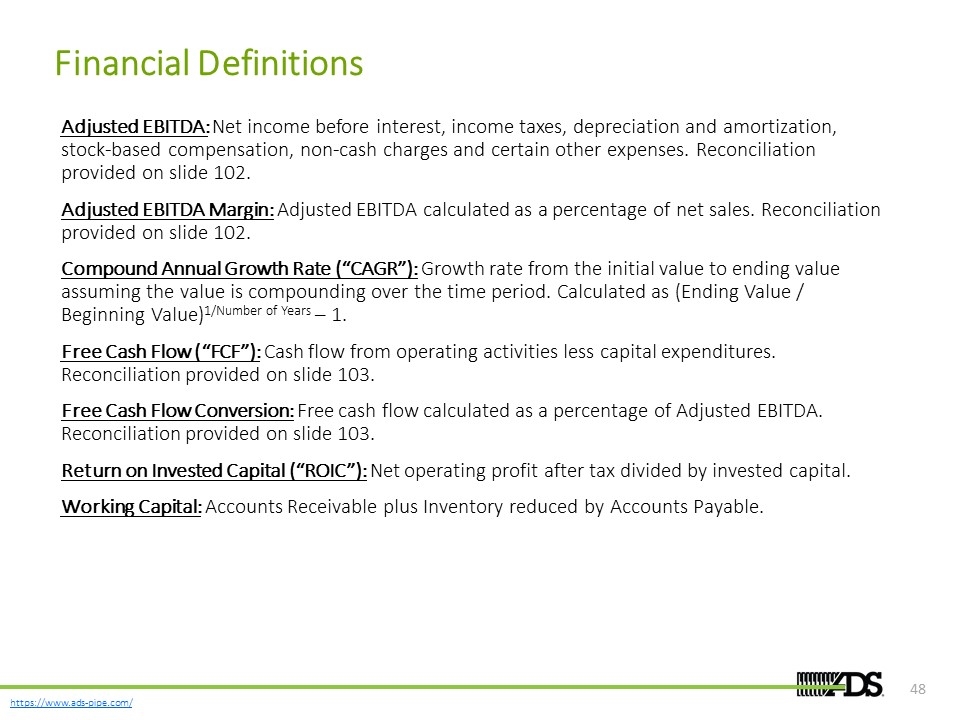
Financial Definitions Adjusted EBITDA: Net income before interest, income taxes, depreciation and amortization, stock-based compensation, non-cash charges and certain other expenses. Reconciliation provided on slide 102. Adjusted EBITDA Margin: Adjusted EBITDA calculated as a percentage of net sales. Reconciliation provided on slide 102. Compound Annual Growth Rate (“CAGR”): Growth rate from the initial value to ending value assuming the value is compounding over the time period. Calculated as (Ending Value / Beginning Value)1/Number of Years – 1. Free Cash Flow (“FCF”): Cash flow from operating activities less capital expenditures. Reconciliation provided on slide 103. Free Cash Flow Conversion: Free cash flow calculated as a percentage of Adjusted EBITDA. Reconciliation provided on slide 103. Return on Invested Capital (“ROIC”): Net operating profit after tax divided by invested capital. Working Capital: Accounts Receivable plus Inventory reduced by Accounts Payable.
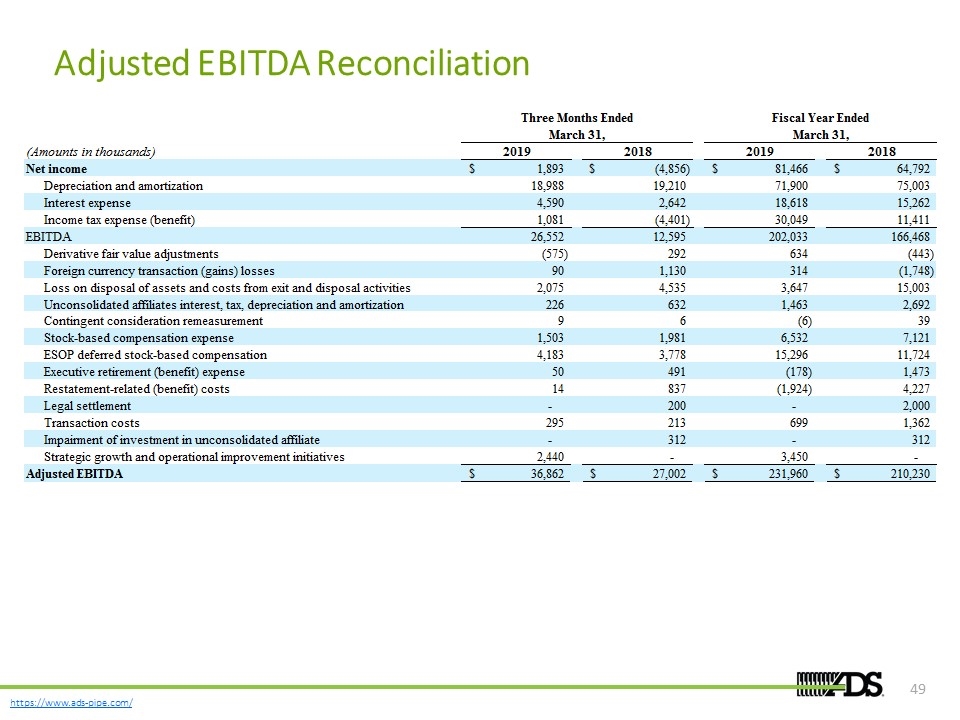
Adjusted EBITDA Reconciliation Three Months Ended Fiscal Year Ended March 31, March 31, (Amounts in thousands) 2019 2018 2019 2018 Net income $1,893 $-4,856 $81,466 $64,792 Depreciation and amortization 18,988 19,210 71,900 75,003 Interest expense 4,590 2,642 18,618 15,262 Income tax expense (benefit) 1,081 -4,401 30,049 11,411 EBITDA 26,552 12,595 ,202,033 ,166,468 Derivative fair value adjustments -,575 292 634 -,443 Foreign currency transaction (gains) losses 90 1,130 314 -1,748 Loss on disposal of assets and costs from exit and disposal activities 2,075 4,535 3,647 15,003 Unconsolidated affiliates interest, tax, depreciation and amortization 226 632 1,463 2,692 Contingent consideration remeasurement 9 6 -6 39 Stock-based compensation expense 1,503 1,981 6,532 7,121 ESOP deferred stock-based compensation 4,183 3,778 15,296 11,724 Executive retirement (benefit) expense 50 491 -,178 1,473 Restatement-related (benefit) costs 14 837 -1,924 4,227 Legal settlement 0 200 0 2,000 Transaction costs 295 213 699 1,362 Impairment of investment in unconsolidated affiliate 0 312 0 312 Strategic growth and operational improvement initiatives 2,440 0 3,450 0 Adjusted EBITDA $36,862 $27,002 $,231,960 $,210,230


