Q4 Fiscal 2022 Financial Results May 19, 2022
Management Presenters 2 Scott Barbour President and Chief Executive Officer Scott Cottrill Executive Vice President, Chief Financial Officer Mike Higgins Vice President, Corporate Strategy & Investor Relations

Forward Looking Statements and Non-GAAP Financial Metrics 3 Certain statements in this press release may be deemed to be forward-looking statements. These statements are not historical facts but rather are based on the Company’s current expectations, estimates and projections regarding the Company’s business, operations and other factors relating thereto. Words such as “may,” “will,” “could,” “would,” “should,” “anticipate,” “predict,” “potential,” “continue,” “expects,” “intends,” “plans,” “projects,” “believes,” “estimates,” “confident” and similar expressions are used to identify these forward-looking statements. Factors that could cause actual results to differ from those reflected in forward-looking statements relating to our operations and business include: fluctuations in the price and availability of resins and other raw materials and our ability to pass any increased costs of raw materials on to our customers in a timely manner; volatility in general business and economic conditions in the markets in which we operate, including the adverse impact on the U.S. and global economy of the COVID-19 global pandemic, and the impact of COVID-19 in the near, medium and long- term on our business, results of operations, financial position, liquidity or cash flows, and other limitation factors relating to availability of credit, interest rates, fluctuations in capital and business and consumer confidence; cyclicality and seasonality of the non-residential and residential construction markets and infrastructure spending; the risks of increasing competition in our existing and future markets, including competition from both manufacturers of high performance thermoplastic corrugated pipe and manufacturers of products using alternative materials, and our ability to continue to convert current demand for concrete, steel and PVC pipe products into demand for our high performance thermoplastic corrugated pipe and Allied Products; uncertainties surrounding the integration and realization of anticipated benefits of acquisitions and similar transactions, including Infiltrator Water Technologies; the effect of weather or seasonality; the loss of any of our significant customers; the risks of doing business internationally; the risks of conducting a portion of our operations through joint ventures; our ability to expand into new geographic or product markets, including risks associated with new markets and products associated with our recent acquisition of Infiltrator Water Technologies; our ability to achieve the acquisition component of our growth strategy; the risk associated with manufacturing processes; our ability to manage our assets; the risks associated with our product warranties; our ability to manage our supply purchasing and customer credit policies; our ability to control labor costs and to attract, train and retain highly-qualified employees and key personnel; our ability to protect our intellectual property rights; changes in laws and regulations, including environmental laws and regulations; the risks associated with our current levels of indebtedness, including borrowings under our existing credit agreement and outstanding indebtedness under our existing senior notes; fluctuations in our effective tax rate, including from the Tax Cuts and Jobs Act of 2017; our ability to meet future capital requirements and fund our liquidity needs; and other risks and uncertainties described in the Company’s filings with the SEC. New risks and uncertainties emerge from time to time and it is not possible for the Company to predict all risks and uncertainties that could have an impact on the forward-looking statements contained in this press release. In light of the significant uncertainties inherent in the forward-looking information included herein, the inclusion of such information should not be regarded as a representation by the Company or any other person that the Company’s expectations, objectives or plans will be achieved in the timeframe anticipated or at all. Investors are cautioned not to place undue reliance on the Company’s forward-looking statements and the Company undertakes no obligation to publicly update or revise any forward-looking statements, whether as a result of new information, future events or otherwise, except as required by law.
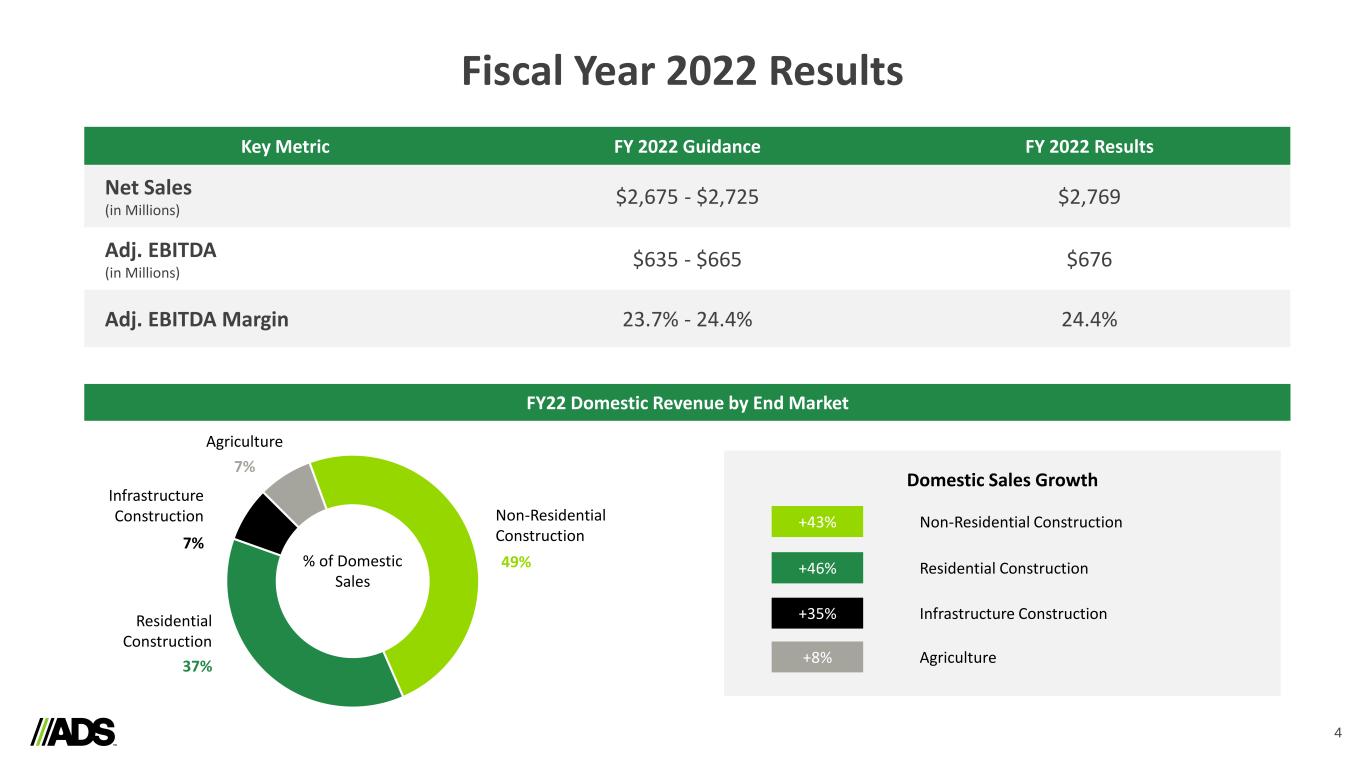
Fiscal Year 2022 Results 4 Key Metric FY 2022 Guidance FY 2022 Results Net Sales (in Millions) $2,675 - $2,725 $2,769 Adj. EBITDA (in Millions) $635 - $665 $676 Adj. EBITDA Margin 23.7% - 24.4% 24.4% FY22 Domestic Revenue by End Market Non-Residential Construction Residential Construction Infrastructure Construction Agriculture Domestic Sales Growth +43% Non-Residential Construction +46% Residential Construction +35% Infrastructure Construction +8% Agriculture 49% 37% 7% 7% % of Domestic Sales
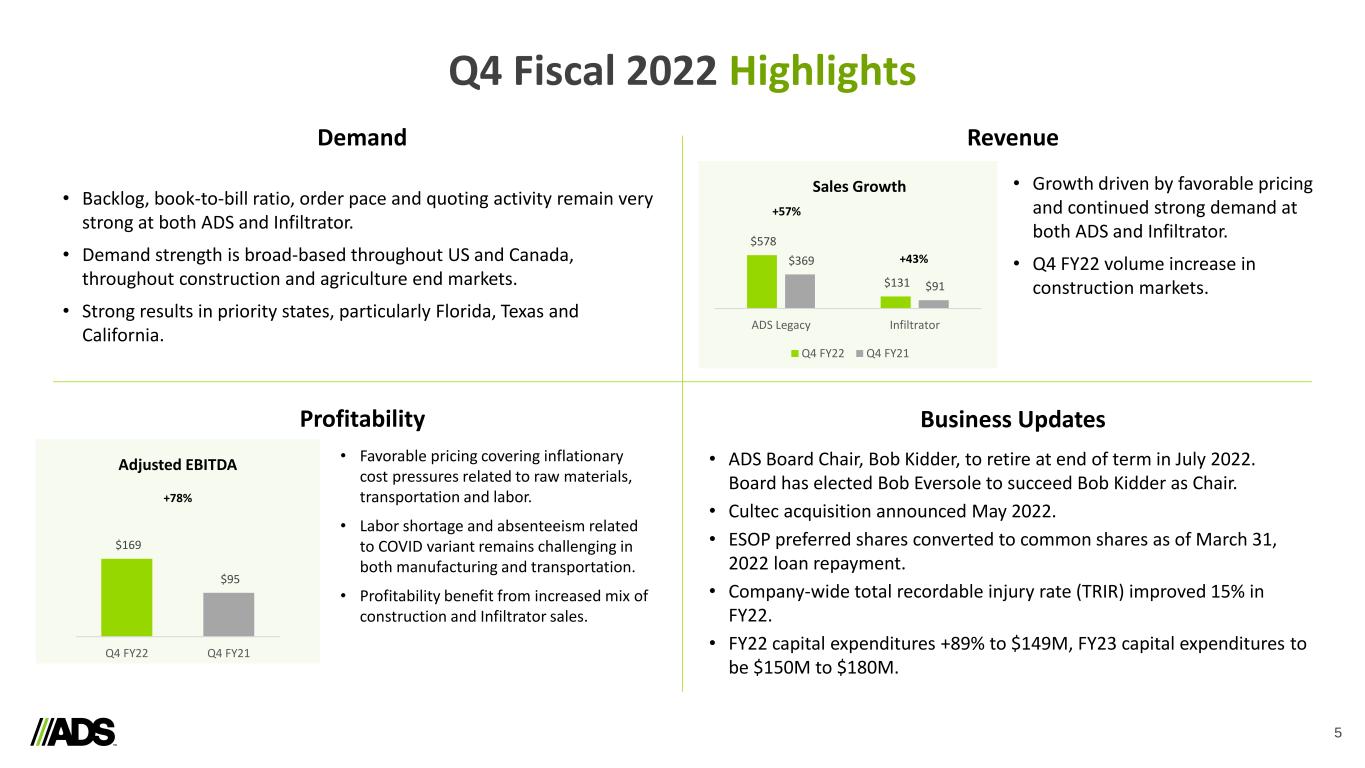
Q4 Fiscal 2022 Highlights 5 $578 $131 $369 $91 ADS Legacy Infiltrator Q4 FY22 Q4 FY21 Sales Growth +57% +43% Demand • Growth driven by favorable pricing and continued strong demand at both ADS and Infiltrator. • Q4 FY22 volume increase in construction markets. Revenue Business UpdatesProfitability $169 $95 Q4 FY22 Q4 FY21 Adjusted EBITDA +78% • Favorable pricing covering inflationary cost pressures related to raw materials, transportation and labor. • Labor shortage and absenteeism related to COVID variant remains challenging in both manufacturing and transportation. • Profitability benefit from increased mix of construction and Infiltrator sales. • Backlog, book-to-bill ratio, order pace and quoting activity remain very strong at both ADS and Infiltrator. • Demand strength is broad-based throughout US and Canada, throughout construction and agriculture end markets. • Strong results in priority states, particularly Florida, Texas and California. • ADS Board Chair, Bob Kidder, to retire at end of term in July 2022. Board has elected Bob Eversole to succeed Bob Kidder as Chair. • Cultec acquisition announced May 2022. • ESOP preferred shares converted to common shares as of March 31, 2022 loan repayment. • Company-wide total recordable injury rate (TRIR) improved 15% in FY22. • FY22 capital expenditures +89% to $149M, FY23 capital expenditures to be $150M to $180M.
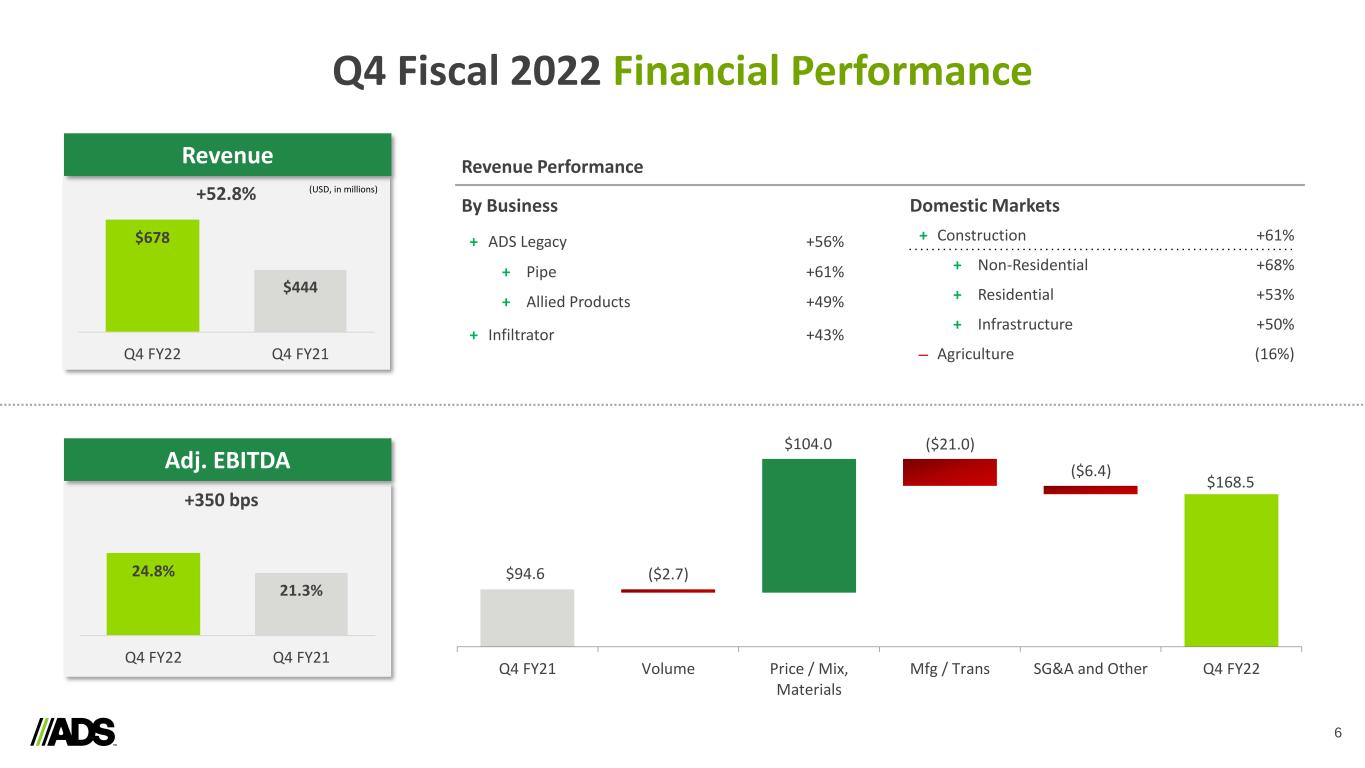
Q4 Fiscal 2022 Financial Performance 6 24.8% 21.3% Q4 FY22 Q4 FY21 $678 $444 Q4 FY22 Q4 FY21 +350 bps (USD, in millions)+52.8% Domestic Markets + Construction +61% + Non-Residential +68% + Residential +53% + Infrastructure +50% ‒ Agriculture (16%) Revenue Performance By Business + ADS Legacy +56% + Pipe +61% + Allied Products +49% + Infiltrator +43% Q4 FY21 Volume Price / Mix, Materials Mfg / Trans SG&A and Other Q4 FY22 $94.6 ($2.7) $104.0 ($6.4) $168.5 Revenue Adj. EBITDA ($21.0)
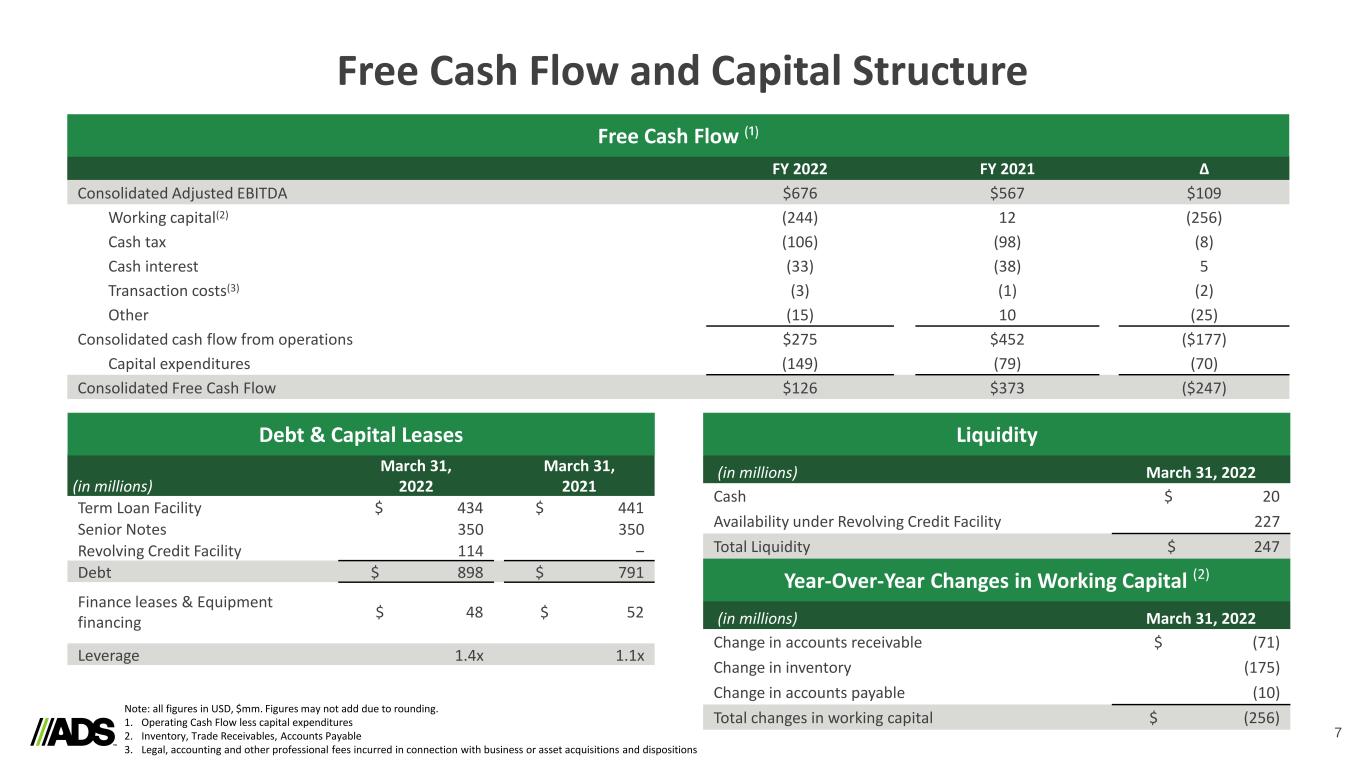
Free Cash Flow and Capital Structure 7 FY 2022 FY 2021 ∆ Consolidated Adjusted EBITDA $676 $567 $109 Working capital(2) (244) 12 (256) Cash tax (106) (98) (8) Cash interest (33) (38) 5 Transaction costs(3) (3) (1) (2) Other (15) 10 (25) Consolidated cash flow from operations $275 $452 ($177) Capital expenditures (149) (79) (70) Consolidated Free Cash Flow $126 $373 ($247) Free Cash Flow (¹) Note: all figures in USD, $mm. Figures may not add due to rounding. 1. Operating Cash Flow less capital expenditures 2. Inventory, Trade Receivables, Accounts Payable 3. Legal, accounting and other professional fees incurred in connection with business or asset acquisitions and dispositions (in millions) March 31, 2022 March 31, 2021 Term Loan Facility $ 434 $ 441 Senior Notes 350 350 Revolving Credit Facility 114 ‒ Debt $ 898 $ 791 Finance leases & Equipment financing $ 48 $ 52 Leverage 1.4x 1.1x Debt & Capital Leases (in millions) March 31, 2022 Cash $ 20 Availability under Revolving Credit Facility 227 Total Liquidity $ 247 Liquidity (in millions) March 31, 2022 Change in accounts receivable $ (71) Change in inventory (175) Change in accounts payable (10) Total changes in working capital $ (256) Year-Over-Year Changes in Working Capital (2)
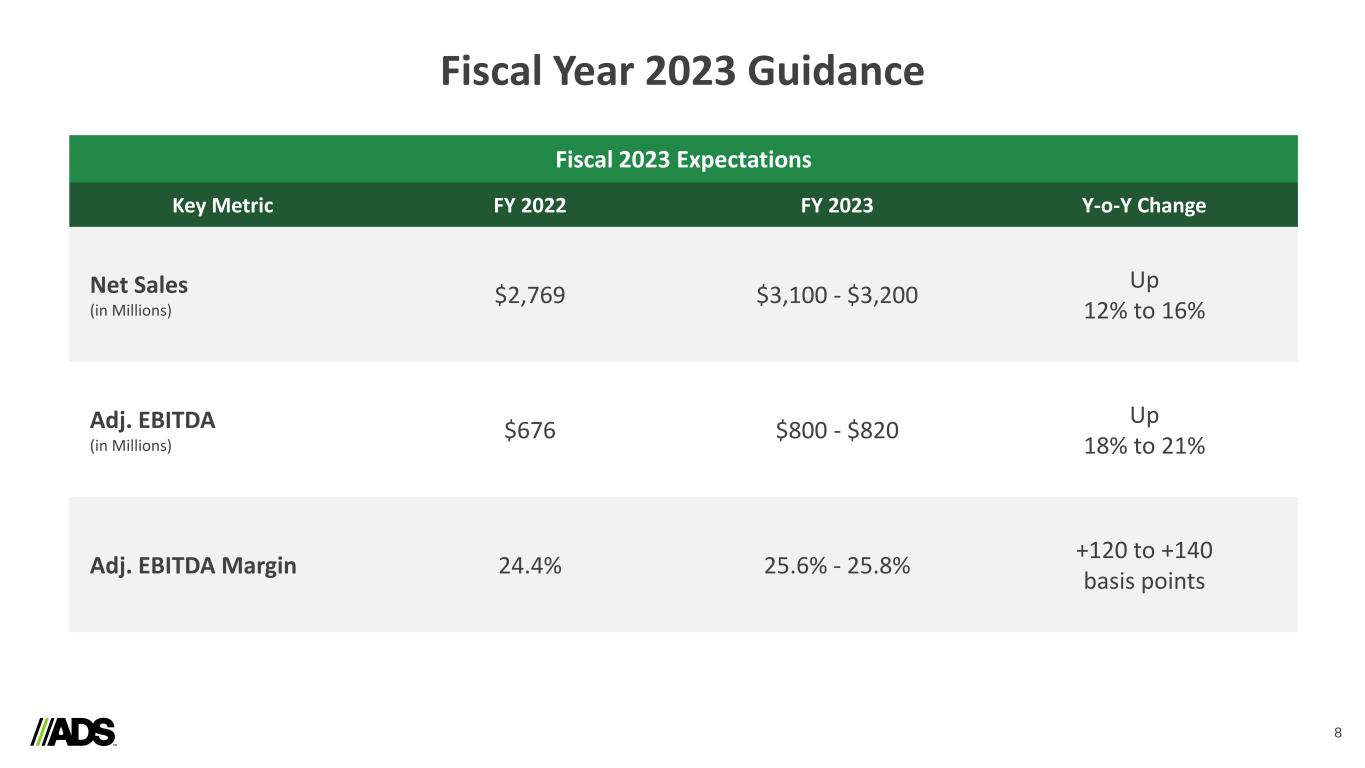
Fiscal Year 2023 Guidance 8 Key Metric FY 2022 FY 2023 Y-o-Y Change Net Sales (in Millions) $2,769 $3,100 - $3,200 Up 12% to 16% Adj. EBITDA (in Millions) $676 $800 - $820 Up 18% to 21% Adj. EBITDA Margin 24.4% 25.6% - 25.8% +120 to +140 basis points Fiscal 2023 Expectations

Q&A

Appendix 10
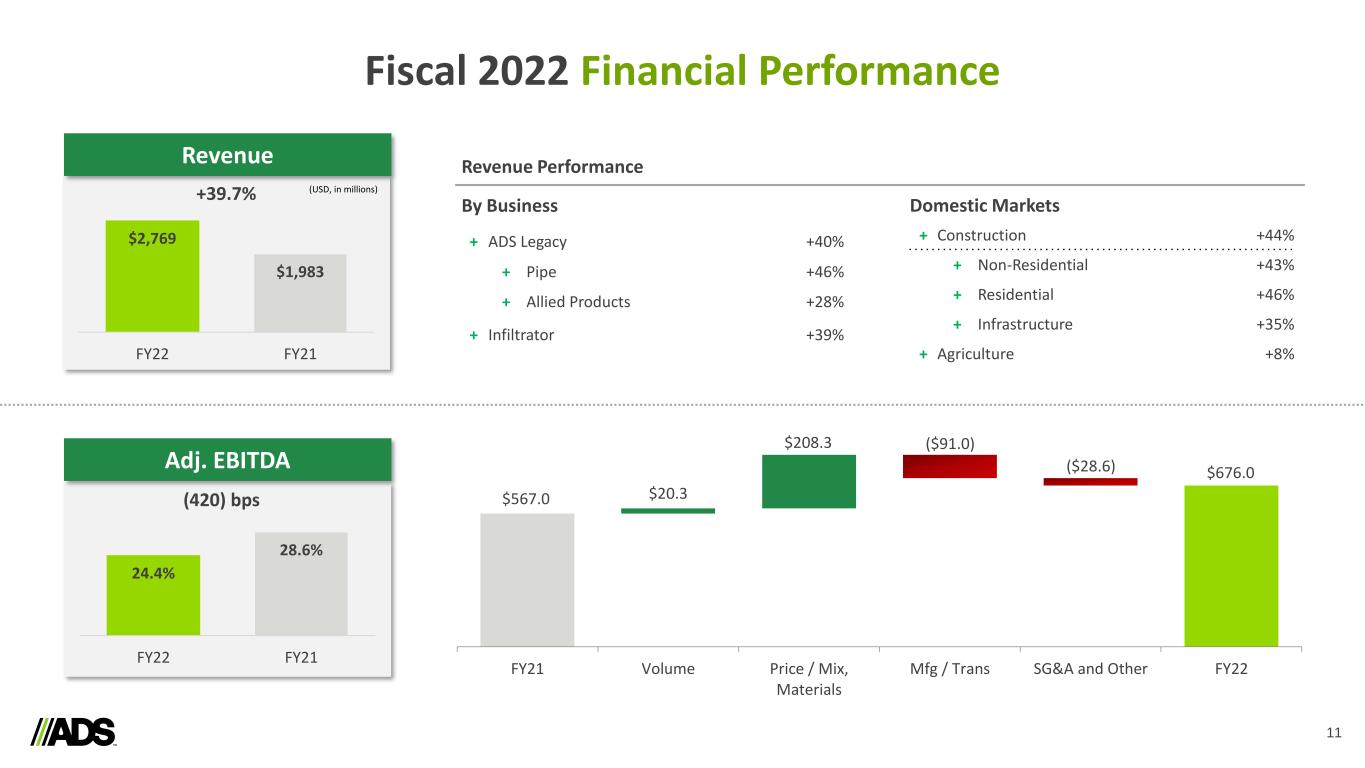
Fiscal 2022 Financial Performance 11 24.4% 28.6% FY22 FY21 $2,769 $1,983 FY22 FY21 (420) bps (USD, in millions)+39.7% Domestic Markets + Construction +44% + Non-Residential +43% + Residential +46% + Infrastructure +35% + Agriculture +8% Revenue Performance By Business + ADS Legacy +40% + Pipe +46% + Allied Products +28% + Infiltrator +39% FY21 Volume Price / Mix, Materials Mfg / Trans SG&A and Other FY22 $567.0 $20.3 $208.3 ($28.6) $676.0 Revenue Adj. EBITDA ($91.0)
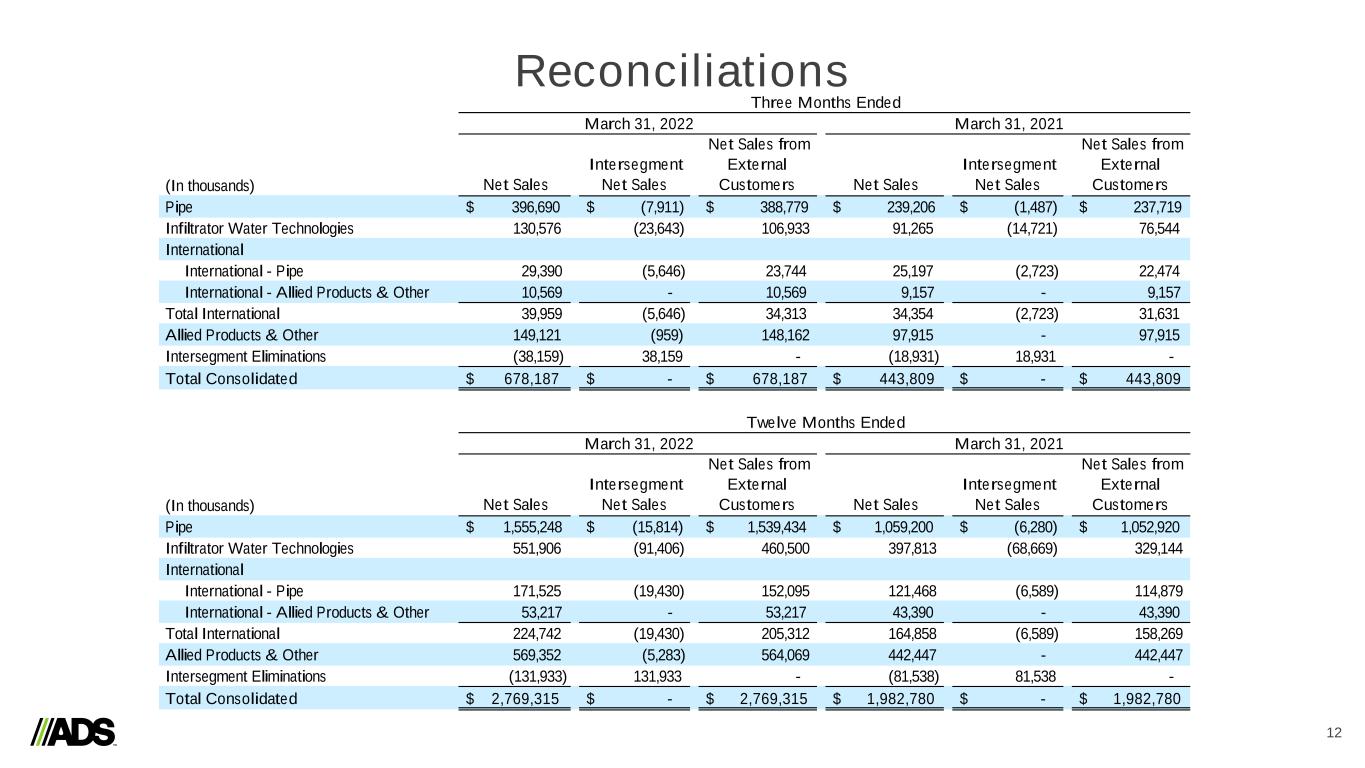
Reconciliations 12 (In thousands) Net Sales Intersegment Net Sales Net Sales from External Customers Net Sales Intersegment Net Sales Net Sales from External Customers Pipe $ 396,690 $ (7,911) $ 388,779 $ 239,206 $ (1,487) $ 237,719 Infiltrator Water Technologies 130,576 (23,643) 106,933 91,265 (14,721) 76,544 International International - Pipe 29,390 (5,646) 23,744 25,197 (2,723) 22,474 International - Allied Products & Other 10,569 - 10,569 9,157 - 9,157 Total International 39,959 (5,646) 34,313 34,354 (2,723) 31,631 Allied Products & Other 149,121 (959) 148,162 97,915 - 97,915 Intersegment Eliminations (38,159) 38,159 - (18,931) 18,931 - Total Consolidated $ 678,187 $ - $ 678,187 $ 443,809 $ - $ 443,809 (In thousands) Net Sales Intersegment Net Sales Net Sales from External Customers Net Sales Intersegment Net Sales Net Sales from External Customers Pipe $ 1,555,248 $ (15,814) $ 1,539,434 $ 1,059,200 $ (6,280) $ 1,052,920 Infiltrator Water Technologies 551,906 (91,406) 460,500 397,813 (68,669) 329,144 International International - Pipe 171,525 (19,430) 152,095 121,468 (6,589) 114,879 International - Allied Products & Other 53,217 - 53,217 43,390 - 43,390 Total International 224,742 (19,430) 205,312 164,858 (6,589) 158,269 Allied Products & Other 569,352 (5,283) 564,069 442,447 - 442,447 Intersegment Eliminations (131,933) 131,933 - (81,538) 81,538 - Total Consolidated $ 2,769,315 $ - $ 2,769,315 $ 1,982,780 $ - $ 1,982,780 Three Months Ended March 31, 2022 March 31, 2021 Twelve Months Ended March 31, 2022 March 31, 2021
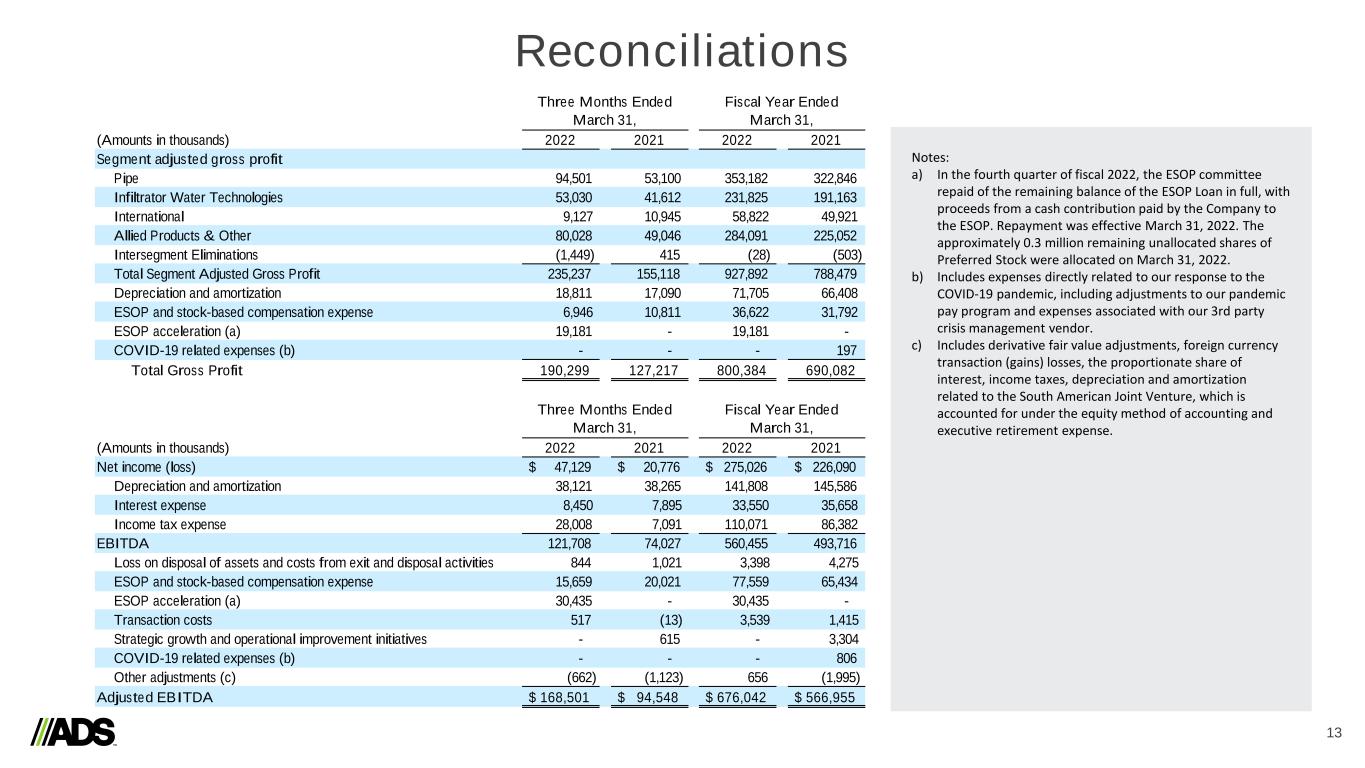
Reconciliations 13 (Amounts in thousands) 2022 2021 2022 2021 Segment adjusted gross profit Pipe 94,501 53,100 353,182 322,846 Infiltrator Water Technologies 53,030 41,612 231,825 191,163 International 9,127 10,945 58,822 49,921 Allied Products & Other 80,028 49,046 284,091 225,052 Intersegment Eliminations (1,449) 415 (28) (503) Total Segment Adjusted Gross Profit 235,237 155,118 927,892 788,479 Depreciation and amortization 18,811 17,090 71,705 66,408 ESOP and stock-based compensation expense 6,946 10,811 36,622 31,792 ESOP acceleration (a) 19,181 - 19,181 - COVID-19 related expenses (b) - - - 197 Total Gross Profit 190,299 127,217 800,384 690,082 (Amounts in thousands) 2022 2021 2022 2021 Net income (loss) $ 47,129 $ 20,776 $ 275,026 $ 226,090 Depreciation and amortization 38,121 38,265 141,808 145,586 Interest expense 8,450 7,895 33,550 35,658 Income tax expense 28,008 7,091 110,071 86,382 EBITDA 121,708 74,027 560,455 493,716 Loss on disposal of assets and costs from exit and disposal activities 844 1,021 3,398 4,275 ESOP and stock-based compensation expense 15,659 20,021 77,559 65,434 ESOP acceleration (a) 30,435 - 30,435 - Transaction costs 517 (13) 3,539 1,415 Strategic growth and operational improvement initiatives - 615 - 3,304 COVID-19 related expenses (b) - - - 806 Other adjustments (c) (662) (1,123) 656 (1,995) Adjusted EBITDA $ 168,501 $ 94,548 $ 676,042 $ 566,955 Three Months Ended March 31, Fiscal Year Ended March 31, Three Months Ended March 31, Fiscal Year Ended March 31, Notes: a) In the fourth quarter of fiscal 2022, the ESOP committee repaid of the remaining balance of the ESOP Loan in full, with proceeds from a cash contribution paid by the Company to the ESOP. Repayment was effective March 31, 2022. The approximately 0.3 million remaining unallocated shares of Preferred Stock were allocated on March 31, 2022. b) Includes expenses directly related to our response to the COVID-19 pandemic, including adjustments to our pandemic pay program and expenses associated with our 3rd party crisis management vendor. c) Includes derivative fair value adjustments, foreign currency transaction (gains) losses, the proportionate share of interest, income taxes, depreciation and amortization related to the South American Joint Venture, which is accounted for under the equity method of accounting and executive retirement expense.


