
2
3

4 • • • • • • • • • • • • • •

5

6
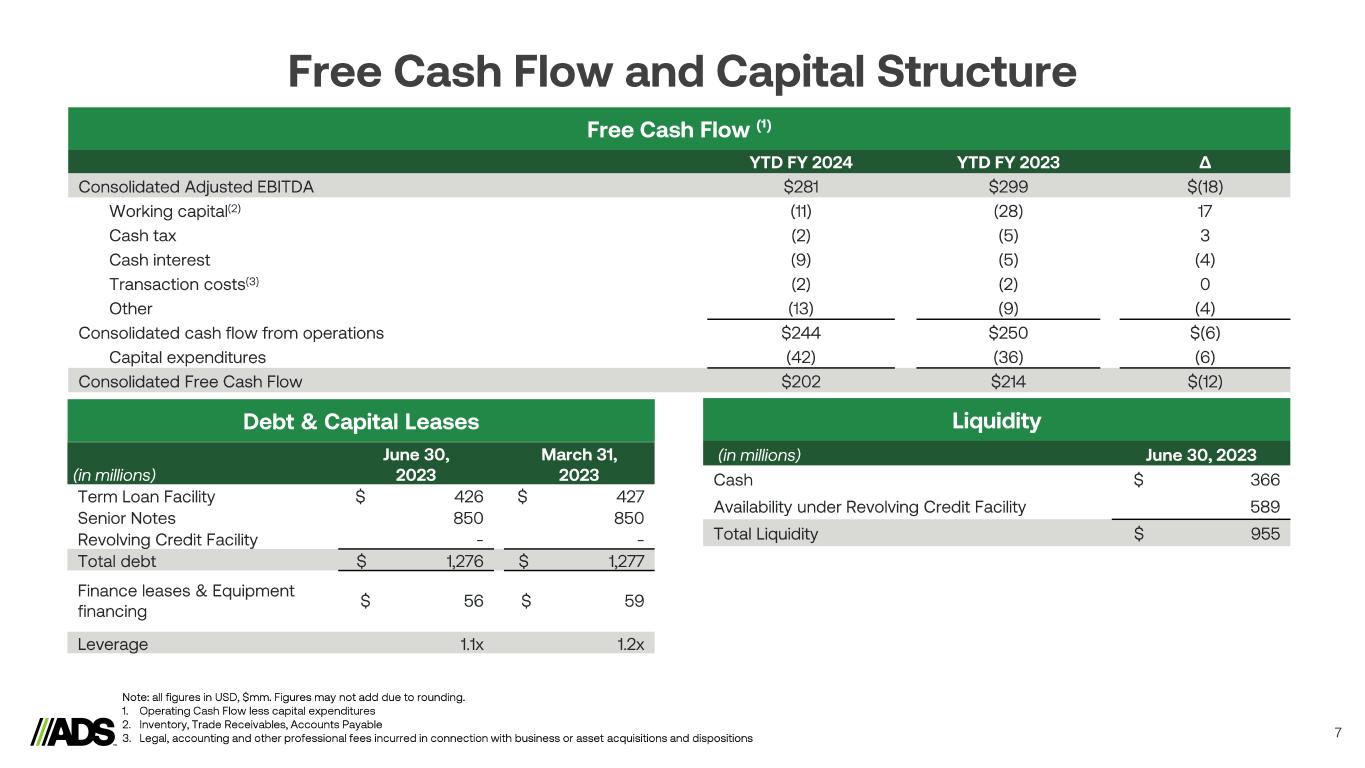
7
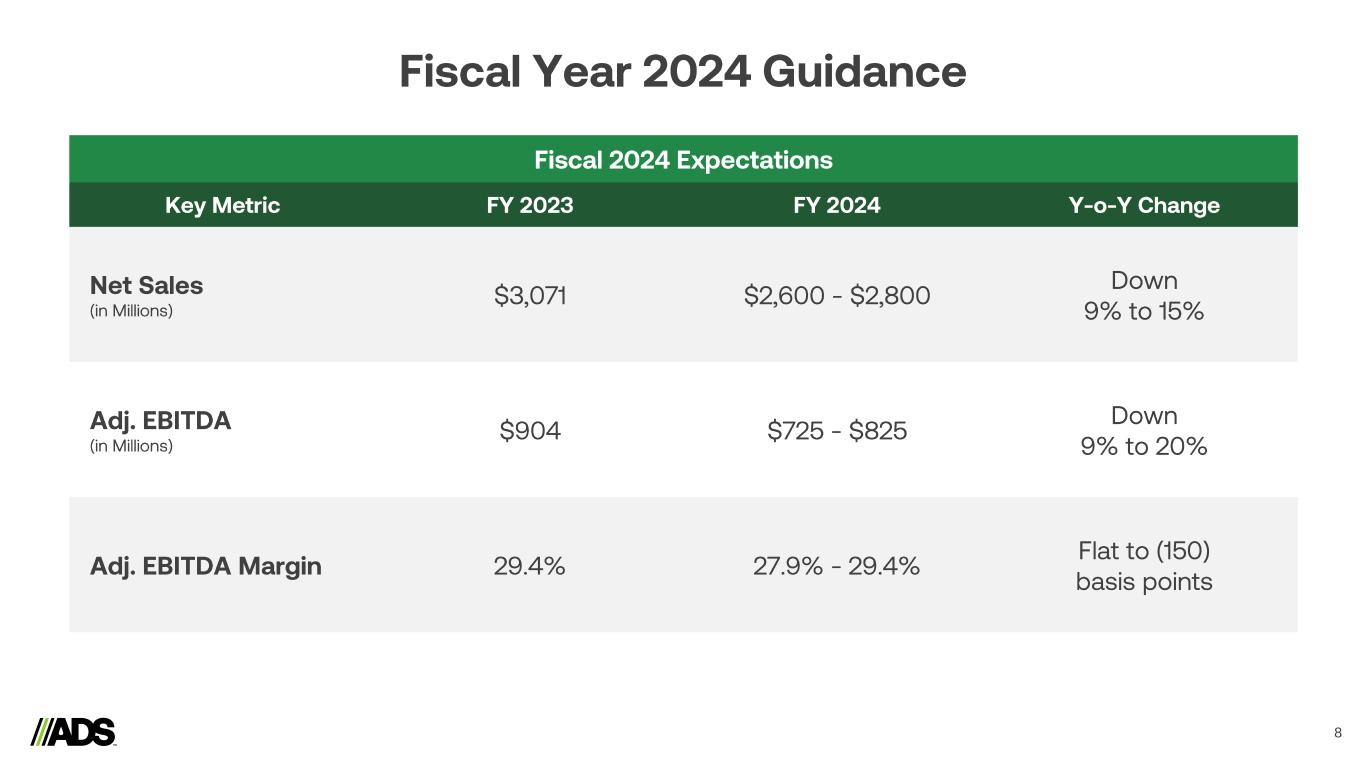
8

10
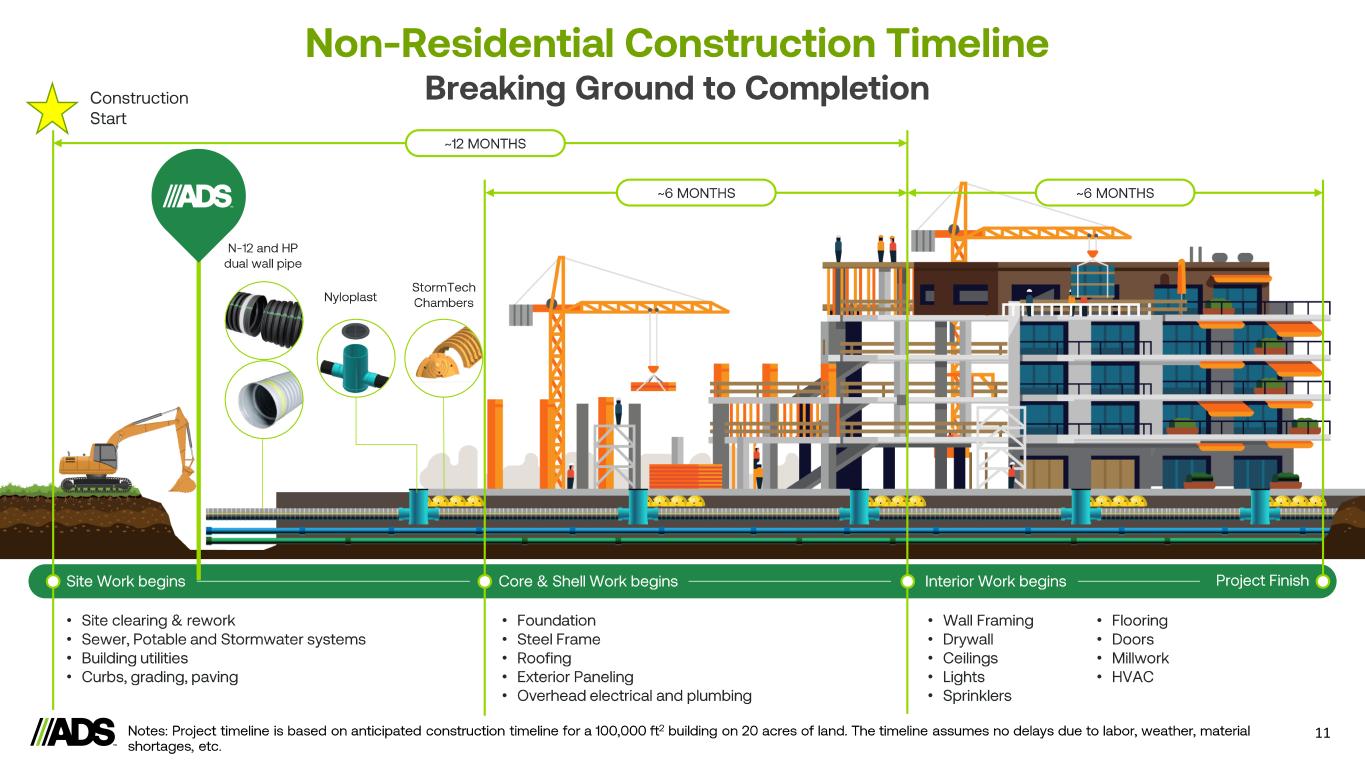
11 • • • • • • • • • • • • • • • • • •
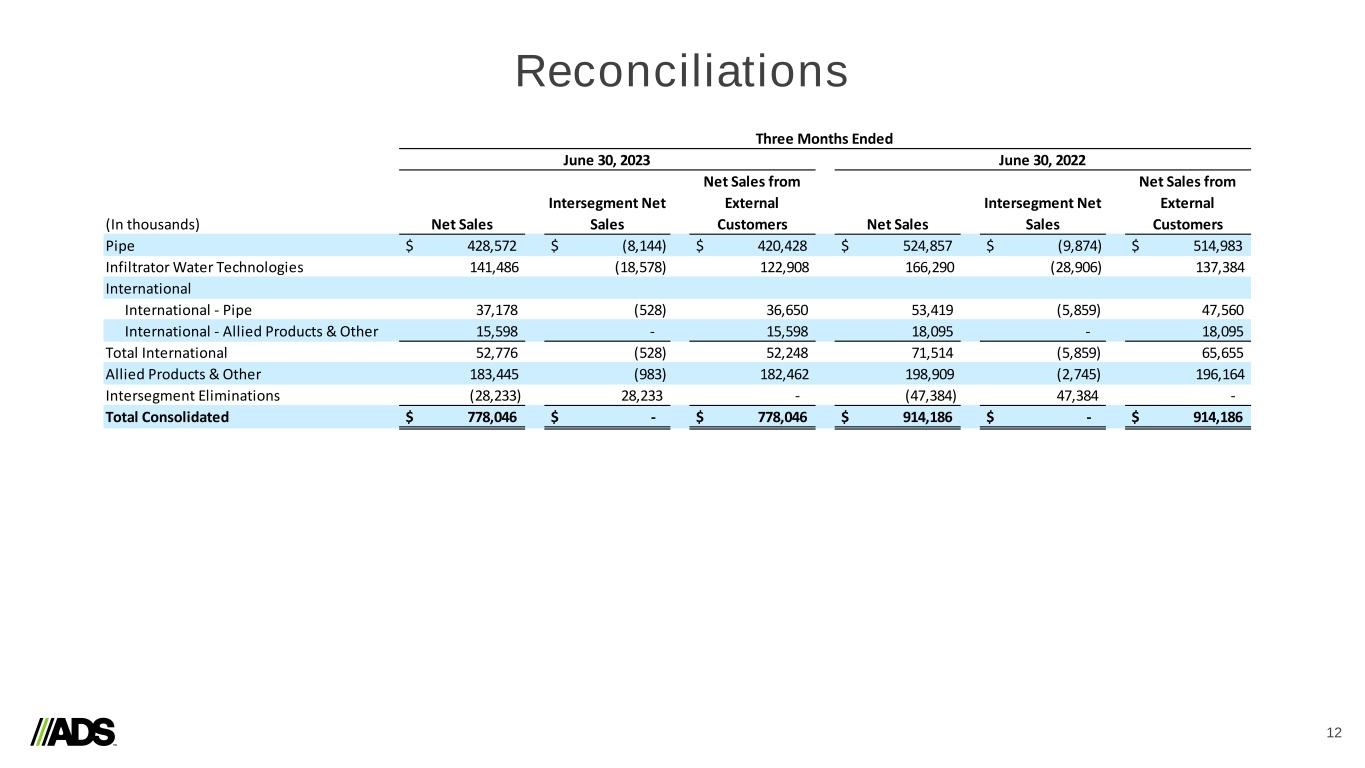
Reconciliations 12 (In thousands) Net Sales Intersegment Net Sales Net Sales from External Customers Net Sales Intersegment Net Sales Net Sales from External Customers Pipe $ 428,572 $ (8,144) $ 420,428 $ 524,857 $ (9,874) $ 514,983 Infiltrator Water Technologies 141,486 (18,578) 122,908 166,290 (28,906) 137,384 International International - Pipe 37,178 (528) 36,650 53,419 (5,859) 47,560 International - Allied Products & Other 15,598 - 15,598 18,095 - 18,095 Total International 52,776 (528) 52,248 71,514 (5,859) 65,655 Allied Products & Other 183,445 (983) 182,462 198,909 (2,745) 196,164 Intersegment Eliminations (28,233) 28,233 - (47,384) 47,384 - Total Consolidated $ 778,046 $ - $ 778,046 $ 914,186 $ - $ 914,186 Three Months Ended June 30, 2023 June 30, 2022
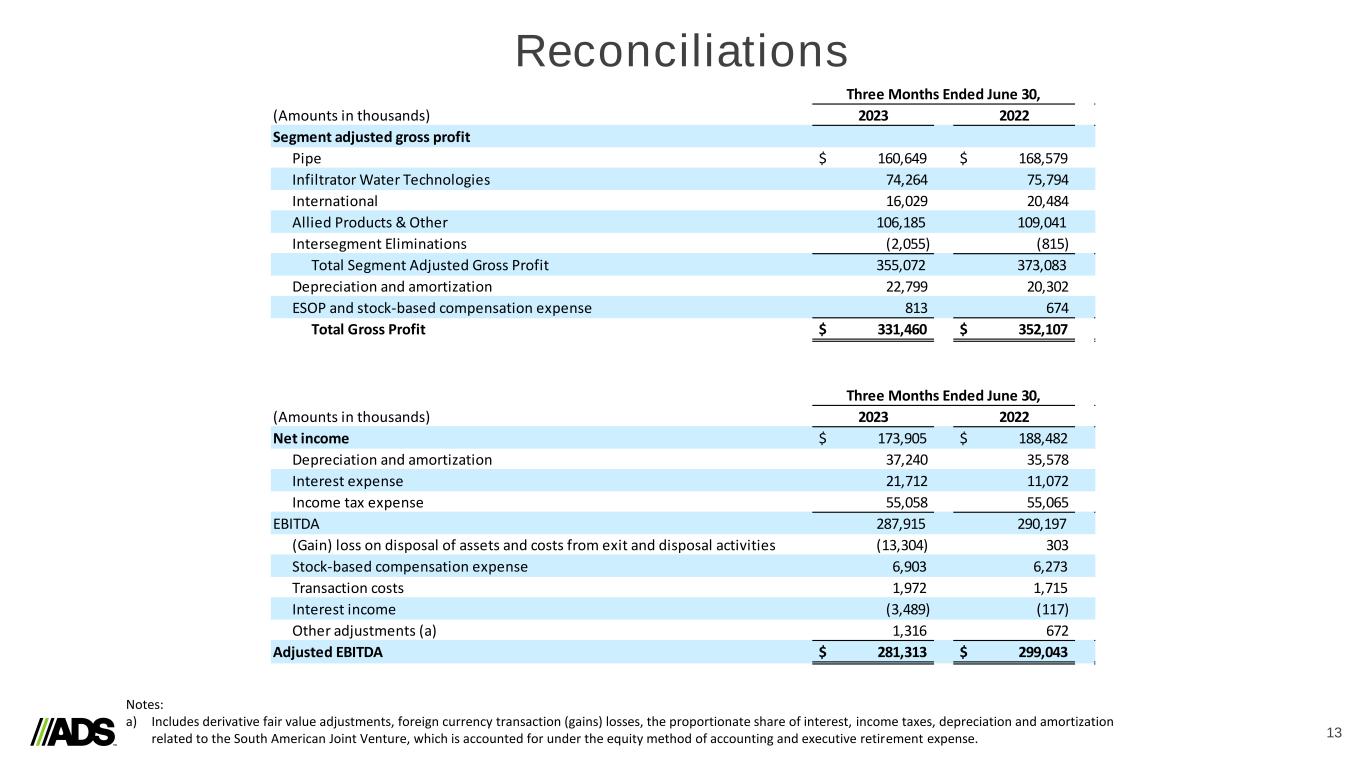
Reconciliations 13 Notes: a) Includes derivative fair value adjustments, foreign currency transaction (gains) losses, the proportionate share of interest, income taxes, depreciation and amortization related to the South American Joint Venture, which is accounted for under the equity method of accounting and executive retirement expense. (Amounts in thousands) 2023 2022 Segment adjusted gross profit Pipe $ 160,649 $ 168,579 Infiltrator Water Technologies 74,264 75,794 International 16,029 20,484 Allied Products & Other 106,185 109,041 Intersegment Eliminations (2,055) (815) Total Segment Adjusted Gross Profit 355,072 373,083 Depreciation and amortization 22,799 20,302 ESOP and stock-based compensation expense 813 674 Total Gross Profit $ 331,460 $ 352,107 (Amounts in thousands) 2023 2022 Net income $ 173,905 $ 188,482 Depreciation and amortization 37,240 35,578 Interest expense 21,712 11,072 Income tax expense 55,058 55,065 EBITDA 287,915 290,197 (Gain) loss on disposal of assets and costs from exit and disposal activities (13,304) 303 Stock-based compensation expense 6,903 6,273 Transaction costs 1,972 1,715 Interest income (3,489) (117) Other adjustments (a) 1,316 672 Adjusted EBITDA $ 281,313 $ 299,043 Three Months Ended June 30, Three Months Ended June 30,
