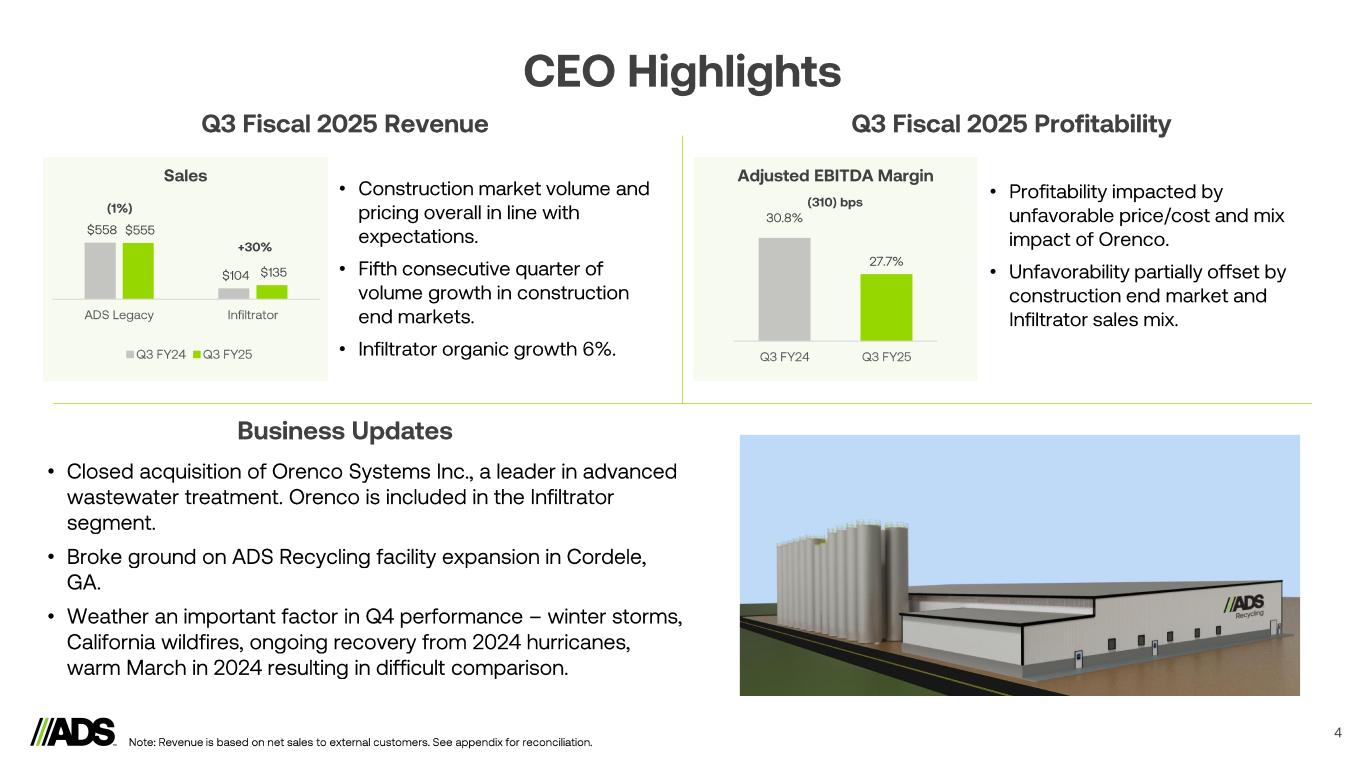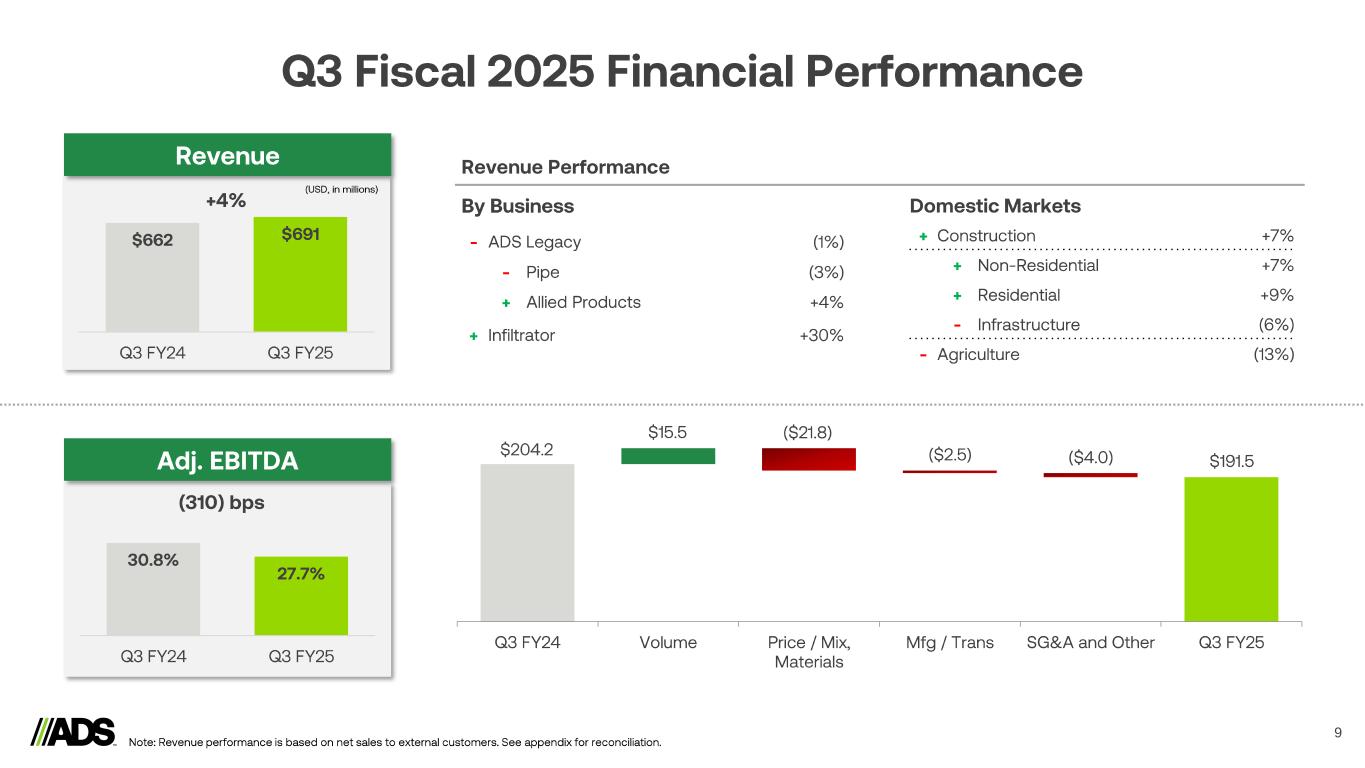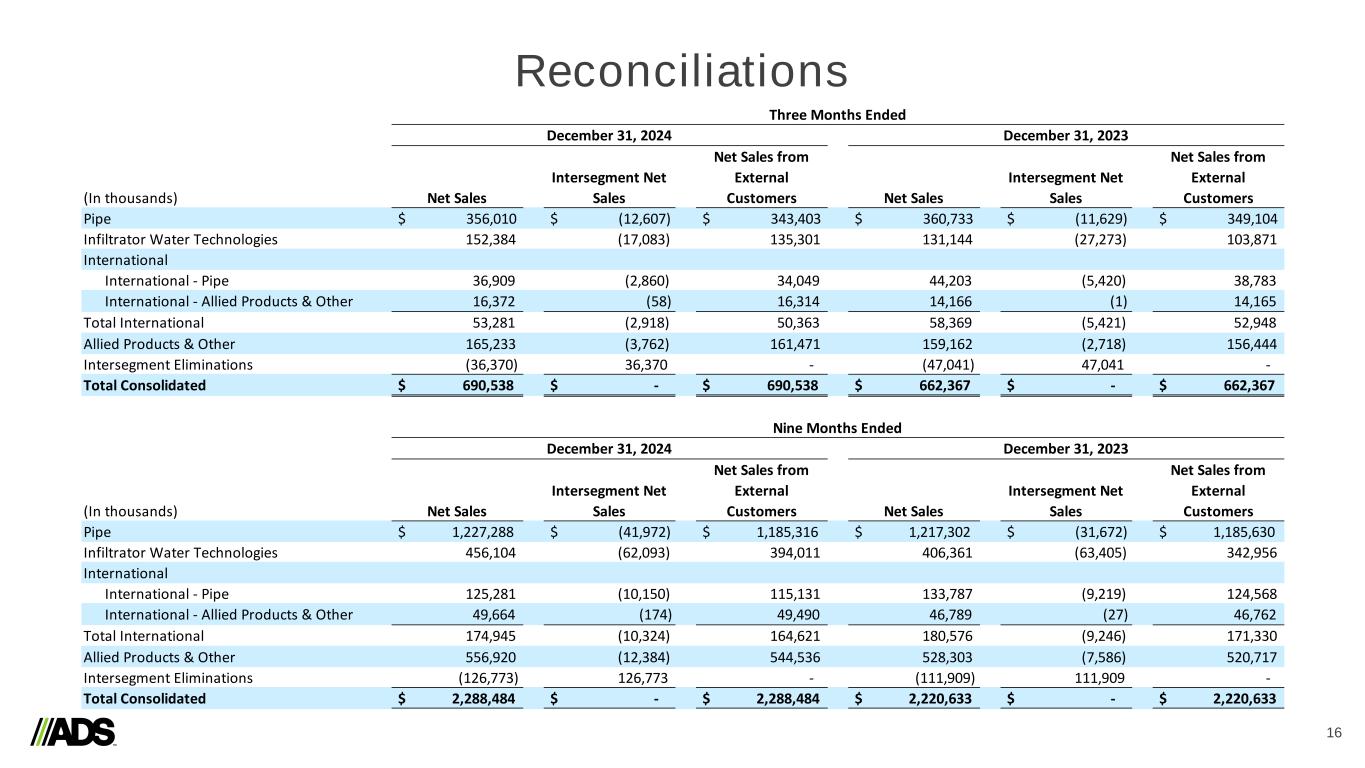
Reconciliations 16 (In thousands) Net Sales Intersegment Net Sales Net Sales from External Customers Net Sales Intersegment Net Sales Net Sales from External Customers Pipe $ 356,010 $ (12,607) $ 343,403 $ 360,733 $ (11,629) $ 349,104 Infiltrator Water Technologies 152,384 (17,083) 135,301 131,144 (27,273) 103,871 International International - Pipe 36,909 (2,860) 34,049 44,203 (5,420) 38,783 International - Allied Products & Other 16,372 (58) 16,314 14,166 (1) 14,165 Total International 53,281 (2,918) 50,363 58,369 (5,421) 52,948 Allied Products & Other 165,233 (3,762) 161,471 159,162 (2,718) 156,444 Intersegment Eliminations (36,370) 36,370 - (47,041) 47,041 - Total Consolidated $ 690,538 $ - $ 690,538 $ 662,367 $ - $ 662,367 (In thousands) Net Sales Intersegment Net Sales Net Sales from External Customers Net Sales Intersegment Net Sales Net Sales from External Customers Pipe $ 1,227,288 $ (41,972) $ 1,185,316 $ 1,217,302 $ (31,672) $ 1,185,630 Infiltrator Water Technologies 456,104 (62,093) 394,011 406,361 (63,405) 342,956 International International - Pipe 125,281 (10,150) 115,131 133,787 (9,219) 124,568 International - Allied Products & Other 49,664 (174) 49,490 46,789 (27) 46,762 Total International 174,945 (10,324) 164,621 180,576 (9,246) 171,330 Allied Products & Other 556,920 (12,384) 544,536 528,303 (7,586) 520,717 Intersegment Eliminations (126,773) 126,773 - (111,909) 111,909 - Total Consolidated $ 2,288,484 $ - $ 2,288,484 $ 2,220,633 $ - $ 2,220,633 Three Months Ended December 31, 2024 December 31, 2023 Nine Months Ended December 31, 2024 December 31, 2023
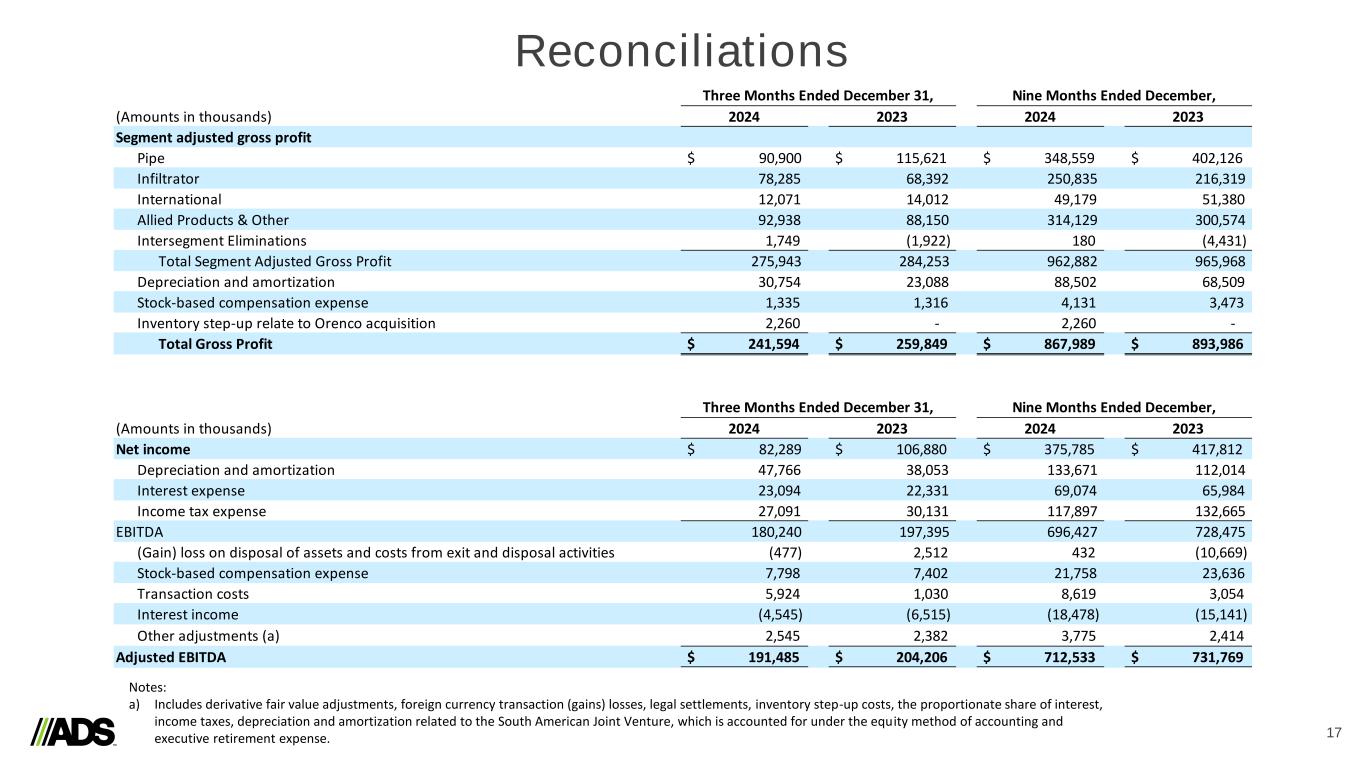
Reconciliations 17 Notes: a) Includes derivative fair value adjustments, foreign currency transaction (gains) losses, legal settlements, inventory step-up costs, the proportionate share of interest, income taxes, depreciation and amortization related to the South American Joint Venture, which is accounted for under the equity method of accounting and executive retirement expense. (Amounts in thousands) 2024 2023 2024 2023 Segment adjusted gross profit Pipe $ 90,900 $ 115,621 $ 348,559 $ 402,126 Infiltrator 78,285 68,392 250,835 216,319 International 12,071 14,012 49,179 51,380 Allied Products & Other 92,938 88,150 314,129 300,574 Intersegment Eliminations 1,749 (1,922) 180 (4,431) Total Segment Adjusted Gross Profit 275,943 284,253 962,882 965,968 Depreciation and amortization 30,754 23,088 88,502 68,509 Stock-based compensation expense 1,335 1,316 4,131 3,473 Inventory step-up relate to Orenco acquisition 2,260 - 2,260 - Total Gross Profit $ 241,594 $ 259,849 $ 867,989 $ 893,986 (Amounts in thousands) 2024 2023 2024 2023 Net income $ 82,289 $ 106,880 $ 375,785 $ 417,812 Depreciation and amortization 47,766 38,053 133,671 112,014 Interest expense 23,094 22,331 69,074 65,984 Income tax expense 27,091 30,131 117,897 132,665 EBITDA 180,240 197,395 696,427 728,475 (Gain) loss on disposal of assets and costs from exit and disposal activities (477) 2,512 432 (10,669) Stock-based compensation expense 7,798 7,402 21,758 23,636 Transaction costs 5,924 1,030 8,619 3,054 Interest income (4,545) (6,515) (18,478) (15,141) Other adjustments (a) 2,545 2,382 3,775 2,414 Adjusted EBITDA $ 191,485 $ 204,206 $ 712,533 $ 731,769 Three Months Ended December 31, Nine Months Ended December, Three Months Ended December 31, Nine Months Ended December,
