Seward & Kissel llp ONE BATTERY PARK PLAZA NEW YORK, NEW YORK 10004 | |||
TELEPHONE: (212) 574-1200 FACSIMILE: (212) 480-8421 WWW.SEWKIS.COM | 901 K STREET, NW WASHINGTON, D.C. 20001 TELEPHONE: (202) 737-8833 FACSIMILE: (202) 737-5184 | ||
January 21, 2020
U.S. Securities and Exchange Commission
Division of Corporation Finance
100 F Street, N.E.
Washington, D.C. 20549
Attention: | Brian McAllister |
Raj Rajan |
Re: | Euronav NV | |
Form 20-F for the fiscal year ended December 31, 2018 | ||
Filed on April 30, 2019 | ||
File No. 001-36810 |
Dear Mr. McAllister,
We refer to the annual report on Form 20-F for the fiscal year ended December 31, 2018 filed by Euronav NV (the “Company”) with the Securities and Exchange Commission (the “Commission”) on April 30, 2019 (the “Annual Report”). By letter dated December 26, 2019 (the “Comment Letter”), the staff of the Commission (the “Staff”) provided the Company with its comments to the Annual Report. The Company’s responses to the Comment Letter are set forth below with each Company response prefaced by the exact text of the Staff’s corresponding comment in bold text.
Form 20-F for the fiscal year ended December 31, 2018
Item 5. Operating and Financial Review Prospects
Critical Accounting Policies
Calculation of Recoverable Amount, page 85
| 1. | We note in determining the recoverable amount of your tankers, you make several assumptions about your future performance and develop estimates of future cash flows. We note that in the past you used a fixed cut of 10 years to define a shipping cycle and 10 year historical average spot freight rates as forecast charter rates. However, in 2018, you define a shipping cycle to include the past 20 years and use forecast charter rates based on a weighted average of the past and ongoing current shipping cycle. You state that when using 10 year historical charter rates in your impairment analysis, it indicated that an impairment is required for of the tanker fleet in the amount of $47.9 million in 2018. |
Please address the following:
• Please explain in detail the new methodology, the basis for the new forecasted cycle and related assumptions used in 2018, why it is preferable and the underlying reasons for the change.
• Please explain how the recoverable amount determined under the new methodology using a longer shipping cycle is more reliable and represents management’s best estimate of the range of economic conditions that will exist over the remaining useful life of the tanker fleet.
• Considering significant volatility and declines in charter rates in recent years, tell us how using the last 20 years for a shipping cycle provides management the ability to give more weight to recent and current market experience than a 10 year period.
SEC Question 1: Explain in detail the new methodology, the basis for the new forecasted cycle and related assumptions used in 2018, why it is preferable and the underlying reasons for the change.
Underlying reasons for the change and preferability
The Company’s policy since 2010 was to use the 10-year average historical spot freight rates in its impairment model, while at the same time disclosing the potential impact of the alternative using either the 5 and 1-year rates.
During Q2 2018, the Company determined that the existing impairment assessment model had become disconnected from observable trends and no longer met the requirements of IAS 36, so it was considered preferable to introduce a revised model.
Since the Company’s listing on NYSE and becoming subject to the U.S. Securities Exchange Act of 1934 reporting and registration requirements, the Company has disclosed the following in its annual report on form 20-F:
Potential impairment based on: | ||||
| 10-year average | 5-year average | 1-year average | Capital gain/(loss) on disposals | |
| 2014 | - | 952.0M | 103.7M | 5.7M |
| 2015 | - | 123.3M | - | 5.3M |
| 2016 | - | - | - | 50.4M |
| 2017 | - | 5.7M | 427.3M | 15.5M |
| 2018 | 47.9M | - | 92.7M | 15.9M |
IAS 36.9 defines an impairment loss as the amount by which the carrying amount of an asset or a cash-generating unit (CGU) exceeds its recoverable amount. The recoverable amount of an asset is defined as the higher of its fair value less cost of disposal and its value in use. Individual vessels are deemed to constitute a CGU unless they are operated in a net revenue sharing pool.
The Company also presents in the table above its actual disposal experience as a potential indicator as to whether our impairment assessment model was reliable. The actual disposal experience indicates that the Company has been able to sell its older tonnage at a price close to or above its carrying value.
The Company advises the Staff that it has always attempted to establish its impairment methodology in the most objective manner and to use assumptions that are objective and, to the greatest extent possible, observable in the market or provided by independent third parties, which was the case again in 2018.
Under IAS 36.33, in measuring value in use, an entity shall base cash flow projections on reasonable and supportable assumptions that represent the Company's best estimate of the range of economic conditions that will exist over the remaining useful life of the asset. Greater weight shall be given to external evidence. The principal input to the impairment methodologies, both new and old, is the freight rates that are observable in the market.
Spot freight rates have historically been driven by the demand and supply of oil, the ton miles required to transport that oil, the vessel supply and geopolitical events such as sanctions and the threat of war. This leads to volatility, that impacts the historic rates in a manner that might not reflect the true expectations of the Company’s ability to recover the value of its vessels over a 20-year useful life with the use of a simple average rate.
The Company has observed over time that the reliability of 10-, 5- and 1-year rate is dependent on whether particular years with special events (a high performing or distressed year) come into or drop out of the calculation. This impact implies that the average rate at a reporting date can benefit from or be penalized by the addition or subtraction of a particular year independently from market expectations of the performance of a vessel over its remaining useful life.
When determining the recoverable amount, the Company reviews its methodology and parameters and evaluates whether those are still appropriate given the market, and the Company’s view of the expected evolution of the rates over the remaining useful life of the vessels.
Developing an estimate for future TCE1 over the remaining life of each vessel is complex considering the volatility in the shipping market. However history has shown that rates evolve on a cyclical basis over the useful life of a vessel, and after bad years, peaks or good rates follow. The Company has therefore resorted to a measure generally retained in the shipping industry which is to look at historical TCEs as a basis to estimate the recoverable amount.
When the Company first designed its impairment assessment model in 2010, taking into account the life of the vessels and the prevailing macroeconomics trends, the Company used historical TCEs as an indication of future TCEs. The Company sought to add robustness to this measure by electing (1) an external data source provider for historical TCEs – namely Clarksons2 (the largest international ship broker) and (2) a 10-year range. Considering a 10-year average for a shipping cycle seemed at that time to be a generally agreed duration of a shipping cycle in the industry, capturing the peaks and troughs in the shipping market.
During 2018, the Company noticed an increase in the fair market values of the vessels throughout the year. Over 2018, the fair market value of the Company’s vessels increased by 7.6% as estimated by reputable third party brokers such as Clarksons and Braemar. In addition, several analysts forecasted the bottoming out of the rate crisis, as evidenced by a strong market in Q4 2018 and early 2019 with TCEs around or above USD 35,000/day for a VLCC, well above break even for impairment purposes. This positive outlook contrasted sharply with the drop in the 10-year average TCE rate over 2018, caused by the exceptional year 2008 dropping out of the average. The graph below shows the valuation of the Company’s fleet over the course of 2018 according to vesselvalues.com compared to the calculated 10 year average daily TCE based on the daily TCE rates as provided by Clarksons.

1 Time Charter Equivalent is a standard shipping industry performance measure used primarily to compare period-to-period changes in a shipping company's performance despite changes in the mix of charter types under which the vessels may be employed between the periods. The standard method to compute TCE is to divide voyage revenues ( net of expenses) by available days for the relevant time period. Expenses primarily consist of port, canal and fuel costs.
2 Clarksons is an independent internationally recognized provider of integrated shipping services and shipping broker including historical Time Charter Equivalent rates (TCE). Clarksons TCE rates have been proven to be consistent and a good proxy – https://www.clarksons.com
Applying the previous impairment model would have resulted in an impairment loss of $47.9 million as of December 31, 2018. When it performed its impairment assessment in February/ March 2019, the Company expected as part of the evolution of freight rates an increase in the TCE rates during Q1 and Q2 2019, based on what was observable at the time and as a continuation of the higher rates observed in Q4 2018, which would have led to a partial reversal of that loss in Q1 2019 as IAS 36.110 requires the Company to assess at each reporting period whether there is an indication that an impairment loss recognized in prior periods for an asset other than goodwill no longer exist or may have been decreased.
As of December 2018, the Company in accordance with IAS 36.111 considered the following indications that could lead to the conclusion that an impairment loss had decreased or no longer existed:
| o | External information: |
| ◾ | the Company noted that TCE rates were increasing significantly from Q4 2018 and market expectations at that time was that the TCE rates were expected to further increase significantly during 2019 to an expected new peak in 2020; and |
| ◾ | This was reflected in the increase in the fair value of the vessels as provided by Clarksons and Braemar (see chart above). |
| o | External information: while in previous periods the 10-year average TCE rates included at least two complete cycles, the 2018 10-year average TCE rate only included one complete cycle with longer periods of low TCE rates (before and after the peak in 2015). Based on its experience, the Company has observed that over its life, a vessel goes through multiple cycles and as the Company has historically generated gains (on average) on the sales of its older vessels, the Company concluded that considering only one cycle, albeit the most recently completed one, did not provide an appropriate reflection of either its historical experience or of the long-term expectations of the market at that time. The Company refers the Staff to the further analysis below. |
| o | Internal information: certain vessels had contracted TCE rates for voyages in Q1 and Q2 2019 which were higher than the average TCE rates calculated using the impairment model using a 10-year average showing that freight rates had bottomed out while the 10-year average TCE continued to decline. |
IAS 36.114 requires the Company to reverse the impairment loss recognized in prior periods for an asset when there has been a change in the estimates to determine the recoverable amount and the carrying value of the vessels shall be increased to their recoverable amount. The change in estimate relevant for IAS 36.114 is the significant expected increase in TCE rates, which aligned with the observable increase in vessel fair value.
The foregoing points led management to conclude as of December 31, 2018 that the impairment assessment model using the 10-year average historical TCE rates might not be an appropriate basis anymore to estimate the future TCE rates and that the previous impairment assessment model was no longer compliant with the IAS 36.33 requirement that the cash flows should represent the Company’s best estimate of the range of economic conditions that will exist over the remaining useful life of the asset.
Basis for the 20-year forecast cycle and related TCE assumption
The following is a detailed explanation of how the Company conducted its analysis:
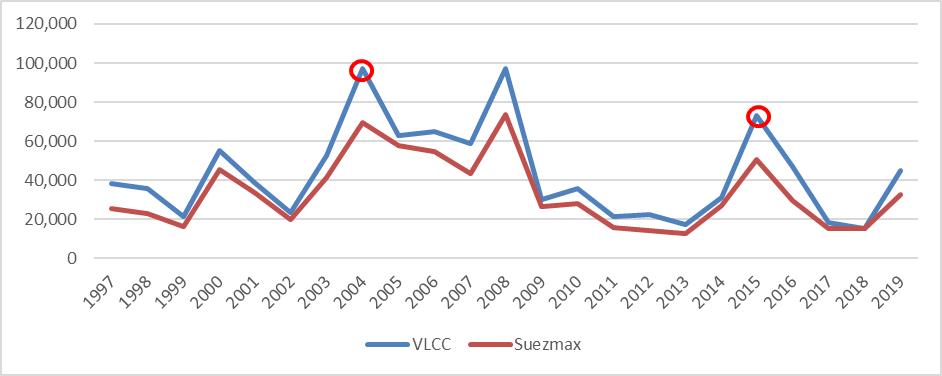
The above chart shows the annual average achieved TCE day rates as published by Clarksons, and eliminates the seasonality within a year. It shows that the rates are very volatile with highs of almost USD 100,000/day to lows below USD 20,000/day.
In order to determine the duration of a cycle, the Company took the position that a cycle started with a peak and ended the year before the next expected peak, so as to avoid doubling counting peaks.3 As a result, the start of a cycle is defined in the following years: 2000, 2004, 2008 and 2015. The Company identified also a cycle from a low to the next low, but this is less robust as several lows in one cycle or a longer period of low rates can be observed, which are not in line with our expectations of the financial performance of a vessel over its useful life. However, this information was considered in the sensitivity analyses which are further detailed below.
This analysis results in 4 observable cycles since 2000, extending from a period of 4 years (2 cycles) to a period of 7 years (1 cycle). The longer period of the third cycle, between 2008 and 2014 was caused by the combined effect of the 2008 financial crisis, credit constraints and the delivery of new builds at the beginning of the decade. This observable cyclicality demonstrates why the 10 year average over time became a less accurate reflection of shipping cycles: in previous years, a 10-year average covered two peaks whereas the last 10 years as of December 31, 2018 would only consider the peak in 2015 and the depressed years before and after that peak. In particular, at the end of 2018 the Company strongly believed that a surge in rates would take place in the years to come, with both temporary and long terms factors being the cause. One “permanent” factor was IMO 2020, which would affect both the supply and demand for tankers.
On the demand side, refinery runs, were expected to be higher to produce compliant fuel, which would increase ton-miles and a further growth of U.S. crude exports to Asia was also expected.
On the supply side, an acceleration of ship decommissioning was beginning to be observed due to a combination of lower rates, credit pressures on the sector and the required preparations for IMO 2020 (scrubber retrofit or the planning and logistics associated with securing compliant fuel). In addition sanctions against Iran removed several ships from the worldwide fleet and were anticipated to remain in place long term. These factors were expected to have a long-term positive effect on freight rates.
The apparent evolution over time of the length of a shipping cycle could in theory be resolved by increasing the number of years considered when calculating the average (in order to include at least two complete shipping cycles) but, although based on external data from the above analysis, the Company considered that this approach would also need continued adjustment each year when investigating the new TCE and potential cycles as, compared to when we started the 10-year approach in 2010, the duration of a cycle has become uncertain and is imperfectly captured by a (purely) linear approach.
Therefore, the Company determined that it would be more appropriate to work with the actual cycles over the expected useful life of a vessel and build an average of the TCE rate of each such cycle rather than fixing the period of averaging regardless of the duration of a cycle. With this approach, the length of time for which historical data is used, might change, but peaks and troughs are always considered in an objective manner. This approach avoids the cliff effect where sometimes a good year can disappear (or appear) which would lead to volatility in the estimate to determine the recoverable amount, generating impairment charges and reversal of impairment on a regular basis.
As set out earlier, IAS 36.33 defines that when measuring the value in use of an asset, the Company should estimate its cashflow projections using reasonable and supportable assumptions that represent the Company’s best estimate of the range of economic conditions that will exist over the remaining useful life of the asset. Greater weight shall be given to external evidence.
As such, the Company must ensure that its impairment assessment methodology sufficiently reflects those economic conditions over the remaining useful life of the asset which in the Company’s view was no longer the case in the previous impairment assessment model and would have resulted in an impairment charge that would have been reversed in the next quarters.
Calculating the averages per cycle results in the following table (based on the TCE rates as provided by Clarksons):
| VLCC | Suezmax | ||||
Start Year | Nr of years | Average USD/day | Nr of years | Average USD/day | |
Cycle 1 | 2000 | 4 | 42,503.55 | 4 | 35,196.11 |
Cycle 2 | 2004 | 4 | 70,976.98 | 4 | 56,259.26 |
Cycle 3 | 2008 | 7 | 36,555.14 | 7 | 28,361.21 |
Cycle 4* | 2015 | 4 | 38,362.41 | 4 | 27,692.17 |
* The Company determined this cycle to be incomplete as it was forecasting a peak year in 2020 (demand and supply for oil considered as robustly increasing while ton miles would be influenced positively by IMO 2020) based on fixing information and analyst expectations as of December 31, 2018. Further note that the rate presented above for cycle 4 only includes observable rates for 2015 to 2018 and excludes management’s expectations for 2019.
The last fully completed cycle started in 2008 and lasted to 2014. The cycle that started in 2015, had not yet reached its new high but in fact seemed to have reached its low as of December 31, 2018 (This has subsequently been evidenced by an average TCE rate achieved in 2019 of USD 45,141/day and USD 32,733 USD/day for a VLCC and Suezmax respectively i.e. above the average shown in the table above.)
After identifying the 4 cycles, it was important to decide whether the Company should use only one cycle only or an average of the different cycles. Taking the normal average of all cycles would have resulted in a 19-year average giving equal importance both to older and to more recent information. Choosing just one of the cycles would have created additional volatility as one bad cycle might create a significant impairment which might need to be reversed during the next cycle. In addition, the TCE rates used for the purpose of the Company’s impairment assessment model applies to all similar type of vessels (VLCC or Suezmax), independently of their age. Younger vessels will still experience multiple cycles throughout their useful life and accordingly, capturing the cyclicality in the rate over a period close to the vessels’ useful life provides more relevant information.
Therefore, the Company opted for an approach that gives greater prominence to recent cycles (cycle 3 and 4) and greater still to completed cycles (cycle 3) while nevertheless still considering, albeit with a significantly lower weighting, older cycles (cycle 1 and 2). The economic reality has changed fundamentally since the deep financial crisis 2008. Hence, while the cycles before that period can still be considered, it is with minor impact. As from 2008, world economics have entered a new era that changed the law of business fundamentally. Hence, the cycles after 2008 have to be considered as more significant reference points.
The weightings in the table below reflect these considerations applied to the average rate per cycle as calculated in the preceding table and taking into account the Company’s forecast for the 2019 rate resulting in the following weighted average for the 2018 impairment analysis.
| VLCC | Suezmax | Weighting | |||||
Start Year | Nr of years | Average USD/day | Nr of years | Average USD/day | VLCC | Suezmax | |
Cycle 1 | 2000 | 4 | 42,504 | 4 | 35,196 | 10% | 10% |
Cycle 2 | 2004 | 4 | 70,977 | 4 | 56,259 | 10% | 10% |
Cycle 3 | 2008 | 7 | 36,555 | 7 | 28,361 | 50% | 50% |
Cycle 4 | 2015 | 5 | 36,690 | 5 | 27,154 | 30% | 30% |
| 40,633 | 31,473 | ||||||
It is worth mentioning that the forecasted rates for 2019 and 2020 were set at USD 30,000 to USD 50,000/day for a VLCC and at USD 25.000 to USD 35.000/day for a Suezmax. These rates were estimated using the market consensus forecast from Fearnley’s (one of the top shipbroking companies in the world) forecast which has proven to be very accurate (see comparison actual vs forecasted rates). The Company further corroborated these rates with the Company’s own fixing data (as were then observable for Q1 and Q2 2019) and with achieved TCE rates of approximately USD 34,959 /day and USD 35,195 /day for a VLCC in Q4 2018 and Q1 2019 respectively.
Based on this information, the Company estimated that it was likely that 2020 would be a new peak and therefore, consistent with the approach described above, the forecast rate for 2020 is not included in the average for Cycle 4. The Company believes that this further demonstrates that the model is robust and objective as any higher rate set by the Company in the future would not increase the average TCE rate of the ongoing cycle but instead would be considered as the start of a next cycle.
The Company notes that its actual experience for 2019 and current 2020 forecast have confirmed the assessments made as of December 31, 2018 in terms of rates and positioning in the cycle. For the full year of 2019 the Company estimates that it has achieved approximately USD 35,916 /day for a VLCC and more specifically Q4 2019 has shown a strong increase in rates going into 2020 with achieved TCE rates for that quarter of approximately USD 61,820 /day for a VLCC and average fixings in the first quarter of 2020 of around USD 87,000 /day.
For the purposes of an illustrative comparison with the previous approach, the Company has updated its old model with the 2019 rates and this would have led to the reversal in 2019 of USD 18.9 million of the theoretical December 31, 2018 impairment based on the 10-year average. Based on analyst’s rate forecasts for 2020, this theoretical impairment would be fully reversed in 2020. The Company believes this is consistent with the fact that the Company is considering the financial performance of the vessels over their respective useful life and with management’s expectations as of December 31, 2018 based on evidence at that time of an increase in rates and fair value of the vessels in 2019 and 2020.
Sensitivity analysis
The Company also performed the various sensitivity analyses to assess the robustness of the new method and assumptions used. In particular, the Company looked at the impact of using the following :
— | the last completed cycle only (2008 – 2014) : the conclusion on impairment did not change; |
— | the current cycle only (2015 – 2019), with and without a rate forecast for 2019: the conclusion on impairment did not change; |
— | only analysts’ forecasts for rates without calibrating these with the Company’s own fixing data: the conclusion on impairment did not change and it is worth noting that the average rate for cycle 4 would actually increase; |
— | the 1-year, 5-year and 10-year average rate (linear): as previously disclosed in the Company’s 2018 financial statements filed on Form 20-F, the use of a 1- and 10-year average resulted in a theoretical impairment of USD 92.7 and 47.9 million, respectively, while the use of a 5-year average did not result in an impairment (the reason being that the 5-year average almost fully coincides with the ongoing cycle which started in 2015). |
Required Impairment | TCE rate used | ||||
| VLCC | Suezmax | ||||
Nr of Years used in TCE | Peak-to-Peak - Incl Forecast | 0 | 40,632.60 | 31,472.26 | |
| Peak-to-Peak - Excl Forecast | 0 | 41,134.34 | 31,633.79 | ||
| Peak-to-Peak - Last Fcst cycle only | 0 | 36,689.93 | 27,153.73 | ||
| Peak-to-Peak- Last completed cycle | 0 | 36,555.14 | 28,361.21 | ||
| 1yr average | -92,680,836 | 15,288.29 | 15,535.69 | ||
| 5yr average | 0 | 36,920.42 | 27,609.33 | ||
| 10yr average | -47,943,942 | 31,218.40 | 23,543.39 | ||
Given the result of this sensitivity analysis, the Company believes that the revised approach is robust, sustainable and meets the requirement of IAS 36 as it reflects the Company’s long-term view of the value of the vessels over their remaining useful life, while maximizing the use of independent and observable data.
Changing weighting, changing the definition of a cycle as from peak to peak, or excluding the forecast for the two coming years, does not lead to an impairment.
SEC Question 2: Please explain how the recoverable amount determined under the new methodology using a longer shipping cycle is more reliable and represents management’s best estimate of the range of economic conditions that will exist over the remaining useful life of the tanker fleet.
Reference is made to our response to question 1.
SEC Question 3: Considering significant volatility and declines in charter rates in recent years, tell us how using the last 20 years for a shipping cycle provides the Company the ability to give more weight to recent and current market experience than a 10-year period.
Reference is made to our response to question 1.
If you have any questions or comments concerning this letter, please feel free to contact the undersigned at (212) 574-1274.
| Very truly yours, | ||
| SEWARD & KISSEL LLP | ||
| By: | /s/ Keith Billotti | |
| Keith J. Billotti, Esq. | ||