J.P. Morgan Global High Yield & Leveraged Finance Conference March 2, 2021 Ben Stas Chief Financial Officer
© 2021 EVOQUA WATER TECHNOLOGIES | 2 This presentation contains forward-looking statements within the meaning of the Private Securities Litigation Reform Act of 1995. All of these forward-looking statements are based on our current expectations, assumptions, estimates and projections. While we believe these expectations, assumptions, estimates and projections are reasonable, such forward-looking statements are only predictions and involve known and unknown risks and uncertainties, many of which are beyond our control. These and other important factors may cause our actual results, performance or achievements to differ materially from any future results, performance or achievements expressed or implied by these forward-looking statements, or could affect our share price. Some of the factors that could cause actual results to differ materially from those expressed or implied by the forward-looking statements include, among other things, general global economic and business conditions, including the impacts of the COVID-19 pandemic and disruptions in global oil markets; our ability to compete successfully in our markets; our ability to execute projects on budget and on schedule; the potential for us to incur liabilities to customers as a result of warranty claims or failure to meet performance guarantees; our ability to meet our customers’ safety standards or the potential for adverse publicity affecting our reputation as a result of incidents such as workplace accidents, mechanical failures, spills, uncontrolled discharges, damage to customer or third-party property or the transmission of contaminants or diseases; our ability to continue to develop or acquire new products, services and solutions and adapt our business to meet the demands of our customers, comply with changes to government regulations and achieve market acceptance with acceptable margins; our ability to implement our growth strategy, including acquisitions and our ability to identify suitable acquisition targets; our ability to operate or integrate any acquired businesses, assets or product lines profitably or otherwise successfully implement our growth strategy; our ability to achieve the expected benefits of our restructuring actions, including restructuring our business into two segments; material and other cost inflation and our ability to mitigate the impact of inflation by increasing selling prices and improving our productivity efficiencies; our ability to accurately predict the timing of contract awards; delays in enactment or repeals of environmental laws and regulations; the potential for us to become subject to claims relating to handling, storage, release or disposal of hazardous materials; our ability to retain our senior management and other key personnel; our increasing dependence on the continuous and reliable operation of our information technology systems; risks associated with product defects and unanticipated or improper use of our products; litigation, regulatory or enforcement actions and reputational risk as a result of the nature of our business or our participation in large-scale projects; seasonality of sales and weather conditions; risks related to government customers, including potential challenges to our government contracts or our eligibility to serve government customers; the potential for our contracts with federal, state and local governments to be terminated or adversely modified prior to completion; risks related to foreign, federal, state and local environmental, health and safety laws and regulations and the costs associated therewith; risks associated with international sales and operations, including our operations in China; our ability to adequately protect our intellectual property from third-party infringement; risks related to our substantial indebtedness; our need for a significant amount of cash, which depends on many factors beyond our control; and other factors described in the “Risk Factors” section included in our Annual Report on Form 10-K for the fiscal year ended September 30, 2020, as filed with the SEC on November 20, 2020, and in other periodic reports we file with the SEC. All statements other than statements of historical fact included in the presentation are forward- looking statements, including, but not limited to, our three to five year targets, statements related to the impact of the COVID-19 pandemic, potential growth drivers and statements regarding our digital water strategy. Any forward-looking statement that we make in this presentation speaks only as of March 2, 2021. We undertake no obligation to update or revise, or to publicly announce any update or revision to, any of the forward-looking statements made herein, whether as a result of new information, future events or otherwise. These forward-looking statements should not be relied upon as representing the Company’s views as of any date subsequent to the date of this presentation. Immaterial rounding differences may be present in the data included in this presentation. Use of Non-GAAP Financial Measures - This presentation contains “non-GAAP financial measures,” which are adjusted financial measures that are not calculated and presented in accordance with generally accepted accounting principles in the United States, or “GAAP.” These non-GAAP adjusted financial measures are provided as additional information for investors. We believe these non-GAAP adjusted financial measures, which include EBITDA, adjusted EBITDA, adjusted EBITDA margin, organic and inorganic revenue, organic and inorganic growth, net debt, net leverage ratio, adjusted free cash flow and adjusted net income, are helpful to management and investors in highlighting trends in our operating results and provide greater clarity and comparability period over period to management and our investors regarding the operational impact of long-term strategic decisions as to capital structure, the tax jurisdictions in which we operate and capital investments. The presentation of this additional information is not meant to be considered in isolation or as a substitute for GAAP measures. For definitions of the non-GAAP adjusted financial measures used in this presentation and reconciliations to the most directly comparable respective GAAP measures, see the Appendix to this presentation. Forward-looking statement safe harbor and non-GAAP financial information

© 2021 EVOQUA WATER TECHNOLOGIES | 3 FINANCIAL HIGHLIGHTS LTM Q1'21 Evoqua Water Technologies overview At a glance $1.4B revenues $241M adjusted EBITDA 17% adjusted EBITDA margin WHAT WE DO Serve a large, growing and fragmented market Support full water lifecycle needs Ensure uninterrupted quantity & quality of water Across North America, Europe, Asia Pacific Across multiple end markets WHO WE ARE A leading provider of mission critical water and wastewater treatment solutions 100+ year legacy of quality, expertise and innovation Headquartered in Pittsburgh, PA 160 locations across 10 countries(1) 4,000+ employees(1) 38,000+ customers(1) 200,000+ installations worldwide(1) HOW WE DO IT Two segments Integrated Solutions & Services Applied Product Technologies 16 acquisitions since 2016 New product development Products, technologies & systems Services Water One® worry-free digital water management platform Outsourced water subscription based model Strong liquidity and cash generation WHY WE DO IT Water is a critical yet finite resource Issues of water scarcity and contamination Help ensure water is safe, reliable and available - now and for future generations Let customers focus on their core competencies while we focus on ours Sustainability is our responsibility and our opportunity… it's what we do every day $169M operating cash flow $125M adjusted free cash flow (1) Data as of September 30, 2020

© 2021 EVOQUA WATER TECHNOLOGIES | 4 $85 BILLION ADDRESSABLE MARKET(1) $16 BILLION SERVED MARKET (1) $600 BILLION GLOBAL WATER MARKET(1) (1) Management Estimates • Water treatment • Technology and innovation • Service and support • North America / Europe / Asia Pacific • Chemicals • Water transportation • Meters / pumps / valves • Design and construction Serving a large, growing and fragmented market WE SERVE $16 BILLION OF AN $85 BILLION MARKET (1) ACROSS A DIVERSE, GROWING SET OF SECTORS OF WHICH ~$10 BILLION INDUSTRIAL & ~$6 BILLION MUNICIPAL(1) FOOD & BEVERAGE AQUATICS MICROELECTRONICS HEALTHCARE & PHARMA MUNICIPAL DRINKING WATER POWER MUNICIPAL WASTE WATER CHEMICAL PROCESSING LIGHT & GENERAL INDUSTRY WE HOLD TOP POSITIONS ACROSS OUR END MARKETS REFINING MARINE ADDRESSED MARKETS UNADDRESSED MARKETS

© 2021 EVOQUA WATER TECHNOLOGIES | 5 Priorities in a COVID-19 impacted world PROTECT EMPLOYEES • Protect the health and safety of employees, customers, supply chain partners and communities • Follow CDC and other health guidelines • Ensure adequate PPE supplies for all personnel ENHANCE BUSINESS RESILIENCY • Maintain business continuity • Maximize customer operating uptime • Manage cost structure to support business priorities • Advance digital strategy IMPROVE LIQUIDITY AND BALANCE SHEET FLEXIBILITY • Manage for cash and liquidity while preserving employment base • Actively manage working capital • Continue to focus on financial deleveraging
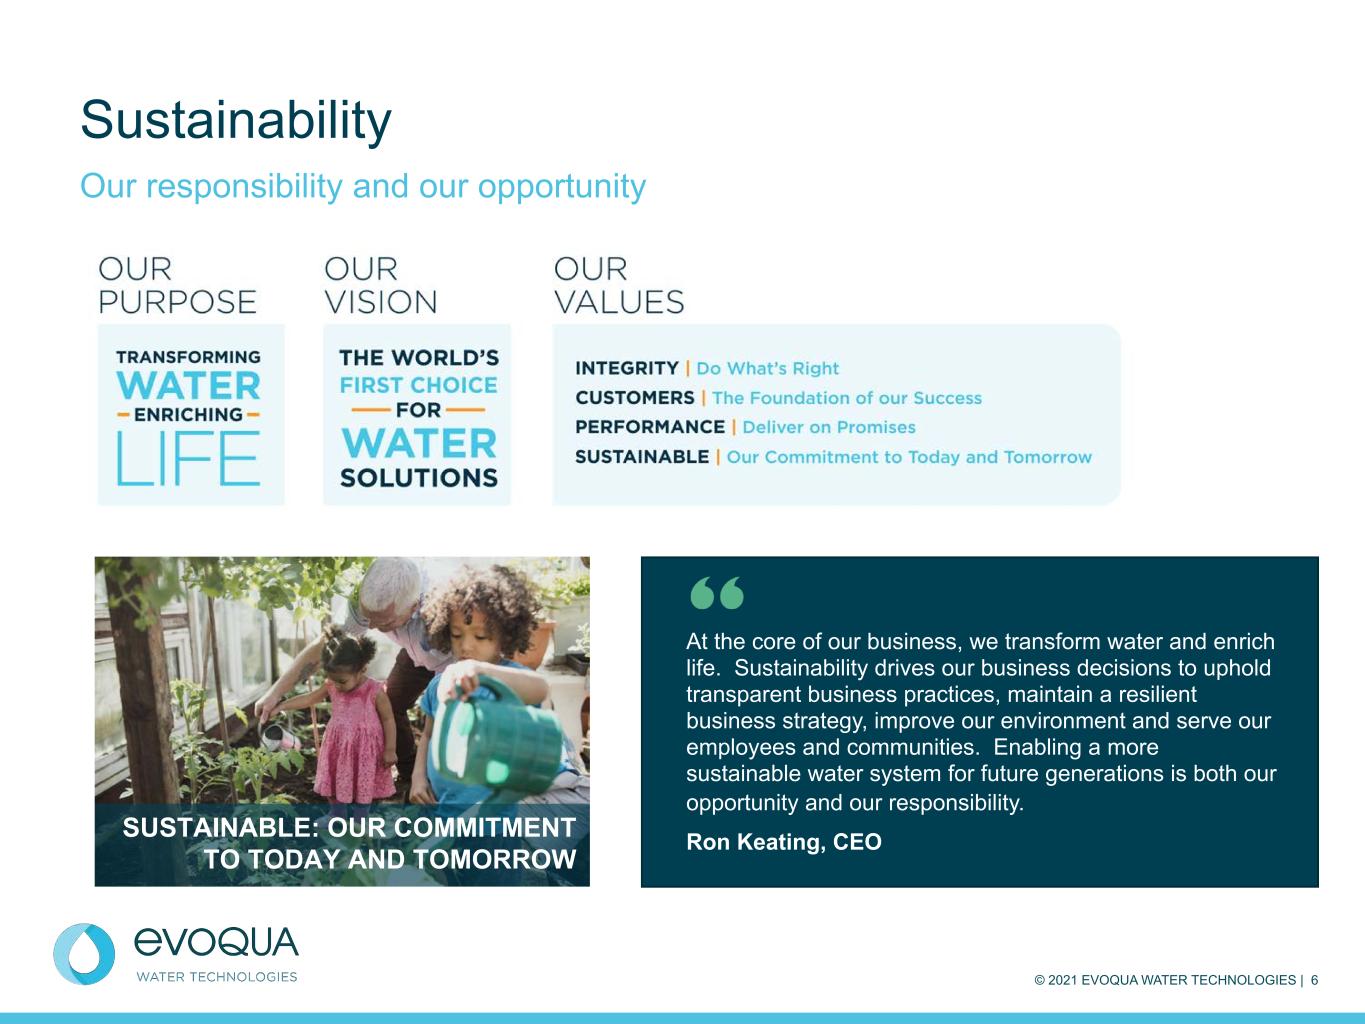
© 2021 EVOQUA WATER TECHNOLOGIES | 6 Sustainability Our responsibility and our opportunity At the core of our business, we transform water and enrich life. Sustainability drives our business decisions to uphold transparent business practices, maintain a resilient business strategy, improve our environment and serve our employees and communities. Enabling a more sustainable water system for future generations is both our opportunity and our responsibility. Ron Keating, CEOSUSTAINABLE: OUR COMMITMENT TO TODAY AND TOMORROW
© 2021 EVOQUA WATER TECHNOLOGIES | 7 EVOQUA PROVIDES PURE WATER FOR COVID-19 TEST VIALS A life-sciences company selected Evoqua to support the demand of one million COVID-19 testing vials a day. Evoqua’s water system provided pure water to retain the integrity of the testing samples. Evoqua provided to the customer a complete, integrated and fully- tested pure water system that included 11 water treatment components with a centralized digital control system. Making one million impacts a day High purity water is essential to this unique, nationally distributed COVID-19 vial-fill project. Consistent high purity water is a main ingredient in each of the test vials which helps maintain the integrity of the biological sample. I’m proud of the team that made a tremendous effort to get this system into place, and proud that we will touch the lives of a million people a day in such an important and impactful way. Rodney Aulick, President of Integrated Solutions & Services Segment

© 2021 EVOQUA WATER TECHNOLOGIES | 8 $507 $516 $520 $529 $538 $537 $536 $538 $551 $563 $581 $593 $600 $604 $594 $590 $582 $656 $677 $690 $718 $727 $761 $794 $802 $815 $818 $817 $851 $868 $867 $864 $840 $823 $1,163 $1,193 $1,210 $1,247 $1,265 $1,298 $1,330 $1,340 $1,366 $1,381 $1,398 $1,444 $1,468 $1,471 $1,458 $1,430 $1,406 Services Products Q1'17 Q2'17 Q3'17 Q4'17 Q1'18 Q2'18 Q3'18 Q4'18 Q1'19 Q2'19 Q3'19 Q4'19 Q1'20 Q2'20 Q3'20 Q4'20 Q1'21 ROLLING LTM REVENUE AND ADJUSTED EBITDA ($ in millions) Adj. EBITDA(1) % (1) Historical results include Memcor. Annual revenues ~$60 million and ~$14.4 million in FY19 and FY20, respectively. Annual adjusted EBITDA ~$8.1 million and ~$1.3 million in FY19 and FY20, respectively. LTM revenue and profitability development CAGR 8.8% adjusted EBITDA Adj. EBITDA(1) ($M) 3.5% Services 5.8% Products 4.9% Total $172 $186 $196 $208 $210 $224 $227 $217 $215 $214 $217 $235 $240 $240 $243 $240 $241 14.8% 15.6% 16.2% 16.7% 16.6% 17.3% 17.1% 16.2% 15.8% 15.5% 15.5% 16.3% 16.4% 16.3% 16.7% 16.8% 17.1% LTM results impacted by Memcor divestiture (1) Impacted by Memcor divestiture(1)
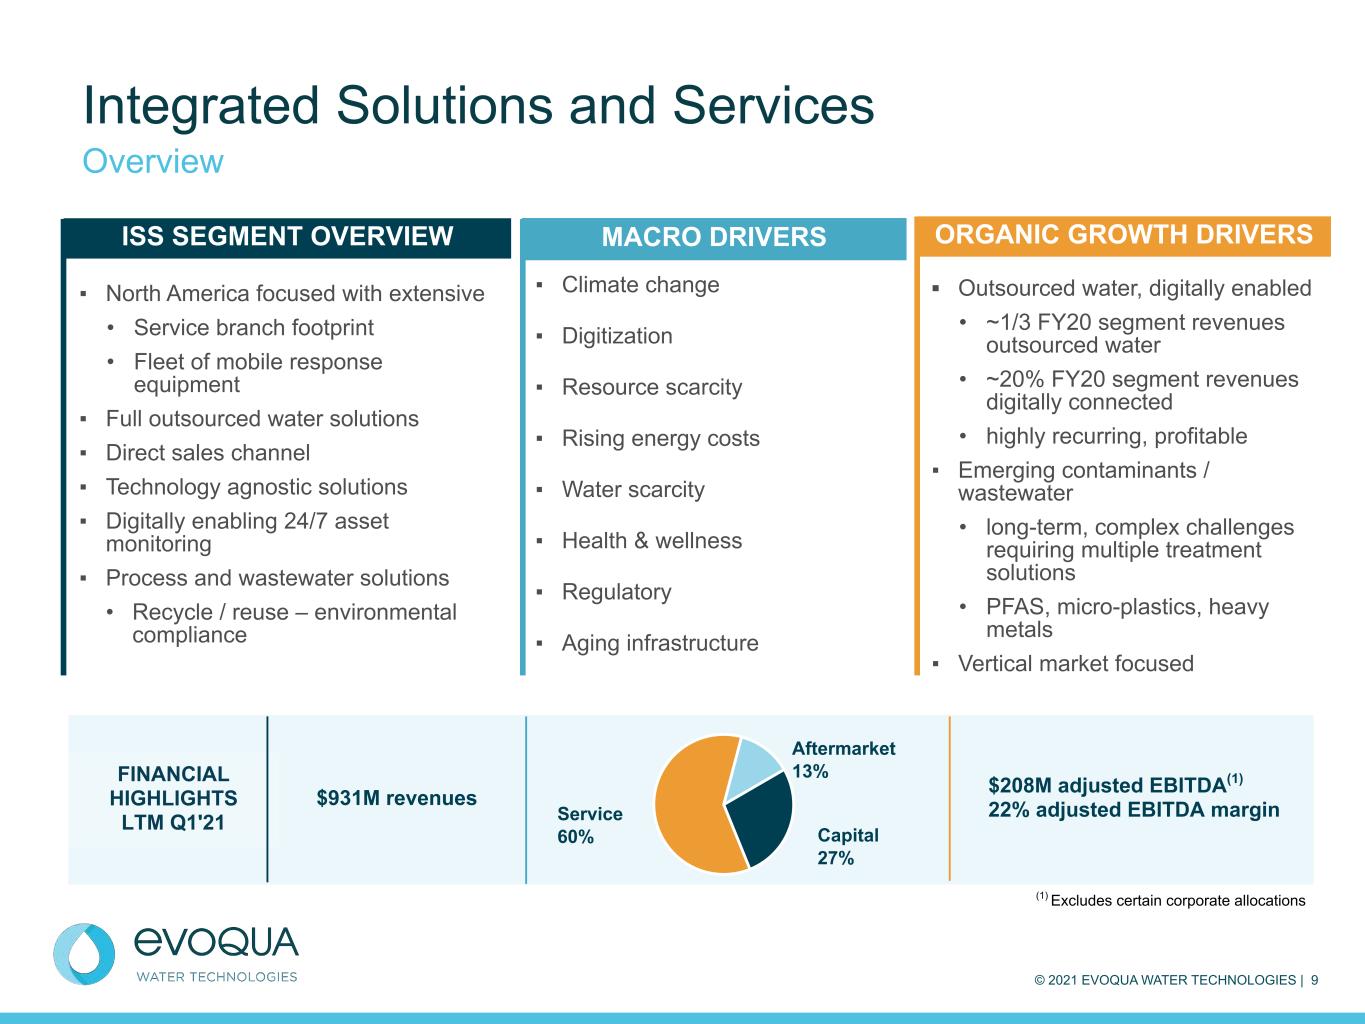
© 2021 EVOQUA WATER TECHNOLOGIES | 9 Integrated Solutions and Services Overview ▪ North America focused with extensive • Service branch footprint • Fleet of mobile response equipment ▪ Full outsourced water solutions ▪ Direct sales channel ▪ Technology agnostic solutions ▪ Digitally enabling 24/7 asset monitoring ▪ Process and wastewater solutions • Recycle / reuse – environmental compliance $931M revenues (1) Excludes certain corporate allocations Service 60% Aftermarket 13% Capital 27% FINANCIAL HIGHLIGHTS LTM Q1'21 $208M adjusted EBITDA(1) 22% adjusted EBITDA margin ▪ Outsourced water, digitally enabled • ~1/3 FY20 segment revenues outsourced water • ~20% FY20 segment revenues digitally connected • highly recurring, profitable ▪ Emerging contaminants / wastewater • long-term, complex challenges requiring multiple treatment solutions • PFAS, micro-plastics, heavy metals ▪ Vertical market focused ISS SEGMENT OVERVIEW MACRO DRIVERS ORGANIC GROWTH DRIVERS ▪ Climate change ▪ Digitization ▪ Resource scarcity ▪ Rising energy costs ▪ Water scarcity ▪ Health & wellness ▪ Regulatory ▪ Aging infrastructure
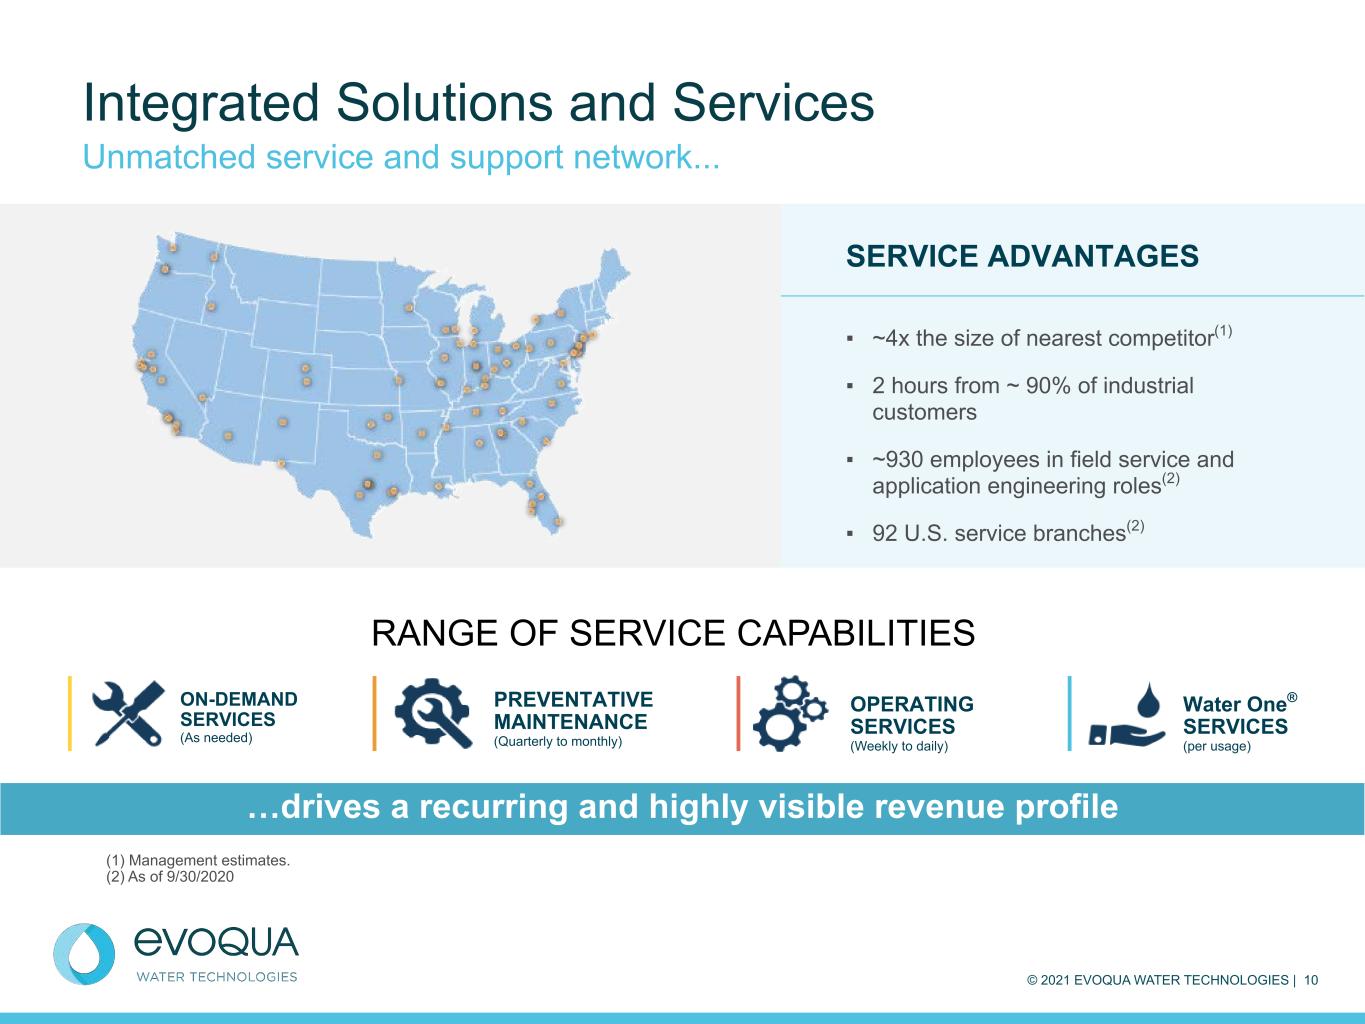
© 2021 EVOQUA WATER TECHNOLOGIES | 10 Integrated Solutions and Services Unmatched service and support network... RANGE OF SERVICE CAPABILITIES …drives a recurring and highly visible revenue profile SERVICE ADVANTAGES ▪ ~4x the size of nearest competitor(1) ▪ 2 hours from ~ 90% of industrial customers ▪ ~930 employees in field service and application engineering roles(2) ▪ 92 U.S. service branches(2) Water One® SERVICES (per usage) ON-DEMAND SERVICES (As needed) OPERATING SERVICES (Weekly to daily) PREVENTATIVE MAINTENANCE (Quarterly to monthly) (1) Management estimates. (2) As of 9/30/2020
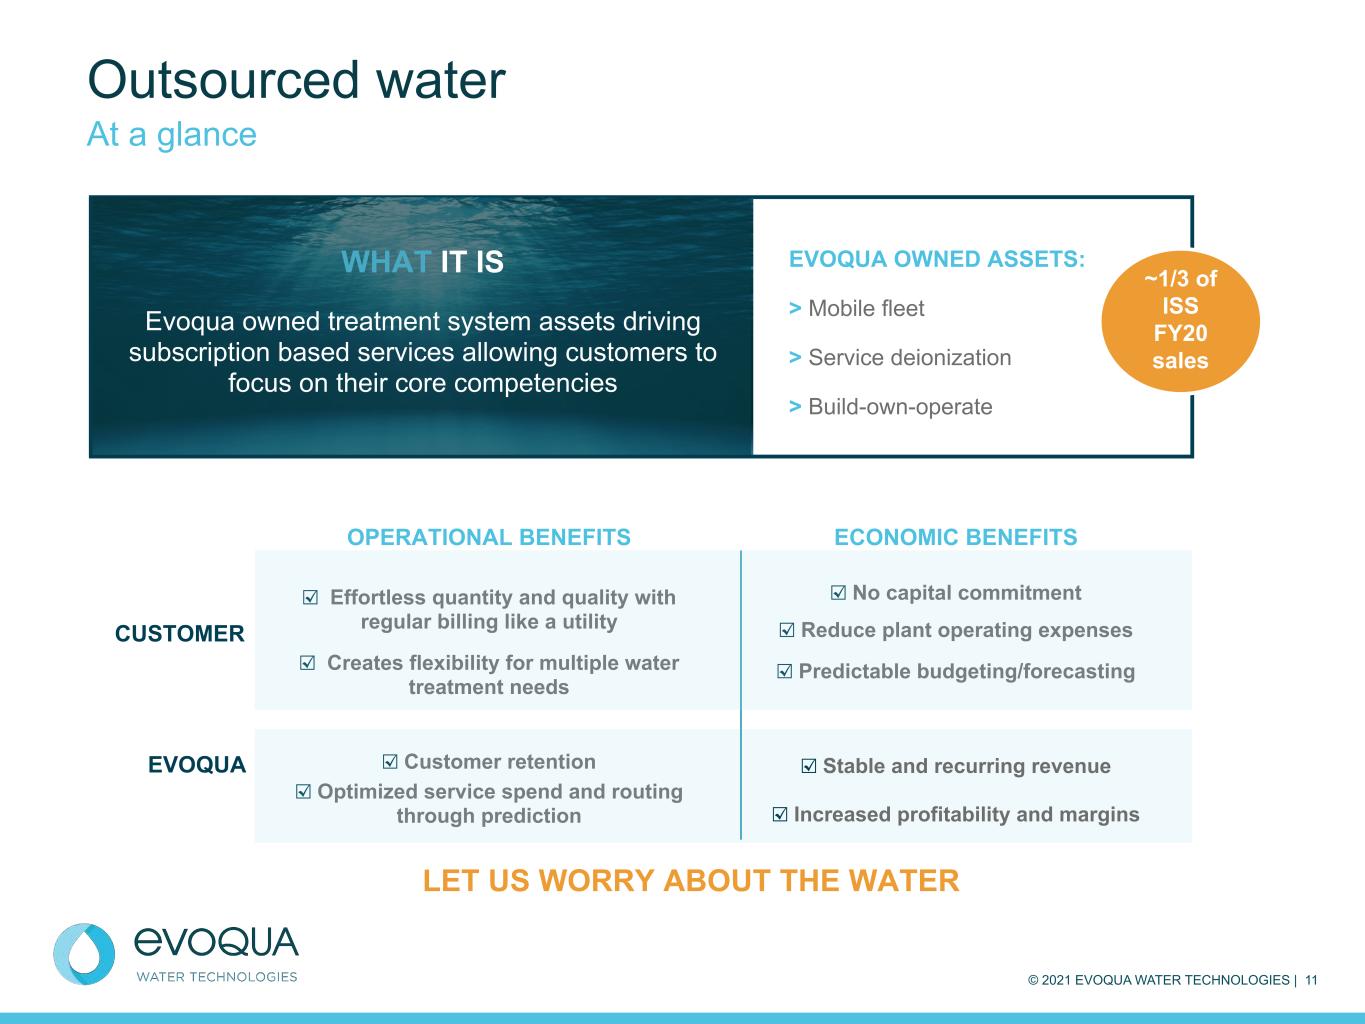
© 2021 EVOQUA WATER TECHNOLOGIES | 11 OPERATIONAL BENEFITS ☑ Effortless quantity and quality with regular billing like a utility ☑ Creates flexibility for multiple water treatment needs ☑ Customer retention ☑ Optimized service spend and routing through prediction ECONOMIC BENEFITS ☑ No capital commitment ☑ Reduce plant operating expenses ☑ Predictable budgeting/forecasting ☑ Stable and recurring revenue ☑ Increased profitability and margins Outsourced water At a glance CUSTOMER EVOQUA WHAT IT IS Evoqua owned treatment system assets driving subscription based services allowing customers to focus on their core competencies EVOQUA OWNED ASSETS: > Mobile fleet > Service deionization > Build-own-operate ~1/3 of ISS FY20 sales LET US WORRY ABOUT THE WATER

© 2021 EVOQUA WATER TECHNOLOGIES | 12 Order value - capital Order value - service Capital revenue Service revenue Aftermarket revenue Book Order Build-out Year 2 Year 3 Year 4 $— $3 $5 $8 Capital order lifecycle Illustrative example of a $5M capital order This information represents a hypothetical order and is not based on any actual order. Actual orders involve risks and uncertainties, and actual results may differ materially from the information presented on this slide. Please review slide 2 and our SEC filings for a discussion of these risks and uncertainties. $ revenues in millions Assumptions: – $8M total order: • $5M capital project ◦ asset owned by customer ◦ 1 year build-out ◦ Evoqua recognizes revenue during build- out • 3 year service contract ($1M/year) • aftermarket revenue as needed – high service contract renewal rate (90%+) 90%+ renewal Pursue capital opportunities to drive recurring and more profitable service and aftermarket revenues

© 2021 EVOQUA WATER TECHNOLOGIES | 13 Order value Evoqua capex Equipment financing Subscription service revenue Book Order Evoqua Capex LT Financing Year 2 Year 3 Year 4 Year 5 Year 6 Year 7 Year 8 Year 9 Year 10 Year 11 $— $5 $10 $15 $20 Outsourced water (build-own-operate) order lifecycle Illustrative example of a $20M outsourced water build-own-operate order This information represents a hypothetical order and is not based on any actual order. Actual orders involve risks and uncertainties, and actual results may differ materially from the information presented on this slide. Please review slide 2 and our SEC filings for a discussion of these risks and uncertainties. *Note that this represents the fixed subscription fee in contract which is based on certain water quantity and quality requirements. Additional fees may apply if water quantity/quality exceeds negotiated ranges. Typical contracts include CPI market pricing adjustments. $ in millions Assumptions: – $20M total order: – 10 year outsourced water contract – $5M Evoqua capex – Evoqua owned asset – 1 year build-out – $2M annual fee (capital recovery, finance charge, service and aftermarket)* – Equipment financed at 80% - 90% of capex spend – Contract maturity options: – Customer renews contract (high service contract renewal rate 90%+) – Customer buys equipment at FMV 90%+ renewal Building a long-term subscription based revenue model; Expected IRR post financing 30%+

© 2021 EVOQUA WATER TECHNOLOGIES | 14 Applied Product Technologies Overview ▪ Highly differentiated and scalable products and technologies ▪ Technologies and products sold as • discrete offerings, or • components of broader solutions ▪ Sold through indirect channels ▪ Global geographic reach serving North America, EMEA and APAC ▪ Specified by water treatment designers, OEMs and engineers $102 million adjusted EBITDA(1) 22% adjusted EBITDA margin (1) Excludes certain corporate allocations Service 5% Aftermarket 24% Capital 71% FINANCIAL HIGHLIGHTS LTM Q1'21 $475M revenues APT SEGMENT OVERVIEW MACRO DRIVERS ORGANIC GROWTH DRIVERS ▪ New product introduction • delivering solutions through innovation ▪ Channel and end market expansion • international focus • leverage ISS as a channel ▪ Digital connection • digitization of customer experience / E-commerce ▪ Climate change ▪ Digitization ▪ Resource scarcity ▪ Rising energy costs ▪ Water scarcity ▪ Health & wellness ▪ Regulatory ▪ Aging infrastructure
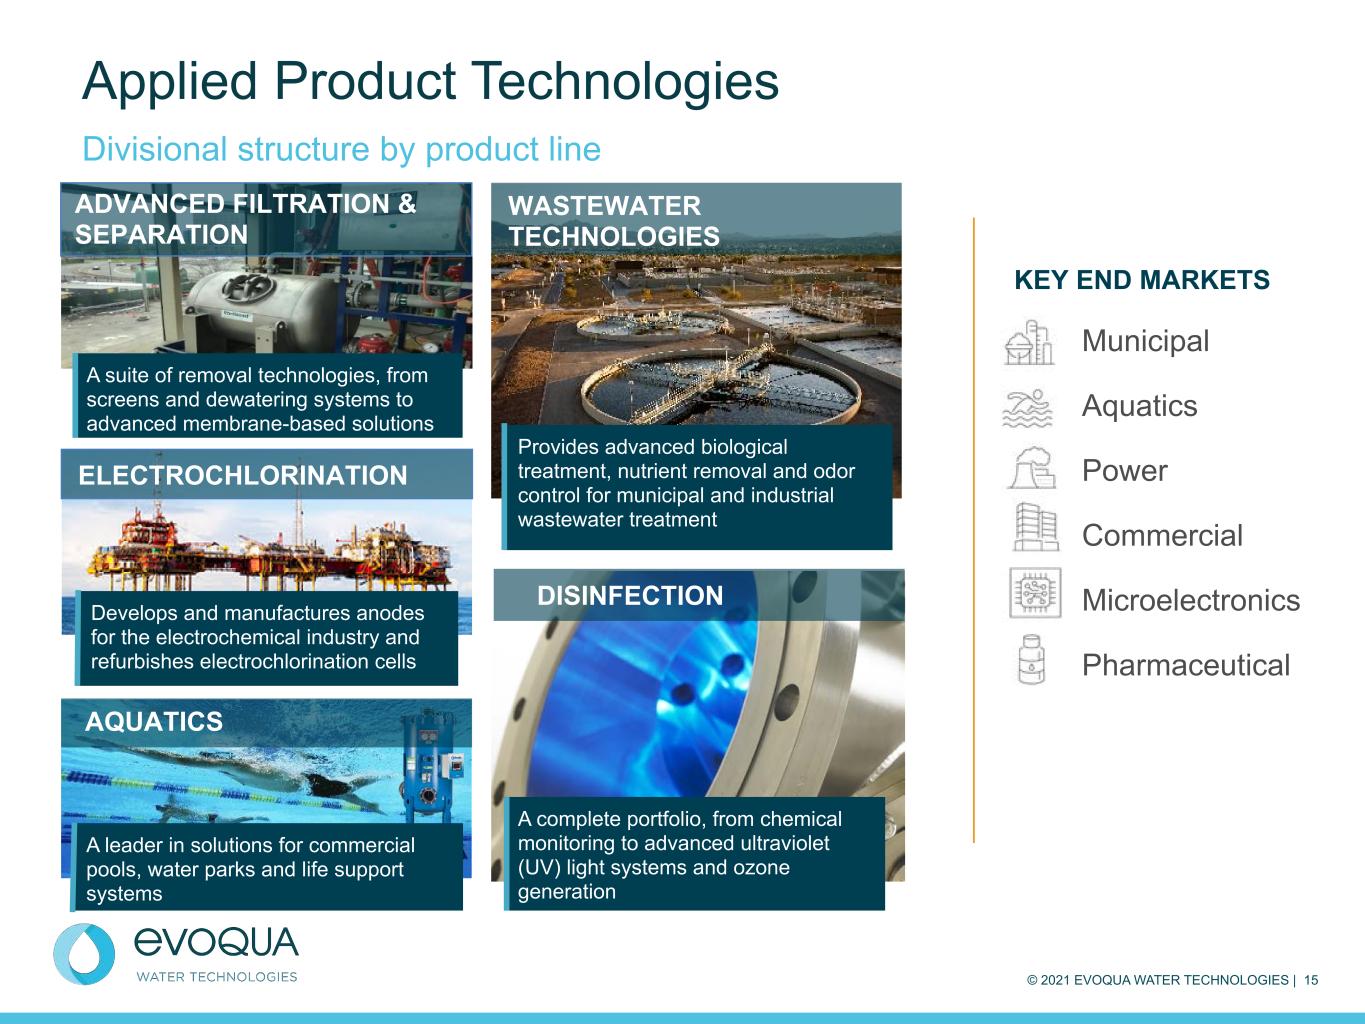
© 2021 EVOQUA WATER TECHNOLOGIES | 15 Applied Product Technologies Divisional structure by product line AQUATICS A leader in solutions for commercial pools, water parks and life support systems DISINFECTION A complete portfolio, from chemical monitoring to advanced ultraviolet (UV) light systems and ozone generation ELECTROCHLORINATION Develops and manufactures anodes for the electrochemical industry and refurbishes electrochlorination cells WASTEWATER TECHNOLOGIES Provides advanced biological treatment, nutrient removal and odor control for municipal and industrial wastewater treatment ADVANCED FILTRATION & SEPARATION A suite of removal technologies, from screens and dewatering systems to advanced membrane-based solutions Municipal Aquatics Power Commercial Microelectronics Pharmaceutical KEY END MARKETS
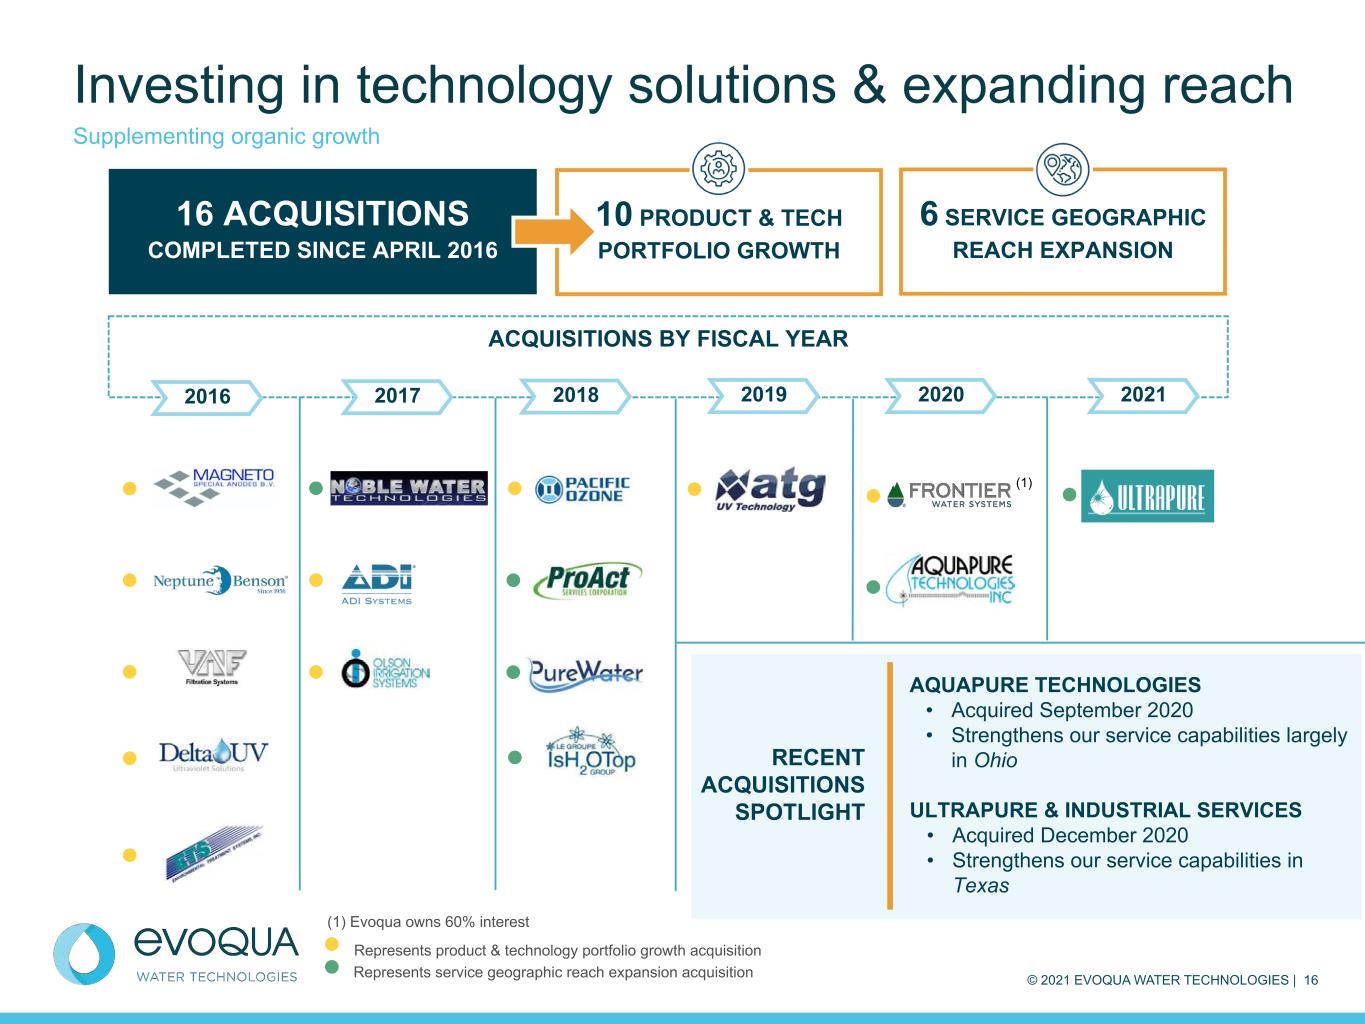
© 2021 EVOQUA WATER TECHNOLOGIES | 16 ACQUISITIONS BY FISCAL YEAR 10 PRODUCT & TECH PORTFOLIO GROWTH (1) (1) Evoqua owns 60% interest Investing in technology solutions & expanding reach Supplementing organic growth 16 ACQUISITIONS COMPLETED SINCE APRIL 2016 6 SERVICE GEOGRAPHIC REACH EXPANSION 2016 Represents product & technology portfolio growth acquisition Represents service geographic reach expansion acquisition AQUAPURE TECHNOLOGIES • Acquired September 2020 • Strengthens our service capabilities largely in Ohio ULTRAPURE & INDUSTRIAL SERVICES • Acquired December 2020 • Strengthens our service capabilities in Texas RECENT ACQUISITIONS SPOTLIGHT 2017 2018 2019 2020 2021

© 2021 EVOQUA WATER TECHNOLOGIES | 17 CUSTOMER BENEFITS EVOQUA BENEFITS Increased ROI Continuous Monitoring and Control Human Resource Efficiency Increased Compliance Potentially Lower Capital Increased Profitability Stable & Recurring Revenue Expanded Margins Uptime of Service Operational Efficiency & Enablement Transitions customers to pricing models based on usage Evoqua’s digital outsourced water offering combines key technologies (such as service deionization, build-own-operate, municipal services) with outcome-based water guarantees Using 24/7/365 remote monitoring, Evoqua provides proactive, predictive services to maintain customer water needs Water One® Enabling Evoqua’s digital outsourced water offering
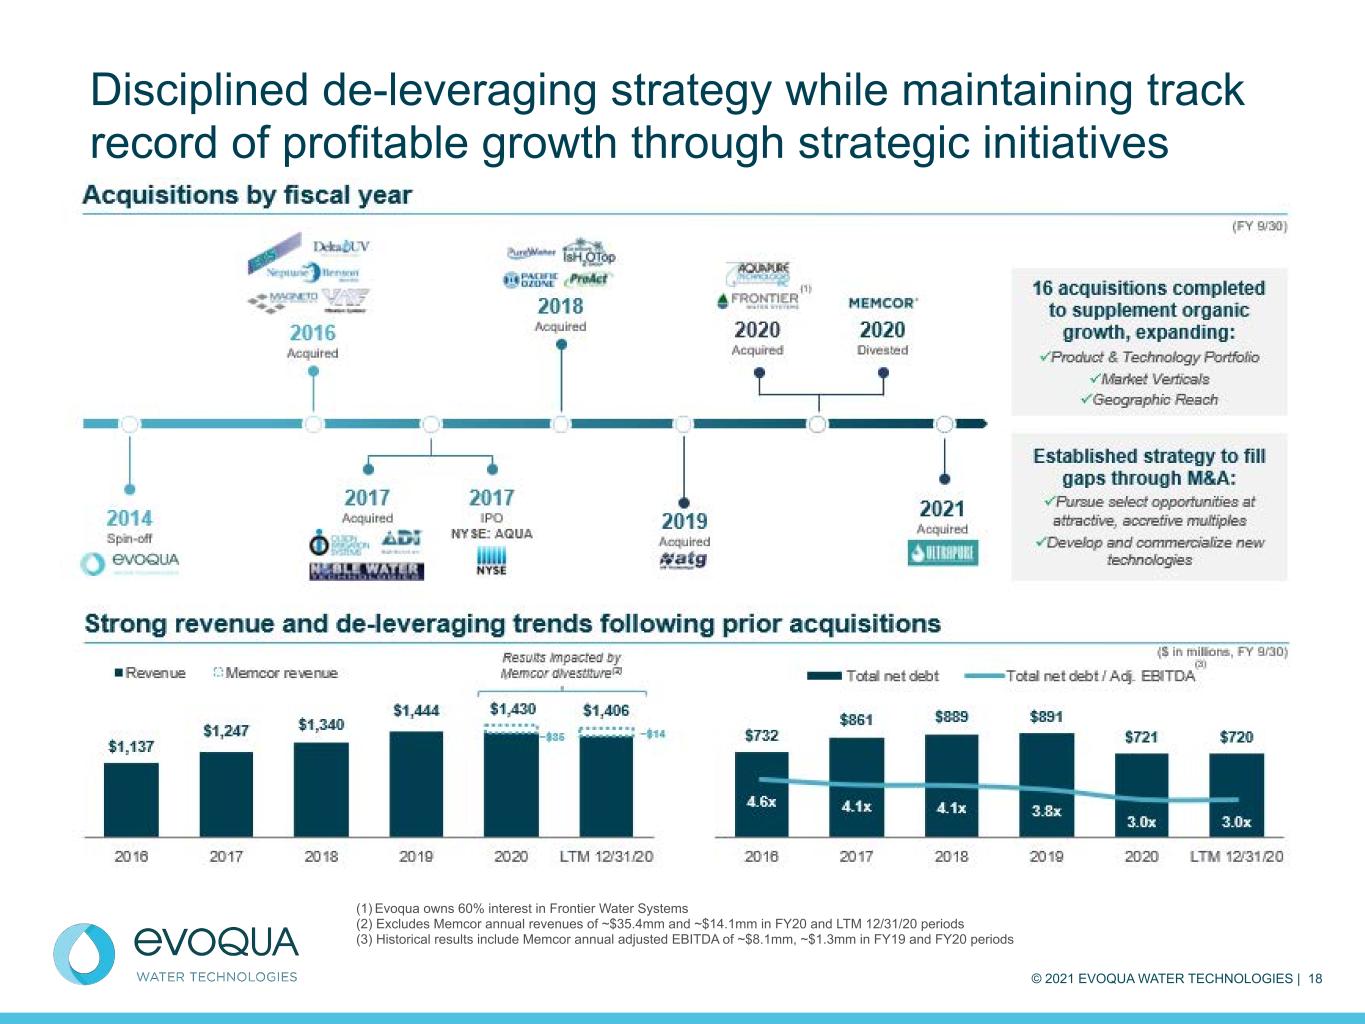
© 2021 EVOQUA WATER TECHNOLOGIES | 18 Disciplined de-leveraging strategy while maintaining track record of profitable growth through strategic initiatives (1) Evoqua owns 60% interest in Frontier Water Systems (2) Excludes Memcor annual revenues of ~$35.4mm and ~$14.1mm in FY20 and LTM 12/31/20 periods (3) Historical results include Memcor annual adjusted EBITDA of ~$8.1mm, ~$1.3mm in FY19 and FY20 periods

© 2021 EVOQUA WATER TECHNOLOGIES | 19 IMPROVEMENT DRIVEN BY NWC INITIATIVES Adjusted free cash flow includes growth capex financings of $3.5 million and $7.8 million in Q1'20 and Q1'21, respectively Cash generation $0.6 $9.6 Q1'20 Q1'21 ($ in millions) (Total net debt to adjusted EBITDA) 3.8x 3.4x 3.3x 3.1x 3.0x 3.0x Q4'19 Q1'20 Q2'20 Q3'20 Q4'20 Q1'21 NET LEVERAGE RATIOADJUSTED FREE CASH FLOW $4.7 $15.6 Q1'20 Q1'21 OPERATING CASH FLOW ($ in millions) 12.5 % 133.3 % ADJUSTED FCF CONVERSION as % of adjusted net income LTM CASH FLOW $28.5 $81.0 $125.2 $158.4 $169.3 Operating cash flow Adjusted free cash flow FY17 FY18 FY19 FY20 LTM Q1'21 ($ in millions)
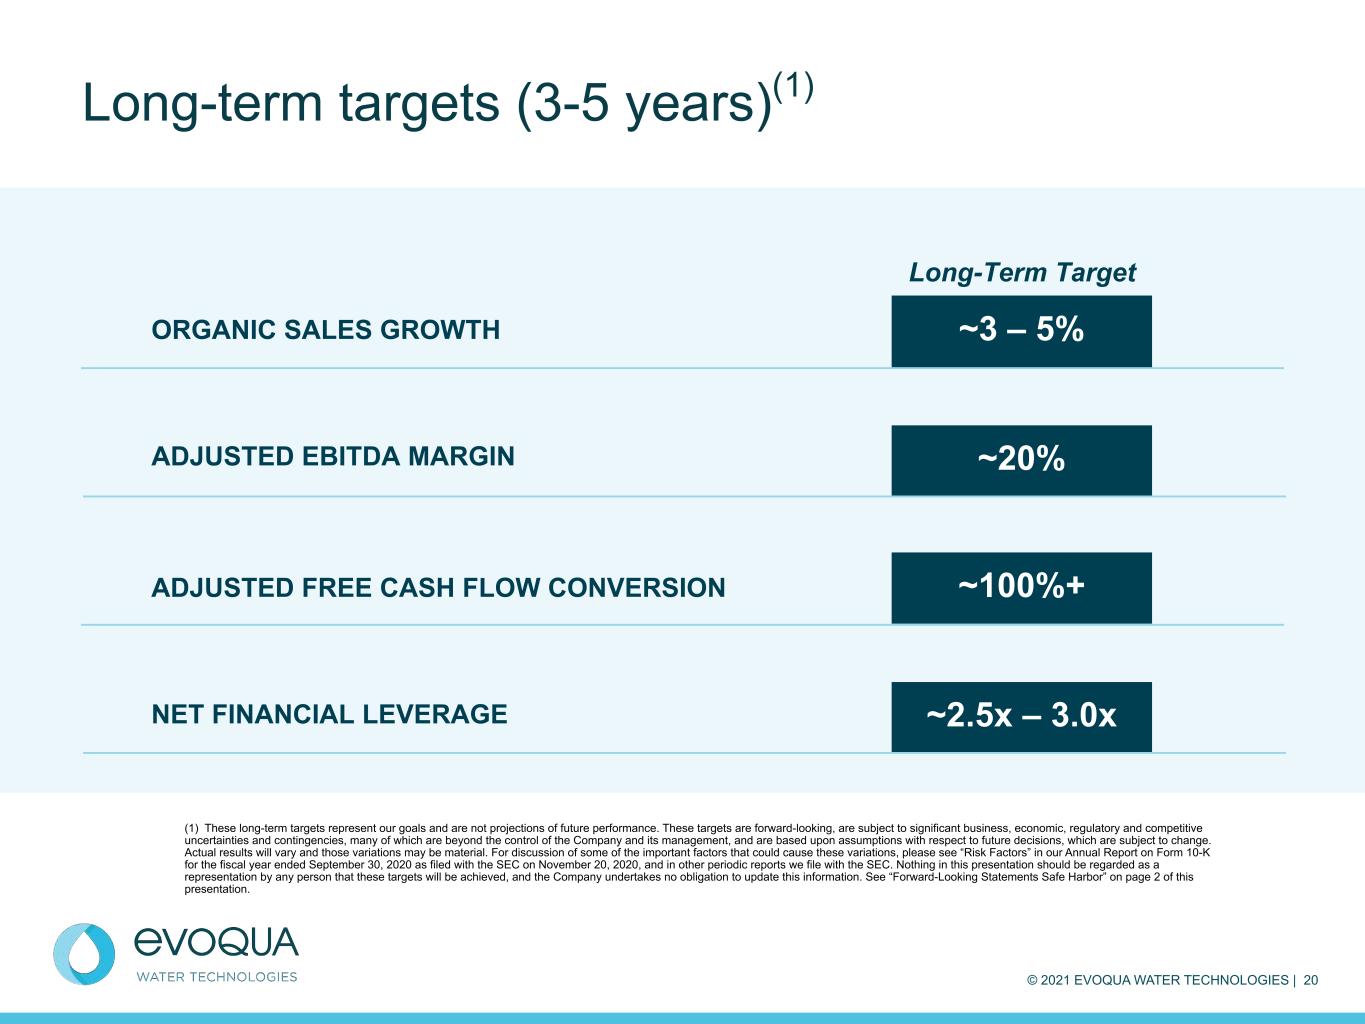
© 2021 EVOQUA WATER TECHNOLOGIES | 20 Long-term targets (3-5 years)(1) ORGANIC SALES GROWTH ~3 – 5% ADJUSTED EBITDA MARGIN ~20% ADJUSTED FREE CASH FLOW CONVERSION ~100%+ NET FINANCIAL LEVERAGE ~2.5x – 3.0x Long-Term Target (1) These long-term targets represent our goals and are not projections of future performance. These targets are forward-looking, are subject to significant business, economic, regulatory and competitive uncertainties and contingencies, many of which are beyond the control of the Company and its management, and are based upon assumptions with respect to future decisions, which are subject to change. Actual results will vary and those variations may be material. For discussion of some of the important factors that could cause these variations, please see “Risk Factors” in our Annual Report on Form 10-K for the fiscal year ended September 30, 2020 as filed with the SEC on November 20, 2020, and in other periodic reports we file with the SEC. Nothing in this presentation should be regarded as a representation by any person that these targets will be achieved, and the Company undertakes no obligation to update this information. See “Forward-Looking Statements Safe Harbor” on page 2 of this presentation.
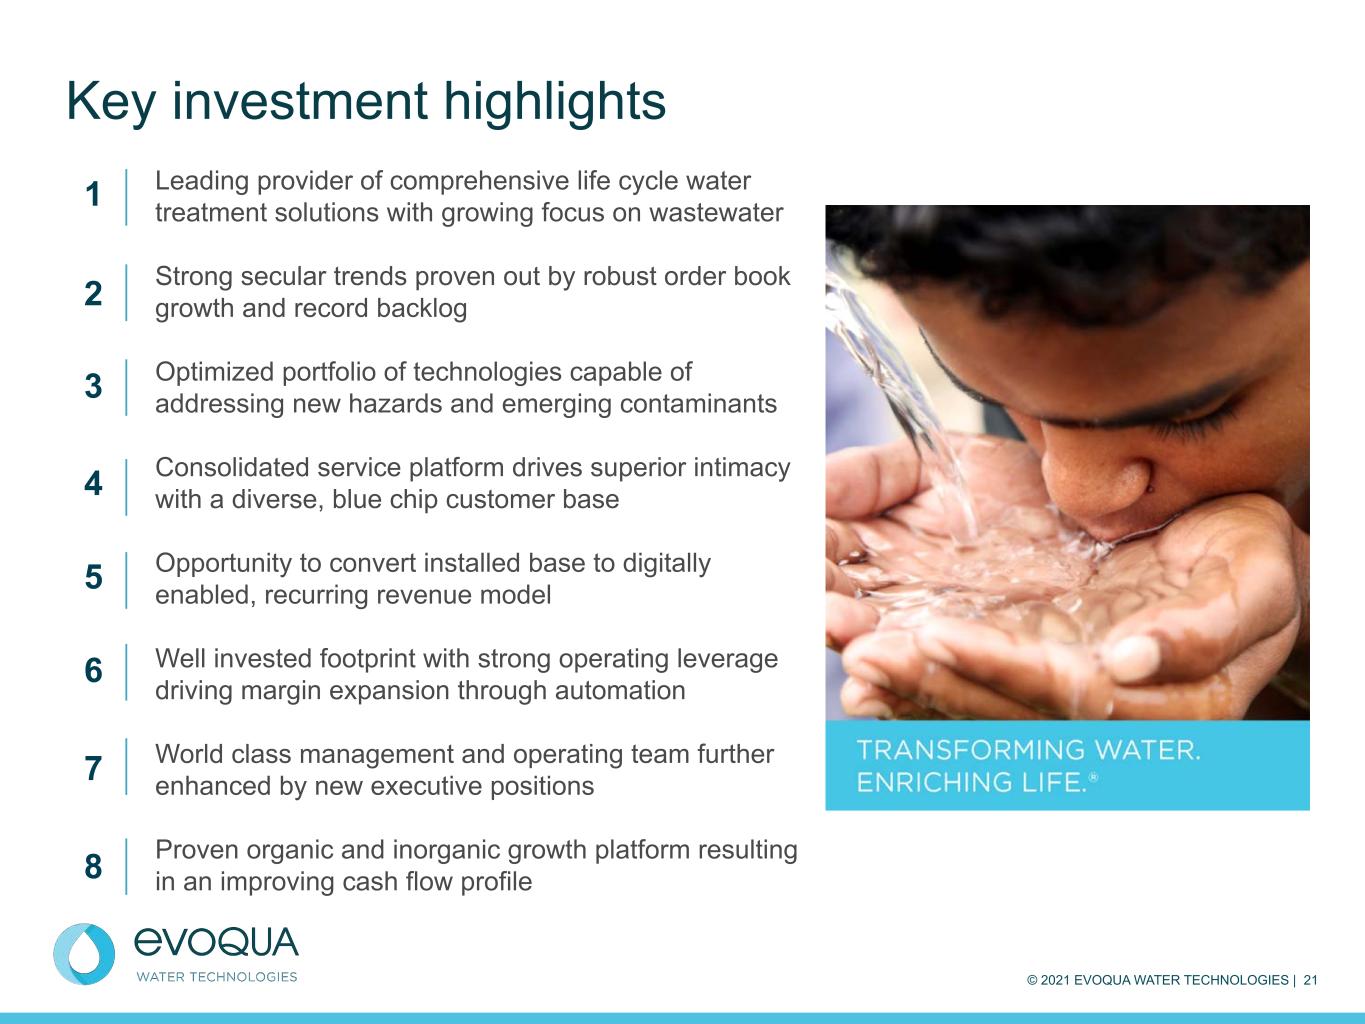
© 2021 EVOQUA WATER TECHNOLOGIES | 21 Leading provider of comprehensive life cycle water treatment solutions with growing focus on wastewater Strong secular trends proven out by robust order book growth and record backlog Optimized portfolio of technologies capable of addressing new hazards and emerging contaminants Consolidated service platform drives superior intimacy with a diverse, blue chip customer base Opportunity to convert installed base to digitally enabled, recurring revenue model Well invested footprint with strong operating leverage driving margin expansion through automation World class management and operating team further enhanced by new executive positions Proven organic and inorganic growth platform resulting in an improving cash flow profile Key investment highlights 1 2 3 4 5 6 7 8
©2021 EVOQUA WATER TECHNOLOGIES | 22 Appendix
© 2021 EVOQUA WATER TECHNOLOGIES | 23 Management reviews key performance indicators including revenue, margins, segment operating income and margins, orders growth, working capital and backlog, among others. In addition, we consider certain non-GAAP measures to be useful to management and investors evaluating our operating performance for the periods presented, and to provide a tool for evaluating our ongoing operations, liquidity, management of assets and future prospects. This information can assist investors in assessing our financial performance and measures our ability to generate capital for deployment among competing strategic alternatives and initiatives, including but not limited to: dividends, acquisitions, share repurchases and debt repayment. These adjusted metrics are consistent with how management views our business and are used to make financial, operating, budgeting, planning and strategic decisions. These metrics, however, are not measures of financial performance under GAAP and should not be considered a substitute for revenue, operating income, net income, earnings per share (basic and diluted) or net cash from operating activities as determined in accordance with GAAP. We consider the following non-GAAP measures, which may not be comparable to similarly titled measures reported by other companies, to be key performance indicators: “EBITDA” defined as earnings before interest, taxes, depreciation and amortization expense. “Adjusted EBITDA” reflects the adjustment to EBITDA to exclude certain other items, including restructuring and related business transformation costs, purchase accounting adjustment costs, non-cash share-based compensation, sponsor fees, transaction costs and other gains, losses and expenses. "Adjusted EBITDA" on a segment level further reflects the adjustment for the impact of certain other items that have been adjusted at the segment level. "Adjusted EBITDA margin" defined as adjusted EBITDA as a percentage of revenue. "Adjusted free cash flow” defined as net cash from operating activities, as reported in the Statement of Cash Flows, less capital expenditures as well as adjustments for other significant items that impact current results which management believes are not related to our ongoing operations and performance. Our definition of free cash flow does not consider certain non-discretionary cash payments, such as debt. "Adjusted free cash flow conversion" defined as adjusted free cash flow divided by adjusted net income. “Adjusted net income” defined as net income adjusted to exclude certain other items, including restructuring and related business transformation costs, purchase accounting adjustment costs, non-cash share-based compensation, sponsor fees, transaction costs and other gains, losses and expenses. "Organic revenue" defined as revenues excluding the impact of foreign exchange and inorganic revenue. "Inorganic revenue" defined as revenues from acquisitions and divestitures. "Total net debt" defined as total debt including finance leases less unamortized deferred financing fees minus cash and cash equivalents. "Net leverage ratio" defined as total net debt divided by adjusted EBITDA. Non-GAAP measures
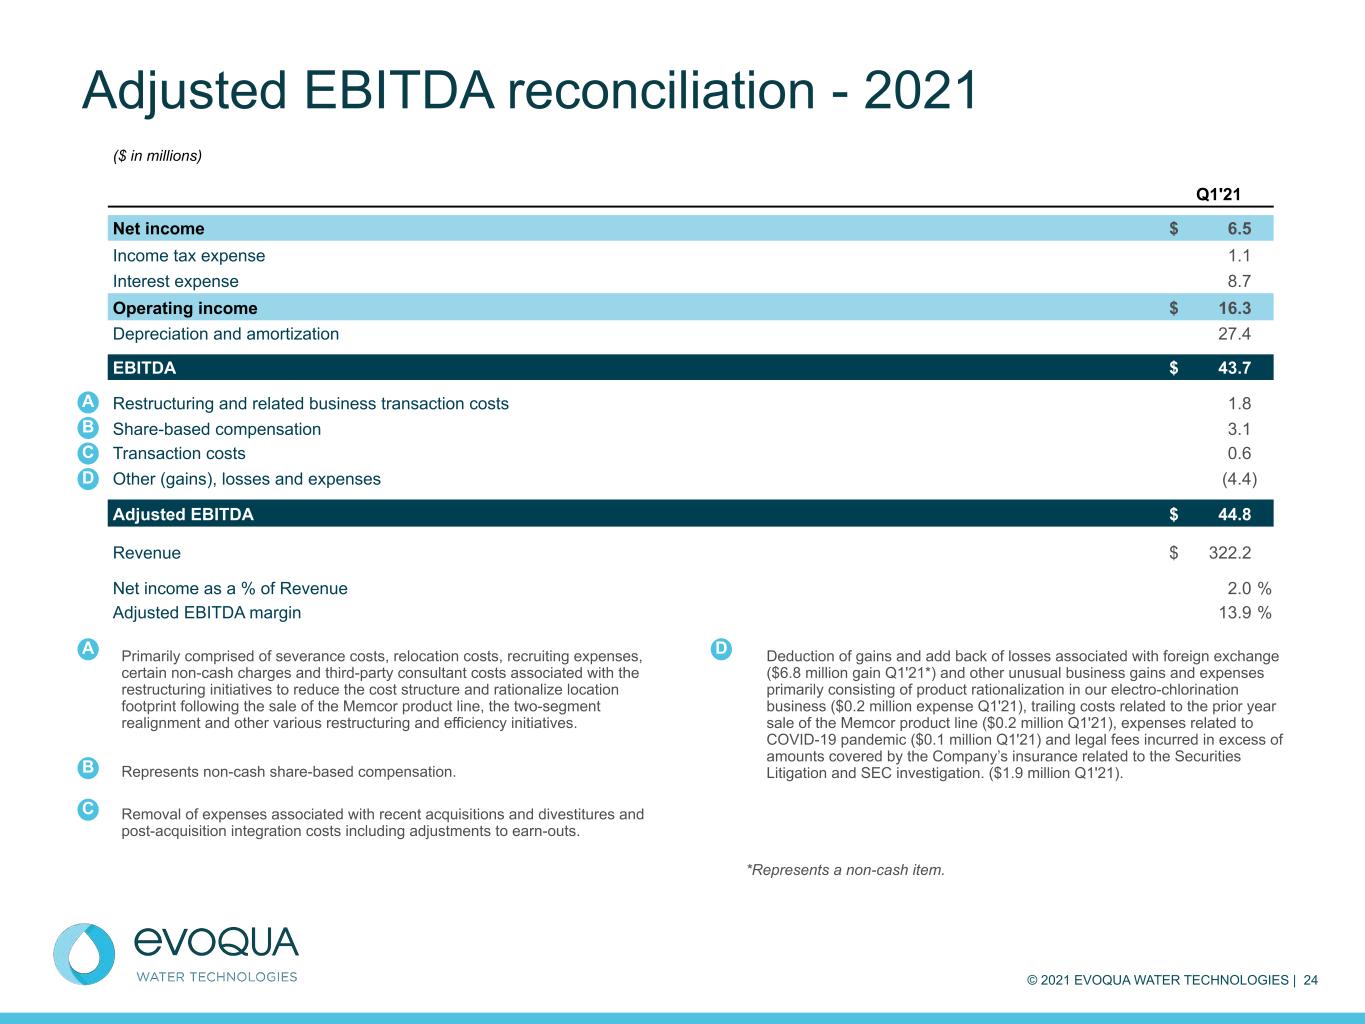
© 2021 EVOQUA WATER TECHNOLOGIES | 24 Adjusted EBITDA reconciliation - 2021 ($ in millions) Q1'21 Net income $ 6.5 Income tax expense 1.1 Interest expense 8.7 Operating income $ 16.3 Depreciation and amortization 27.4 EBITDA $ 43.7 Restructuring and related business transaction costs 1.8 Share-based compensation 3.1 Transaction costs 0.6 Other (gains), losses and expenses (4.4) Adjusted EBITDA $ 44.8 Revenue $ 322.2 Net income as a % of Revenue 2.0 % Adjusted EBITDA margin 13.9 % A C D Primarily comprised of severance costs, relocation costs, recruiting expenses, certain non-cash charges and third-party consultant costs associated with the restructuring initiatives to reduce the cost structure and rationalize location footprint following the sale of the Memcor product line, the two-segment realignment and other various restructuring and efficiency initiatives. Represents non-cash share-based compensation. Removal of expenses associated with recent acquisitions and divestitures and post-acquisition integration costs including adjustments to earn-outs. Deduction of gains and add back of losses associated with foreign exchange ($6.8 million gain Q1'21*) and other unusual business gains and expenses primarily consisting of product rationalization in our electro-chlorination business ($0.2 million expense Q1'21), trailing costs related to the prior year sale of the Memcor product line ($0.2 million Q1'21), expenses related to COVID-19 pandemic ($0.1 million Q1'21) and legal fees incurred in excess of amounts covered by the Company’s insurance related to the Securities Litigation and SEC investigation. ($1.9 million Q1'21). *Represents a non-cash item. B A B C D
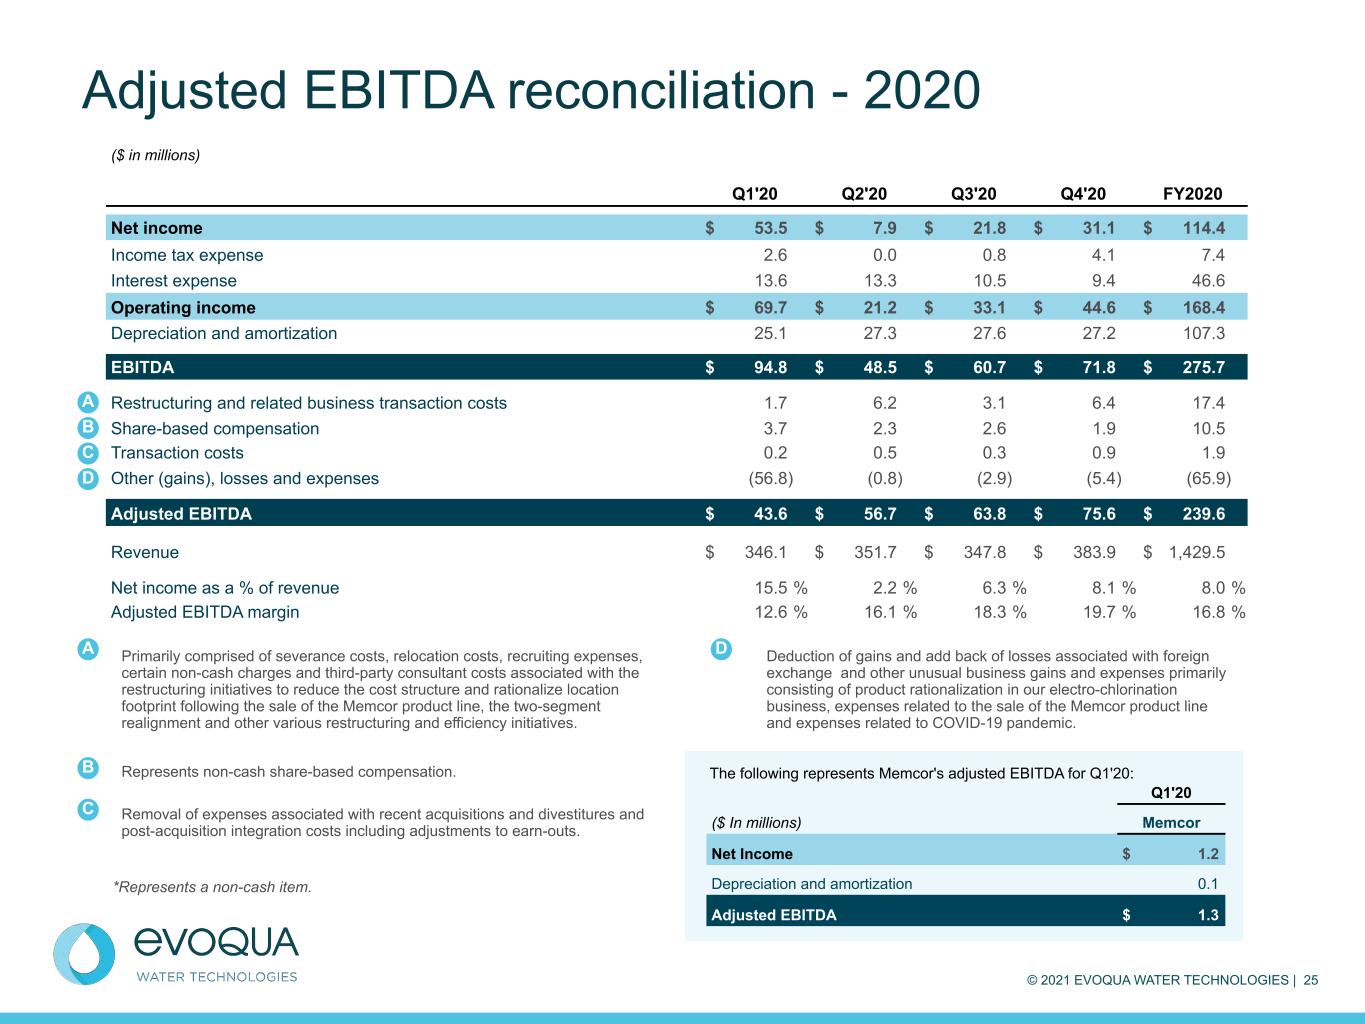
© 2021 EVOQUA WATER TECHNOLOGIES | 25 Adjusted EBITDA reconciliation - 2020 ($ in millions) Q1'20 Q2'20 Q3'20 Q4'20 FY2020 Net income $ 53.5 $ 7.9 $ 21.8 $ 31.1 $ 114.4 Income tax expense 2.6 0.0 0.8 4.1 7.4 Interest expense 13.6 13.3 10.5 9.4 46.6 Operating income $ 69.7 $ 21.2 $ 33.1 $ 44.6 $ 168.4 Depreciation and amortization 25.1 27.3 27.6 27.2 107.3 EBITDA $ 94.8 $ 48.5 $ 60.7 $ 71.8 $ 275.7 Restructuring and related business transaction costs 1.7 6.2 3.1 6.4 17.4 Share-based compensation 3.7 2.3 2.6 1.9 10.5 Transaction costs 0.2 0.5 0.3 0.9 1.9 Other (gains), losses and expenses (56.8) (0.8) (2.9) (5.4) (65.9) Adjusted EBITDA $ 43.6 $ 56.7 $ 63.8 $ 75.6 $ 239.6 Revenue $ 346.1 $ 351.7 $ 347.8 $ 383.9 $ 1,429.5 Net income as a % of revenue 15.5 % 2.2 % 6.3 % 8.1 % 8.0 % Adjusted EBITDA margin 12.6 % 16.1 % 18.3 % 19.7 % 16.8 % A C D Primarily comprised of severance costs, relocation costs, recruiting expenses, certain non-cash charges and third-party consultant costs associated with the restructuring initiatives to reduce the cost structure and rationalize location footprint following the sale of the Memcor product line, the two-segment realignment and other various restructuring and efficiency initiatives. Represents non-cash share-based compensation. Removal of expenses associated with recent acquisitions and divestitures and post-acquisition integration costs including adjustments to earn-outs. Deduction of gains and add back of losses associated with foreign exchange and other unusual business gains and expenses primarily consisting of product rationalization in our electro-chlorination business, expenses related to the sale of the Memcor product line and expenses related to COVID-19 pandemic. *Represents a non-cash item. B A B C D Q1'20 ($ In millions) Memcor Net Income $ 1.2 Depreciation and amortization 0.1 Adjusted EBITDA $ 1.3 The following represents Memcor's adjusted EBITDA for Q1'20:
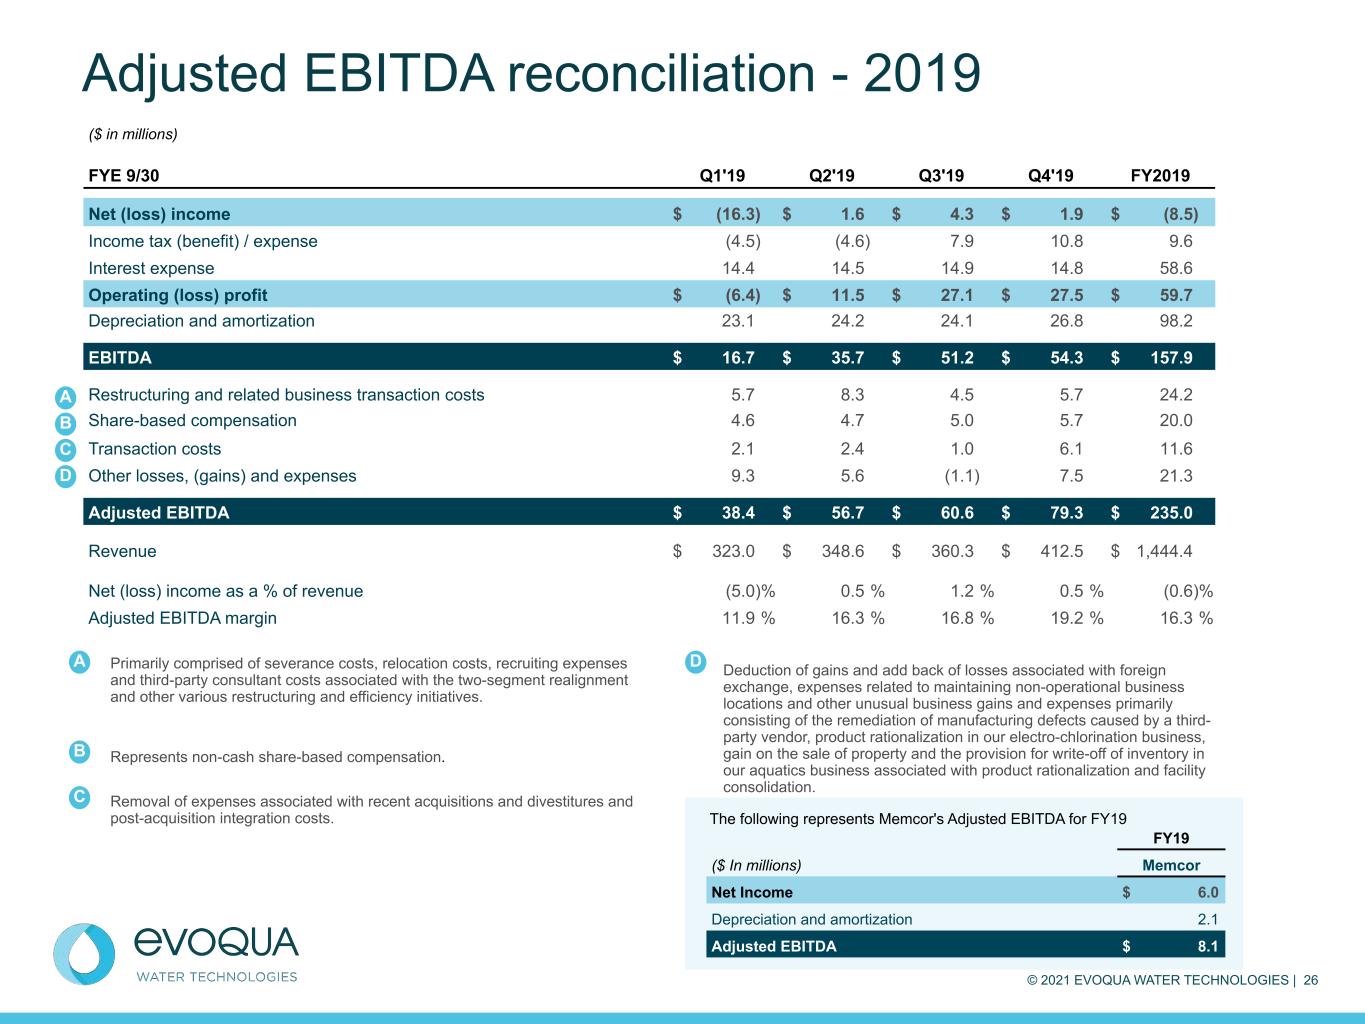
© 2021 EVOQUA WATER TECHNOLOGIES | 26 Adjusted EBITDA reconciliation - 2019 ($ in millions) FYE 9/30 Q1'19 Q2'19 Q3'19 Q4'19 FY2019 Net (loss) income $ (16.3) $ 1.6 $ 4.3 $ 1.9 $ (8.5) Income tax (benefit) / expense (4.5) (4.6) 7.9 10.8 9.6 Interest expense 14.4 14.5 14.9 14.8 58.6 Operating (loss) profit $ (6.4) $ 11.5 $ 27.1 $ 27.5 $ 59.7 Depreciation and amortization 23.1 24.2 24.1 26.8 98.2 EBITDA $ 16.7 $ 35.7 $ 51.2 $ 54.3 $ 157.9 Restructuring and related business transaction costs 5.7 8.3 4.5 5.7 24.2 Share-based compensation 4.6 4.7 5.0 5.7 20.0 Transaction costs 2.1 2.4 1.0 6.1 11.6 Other losses, (gains) and expenses 9.3 5.6 (1.1) 7.5 21.3 Adjusted EBITDA $ 38.4 $ 56.7 $ 60.6 $ 79.3 $ 235.0 Revenue $ 323.0 $ 348.6 $ 360.3 $ 412.5 $ 1,444.4 Net (loss) income as a % of revenue (5.0) % 0.5 % 1.2 % 0.5 % (0.6) % Adjusted EBITDA margin 11.9 % 16.3 % 16.8 % 19.2 % 16.3 % A B C D Primarily comprised of severance costs, relocation costs, recruiting expenses and third-party consultant costs associated with the two-segment realignment and other various restructuring and efficiency initiatives. Represents non-cash share-based compensation. Removal of expenses associated with recent acquisitions and divestitures and post-acquisition integration costs. Deduction of gains and add back of losses associated with foreign exchange, expenses related to maintaining non-operational business locations and other unusual business gains and expenses primarily consisting of the remediation of manufacturing defects caused by a third- party vendor, product rationalization in our electro-chlorination business, gain on the sale of property and the provision for write-off of inventory in our aquatics business associated with product rationalization and facility consolidation. A B C D FY19 ($ In millions) Memcor Net Income $ 6.0 Depreciation and amortization 2.1 Adjusted EBITDA $ 8.1 The following represents Memcor's Adjusted EBITDA for FY19
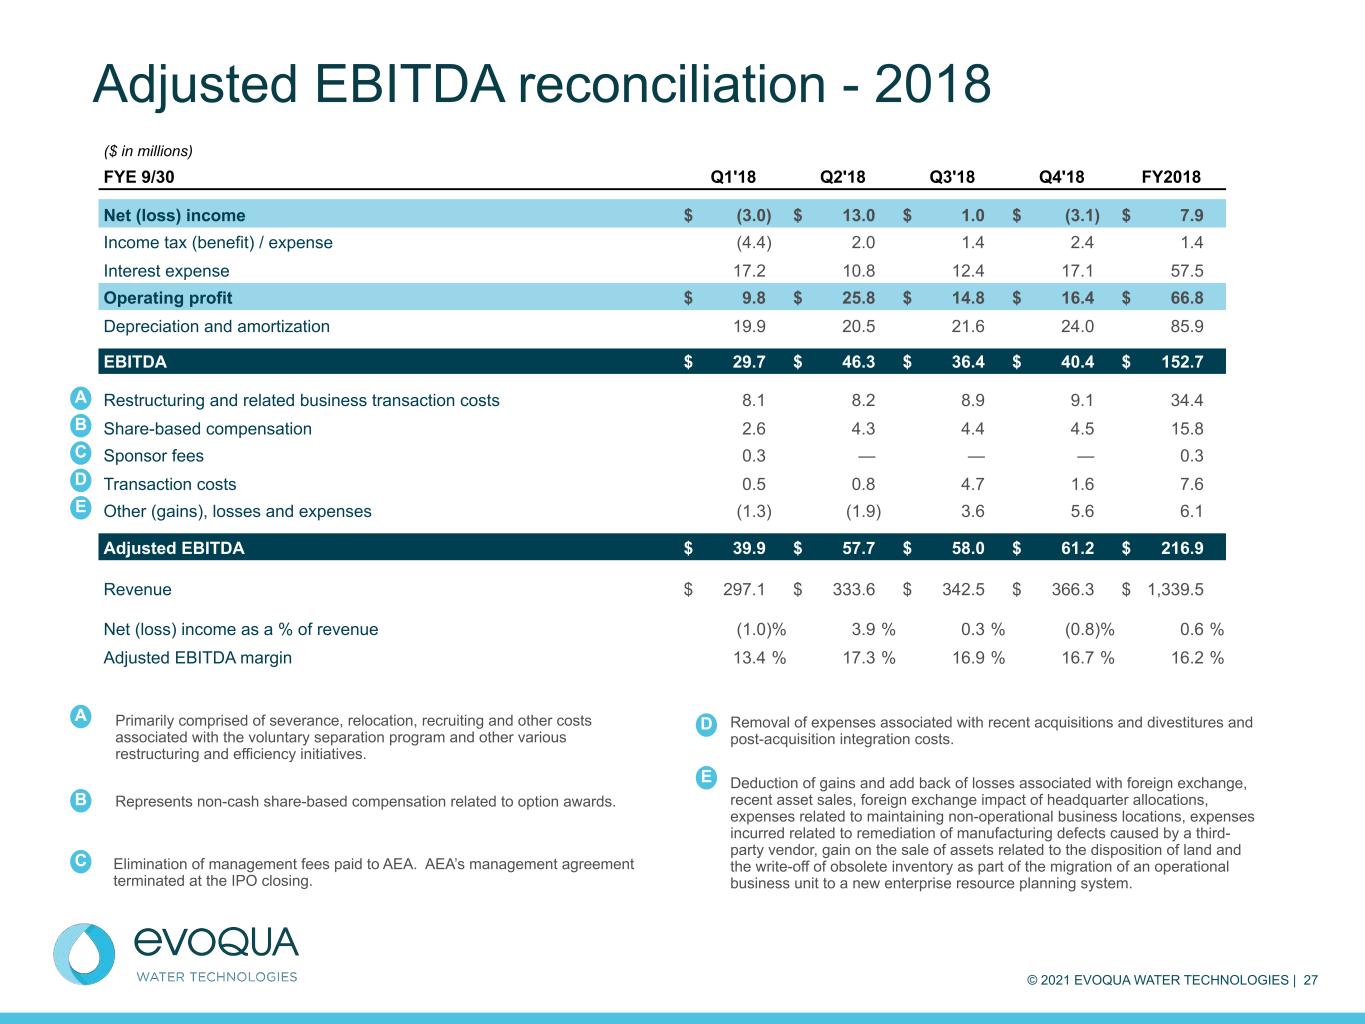
© 2021 EVOQUA WATER TECHNOLOGIES | 27 Adjusted EBITDA reconciliation - 2018 Primarily comprised of severance, relocation, recruiting and other costs associated with the voluntary separation program and other various restructuring and efficiency initiatives. Represents non-cash share-based compensation related to option awards. Elimination of management fees paid to AEA. AEA’s management agreement terminated at the IPO closing. Removal of expenses associated with recent acquisitions and divestitures and post-acquisition integration costs. Deduction of gains and add back of losses associated with foreign exchange, recent asset sales, foreign exchange impact of headquarter allocations, expenses related to maintaining non-operational business locations, expenses incurred related to remediation of manufacturing defects caused by a third- party vendor, gain on the sale of assets related to the disposition of land and the write-off of obsolete inventory as part of the migration of an operational business unit to a new enterprise resource planning system. ($ in millions) FYE 9/30 Q1'18 Q2'18 Q3'18 Q4'18 FY2018 Net (loss) income $ (3.0) $ 13.0 $ 1.0 $ (3.1) $ 7.9 Income tax (benefit) / expense (4.4) 2.0 1.4 2.4 1.4 Interest expense 17.2 10.8 12.4 17.1 57.5 Operating profit $ 9.8 $ 25.8 $ 14.8 $ 16.4 $ 66.8 Depreciation and amortization 19.9 20.5 21.6 24.0 85.9 EBITDA $ 29.7 $ 46.3 $ 36.4 $ 40.4 $ 152.7 Restructuring and related business transaction costs 8.1 8.2 8.9 9.1 34.4 Share-based compensation 2.6 4.3 4.4 4.5 15.8 Sponsor fees 0.3 — — — 0.3 Transaction costs 0.5 0.8 4.7 1.6 7.6 Other (gains), losses and expenses (1.3) (1.9) 3.6 5.6 6.1 Adjusted EBITDA $ 39.9 $ 57.7 $ 58.0 $ 61.2 $ 216.9 Revenue $ 297.1 $ 333.6 $ 342.5 $ 366.3 $ 1,339.5 Net (loss) income as a % of revenue (1.0) % 3.9 % 0.3 % (0.8) % 0.6 % Adjusted EBITDA margin 13.4 % 17.3 % 16.9 % 16.7 % 16.2 % A B C D E A B C D E
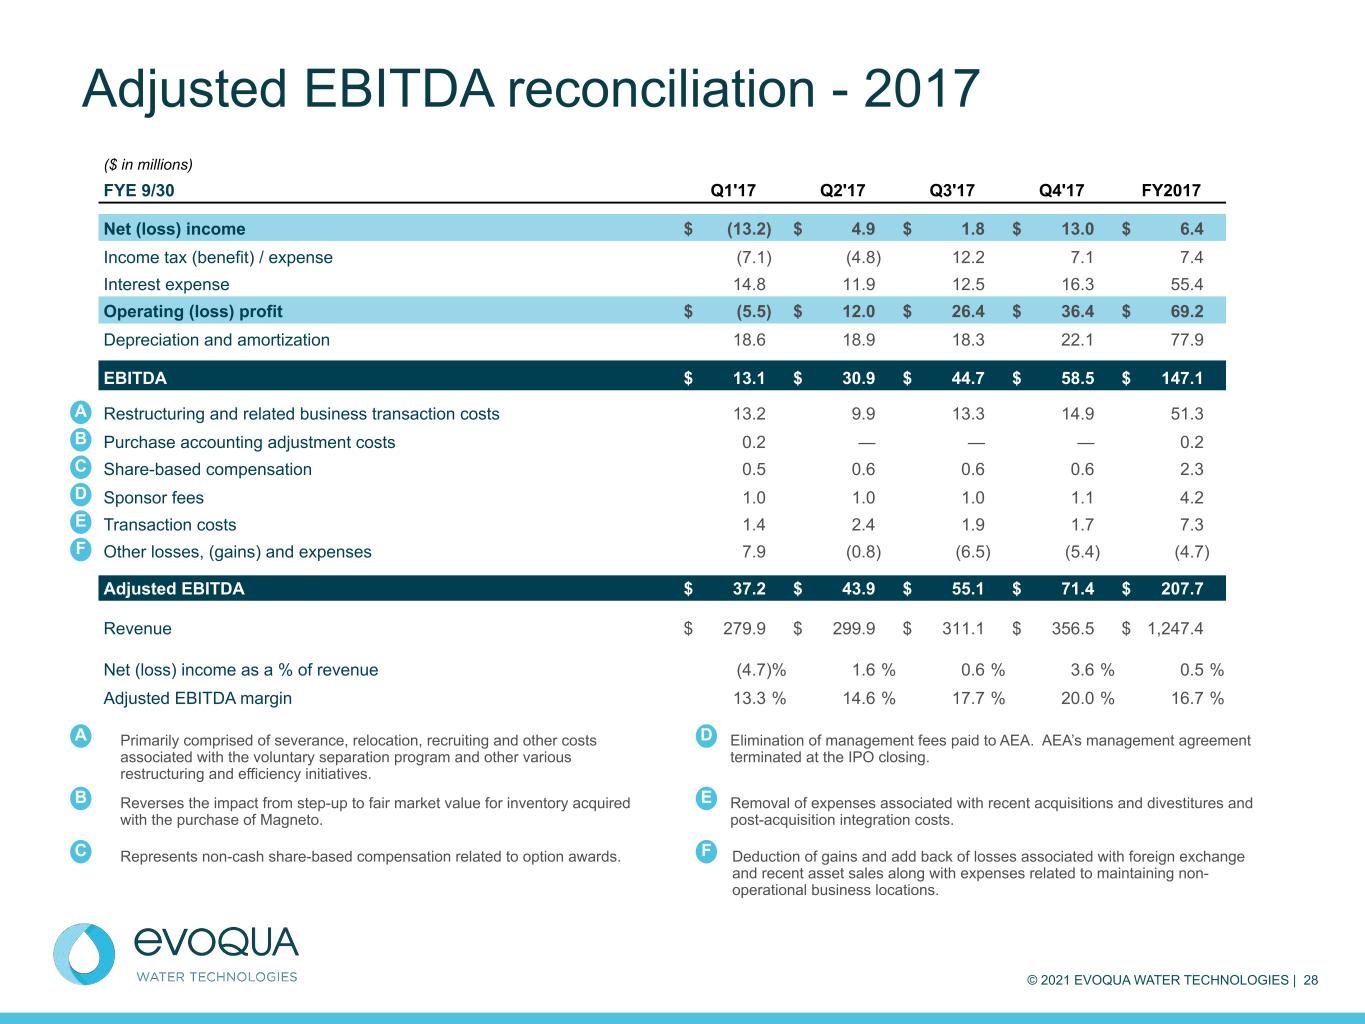
© 2021 EVOQUA WATER TECHNOLOGIES | 28 Adjusted EBITDA reconciliation - 2017 Primarily comprised of severance, relocation, recruiting and other costs associated with the voluntary separation program and other various restructuring and efficiency initiatives. Reverses the impact from step-up to fair market value for inventory acquired with the purchase of Magneto. Represents non-cash share-based compensation related to option awards. Elimination of management fees paid to AEA. AEA’s management agreement terminated at the IPO closing. Removal of expenses associated with recent acquisitions and divestitures and post-acquisition integration costs. Deduction of gains and add back of losses associated with foreign exchange and recent asset sales along with expenses related to maintaining non- operational business locations. ($ in millions) FYE 9/30 Q1'17 Q2'17 Q3'17 Q4'17 FY2017 Net (loss) income $ (13.2) $ 4.9 $ 1.8 $ 13.0 $ 6.4 Income tax (benefit) / expense (7.1) (4.8) 12.2 7.1 7.4 Interest expense 14.8 11.9 12.5 16.3 55.4 Operating (loss) profit $ (5.5) $ 12.0 $ 26.4 $ 36.4 $ 69.2 Depreciation and amortization 18.6 18.9 18.3 22.1 77.9 EBITDA $ 13.1 $ 30.9 $ 44.7 $ 58.5 $ 147.1 Restructuring and related business transaction costs 13.2 9.9 13.3 14.9 51.3 Purchase accounting adjustment costs 0.2 — — — 0.2 Share-based compensation 0.5 0.6 0.6 0.6 2.3 Sponsor fees 1.0 1.0 1.0 1.1 4.2 Transaction costs 1.4 2.4 1.9 1.7 7.3 Other losses, (gains) and expenses 7.9 (0.8) (6.5) (5.4) (4.7) Adjusted EBITDA $ 37.2 $ 43.9 $ 55.1 $ 71.4 $ 207.7 Revenue $ 279.9 $ 299.9 $ 311.1 $ 356.5 $ 1,247.4 Net (loss) income as a % of revenue (4.7) % 1.6 % 0.6 % 3.6 % 0.5 % Adjusted EBITDA margin 13.3 % 14.6 % 17.7 % 20.0 % 16.7 % A B C D E F A B C D E F
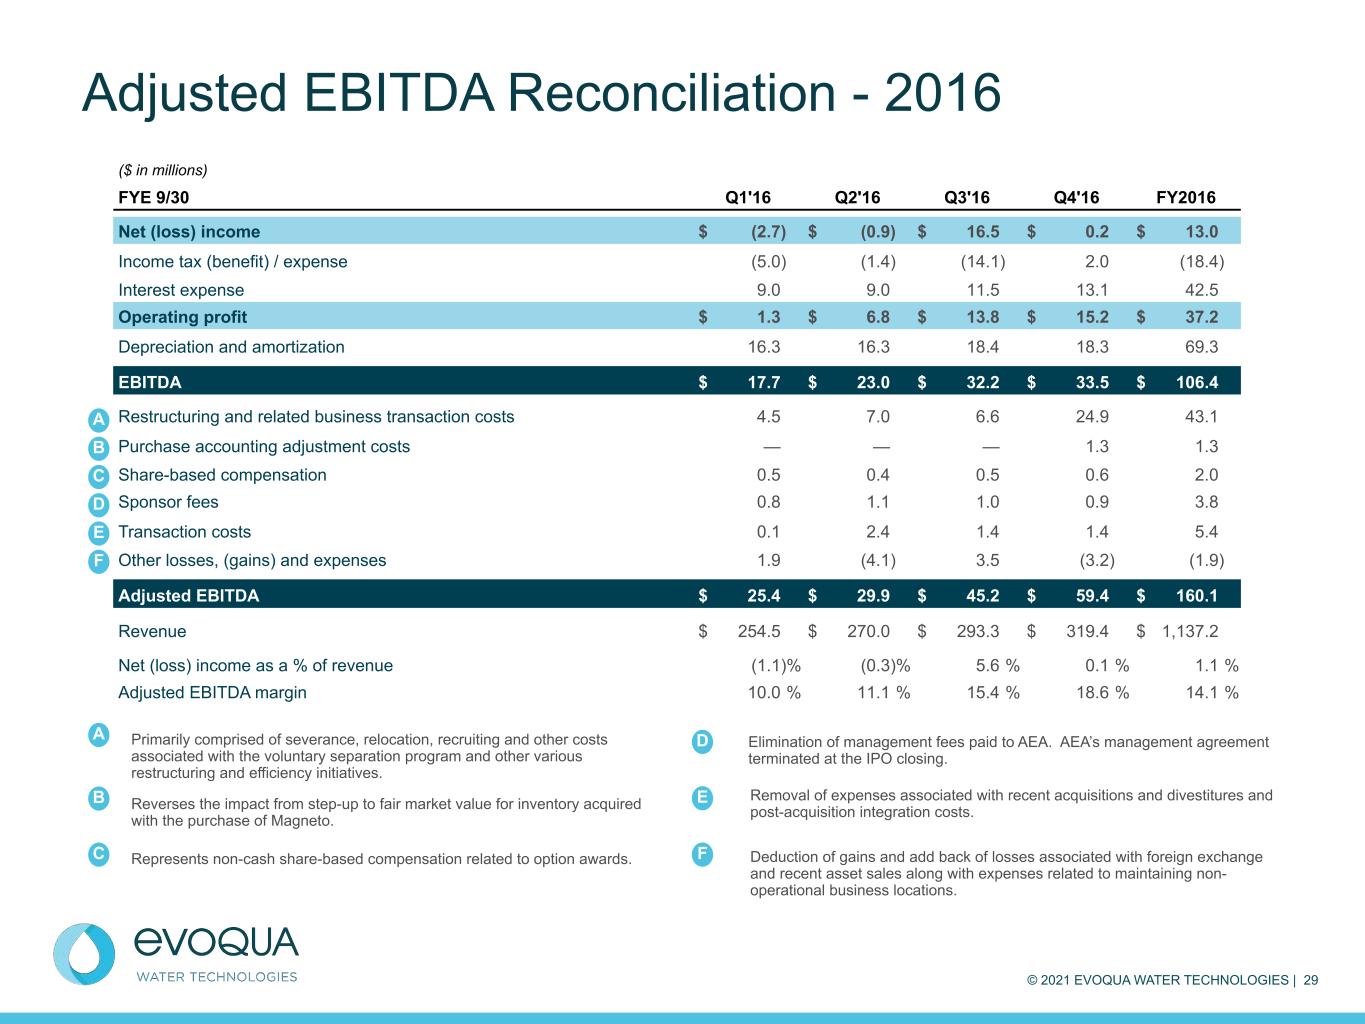
© 2021 EVOQUA WATER TECHNOLOGIES | 29 Adjusted EBITDA Reconciliation - 2016 Primarily comprised of severance, relocation, recruiting and other costs associated with the voluntary separation program and other various restructuring and efficiency initiatives. Reverses the impact from step-up to fair market value for inventory acquired with the purchase of Magneto. Represents non-cash share-based compensation related to option awards. Elimination of management fees paid to AEA. AEA’s management agreement terminated at the IPO closing. Removal of expenses associated with recent acquisitions and divestitures and post-acquisition integration costs. Deduction of gains and add back of losses associated with foreign exchange and recent asset sales along with expenses related to maintaining non- operational business locations. ($ in millions) FYE 9/30 Q1'16 Q2'16 Q3'16 Q4'16 FY2016 Net (loss) income $ (2.7) $ (0.9) $ 16.5 $ 0.2 $ 13.0 Income tax (benefit) / expense (5.0) (1.4) (14.1) 2.0 (18.4) Interest expense 9.0 9.0 11.5 13.1 42.5 Operating profit $ 1.3 $ 6.8 $ 13.8 $ 15.2 $ 37.2 Depreciation and amortization 16.3 16.3 18.4 18.3 69.3 EBITDA $ 17.7 $ 23.0 $ 32.2 $ 33.5 $ 106.4 Restructuring and related business transaction costs 4.5 7.0 6.6 24.9 43.1 Purchase accounting adjustment costs — — — 1.3 1.3 Share-based compensation 0.5 0.4 0.5 0.6 2.0 Sponsor fees 0.8 1.1 1.0 0.9 3.8 Transaction costs 0.1 2.4 1.4 1.4 5.4 Other losses, (gains) and expenses 1.9 (4.1) 3.5 (3.2) (1.9) Adjusted EBITDA $ 25.4 $ 29.9 $ 45.2 $ 59.4 $ 160.1 Revenue $ 254.5 $ 270.0 $ 293.3 $ 319.4 $ 1,137.2 Net (loss) income as a % of revenue (1.1) % (0.3) % 5.6 % 0.1 % 1.1 % Adjusted EBITDA margin 10.0 % 11.1 % 15.4 % 18.6 % 14.1 % A B C D E F A C D E F B
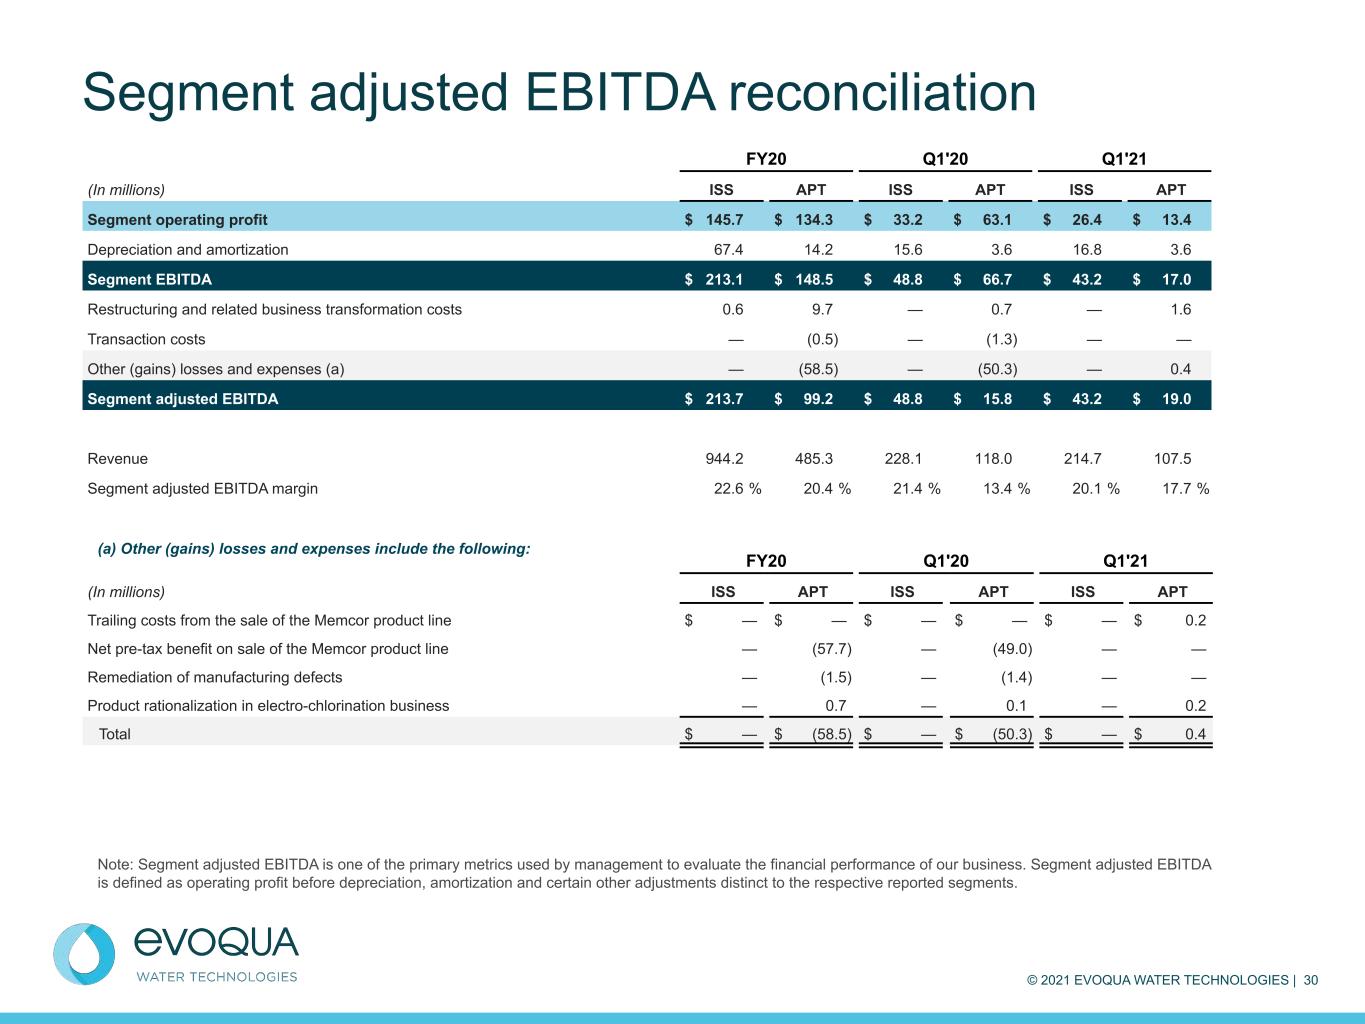
© 2021 EVOQUA WATER TECHNOLOGIES | 30 Segment adjusted EBITDA reconciliation FY20 Q1'20 Q1'21 (In millions) ISS APT ISS APT ISS APT Trailing costs from the sale of the Memcor product line $ — $ — $ — $ — $ — $ 0.2 Net pre-tax benefit on sale of the Memcor product line — (57.7) — (49.0) — — Remediation of manufacturing defects — (1.5) — (1.4) — — Product rationalization in electro-chlorination business — 0.7 — 0.1 — 0.2 Total $ — $ (58.5) $ — $ (50.3) $ — $ 0.4 FY20 Q1'20 Q1'21 (In millions) ISS APT ISS APT ISS APT Segment operating profit $ 145.7 $ 134.3 $ 33.2 $ 63.1 $ 26.4 $ 13.4 Depreciation and amortization 67.4 14.2 15.6 3.6 16.8 3.6 Segment EBITDA $ 213.1 $ 148.5 $ 48.8 $ 66.7 $ 43.2 $ 17.0 Restructuring and related business transformation costs 0.6 9.7 — 0.7 — 1.6 Transaction costs — (0.5) — (1.3) — — Other (gains) losses and expenses (a) — (58.5) — (50.3) — 0.4 Segment adjusted EBITDA $ 213.7 $ 99.2 $ 48.8 $ 15.8 $ 43.2 $ 19.0 Revenue 944.2 485.3 228.1 118.0 214.7 107.5 Segment adjusted EBITDA margin 22.6 % 20.4 % 21.4 % 13.4 % 20.1 % 17.7 % Note: Segment adjusted EBITDA is one of the primary metrics used by management to evaluate the financial performance of our business. Segment adjusted EBITDA is defined as operating profit before depreciation, amortization and certain other adjustments distinct to the respective reported segments. (a) Other (gains) losses and expenses include the following:

© 2021 EVOQUA WATER TECHNOLOGIES | 31 Adjusted free cash flow ($ in millions) Q1'20 Q1'21 Operating cash flow $ 4.7 $ 15.6 (+/-) EBITDA adjustments including: Restructuring and related business transformation costs 1.7 1.8 Transaction costs 0.2 0.6 Other (gains) losses including: (i) (1.4) — (ii) 0.1 0.2 (iii) 9.3 0.2 (iv) — 0.1 (v) — 1.9 (-/+) Tax impact of above EBITDA adjustments(1) 2.3 (1.2) (+) Adoption impact of ASC 842 (2.0) — (-) Capital expenditures (17.6) (17.3) (+) Financing related to growth capital expenditures 3.5 7.8 (-) Purchases of intangibles (e.g., software licenses) (0.2) (0.1) Adjusted free cash flow $ 0.6 $ 9.6 Net income $ 53.5 $ 6.5 Operating cash flow as a % of net income 8.8 % 240.0 % Adjusted net income $ 4.8 $ 7.2 Adjusted free cash flow conversion 12.5 % 133.3 % (i) expense reduction related to the remediation of manufacturing defects caused by a third- party vendor for which partial restitution was received; (ii) charges incurred by the Company related to product rationalization in its electro-chlorination business; (iii) discretionary compensation payments to employees of $8.3 million and transaction costs of $1.0 million incurred in connection with the sale of the Memcor product line in Q1'20 and trailing costs incurred in Q1'21; (iv) expenses incurred by the Company as a result of the COVID-19 pandemic, including additional charges for personal protective equipment, increased costs for facility sanitization and one-time payments to certain employees; and (v) legal fees incurred in excess of amounts covered by the Company’s insurance related to the Securities Litigation and SEC investigation. (1) The blended statutory tax rate was 26.0% for all periods presented. The tax rate on Non-GAAP adjustments to net income was 4.9% (due to the impact of the Memcor transaction) and 26.0% in the three months ended December 31, 2019 and 2020, respectively.
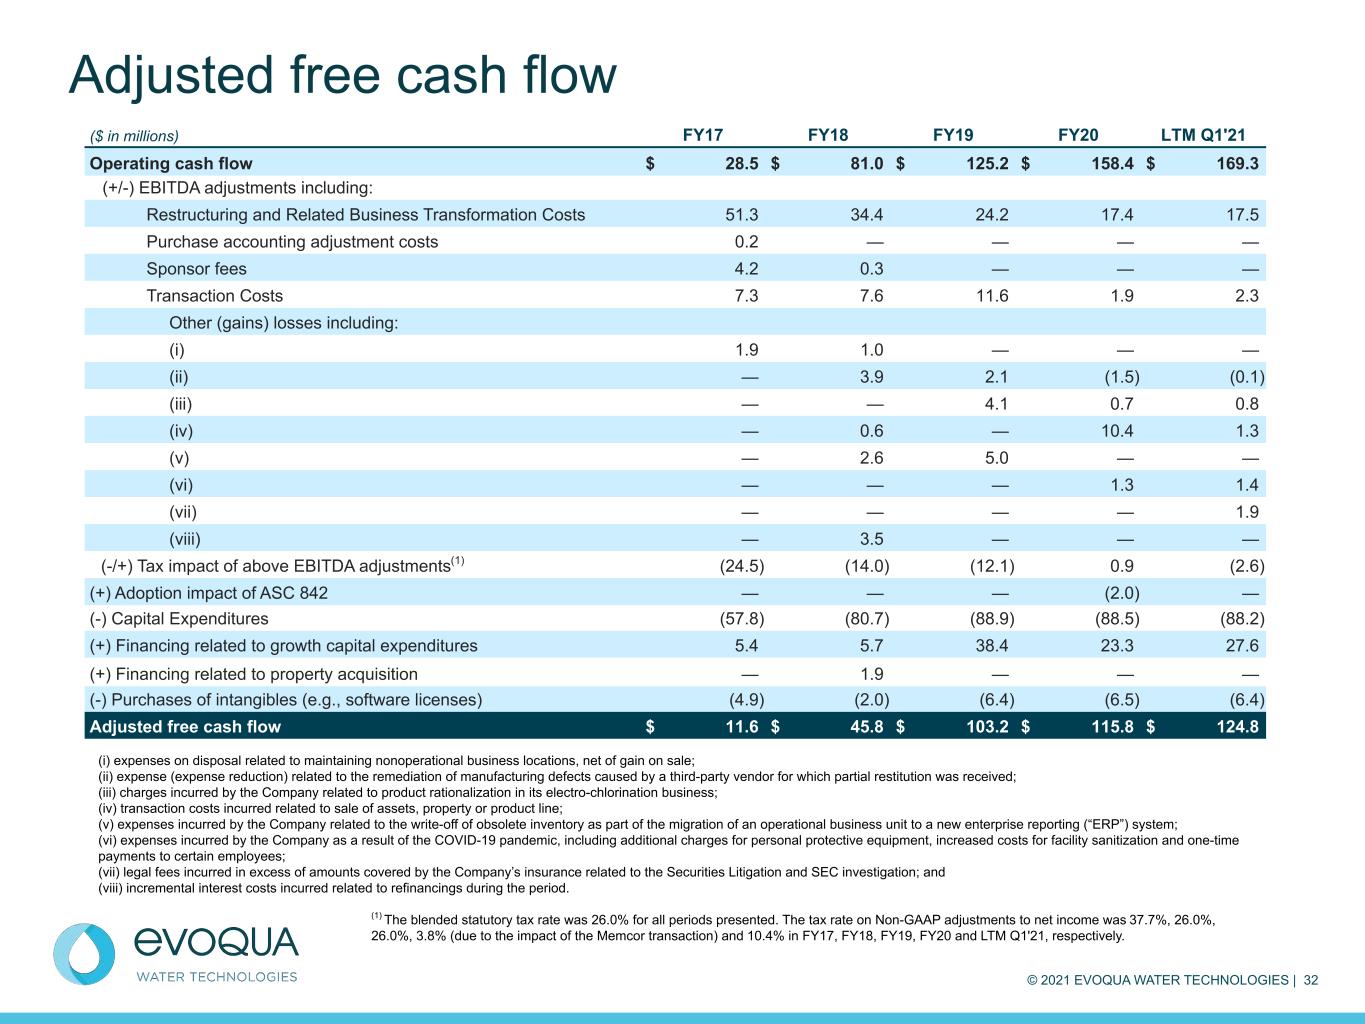
© 2021 EVOQUA WATER TECHNOLOGIES | 32 Adjusted free cash flow ($ in millions) FY17 FY18 FY19 FY20 LTM Q1'21 Operating cash flow $ 28.5 $ 81.0 $ 125.2 $ 158.4 $ 169.3 (+/-) EBITDA adjustments including: Restructuring and Related Business Transformation Costs 51.3 34.4 24.2 17.4 17.5 Purchase accounting adjustment costs 0.2 — — — — Sponsor fees 4.2 0.3 — — — Transaction Costs 7.3 7.6 11.6 1.9 2.3 Other (gains) losses including: (i) 1.9 1.0 — — — (ii) — 3.9 2.1 (1.5) (0.1) (iii) — — 4.1 0.7 0.8 (iv) — 0.6 — 10.4 1.3 (v) — 2.6 5.0 — — (vi) — — — 1.3 1.4 (vii) — — — — 1.9 (viii) — 3.5 — — — (-/+) Tax impact of above EBITDA adjustments(1) (24.5) (14.0) (12.1) 0.9 (2.6) (+) Adoption impact of ASC 842 — — — (2.0) — (-) Capital Expenditures (57.8) (80.7) (88.9) (88.5) (88.2) (+) Financing related to growth capital expenditures 5.4 5.7 38.4 23.3 27.6 (+) Financing related to property acquisition — 1.9 — — — (-) Purchases of intangibles (e.g., software licenses) (4.9) (2.0) (6.4) (6.5) (6.4) Adjusted free cash flow $ 11.6 $ 45.8 $ 103.2 $ 115.8 $ 124.8 (i) expenses on disposal related to maintaining nonoperational business locations, net of gain on sale; (ii) expense (expense reduction) related to the remediation of manufacturing defects caused by a third-party vendor for which partial restitution was received; (iii) charges incurred by the Company related to product rationalization in its electro-chlorination business; (iv) transaction costs incurred related to sale of assets, property or product line; (v) expenses incurred by the Company related to the write-off of obsolete inventory as part of the migration of an operational business unit to a new enterprise reporting (“ERP”) system; (vi) expenses incurred by the Company as a result of the COVID-19 pandemic, including additional charges for personal protective equipment, increased costs for facility sanitization and one-time payments to certain employees; (vii) legal fees incurred in excess of amounts covered by the Company’s insurance related to the Securities Litigation and SEC investigation; and (viii) incremental interest costs incurred related to refinancings during the period. (1) The blended statutory tax rate was 26.0% for all periods presented. The tax rate on Non-GAAP adjustments to net income was 37.7%, 26.0%, 26.0%, 3.8% (due to the impact of the Memcor transaction) and 10.4% in FY17, FY18, FY19, FY20 and LTM Q1'21, respectively.
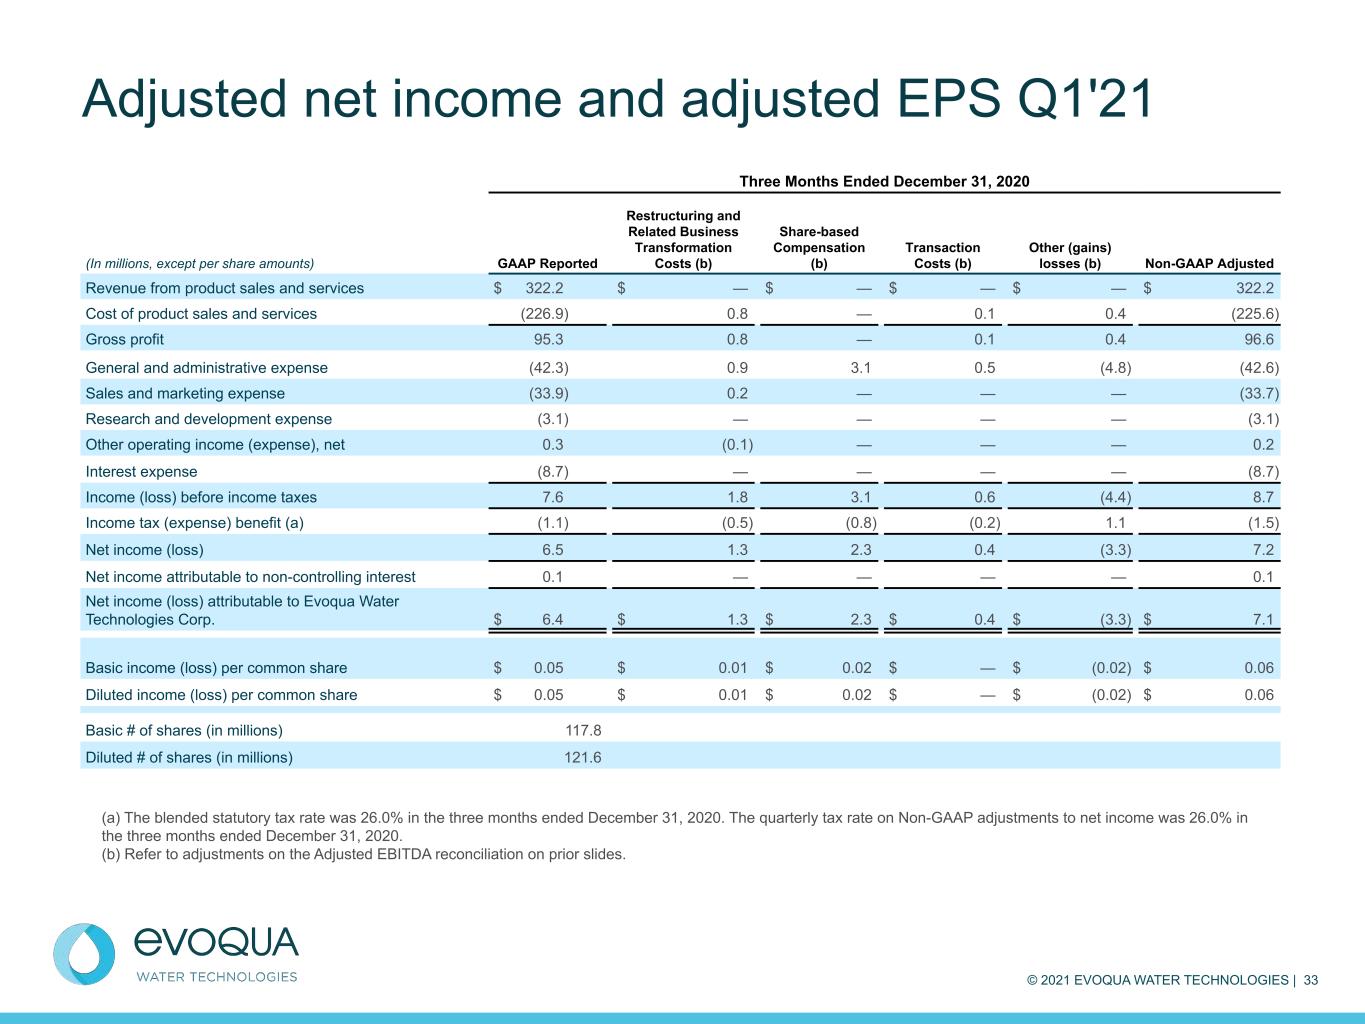
© 2021 EVOQUA WATER TECHNOLOGIES | 33 Adjusted net income and adjusted EPS Q1'21 Three Months Ended December 31, 2020 (In millions, except per share amounts) GAAP Reported Restructuring and Related Business Transformation Costs (b) Share-based Compensation (b) Transaction Costs (b) Other (gains) losses (b) Non-GAAP Adjusted Revenue from product sales and services $ 322.2 $ — $ — $ — $ — $ 322.2 Cost of product sales and services (226.9) 0.8 — 0.1 0.4 (225.6) Gross profit 95.3 0.8 — 0.1 0.4 96.6 General and administrative expense (42.3) 0.9 3.1 0.5 (4.8) (42.6) Sales and marketing expense (33.9) 0.2 — — — (33.7) Research and development expense (3.1) — — — — (3.1) Other operating income (expense), net 0.3 (0.1) — — — 0.2 Interest expense (8.7) — — — — (8.7) Income (loss) before income taxes 7.6 1.8 3.1 0.6 (4.4) 8.7 Income tax (expense) benefit (a) (1.1) (0.5) (0.8) (0.2) 1.1 (1.5) Net income (loss) 6.5 1.3 2.3 0.4 (3.3) 7.2 Net income attributable to non-controlling interest 0.1 — — — — 0.1 Net income (loss) attributable to Evoqua Water Technologies Corp. $ 6.4 $ 1.3 $ 2.3 $ 0.4 $ (3.3) $ 7.1 Basic income (loss) per common share $ 0.05 $ 0.01 $ 0.02 $ — $ (0.02) $ 0.06 Diluted income (loss) per common share $ 0.05 $ 0.01 $ 0.02 $ — $ (0.02) $ 0.06 Basic # of shares (in millions) 117.8 Diluted # of shares (in millions) 121.6 (a) The blended statutory tax rate was 26.0% in the three months ended December 31, 2020. The quarterly tax rate on Non-GAAP adjustments to net income was 26.0% in the three months ended December 31, 2020. (b) Refer to adjustments on the Adjusted EBITDA reconciliation on prior slides.
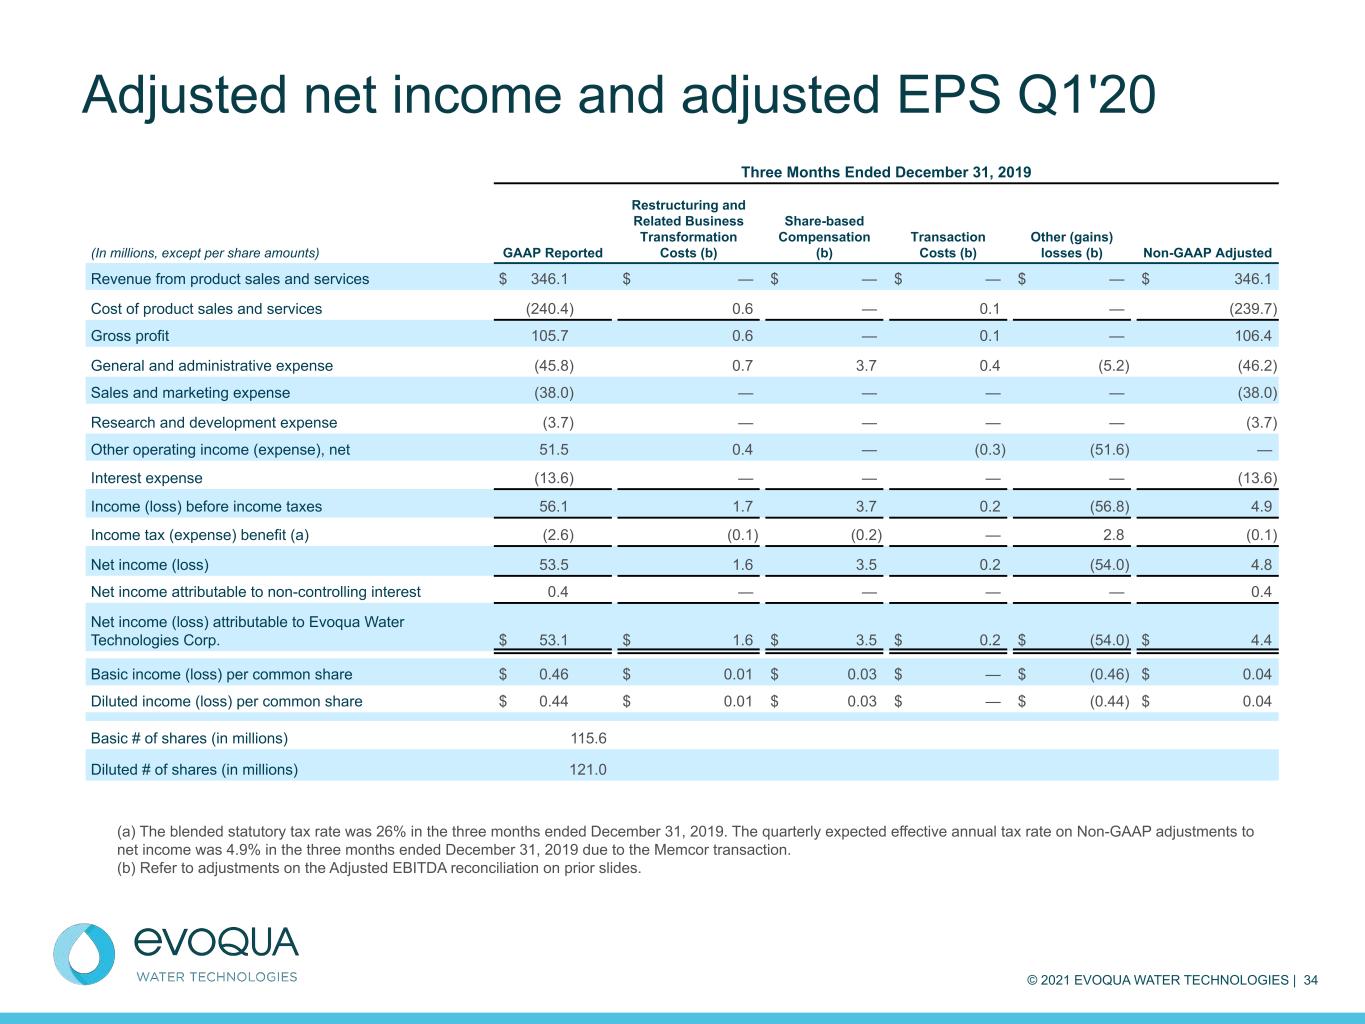
© 2021 EVOQUA WATER TECHNOLOGIES | 34 Adjusted net income and adjusted EPS Q1'20 Three Months Ended December 31, 2019 (In millions, except per share amounts) GAAP Reported Restructuring and Related Business Transformation Costs (b) Share-based Compensation (b) Transaction Costs (b) Other (gains) losses (b) Non-GAAP Adjusted Revenue from product sales and services $ 346.1 $ — $ — $ — $ — $ 346.1 Cost of product sales and services (240.4) 0.6 — 0.1 — (239.7) Gross profit 105.7 0.6 — 0.1 — 106.4 General and administrative expense (45.8) 0.7 3.7 0.4 (5.2) (46.2) Sales and marketing expense (38.0) — — — — (38.0) Research and development expense (3.7) — — — — (3.7) Other operating income (expense), net 51.5 0.4 — (0.3) (51.6) — Interest expense (13.6) — — — — (13.6) Income (loss) before income taxes 56.1 1.7 3.7 0.2 (56.8) 4.9 Income tax (expense) benefit (a) (2.6) (0.1) (0.2) — 2.8 (0.1) Net income (loss) 53.5 1.6 3.5 0.2 (54.0) 4.8 Net income attributable to non-controlling interest 0.4 — — — — 0.4 Net income (loss) attributable to Evoqua Water Technologies Corp. $ 53.1 $ 1.6 $ 3.5 $ 0.2 $ (54.0) $ 4.4 Basic income (loss) per common share $ 0.46 $ 0.01 $ 0.03 $ — $ (0.46) $ 0.04 Diluted income (loss) per common share $ 0.44 $ 0.01 $ 0.03 $ — $ (0.44) $ 0.04 Basic # of shares (in millions) 115.6 Diluted # of shares (in millions) 121.0 (a) The blended statutory tax rate was 26% in the three months ended December 31, 2019. The quarterly expected effective annual tax rate on Non-GAAP adjustments to net income was 4.9% in the three months ended December 31, 2019 due to the Memcor transaction. (b) Refer to adjustments on the Adjusted EBITDA reconciliation on prior slides.
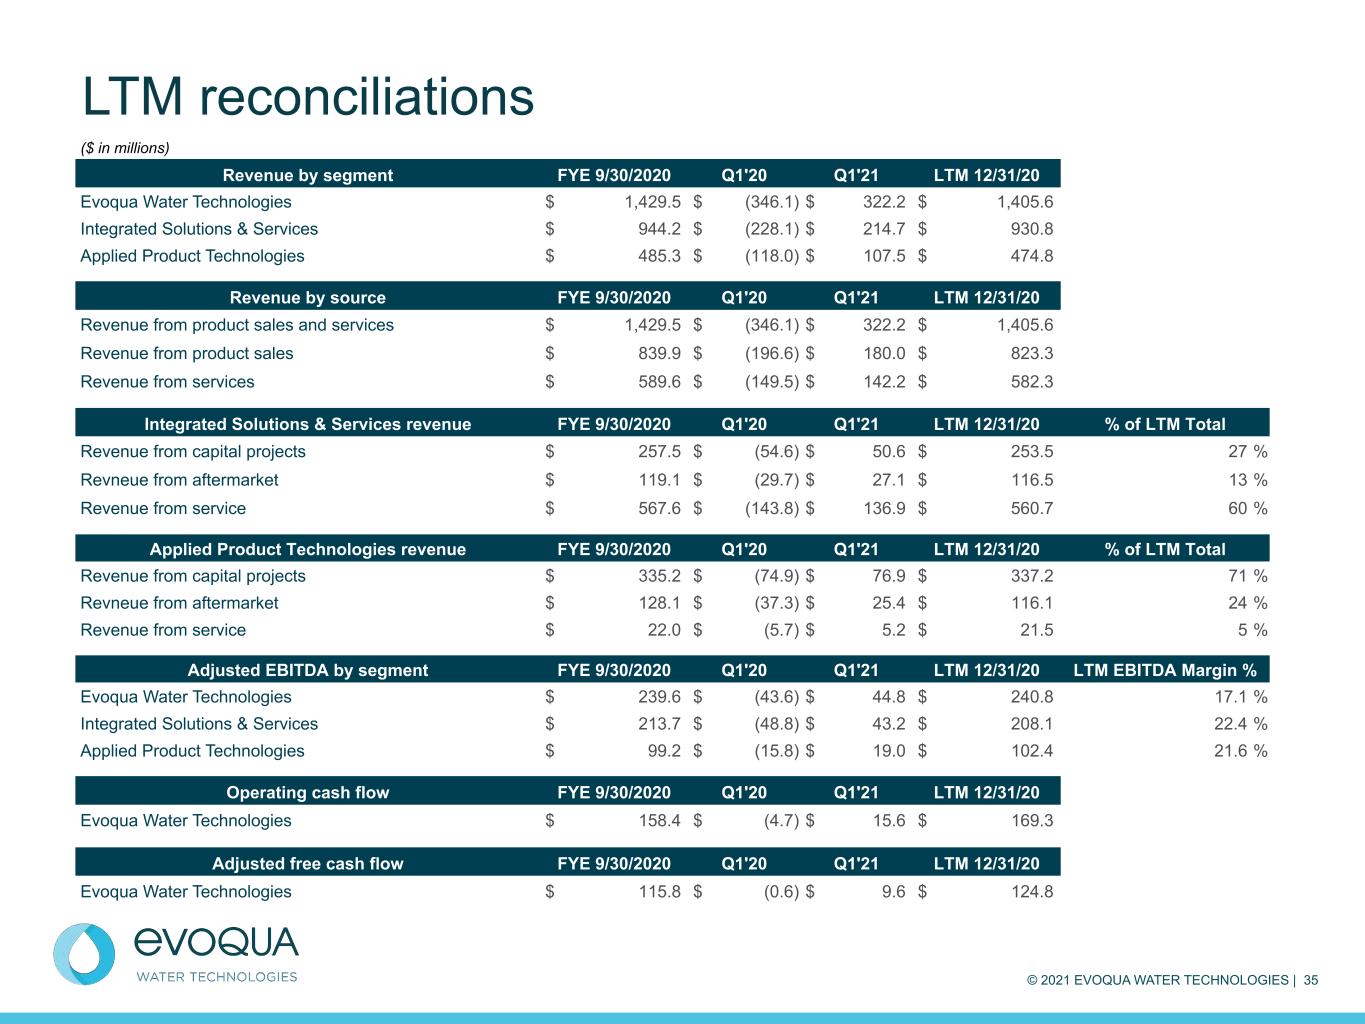
© 2021 EVOQUA WATER TECHNOLOGIES | 35 LTM reconciliations ($ in millions) Revenue by segment FYE 9/30/2020 Q1'20 Q1'21 LTM 12/31/20 Evoqua Water Technologies $ 1,429.5 $ (346.1) $ 322.2 $ 1,405.6 Integrated Solutions & Services $ 944.2 $ (228.1) $ 214.7 $ 930.8 Applied Product Technologies $ 485.3 $ (118.0) $ 107.5 $ 474.8 Revenue by source FYE 9/30/2020 Q1'20 Q1'21 LTM 12/31/20 Revenue from product sales and services $ 1,429.5 $ (346.1) $ 322.2 $ 1,405.6 Revenue from product sales $ 839.9 $ (196.6) $ 180.0 $ 823.3 Revenue from services $ 589.6 $ (149.5) $ 142.2 $ 582.3 Integrated Solutions & Services revenue FYE 9/30/2020 Q1'20 Q1'21 LTM 12/31/20 % of LTM Total Revenue from capital projects $ 257.5 $ (54.6) $ 50.6 $ 253.5 27 % Revneue from aftermarket $ 119.1 $ (29.7) $ 27.1 $ 116.5 13 % Revenue from service $ 567.6 $ (143.8) $ 136.9 $ 560.7 60 % Applied Product Technologies revenue FYE 9/30/2020 Q1'20 Q1'21 LTM 12/31/20 % of LTM Total Revenue from capital projects $ 335.2 $ (74.9) $ 76.9 $ 337.2 71 % Revneue from aftermarket $ 128.1 $ (37.3) $ 25.4 $ 116.1 24 % Revenue from service $ 22.0 $ (5.7) $ 5.2 $ 21.5 5 % Adjusted EBITDA by segment FYE 9/30/2020 Q1'20 Q1'21 LTM 12/31/20 LTM EBITDA Margin % Evoqua Water Technologies $ 239.6 $ (43.6) $ 44.8 $ 240.8 17.1 % Integrated Solutions & Services $ 213.7 $ (48.8) $ 43.2 $ 208.1 22.4 % Applied Product Technologies $ 99.2 $ (15.8) $ 19.0 $ 102.4 21.6 % Operating cash flow FYE 9/30/2020 Q1'20 Q1'21 LTM 12/31/20 Evoqua Water Technologies $ 158.4 $ (4.7) $ 15.6 $ 169.3 Adjusted free cash flow FYE 9/30/2020 Q1'20 Q1'21 LTM 12/31/20 Evoqua Water Technologies $ 115.8 $ (0.6) $ 9.6 $ 124.8
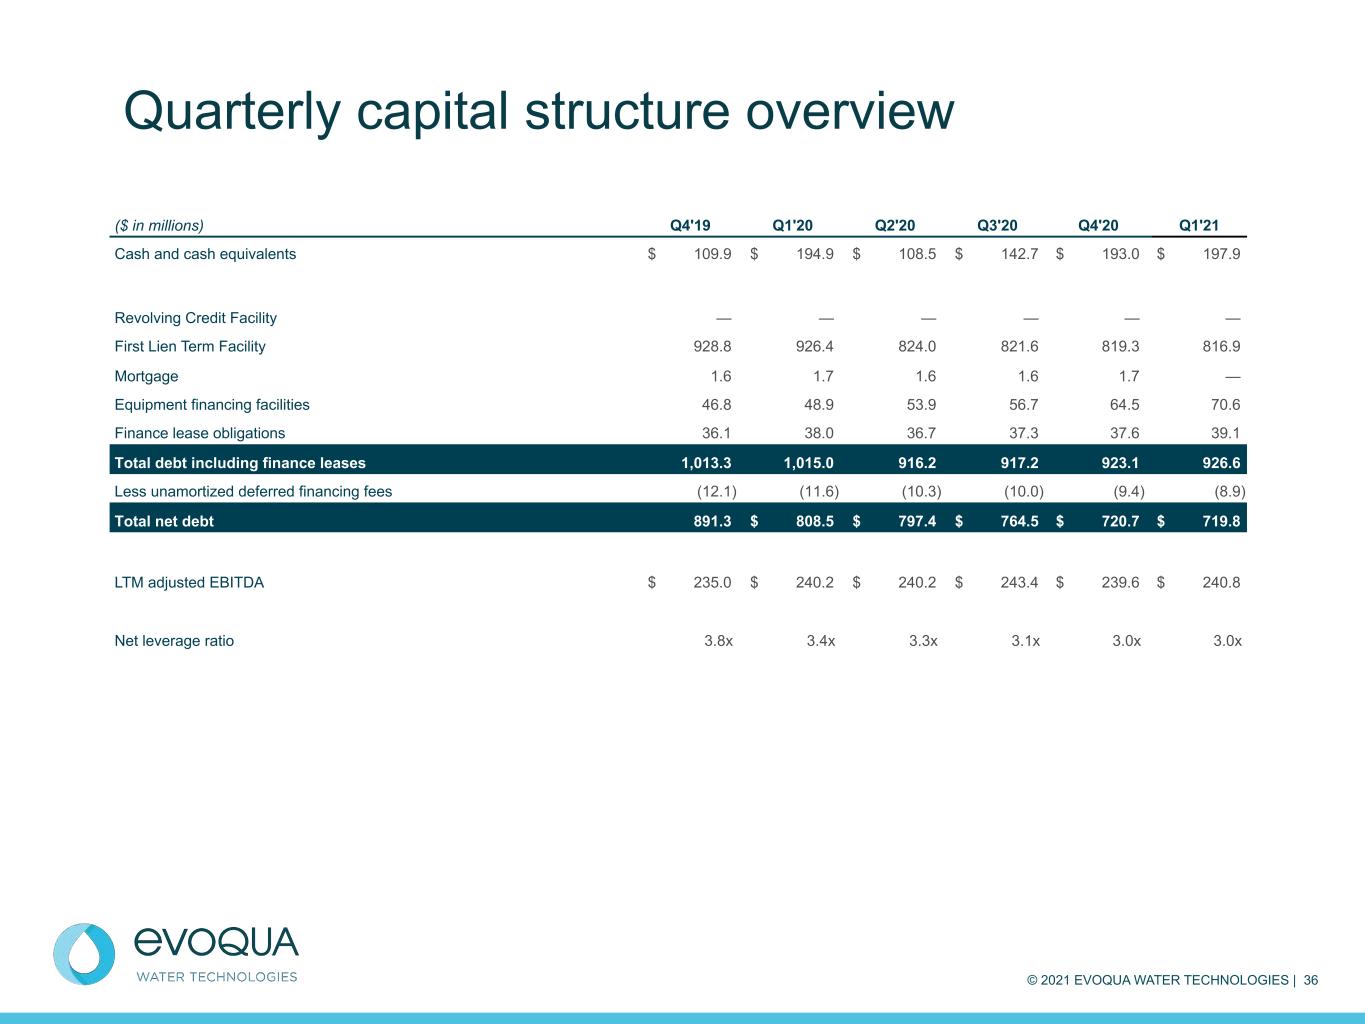
© 2021 EVOQUA WATER TECHNOLOGIES | 36 Quarterly capital structure overview ($ in millions) Q4'19 Q1'20 Q2'20 Q3'20 Q4'20 Q1'21 Cash and cash equivalents $ 109.9 $ 194.9 $ 108.5 $ 142.7 $ 193.0 $ 197.9 Revolving Credit Facility — — — — — — First Lien Term Facility 928.8 926.4 824.0 821.6 819.3 816.9 Mortgage 1.6 1.7 1.6 1.6 1.7 — Equipment financing facilities 46.8 48.9 53.9 56.7 64.5 70.6 Finance lease obligations 36.1 38.0 36.7 37.3 37.6 39.1 Total debt including finance leases 1,013.3 1,015.0 916.2 917.2 923.1 926.6 Less unamortized deferred financing fees (12.1) (11.6) (10.3) (10.0) (9.4) (8.9) Total net debt 891.3 $ 808.5 $ 797.4 $ 764.5 $ 720.7 $ 719.8 LTM adjusted EBITDA $ 235.0 $ 240.2 $ 240.2 $ 243.4 $ 239.6 $ 240.8 Net leverage ratio 3.8x 3.4x 3.3x 3.1x 3.0x 3.0x
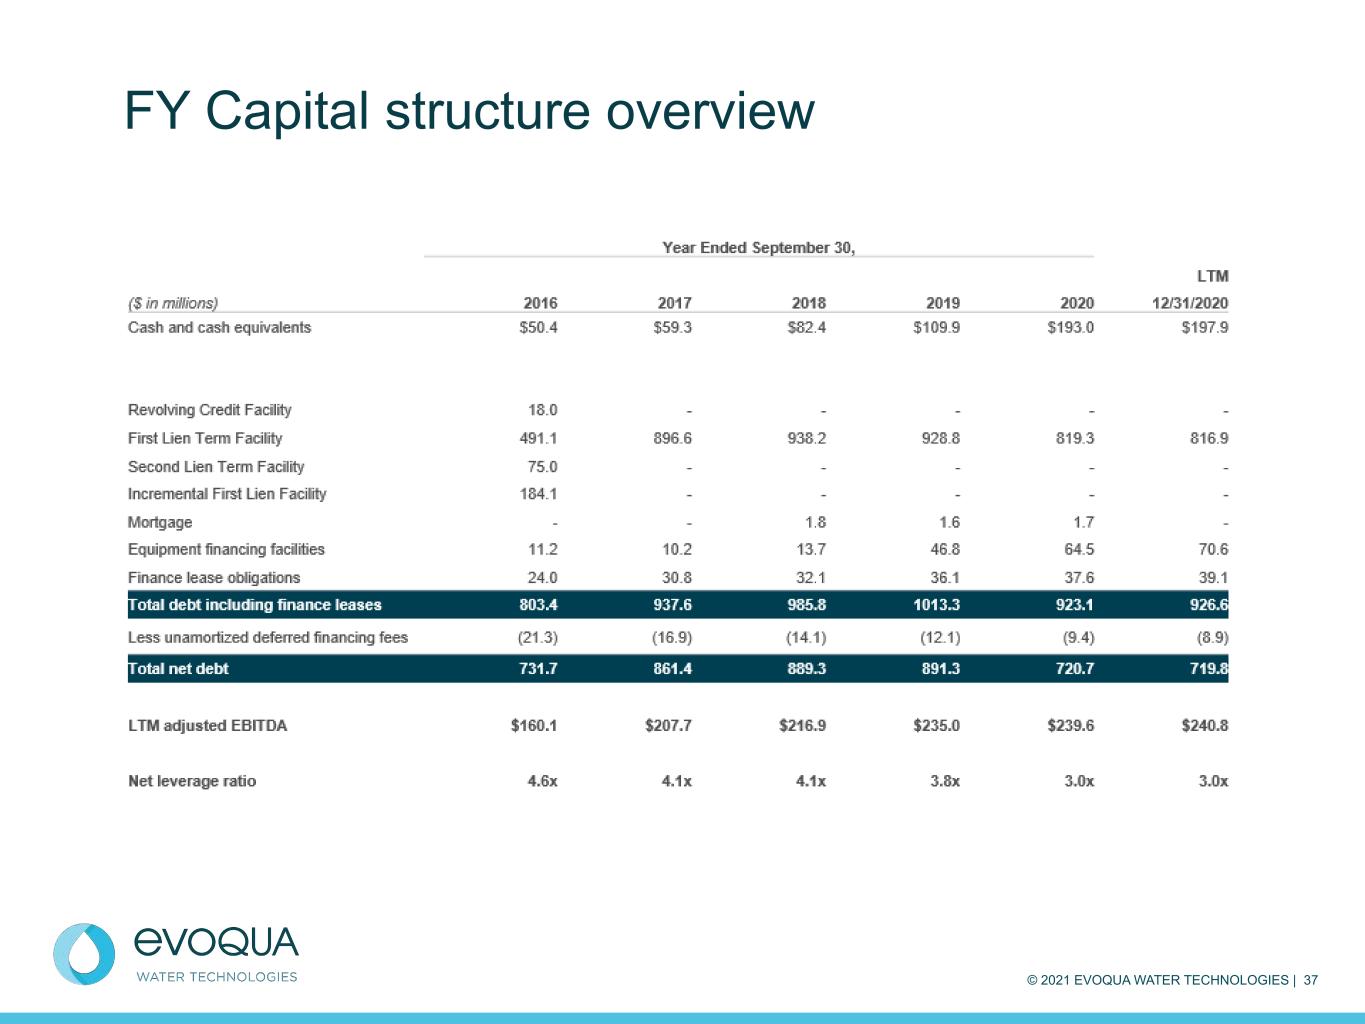
© 2021 EVOQUA WATER TECHNOLOGIES | 37 FY Capital structure overview


