1 Annual Shareholder Meeting - May 2015
2 Safe Harbor In keeping with the SEC's "Safe Harbor" guidelines, certain statements made during this presentation could be considered forward-looking and subject to certain risks and uncertainties that could cause results to differ materially from those projected. When we use the words "will likely result," "may," "anticipate," "estimate," "should," "expect," "believe," "intend," or similar expressions, we intend to identify forward- looking statements. Such forward-looking statements include, but are not limited to, our business and investment strategy, our understanding of our competition, current market trends and opportunities, projected operating results, and projected capital expenditures. These forward-looking statements are subject to known and unknown risks and uncertainties, which could cause actual results to differ materially from those anticipated including, without limitation: general volatility of the capital markets and the market price of our common stock; changes in our business or investment strategy; availability, terms and deployment of capital; availability of qualified personnel; changes in our industry and the market in which we operate, interest rates or the general economy, and the degree and nature of our competition. These and other risk factors are more fully discussed in the Company's filings with the Securities and Exchange Commission. Historical results are not indicative of future performance. EBITDA is defined as net income before interest, taxes, depreciation and amortization. EBITDA yield is defined as trailing twelve month EBITDA divided by the purchase price. A capitalization rate is determined by dividing the property's net operating income by the purchase price. Net operating income is the property's funds from operations minus a capital expense reserve of either 4% or 5% of gross revenues. Hotel EBITDA flow-through is the change in Hotel EBITDA divided by the change in total revenues. EBITDA, FFO, AFFO, CAD and other terms are non-GAAP measures, reconciliations of which have been provided in prior earnings releases and filings with the SEC. This overview is for informational purposes only and is not an offer to sell, or a solicitation of an offer to buy or sell, any securities of Ashford Inc. or any of its respective affiliates, and may not be relied upon in connection with the purchase or sale of any such security.
3 3 Overview of Ashford Ashford (NYSE MKT: AINC) is a global asset management company focused on managing real estate, hospitality and securities platforms Ashford currently manages Ashford Hospitality Trust (NYSE: AHT), Ashford Hospitality Prime (NYSE: AHP) and Ashford Investment Management (AIM) Scalable, asset-light operating platform with limited capital needs Multiple ways to grow platform: Organic growth of current Ashford Trust and Ashford Prime platforms Potential growth of Ashford Investment Management Creation of other investment vehicles/capital platforms – Select Service, Debt, other Hospitality-related Service Businesses Proven track record in managing and growing hospitality-related platforms Ashford currently has over $6 billion of Assets Under Management
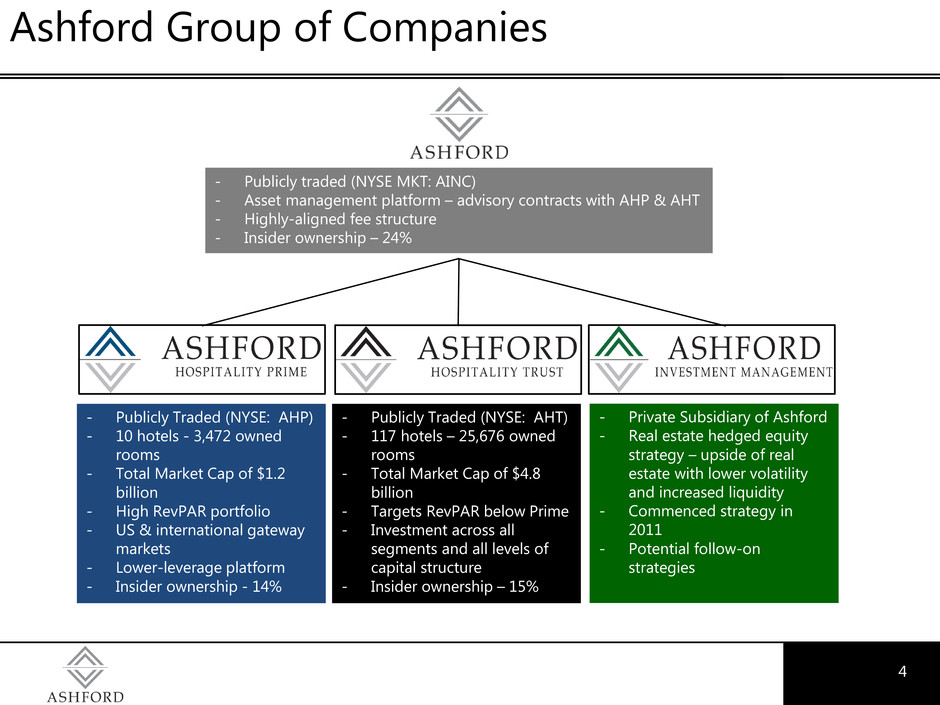
4 4 Ashford Group of Companies - Publicly Traded (NYSE: AHP) - 10 hotels - 3,472 owned rooms - Total Market Cap of $1.2 billion - High RevPAR portfolio - US & international gateway markets - Lower-leverage platform - Insider ownership - 14% - Publicly Traded (NYSE: AHT) - 117 hotels – 25,676 owned rooms - Total Market Cap of $4.8 billion - Targets RevPAR below Prime - Investment across all segments and all levels of capital structure - Insider ownership – 15% - Private Subsidiary of Ashford - Real estate hedged equity strategy – upside of real estate with lower volatility and increased liquidity - Commenced strategy in 2011 - Potential follow-on strategies - Publicly traded (NYSE MKT: AINC) - Asset management platform – advisory contracts with AHP & AHT - Highly-aligned fee structure - Insider ownership – 24%
5 5 Benefits of REIT Advisory Contracts Long duration contracts Scalable platform with attractive margins Upside through additional value creation and outperformance Low volatility fee stream
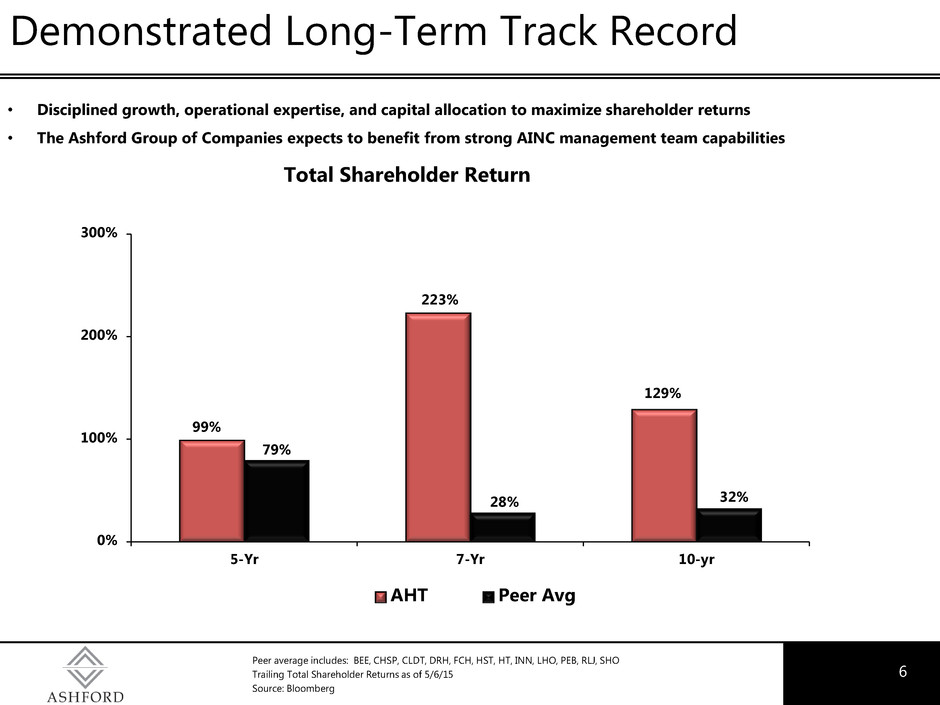
6 6 Demonstrated Long-Term Track Record • Disciplined growth, operational expertise, and capital allocation to maximize shareholder returns • The Ashford Group of Companies expects to benefit from strong AINC management team capabilities Peer average includes: BEE, CHSP, CLDT, DRH, FCH, HST, HT, INN, LHO, PEB, RLJ, SHO Trailing Total Shareholder Returns as of 5/6/15 Source: Bloomberg Total Shareholder Return 99% 223% 129% 79% 28% 32% 0% 100% 200% 300% 5-Yr 7-Yr 10-yr AHT Peer Avg

7 7 Ashford Hospitality Prime
8 8 Ashford Prime Overview High quality portfolio predominantly located in gateway & resort markets Low leverage strategy in line with peers High insider ownership of 14% Portfolio is in great physical condition after recent renovations Company announced $100mm share repurchase plan in October 2014

9 9 Ashford Hospitality Trust
10 10 Ashford Trust Overview High insider ownership of 15% Diversified portfolio with 66% of hotels managed by affiliated property manager Leveraged way to invest in the hotel cycle Opportunistically invest in hotels assets with up to 2x the national average RevPAR in all market locations
11 Ashford Investment Management
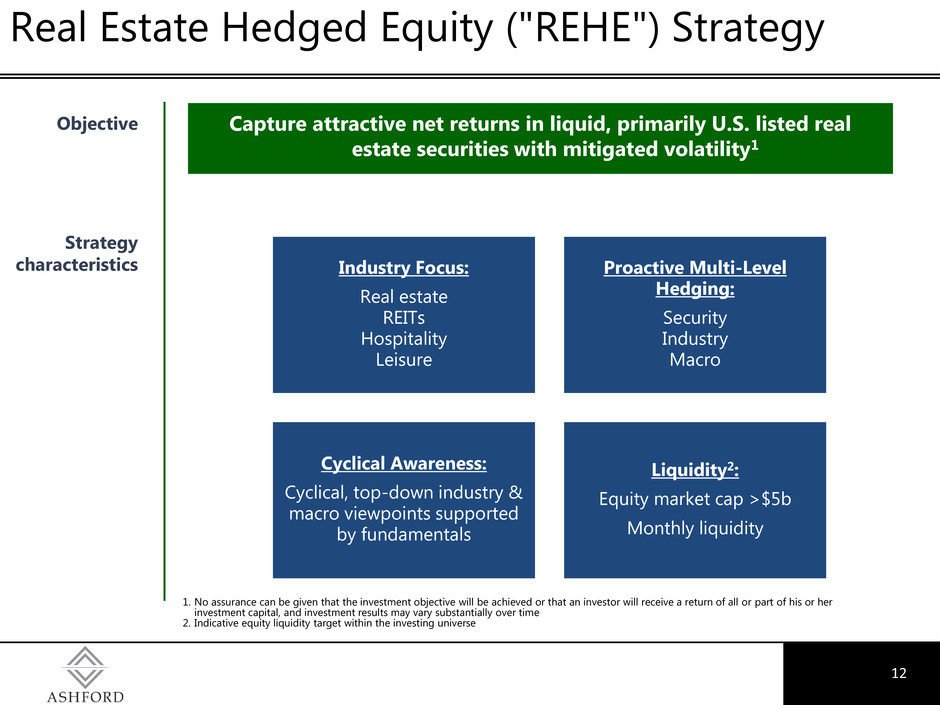
12 Real Estate Hedged Equity ("REHE") Strategy Objective Strategy characteristics Capture attractive net returns in liquid, primarily U.S. listed real estate securities with mitigated volatility1 1. No assurance can be given that the investment objective will be achieved or that an investor will receive a return of all or part of his or her investment capital, and investment results may vary substantially over time 2. Indicative equity liquidity target within the investing universe Industry Focus: Real estate REITs Hospitality Leisure Proactive Multi-Level Hedging: Security Industry Macro Cyclical Awareness: Cyclical, top-down industry & macro viewpoints supported by fundamentals Liquidity2: Equity market cap >$5b Monthly liquidity
13 Annual Shareholder Meeting - May 2015


