
ASHFORD INC. (NYSE American: AINC) W Atlanta Downtown – Atlanta, GA AINC COMPANY PRESENTATION – SEPTEMBER 2017
Safe Harbor Page 2 Ashford Company Presentation – September 2017 In keeping with the SEC's "Safe Harbor" guidelines, certain statements made during this presentation could be considered forward-looking and subject to certain risks and uncertainties that could cause results to differ materially from those projected. When we use the words "will likely result," "may," "anticipate," "estimate," "should," "expect," "believe," "intend," or similar expressions, we intend to identify forward-looking statements. Such forward-looking statements include, but are not limited to, our business and investment strategy, our understanding of our competition, current market trends and opportunities, projected operating results, and projected capital expenditures. These forward-looking statements are subject to known and unknown risks and uncertainties, which could cause actual results to differ materially from those anticipated including, without limitation: general volatility of the capital markets and the market price of our common stock; changes in our business or investment strategy; availability, terms and deployment of capital; availability of qualified personnel; changes in our industry and the market in which we operate, interest rates or the general economy, and the degree and nature of our competition. These and other risk factors are more fully discussed in each company's filings with the Securities and Exchange Commission. EBITDA is defined as net income before interest, taxes, depreciation and amortization. EBITDA yield is defined as trailing twelve month EBITDA divided by the purchase price. A capitalization rate is determined by dividing the property's net operating income by the purchase price. Net operating income is the property's funds from operations minus a capital expense reserve of either 4% or 5% of gross revenues. Hotel EBITDA flow-through is the change in Hotel EBITDA divided by the change in total revenues. EBITDA, FFO, AFFO, CAD and other terms are non-GAAP measures, reconciliations of which have been provided in prior earnings releases and filings with the SEC. This overview is for informational purposes only and is not an offer to sell, or a solicitation of an offer to buy or sell, any securities of Ashford Hospitality Trust, Inc., Ashford Hospitality Prime, Inc., Ashford Inc., or any of their respective affiliates, and may not be relied upon in connection with the purchase or sale of any such security.

Company Overview Focus on Hotels The only publicly-traded asset manager focused solely on hospitality 40+ years as a hotel owner, operator, and investor $6.3 billion hotel AUM managed via two public lodging REITs $66.4 million of advisory fees in the trailing 12-month period Ritz-Carlton – St. Thomas, V.I. Proven Performance Best-in-class hotel operational track record Long history of accessing capital to fuel accretive growth Outperformed peers in total shareholder returns Strong alignment of interest with high insider ownership Sofitel – Chicago, IL Expand existing platforms accretively & accelerate performance for incentive fees Start new investment platforms for additional base and incentive fees Invest in or incubate strategic businesses that can achieve accelerated growth through Ashford, especially by leveraging our deep knowledge and extensive relationships within the hospitality sector Multiple Paths to Growth Bardessono – Napa Valley, CA Hospitality asset management Core platform with high growth potential Growth-focused business model Long-term value creation Page 3 Ashford Company Presentation – September 2017 Data as of 6/30/2017
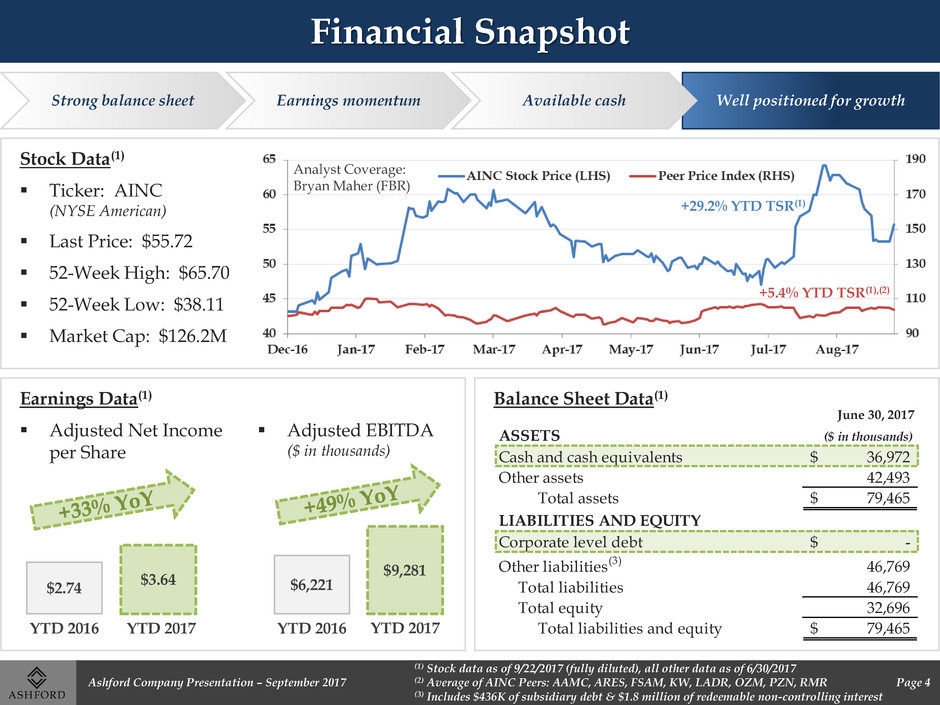
Financial Snapshot Page 4 Ashford Company Presentation – September 2017 (1) Stock data as of 9/22/2017 (fully diluted), all other data as of 6/30/2017 (2) Average of AINC Peers: AAMC, ARES, FSAM, KW, LADR, OZM, PZN, RMR (3) Includes $436K of subsidiary debt & $1.8 million of redeemable non-controlling interest June 30, 2017 ASSETS ($ in thousands) Cash and cash equivalents 36,972$ Other assets 42,493 Total assets 79,465$ LIABILITIES AND EQUITY Corporate level debt -$ Other liabilities (3) 46,769 Total liabilities 46,769 Total equity 32,696 Total liabilities and equity 79,465$ Balance Sheet Data(1) Stock Data(1) Ticker: AINC (NYSE American) Last Price: $55.72 52-Week High: $65.70 52-Week Low: $38.11 Market Cap: $126.2M YTD 2016 YTD 2017 $9,281 YTD 2016 $2.74 YTD 2017 $3.64 $6,221 Analyst Coverage: Bryan Maher (FBR) Earnings Data(1) Adjusted Net Income per Share Adjusted EBITDA ($ in thousands) +29.2% YTD TSR(1) +5.4% YTD TSR(1),(2) Strong balance sheet Well positioned for growth Earnings momentum Available cash

Corporate Structure Highly-aligned platform Provide diverse return streams to shareholders Charge fees for advisory services Invest in high-growth businesses Spun out from Ashford Hospitality Trust in 2014 Asset management company serving the hospitality industry Advisor to two publicly-traded REITs $6.3 billion of assets under management Ashford Inc. (NYSE American: AINC)(1) Publicly-traded hotel REIT (NYSE: AHP) $1.8 billion gross assets Luxury hotels and resorts 13 hotels – nearly 4,000 rooms Publicly-traded hotel REIT (NYSE: AHT) $5.7 billion gross assets Full-service and upper-upscale hotels in diversified markets 120 hotels – 25,000+ rooms Provide asset management & advisory services to REITs Pay base advisory, incentive, and other fees Make direct investments Accelerate returns & earnings growth Page 5 Ashford Company Presentation – September 2017 (1) All data as of 6/30/2017 (2) Anticipated to close in 2017 (2)

Expansive Footprint Large, public company presence Institutional quality investment platform Robust operational infrastructure Broad geographic asset diversity Page 6 Ashford Company Presentation – September 2017 Data as of 6/30/2017 Diverse Markets & Segments Headquarters in Dallas, TX with over 100 corporate employees One of the largest North American hotel portfolios with close to 30,000 rooms and 130+ hotels Geographic diversity in 32 states, Washington D.C., and U.S. Virgin Islands Park Hyatt – Beaver Creek, CO Marriott – Beverly Hills, CA The Churchill – Washington D.C. Ashford Properties
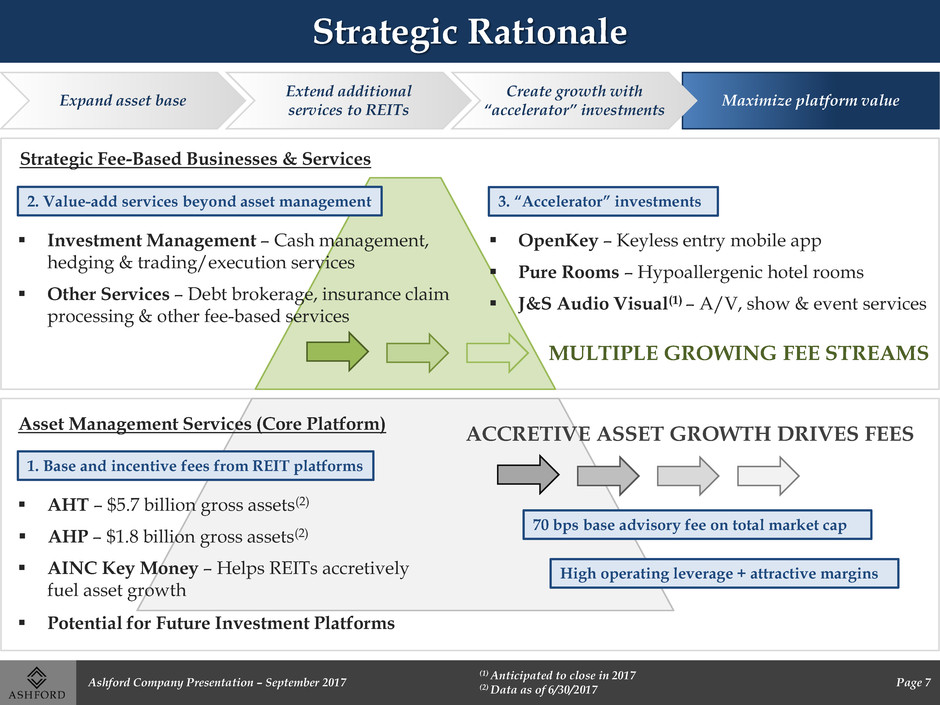
Strategic Rationale Expand asset base Maximize platform value Extend additional services to REITs Create growth with “accelerator” investments Strategic Fee-Based Businesses & Services Investment Management – Cash management, hedging & trading/execution services Other Services – Debt brokerage, insurance claim processing & other fee-based services 2. Value-add services beyond asset management Asset Management Services (Core Platform) Potential for Future Investment Platforms AHP – $1.8 billion gross assets(2) AINC Key Money – Helps REITs accretively fuel asset growth AHT – $5.7 billion gross assets(2) 1. Base and incentive fees from REIT platforms OpenKey – Keyless entry mobile app Pure Rooms – Hypoallergenic hotel rooms J&S Audio Visual(1) – A/V, show & event services 3. “Accelerator” investments MULTIPLE GROWING FEE STREAMS ACCRETIVE ASSET GROWTH DRIVES FEES 70 bps base advisory fee on total market cap High operating leverage + attractive margins Page 7 Ashford Company Presentation – September 2017 (1) Anticipated to close in 2017 (2) Data as of 6/30/2017
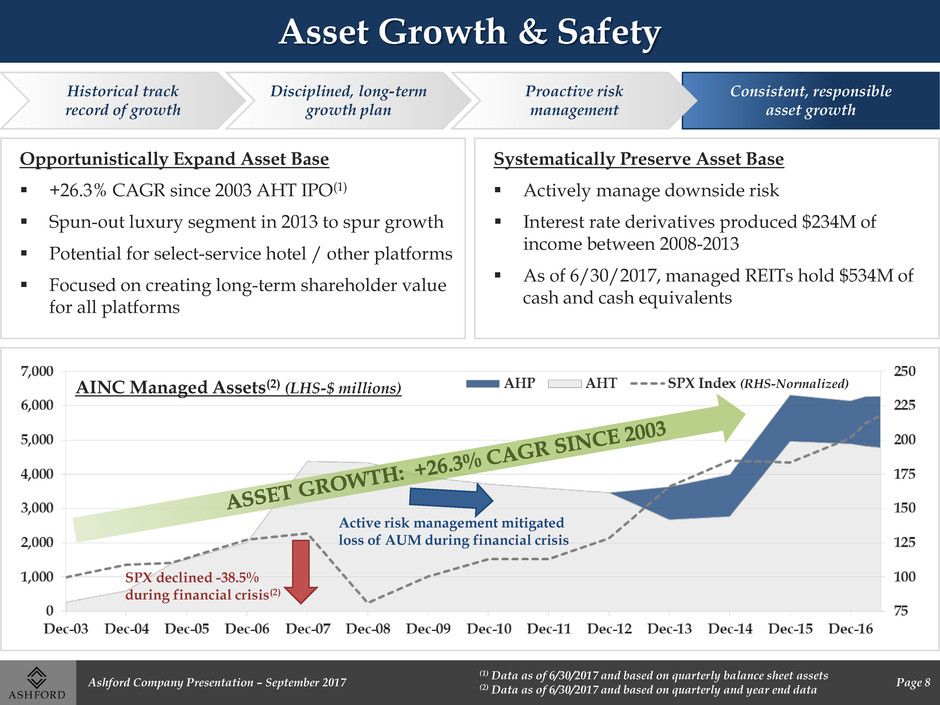
Asset Growth & Safety Historical track record of growth Consistent, responsible asset growth Disciplined, long-term growth plan Proactive risk management Opportunistically Expand Asset Base +26.3% CAGR since 2003 AHT IPO(1) Spun-out luxury segment in 2013 to spur growth Potential for select-service hotel / other platforms Focused on creating long-term shareholder value for all platforms Active risk management mitigated loss of AUM during financial crisis Systematically Preserve Asset Base Actively manage downside risk Interest rate derivatives produced $234M of income between 2008-2013 As of 6/30/2017, managed REITs hold $534M of cash and cash equivalents AINC Managed Assets(2) (LHS-$ millions) SPX declined -38.5% during financial crisis(2) (RHS-Normalized) Page 8 Ashford Company Presentation – September 2017 (1) Data as of 6/30/2017 and based on quarterly balance sheet assets (2) Data as of 6/30/2017 and based on quarterly and year end data
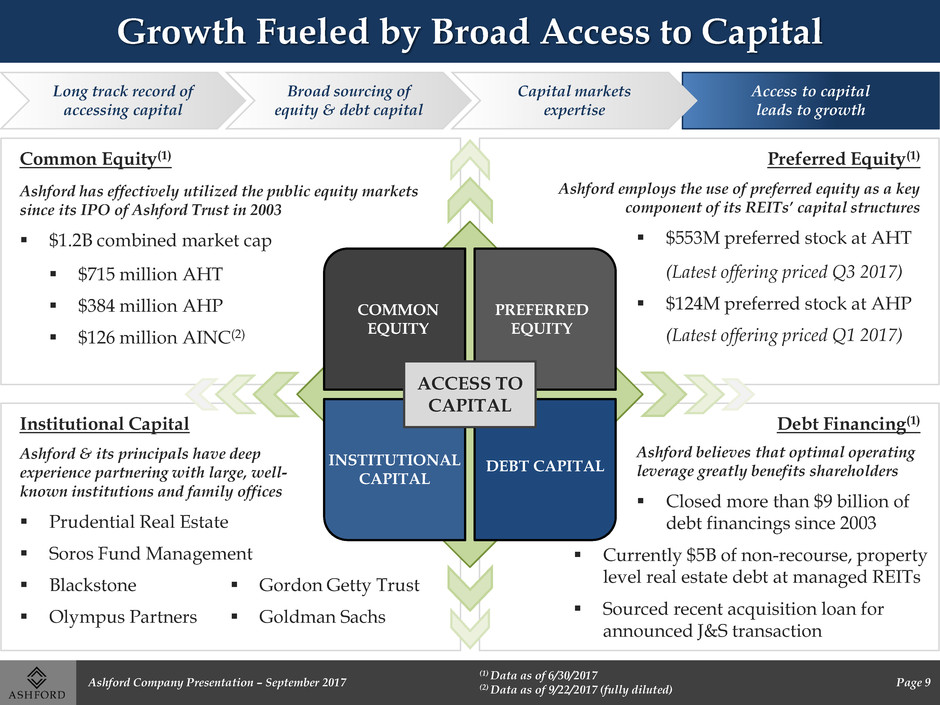
Growth Fueled by Broad Access to Capital Long track record of accessing capital Access to capital leads to growth Broad sourcing of equity & debt capital Capital markets expertise $553M preferred stock at AHT Preferred Equity(1) Ashford employs the use of preferred equity as a key component of its REITs’ capital structures (Latest offering priced Q3 2017) $124M preferred stock at AHP (Latest offering priced Q1 2017) COMMON EQUITY PREFERRED EQUITY DEBT CAPITAL INSTITUTIONAL CAPITAL ACCESS TO CAPITAL $715 million AHT $1.2B combined market cap $126 million AINC(2) Common Equity(1) Ashford has effectively utilized the public equity markets since its IPO of Ashford Trust in 2003 $384 million AHP Currently $5B of non-recourse, property level real estate debt at managed REITs Sourced recent acquisition loan for announced J&S transaction Ashford believes that optimal operating leverage greatly benefits shareholders Debt Financing(1) Closed more than $9 billion of debt financings since 2003 Institutional Capital Ashford & its principals have deep experience partnering with large, well- known institutions and family offices Prudential Real Estate Gordon Getty Trust Soros Fund Management Blackstone Olympus Partners Goldman Sachs Page 9 Ashford Company Presentation – September 2017 (1) Data as of 6/30/2017 (2) Data as of 9/22/2017 (fully diluted)
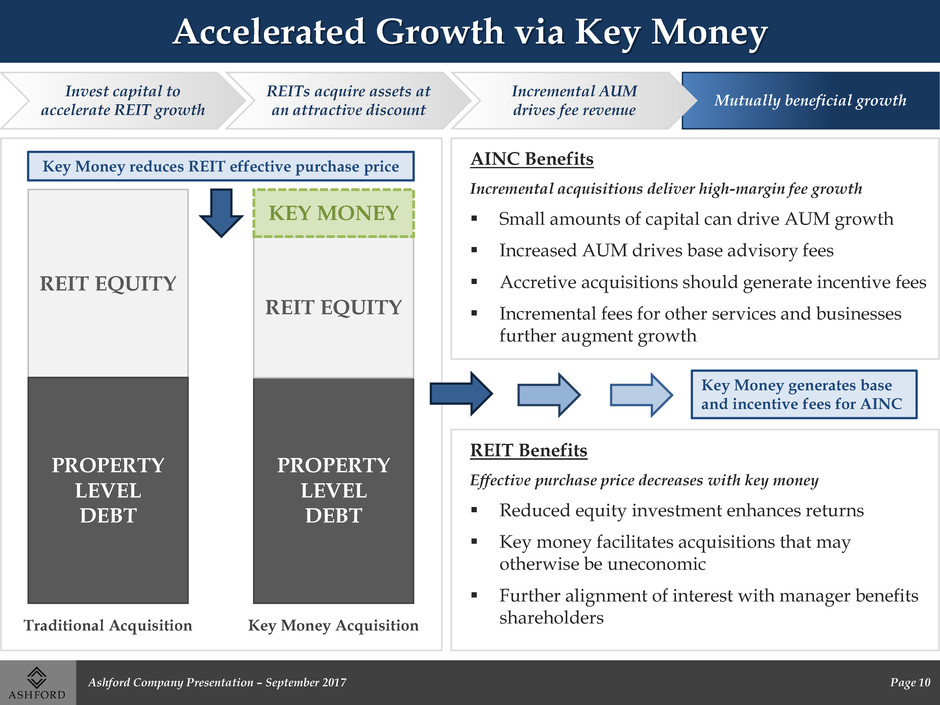
Accelerated Growth via Key Money Invest capital to accelerate REIT growth Mutually beneficial growth REITs acquire assets at an attractive discount Incremental AUM drives fee revenue REIT Benefits Effective purchase price decreases with key money Further alignment of interest with manager benefits shareholders Reduced equity investment enhances returns Key money facilitates acquisitions that may otherwise be uneconomic AINC Benefits Incremental acquisitions deliver high-margin fee growth Accretive acquisitions should generate incentive fees Increased AUM drives base advisory fees Incremental fees for other services and businesses further augment growth Small amounts of capital can drive AUM growth PROPERTY LEVEL DEBT REIT EQUITY PROPERTY LEVEL DEBT REIT EQUITY KEY MONEY Key Money reduces REIT effective purchase price Key Money generates base and incentive fees for AINC Traditional Acquisition Key Money Acquisition Page 10 Ashford Company Presentation – September 2017
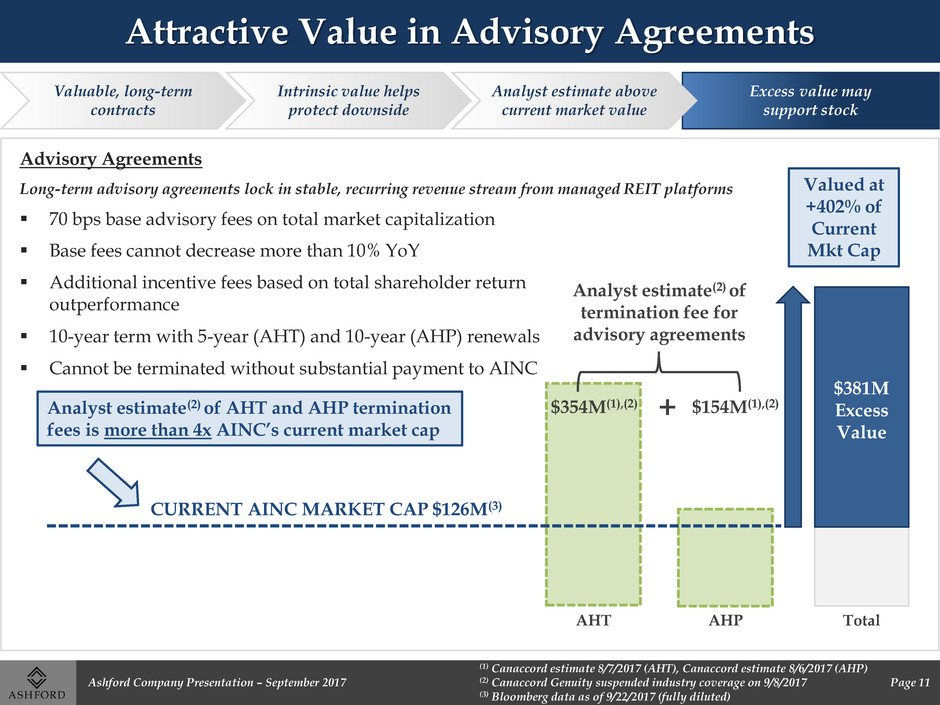
Attractive Value in Advisory Agreements Total AHT AHP Valuable, long-term contracts Excess value may support stock Intrinsic value helps protect downside Analyst estimate above current market value Advisory Agreements Long-term advisory agreements lock in stable, recurring revenue stream from managed REIT platforms 70 bps base advisory fees on total market capitalization Base fees cannot decrease more than 10% YoY Additional incentive fees based on total shareholder return outperformance Cannot be terminated without substantial payment to AINC 10-year term with 5-year (AHT) and 10-year (AHP) renewals Valued at +402% of Current Mkt Cap CURRENT AINC MARKET CAP $126M(3) $154M(1),(2) $354M(1),(2) Analyst estimate(2) of termination fee for advisory agreements + Analyst estimate(2) of AHT and AHP termination fees is more than 4x AINC’s current market cap $381M Excess Value Page 11 Ashford Company Presentation – September 2017 (1) Canaccord estimate 8/7/2017 (AHT), Canaccord estimate 8/6/2017 (AHP) (2) Canaccord Genuity suspended industry coverage on 9/8/2017 (3) Bloomberg data as of 9/22/2017 (fully diluted)

Operational Excellence Hotel operating expertise Deliver EBITDA and RevPAR outperformance Benefits from affiliated property manager Best-in-class asset management Value Creation Through Active Management AINC and REITs alignment drives performance Affiliated property management delivers results Accretive EBITDA margins and flow-throughs Strong RevPAR gains relative to peers Operating Performance 3-Year Averages (2015, 2016, and YTD 2017 as of 6/30)(1),(2) Hotel EBITDA Flow-Through Hotel EBITDA Margin Growth (bps) Hotel EBITDA % Change YoY Hotel RevPAR Growth YoY Page 12 Ashford Company Presentation – September 2017 (1) Based on reported financial results for AHT and AHP; EBITDA and other terms are non-GAAP measures, reconciliations of which have been provided in prior earnings releases and SEC filings (2) REIT Peers: APLE, CHSP, CLDT, DRH, FCH, HST, HT, INN, LHO, PEB, PK, RHP, RLJ, SHO, XHR
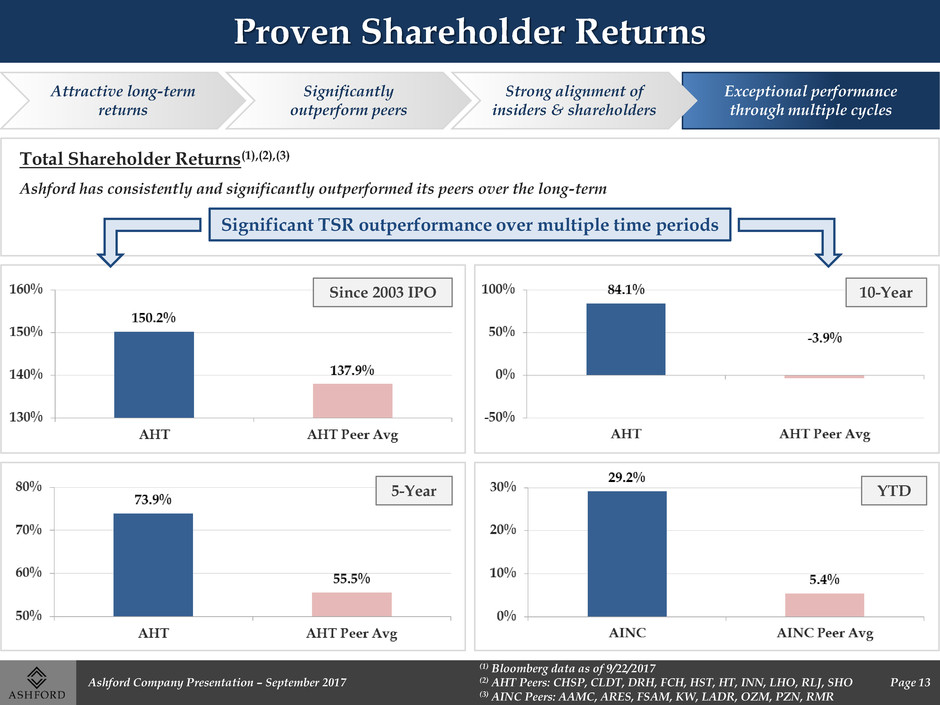
Proven Shareholder Returns Significant TSR outperformance over multiple time periods Since 2003 IPO Attractive long-term returns Exceptional performance through multiple cycles Significantly outperform peers Strong alignment of insiders & shareholders Total Shareholder Returns(1),(2),(3) Ashford has consistently and significantly outperformed its peers over the long-term 10-Year 5-Year YTD Page 13 Ashford Company Presentation – September 2017 (1) Bloomberg data as of 9/22/2017 (2) AHT Peers: CHSP, CLDT, DRH, FCH, HST, HT, INN, LHO, RLJ, SHO (3) AINC Peers: AAMC, ARES, FSAM, KW, LADR, OZM, PZN, RMR
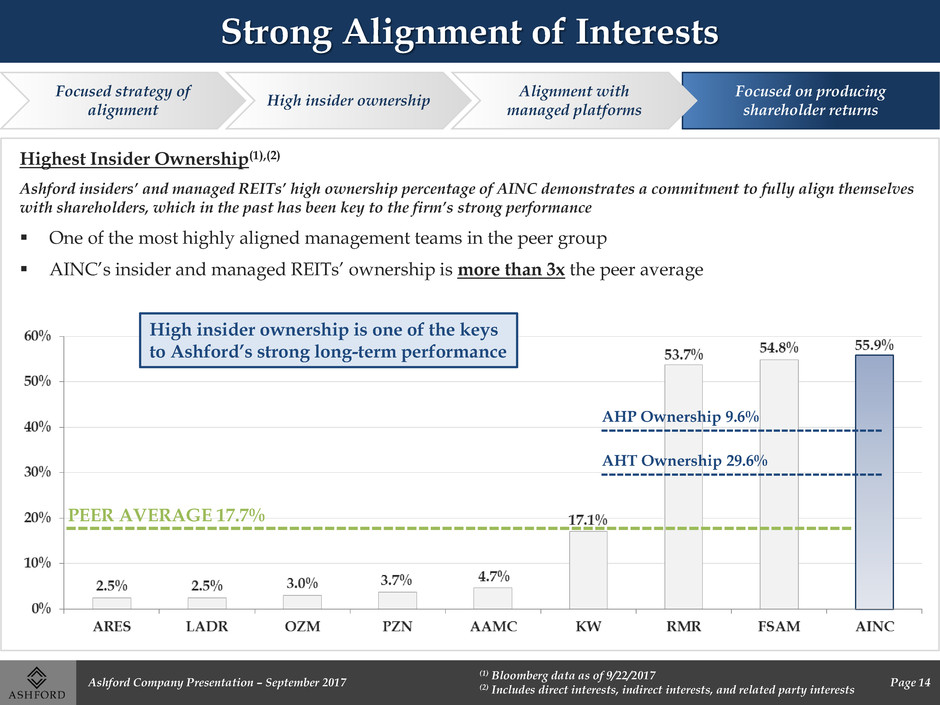
Strong Alignment of Interests PEER AVERAGE 17.7% Focused strategy of alignment Focused on producing shareholder returns High insider ownership Alignment with managed platforms Highest Insider Ownership(1),(2) Ashford insiders’ and managed REITs’ high ownership percentage of AINC demonstrates a commitment to fully align themselves with shareholders, which in the past has been key to the firm’s strong performance One of the most highly aligned management teams in the peer group AINC’s insider and managed REITs’ ownership is more than 3x the peer average High insider ownership is one of the keys to Ashford’s strong long-term performance AHT Ownership 29.6% AHP Ownership 9.6% Page 14 Ashford Company Presentation – September 2017 (1) Bloomberg data as of 9/22/2017 (2) Includes direct interests, indirect interests, and related party interests

Hotel industry experts Seasoned veterans with excellent long-term returns Decades working together Experience throughout market cycles Executive Leadership Page 15 Ashford Company Presentation – September 2017 Data as of 6/30/2017 Monty Bennett – CEO 28 years of hospitality experience 28 years with Ashford and predecessor Cornell School of Hotel Administration, BS Cornell S.C. Johnson School, MBA David Brooks – COO and General Counsel 32 years of hospitality & legal experience 25 years with Ashford and predecessor University of North Texas, BS University of Houston, JD Mark Nunneley, CPA – CAO 32 years of hospitality experience 32 years with Ashford and predecessor Pepperdine University, BS University of Houston, MS Deric Eubanks, CFA – CFO 17 years of hospitality experience 14 years with Ashford 3 years with ClubCorp Southern Methodist University, BBA Rob Hays – CSO 12 years of hospitality experience 12 years with Ashford 3 years M&A at Dresser Inc. & Merrill Lynch Princeton University, AB Jeremy Welter – EVP of Asset Management 11 years of hospitality experience 11 years with Ashford 5 years with Stephens Investment Bank Oklahoma State University, BS Douglas Kessler – President 33 years of real estate & hospitality experience 15 years with Ashford and predecessor 10 years with Goldman Sachs Whitehall Funds Stanford University, BA & MBA
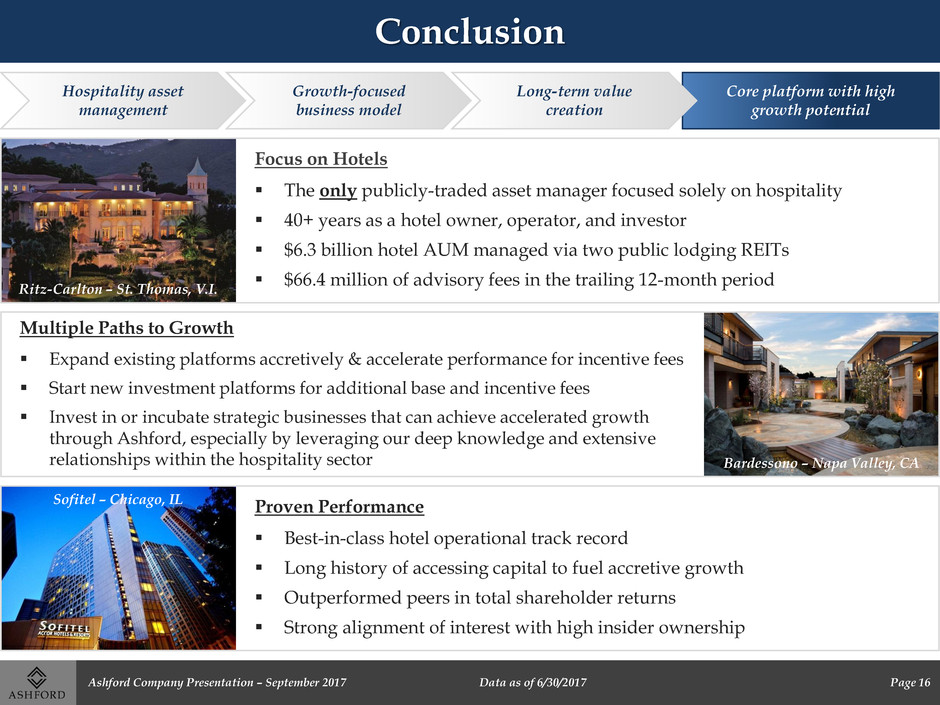
Conclusion Focus on Hotels The only publicly-traded asset manager focused solely on hospitality 40+ years as a hotel owner, operator, and investor $6.3 billion hotel AUM managed via two public lodging REITs $66.4 million of advisory fees in the trailing 12-month period Ritz-Carlton – St. Thomas, V.I. Proven Performance Best-in-class hotel operational track record Long history of accessing capital to fuel accretive growth Outperformed peers in total shareholder returns Strong alignment of interest with high insider ownership Sofitel – Chicago, IL Expand existing platforms accretively & accelerate performance for incentive fees Start new investment platforms for additional base and incentive fees Invest in or incubate strategic businesses that can achieve accelerated growth through Ashford, especially by leveraging our deep knowledge and extensive relationships within the hospitality sector Multiple Paths to Growth Bardessono – Napa Valley, CA Hospitality asset management Core platform with high growth potential Growth-focused business model Long-term value creation Page 16 Ashford Company Presentation – September 2017 Data as of 6/30/2017

Ashford Inc. (NYSE American: AINC) 14185 Dallas Parkway, Suite 1100 ● Dallas, TX 75254 P: 972-490-9600 ● www.ashfordinc.com Park Hyatt Beaver Creek Resort & Spa – Beaver Creek, CO AINC COMPANY PRESENTATION – SEPTEMBER 2017
APPENDIX: STRATEGIC INVESTMENTS Pier House Resort & Spa – Key West, FL AINC COMPANY PRESENTATION – SEPTEMBER 2017
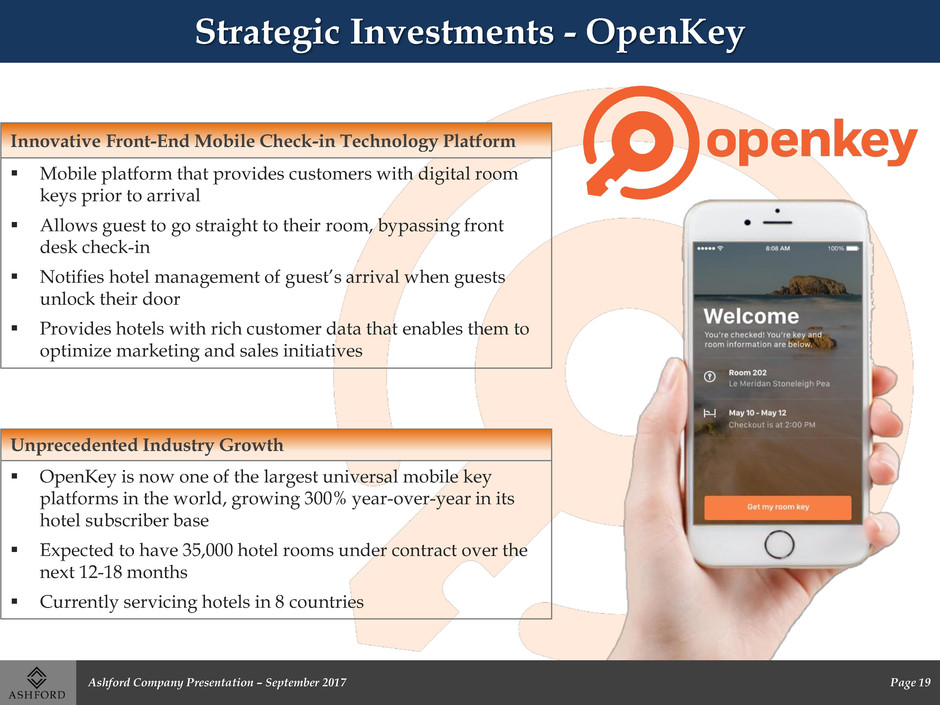
Strategic Investments - OpenKey Unprecedented Industry Growth OpenKey is now one of the largest universal mobile key platforms in the world, growing 300% year-over-year in its hotel subscriber base Expected to have 35,000 hotel rooms under contract over the next 12-18 months Currently servicing hotels in 8 countries Mobile platform that provides customers with digital room keys prior to arrival Allows guest to go straight to their room, bypassing front desk check-in Notifies hotel management of guest’s arrival when guests unlock their door Provides hotels with rich customer data that enables them to optimize marketing and sales initiatives Innovative Front-End Mobile Check-in Technology Platform Page 19 Ashford Company Presentation – September 2017

Strategic Investments – PURE Rooms PURE Room Solutions Leading provider of hypo-allergenic rooms in the hospitality industry 7-step process that eliminates and protects against 98- 100% of viruses, bacteria and other irritants Currently serves more than 2,400 rooms throughout the United States in 160+ hotels Revenue on Multiple Fronts Allergy friendly rooms are increasingly demanded Hotels can charge a premium for each room booked utilizing PURE technology, thus increasing a property’s ADR and bottom line Ashford can leverage its industry relationships to push PURE in other platforms, thus increasing fee generation back to PURE and Ashford After inclusion of all Trust and Prime hotels, net income and adjusted EBITDA are expected to increase by $434,000 and $257,000 respectively Page 20 Ashford Company Presentation – September 2017
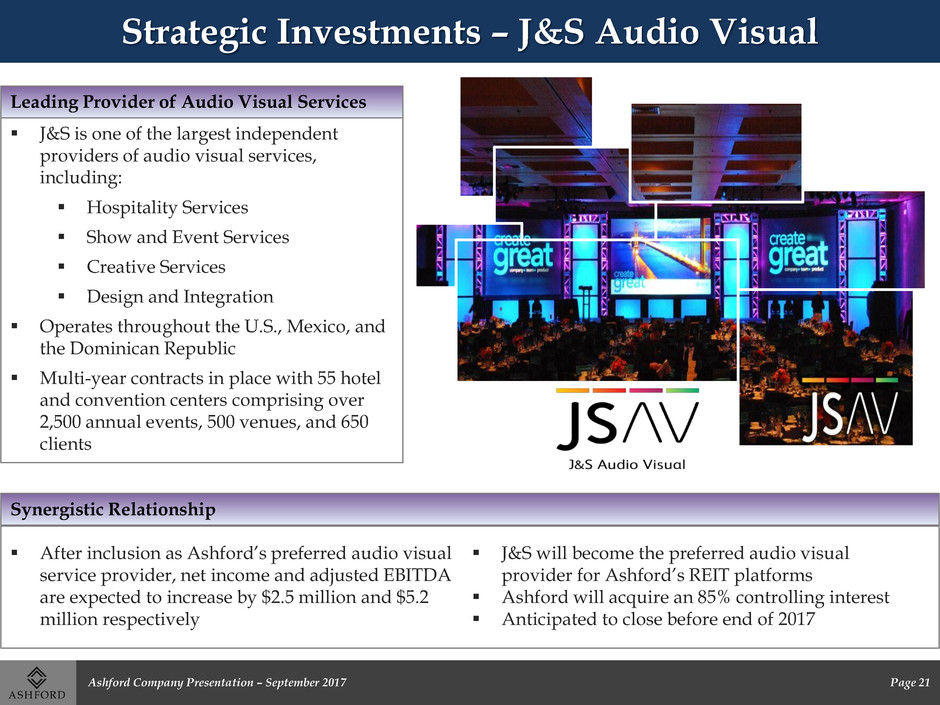
Strategic Investments – J&S Audio Visual Leading Provider of Audio Visual Services J&S is one of the largest independent providers of audio visual services, including: Hospitality Services Show and Event Services Creative Services Design and Integration Operates throughout the U.S., Mexico, and the Dominican Republic Multi-year contracts in place with 55 hotel and convention centers comprising over 2,500 annual events, 500 venues, and 650 clients Synergistic Relationship After inclusion as Ashford’s preferred audio visual service provider, net income and adjusted EBITDA are expected to increase by $2.5 million and $5.2 million respectively J&S will become the preferred audio visual provider for Ashford’s REIT platforms Ashford will acquire an 85% controlling interest Anticipated to close before end of 2017 Page 21 Ashford Company Presentation – September 2017


