
NYSE American: AINC September 2021

Page 2 In keeping with the Securities and Exchange Commission (“SEC”) "Safe Harbor" guidelines, certain statements made during this presentation could be considered forward-looking and subject to certain risks and uncertainties that could cause results to differ materially from those projected. When we use the words "will likely result," "may," "anticipate," "estimate," "should," "expect," "believe," "intend," “target,” or similar expressions, we intend to identify forward-looking statements. Such forward-looking statements include, but are not limited to, our business and investment strategy, our understanding of our competition, current market trends and opportunities, projected operating results, and projected capital expenditures. Readers are cautioned not to place undue reliance on these forward-looking statements, which speak only as of the date of this document. We undertake no obligation to update or revise the statements made therein, except as may be required by law. These forward-looking statements are subject to known and unknown risks and uncertainties, which could cause actual results to differ materially from those anticipated including, without limitation: the continued impact of the COVID-19 pandemic and its effects on travel (including uncertainty relating to any new or continuing governmental restrictions on travel or other factors that impact public behavior) and its impact on our business, financial condition and results from operations; general volatility of the capital markets, the general economy or the hospitality industry, whether the result of market events (including the COVID-19 pandemic and the timing and pace of the economic recovery therefrom) or otherwise, and the market price of our common stock; availability, terms and deployment of capital; our ability to maintain compliance with NYSE American LLC continued listing standards; changes in our industry and the market in which we operate, interest rates or the general economy; the degree and nature of our competition; actual and potential conflicts of interest with or between Remington, Ashford Trust and Braemar, our executive officers and our non-independent directors; availability of qualified personnel; changes in governmental regulations, accounting rules, tax rates and similar matters; legislative and regulatory changes; the possibility that we may not realize any or all of the anticipated benefits from transactions to acquire businesses, including the acquisition of the project management business previously owned by Remington, and from new business initiatives, including the ERFPs with Ashford Trust and Braemar; disruptions relating to the acquisition or integration of the hotel management business previously owned by Remington, which may harm relationships with customers, employees and regulators; and unexpected costs relating to the acquisition or integration of the hotel management business previously owned by Remington. These and other risk factors are more fully discussed in the company's filings with the SEC. Adjusted EBITDA is calculated by subtracting or adding to net income (loss): interest expense, income taxes, depreciation, amortization, net income (loss) to non- controlling interests, transaction costs, and other expenses. Adjusted EBITDA is a non-GAAP measure and reconciliations have been provided in prior earnings releases and filings with the SEC or in the appendix to this presentation. Our business has been and will continue to be materially adversely affected by the impact of, and the public perception of a risk of, a pandemic disease. In December 2019, a novel strain of coronavirus (COVID-19) was identified in Wuhan, China, which has subsequently spread to other regions of the world, and has resulted in increased travel restrictions and extended shutdown of certain businesses in affected regions, including in nearly every state in the United States. Since late February 2020, we have experienced a significant decline in occupancy and RevPAR and we expect the significant occupancy and RevPAR reduction associated with the novel coronavirus (COVID-19) to likely continue as we are recording significant reservation cancellations as well as a significant reduction in new reservations relative to prior expectations. The continued outbreak of the virus in the U.S. has and will likely continue to further reduce travel and demand at our hotels. The prolonged occurrence of the virus has resulted in health or other government authorities imposing widespread restrictions on travel or other market impacts. The hotel industry and our portfolio have and we expect will continue to experience the postponement or cancellation of a significant number of business conferences and similar events. At this time those restrictions are very fluid and evolving. We have been and will continue to be negatively impacted by those restrictions. Given that the type, degree and length of such restrictions are not known at this time, we cannot predict the overall impact of such restrictions on us or the overall economic environment. In addition, even after the restrictions are lifted, the propensity of people to travel and for businesses to hold conferences will likely remain below historical levels for an additional period of time that is difficult to predict. We may also face increased risk of litigation if we have guests or employees who become ill due to COVID-19. This overview is for informational purposes only and is not an offer to sell, or a solicitation of an offer to buy or sell, any securities of Ashford Inc., or any of its respective affiliates, and may not be relied upon in connection with the purchase or sale of any such security, and the information contained herein does not form part of any prospectus of Ashford Inc. that may be used to offer or sell securities. Prior to investing in Ashford, potential investors should carefully review Ashford’s periodic filings with the Securities and Exchange Commission, including, but not limited to, Ashford’s most current Form 10-K, Form 10-Q and Form 8-K’s, including the risk factors included therein. Safe Harbor
About Us – Advisor. Operator. Innovator. Ashford (NYSE American: AINC) is a leading provider of asset management and other services to companies within the hospitality industry. Ashford's principals have a long track record of success and many years of experience investing and operating in the hospitality industry. Currently, Ashford serves as the advisor to two NYSE-listed real estate investment trusts, Ashford Hospitality Trust (NYSE: AHT) and Braemar Hotels & Resorts (NYSE: BHR). Ashford also has a Products and Services initiative, where it strategically invests in operating companies that service the industry, and acts as an accelerator to grow those companies, through both of the advised platforms and other third parties. Page 3
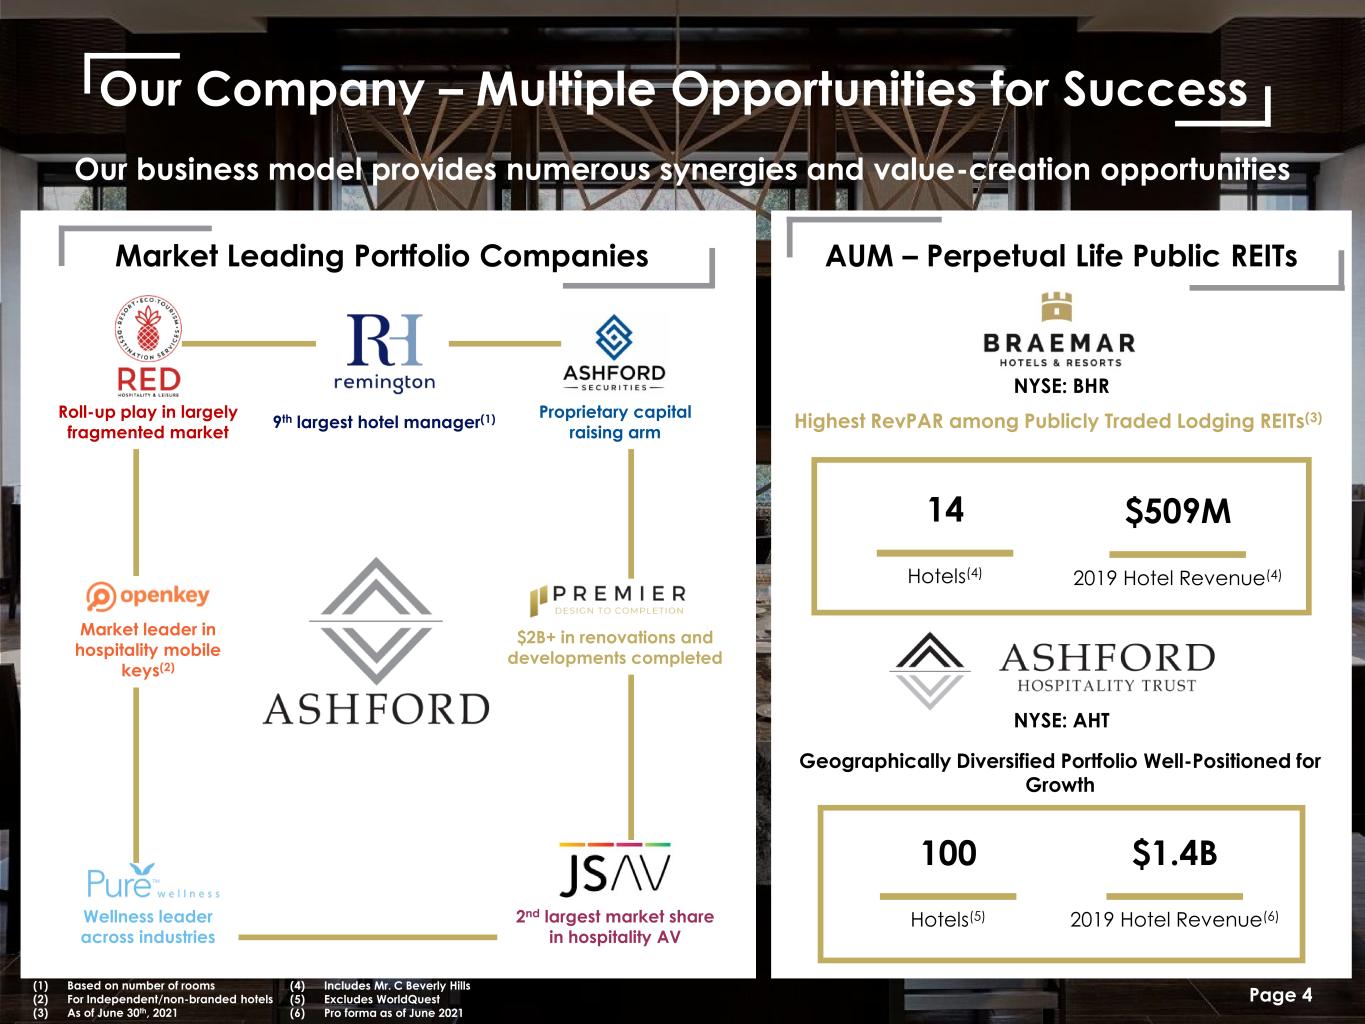
c Hotels(5) 100 2019 Hotel Revenue(6) $1.4B c Hotels(4) 14 2019 Hotel Revenue(4) $509M Our Company – Multiple Opportunities for Success Market Leading Portfolio Companies AUM – Perpetual Life Public REITs NYSE: BHR NYSE: AHT Our business model provides numerous synergies and value-creation opportunities Highest RevPAR among Publicly Traded Lodging REITs(3) (1) Based on number of rooms (2) For Independent/non-branded hotels (3) As of June 30th, 2021 Page 4 2nd largest market share in hospitality AV 9th largest hotel manager(1) Proprietary capital raising arm Roll-up play in largely fragmented market Wellness leader across industries $2B+ in renovations and developments completed Market leader in hospitality mobile keys(2) (1) D (2) D (3) d (4) Includes Mr. C Beverly Hills (5) Excludes WorldQuest (6) Pro forma as of June 2021 Geographically Diversified Portfolio Well-Positioned for Growth
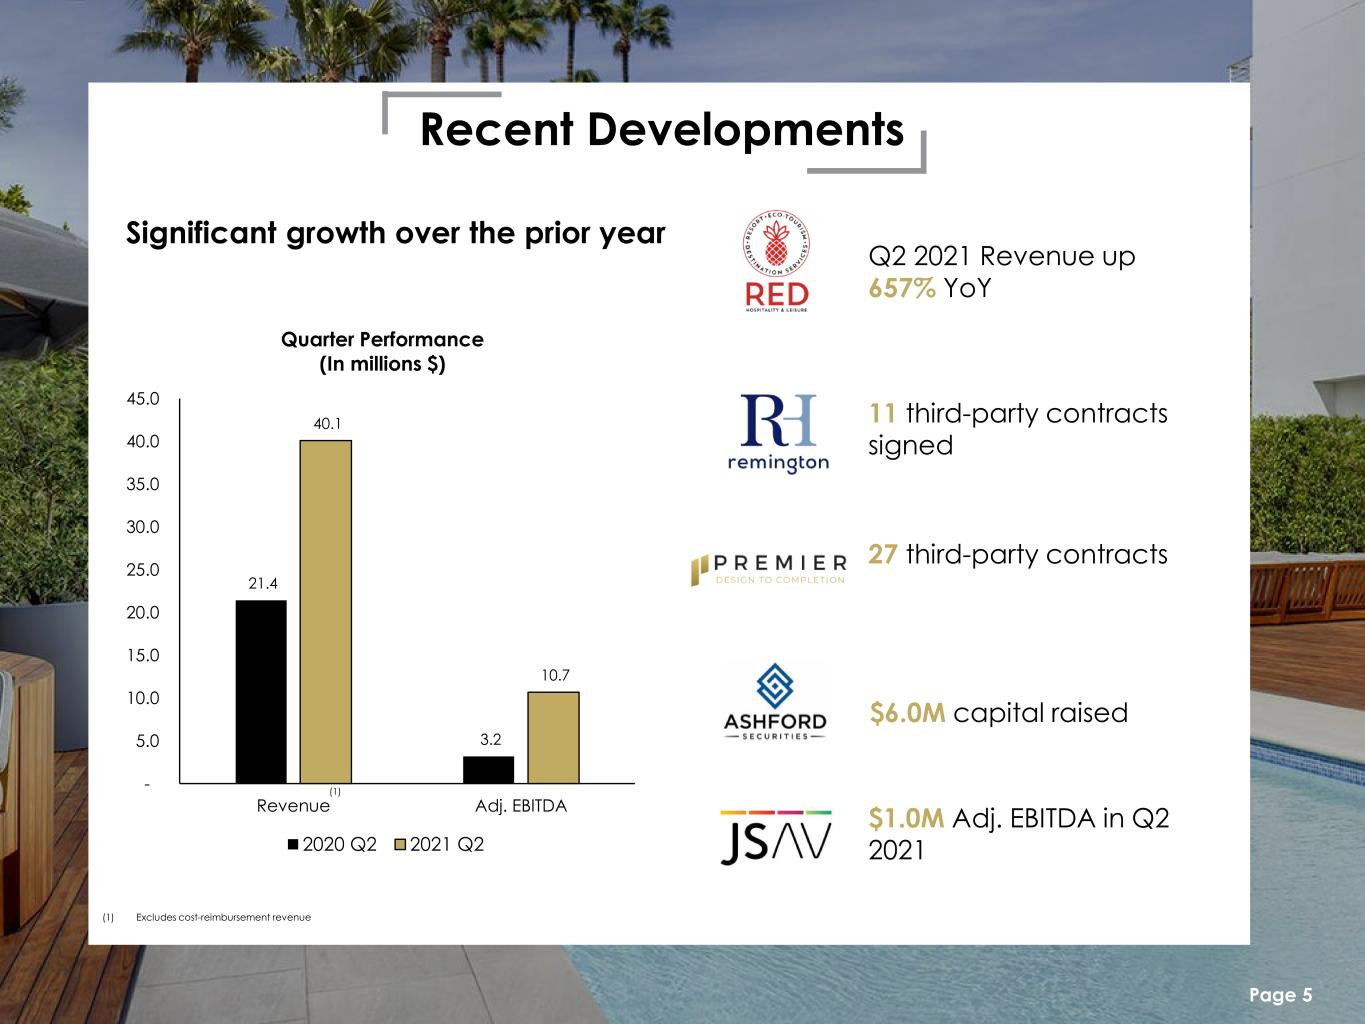
Recent Developments Page 5 Q2 2021 Revenue up 657% YoY 11 third-party contracts signed 27 third-party contracts $6.0M capital raised $1.0M Adj. EBITDA in Q2 2021 21.4 3.2 40.1 10.7 - 5.0 10.0 15.0 20.0 25.0 30.0 35.0 40.0 45.0 Revenue Adj. EBITDA Quarter Performance (In millions $) 2020 Q2 2021 Q2 (1) (1) Excludes cost-reimbursement revenue Significant growth over the prior year
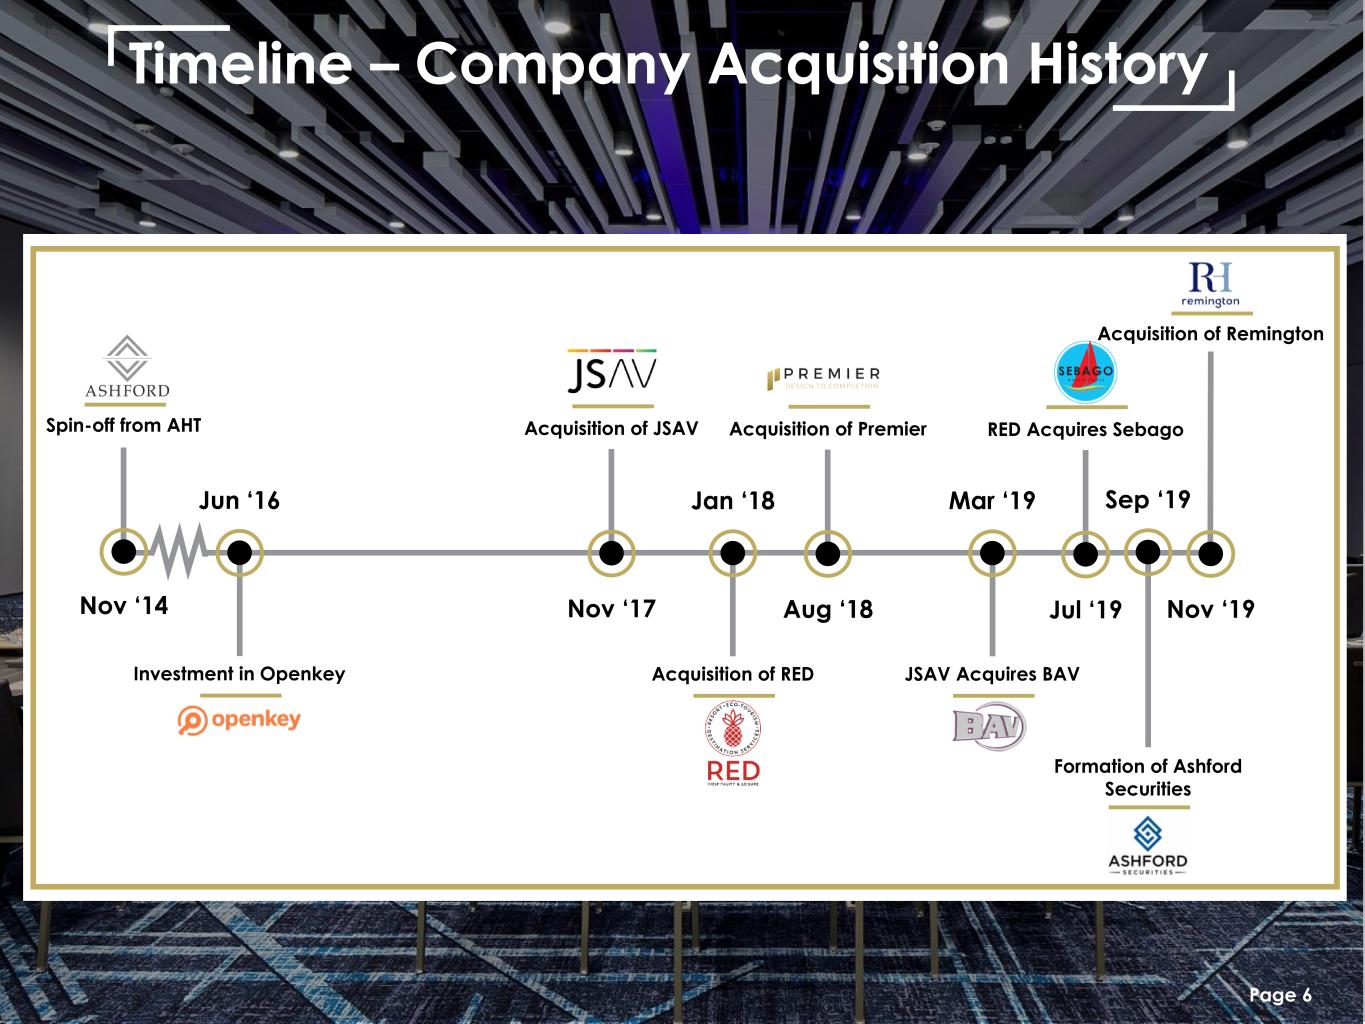
Timeline – Company Acquisition History Investment in Openkey Jun ‘16 Spin-off from AHT Nov ‘14 Acquisition of JSAV Nov ‘17 Acquisition of RED Jan ‘18 JSAV Acquires BAV Mar ‘19 Acquisition of Premier Aug ‘18 RED Acquires Sebago Jul ‘19 Formation of Ashford Securities Sep ‘19 Acquisition of Remington Nov ‘19 Page 6
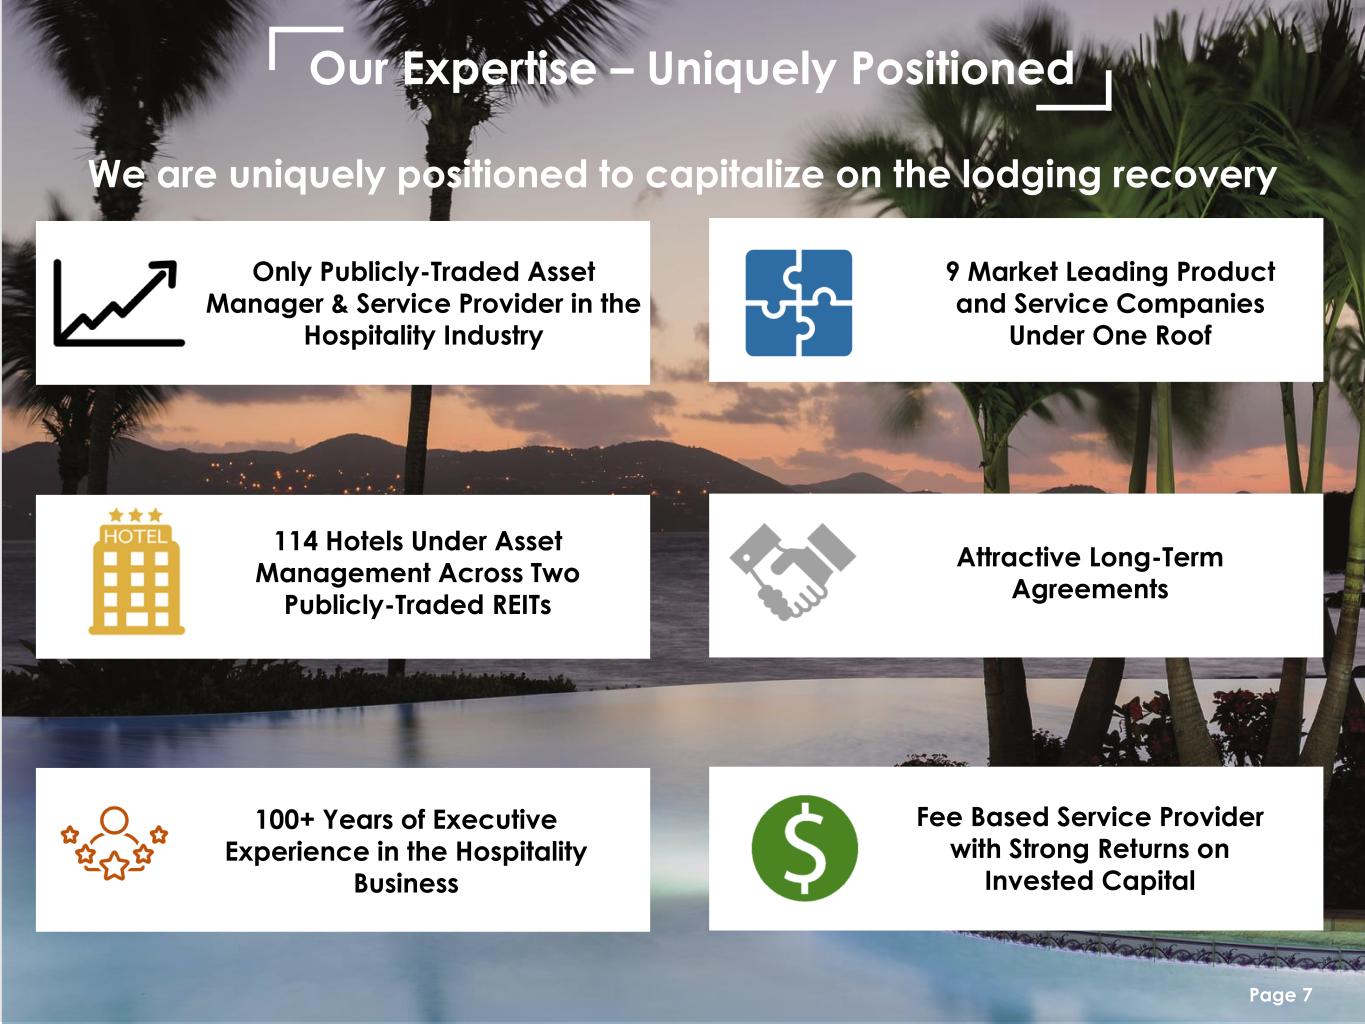
Our Expertise – Uniquely Positioned Only Publicly-Traded Asset Manager & Service Provider in the Hospitality Industry 100+ Years of Executive Experience in the Hospitality Business 9 Market Leading Product and Service Companies Under One Roof 114 Hotels Under Asset Management Across Two Publicly-Traded REITs Fee Based Service Provider with Strong Returns on Invested Capital Attractive Long-Term Agreements We are uniquely positioned to capitalize on the lodging recovery Page 7

Our Strategy- Multiple Paths to Growth Grow Assets Under Management Grow Third-Party Business Expand Service Offerings Best-in-Class Asset Management and Operations with Deep Industry Relationships Page 8
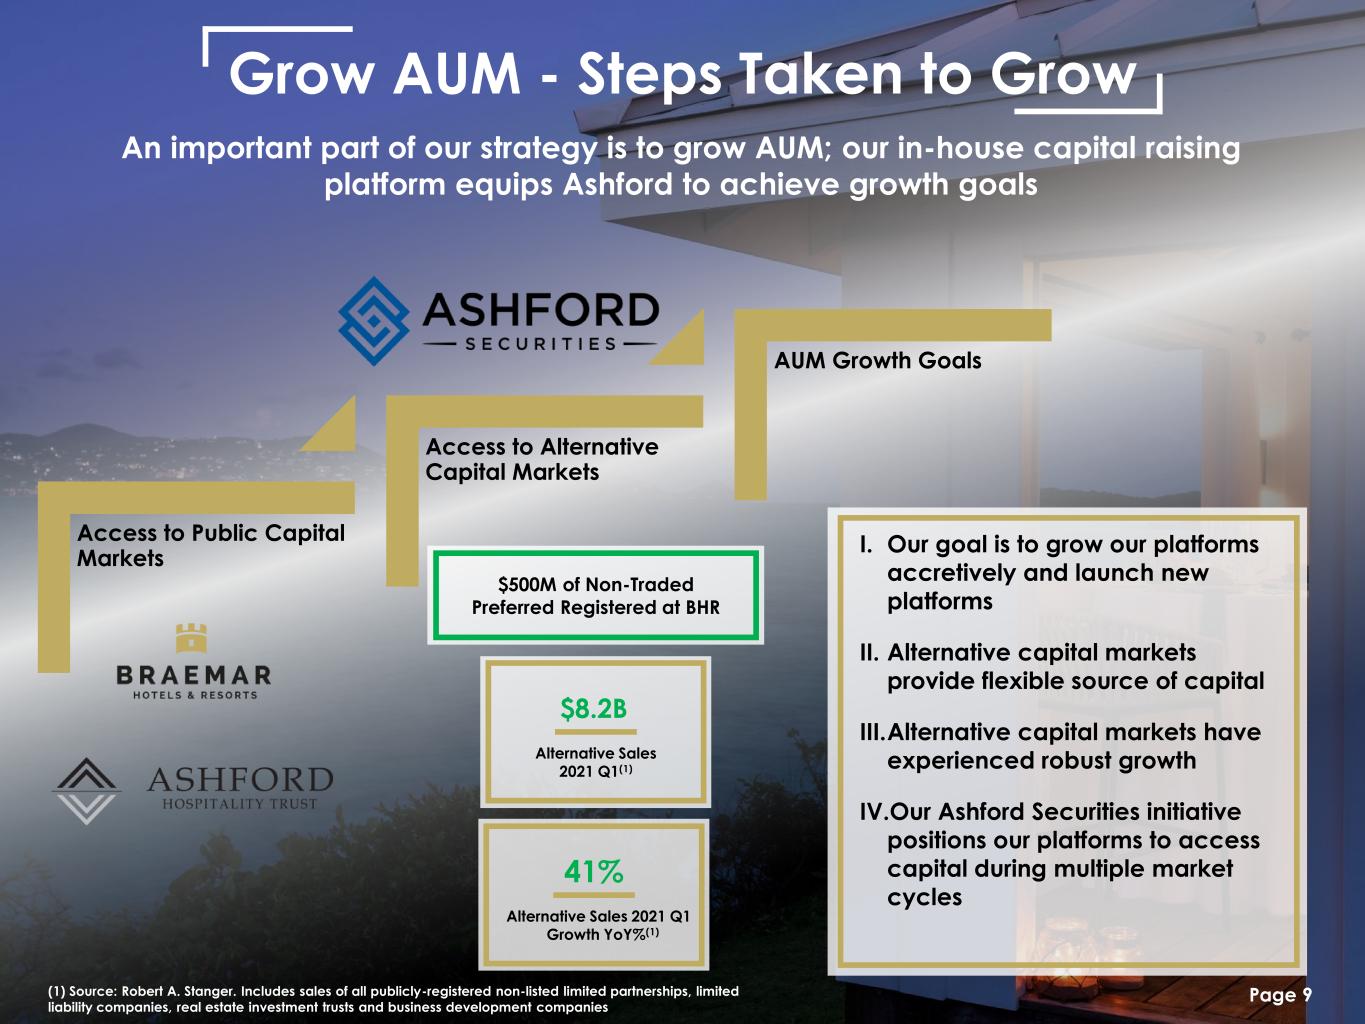
Page 9 Grow AUM - Steps Taken to Grow An important part of our strategy is to grow AUM; our in-house capital raising platform equips Ashford to achieve growth goals (1) Source: Robert A. Stanger. Includes sales of all publicly-registered non-listed limited partnerships, limited liability companies, real estate investment trusts and business development companies Access to Public Capital Markets Access to Alternative Capital Markets AUM Growth Goals $500M of Non-Traded Preferred Registered at BHR 41% Alternative Sales 2021 Q1 Growth YoY%(1) $8.2B Alternative Sales 2021 Q1(1) I. Our goal is to grow our platforms accretively and launch new platforms II. Alternative capital markets provide flexible source of capital III.Alternative capital markets have experienced robust growth IV.Our Ashford Securities initiative positions our platforms to access capital during multiple market cycles
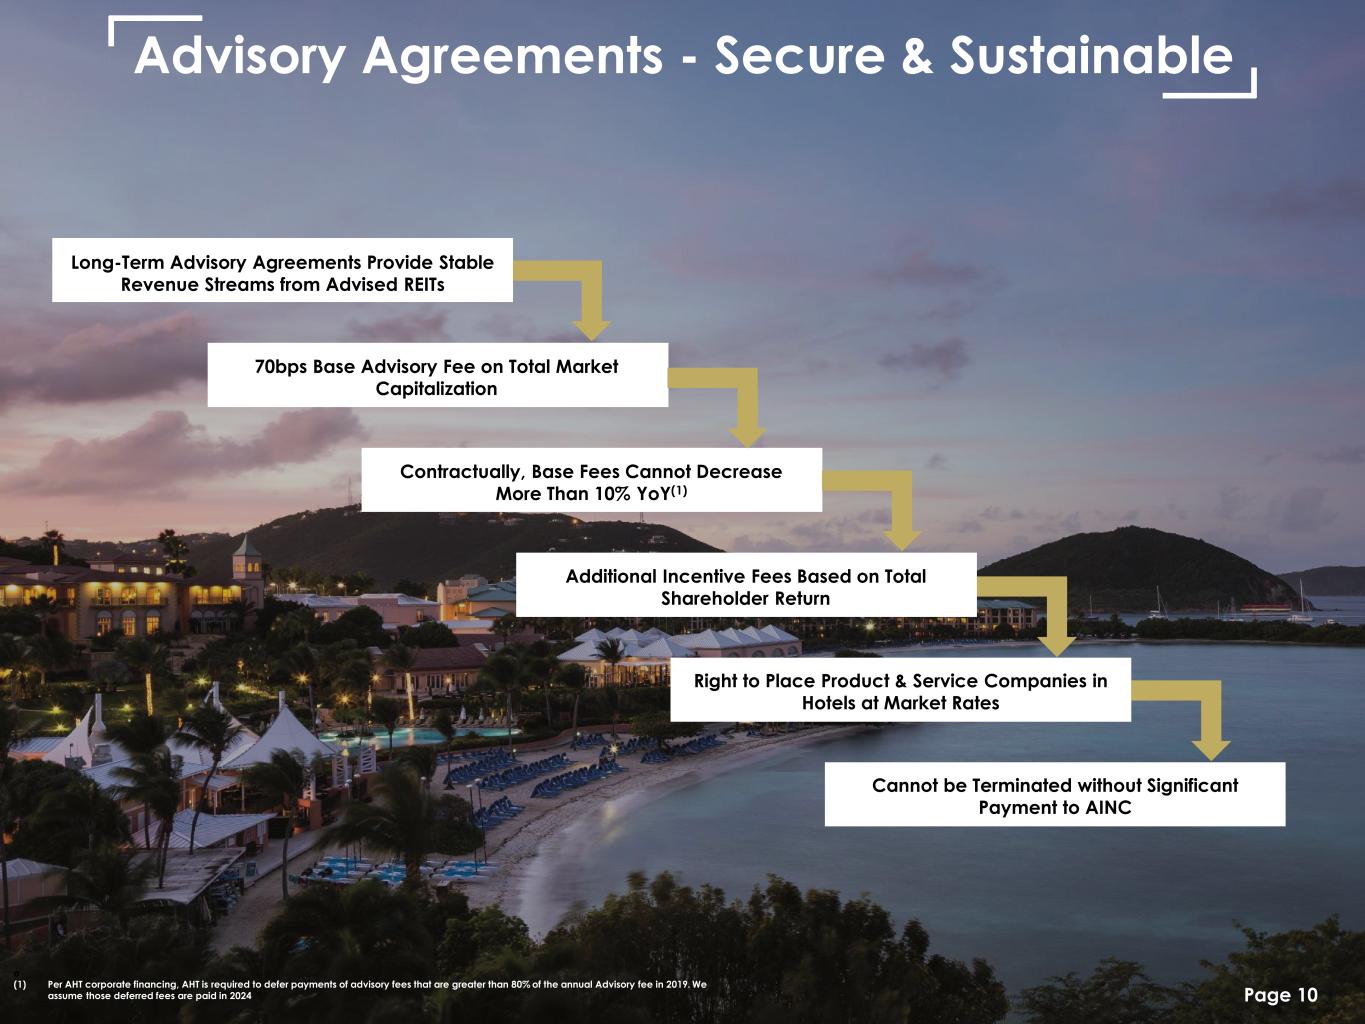
Advisory Agreements - Secure & Sustainable Long-Term Advisory Agreements Provide Stable Revenue Streams from Advised REITs 70bps Base Advisory Fee on Total Market Capitalization Contractually, Base Fees Cannot Decrease More Than 10% YoY(1) Additional Incentive Fees Based on Total Shareholder Return Cannot be Terminated without Significant Payment to AINC Right to Place Product & Service Companies in Hotels at Market Rates Page 10 e (1) Per AHT corporate financing, AHT is required to defer payments of advisory fees that are greater than 80% of the annual Advisory fee in 2019. We assume those deferred fees are paid in 2024
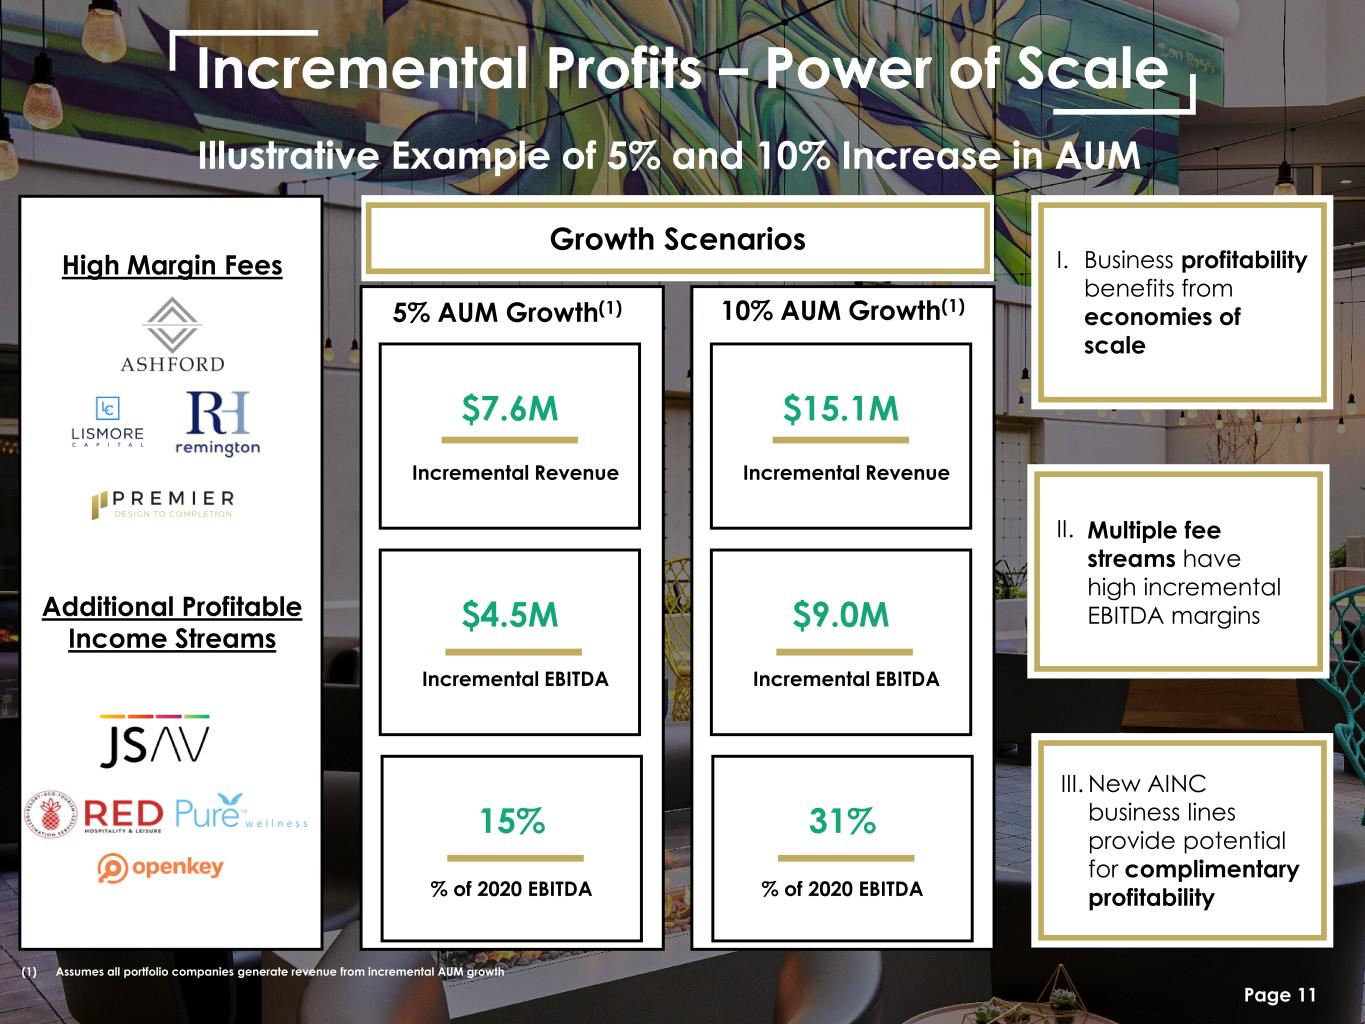
11 Incremental Profits – Power of Scale Illustrative Example of 5% and 10% Increase in AUM High Margin Fees Additional Profitable Income Streams Page 11 Incremental Revenue $7.6M Incremental EBITDA $4.5M % of 2020 EBITDA 15% Incremental Revenue $15.1M Incremental EBITDA $9.0M % of 2020 EBITDA 31% 5% AUM Growth(1) 10% AUM Growth(1) Growth Scenarios II. Multiple fee streams have high incremental EBITDA margins III. New AINC business lines provide potential for complimentary profitability I. Business profitability benefits from economies of scale lti l f str v high incremental IT r i s (1) Assumes all portfolio companies generate revenue from incremental AUM growth

Grow Third-Party – Seeing Strong Momentum 11 New Third-Party Contracts 27 New Third-Party Contracts Third-party contracts reflect 13% of Remington's hotels under management Premier has contracted $5.3M of revenue from its third-party initiative since March 2020 Page 12 Another important part of our strategy is to grow third-party business: both Remington and Premier are seeing strong momentum + + = Experienced Management Team Third-Party Growth Sales & Marketing Strong Track Record$ (1) As of June 30th, 2021 (1)

Portfolio Companies – Sustained Growth Strategy Acquire/Incubate Great Companies Target Company Invest • Identify great businesses with exceptional future potential • Focus on products, services, and technology that cater to the lodging industry • Best-in-class companies led by best-in-class management teams Accelerate Growth Target Company Accelerate • Integrate into the existing Ashford portfolios • Deliver material increases to top & bottom lines • Improve operational efficiency • Provide institutional infrastructure Generate Returns Scale Target Company • Leverage Ashford resources to significantly scale business • Utilize management’s deep industry and capital markets knowledge and relationships • Achieve further economies of scale and market penetration Page 13

Page 14 Illustrative Example of Recovery in 2024 + Ashford Strategic Initiatives 2019 Pro Forma 2020 Actual Status Quo Adj. EBITDA $62M(1) $29M(1) $54M $3MThird-party EBITDA from Remington & Premier + $12M(2) 5% AUM growth per year + $6MRED acquisitions + Total Adj. EBITDA $85M $10MJSAV Third-party growth + Adj. EBITDA of ~$54M in 2025 would be in line with the recovery of the overall hotel industry and does not consider other potential growth prospects Industry recovery in 2024 with minor growth in 2025 Potential incremental EBITDA due to strategic initiatives 2025 Estimate Reasonable and achievable growth targets 2020 pre-COVID YoY EBITDA growth was 81%(3) (1) See Appendix B for GAAP Reconciliation (2) Assumes not all portfolio companies generate revenue from incremental AUM growth (3) JSAV consolidated EBITDA grew 81% during January and February 2020 over prior year comparable periods
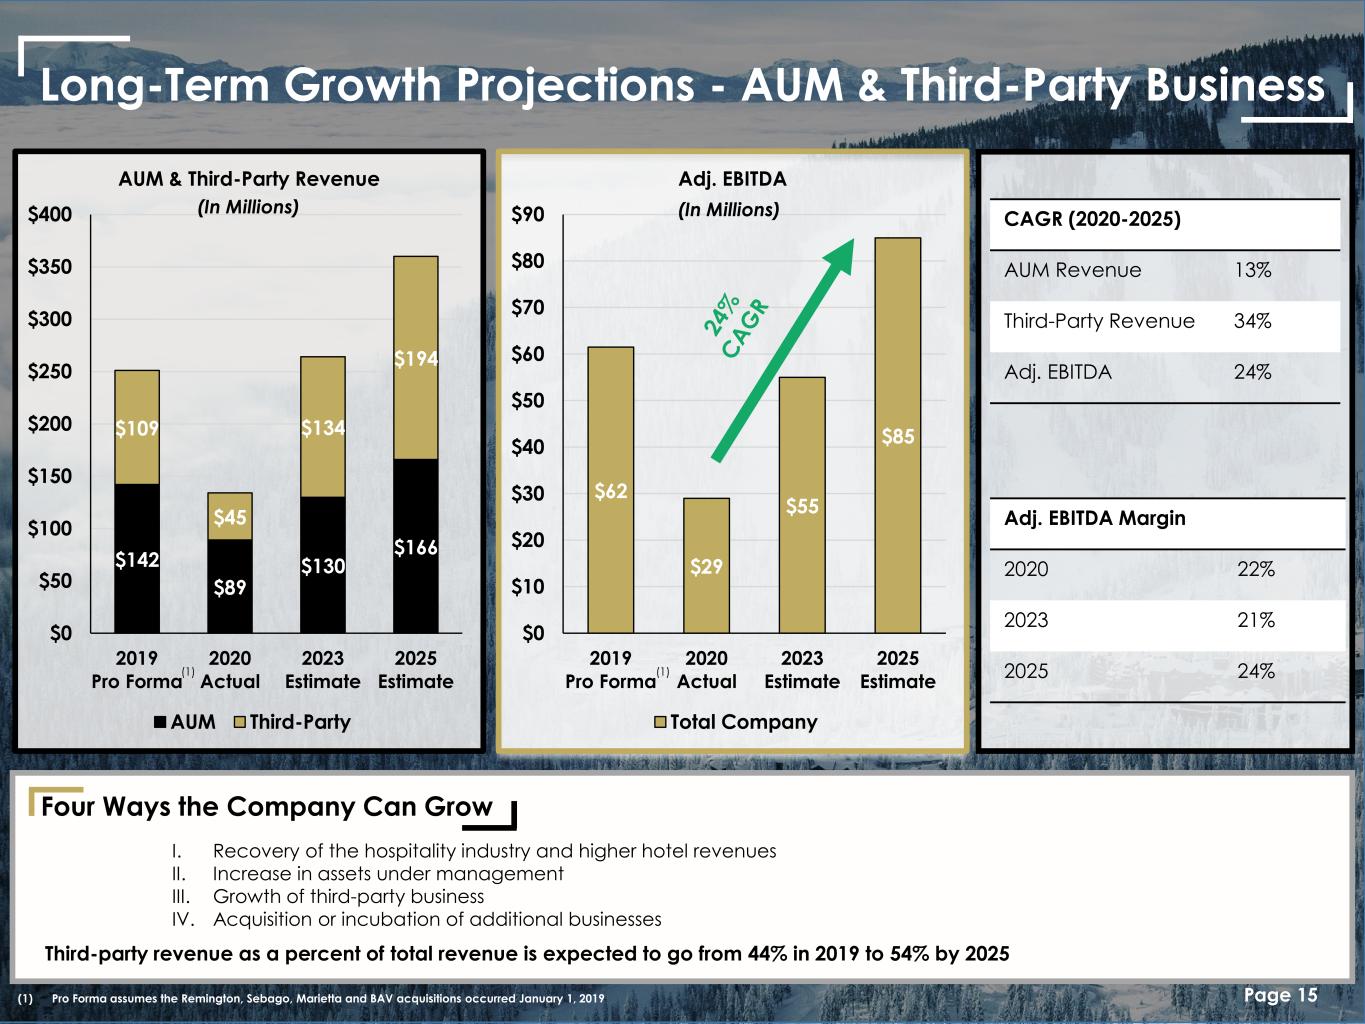
CAGR (2020-2025) AUM Revenue 13% Third-Party Revenue 34% Adj. EBITDA 24% Four Ways the Company Can Grow Adj. EBITDA Margin 2020 22% 2023 21% 2025 24% $142 $89 $130 $166 $109 $45 $134 $194 $0 $50 $100 $150 $200 $250 $300 $350 $400 2019 Pro Forma 2020 Actual 2023 Estimate 2025 Estimate AUM & Third-Party Revenue AUM Third-Party $62 $29 $55 $85 $0 $10 $20 $30 $40 $50 $60 $70 $80 $90 2019 Pro Forma 2020 Actual 2023 Estimate 2025 Estimate Adj. EBITDA Total Company Long-Term Growth Projections - AUM & Third-Party Business I. Recovery of the hospitality industry and higher hotel revenues II. Increase in assets under management III. Growth of third-party business IV. Acquisition or incubation of additional businesses (In Millions) (In Millions) Third-party revenue as a percent of total revenue is expected to go from 44% in 2019 to 54% by 2025 Page 15 (1) (1) Pro Forma assumes the Remington, Sebago, Marietta and BAV acquisitions occurred January 1, 2019 (1)
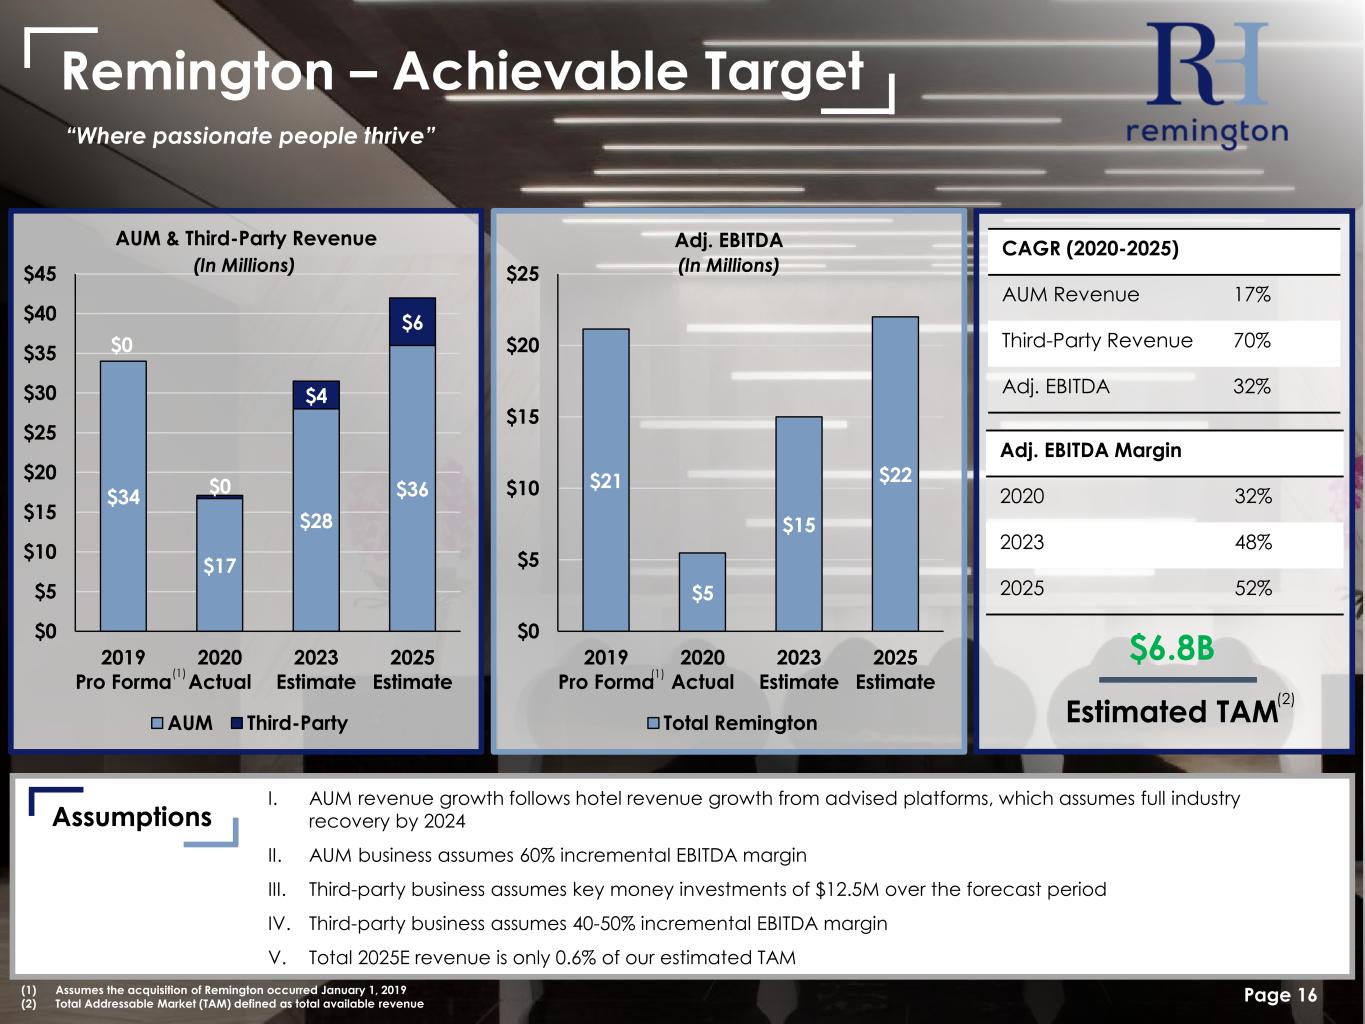
$34 $17 $28 $36 $0 $0 $4 $6 $0 $5 $10 $15 $20 $25 $30 $35 $40 $45 2019 Pro Forma 2020 Actual 2023 Estimate 2025 Estimate AUM & Third-Party Revenue AUM Third-Party $21 $5 $15 $22 $0 $5 $10 $15 $20 $25 2019 Pro Forma 2020 Actual 2023 Estimate 2025 Estimate Adj. EBITDA Total Remington CAGR (2020-2025) AUM Revenue 17% Third-Party Revenue 70% Adj. EBITDA 32% Assumptions “Where passionate people thrive” Adj. EBITDA Margin 2020 32% 2023 48% 2025 52% Remington – Achievable Target I. AUM revenue growth follows hotel revenue growth from advised platforms, which assumes full industry recovery by 2024 II. AUM business assumes 60% incremental EBITDA margin III. Third-party business assumes key money investments of $12.5M over the forecast period IV. Third-party business assumes 40-50% incremental EBITDA margin V. Total 2025E revenue is only 0.6% of our estimated TAM Estimated TAM (In Millions) (In Millions) (2) (1) Assumes the acquisition of Remington occurred January 1, 2019 (2) Total Addressable Market (TAM) defined as total available revenue $6.8B Page 16 (1) (1)
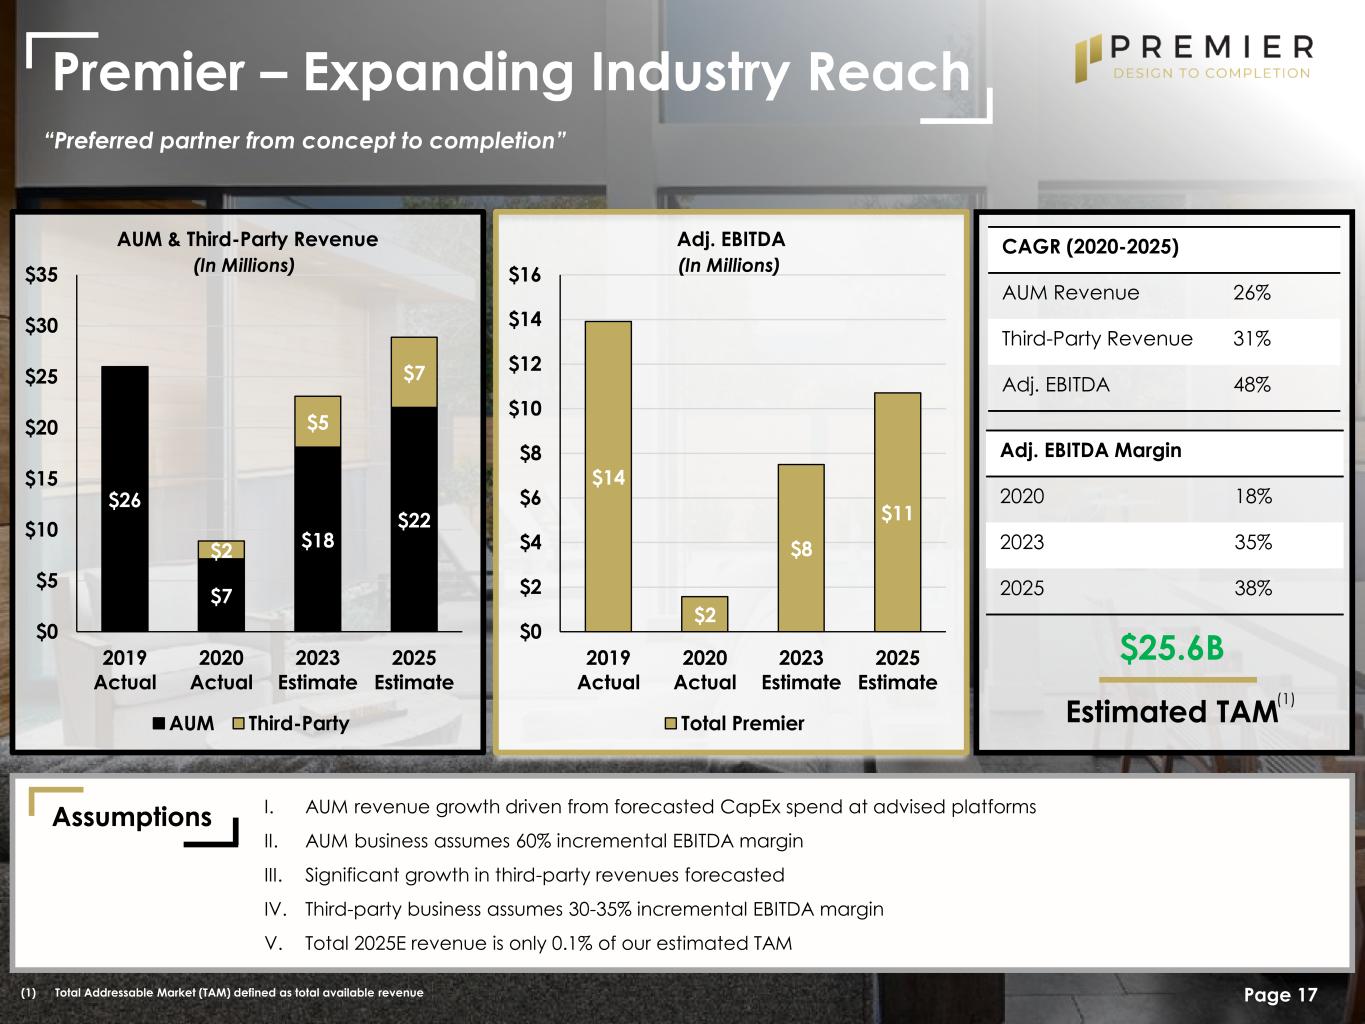
CAGR (2020-2025) AUM Revenue 26% Third-Party Revenue 31% Adj. EBITDA 48% Assumptions Adj. EBITDA Margin 2020 18% 2023 35% 2025 38% $26 $7 $18 $22 $2 $5 $7 $0 $5 $10 $15 $20 $25 $30 $35 2019 Actual 2020 Actual 2023 Estimate 2025 Estimate AUM & Third-Party Revenue AUM Third-Party $14 $2 $8 $11 $0 $2 $4 $6 $8 $10 $12 $14 $16 2019 Actual 2020 Actual 2023 Estimate 2025 Estimate Adj. EBITDA Total Premier “Preferred partner from concept to completion” I. AUM revenue growth driven from forecasted CapEx spend at advised platforms II. AUM business assumes 60% incremental EBITDA margin III. Significant growth in third-party revenues forecasted IV. Third-party business assumes 30-35% incremental EBITDA margin V. Total 2025E revenue is only 0.1% of our estimated TAM (In Millions) (In Millions) (1) Total Addressable Market (TAM) defined as total available revenue Premier – Expanding Industry Reach Estimated TAM (1) $25.6B Page 17
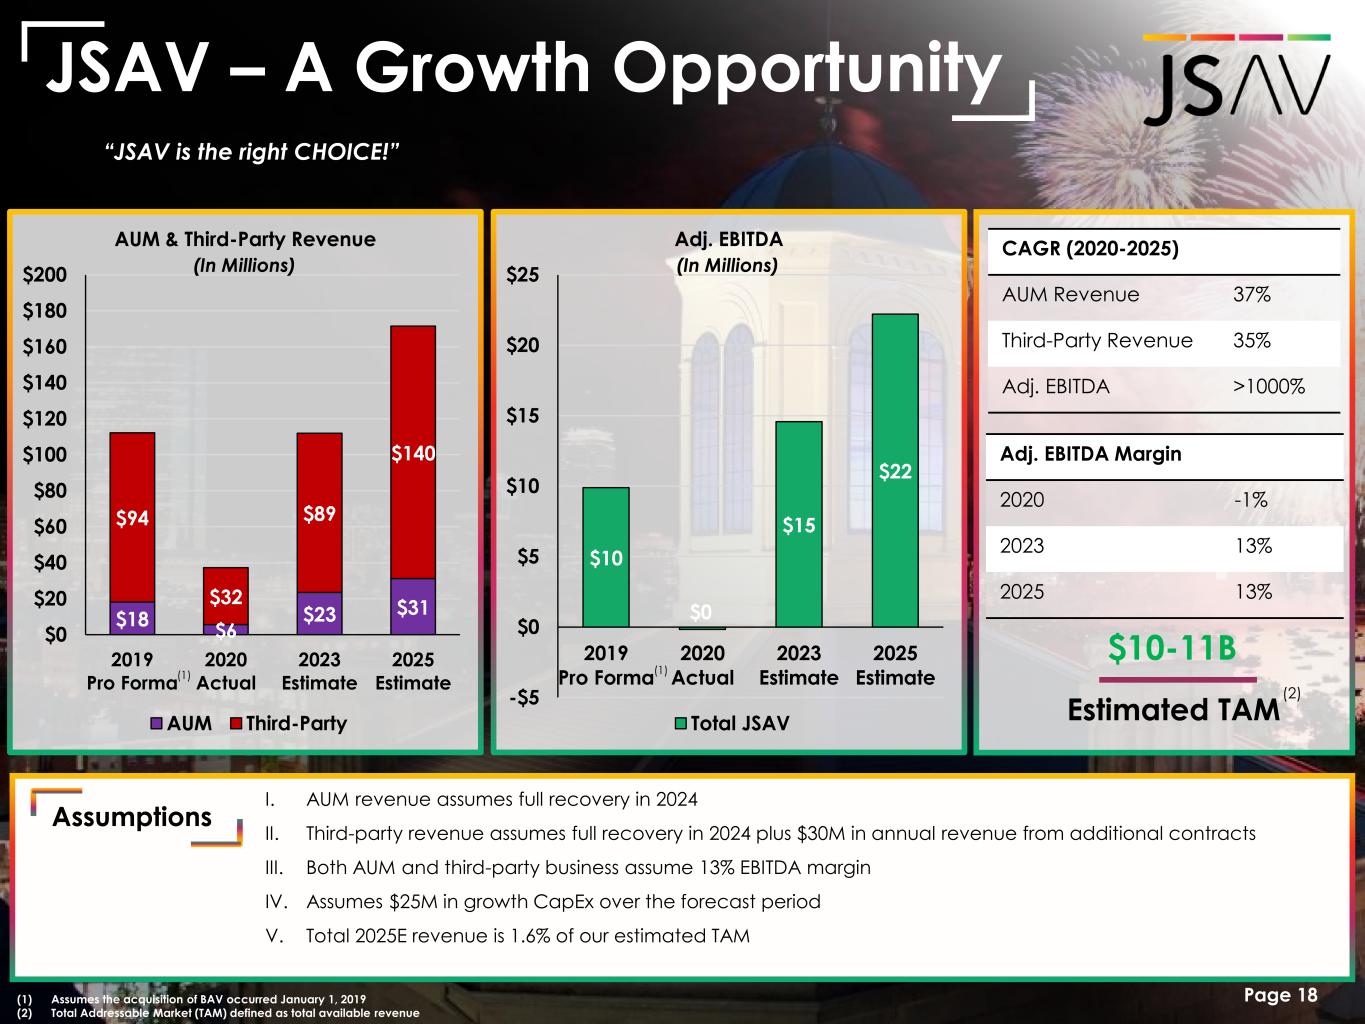
CAGR (2020-2025) AUM Revenue 37% Third-Party Revenue 35% Adj. EBITDA >1000% Assumptions Adj. EBITDA Margin 2020 -1% 2023 13% 2025 13% $18 $6 $23 $31 $94 $32 $89 $140 $0 $20 $40 $60 $80 $100 $120 $140 $160 $180 $200 2019 Pro Forma 2020 Actual 2023 Estimate 2025 Estimate AUM & Third-Party Revenue AUM Third-Party $10 $0 $15 $22 -$5 $0 $5 $10 $15 $20 $25 2019 Pro Forma 2020 Actual 2023 Estimate 2025 Estimate Adj. EBITDA Total JSAV JSAV – A Growth Opportunity “JSAV is the right CHOICE!” I. AUM revenue assumes full recovery in 2024 II. Third-party revenue assumes full recovery in 2024 plus $30M in annual revenue from additional contracts III. Both AUM and third-party business assume 13% EBITDA margin IV. Assumes $25M in growth CapEx over the forecast period V. Total 2025E revenue is 1.6% of our estimated TAM (In Millions) (In Millions) (1) Assumes the acquisition of BAV occurred January 1, 2019 (2) Total Addressable Market (TAM) defined as total available revenue Estimated TAM $10-11B Page 18 (1) (2) (1)
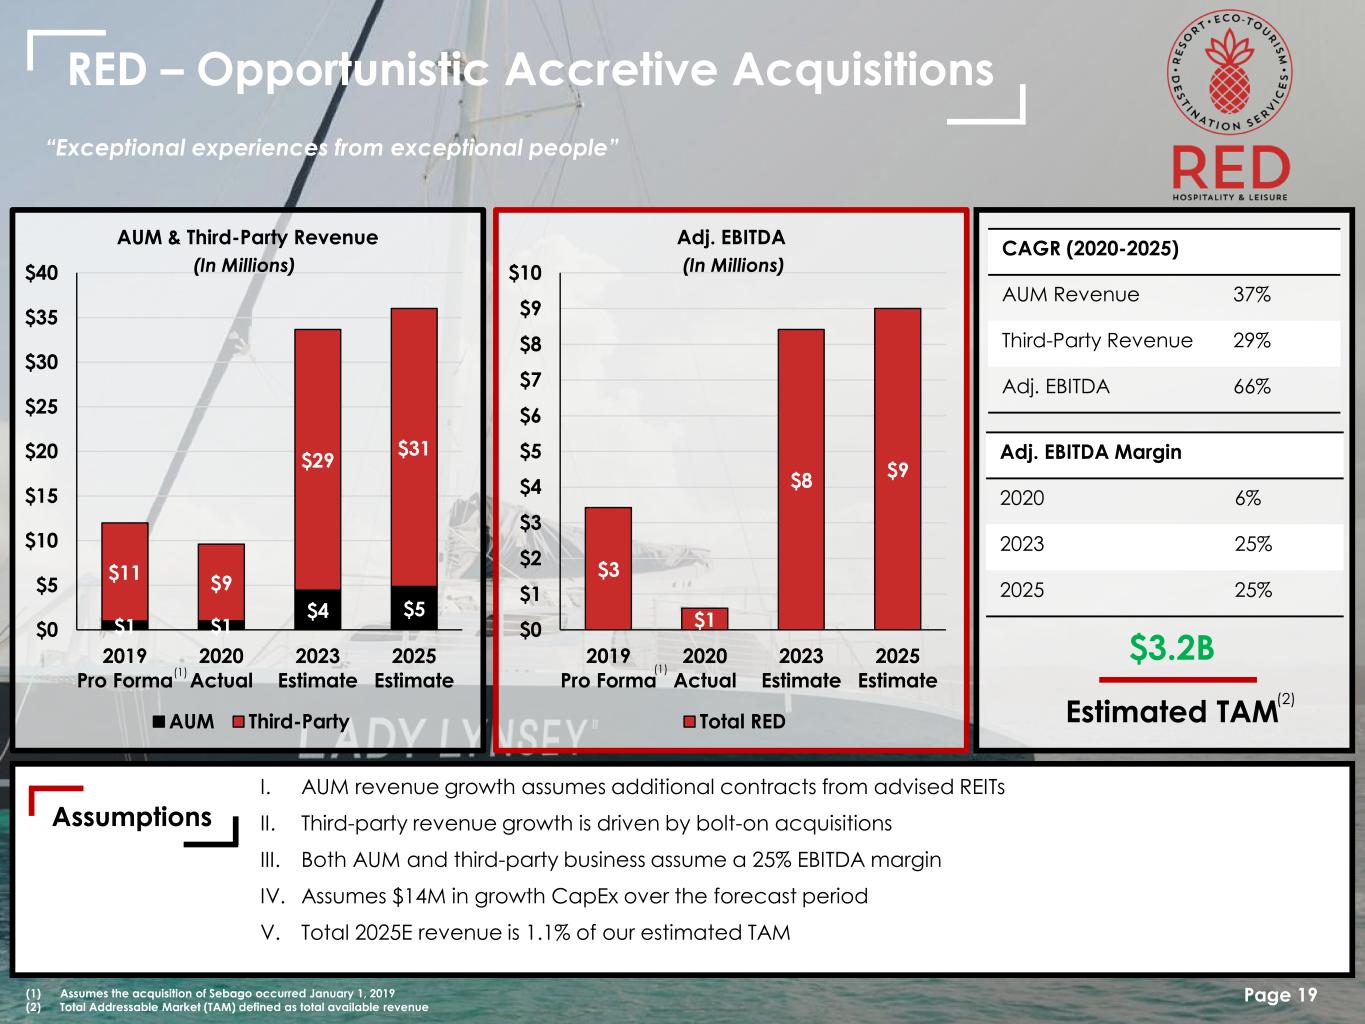
CAGR (2020-2025) AUM Revenue 37% Third-Party Revenue 29% Adj. EBITDA 66% Assumptions Adj. EBITDA Margin 2020 6% 2023 25% 2025 25% $1 $1 $4 $5 $11 $9 $29 $31 $0 $5 $10 $15 $20 $25 $30 $35 $40 2019 Pro Forma 2020 Actual 2023 Estimate 2025 Estimate AUM & Third-Party Revenue AUM Third-Party $3 $1 $8 $9 $0 $1 $2 $3 $4 $5 $6 $7 $8 $9 $10 2019 Pro Forma 2020 Actual 2023 Estimate 2025 Estimate Adj. EBITDA Total RED “Exceptional experiences from exceptional people” I. AUM revenue growth assumes additional contracts from advised REITs II. Third-party revenue growth is driven by bolt-on acquisitions III. Both AUM and third-party business assume a 25% EBITDA margin IV. Assumes $14M in growth CapEx over the forecast period V. Total 2025E revenue is 1.1% of our estimated TAM (In Millions) (In Millions) (1) Assumes the acquisition of Sebago occurred January 1, 2019 (2) Total Addressable Market (TAM) defined as total available revenue RED – Opportunistic Accretive Acquisitions Estimated TAM $3.2B Page 19 (1) (2) (1)
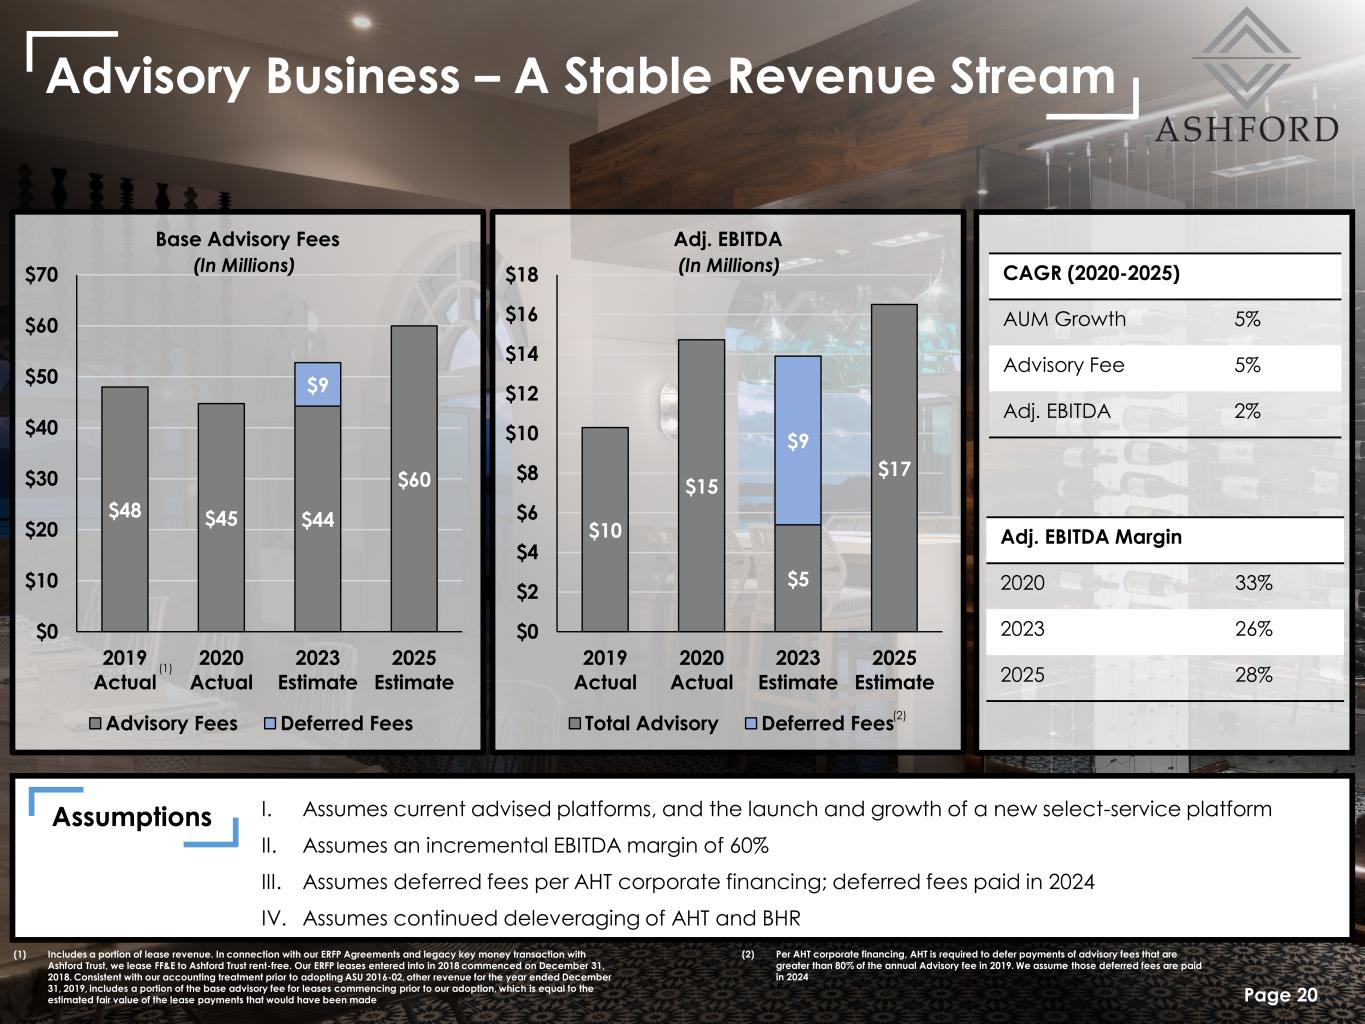
CAGR (2020-2025) AUM Growth 5% Advisory Fee 5% Adj. EBITDA 2% Assumptions Adj. EBITDA Margin 2020 33% 2023 26% 2025 28% Advisory Business – A Stable Revenue Stream $48 $45 $44 $60 $9 $0 $10 $20 $30 $40 $50 $60 $70 2019 Actual 2020 Actual 2023 Estimate 2025 Estimate Base Advisory Fees Advisory Fees Deferred Fees $10 $15 $5 $17 $9 $0 $2 $4 $6 $8 $10 $12 $14 $16 $18 2019 Actual 2020 Actual 2023 Estimate 2025 Estimate Adj. EBITDA Total Advisory Deferred Fees I. Assumes current advised platforms, and the launch and growth of a new select-service platform II. Assumes an incremental EBITDA margin of 60% III. Assumes deferred fees per AHT corporate financing; deferred fees paid in 2024 IV. Assumes continued deleveraging of AHT and BHR (In Millions) (In Millions) Page 20 (1) Includes a portion of lease revenue. In connection with our ERFP Agreements and legacy key money transaction with Ashford Trust, we lease FF&E to Ashford Trust rent-free. Our ERFP leases entered into in 2018 commenced on December 31, 2018. Consistent with our accounting treatment prior to adopting ASU 2016-02, other revenue for the year ended December 31, 2019, includes a portion of the base advisory fee for leases commencing prior to our adoption, which is equal to the estimated fair value of the lease payments that would have been made (2) (1) (1) e (2) Per AHT corporate financing, AHT is required to defer payments of advisory fees that are greater than 80% of the annual Advisory fee in 2019. We assume those deferred fees are paid in 2024
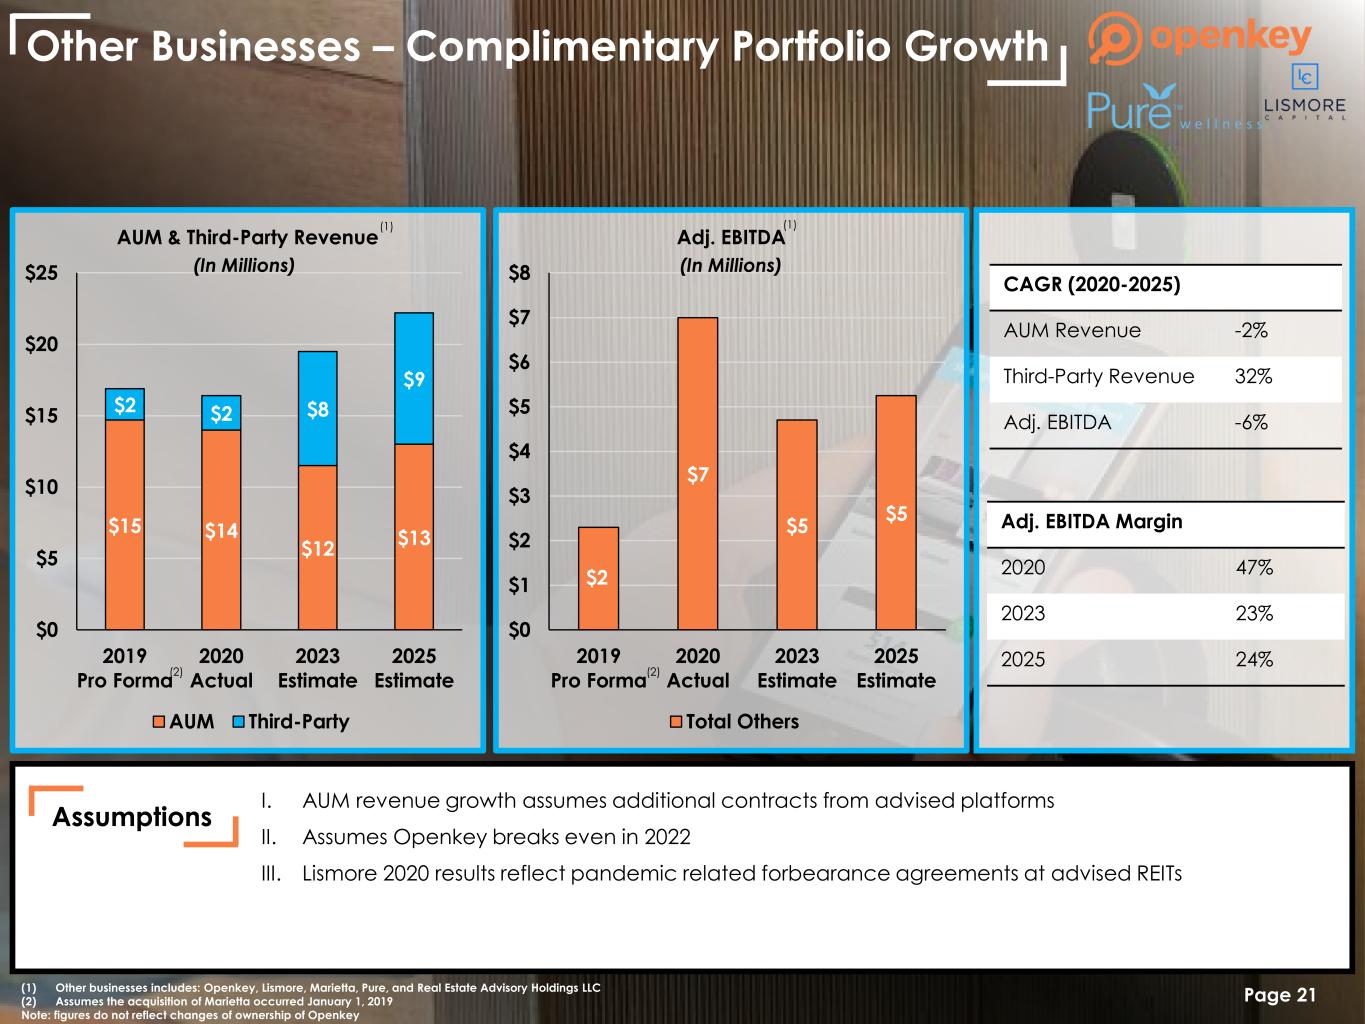
CAGR (2020-2025) AUM Revenue -2% Third-Party Revenue 32% Adj. EBITDA -6% Assumptions Adj. EBITDA Margin 2020 47% 2023 23% 2025 24% $15 $14 $12 $13 $2 $2 $8 $9 $0 $5 $10 $15 $20 $25 2019 Pro Forma 2020 Actual 2023 Estimate 2025 Estimate AUM & Third-Party Revenue AUM Third-Party $2 $7 $5 $5 $0 $1 $2 $3 $4 $5 $6 $7 $8 2019 Pro Forma 2020 Actual 2023 Estimate 2025 Estimate Adj. EBITDA Total Others I. AUM revenue growth assumes additional contracts from advised platforms II. Assumes Openkey breaks even in 2022 III. Lismore 2020 results reflect pandemic related forbearance agreements at advised REITs (In Millions) (In Millions) Other Businesses – Complimentary Portfolio Growth Page 21 (1) (1) (1) Other businesses includes: Openkey, Lismore, Marietta, Pure, and Real Estate Advisory Holdings LLC (2) Assumes the acquisition of Marietta occurred January 1, 2019 Note: figures do not reflect changes of ownership of Openkey (2)(2)
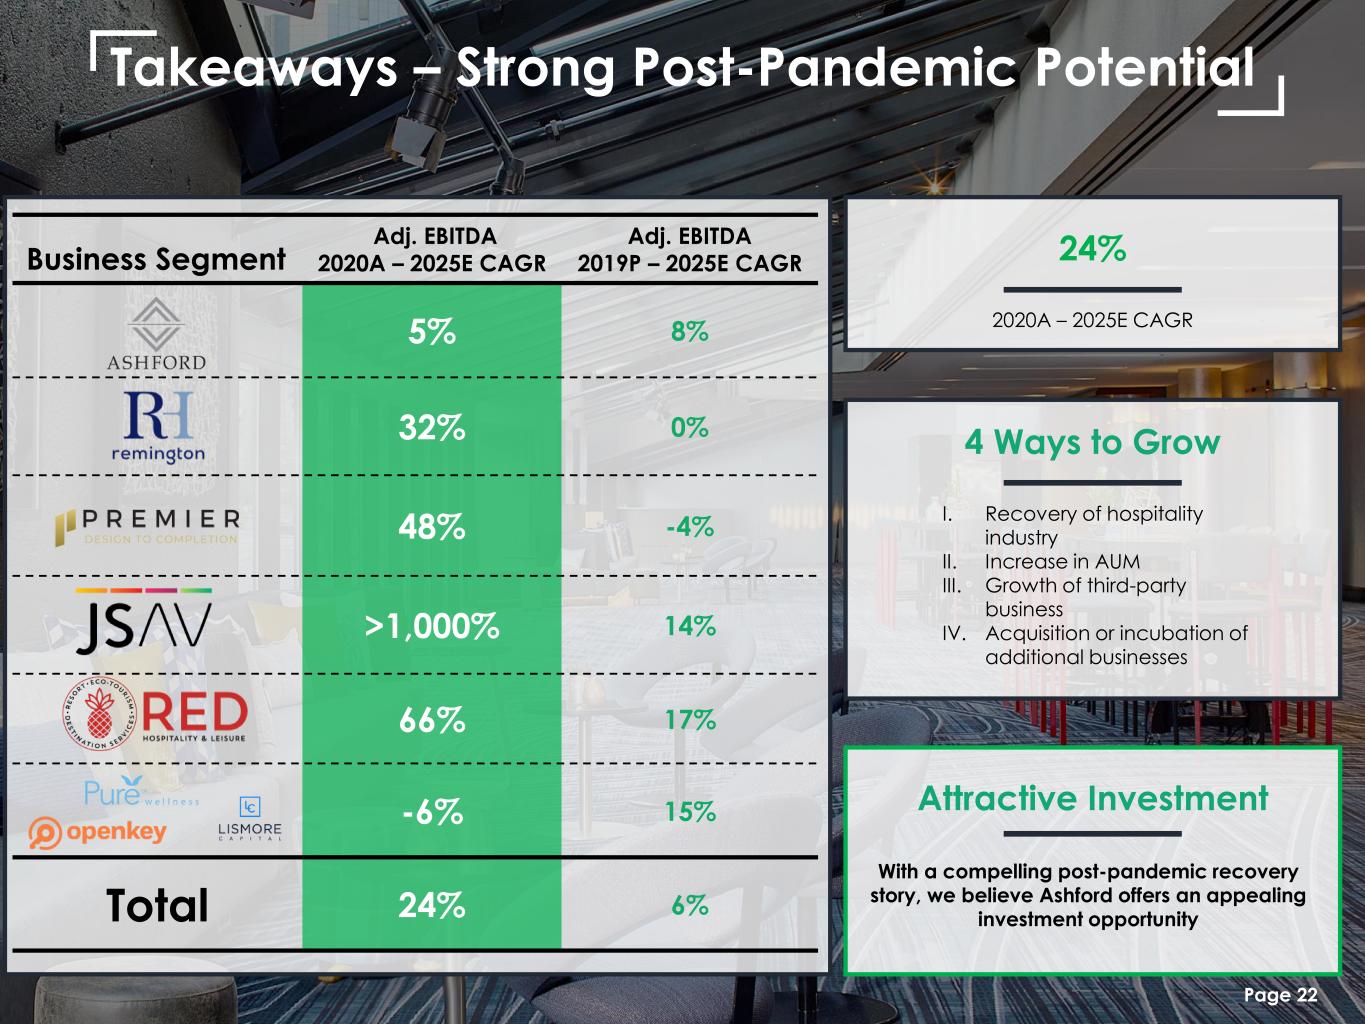
Takeaways – Strong Post-Pandemic Potential Business Segment Adj. EBITDA 2020A – 2025E CAGR Adj. EBITDA 2019P – 2025E CAGR 5% 8% 32% 0% 48% -4% >1,000% 14% 66% 17% -6% 15% Total 24% 6% 2020A – 2025E CAGR 24% I. Recovery of hospitality industry II. Increase in AUM III. Growth of third-party business IV. Acquisition or incubation of additional businesses 4 Ways to Grow Attractive Investment Page 22 With a compelling post-pandemic recovery story, we believe Ashford offers an appealing investment opportunity

Appendix A Page 23

Ashford – Executive Leadership • 24 years of hospitality experience • 5 years with the company • 15 years with Morgan Stanley • University of Pennsylvania, MBA • 16 years of hospitality experience • 16 years with the company & affiliate • 5 years with Stephens Investment Bank • Oklahoma State University, BS President & COO of AINC COO of BHR & AHT President & CEO of BHRPresident & CEO of AHT Sr. Managing Dir. of AINC Jeremy Welter Monty BennettRob Hays Richard Stockton Deric Eubanks CFO of AINC, BHR, & AHTCEO of AINC Chairman of AINC, BHR, & AHT • 21 years of hospitality experience • 18 years with the company • CFA Charter- holder • Southern Methodist University, BBA • 16 years of hospitality experience • 16 years with the company • 3 years of M&A at Dresser Inc. & Merrill Lynch • Princeton University, AB • 31 years of hospitality experience • 31 years with the company & affiliate • Cornell University, BS • Cornell University, MBA Page 24 General Counsel of AINC, BHR, & AHT Alex Rose • Joined the company in 2021 • 10 years of corporate law experience at major law firms • Columbia University School of Law • University of Kansas, BS

Portfolio Companies – Overview Page 25
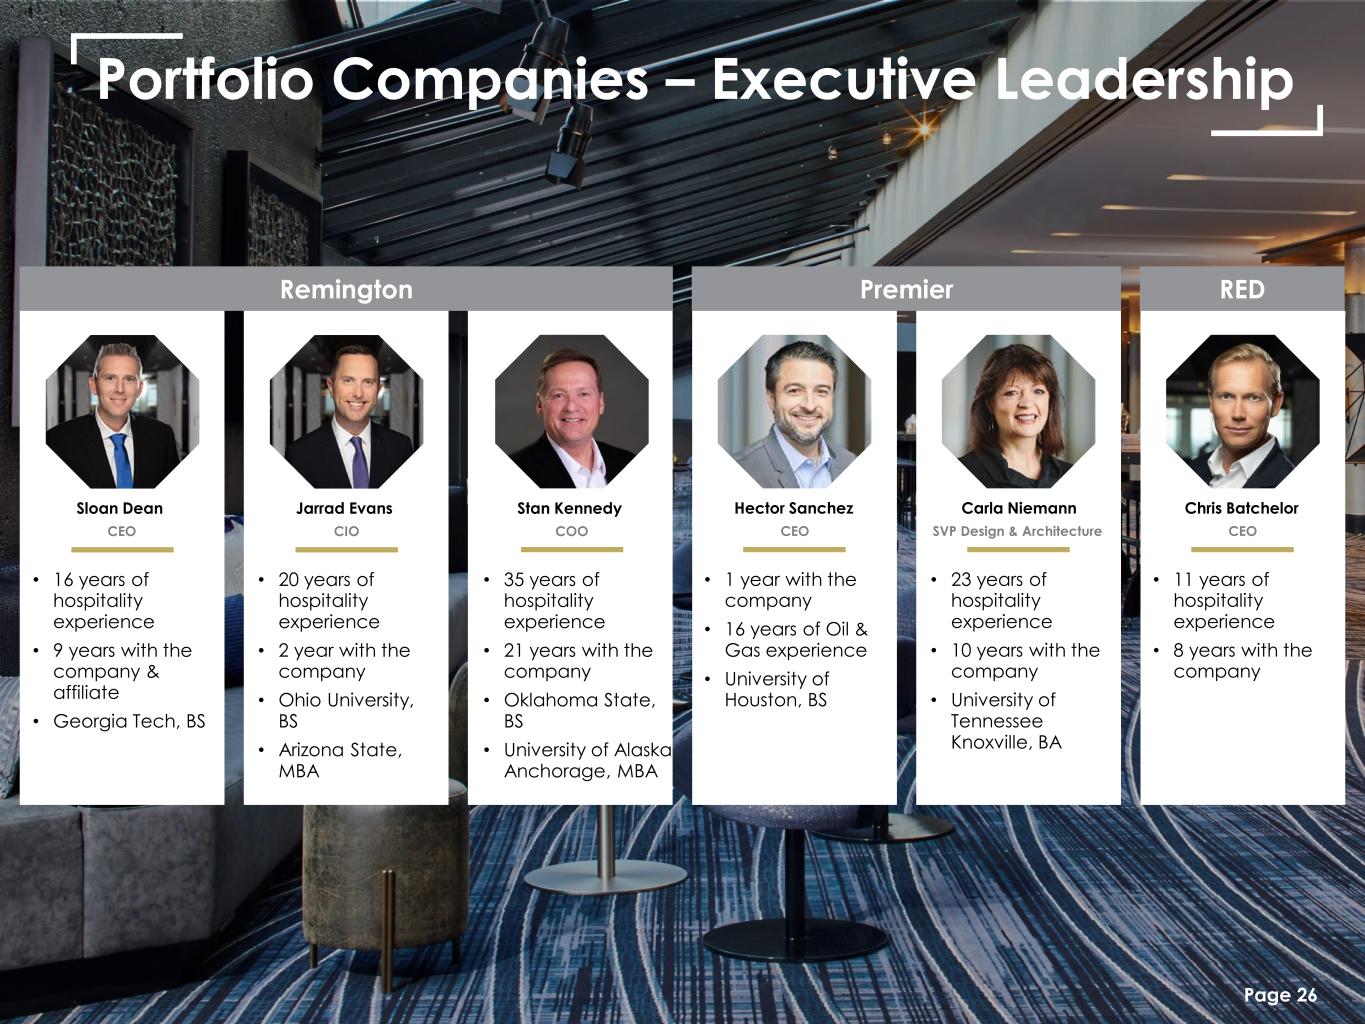
Portfolio Companies – Executive Leadership • 1 year with the company • 16 years of Oil & Gas experience • University of Houston, BS CEO Hector Sanchez Carla Niemann Chris Batchelor SVP Design & Architecture CEO • 23 years of hospitality experience • 10 years with the company • University of Tennessee Knoxville, BA • 11 years of hospitality experience • 8 years with the company Remington Premier RED • 20 years of hospitality experience • 2 year with the company • Ohio University, BS • Arizona State, MBA CIO Jarrad EvansSloan Dean CEO • 16 years of hospitality experience • 9 years with the company & affiliate • Georgia Tech, BS • 35 years of hospitality experience • 21 years with the company • Oklahoma State, BS • University of Alaska Anchorage, MBA COO Stan Kennedy Page 26

Portfolio Companies – Executive Leadership (Cont.) • Recently joined company • ~20 years of financial services experience • Hamilton College, BS Head of National Accounts Josh Rubinger Ron Owens Andrew Rehwinkel CEO Interim CEO • Recently joined company • 30+ years of experience in software and technology • Old Dominion University, MBA • 2 years with the company & affiliate • 3 years with FTI Consulting • Georgetown, BA • SMU, MBA JSAV Ashford Securities Pure • 2 years with the company • 30+ years in alternative investment products • $7B+ raised • Muhlenberg College, BS President Jay Steigerwald COO Conor DonahueChuck Bauman CEO • 17 years of audiovisual experience • 3 years with the company • Former Team USA Swimmer • SMU, BBA • 4 years with the company & affiliate • 2 years at McKinsey & Company • 9 years as U.S. Navy SEAL Officer • Stanford, MBA OpenKey Page 27
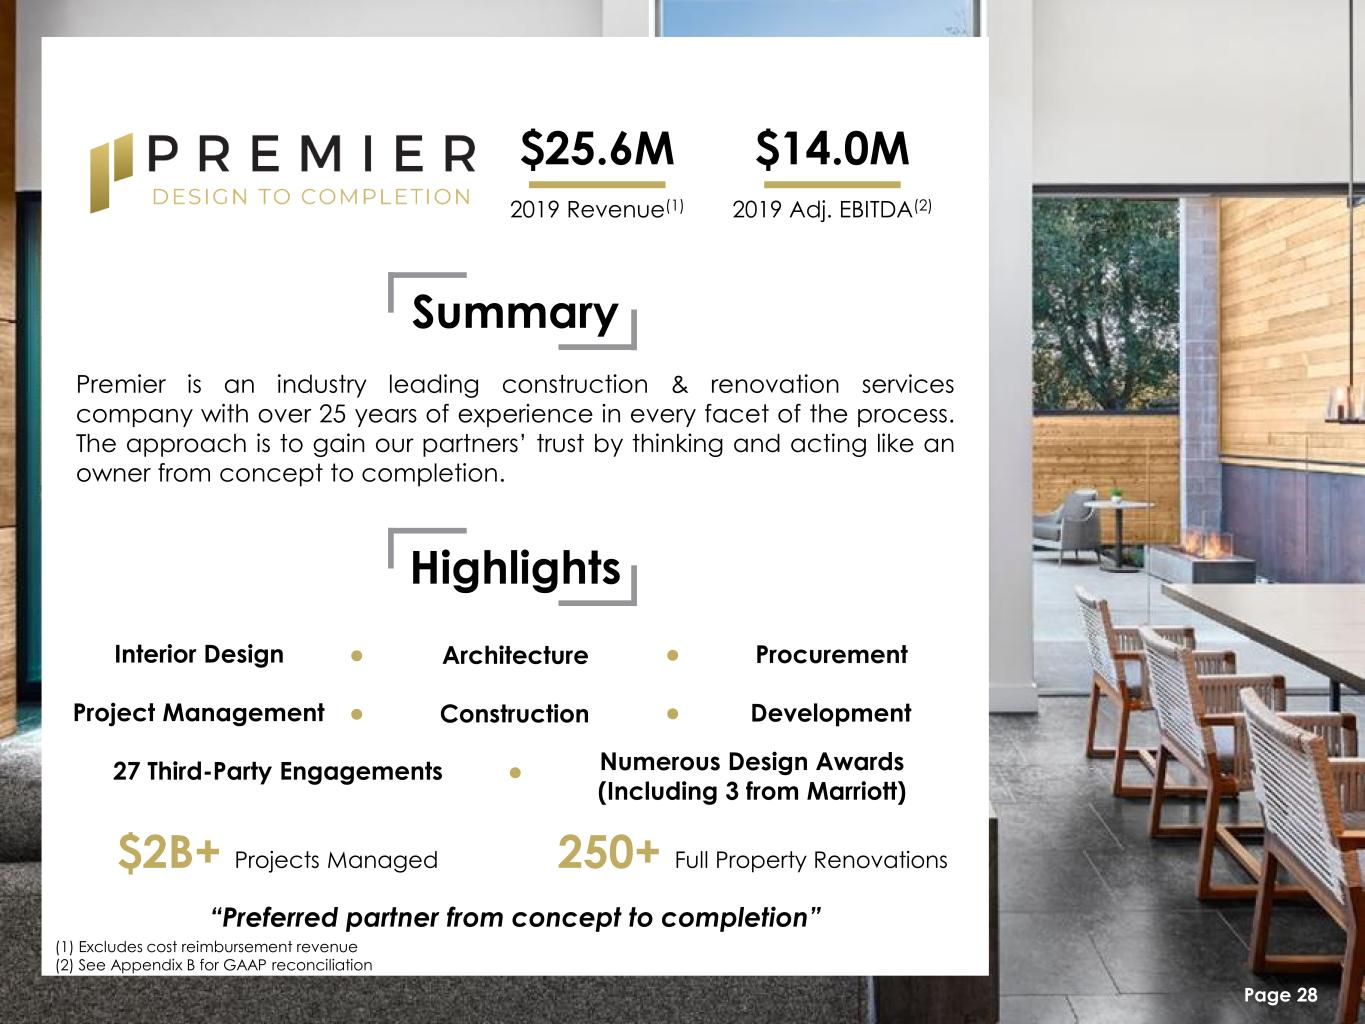
2019 Revenue(1) $25.6M 2019 Adj. EBITDA(2) $14.0M Summary “Preferred partner from concept to completion” Premier is an industry leading construction & renovation services company with over 25 years of experience in every facet of the process. The approach is to gain our partners’ trust by thinking and acting like an owner from concept to completion. Highlights Interior Design Architecture Procurement Project Management Construction Development $2B+ Projects Managed 250+ Full Property Renovations 27 Third-Party Engagements Numerous Design Awards (Including 3 from Marriott) (1) Excludes cost reimbursement revenue (2) See Appendix B for GAAP reconciliation Page 28
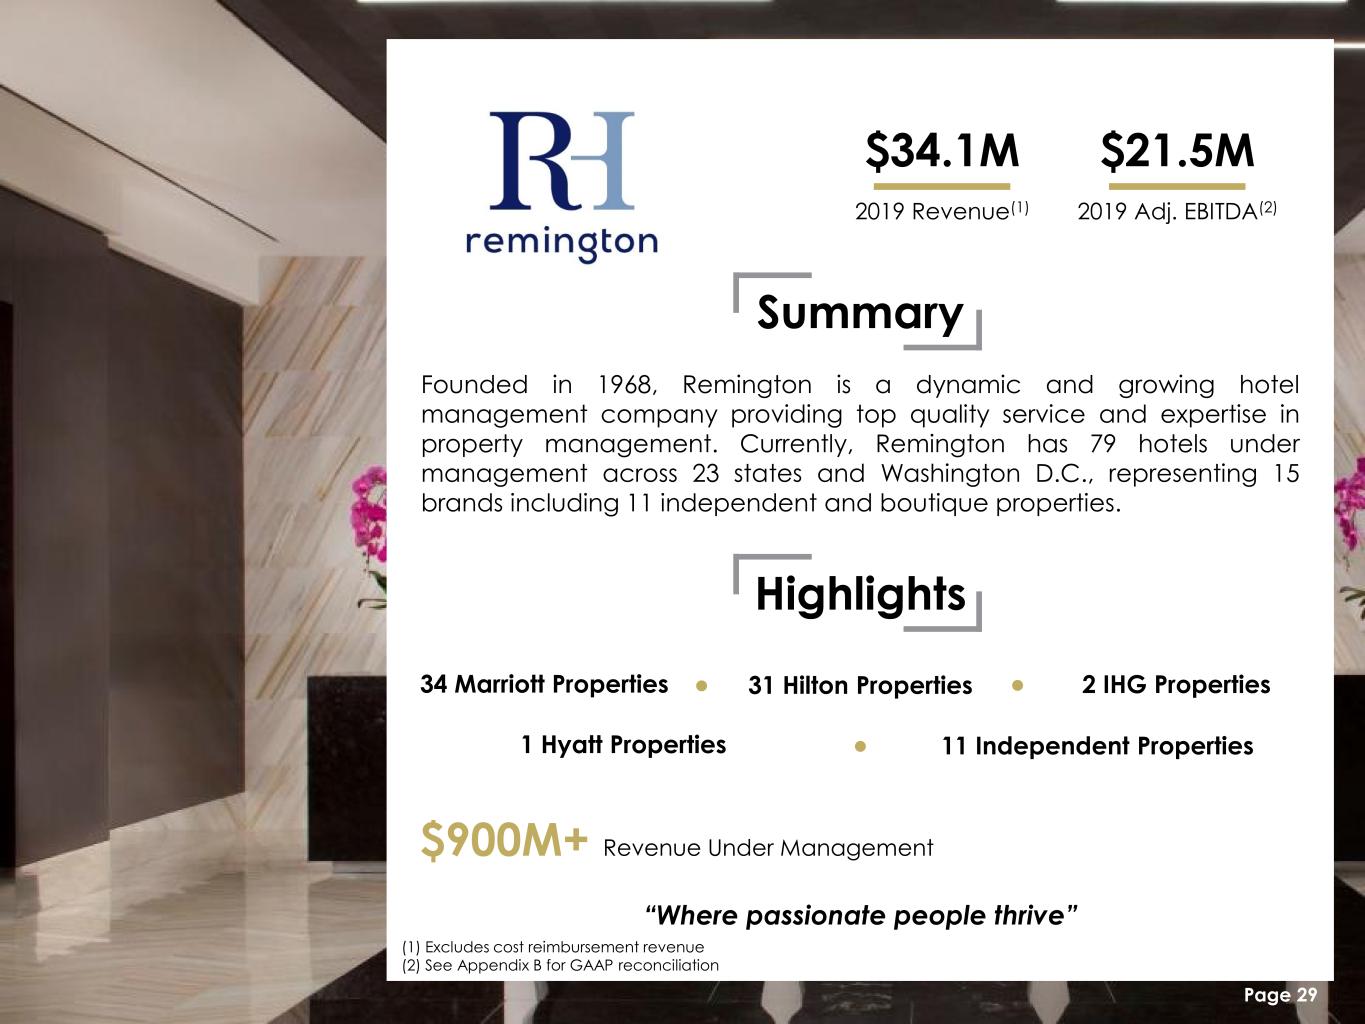
2019 Revenue(1) $34.1M 2019 Adj. EBITDA(2) $21.5M Summary “Where passionate people thrive” Founded in 1968, Remington is a dynamic and growing hotel management company providing top quality service and expertise in property management. Currently, Remington has 79 hotels under management across 23 states and Washington D.C., representing 15 brands including 11 independent and boutique properties. Highlights 34 Marriott Properties 31 Hilton Properties 2 IHG Properties 1 Hyatt Properties 11 Independent Properties $900M+ Revenue Under Management (1) Excludes cost reimbursement revenue (2) See Appendix B for GAAP reconciliation Page 29
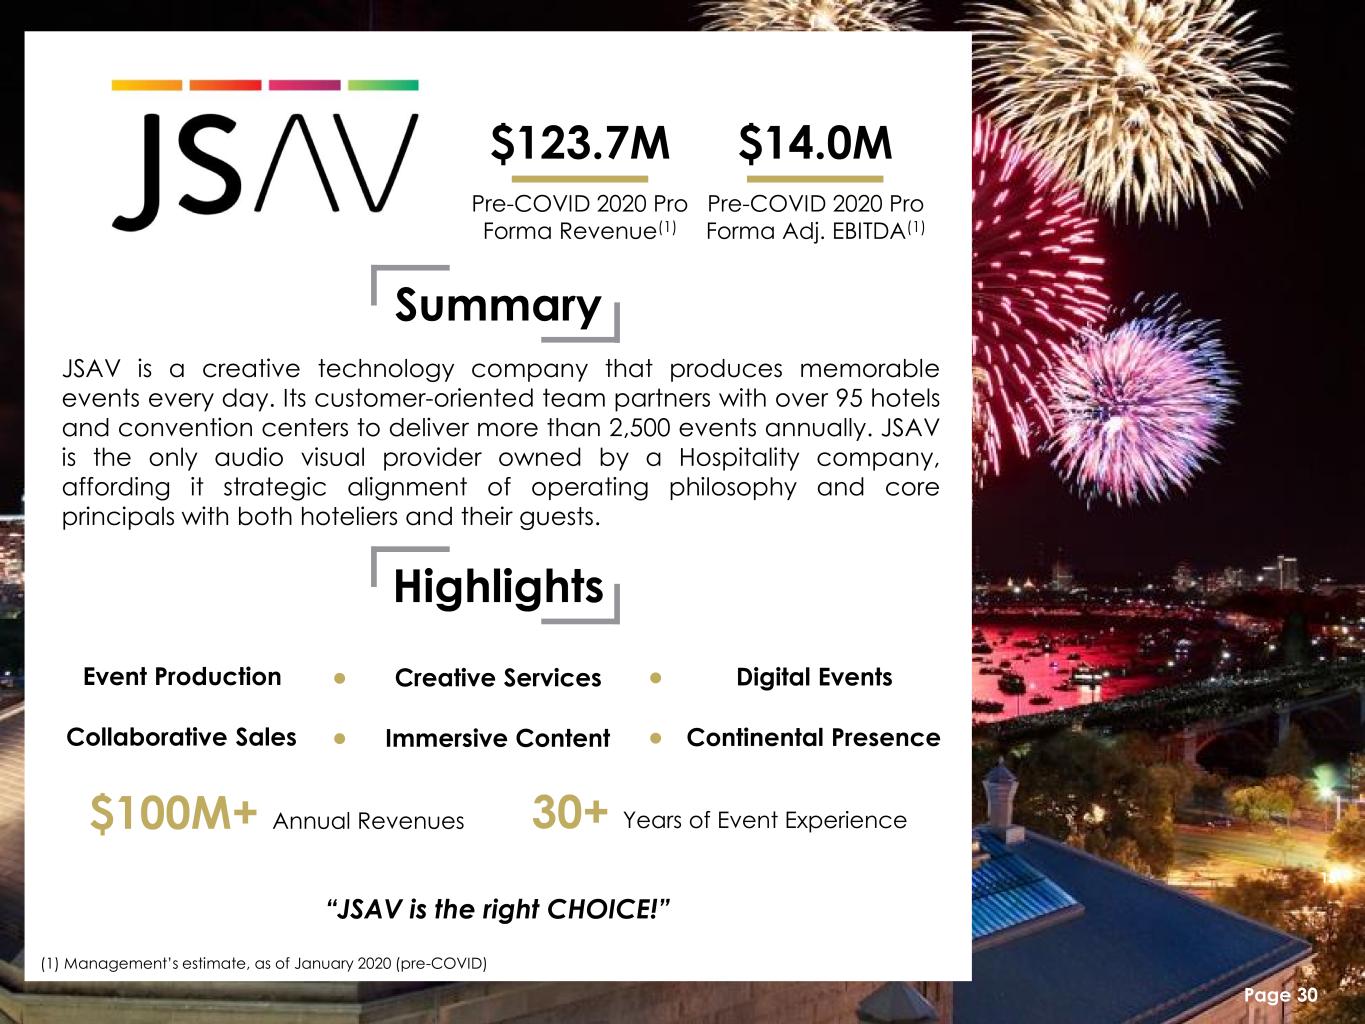
15 Pre-COVID 2020 Pro Forma Revenue(1) $123.7M Pre-COVID 2020 Pro Forma Adj. EBITDA(1) $14.0M Summary “JSAV is the right CHOICE!” JSAV is a creative technology company that produces memorable events every day. Its customer-oriented team partners with over 95 hotels and convention centers to deliver more than 2,500 events annually. JSAV is the only audio visual provider owned by a Hospitality company, affording it strategic alignment of operating philosophy and core principals with both hoteliers and their guests. Highlights Event Production Creative Services Digital Events Collaborative Sales Immersive Content Continental Presence 30+ Years of Event Experience$100M+ Annual Revenues (1) Management’s estimate, as of January 2020 (pre-COVID) Page 30
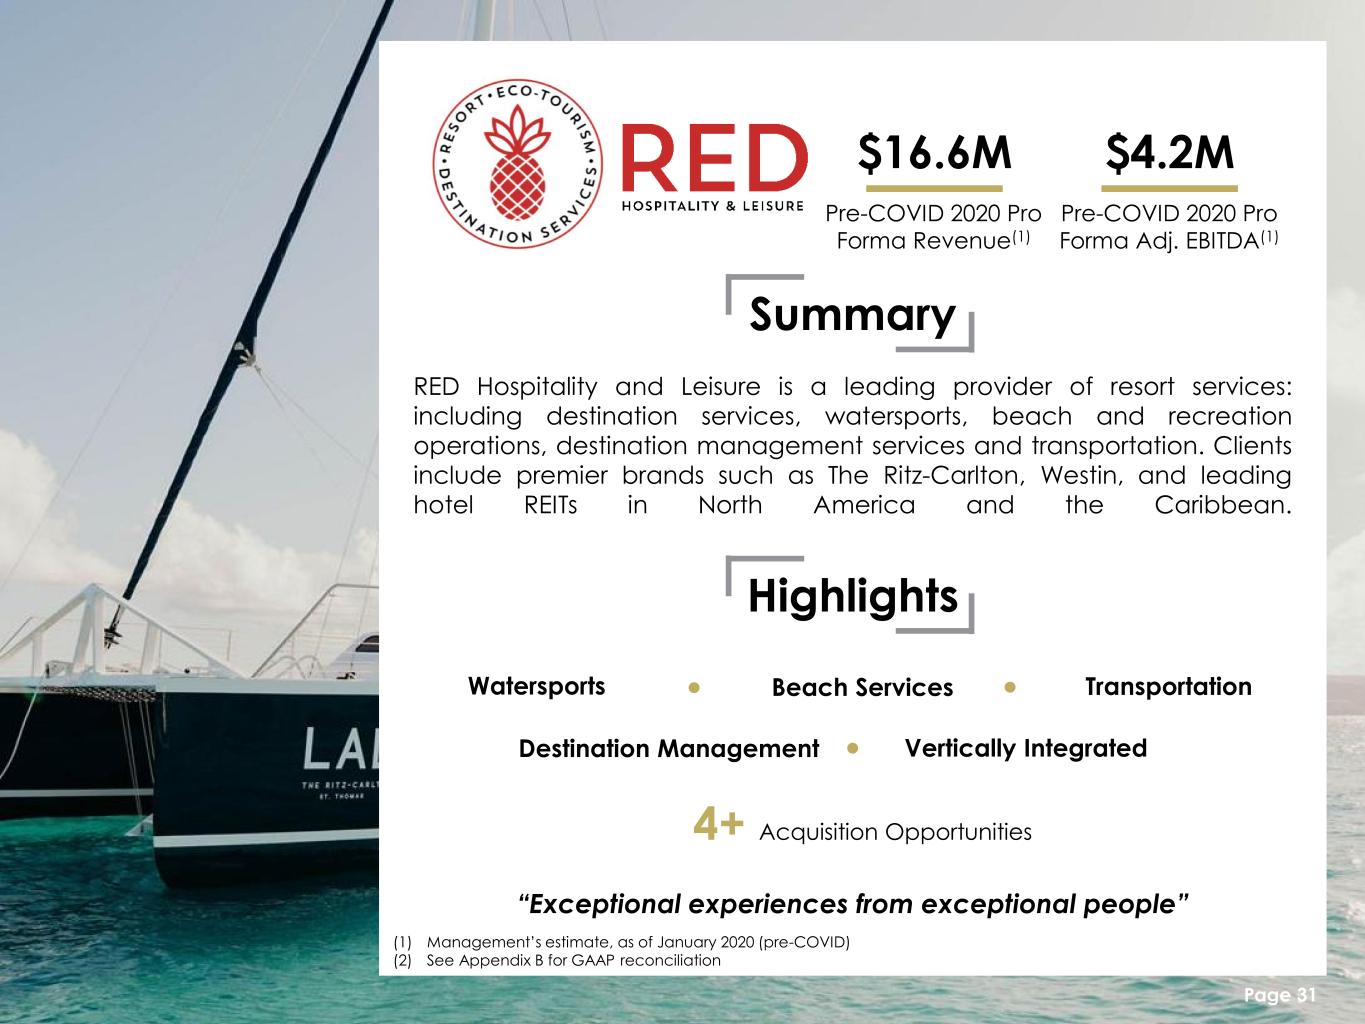
Pre-COVID 2020 Pro Forma Revenue(1) $16.6M Pre-COVID 2020 Pro Forma Adj. EBITDA(1) $4.2M Summary “Exceptional experiences from exceptional people” RED Hospitality and Leisure is a leading provider of resort services: including destination services, watersports, beach and recreation operations, destination management services and transportation. Clients include premier brands such as The Ritz-Carlton, Westin, and leading hotel REITs in North America and the Caribbean. Highlights Watersports Beach Services Transportation Destination Management Vertically Integrated 4+ Acquisition Opportunities (1) Management’s estimate, as of January 2020 (pre-COVID) (2) See Appendix B for GAAP reconciliation Page 31
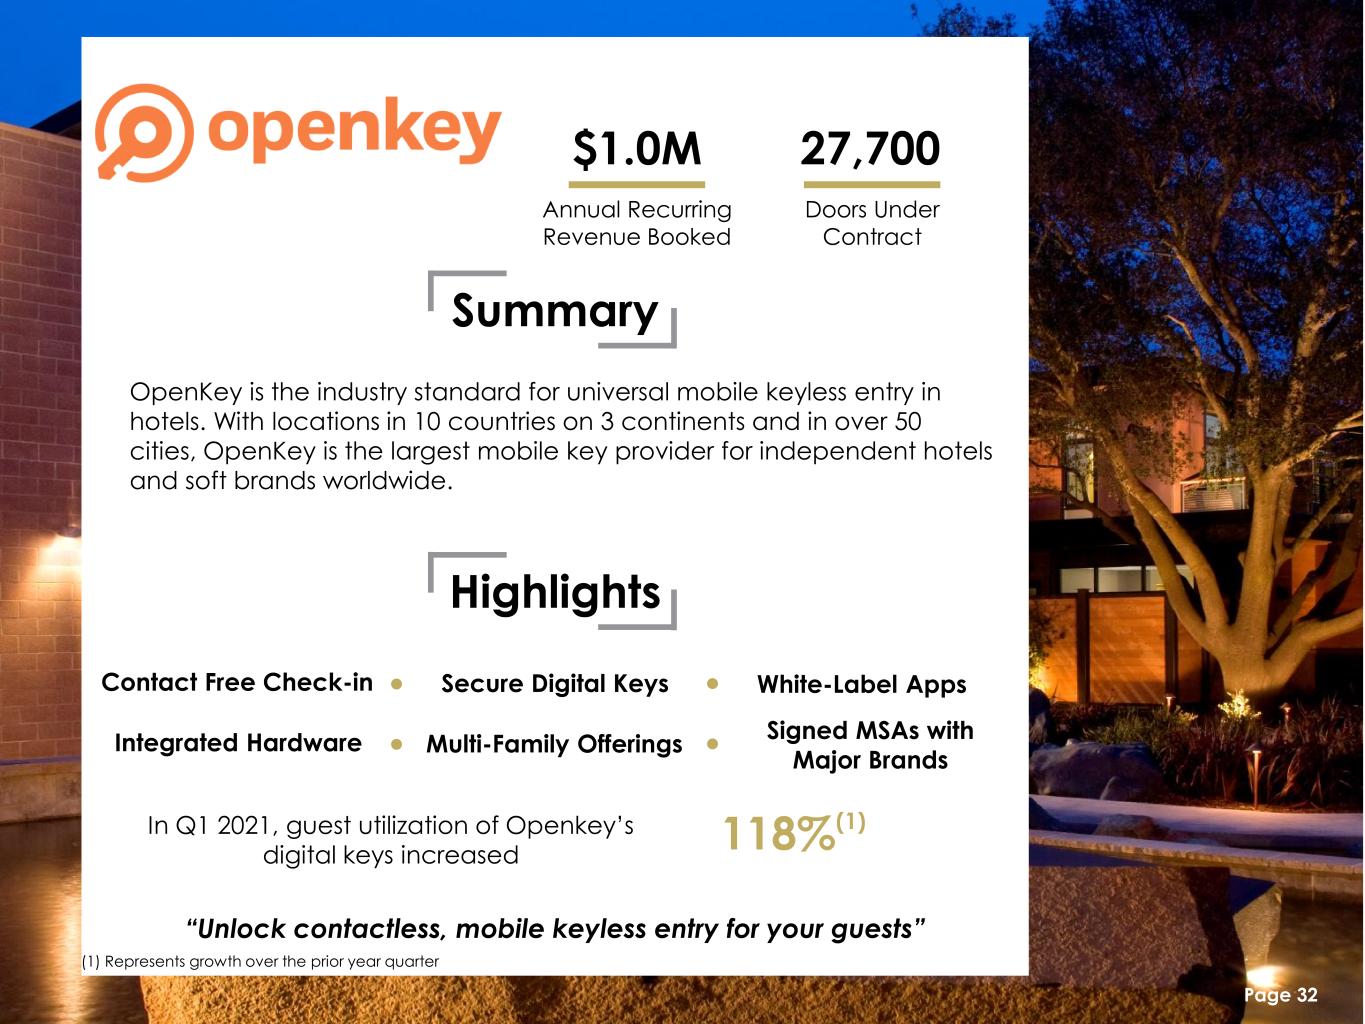
Annual Recurring Revenue Booked $1.0M Doors Under Contract 27,700 Summary “Unlock contactless, mobile keyless entry for your guests” OpenKey is the industry standard for universal mobile keyless entry in hotels. With locations in 10 countries on 3 continents and in over 50 cities, OpenKey is the largest mobile key provider for independent hotels and soft brands worldwide. Highlights Contact Free Check-in Secure Digital Keys White-Label Apps Integrated Hardware Multi-Family Offerings Signed MSAs with Major Brands 118%(1)In Q1 2021, guest utilization of Openkey’s digital keys increased Page 32 (1) Represents growth over the prior year quarter

October 2020 Industry Sales vs. May 2020(1)(2) +166% Industry Monthly Pre-COVID Fundraising(1)(2) $2.5B Summary “If it’s lodging, it’s Ashford” Ashford Securities is a managing broker/dealer committed to offering highly differentiated investment products to retail and institutional investors. Efforts are led by C. Jay Steigerwald III, former executive at W. P. Carey, who helped raise $7B of capital. Highlights FINRA Member Firm Private Placements Private Equity Funds Non-Traded Preferred Stock Retail Commitment to Alts is High $29B+ 2019 Alternative Industry Market Sales(1)(2) (1) Figures represent alternative investment market as a whole (2) Source: Robert A. Stanger Page 33

2019 Revenue $3.1M 2019 Adj. EBITDA(1) $162K Summary “Pure Wellness helps wellness-minded individuals be their best” Pure Wellness transforms interior spaces into world-class wellness environments that protect against viral and bacterial contaminates to promote overall wellbeing. Pure rooms provide a refreshing, relaxing experience to guests around the world: in hotels, resorts, office buildings, senior living, and more. Pure Rooms are designed to meet the needs of wellness-minded travelers and guests. Highlights $20 Average increase in nightly rate CDC Approved For COVID-19 15+ Years of Operation Patented 7-Step Process Expanding into Office/Multi-Family 30% Loyalty Program Upgrades (1) See Appendix B for GAAP reconciliation Page 34

Appendix B Page 35
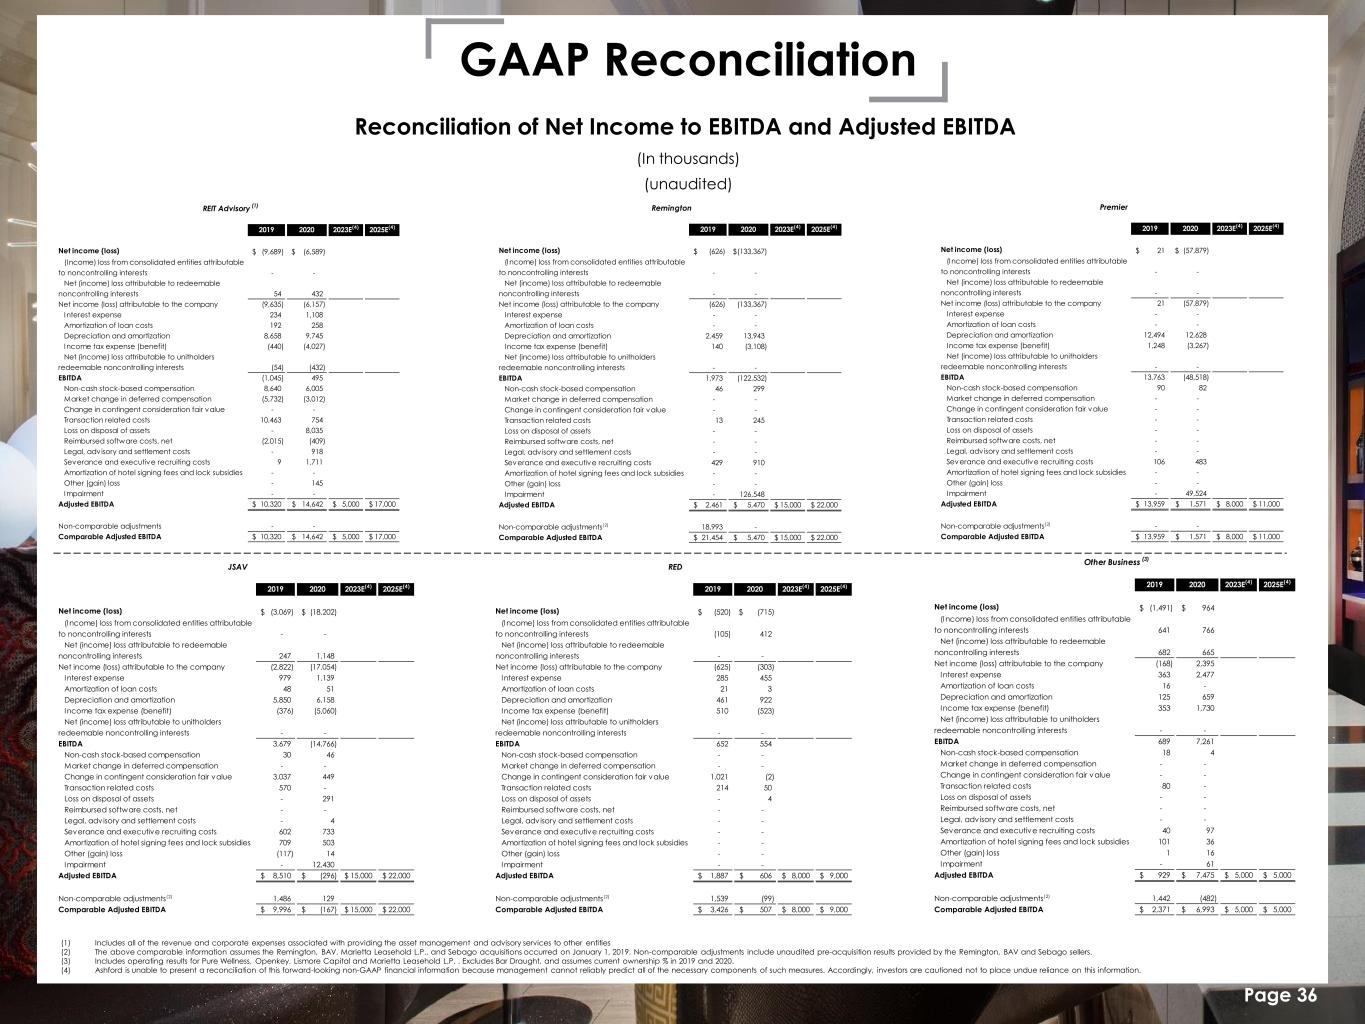
9/22/2021 36 GAAP Reconciliation (1) Includes all of the revenue and corporate expenses associated with providing the asset management and advisory services to other entities (2) The above comparable information assumes the Remington, BAV, Marietta Leasehold L.P., and Sebago acquisitions occurred on January 1, 2019. Non-comparable adjustments include unaudited pre-acquisition results provided by the Remington, BAV and Sebago sellers. (3) Includes operating results for Pure Wellness, Openkey, Lismore Capital and Marietta Leasehold L.P. . Excludes Bar Draught, and assumes current ownership % in 2019 and 2020. (4) Ashford is unable to present a reconciliation of this forward-looking non-GAAP financial information because management cannot reliably predict all of the necessary components of such measures. Accordingly, investors are cautioned not to place undue reliance on this information. Page 36 REIT Advisory (1) 2019 2020 2023E(4) 2025E(4) Net income (loss) (9,689)$ (6,589)$ (Income) loss from consolidated entities attributable to noncontrolling interests - - Net (income) loss attributable to redeemable noncontrolling interests 54 432 Net income (loss) attributable to the company (9,635) (6,157) Interest expense 234 1,108 Amortization of loan costs 192 258 Depreciation and amortization 8,658 9,745 Income tax expense (benefit) (440) (4,027) Net (income) loss attributable to unitholders redeemable noncontrolling interests (54) (432) EBITDA (1,045) 495 Non-cash stock-based compensation 8,640 6,005 Market change in deferred compensation (5,732) (3,012) Change in contingent consideration fair value - - Transaction related costs 10,463 754 Loss on disposal of assets - 8,035 Reimbursed software costs, net (2,015) (409) Legal, advisory and settlement costs - 918 Severance and executive recruiting costs 9 1,711 Amortization of hotel signing fees and lock subsidies - - Other (gain) loss - 145 Impairment - - Adjusted EBITDA 10,320$ 14,642$ 5,000$ 17,000$ Non-comparable adjustments - - Comparable Adjusted EBITDA 10,320$ 14,642$ 5,000$ 17,000$ Remington 2019 2020 2023E(4) 2025E(4) Net income (loss) (626)$ (133,367)$ (Income) loss from consolidated entities attributable to noncontrolling interests - - Net (income) loss attributable to redeemable noncontrolling interests - - Net income (loss) attributable to the company (626) (133,367) Interest expense - - Amortization of loan costs - - Depreciation and amortization 2,459 13,943 Income tax expense (benefit) 140 (3,108) Net (income) loss attributable to unitholders redeemable noncontrolling interests - - EBITDA 1,973 (122,532) Non-cash stock-based compensation 46 299 Market change in deferred compensation - - Change in contingent consideration fair value - - Transaction related costs 13 245 Loss on disposal of assets - - Reimbursed software costs, net - - Legal, advisory and settlement costs - - Severance and executive recruiting costs 429 910 Amortization of hotel signing fees and lock subsidies - - Other (gain) loss - - Impairment - 126,548 Adjusted EBITDA 2,461$ 5,470$ 15,000$ 22,000$ Non-comparable adjustments(2) 18,993 - Comparable Adjusted EBITDA 21,454$ 5,470$ 15,000$ 22,000$ Premier 2019 2020 2023E(4) 2025E(4) Net income (loss) 21$ (57,879)$ (Income) loss from consolidated entities attributable to noncontrolling interests - - Net (income) loss attributable to redeemable noncontrolling interests - - Net income (loss) attributable to the company 21 (57,879) Interest expense - - Amortization of loan costs - - Depreciation and amortization 12,494 12,628 Income tax expense (benefit) 1,248 (3,267) Net (income) loss attributable to unitholders redeemable noncontrolling interests - - EBITDA 13,763 (48,518) Non-cash stock-based compensation 90 82 Market change in deferred compensation - - Change in contingent consideration fair value - - Transaction related costs - - Loss on disposal of assets - - Reimbursed software costs, net - - Legal, advisory and settlement costs - - Severance and executive recruiting costs 106 483 Amortization of hotel signing fees and lock subsidies - - Other (gain) loss - - Impairment - 49,524 Adjusted EBITDA 13,959$ 1,571$ 8,000$ 11,000$ Non-comparable adjustments(2) - - Comparable Adjusted EBITDA 13,959$ 1,571$ 8,000$ 11,000$ Reconciliation of Net Income to EBITDA and Adjusted EBITDA (In thousands) (unaudited) JSAV 2019 2020 2023E(4) 2025E(4) Net income (loss) (3,069)$ (18,202)$ (Income) loss from consolidated entities attributable to noncontrolling interests - - Net (income) loss attributable to redeemable noncontrolling interests 247 1,148 Net income (loss) attributable to the company (2,822) (17,054) Interest expense 979 1,139 Amortization of loan costs 48 51 Depreciation and amortization 5,850 6,158 Income tax expense (benefit) (376) (5,060) Net (income) loss attributable to unitholders redeemable noncontrolling interests - - EBITDA 3,679 (14,766) Non-cash stock-based compensation 30 46 Market change in deferred compensation - - Change in contingent consideration fair value 3,037 449 Transaction related costs 570 - Loss on disposal of assets - 291 Reimbursed software costs, net - - Legal, advisory and settlement costs - 4 Severance and executive recruiting costs 602 733 Amortization of hotel signing fees and lock subsidies 709 503 Other (gain) loss (117) 14 Impairment - 12,430 Adjusted EBITDA 8,510$ (296)$ 15,000$ 22,000$ Non-comparable adjustments(2) 1,486 129 Comparable Adjusted EBITDA 9,996$ (167)$ 15,000$ 22,000$ RED 2019 2020 2023E(4) 2025E(4) Net income (loss) (520)$ (715)$ (Income) loss from consolidated entities attributable to noncontrolling interests (105) 412 Net (income) loss attributable to redeemable noncontrolling interests - - Net income (loss) attributable to the company (625) (303) Interest expense 285 455 Amortization of loan costs 21 3 Depreciation and amortization 461 922 Income tax expense (benefit) 510 (523) Net (income) loss attributable to unitholders redeemable noncontrolling interests - - EBITDA 652 554 Non-cash stock-based compensation - - Market change in deferred compensation - - Change in contingent consideration fair value 1,021 (2) Transaction related costs 214 50 Loss on disposal of assets - 4 Reimbursed software costs, net - - Legal, advisory and settlement costs - - Severance and executive recruiting costs - - Amortization of hotel signing fees and lock subsidies - - Other (gain) loss - - Impairment - - Adjusted EBITDA 1,887$ 606$ 8,000$ 9,000$ Non-comparable adjustments(2) 1,539 (99) Comparable Adjusted EBITDA 3,426$ 507$ 8,000$ 9,000$ Other Business (3) 2019 2020 2023E(4) 2025E(4) Net income (loss) (1,491)$ 964$ (Income) loss from consolidated entities attributable to noncontrolling interests 641 766 Net (income) loss attributable to redeemable noncontrolling interests 682 665 Net income (loss) attributable to the company (168) 2,395 Interest expense 363 2,477 Amortization of loan costs 16 - Depreciation and amortization 125 659 Income tax expense (benefit) 353 1,730 Net (income) loss attributable to unitholders redeemable noncontrolling interests - - EBITDA 689 7,261 Non-cash stock-based compensation 18 4 Market change in deferred compensation - - Change in contingent consideration fair value - - Transaction related costs 80 - Loss on disposal of assets - - Reimbursed software costs, net - - Legal, advisory and settlement costs - - Severance and executive recruiting costs 40 97 Amortization of hotel signing fees and lock subsidies 101 36 Other (gain) loss 1 16 Impairment - 61 Adjusted EBITDA 929$ 7,475$ 5,000$ 5,000$ Non-comparable adjustments(2) 1,442 (482) Comparable Adjusted EBITDA 2,371$ 6,993$ 5,000$ 5,000$

9/22/2021 37 GAAP Reconciliation (1) Ashford is unable to present a reconciliation of this forward-looking non-GAAP financial information because management cannot reliably predict all of the necessary components of such measures. Accordingly, investors are cautioned not to place undue reliance on this information. (2) The above comparable information assumes the Remington, BAV, Marietta Leasehold L.P., and Sebago acquisitions occurred on January 1, 2019. Non-comparable adjustments include unaudited pre-acquisition results provided by the Remington, BAV and Sebago sellers. Excludes Bar Draught, and assumes current ownership % in 2019 and 2020. Page 37 Ashford Inc. Consolidated 2019 2020 2023E(1) 2025E(1) Net income (loss) (15,374)$ (215,788)$ (Income) loss from consolidated entities attributable to noncontrolling interests 536 1,178 Net (income) loss attributable to redeemable noncontrolling interests 983 2,245 Net income (loss) attributable to the company (13,855) (212,365) Interest expense 1,861 5,179 Amortization of loan costs 277 312 Depreciation and amortization 30,047 44,055 Income tax expense (benefit) 1,435 (14,255) Net (income) loss attributable to unitholders redeemable noncontrolling interests (54) (432) EBITDA 19,711 (177,506) Non-cash stock-based compensation 8,824 6,436 Market change in deferred compensation (5,732) (3,012) Change in contingent consideration fair value 4,058 447 Transaction related costs 11,340 1,049 Loss on disposal of assets - 8,330 Reimbursed software costs, net (2,015) (409) Legal, advisory and settlement costs - 922 Severance and executive recruiting costs 1,186 3,934 Amortization of hotel signing fees and lock subsidies 810 539 Other (gain) loss (116) 175 Impairment - 188,563 Adjusted EBITDA 38,066$ 29,468$ 55,000$ 85,000$ Non-comparable adjustments(2) 23,460 (452) Comparable Adjusted EBITDA 61,526$ 29,016$ 55,000$ 85,000$
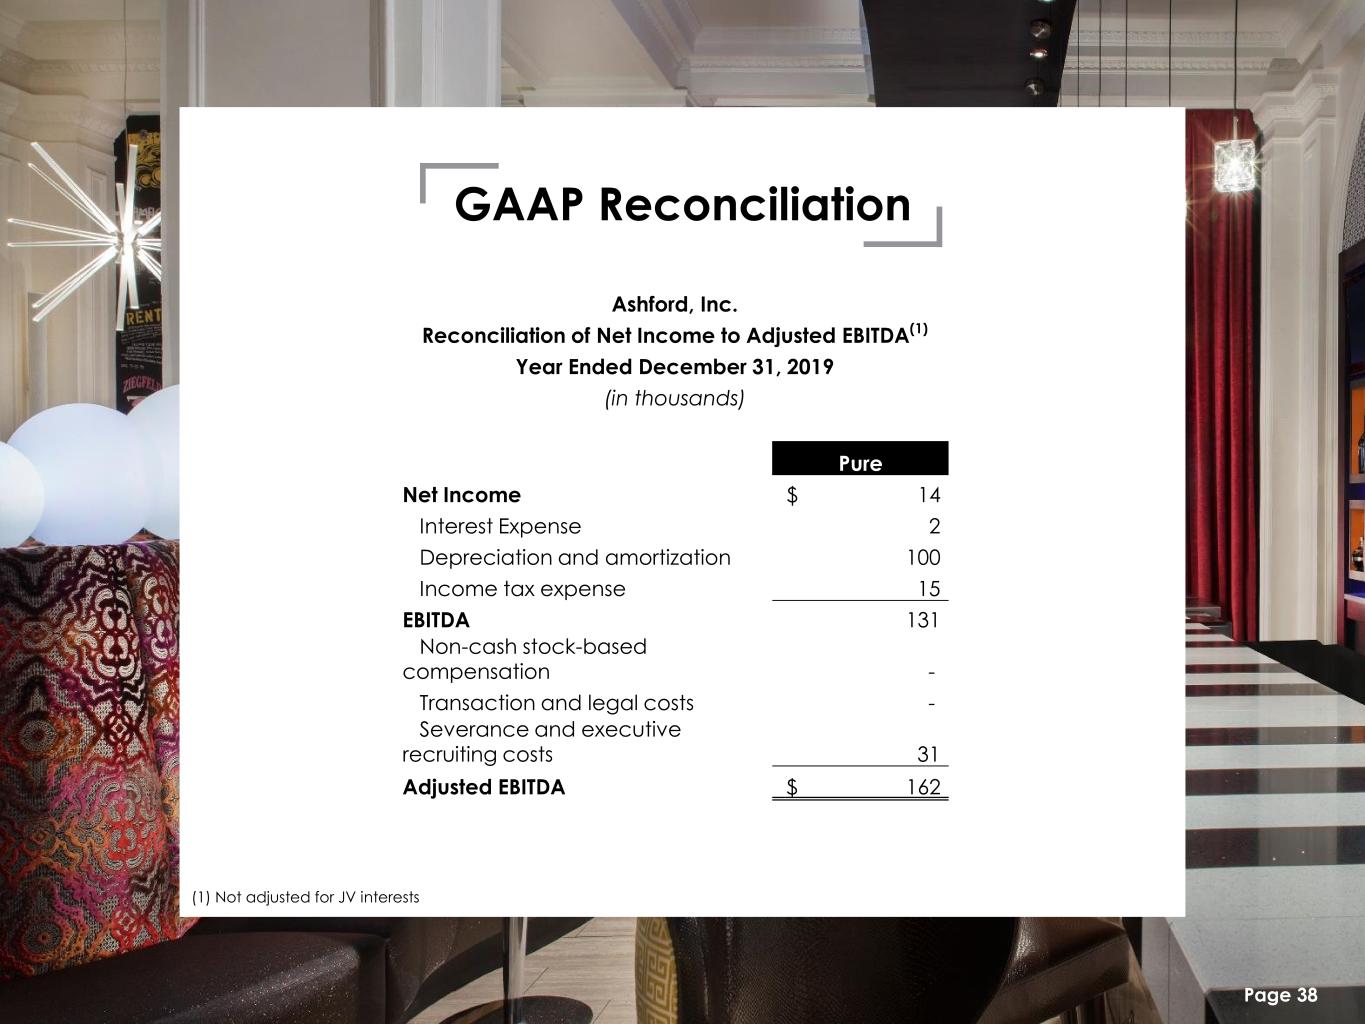
9/22/2021 38 GAAP Reconciliation Ashford, Inc. Reconciliation of Net Income to Adjusted EBITDA(1) Year Ended December 31, 2019 (in thousands) Pure Net Income $ 14 Interest Expense 2 Depreciation and amortization 100 Income tax expense 15 EBITDA 131 Non-cash stock-based compensation - Transaction and legal costs - Severance and executive recruiting costs 31 Adjusted EBITDA $ 162 Page 38 (1) Not adjusted for JV interests
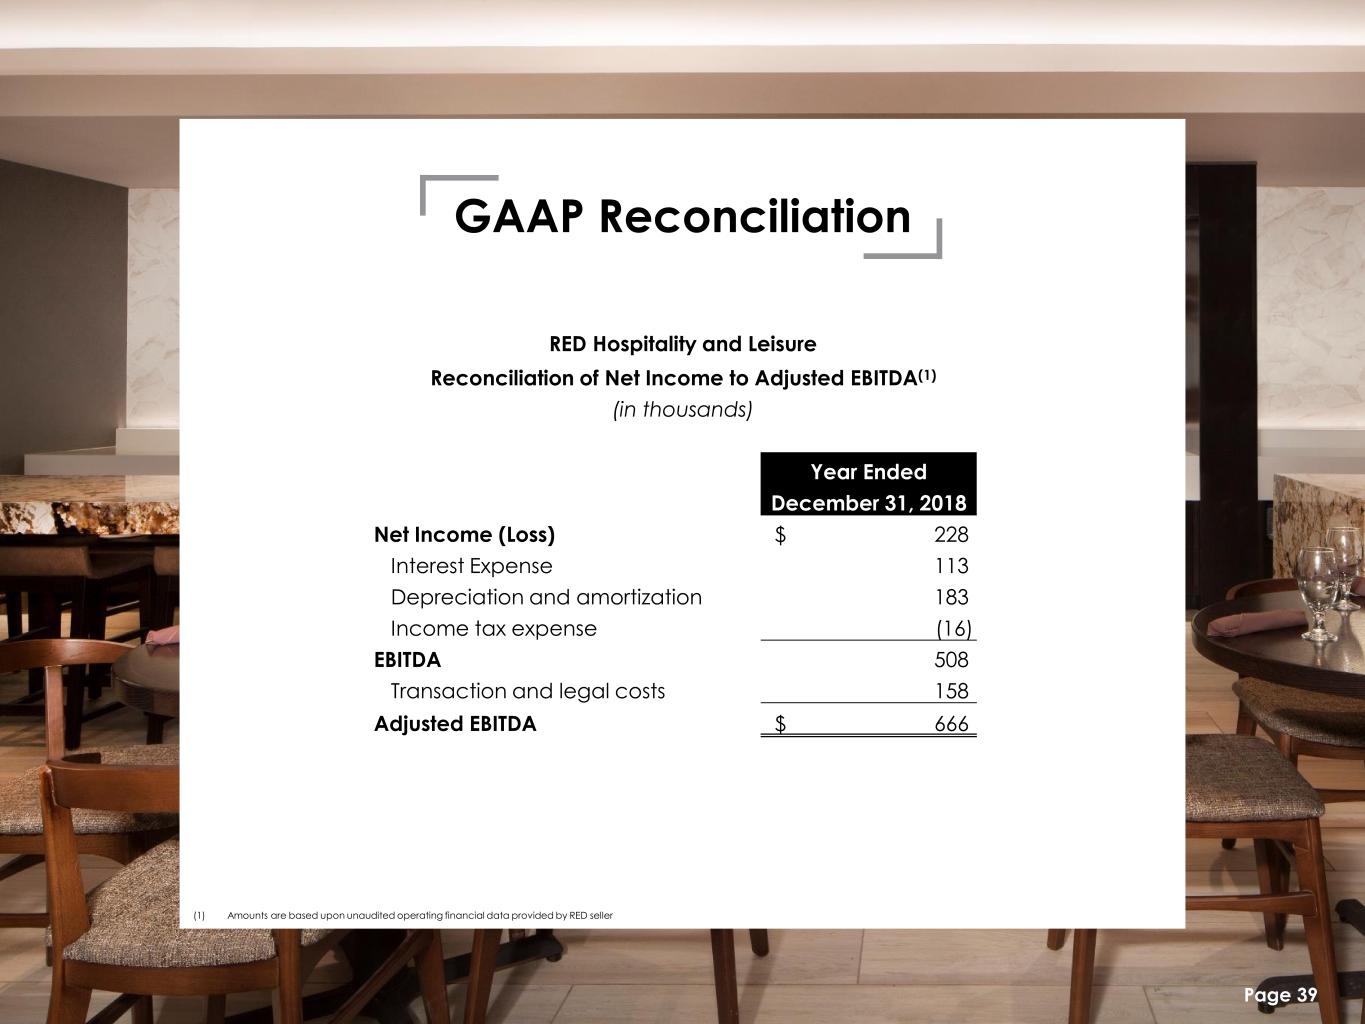
9/22/2021 39 GAAP Reconciliation RED Hospitality and Leisure Reconciliation of Net Income to Adjusted EBITDA(1) (in thousands) Year Ended December 31, 2018 Net Income (Loss) $ 228 Interest Expense 113 Depreciation and amortization 183 Income tax expense (16) EBITDA 508 Transaction and legal costs 158 Adjusted EBITDA $ 666 Page 39 (1) Amounts are based upon unaudited operating financial data provided by RED seller

NYSE American: AINC September 2021


