TrimTabs ETF Trust
TrimTabs U.S. Free Cash Flow Quality ETF
TrimTabs International Free Cash Flow Quality ETF
TrimTabs Donoghue Forlines Tactical High Yield ETF
TrimTabs Donoghue Forlines Risk Managed Innovation ETF
Semi-Annual Report
January 31, 2021
TrimTabs ETF Trust
| TABLE OF CONTENTS | |
| Shareholder Letter for TrimTabs U.S. Free Cash Flow Quality ETF | 1 |
| Performance Summary for TrimTabs U.S. Free Cash Flow Quality ETF | 3 |
| Shareholder Letter for TrimTabs International Free Cash Flow Quality ETF | 4 |
Performance Summary for TrimTabs International Free Cash Flow Quality ETF | 6 |
Shareholder Letter for TrimTabs Donoghue Forlines Tactical High Yield ETF | 7 |
Performance Summary for TrimTabs Donoghue Forlines Tactical High Yield ETF | 8 |
Shareholder Letter for TrimTabs Donoghue Forlines Risk Managed Innovation ETF | 9 |
Performance Summary for TrimTabs Donoghue Forlines Risk Managed Innovation ETF | 11 |
| Shareholder Expense Examples | 12 |
| Portfolio Holdings Allocation | 14 |
| Schedules of Investments | 16 |
| Statements of Assets and Liabilities | 30 |
| Statements of Operations | 31 |
| Statements of Changes in Net Assets | 32 |
| Financial Highlights | 36 |
| Notes to Financial Statements | 40 |
| Additional Information | 55 |
TrimTabs U.S. Free Cash Flow Quality ETF
SHAREHOLDER LETTER
January 31, 2021 (Unaudited)
Dear Shareholder,
The TrimTabs US Free Cash Flow Quality ETF (TTAC) was up 14.82% (NAV) and 15.46% (Market) for the 6 months ended January 31, 2021. Our benchmark, the Russell 3000 Total Return Index (R3000), was up 17.98% over the same period. The last 6 months saw a recovery rally in the US Small Cap Stock, where the Russell 2000 Total Return Index (R2000) was up 40.89% compared to 14.47% for the S&P 500 Total Return Index (SP500).
On an absolute basis, the leading contributors of TTAC were Information Technology stocks with a 4.51% return, and Large Growth stocks with 4.09% return; the main detractors were Energy Stocks, losing 0.14%. On a benchmark relative basis, the best active contributors were Communication Services stocks, adding 0.77% active return over R3000; and large value stocks, contributed to 1.05% active return. The main active detractors were Healthcare stocks and Large Blend stocks, losing 1.21% and 1.40% respectively.
TTAC owns a portfolio of high-quality stocks selected by our proprietary free cash flow algorithm: as of January 31, 2021, the weighted average return on equity for TTAC was 21.47%, compared to 15.98% of R3000 and debt-to-capital of 41.50% compared to 44.09%. Historically, high quality stocks underperformed in the recovery stage but remained resilient throughout the economic cycle. We believe holding a Large and Mid-cap high-quality portfolio selected by the proprietary free cash flow metrics informed by our research as a core position can benefit investors in the long-term.
Must be preceded or accompanied by a current Fund prospectus.
The views and opinions expressed in this discussion are those of TrimTabs Asset Management, LLC. The views and opinions expressed are subject to change at any time, are not guaranteed and should not be considered investment advice.
Past performance is no guarantee of future results.
Fund holdings and sector allocations are subject to change and are not recommendations to buy or sell any security. Current and future portfolio holdings are subject to risk. Please refer to the Schedule of Investments contained in this report for a full listing of fund holdings.
Investing involves risk, including the possible loss of principal. Shares of any ETF are bought and sold at market price (not NAV), may trade at a discount or premium to NAV and are not individually redeemed from the Fund. Brokerage commissions will reduce returns. Investments in the Fund include risks associated with small and mid-cap securities which involve limited liquidity and greater volatility than large-cap securities.
The performance data quoted represents past performance. Past performance does not guarantee future results. The investment return and principal value of an investment will fluctuate so that an investor’s shares, when sold or redeemed, may be worth more or less than their original cost and current performance may be lower or higher than the performance quoted. Performance current to the most recent month-end can be obtained by calling (toll free 800-617-0004).
TrimTabs U.S. Free Cash Flow Quality ETF
SHAREHOLDER LETTER
January 31, 2021 (Unaudited) (Continued)
The Russell 3000® Index measures the performance of the 3,000 largest publicly traded U.S. companies, based on market capitalization. The Index measures the performance of approximately 98% of the total market capitalization of the publicly traded U.S. equity market. The Index return reflects the reinvestment of income dividends and capital gain distributions, if any, but does not reflect fees, brokerage commissions, or other expenses of investing. It is not possible to invest directly in the Index.
The S&P 500 Index (Standard & Poor’s 500 Index) is a market-capitalization-weighted index of the 500 largest U.S. publicly traded companies by market value.
Free Cash Flow represents the cash that a company is able to generate after accounting for capital expenditures.
The TrimTabs U.S. Free Cash Flow Quality ETF is distributed by Quasar Distributors, LLC.
The return on equity is a measure of the profitability of a business in relation to the equity.
A company’s debt-to-capital ratio or D/C ratio is the ratio of its total debt to its total capital, its debt and equity combined.
The Russell 2000 Index is a small-cap stock market index of the smallest 2,000 stocks in the Russell 3000 Index.
TrimTabs U.S. Free Cash Flow Quality ETF
PERFORMANCE SUMMARY
January 31, 2021 (Unaudited)
Growth of a $10,000 Investment
| | One | Three | Since |
| Average Annual Total Returns (as of January 31, 2021) | Year | Year | Inception(a) |
| TrimTabs U.S. Free Cash Flow | | | |
| Quality ETF – NAV | 16.67% | 9.45% | 15.48% |
| TrimTabs U.S. Free Cash Flow | | | |
| Quality ETF – Market | 16.97% | 9.52% | 15.56% |
Russell 3000® Index | 20.48% | 12.38% | 15.83% |
This chart assumes an initial gross investment of $10,000 made on September 27, 2016 (commencement of the Fund’s operations). Returns shown include the reinvestment of all dividends. Returns shown do not reflect the deductions of taxes that a shareholder would pay on Fund distributions or the redemption of Fund shares. Past performance is not predictive of future performance. Investment return and principal value will fluctuate so that your shares, when redeemed, may be worth more or less than original cost. Index returns do not reflect the effects of fees or expenses. It is not possible to invest directly in an index. The total operating expense ratio as stated in the fee table to the Fund’s prospectus dated November 27, 2020, as supplemented January 12, 2021, is 0.59%. For performance information current to the most recent month-end, please call 1-800-617-0004.
(a) Commencement of operations on September 27, 2016.
TrimTabs International Free Cash Flow Quality ETF
SHAREHOLDER LETTER
January 31, 2021 (Unaudited)
Dear Shareholder,
The TrimTabs International Free Cash Flow Quality ETF (TTAI) was up 21.26% (NAV) and 21.50% (Market) for the 6 months ended January 31, 2021. Our benchmark, the S&P Developed Ex US BMI Net Total Return Index (SCRTWU), was up 19.78% over the same period. The last 6 months saw a recovery rally in the US Small Cap Stock, where the S&P Developed Ex-US SmallCap Select Net Total Return Index (SBERWUU) was up 23.78%.
On an absolute basis, the leading contributors of TTAI were Information Technology stocks with a 5.48% return, Foreign Large Growth stocks with 10.07% return and Japanese stocks with 5.71% return. On a benchmark relative basis, the best active contributors were Industrials, Foreign Large Growth and European Ex-Euro stocks, adding 1.25%, 1.92% and 0.58% active returns over SCRTWU, respectively. The main active detractors were Consumer Discretionary, Mid Blend and Developed Asia stocks, losing 1.92%, 0.52 and 0.32%, respectively.
TTAI owns a portfolio of high-quality stocks selected by our proprietary free cash flow algorithm: as of January 31, 2021, the weighted average return on equity for TTAI was 17.69%, compared to 10.32% of SCRTWU and debt-to-capital of 35.09% compared to 35.17%. Historically, high quality stocks underperformed in the recovery stage but remained resilient throughout of the economic cycle.
We believe holding a Large and Mid-cap high-quality portfolio selected by the proprietary free cash flow metrics informed by our research as a core position can benefit investors in the long-term.
Must be preceded or accompanied by a current Fund prospectus.
The views and opinions expressed in this discussion are those of TrimTabs Asset Management, LLC. The views and opinions expressed are subject to change at any time, are not guaranteed and should not be considered investment advice.
Past performance is no guarantee of future results.
Fund holdings and sector allocations are subject to change and are not recommendations to buy or sell any security. Current and future portfolio holdings are subject to risk. Please refer to the Schedule of Investments contained in this report for a full listing of fund holdings.
Investing involves risk, including the possible loss of principal. Shares of any ETF are bought and sold at market price (not NAV), may trade at a discount or premium to NAV and are not individually redeemed from the Fund. Brokerage commissions will reduce returns. Investments in the Fund include risks associated with small- and mid-cap securities which involve limited liquidity and greater volatility than large-cap securities. Returns on investments in foreign securities could be more volatile than investments in securities of domestic issuers.
TrimTabs International Free Cash Flow Quality ETF
SHAREHOLDER LETTER
January 31, 2021 (Unaudited) (Continued)
The performance data quoted represents past performance. Past performance does not guarantee future results. The investment return and principal value of an investment will fluctuate so that an investor’s shares, when sold or redeemed, may be worth more or less than their original cost and current performance may be lower or higher than the performance quoted. Performance current to the most recent month-end can be obtained by calling (toll free 800-617-0004).
The S&P Developed Ex-US BMI Net Total Return Index (“S&P Index”) is a market capitalization weighted index that defines and measures the investable universe of publicly traded companies domiciled in developed countries outside the U.S. The S&P Index is float adjusted, meaning that only those shares publicly available to investors are included in the S&P Index calculation. It is not possible to invest directly in the Index.
The S&P Developed Ex-US SmallCap Select Index seeks to measure constituents of the S&P Developed Ex-US SmallCap that have a demonstrated tracked record of generating positive earnings.
Free Cash Flow represents the cash that a company is able to generate after accounting for capital expenditures.
The TrimTabs International Free Cash Flow Quality ETF is distributed by Quasar Distributors, LLC.
The return on equity is a measure of the profitability of a business in relation to the equity.
A company’s debt-to-capital ratio or D/C ratio is the ratio of its total debt to its total capital, its debt and equity combined.
TrimTabs International Free Cash Flow Quality ETF
PERFORMANCE SUMMARY
January 31, 2021 (Unaudited)
Growth of a $10,000 Investment
| | One | Three | Since |
| Average Annual Total Returns (as of January 31, 2021) | Year | Year | Inception(a) |
| TrimTabs International Free Cash | | | |
| Flow Quality ETF – NAV | 18.44% | 5.29% | 7.76% |
| TrimTabs International Free Cash | | | |
| Flow Quality ETF – Market | 19.24% | 4.97% | 7.81% |
| S&P Developed ex-U.S. BMI Index | 12.13% | 2.91% | 6.62% |
This chart assumes an initial gross investment of $10,000 made on June 27, 2017 (commencement of the Fund’s operations). Returns shown include the reinvestment of all dividends. Returns shown do not reflect the deductions of taxes that a shareholder would pay on Fund distributions or the redemption of Fund shares. Past performance is not predictive of future performance. Investment return and principal value will fluctuate so that your shares, when redeemed, may be worth more or less than original cost. Index returns do not reflect the effects of fees or expenses. It is not possible to invest directly in an index. The total operating expense ratio as stated in the fee table to the Fund’s prospectus dated November 27, 2020, as supplemented, January 12, 2021, is 0.61%. For performance information current to the most recent month-end, please call 1-800-617-0004.
(a) Commencement of operations on June 27, 2017.
TrimTabs Donoghue Forlines Tactical High Yield ETF
SHAREHOLDER LETTER
January 31, 2021 (Unaudited)
Dear Shareholder,
The TrimTabs Donoghue Forlines Tactical High Yield ETF (DFHY) began trading on December 8, 2020. Since commencement of operations on December 7, 2020, through the period ending January 31, 2021, the fund was up 0.66% (NAV) and 0.71% (Market). The underlying index, TrimTabs Donoghue Forlines Tactical High Yield NTR Index, was up 0.54%. Our benchmark, the Bloomberg Barclays US Aggregate Bond Index was down 0.30%. DFHY was 100% allocated to high yield bond ETFs during the period ending January 31, 2021, as the fund’s underlying index did not employ the tactical risk management overlay.
Must be preceded or accompanied by a current Fund prospectus.
The views and opinions expressed in this discussion are those of TrimTabs Asset Management, LLC and Donoghue Forlines LLC. The views and opinions expressed are subject to change at any time, are not guaranteed and should not be considered investment advice.
Past performance is no guarantee of future results.
Fund holdings and sector allocations are subject to change and are not recommendations to buy or sell any security. Current and future portfolio holdings are subject to risk. Please refer to the Schedule of Investments contained in this report for a full listing of fund holdings.
The performance data quoted represents past performance. Past performance does not guarantee future results. The investment return and principal value of an investment will fluctuate so that an investor’s shares, when sold or redeemed, may be worth more or less than their original cost and current performance may be lower or higher than the performance quoted. Performance current to the most recent month-end can be obtained by calling (toll free 800-617-0004).
Investing involves risk, including the possible loss of principal. Shares of any ETF are bought and sold at market price (not NAV), may trade at a discount or premium to NAV and are not individually redeemed from the Fund. Brokerage commissions will reduce returns. Because the Fund invests in ETFs, an investor will indirectly bear the principal risks of the underlying funds, including illiquidity, and an investment in the Fund will entail more costs and expenses than a direct investment in the Underlying ETFs. Passive funds that seek to track an index may hold the component securities of the underlying index regardless of the current or projected performance of a specific security or the relevant market as a whole, which could cause fund returns to be lower than if the fund employed an active strategy. The performance of the Fund may diverge from that of its Index. Active and frequent trading of portfolio securities may result in increased transaction costs to the Fund and may also result in higher taxes if Shares are held in a taxable account. Investments in debt securities typically decrease in value when interest rates rise. This risk is usually greater for longer-term debt securities. Investments in high yield securities and unrated securities of similar credit quality are considered to be speculative and are generally subject to a greater risk of loss of principal and interest than investment grade securities. Investment in a fund that utilizes a tactical overlay that seeks to minimize risk may not be appropriate for every investor seeking a particular risk profile.
The TrimTabs Donoghue Forlines Tactical High Yield ETF is distributed by Quasar Distributors, LLC
TrimTabs Donoghue Forlines Tactical High Yield Index tracks the performance of a rules-based tactical strategy that employs technical signals to determine a bullish or defensive posture: when bullish, the Index is fully invested into selected High Yield Bond exchange-traded funds (“ETFs”); when defensive, the Index directs 80% of its position into selected intermediate-term U.S. Treasury ETFs.
The Bloomberg Barclays US Aggregate Bond Index, or the Agg, is a broad base, market capitalization-weighted bond market index representing intermediate term investment grade bonds traded in the United States.
TrimTabs Donoghue Forlines Tactical High Yield ETF
PERFORMANCE SUMMARY
January 31, 2021 (Unaudited)
Growth of a $10,000 Investment
| | Since |
| Cumulative Returns (as of January 31, 2021) | Inception(a) |
| TrimTabs Donoghue Forlines Tactical High Yield ETF – NAV | 0.66% |
| TrimTabs Donoghue Forlines Tactical High Yield ETF – Market | 0.71% |
| TrimTabs Donoghue Forlines Tactical High Yield Index | 0.54% |
| Bloomberg Barclays US Aggregated Bond Index | -0.30%
|
This chart assumes an initial gross investment of $10,000 made on December 7, 2020 (commencement of the Fund’s operations). Returns shown include the reinvestment of all dividends. Returns shown do not reflect the deductions of taxes that a shareholder would pay on Fund distributions or the redemption of Fund shares. Past performance is not predictive of future performance. Investment return and principal value will fluctuate so that your shares, when redeemed, may be worth more or less than original cost. Index returns do not reflect the effects of fees or expenses. It is not possible to invest directly in an index. The total operating expense ratio as stated in the fee table to the Fund’s prospectus dated November 16, 2020 is 0.95%. For performance information current to the most recent month-end, please call 1-800-617-0004.
(a) Commencement of operations on December 7, 2020.
TrimTabs Donoghue Forlines Risk Managed Innovation ETF
SHAREHOLDER LETTER
January 31, 2021 (Unaudited)
Dear Shareholder,
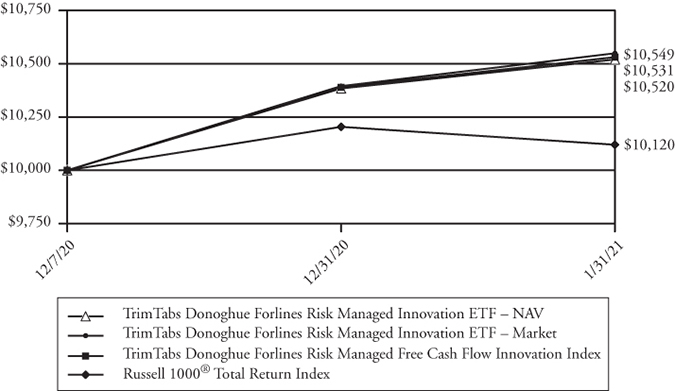
The TrimTabs Donoghue Forlines Risk Managed Innovation ETF (DFNV) began trading on December 8, 2020. Since commencement of operations on December 7, 2020, through the period ending January 31, 2021, the fund was up 5.20% (NAV) and 5.49% (Market). The underlying index, TrimTabs Donoghue Forlines Risk Managed Free Cash Flow Innovation Index, was up 5.31%. Our benchmark, the Russell 1000 Total Return Index (R1000), was up 1.20%.
On an absolute basis, the leading contributors of DFNV were Healthcare stocks with a 2.41% return, and Mid Growth stocks with a 1.49% return; the main detractors were Financials Stocks, losing 0.16%. On a benchmark relative basis, the best active contributors were Healthcare stocks, adding 1.77% active return over R1000; and Mid Blend and Mid Growth stocks, both contributed to 1.08% active return. The main active detractor was Financials stocks, losing 0.16%. Active contributions in all style boxes were positive.
DFNV owns a portfolio of high-quality innovative stocks selected by our proprietary free cash flow algorithm: as of January 31, 2021, the weighted average return on equity for DFNV was 17.66%, compared to 17.42% of R1000 and debt-to-capital of 39.14% compared to 44.48%. The Research & Development intensity for DFNV was 19.81%, compared to Russell 1000’s 3.51%. DFNV remained fully invested during the period ending January 31, 2021, as the fund’s underlying index did not employ the downside protection model.
Must be preceded or accompanied by a current Fund prospectus.
The views and opinions expressed in this discussion are those of TrimTabs Asset Management, LLC and Donoghue Forlines LLC. The views and opinions expressed are subject to change at any time, are not guaranteed and should not be considered investment advice.
Past performance is no guarantee of future results.
Fund holdings and sector allocations are subject to change and are not recommendations to buy or sell any security. Current and future portfolio holdings are subject to risk. Please refer to the Schedule of Investments contained in this report for a full listing of fund holdings.
The performance data quoted represents past performance. Past performance does not guarantee future results. The investment return and principal value of an investment will fluctuate so that an investor’s shares, when sold or redeemed, may be worth more or less than their original cost and current performance may be lower or higher than the performance quoted. Performance current to the most recent month-end can be obtained by calling (toll free 800-617-0004).
Investing involves risk, including the possible loss of principal. Shares of any ETF are bought and sold at market price (not NAV), may trade at a discount or premium to NAV and are not individually redeemed from the Fund. Brokerage commissions will reduce returns. Investments in the Fund include risks associated with small- and mid-cap securities which involve limited liquidity and greater volatility than large-cap securities. Because the Fund may invest in ETFs, an investor will indirectly bear the
TrimTabs Donoghue Forlines Risk Managed Innovation ETF
SHAREHOLDER LETTER
January 31, 2021 (Unaudited) (Continued)
principal risks of the underlying funds, including illiquidity, and an investment in the Fund will entail more costs and expenses than a direct investment in the Underlying ETFs. Passive funds that seek to track an index may hold the component securities of the underlying index regardless of the current or projected performance of a specific security or the relevant market as a whole, which could cause fund returns to be lower than if the fund employed an active strategy. The performance of the Fund may diverge from that of its Index. Active and frequent trading of portfolio securities may result in increased transaction costs to the Fund and may also result in higher taxes if Shares are held in a taxable account. Investment in a fund that utilizes a downside protection model that seeks to minimize risk only during certain prolonged bear market environments may not be appropriate for ever investor seeking a particular risk profile.
The Russell 1000 Index is a stock market index that tracks the highest-ranking 1,000 stocks in the Russell 3000 Index, which represent about 90% of the total market capitalization of that index.
Free Cash Flow represents the cash that a company is able to generate after accounting for capital expenditures.
The TrimTabs Donoghue Forlines Risk Managed Innovation ETF is distributed by Quasar Distributors, LLC.
TrimTabs Donoghue Forlines Risk Managed Free Cash Flow Innovation Index tracks the performance of a rules-based strategy that seeks to provide downside-protected exposure to U.S. equities with strong Free Cash Flow and R&D Investment, selected by a proprietary Free Cash Flow Innovation factor model. The index directs 50% of its position into short-term U.S. Treasury during a defensive regime.
Return on equity (ROE) is a measure of financial performance calculated by dividing net income by shareholders’ equity.
A company’s debt-to-capital ratio or D/C ratio is the ratio of its total debt to its total capital, its debt and equity combined.
TrimTabs Donoghue Forlines Risk Managed Innovation ETF
PERFORMANCE SUMMARY
January 31, 2021 (Unaudited)
Growth of a $10,000 Investment
| | Since |
| Cumulative Returns (as of January 31, 2021) | Inception(a) |
| TrimTabs Donoghue Forlines Risk Managed Innovation ETF – NAV | 5.20% |
| TrimTabs Donoghue Forlines Risk Managed Innovation ETF – Market | 5.49% |
| TrimTabs Donoghue Forlines Risk Managed | |
| Free Cash Flow Innovation Index | 5.31% |
Russell 1000® Total Return Index | 1.20% |
This chart assumes an initial gross investment of $10,000 made on December 7, 2020 (commencement of the Fund’s operations). Returns shown include the reinvestment of all dividends. Returns shown do not reflect the deductions of taxes that a shareholder would pay on Fund distributions or the redemption of Fund shares. Past performance is not predictive of future performance. Investment return and principal value will fluctuate so that your shares, when redeemed, may be worth more or less than original cost. Index returns do not reflect the effects of fees or expenses. It is not possible to invest directly in an index. The total operating expense ratio as stated in the fee table to the Fund’s prospectus dated November 16, 2020 is 0.69%. For performance information current to the most recent month-end, please call 1-800-617-0004.
(a) Commencement of operations on December 7, 2020.
TrimTabs ETF Trust
SHAREHOLDER EXPENSE EXAMPLES
For the Period Ended January 31, 2021 (Unaudited)
As a shareholder of a Fund you incur two types of costs: (1) transaction costs for purchasing and selling shares; and (2) ongoing costs, including management fees and other Fund expenses. The following examples are intended to help you understand your ongoing costs (in dollars and cents) of investing in the Fund and to compare these costs with the ongoing costs of investing in other funds.
Each example is based on an investment of $1,000 invested at the beginning of the period and held for the entire six-month period as indicated below.
Actual Expenses
The first line in the table below provides information about actual account values and actual expenses. You may use the information provided in this line, together with the amount you invested, to estimate the expenses that you paid over the period. Simply divide your account value by $1,000 (for example, an $8,600 ending account value divided by $1,000 = 8.6), then multiply the result by the number in the first line under the heading entitled “Expenses Paid During Period” to estimate the expenses you paid on your account during the period.
Hypothetical Example for Comparison Purposes
The second line in the table below provides information about hypothetical account values and hypothetical expenses based on the Fund’s actual expense ratio and an assumed rate of return of 5% per year before expenses, which is not the Fund’s actual return. The hypothetical account values and expenses may not be used to estimate the actual ending account balance or expenses you paid for the period. You may use this information to compare the ongoing costs of investing in a Fund and other funds. To do so, compare this 5% hypothetical example with the 5% hypothetical examples that appear in the shareholder reports of the other funds. Please note that the expenses shown in the table are meant to highlight your ongoing costs only and do not reflect any transactional cost, such as brokerage commissions paid on purchases and sales of Fund shares. Therefore, the second line in the table below is useful in comparing ongoing Fund costs only and will not help you determine the relative total costs of owning different funds. In addition, if these transactional costs were included, your costs would have been higher.
| | | | Expenses |
| | Beginning | Ending | Paid During |
| | Account | Account | Period |
| | Value | Value | 8/1/20 – |
| | 8/1/20 | 1/31/21 | 1/31/21(a) |
| TrimTabs U.S. Free Cash | | | |
| Flow Quality ETF | | | |
| Actual | $1,000.00 | $1,148.20 | $3.19 |
| Hypothetical (5% return | | | |
| before expenses) | $1,000.00 | $1,022.23 | $3.01 |
TrimTabs ETF Trust
SHAREHOLDER EXPENSE EXAMPLES
For the Period Ended January 31, 2021 (Unaudited) (Continued)
| | | | Expenses |
| | Beginning | Ending | Paid During |
| | Account | Account | Period |
| | Value | Value | 8/1/20 – |
| | 8/1/20 | 1/31/21 | 1/31/21(a) |
| TrimTabs International | | | |
| Free Cash Flow Quality ETF | | | |
| Actual | $1,000.00 | $1,212.60 | $3.29 |
| Hypothetical (5% return | | | |
| before expenses) | $1,000.00 | $1,022.23 | $3.01 |
| | | | |
| | | | Expenses |
| | Beginning | Ending | Paid During |
| | Account | Account | Period |
| | Value | Value | 12/7/20 – |
| | 12/7/20 | 1/31/21 | 1/31/21(b) |
| TrimTabs Donoghue Forlines | | | |
| Tactical High Yield ETF | | | |
Actual(b) | $1,000.00 | $1,006.60 | $1.04 |
| Hypothetical (5% return | | | |
before expenses)(c) | $1,000.00 | $1,021.72 | $3.52 |
| | | | |
| | | | Expenses |
| | Beginning | Ending | Paid During |
| | Account | Account | Period |
| | Value | Value | 12/7/20 – |
| | 12/7/20 | 1/31/21 | 1/31/21(b) |
| TrimTabs Donoghue Forlines | | | |
| Risk Managed Innovation ETF | | | |
Actual(b) | $1,000.00 | $1,052.00 | $1.07 |
| Hypothetical (5% return | | | |
before expenses)(c) | $1,000.00 | $1,021.73 | $3.52 |
(a) | Actual Expenses Paid are equal to the Fund’s annualized expense ratio of 0.59%, multiplied by the average account value over the period, multiplied by 184/365 to reflect the period. |
(b) | Actual Expenses Paid are equal to the Fund’s annualized expense ratio of 0.69%, multiplied by the average account value over the period, multiplied by 55/365 to reflect the period. |
(c) | Hypothetical Expenses Paid are equal to the Fund’s annualized expense ratio of 0.69%, multiplied by the average account value over the period, multiplied by 184/365 to reflect the period. |
TrimTabs ETF Trust
PORTFOLIO HOLDINGS ALLOCATION (as a % of net assets)
January 31, 2021 (Unaudited)
| TrimTabs U.S. Free Cash Flow Quality ETF | | | |
| Communications | | | 5.7 | % |
| Consumer Discretionary | | | 14.8 | % |
| Consumer Staples | | | 7.7 | % |
| Energy | | | 2.0 | % |
| Financials | | | 10.1 | % |
| Health Care | | | 11.1 | % |
| Industrials | | | 10.9 | % |
| Materials | | | 2.7 | % |
| Technology | | | 34.6 | %(b) |
| Short-Term Investments | | | 0.4 | % |
| Other Assets in Excess of Liabilities | | | 0.0 | %(a) |
| Total Net Assets | | | 100.0 | % |
| | | | | |
| TrimTabs International Free Cash Flow Quality ETF | | | | |
| Australia | | | 6.2 | % |
| Canada | | | 7.9 | % |
| China | | | 4.5 | % |
| Denmark | | | 2.9 | % |
| Finland | | | 1.2 | % |
| France | | | 5.1 | % |
| Germany | | | 6.2 | % |
| Hong Kong | | | 0.8 | % |
| India | | | 0.3 | % |
| Ireland | | | 1.8 | % |
| Israel | | | 2.9 | % |
| Japan | | | 16.8 | % |
| Netherlands | | | 2.0 | % |
| New Zealand | | | 0.3 | % |
| Norway | | | 3.2 | % |
| Republic of Korea | | | 6.1 | % |
| Spain | | | 0.5 | % |
| Sweden | | | 3.7 | % |
| Switzerland | | | 11.9 | % |
| United Kingdom | | | 11.2 | % |
| Other Countries | | | 4.0 | % |
| Short-Term Investments | | | 0.4 | % |
| Other Assets in Excess of Liabilities | | | 0.1 | % |
| Total Net Assets | | | 100.0 | % |
(a) | Less than 0.05%. |
(b) | Amount represents investments in a particular sector. No industry within this sector represented more than 25% of the Fund’s total assets at the time of investment. |
TrimTabs ETF Trust
PORTFOLIO HOLDINGS ALLOCATION (as a % of net assets)
January 31, 2021 (Unaudited) (Continued)
| TrimTabs Donoghue Forlines Tactical High Yield ETF | | | |
| Exchange Traded Funds | | | 99.8 | % |
| Short-Term Investments | | | 0.2 | % |
| Liabilities in Excess of Other Assets | | | 0.0 | %(a) |
| Total Net Assets | | | 100.0 | % |
| | | | | |
| | | | | |
| TrimTabs Donoghue Forlines Risk Managed Innovation ETF | | | | |
| Communications | | | 6.7 | % |
| Consumer Discretionary | | | 9.3 | % |
| Energy | | | 0.8 | % |
| Health Care | | | 20.8 | % |
| Industrials | | | 4.3 | % |
| Technology | | | 57.6 | % |
| Short-Term Investments | | | 0.5 | % |
| Liabilities in Excess of Other Assets | | | 0.0 | %(a) |
| Total Net Assets | | | 100.0 | % |
TrimTabs U.S. Free Cash Flow Quality ETF
SCHEDULE OF INVESTMENTS
January 31, 2021 (Unaudited)
| | | Shares | | | Value | |
| COMMON STOCKS – 99.6% | | | | | | |
| | | | | | | |
| Communications – 5.7% | | | | | | |
| Activision Blizzard, Inc. | | | 12,980 | | | $ | 1,181,180 | |
| Alphabet, Inc. – Class A (a) | | | 1,155 | | | | 2,110,601 | |
| Booking Holdings, Inc. (a) | | | 857 | | | | 1,666,291 | |
| Facebook, Inc. – Class A (a) | | | 12,150 | | | | 3,138,710 | |
| Take-Two Interactive Software, Inc. (a) | | | 2,162 | | | | 433,373 | |
| Zillow Group, Inc. – Class C (a) | | | 14,815 | | | | 1,932,765 | |
| | | | | | | | 10,462,920 | |
| Consumer Discretionary – 14.8% | | | | | | | | |
| Amazon.com, Inc. (a) | | | 1,244 | | | | 3,988,513 | |
| AutoNation, Inc. (a) | | | 30,011 | | | | 2,139,184 | |
| Best Buy Co., Inc. | | | 3,627 | | | | 394,690 | |
| Etsy, Inc. (a) | | | 9,983 | | | | 1,987,515 | |
| Lennar Corp. – Class A | | | 22,559 | | | | 1,875,781 | |
| Lowe’s Cos., Inc. | | | 10,415 | | | | 1,737,743 | |
| Lululemon Athletica, Inc. (a) | | | 4,879 | | | | 1,603,630 | |
| Marriott International, Inc. | | | 19,117 | | | | 2,223,498 | |
| NIKE, Inc. – Class B | | | 19,606 | | | | 2,619,165 | |
| Peloton Interactive, Inc. – Class A (a) | | | 3,463 | | | | 506,048 | |
| Starbucks Corp. | | | 20,613 | | | | 1,995,544 | |
| The Home Depot, Inc. | | | 6,551 | | | | 1,774,142 | |
| The TJX Companies, Inc. | | | 10,419 | | | | 667,233 | |
| Thor Industries, Inc. | | | 13,814 | | | | 1,671,632 | |
| Yum China Holdings, Inc. | | | 37,425 | | | | 2,122,372 | |
| | | | | | | | 27,306,690 | |
| Consumer Staples – 7.7% | | | | | | | | |
| Colgate-Palmolive Co. | | | 20,004 | | | | 1,560,312 | |
| Costco Wholesale Corp. | | | 4,986 | | | | 1,757,216 | |
| Monster Beverage Corp. (a) | | | 23,525 | | | | 2,042,676 | |
| Target Corp. | | | 3,751 | | | | 679,569 | |
| The Boston Beer Co., Inc. – Class A (a) | | | 1,493 | | | | 1,368,917 | |
| The Clorox Co. | | | 6,723 | | | | 1,408,200 | |
| The Estee Lauder Companies, Inc. | | | 7,810 | | | | 1,848,236 | |
| The Hershey Co. | | | 9,500 | | | | 1,381,680 | |
| Walmart, Inc. | | | 15,419 | | | | 2,166,215 | |
| | | | | | | | 14,213,021 | |
The accompanying notes are an integral part of these financial statements.
TrimTabs U.S. Free Cash Flow Quality ETF
SCHEDULE OF INVESTMENTS
January 31, 2021 (Unaudited) (Continued)
| | | Shares | | | Value | |
| COMMON STOCKS – 99.6% (Continued) | | | | | | |
| | | | | | | |
| Energy – 2.0% | | | | | | |
| Halliburton Co. | | | 107,164 | | | $ | 1,889,301 | |
| NOV, Inc. | | | 144,889 | | | | 1,793,726 | |
| | | | | | | | 3,683,027 | |
| Financials – 10.1% | | | | | | | | |
| Aon PLC | | | 4,351 | | | | 883,688 | |
| Berkshire Hathaway, Inc. – Class B (a) | | | 11,589 | | | | 2,640,786 | |
| Discover Financial Services | | | 4,500 | | | | 375,930 | |
| First Horizon National Corp. | | | 151,298 | | | | 2,101,529 | |
| JPMorgan Chase & Co. | | | 46,142 | | | | 5,937,091 | |
| Morgan Stanley | | | 62,566 | | | | 4,195,050 | |
| Synchrony Financial | | | 10,264 | | | | 345,384 | |
| T Rowe Price Group, Inc. | | | 2,927 | | | | 458,017 | |
| The Progressive Corp. | | | 20,473 | | | | 1,785,041 | |
| | | | | | | | 18,722,516 | |
| Health Care – 11.1% | | | | | | | | |
| Abbott Laboratories | | | 17,362 | | | | 2,145,769 | |
| AbbVie, Inc. | | | 20,164 | | | | 2,066,407 | |
| Alexion Pharmaceuticals, Inc. (a) | | | 3,343 | | | | 512,582 | |
| Amgen, Inc. | | | 3,916 | | | | 945,440 | |
| Edwards Lifesciences Corp. (a) | | | 19,310 | | | | 1,594,620 | |
| Humana, Inc. | | | 4,860 | | | | 1,861,915 | |
| Illumina, Inc. (a) | | | 4,430 | | | | 1,889,129 | |
| Intuitive Surgical, Inc. (a) | | | 2,695 | | | | 2,014,890 | |
| McKesson Corp. | | | 10,393 | | | | 1,813,267 | |
| UnitedHealth Group, Inc. | | | 6,918 | | | | 2,307,706 | |
| Vertex Pharmaceuticals, Inc. (a) | | | 5,039 | | | | 1,154,334 | |
| Zoetis, Inc. | | | 14,599 | | | | 2,251,896 | |
| | | | | | | | 20,557,955 | |
| Industrials – 10.9% | | | | | | | | |
| Illinois Tool Works, Inc. | | | 2,932 | | | | 569,424 | |
| Keysight Technologies, Inc. (a) | | | 15,450 | | | | 2,187,565 | |
| Norfolk Southern Corp. | | | 8,435 | | | | 1,995,890 | |
| Old Dominion Freight Line, Inc. | | | 13,125 | | | | 2,546,250 | |
| Proto Labs, Inc. (a) | | | 13,230 | | | | 2,802,114 | |
The accompanying notes are an integral part of these financial statements.
TrimTabs U.S. Free Cash Flow Quality ETF
SCHEDULE OF INVESTMENTS
January 31, 2021 (Unaudited) (Continued)
| | | Shares | | | Value | |
| COMMON STOCKS – 99.6% (Continued) | | | | | | |
| | | | | | | |
| Industrials – 10.9% (Continued) | | | | | | |
| Rockwell Automation, Inc. | | | 8,005 | | | $ | 1,989,483 | |
| Rollins, Inc. | | | 9,159 | | | | 329,907 | |
| Stanley Black & Decker, Inc. | | | 9,509 | | | | 1,649,716 | |
| Trane Technologies PLC | | | 15,608 | | | | 2,237,407 | |
| United Parcel Service, Inc. – Class B | | | 10,073 | | | | 1,561,315 | |
| United Rentals, Inc. (a) | | | 9,625 | | | | 2,338,971 | |
| | | | | | | | 20,208,042 | |
| Materials – 2.7% | | | | | | | | |
| Dow, Inc. | | | 8,785 | | | | 455,942 | |
| Louisiana-Pacific Corp. | | | 64,524 | | | | 2,452,557 | |
| Newmont Corp. | | | 24,939 | | | | 1,486,364 | |
| The Sherwin-Williams Co. | | | 920 | | | | 636,456 | |
| | | | | | | | 5,031,319 | |
| Technology – 34.6% (c) | | | | | | | | |
| Accenture PLC – Class A | | | 9,108 | | | | 2,203,407 | |
| Adobe, Inc. (a) | | | 2,600 | | | | 1,192,802 | |
| Advanced Micro Devices, Inc. (a) | | | 24,743 | | | | 2,118,990 | |
| ANSYS, Inc. (a) | | | 6,828 | | | | 2,419,638 | |
| Apple, Inc. | | | 43,536 | | | | 5,745,011 | |
| Atlassian Corp PLC – Class A (a) | | | 2,090 | | | | 483,062 | |
| Autodesk, Inc. (a) | | | 2,297 | | | | 637,257 | |
| Broadcom, Inc. | | | 2,502 | | | | 1,127,151 | |
| Cadence Design Systems, Inc. (a) | | | 15,735 | | | | 2,051,687 | |
| Cisco Systems, Inc. | | | 23,518 | | | | 1,048,432 | |
| Cognizant Technology Solutions Corp. | | | 6,727 | | | | 524,370 | |
| CoStar Group, Inc. (a) | | | 2,491 | | | | 2,241,178 | |
| Crowdstrike Holdings, Inc. – Class A (a) | | | 2,657 | | | | 573,381 | |
| FleetCor Technologies, Inc. (a) | | | 6,851 | | | | 1,663,080 | |
| FLIR Systems, Inc. | | | 38,421 | | | | 1,999,813 | |
| Fortinet, Inc. (a) | | | 3,011 | | | | 435,842 | |
| HP, Inc. | | | 88,635 | | | | 2,157,376 | |
| International Business Machines Corp. | | | 6,326 | | | | 753,490 | |
| Intuit, Inc. | | | 2,195 | | | | 792,900 | |
| Jack Henry & Associates, Inc. | | | 7,899 | | | | 1,143,696 | |
| KLA Corp. | | | 1,575 | | | | 441,110 | |
The accompanying notes are an integral part of these financial statements.
TrimTabs U.S. Free Cash Flow Quality ETF
SCHEDULE OF INVESTMENTS
January 31, 2021 (Unaudited) (Continued)
| | | Shares | | | Value | |
| COMMON STOCKS – 99.6% (Continued) | | | | | | |
| | | | | | | |
| Technology – 34.6% (c) (Continued) | | | | | | |
| Leidos Holdings, Inc. | | | 15,433 | | | $ | 1,636,824 | |
| MarketAxess Holdings, Inc. | | | 1,630 | | | | 881,439 | |
| Mastercard, Inc. – Class A | | | 5,545 | | | | 1,753,828 | |
| Maxim Integrated Products, Inc. | | | 24,501 | | | | 2,148,983 | |
| Microsoft Corp. | | | 19,832 | | | | 4,600,231 | |
| Moody’s Corp. | | | 4,421 | | | | 1,177,135 | |
| Morningstar, Inc. | | | 4,227 | | | | 971,745 | |
| MSCI, Inc. | | | 3,135 | | | | 1,239,265 | |
| NVIDIA Corp. | | | 4,963 | | | | 2,578,725 | |
| Palo Alto Networks, Inc. (a) | | | 6,035 | | | | 2,116,776 | |
| S&P Global, Inc. | | | 3,581 | | | | 1,135,177 | |
| ServiceNow, Inc. (a) | | | 3,626 | | | | 1,969,498 | |
| Teradyne, Inc. | | | 15,076 | | | | 1,710,824 | |
| Texas Instruments, Inc. | | | 13,324 | | | | 2,207,654 | |
| Veeva Systems, Inc. – Class A (a) | | | 1,662 | | | | 459,443 | |
| Visa, Inc. – Class A | | | 13,112 | | | | 2,533,894 | |
| Workday, Inc. – Class A (a) | | | 7,615 | | | | 1,732,641 | |
| Xilinx, Inc. | | | 3,377 | | | | 440,935 | |
| Zebra Technologies Corp. (a) | | | 857 | | | | 332,370 | |
| Zoom Video Communications, Inc. – Class A (a) | | | 1,551 | | | | 577,081 | |
| | | | | | | | 63,958,141 | |
| TOTAL COMMON STOCKS | | | | | | | | |
| (Cost $153,633,844) | | | | | | | 184,143,631 | |
The accompanying notes are an integral part of these financial statements.
TrimTabs U.S. Free Cash Flow Quality ETF
SCHEDULE OF INVESTMENTS
January 31, 2021 (Unaudited) (Continued)
| | | Shares | | | Value | |
| SHORT-TERM INVESTMENTS – 0.4% | | | | | | |
| | | | | | | |
| Money Market Funds – 0.4% | | | | | | |
| Fidelity Institutional Money Market Funds – | | | | | | |
| Government Portfolio, Institutional Class, 0.010% (b) | | | 685,298 | | | $ | 685,298 | |
| TOTAL SHORT-TERM INVESTMENTS | | | | | | | | |
| (Cost $685,298) | | | | | | | 685,298 | |
| | | | | | | | | |
| Total Investments (Cost $154,319,142) – 100.0% | | | | | | | 184,828,929 | |
| Other Assets in Excess of Liabilities – 0.0% (d) | | | | | | | 59,714 | |
| TOTAL NET ASSETS – 100.0% | | | | | | $ | 184,888,643 | |
Percentages are stated as a percent of net assets.
| (a) | Non-income producing security. |
| (b) | Rate disclosed is the seven day yield as of January 31, 2021. |
| (c) | Amount represents investments in a particular sector. No industry within this sector represented more than 25% of the Fund’s total assets at the time of investment. |
| (d) | Less than 0.05%. |
For Fund compliance purposes, the Fund’s sector classifications refers to any one or more of the sector classifications used by one or more widely recognized market indexes or ratings group indexes, and/or they may be defined by Fund management. This definition does not apply for all purposes of this report, which may combine sub-classifications for reporting ease.
The accompanying notes are an integral part of these financial statements.
TrimTabs International Free Cash Flow Quality ETF
SCHEDULE OF INVESTMENTS
January 31, 2021 (Unaudited)
| | | Shares | | | Value | |
| COMMON STOCKS – 91.8% | | | | | | |
| | | | | | | |
| Communications – 5.3% | | | | | | |
| Capcom Co. Ltd. | | | 2,596 | | | $ | 163,327 | |
| Kakaku.com, Inc. | | | 5,361 | | | | 155,080 | |
| Rightmove PLC (a) | | | 19,207 | | | | 157,688 | |
| Tencent Holdings Ltd. | | | 2,620 | | | | 230,294 | |
| | | | | | | | 706,389 | |
| Consumer Discretionary – 14.0% | | | | | | | | |
| Daimler AG | | | 2,724 | | | | 192,128 | |
| Domino’s Pizza Enterprises Ltd. | | | 2,501 | | | | 175,886 | |
| Dufry AG (a) | | | 3,019 | | | | 162,956 | |
| Evolution Gaming Group AB (b) | | | 622 | | | | 60,709 | |
| Geberit AG | | | 81 | | | | 49,614 | |
| Hennes & Mauritz AB – Class B (a) | | | 7,135 | | | | 152,839 | |
| Howden Joinery Group PLC (a) | | | 17,214 | | | | 158,496 | |
| Industria de Diseno Textil SA | | | 2,055 | | | | 61,074 | |
| Lululemon Athletica, Inc. (a) | | | 374 | | | | 122,926 | |
| Next PLC (a) | | | 863 | | | | 91,402 | |
| Puma SE (a) | | | 1,772 | | | | 173,710 | |
| Rakuten, Inc. (a) | | | 13,300 | | | | 130,657 | |
| Vipshop Holdings Ltd. – ADR (a) | | | 971 | | | | 26,625 | |
| Yum China Holdings, Inc. | | | 2,846 | | | | 161,397 | |
| ZOZO, Inc. | | | 5,500 | | | | 154,007 | |
| | | | | | | | 1,874,426 | |
| Consumer Staples – 6.3% | | | | | | | | |
| Alimentation Couche-Tard, Inc. – Class B | | | 3,966 | | | | 120,957 | |
| Diageo PLC | | | 4,336 | | | | 175,198 | |
| Kao Corp. | | | 1,500 | | | | 108,793 | |
| L’Oreal SA | | | 459 | | | | 161,591 | |
| Reckitt Benckiser Group PLC | | | 1,340 | | | | 113,795 | |
| Strauss Group Ltd. | | | 4,487 | | | | 127,829 | |
| Swedish Match AB | | | 506 | | | | 39,117 | |
| | | | | | | | 847,280 | |
| Energy – 3.9% | | | | | | | | |
| Neste Oyj | | | 2,217 | | | | 156,798 | |
| Vestas Wind Systems A/S | | | 876 | | | | 190,677 | |
| Woodside Petroleum Ltd. | | | 9,547 | | | | 178,541 | |
| | | | | | | | 526,016 | |
The accompanying notes are an integral part of these financial statements.
TrimTabs International Free Cash Flow Quality ETF
SCHEDULE OF INVESTMENTS
January 31, 2021 (Unaudited) (Continued)
| | | Shares | | | Value | |
| COMMON STOCKS – 91.8% (Continued) | | | | | | |
| | | | | | | |
| Financials – 11.7% | | | | | | |
| BNP Paribas SA (a) | | | 4,564 | | | $ | 220,327 | |
| DNB ASA (a) | | | 12,644 | | | | 247,919 | |
| Hong Kong Exchanges & Clearing Ltd. | | | 1,602 | | | | 102,774 | |
| Partners Group Holding AG | | | 119 | | | | 140,876 | |
| Royal Bank of Canada | | | 3,086 | | | | 249,565 | |
| Tokio Marine Holdings, Inc. | | | 2,437 | | | | 119,425 | |
| UBS Group AG | | | 21,649 | | | | 311,529 | |
| Zurich Insurance Group AG | | | 439 | | | | 175,551 | |
| | | | | | | | 1,567,966 | |
| Health Care – 6.8% | | | | | | | | |
| Coloplast A/S – Class B | | | 289 | | | | 43,261 | |
| CSL Ltd. | | | 353 | | | | 73,305 | |
| ICON PLC (a) | | | 868 | | | | 176,907 | |
| Novartis AG | | | 1,948 | | | | 176,113 | |
| Novo Nordisk A/S – Class B | | | 2,122 | | | | 147,293 | |
| Roche Holding AG | | | 583 | | | | 201,031 | |
| Shionogi & Co. Ltd. | | | 1,800 | | | | 97,608 | |
| | | | | | | | 915,518 | |
| Industrials – 19.8% | | | | | | | | |
| Ashtead Group PLC | | | 4,386 | | | | 221,929 | |
| Atlas Copco AB – Class A | | | 1,115 | | | | 60,765 | |
| CAE, Inc. | | | 6,383 | | | | 144,207 | |
| Canadian Pacific Railway Ltd. | | | 577 | | | | 193,999 | |
| Daikin Industries Ltd. | | | 700 | | | | 147,726 | |
| Deutsche Post AG | | | 1,659 | | | | 82,162 | |
| Ferguson PLC | | | 563 | | | | 65,584 | |
| GEA Group AG | | | 4,065 | | | | 140,790 | |
| Halma PLC | | | 2,610 | | | | 88,293 | |
| Husqvarna AB – Class B | | | 14,778 | | | | 183,304 | |
| Keyence Corp. | | | 300 | | | | 160,791 | |
| Legrand SA | | | 1,583 | | | | 145,807 | |
| Omron Corp. | | | 1,821 | | | | 160,638 | |
| Recruit Holdings Co. Ltd. | | | 3,775 | | | | 163,693 | |
| Schindler Holding AG | | | 139 | | | | 36,749 | |
| SGS SA | | | 17 | | | | 51,701 | |
The accompanying notes are an integral part of these financial statements.
TrimTabs International Free Cash Flow Quality ETF
SCHEDULE OF INVESTMENTS
January 31, 2021 (Unaudited) (Continued)
| | | Shares | | | Value | |
| COMMON STOCKS – 91.8% (Continued) | | | | | | |
| | | | | | | |
| Industrials – 19.8% (Continued) | | | | | | |
| Siemens AG | | | 1,566 | | | $ | 243,139 | |
| TOMRA Systems ASA | | | 4,006 | | | | 184,737 | |
| The Weir Group PLC (a) | | | 6,806 | | | | 176,713 | |
| | | | | | | | 2,652,727 | |
| Materials – 3.6% | | | | | | | | |
| Fortescue Metals Group Ltd. | | | 13,793 | | | | 229,695 | |
| Sika AG | | | 303 | | | | 82,455 | |
| West Fraser Timber Co. Ltd. | | | 2,732 | | | | 175,062 | |
| | | | | | | | 487,212 | |
| Real Estate – 1.3% | | | | | | | | |
| Goodman Group (c) | | | 12,656 | | | | 171,007 | |
| | | | | | | | | |
| Technology – 19.1% | | | | | | | | |
| ASML Holding NV | | | 401 | | | | 213,851 | |
| Atlassian Corp PLC – Class A (a) | | | 718 | | | | 165,951 | |
| Check Point Software Technologies Ltd. (a) | | | 392 | | | | 50,074 | |
| Constellation Software, Inc. | | | 46 | | | | 56,038 | |
| Dassault Systemes SE | | | 793 | | | | 158,546 | |
| Experian PLC | | | 1,965 | | | | 68,816 | |
| Infosys Ltd. – ADR | | | 2,541 | | | | 42,892 | |
| Logitech International SA | | | 1,534 | | | | 159,918 | |
| Nice Ltd. – ADR (a) | | | 828 | | | | 216,340 | |
| Nintendo Co. Ltd. | | | 300 | | | | 173,507 | |
| Nomura Research Institute Ltd. | | | 5,412 | | | | 182,648 | |
| RELX PLC | | | 3,348 | | | | 83,144 | |
| Samsung Electronics Co. Ltd. – GDR (d) | | | 173 | | | | 318,320 | |
| SCSK Corp. | | | 2,238 | | | | 124,351 | |
| Taiwan Semiconductor Manufacturing Co. Ltd. – ADR | | | 1,541 | | | | 187,262 | |
| Temenos AG | | | 337 | | | | 42,695 | |
| Tokyo Electron Ltd. | | | 565 | | | | 214,737 | |
| Wolters Kluwer NV | | | 637 | | | | 52,906 | |
| Xero Ltd. (a) | | | 387 | | | | 38,417 | |
| | | | | | | | 2,550,413 | |
| TOTAL COMMON STOCKS | | | | | | | | |
| (Cost $9,366,442) | | | | | | | 12,298,954 | |
The accompanying notes are an integral part of these financial statements.
TrimTabs International Free Cash Flow Quality ETF
SCHEDULE OF INVESTMENTS
January 31, 2021 (Unaudited) (Continued)
| | | Shares | | | Value | |
| EXCHANGE TRADED FUNDS – 7.7% | | | | | | |
| iShares MSCI Europe Financials ETF | | | 31,495 | | | $ | 529,746 | |
| iShares MSCI South Korea ETF | | | 5,687 | | | | 501,025 | |
| TOTAL EXCHANGE TRADED FUNDS | | | | | | | | |
| (Cost $907,518) | | | | | | | 1,030,771 | |
| | | | | | | | | |
| SHORT-TERM INVESTMENTS – 0.4% | | | | | | | | |
| | | | | | | | | |
| Money Market Funds – 0.4% | | | | | | | | |
| Fidelity Institutional Money Market Funds – | | | | | | | | |
| Government Portfolio, Institutional Class, 0.010% (e) | | | 45,143 | | | | 45,143 | |
| TOTAL SHORT-TERM INVESTMENTS | | | | | | | | |
| (Cost $45,143) | | | | | | | 45,143 | |
| | | | | | | | | |
| Total Investments (Cost $10,319,103) – 99.9% | | | | | | | 13,374,868 | |
| Other Assets in Excess of Liabilities – 0.1% | | | | | | | 19,826 | |
| TOTAL NET ASSETS – 100.0% | | | | | | $ | 13,394,694 | |
Percentages are stated as a percent of net assets.
ADR – American Depositary Receipt
GDR – Global Depositary Receipt
PLC – Public Limited Company
| (a) | Non-income producing security. |
| (b) | Security exempt from registration under Rule 144(a) and Regulation S of the Securities Act of 1933. Such securities are treated as liquid according to the Fund’s liquidity guidelines. At January 31, 2021, the value of this security amounted to $60,709 or 0.5% of net assets. |
| (c) | Real Estate Investment Trust. |
| (d) | Security exempt from registration under Regulation S of the Securities Act of 1933. Such securities are treated as liquid according to the Fund’s liquidity guidelines. At January 31, 2021, the value of this security amounted to $318,320 or 2.4% of net assets. |
| (e) | Rate disclosed is the seven day yield as of January 31, 2021. |
For Fund compliance purposes, the Fund’s sector classifications refers to any one or more of the sector classifications used by one or more widely recognized market indexes or ratings group indexes, and/or they may be defined by Fund management. This definition does not apply for all purposes of this report, which may combine sub-classifications for reporting ease.
The accompanying notes are an integral part of these financial statements.
TrimTabs Donoghue Forlines Tactical High Yield ETF
SCHEDULE OF INVESTMENTS
January 31, 2021 (Unaudited)
| | | Shares | | | Value | |
| EXCHANGE TRADED FUNDS – 99.8% | | | | | | |
| iShares 0-5 Year High Yield Corporate Bond ETF | | | 189,296 | | | $ | 8,588,360 | |
| iShares Broad USD High Yield Corporate Bond ETF | | | 278,426 | | | | 11,462,798 | |
| iShares iBoxx High Yield Corporate Bond ETF | | | 207,819 | | | | 18,074,019 | |
| SPDR Bloomberg Barclays High Yield Bond ETF | | | 102,772 | | | | 11,140,485 | |
| SPDR Bloomberg Barclays | | | | | | | | |
| Short Term High Yield Bond ETF | | | 223,783 | | | | 6,037,665 | |
| VanEck Vectors Fallen Angel High Yield Bond ETF | | | 214,231 | | | | 6,870,388 | |
| Xtrackers USD High Yield Corporate Bond ETF | | | 296,728 | | | | 14,806,727 | |
| TOTAL EXCHANGE TRADED FUNDS | | | | | | | | |
| (Cost $76,733,492) | | | | | | | 76,980,442 | |
| | | | | | | | | |
| SHORT-TERM INVESTMENTS – 0.2% | | | | | | | | |
| | | | | | | | | |
| Money Market Funds – 0.2% | | | | | | | | |
| Fidelity Institutional Money Market Funds – | | | | | | | | |
| Government Portfolio, Institutional Class – 0.010% (a) | | | 165,040 | | | | 165,040 | |
| TOTAL SHORT-TERM INVESTMENTS | | | | | | | | |
| (Cost $165,040) | | | | | | | 165,040 | |
| | | | | | | | | |
| Total Investments (Cost $76,898,532) – 100.0% | | | | | | | 77,145,482 | |
| Liabilities in Excess of Other Assets – (0.0%) (b) | | | | | | | (45,325 | ) |
| TOTAL NET ASSETS – 100.0% | | | | | | $ | 77,100,157 | |
Percentages are stated as a percent of net assets.
| (a) | Rate disclosed is the seven day yield as of January 31, 2021. |
| (b) | Less than 0.05%. |
The accompanying notes are an integral part of these financial statements.
TrimTabs Donoghue Forlines Risk Managed Innovation ETF
SCHEDULE OF INVESTMENTS
January 31, 2021 (Unaudited)
| | | Shares | | | Value | |
| COMMON STOCKS – 99.5% | | | | | | |
| | | | | | | |
| Communications – 6.7% | | | | | | |
| Electronic Arts, Inc. | | | 5,502 | | | $ | 787,886 | |
| GoDaddy, Inc. – Class A (a) | | | 8,777 | | | | 689,697 | |
| Sirius XM Holdings, Inc. | | | 129,428 | | | | 810,219 | |
| Spotify Technology SA (a) | | | 3,668 | | | | 1,155,420 | |
| Take-Two Interactive Software, Inc. (a) | | | 4,454 | | | | 892,804 | |
| Zillow Group, Inc. – Class C (a) | | | 5,764 | | | | 751,971 | |
| Zynga, Inc. (a) | | | 66,810 | | | | 662,087 | |
| | | | | | | | 5,750,084 | |
| Consumer Discretionary – 9.3% | | | | | | | | |
| Amazon.com, Inc. (a) | | | 871 | | | | 2,792,600 | |
| Brunswick Corp. | | | 6,812 | | | | 588,966 | |
| Etsy, Inc. (a) | | | 5,240 | | | | 1,043,232 | |
| Ford Motor Co. | | | 72,836 | | | | 766,963 | |
| Gentex Corp. | | | 12,969 | | | | 428,625 | |
| Peloton Interactive, Inc. – Class A (a) | | | 5,633 | | | | 823,150 | |
| Polaris Industries, Inc. | | | 5,633 | | | | 657,202 | |
| Whirlpool Corp. | | | 2,489 | | | | 460,689 | |
| YETI Holdings, Inc. (a) | | | 7,598 | | | | 500,100 | |
| | | | | | | | 8,061,527 | |
| Energy – 0.8% | | | | | | | | |
| Enphase Energy, Inc. (a) | | | 3,930 | | | | 716,635 | |
| | | | | | | | | |
| Health Care – 20.8% | | | | | | | | |
| AbbVie, Inc. | | | 14,541 | | | | 1,490,162 | |
| ABIOMED, Inc. (a) | | | 2,358 | | | | 821,173 | |
| Alexion Pharmaceuticals, Inc. (a) | | | 6,681 | | | | 1,024,398 | |
| Amgen, Inc. | | | 6,026 | | | | 1,454,857 | |
| Biogen, Inc. (a) | | | 3,799 | | | | 1,073,635 | |
| Blueprint Medicines Corp. (a) | | | 3,668 | | | | 354,879 | |
| Bristol-Myers Squibb Co. | | | 22,532 | | | | 1,384,141 | |
| Emergent BioSolutions, Inc. (a) | | | 3,668 | | | | 391,926 | |
| Exelixis, Inc. (a) | | | 27,510 | | | | 610,997 | |
| FibroGen, Inc. (a) | | | 6,288 | | | | 302,956 | |
| Gilead Sciences, Inc. | | | 19,126 | | | | 1,254,666 | |
| Illumina, Inc. (a) | | | 2,882 | | | | 1,229,000 | |
The accompanying notes are an integral part of these financial statements.
TrimTabs Donoghue Forlines Risk Managed Innovation ETF
SCHEDULE OF INVESTMENTS
January 31, 2021 (Unaudited) (Continued)
| | | Shares | | | Value | |
| COMMON STOCKS – 99.5% (Continued) | | | | | | |
| | | | | | | |
| Health Care – 20.8% (Continued) | | | | | | |
| Jazz Pharmaceuticals PLC (a) | | | 4,192 | | | $ | 651,856 | |
| Moderna, Inc. (a) | | | 5,502 | | | | 952,726 | |
| Neurocrine Biosciences, Inc. (a) | | | 6,419 | | | | 704,485 | |
| Novavax, Inc. (a) | | | 3,275 | | | | 723,579 | |
| Novocure Ltd. (a) | | | 4,061 | | | | 653,659 | |
| Seagen, Inc. (a) | | | 3,930 | | | | 645,581 | |
| United Therapeutics Corp. (a) | | | 3,799 | | | | 622,352 | |
| Varian Medical Systems, Inc. (a) | | | 3,013 | | | | 528,992 | |
| Vertex Pharmaceuticals, Inc. (a) | | | 4,585 | | | | 1,050,332 | |
| | | | | | | | 17,926,352 | |
| Industrials – 4.3% | | | | | | | | |
| A O Smith Corp. | | | 10,218 | | | | 554,837 | |
| AGCO Corp. | | | 4,454 | | | | 493,949 | |
| ITT, Inc. | | | 5,502 | | | | 411,054 | |
| Keysight Technologies, Inc. (a) | | | 6,812 | | | | 964,511 | |
| Lennox International, Inc. | | | 2,096 | | | | 577,427 | |
| Novanta, Inc. (a) | | | 2,489 | | | | 310,926 | |
| Vontier Corp. (a) | | | 11,397 | | | | 369,605 | |
| | | | | | | | 3,682,309 | |
| Technology – 57.6% | | | | | | | | |
| Accenture PLC – Class A | | | 5,371 | | | | 1,299,352 | |
| Adobe, Inc. (a) | | | 3,406 | | | | 1,562,571 | |
| Apple, Inc. | | | 26,331 | | | | 3,474,639 | |
| Arista Networks, Inc. (a) | | | 3,013 | | | | 926,678 | |
| Aspen Technology, Inc. (a) | | | 4,192 | | | | 561,309 | |
| Atlassian Corp. PLC – Class A (a) | | | 4,192 | | | | 968,897 | |
| Autodesk, Inc. (a) | | | 4,192 | | | | 1,162,987 | |
| Broadcom, Inc. | | | 3,799 | | | | 1,711,449 | |
| CDK Global, Inc. | | | 11,004 | | | | 549,100 | |
| Cerner Corp. | | | 10,480 | | | | 839,553 | |
| Cirrus Logic, Inc. (a) | | | 5,371 | | | | 503,209 | |
| Cisco Systems, Inc. | | | 35,370 | | | | 1,576,795 | |
| Citrix Systems, Inc. | | | 5,502 | | | | 733,472 | |
| Crowdstrike Holdings, Inc. – Class A (a) | | | 5,502 | | | | 1,187,332 | |
| Dell Technologies, Inc. – Class C (a) | | | 7,991 | | | | 582,464 | |
The accompanying notes are an integral part of these financial statements.
TrimTabs Donoghue Forlines Risk Managed Innovation ETF
SCHEDULE OF INVESTMENTS
January 31, 2021 (Unaudited) (Continued)
| | | Shares | | | Value | |
| COMMON STOCKS – 99.5% (Continued) | | | | | | |
| | | | | | | |
| Technology – 57.6% (b) (Continued) | | | | | | |
| DocuSign, Inc. (a) | | | 3,275 | | | $ | 762,715 | |
| Dropbox, Inc. – Class A (a) | | | 27,903 | | | | 631,445 | |
| F5 Networks, Inc. (a) | | | 4,061 | | | | 795,753 | |
| FactSet Research Systems, Inc. | | | 1,572 | | | | 475,279 | |
| Fair Isaac Corp. (a) | | | 1,572 | | | | 707,573 | |
| HP, Inc. | | | 30,130 | | | | 733,364 | |
| Inphi Corp. (a) | | | 3,930 | | | | 662,637 | |
| International Business Machines Corp. | | | 10,087 | | | | 1,201,463 | |
| Intuit, Inc. | | | 3,537 | | | | 1,277,670 | |
| Jack Henry & Associates, Inc. | | | 4,192 | | | | 606,960 | |
| KLA Corp. | | | 3,930 | | | | 1,100,675 | |
| Lattice Semiconductor Corp. (a) | | | 9,432 | | | | 378,318 | |
| Lumentum Holdings, Inc. (a) | | | 6,419 | | | | 602,102 | |
| Manhattan Associates, Inc. (a) | | | 5,633 | | | | 637,825 | |
| Maxim Integrated Products, Inc. | | | 9,039 | | | | 792,811 | |
| Microchip Technology, Inc. | | | 6,943 | | | | 945,012 | |
| Monolithic Power Systems, Inc. | | | 2,227 | | | | 791,231 | |
| Motorola Solutions, Inc. | | | 5,240 | | | | 877,962 | |
| MSCI, Inc. | | | 2,227 | | | | 880,333 | |
| NetApp, Inc. | | | 11,659 | | | | 774,624 | |
| NVIDIA Corp. | | | 917 | | | | 476,464 | |
| Palo Alto Networks, Inc. (a) | | | 3,144 | | | | 1,102,758 | |
| Paylocity Holding Corp. (a) | | | 3,275 | | | | 613,932 | |
| PayPal Holdings, Inc. (a) | | | 7,729 | | | | 1,810,982 | |
| Proofpoint, Inc. (a) | | | 5,240 | | | | 676,379 | |
| Pure Storage, Inc. (a) | | | 24,890 | | | | 575,706 | |
| Qorvo, Inc. (a) | | | 4,847 | | | | 828,255 | |
| QUALCOMM, Inc. | | | 3,144 | | | | 491,344 | |
| Qualys, Inc. (a) | | | 3,668 | | | | 507,908 | |
| salesforce.com, Inc. (a) | | | 1,572 | | | | 354,580 | |
| Semtech Corp. (a) | | | 4,454 | | | | 316,011 | |
| ServiceNow, Inc. (a) | | | 2,489 | | | | 1,351,925 | |
| Synopsys, Inc. (a) | | | 4,061 | | | | 1,037,382 | |
| Texas Instruments, Inc. | | | 2,489 | | | | 412,402 | |
| Tyler Technologies, Inc. (a) | | | 1,310 | | | | 553,855 | |
| Veeva Systems, Inc. – Class A (a) | | | 3,406 | | | | 941,555 | |
| VMware, Inc. – Class A (a) | | | 3,930 | | | | 541,750 | |
The accompanying notes are an integral part of these financial statements.
TrimTabs Donoghue Forlines Risk Managed Innovation ETF
SCHEDULE OF INVESTMENTS
January 31, 2021 (Unaudited) (Continued)
| | | Shares | | | Value | |
| COMMON STOCKS – 99.5% (Continued) | | | | | | |
| | | | | | | |
| Technology – 57.6% (b) (Continued) | | | | | | |
| Workday, Inc. – Class A (a) | | | 4,323 | | | $ | 983,612 | |
| Xilinx, Inc. | | | 6,943 | | | | 906,548 | |
| Zebra Technologies Corp. (a) | | | 2,227 | | | | 863,697 | |
| Zoom Video Communications, Inc. – Class A (a) | | | 2,620 | | | | 974,823 | |
| | | | | | | | 49,597,427 | |
| TOTAL COMMON STOCKS | | | | | | | | |
| (Cost $81,333,989) | | | | | | | 85,734,334 | |
| | | | | | | | | |
| SHORT-TERM INVESTMENTS – 0.5% | | | | | | | | |
| | | | | | | | | |
| Money Market Funds – 0.5% | | | | | | | | |
| Fidelity Institutional Money Market Funds – | | | | | | | | |
| Government Portfolio, Institutional Class, 0.010% (b) | | | 393,727 | | | | 393,727 | |
| TOTAL SHORT-TERM INVESTMENTS | | | | | | | | |
| (Cost $393,727) | | | | | | | 393,727 | |
| | | | | | | | | |
| Total Investments (Cost $81,727,716) – 100.0% | | | | | | | 86,128,061 | |
| Liabilities in Excess of Other Assets – (0.0%) (c) | | | | | | | (13,338 | ) |
| TOTAL NET ASSETS – 100.0% | | | | | | $ | 86,114,723 | |
Percentages are stated as a percent of net assets.
| (a) | Non-income producing security. |
| (b) | Rate disclosed is the seven day yield as of January 31, 2021. |
| (c) | Less than 0.05%. |
For Fund compliance purposes, the Fund’s sector classifications refers to any one or more of the sector classifications used by one or more widely recognized market indexes or ratings group indexes, and/or they may be defined by Fund management. This definition does not apply for all purposes of this report, which may combine sub-classifications for reporting ease.
The accompanying notes are an integral part of these financial statements.
TrimTabs ETF Trust
STATEMENTS OF ASSETS & LIABILITIES
January 31, 2021 (Unaudited)
| | | | | | | | | TrimTabs | | | TrimTabs | |
| | | TrimTabs | | | TrimTabs | | | Donoghue | | | Donoghue | |
| | | U.S. Free | | | International | | | Forlines | | | Forlines Risk | |
| | | Cash Flow | | | Free Cash Flow | | | Tactical High | | | Managed | |
| | | Quality ETF | | | Quality ETF | | | Yield ETF | | | Innovation ETF | |
| ASSETS | | | | | | | | | | | | |
| Investments in Securities, | | | | | | | | | | | | |
| at Value* | | $ | 184,828,929 | | | $ | 13,374,868 | | | $ | 77,145,482 | | | $ | 86,128,061 | |
| Receivable for Investment | | | | | | | | | | | | | | | | |
| Securities Sold | | | — | | | | — | | | | — | | | | 662,902 | |
| Interest and Dividends Receivable | | | 154,446 | | | | 26,757 | | | | 2 | | | | 41,189 | |
| Total Assets | | | 184,983,375 | | | | 13,401,625 | | | | 77,145,484 | | | | 86,832,152 | |
| | | | | | | | | | | | | | | | | |
| LIABILITIES | | | | | | | | | | | | | | | | |
| Management Fees Payable | | | 94,732 | | | | 6,931 | | | | 45,327 | | | | 52,741 | |
| Payable for Fund Shares Redeemed | | | — | | | | — | | | | — | | | | 664,688 | |
| Total Liabilities | | | 94,732 | | | | 6,931 | | | | 45,327 | | | | 717,429 | |
| NET ASSETS | | $ | 184,888,643 | | | $ | 13,394,694 | | | $ | 77,100,157 | | | $ | 86,114,723 | |
| | | | | | | | | | | | | | | | | |
| NET ASSETS CONSIST OF: | | | | | | | | | | | | | | | | |
| Paid-in Capital | | $ | 157,219,559 | | | $ | 11,121,784 | | | $ | 76,886,880 | | | $ | 81,384,160 | |
| Total Distributable Earnings | | | 27,669,084 | | | | 2,272,910 | | | | 213,277 | | | | 4,730,563 | |
| Net Assets | | $ | 184,888,643 | | | $ | 13,394,694 | | | $ | 77,100,157 | | | $ | 86,114,723 | |
| * Identified Cost: | | | | | | | | | | | | | | | | |
| Investments in Securities | | $ | 154,319,142 | | | $ | 10,319,103 | | | $ | 76,898,532 | | | $ | 81,727,716 | |
| | | | | | | | | | | | | | | | | |
| Net Asset Value (unlimited | | | | | | | | | | | | | | | | |
| shares authorized): | | | | | | | | | | | | | | | | |
| Net Assets | | $ | 184,888,643 | | | $ | 13,394,694 | | | $ | 77,100,157 | | | $ | 86,114,723 | |
| Shares Outstanding | | | | | | | | | | | | | | | | |
| (No Par Value) | | | 4,050,000 | | | | 425,000 | | | | 3,075,000 | | | | 3,275,000 | |
| Net Asset Value, Offering and | | | | | | | | | | | | | | | | |
| Redemption Price per Share | | $ | 45.65 | | | $ | 31.52 | | | $ | 25.07 | | | $ | 26.29 | |
The accompanying notes are an integral part of these financial statements.
TrimTabs ETF Trust
STATEMENTS OF OPERATIONS
Period Ended January 31, 2021 (Unaudited)
| | | | | | | | | TrimTabs | | | TrimTabs | |
| | | TrimTabs | | | TrimTabs | | | Donoghue | | | Donoghue | |
| | | U.S. Free | | | International | | | Forlines | | | Forlines Risk | |
| | | Cash Flow | | | Free Cash Flow | | | Tactical High | | | Managed | |
| | | Quality ETF | | | Quality ETF | | | Yield ETF(a) | | | Innovation ETF(a) | |
| INVESTMENT INCOME | | | | | | | | | | | | |
| Income: | | | | | | | | | | | | |
| Dividends (net of foreign | | | | | | | | | | | | |
| withholding tax of $0, | | | | | | | | | | | | |
| $6,934, $0, and | | | | | | | | | | | | |
| $0 respectively) | | $ | 975,932 | | | $ | 69,467 | | | $ | 310,545 | | | $ | 101,146 | |
| Interest | | | 63 | | | | 5 | | | | 6 | | | | 6 | |
| Total Investment Income | | | 975,995 | | | | 69,472 | | | | 310,551 | | | | 101,152 | |
| | | | | | | | | | | | | | | | | |
| Expenses: | | | | | | | | | | | | | | | | |
| Management Fees | | | 512,386 | | | | 37,073 | | | | 71,610 | | | | 82,973 | |
| Total Expenses | | | 512,386 | | | | 37,073 | | | | 71,610 | | | | 82,973 | |
| Net Investment Income | | | 463,609 | | | | 32,399 | | | | 238,941 | | | | 18,179 | |
| | | | | | | | | | | | | | | | | |
| REALIZED & UNREALIZED | | | | | | | | | | | | | | | | |
| GAIN (LOSS) | | | | | | | | | | | | | | | | |
| ON INVESTMENTS | | | | | | | | | | | | | | | | |
| Net Realized Gain on: | | | | | | | | | | | | | | | | |
| Investment Securities | | | 12,466,536 | | | | 1,179,463 | | | | 11,700 | | | | 330,052 | |
| Foreign Currencies | | | — | | | | 430 | | | | — | | | | — | |
| Total | | | 12,466,536 | | | | 1,179,893 | | | | 11,700 | | | | 330,052 | |
| Net Change in Unrealized | | | | | | | | | | | | | | | | |
| Appreciation of: | | | | | | | | | | | | | | | | |
| Investments Securities | | | 8,563,505 | | | | 1,151,970 | | | | 246,950 | | | | 4,400,345 | |
| Foreign Securities | | | — | | | | 472 | | | | — | | | | — | |
| Total | | | 8,563,505 | | | | 1,152,442 | | | | 246,950 | | | | 4,400,345 | |
| Net Realized and Unrealized | | | | | | | | | | | | | | | | |
| Gain on Investments and | | | | | | | | | | | | | | | | |
| Foreign Currencies | | | 21,030,041 | | | | 2,332,335 | | | | 258,650 | | | | 4,730,397 | |
| NET INCREASE IN NET | | | | | | | | | | | | | | | | |
| ASSETS RESULTING | | | | | | | | | | | | | | | | |
| FROM OPERATIONS | | $ | 21,493,650 | | | $ | 2,364,734 | | | $ | 497,591 | | | $ | 4,748,576 | |
(a) | Fund commenced operations on December 7, 2020. |
The accompanying notes are an integral part of these financial statements.
TrimTabs U.S. Free Cash Flow Quality ETF
STATEMENTS OF CHANGES IN NET ASSETS
| | | Six-Months Ended | | | | |
| | | January 31, 2021 | | | Year Ended | |
| | | (Unaudited) | | | July 31, 2020 | |
| OPERATIONS | | | | | | |
| Net Investment Income | | $ | 463,609 | | | $ | 784,368 | |
| Net Realized Gain (Loss) on Investments | | | 12,466,536 | | | | (4,729,815 | ) |
| Net Change in Unrealized Appreciation of Investments | | | 8,563,505 | | | | 9,605,380 | |
| Net Increase in Net Assets Resulting from Operations | | | 21,493,650 | | | | 5,659,933 | |
| | | | | | | | | |
| DISTRIBUTIONS TO SHAREHOLDERS | | | | | | | | |
| Dividends and Distributions | | | (757,531 | ) | | | (915,650 | ) |
| Total Distributions to Shareholders | | | (757,531 | ) | | | (915,650 | ) |
| | | | | | | | | |
| CAPITAL SHARE TRANSACTIONS | | | | | | | | |
| Proceeds from Shares Sold | | | 73,329,200 | | | | 8,485,742 | |
| Payments for Shares Redeemed | | | (17,967,808 | ) | | | (28,495,215 | ) |
| Net Increase (Decrease) in Net Assets Derived | | | | | | | | |
from Capital Share Transactions(a) | | | 55,361,392 | | | | (20,009,473 | ) |
| Net Increase in Net Assets | | | 76,097,511 | | | | (15,265,190 | ) |
| | | | | | | | | |
| NET ASSETS | | | | | | | | |
| Beginning of Period | | | 108,791,132 | | | | 124,056,322 | |
| End of Period | | $ | 184,888,643 | | | $ | 108,791,132 | |
(a) | Summary of capital share transactions is as follows: |
| | | | Shares | | | Shares | |
| | Subscriptions | | | 1,750,000 | | | | 250,000 | |
| | Redemptions | | | (425,000 | ) | | | (825,000 | ) |
| | Net Increase | | | 1,325,000 | | | | (575,000 | ) |
The accompanying notes are an integral part of these financial statements.
TrimTabs International Free Cash Flow Quality ETF
STATEMENTS OF CHANGES IN NET ASSETS
| | | Six-Months Ended | | | | |
| | | January 31, 2021 | | | Year Ended | |
| | | (Unaudited) | | | July 31, 2020 | |
| OPERATIONS | | | | | | |
| Net Investment Income | | $ | 32,399 | | | $ | 115,398 | |
| Net Realized Gain (Loss) on Investments | | | | | | | | |
| and Foreign Currencies | | | 1,179,893 | | | | (1,111,402 | ) |
| Change in Unrealized Appreciation of Investments | | | | | | | | |
| and Foreign Currencies | | | 1,152,442 | | | | 1,036,104 | |
| Net Increase in Net Assets Resulting from Operations | | | 2,364,734 | | | | 40,100 | |
| | | | | | | | | |
| DISTRIBUTIONS TO SHAREHOLDERS | | | | | | | | |
| Dividends and Distributions | | | (86,243 | ) | | | (244,461 | ) |
| Total Distributions to Shareholders | | | (86,243 | ) | | | (244,461 | ) |
| | | | | | | | | |
| CAPITAL SHARE TRANSACTIONS | | | | | | | | |
| Payments for Shares Redeemed | | | — | | | | (1,040,455 | ) |
| Net Increase (Decrease) in Net Assets Derived | | | | | | | | |
from Capital Share Transactions(a) | | | — | | | | (1,040,455 | ) |
| Net Increase (Decrease) in Net Assets | | | 2,278,491 | | | | (1,244,816 | ) |
| | | | | | | | | |
| NET ASSETS | | | | | | | | |
| Beginning of Period | | | 11,116,203 | | | | 12,361,019 | |
| End of Period | | $ | 13,394,694 | | | $ | 11,116,203 | |
(a) | Summary of capital share transactions is as follows: |
| | | | Shares | | | Shares | |
| | Redemptions | | | — | | | | (50,000 | ) |
| | Net Decrease | | | — | | | | (50,000 | ) |
The accompanying notes are an integral part of these financial statements.
TrimTabs Donoghue Forlines Tactical High Yield ETF
STATEMENT OF CHANGES IN NET ASSETS
| | | Period Ended | |
| | January 31, 2021(a) |
| | | (Unaudited) | |
| OPERATIONS | | | |
| Net Investment Income | | $ | 238,941 | |
| Net Realized Gain on Investments and Foreign Currencies | | | 11,700 | |
| Change in Unrealized Appreciation of Investments and Foreign Currencies | | | 246,950 | |
| Net Increase in Net Assets Resulting from Operations | | | 497,591 | |
| | | | | |
| DISTRIBUTIONS TO SHAREHOLDERS | | | | |
| Dividends and Distributions | | | (284,314 | ) |
| Total Distributions to Shareholders | | | (284,314 | ) |
| | | | | |
| CAPITAL SHARE TRANSACTIONS | | | | |
| Proceeds from Shares Sold | | | 76,886,880 | |
Net Increase in Net Assets Derived from Capital Share Transactions(b) | | | 76,886,880 | |
| Net Increase in Net Assets | | | 77,100,157 | |
| | | | | |
| NET ASSETS | | | | |
| Beginning of Period | | | — | |
| End of Period | | $ | 77,100,157 | |
(b) | Summary of capital share transactions is as follows: |
| | | | Shares | |
| | Subscriptions | | | 3,075,000 | |
| | Net Increase | | | 3,075,000 | |
(a) | Fund commenced operations on December 7, 2020. |
The accompanying notes are an integral part of these financial statements.
TrimTabs Donoghue Forlines Risk Managed Innovation ETF
STATEMENT OF CHANGES IN NET ASSETS
| | | Period Ended | |
| | January 31, 2021(a) |
| | | (Unaudited) | |
| OPERATIONS | | | |
| Net Investment Income | | $ | 18,179 | |
| Net Realized Gain on Investments and Foreign Currencies | | | 330,052 | |
| Change in Unrealized Appreciation of Investments and Foreign Currencies | | | 4,400,345 | |
| Net Increase in Net Assets Resulting from Operations | | | 4,748,576 | |
| | | | | |
| DISTRIBUTIONS TO SHAREHOLDERS | | | | |
| Dividends and Distributions | | | (18,013 | ) |
| Total Distributions to Shareholders | | | (18,013 | ) |
| | | | | |
| CAPITAL SHARE TRANSACTIONS | | | | |
| Proceeds from Shares Sold | | | 85,427,155 | |
| Payments for Shares Redeemed | | | (4,042,995 | ) |
Net Increase in Net Assets Derived from Capital Share Transactions(b) | | | 81,384,160 | |
| Net Increase in Net Assets | | | 86,114,723 | |
| | | | | |
| NET ASSETS | | | | |
| Beginning of Period | | | — | |
| End of Period | | $ | 86,114,723 | |
(b) | Summary of capital share transactions is as follows: |
| | | | Shares | |
| | Subscriptions | | | 3,425,000 | |
| | Redemptions | | | (150,000 | ) |
| | Net Increase | | | 3,275,000 | |
(a) | Fund commenced operations on December 7, 2020. |
The accompanying notes are an integral part of these financial statements.
TrimTabs U.S. Free Cash Flow Quality ETF
FINANCIAL HIGHLIGHTS
For a capital share outstanding throughout the period/year
| | | Six-Months | | | | | | | | | | | | | |
| | | Ended | | | Year | | | Year | | | Year | | | Period | |
| | | January 31, | | | Ended | | | Ended | | | Ended | | | Ended | |
| | | 2021 | | | July 31, | | | July 31, | | | July 31, | | | July 31, | |
| | | (Unaudited) | | | 2020 | | | 2019 | | | 2018 | | | 2017(a) | |
| Net Asset Value, | | | | | | | | | | | | | | | |
| Beginning of Period/Year | | $ | 39.92 | | | $ | 37.59 | | | $ | 36.41 | | | $ | 29.81 | | | $ | 25.00 | |
| | | | | | | | | | | | | | | | | | | | | |
| Income from Investment Operations: | | | | | | | | | | | | | | | | | | | | |
Net Investment Income(b) | | | 0.12 | | | | 0.25 | | | | 0.30 | | | | 0.21 | | | | 0.16 | |
| Net Realized and Unrealized | | | | | | | | | | | | | | | | | | | | |
| Gain on Investments | | | 6.80 | | | | 2.36 | | | | 1.07 | | | | 6.53 | | | | 4.70 | |
| Total from Investment Operations | | | 6.92 | | | | 2.61 | | | | 1.37 | | | | 6.74 | | | | 4.86 | |
| | | | | | | | | | | | | | | | | | | | | |
| Less Distributions: | | | | | | | | | | | | | | | | | | | | |
| From Net Investment Income | | | (0.19 | ) | | | (0.28 | ) | | | (0.19 | ) | | | (0.14 | ) | | | (0.05 | ) |
| Total Distributions | | | (0.19 | ) | | | (0.28 | ) | | | (0.19 | ) | | | (0.14 | ) | | | (0.05 | ) |
| Net Asset Value, End of Period/Year | | $ | 46.65 | | | $ | 39.92 | | | $ | 37.59 | | | $ | 36.41 | | | $ | 29.81 | |
| Total Return | | | 14.82 | %(c) | | | 6.97 | % | | | 3.89 | % | | | 22.62 | % | | | 19.47 | %(c) |
| | | | | | | | | | | | | | | | | | | | | |
| Supplemental Data: | | | | | | | | | | | | | | | | | | | | |
| Net Assets at End of Period/Year (000’s) | | $ | 184,889 | | | $ | 108,791 | | | $ | 124,056 | | | $ | 99,214 | | | $ | 27,574 | |
| | | | | | | | | | | | | | | | | | | | | |
| Ratios to Average Net Assets: | | | | | | | | | | | | | | | | | | | | |
| Expenses to Average Net Assets | | | 0.59 | %(d) | | | 0.59 | % | | | 0.59 | % | | | 0.59 | % | | | 0.59 | %(d) |
| Net Investment Income | | | | | | | | | | | | | | | | | | | | |
| to Average Net Assets | | | 0.53 | %(d) | | | 0.68 | % | | | 0.84 | % | | | 0.60 | % | | | 0.68 | %(d) |
Portfolio Turnover Rate(e) | | | 37 | %(c) | | | 83 | % | | | 49 | % | | | 42 | % | | | 63 | %(c) |
(a) | Commencement of operations on September 27, 2016. |
(b) | Calculated based on average shares outstanding during the period. |
(c) | Not annualized. |
(d) | Annualized. |
(e) | Excludes impact of in-kind transactions. |
The accompanying notes are an integral part of these financial statements.
TrimTabs International Free Cash Flow Quality ETF
FINANCIAL HIGHLIGHTS
For a capital share outstanding throughout the period/year
| | | Six-Months | | | | | | | | | | | | | |
| | | Ended | | | Year | | | Year | | | Year | | | Period | |
| | | January 31, | | | Ended | | | Ended | | | Ended | | | Ended | |
| | | 2021 | | | July 31, | | | July 31, | | | July 31, | | | July 31, | |
| | | (Unaudited) | | | 2020 | | | 2019 | | | 2018 | | | 2017(a) | |
| Net Asset Value, | | | | | | | | | | | | | | | |
| Beginning of Period/Year | | $ | 26.16 | | | $ | 26.02 | | | $ | 26.93 | | | $ | 25.48 | | | $ | 25.00 | |
| | | | | | | | | | | | | | | | | | | | | |
| Income from Investment Operations: | | | | | | | | | | | | | | | | | | | | |
Net Investment Income(b) | | | 0.08 | | | | 0.25 | | | | 0.37 | | | | 0.34 | | | | 0.01 | |
| Net Realized and Unrealized | | | | | | | | | | | | | | | | | | | | |
| Gain (Loss) on Investments | | | 5.48 | | | | 0.40 | | | | (1.08 | ) | | | 1.18 | | | | 0.47 | |
| Total from Investment Operations | | | 5.56 | | | | 0.65 | | | | (0.71 | ) | | | 1.52 | | | | 0.48 | |
| | | | | | | | | | | | | | | | | | | | | |
| Less Distributions: | | | | | | | | | | | | | | | | | | | | |
| From Net Investment Income | | | (0.20 | ) | | | (0.51 | ) | | | (0.20 | ) | | | (0.07 | ) | | | — | |
| Total Distributions | | | (0.20 | ) | | | (0.51 | ) | | | (0.20 | ) | | | (0.07 | ) | | | — | |
| Net Asset Value, End of Period/Year | | $ | 31.52 | | | $ | 26.16 | | | $ | 26.02 | | | $ | 26.93 | | | $ | 25.48 | |
| Total Return | | | 21.26 | %(c) | | | 2.42 | % | | | -2.47 | % | | | 5.97 | % | | | 1.92 | %(c) |
| | | | | | | | | | | | | | | | | | | | | |
| Supplemental Data: | | | | | | | | | | | | | | | | | | | | |
| Net Assets at End of Period/Year (000’s) | | $ | 13,395 | | | $ | 11,116 | | | $ | 12,361 | | | $ | 10,098 | | | $ | 3,822 | |
| | | | | | | | | | | | | | | | | | | | | |
| Ratios to Average Net Assets: | | | | | | | | | | | | | | | | | | | | |
| Expenses to Average Net Assets | | | 0.59 | %(d) | | | 0.59 | % | | | 0.59 | % | | | 0.59 | % | | | 0.59 | %(d) |
| Net Investment Income | | | | | | | | | | | | | | | | | | | | |
| to Average Net Assets | | | 0.52 | %(d) | | | 1.00 | % | | | 1.48 | % | | | 1.28 | % | | | 0.35 | %(d) |
Portfolio Turnover Rate(e) | | | 38 | %(c) | | | 45 | % | | | 43 | % | | | 83 | % | | | 0 | %(c) |
(a) | Commencement of operations on June 27, 2017. |
(b) | Calculated based on average shares outstanding during the period. |
(c) | Not annualized. |
(d) | Annualized. |
(e) | Excludes impact of in-kind transactions. |
The accompanying notes are an integral part of these financial statements.
TrimTabs Donoghue Forlines Tactical High Yield ETF
FINANCIAL HIGHLIGHTS
For a capital share outstanding throughout the period
| | | Period Ended | |
| | | January 31, 2021(a) | |
| | | (Unaudited) | |
| Net Asset Value, Beginning of Period | | $ | 25.00 | |
| | | | | |
| Income from Investment Operations: | | | | |
Net Investment Income(b) | | | 0.09 | |
| Net Realized and Unrealized Gain on Investments | | | 0.07 | |
| Total from Investment Operations | | | 0.16 | |
| | | | | |
| Less Distributions: | | | | |
| From Net Investment Income | | | (0.09 | ) |
| Total Distributions | | | (0.09 | ) |
| Net Asset Value, End of Period | | $ | 25.07 | |
| Total Return | | | 0.66 | %(c) |
| | | | | |
| Supplemental Data: | | | | |
| Net Assets at End of Period (000’s) | | $ | 77,100 | |
| | | | | |
| Ratios to Average Net Assets: | | | | |
| Expenses to Average Net Assets | | | 0.69 | %(d) |
| Net Investment Income to Average Net Assets | | | 2.30 | %(d) |
Portfolio Turnover Rate(e) | | | 4 | %(c) |
(a) | Commencement of operations on December 7, 2020. |
(b) | Calculated based on average shares outstanding during the period. |
(c) | Not annualized. |
(d) | Annualized. |
(e) | Excludes impact of in-kind transactions. |
The accompanying notes are an integral part of these financial statements.
TrimTabs Donoghue Forlines Risk Managed Innovation ETF
FINANCIAL HIGHLIGHTS
For a capital share outstanding throughout the period
| | | Period Ended | |
| | | January 31, 2021(a) | |
| | | (Unaudited) | |
| Net Asset Value, Beginning of Period | | $ | 25.00 | |
| | | | | |
| Income from Investment Operations: | | | | |
Net Investment Income(b) | | | 0.01 | |
| Net Realized and Unrealized Gain on Investments | | | 1.29 | |
| Total from Investment Operations | | | 1.30 | |
| | | | | |
| Less Distributions: | | | | |
| From Net Investment Income | | | (0.01 | ) |
| Total Distributions | | | (0.01 | ) |
| Net Asset Value, End of Period | | $ | 26.29 | |
| Total Return | | | 5.20 | %(c) |
| | | | | |
| Supplemental Data: | | | | |
| Net Assets at End of Period (000’s) | | $ | 86,115 | |
| | | | | |
| Ratios to Average Net Assets: | | | | |
| Expenses to Average Net Assets | | | 0.69 | %(d) |
| Net Investment Income to Average Net Assets | | | 0.15 | %(d) |
Portfolio Turnover Rate(e) | | | 0 | %(c) |
(a) | Commencement of operations on December 7, 2020. |
(b) | Calculated based on average shares outstanding during the period. |
(c) | Not annualized. |
(d) | Annualized. |
(e) | Excludes impact of in-kind transactions. |
The accompanying notes are an integral part of these financial statements.
TrimTabs ETF Trust
NOTES TO FINANCIAL STATEMENTS
January 31, 2021 (Unaudited)
1. ORGANIZATION
The TrimTabs U.S. Free Cash Flow Quality ETF (formerly known as the TrimTabs All Cap U.S. Free-Cash-Flow ETF) (“TTAC”), TrimTabs International Free Cash Flow Quality ETF (formerly known as the TrimTabs All Cap International Free-Cash-Flow ETF) (“TTAI”), TrimTabs Donoghue Forlines Tactical High Yield ETF (“DFHY”), and TrimTabs Donoghue Forlines Risk Managed Innovation ETF (“DFNV”) (each, a “Fund” and collectively, the “Funds”) are each a series of the TrimTabs ETF Trust (the “Trust”). The Trust was organized as a Delaware statutory trust on April 2, 2014. Each Fund is classified as a diversified, open-end management investment company registered under the Investment Company Act of 1940, as amended (the “1940 Act”). TTAC commenced operations on September 27, 2016 and that is the date the initial creation units were established. The Fund seeks to generate long-term returns in excess of the total return of the Russell 3000® Index (the “Russell Index”), with less volatility than the Russell Index. TTAI commenced operations on June 27, 2017 and that is the date the initial creation units were established. The Fund seeks to generate long-term returns in excess of the total return of the S&P Developed ex-U.S. BMI Index, with similar volatility to the S&P Developed ex-U.S. BMI Index. DFHY commenced operations on December 7, 2020 and that is the date the initial creation units were established. The Fund seeks to provide investment results that closely correspond, before fees and expenses, to the performance of the TrimTabs Donoghue Forlines Tactical High Yield Index. DFHY is a “fund of funds,” meaning it will invest its assets in other registered investment companies. DFNV commenced operations on December 7, 2020 and that is the date the initial creation units were established. The Fund seeks to provide investment results that closely correspond, before fees and expenses, to the performance of the TrimTabs Donoghue Forlines Risk Managed Free Cash Flow Innovation Index.
Shares of the Funds are listed and traded on the Cboe BZX Exchange, Inc. (“Cboe” or the “Exchange”). Market prices for the shares may be different from their net asset value (“NAV”). Each Fund issues and redeems shares on a continuous basis at NAV only in large blocks of shares, called “Creation Units,” which generally consist of 25,000 shares. Creation Units are issued and redeemed principally in-kind for securities included in a specified universe. Once created, shares generally trade in the secondary market at market prices that change throughout the day in amounts less than a Creation Unit. Except when aggregated in Creation Units, shares are not redeemable securities of a Fund. Shares of a Fund may only be purchased directly from or redeemed directly to a Fund by certain financial institutions (“Authorized Participants”). An Authorized Participant is either (i) a broker-dealer or other participant in the clearing process through the Continuous Net Settlement System of the National Securities Clearing Corporation or (ii) a DTC participant and, in each case, must have executed a Participant Agreement with Quasar Distributors, LLC (the “Distributor”). Most retail investors do not qualify as Authorized Participants or have the resources to buy and sell whole Creation Units. Therefore, most retail investors may purchase shares in the secondary market with the assistance of a broker and are subject to customary brokerage commissions or fees.
TrimTabs ETF Trust
NOTES TO FINANCIAL STATEMENTS
January 31, 2021 (Unaudited) (Continued)
Each Fund currently offers one class of shares, which have no front end sales loads, no deferred sales charges, and no redemption fees. A purchase (i.e., creation) transaction fee is imposed for the transfer and other transaction costs associated with the purchase of Creation Units. TTAC charges $500 for the standard fixed creation fee, TTAI charges $1,500 for the standard fixed creation fee, and DFHY and DFNV each charge $250 for the standard fixed creation fee, payable to the Custodian. In addition, a variable fee may be charged on all cash transactions or substitutes for Creation Units of up to a maximum of 2% as a percentage of the total value of the Creation Units subject to the transaction. Variable fees received by each Fund are displayed in the Capital Share Transactions section of the Statement of Changes in Net Assets. There were no variable fees charged in any Fund during the fiscal year. Each Fund may issue an unlimited number of shares of beneficial interest, with no par value. Shares of each Fund have equal rights and privileges with respect to such Fund.
2. SIGNIFICANT ACCOUNTING POLICIES
Each Fund is a registered investment company and accordingly follows the investment company accounting and reporting guidance of the Financial Accounting Standards Board (“FASB”) Accounting Standard Codification (“ASC”) Topic 946 Financial Services – Investment Companies.
The following is a summary of significant accounting policies followed by each Fund in the preparation of their financial statements. These policies are in conformity with accounting principles generally accepted in the United States of America (“GAAP”).
Security Transactions and Investment Income: Investment securities transactions are accounted for on the trade date. Gains and losses realized on sales of securities are computed on the basis of specific identification. Dividend income is recorded on the ex-dividend date. Withholding taxes on foreign dividends have been provided for in accordance with the Funds’ understanding of the applicable tax rules and regulations. Interest income is recorded on an accrual basis. Discounts and premiums on securities purchased are accreted and amortized over the lives of the respective securities.
Dividend Distributions: Distributions to shareholders are recorded on the ex-dividend date and are determined in accordance with federal income tax regulations, which may differ from GAAP. Each Fund distributes all or substantially all of its net investment income to shareholders in the form of dividends.
Federal Income Taxes: The Funds comply with the requirements of subchapter M of the Internal Revenue Code of 1986, as amended, necessary to qualify as regulated investment companies and distribute substantially all net taxable investment income and net realized gains to shareholders in a manner which results in no tax cost to the Funds. Therefore, no federal income tax provision is required. As of and during the year ended July 31, 2020, the Funds did not have any tax positions that did not meet the “more-likely-than-not” threshold of being sustained by the applicable tax authority. As of and during the year ended July 31, 2020, the Funds did not have liabilities for any
TrimTabs ETF Trust
NOTES TO FINANCIAL STATEMENTS
January 31, 2021 (Unaudited) (Continued)
unrecognized tax benefits on uncertain tax positions as income tax expense in the Statements of Operations. During the year ended July 31, 2020, the Funds did not incur any interest or penalties. The Funds are subject to examination by U.S. taxing authorities for the tax periods since each Fund’s commencement of operations.
Currency Translation: Assets and liabilities, including investment securities, denominated in currencies other than U.S. dollars are translated into U.S. dollars at the exchange rates supplied by one or more pricing vendors on the valuation date. Purchases and sales of investment securities and income and expenses are translated into U.S. dollars at the exchange rates on the dates of such transactions. The effects of changes in exchange rates on investment securities are included with the net realized gain or loss and net unrealized appreciation or depreciation on investments in the Funds’ Statement of Operations. The realized gain or loss and unrealized appreciation or depreciation resulting from all other transactions denominated in currencies other than U.S. dollars are disclosed separately.
Use of Estimates: The preparation of financial statements in conformity with GAAP requires management to make estimates and assumptions that affect the reported amounts of assets and liabilities and disclosure of contingent assets and liabilities at the date of the financial statements, and the reported amounts of increases and decreases in net assets from operations during the reporting period. Actual results could differ from those estimates.
Share Valuation: The NAV per share of each Fund is calculated by dividing the sum of the value of the securities held by the Fund, plus cash and other assets, minus all liabilities (including estimated accrued expenses) by the total number of shares outstanding for the Fund, rounded to the nearest cent. The offering and redemption price per share for each Fund is equal to the Fund’s net asset value per share.
Guarantees and Indemnifications: The Funds indemnify their officers and trustees for certain liabilities that may arise from the performance of their duties to the Funds. Additionally, in the normal course of business, the Trust enters into contracts with its vendors and others that provide for general indemnifications. The Trust and Funds’ maximum exposure under these arrangements is unknown, as this would involve future claims that may be made against the Funds. However, based on industry experience, the Funds expect that risk of loss to be remote.
Reclassification of Capital Accounts: GAAP requires that certain components of net assets relating to permanent differences be reclassified between financial and tax reporting. These reclassifications have no effect on net assets or NAV per share. For the fiscal year ended July 31, 2020, the following table shows the reclassifications made:
| | Distributable Earnings | | Paid-In |
| | (Accumulated Deficit) | | Capital |
| TTAC | | $ | (4,033,795 | ) | | | $ | 4,033,795 | |
| TTAI | | $ | 7,487 | | | | $ | (7,487 | ) |
TrimTabs ETF Trust
NOTES TO FINANCIAL STATEMENTS
January 31, 2021 (Unaudited) (Continued)
During the fiscal year ended July 31, 2020, the Funds realized the following net capital gains resulting from in-kind redemptions in which shareholders exchanged Fund shares for securities held by the Funds rather than for cash. Because such gains are not taxable to the Funds, and are not distributed to shareholders, they have been reclassified from distributable earnings to paid-in capital.
| | Gains/(Losses) from |
| | In-Kind Redemptions |
| TTAC | | $ | 4,123,412 | |
| TTAI | | $ | (3,505 | ) |
Subsequent Events: The Trust has evaluated the need for disclosures and/or adjustments resulting from subsequent events through the date the financial statements were issued. Based on this evaluation, no adjustments or disclosures were required to the financial statements.
3. SECURITIES VALUATION
Investment Valuation: Each Fund calculates its net asset value (“NAV”) each day the New York Stock Exchange (the “NYSE”) is open for trading as of the close of regular trading on the NYSE, normally 4:00 p.m. Eastern time (the “NAV Calculation Time”).
Equity securities are valued primarily on the basis of market quotations reported on stock exchanges and other securities markets around the world. If an equity security is listed on a national securities exchange, the security is valued at the closing price or, if the closing price is not readily available, the mean of the closing bid and asked prices. Investments in other open-end investment companies, including money market funds, are valued at the investment company’s net asset value per share, with the exception of exchange-traded open-end investment companies, which are priced as equity securities described above.
Market quotations and indicative bids are obtained from outside pricing services approved and monitored pursuant to a policy approved by the Funds’ Board of Trustees (the “Board”). If a market quotation is not readily available or is deemed not to reflect market value, the Funds will determine the price of the security held by the Funds based on a determination of the security’s fair value pursuant to policies and procedures approved by the Board. In addition, the Funds may use fair valuation to price securities that trade on a foreign exchange when a significant event has occurred after the foreign exchange closes but before the time at which the Funds’ NAV’s are calculated. Such valuations would typically be categorized as Level 2 or Level 3 in the fair value hierarchy described below.
Foreign exchanges typically close before the time at which Fund share prices are calculated and may be closed altogether on some days when shares of the Funds are traded. Significant events affecting a foreign security may include, but are not limited to: corporate actions, earnings announcements, litigation or other events impacting a single
TrimTabs ETF Trust
NOTES TO FINANCIAL STATEMENTS
January 31, 2021 (Unaudited) (Continued)
issuer; governmental action that affects securities in one sector or country; natural disasters or armed conflicts affecting a country or region; or significant domestic or foreign market fluctuations.
Fair valuations and valuations of investments that are not actively trading involve judgment and may differ materially from valuations that would have been used had greater market activity occurred.
Fair Valuation Measurement: The FASB established a framework for measuring fair value in accordance with GAAP. Under FASB ASC Topic 820, Fair Value Measurement, various inputs are used in determining the value of each Fund’s investments. The inputs or methodology used for valuing securities are not necessarily an indication of the risk associated with investing in those securities. The three Levels of inputs of the fair value hierarchy are defined as follows:
| Level 1 — | Unadjusted quoted prices in active markets for identical assets or liabilities. |
| | |
| Level 2 — | Observable inputs other than quoted prices included in Level 1 that are observable for the asset or liability, either directly or indirectly. These inputs may include quoted prices for the identical instrument on an inactive market, prices for similar securities, interest rates, prepayment speeds, credit risk, yield curves, default rates and similar data. |
| | |
| Level 3 — | Unobservable inputs for the asset or liability, to the extent relevant observable inputs are not available; representing the Fund’s own assumptions about the assumptions a market participant would use in valuing the asset or liability and would be based on the best information available. |
A financial instrument’s level within the fair value hierarchy is based on the lowest level of any input that is significant to the fair value measurement.
The availability of observable inputs can vary from security to security and is affected by a wide variety of factors, including, for example, the type of security, whether the security is new and not yet established in the marketplace, the liquidity of markets, and other characteristics particular to the security. To the extent that valuation is based on models or inputs that are less observable or unobservable in the market, the determination of fair value requires more judgment. Accordingly, the degree of judgment exercised in determining fair value is greatest for instruments categorized in Level 3.
TrimTabs ETF Trust
NOTES TO FINANCIAL STATEMENTS
January 31, 2021 (Unaudited) (Continued)
The following is a summary of the inputs used to value the Fund’s investments as of January 31, 2021:
| TTAC | | | | | | | | | | | | |
| | | | | | | | | | | | | |
Description^ | | Level 1 | | | Level 2 | | | Level 3 | | | Total | |
| Common Stocks | | $ | 184,143,631 | | | $ | — | | | $ | — | | | $ | 184,143,631 | |
| Short-Term Investments | | | 685,298 | | | | — | | | | — | | | | 685,298 | |
| Total Investments | | | | | | | | | | | | | | | | |
| in Securities | | $ | 184,828,929 | | | $ | — | | | $ | — | | | $ | 184,828,929 | |
| | | | | | | | | | | | | | | | | |
| TTAI | | | | | | | | | | | | | | | | |
| | | | | | | | | | | | | | | | | |
Description^ | | Level 1 | | | Level 2 | | | Level 3 | | | Total | |
| Common Stocks | | $ | 12,298,954 | | | $ | — | | | $ | — | | | $ | 12,298,954 | |
| Exchange Traded Funds | | | 1,030,771 | | | | — | | | | — | | | | 1,030,771 | |
| Short-Term Investments | | | 45,143 | | | | — | | | | — | | | | 45,143 | |
| Total Investments | | | | | | | | | | | | | | | | |
| in Securities | | $ | 13,374,868 | | | $ | — | | | $ | — | | | $ | 13,374,868 | |
| | | | | | | | | | | | | | | | | |
| DFHY | | | | | | | | | | | | | | | | |
| | | | | | | | | | | | | | | | | |
Description^ | | Level 1 | | | Level 2 | | | Level 3 | | | Total | |
| Exchange Traded Funds | | $ | 76,980,442 | | | $ | — | | | $ | — | | | $ | 76,980,442 | |
| Short-Term Investments | | | 165,040 | | | | — | | | | — | | | | 165,040 | |
| Total Investments | | | | | | | | | | | | | | | | |
| in Securities | | $ | 77,145,482 | | | $ | — | | | $ | — | | | $ | 77,145,482 | |
| | | | | | | | | | | | | | | | | |
| DFNV | | | | | | | | | | | | | | | | |
| | | | | | | | | | | | | | | | | |
Description^ | | Level 1 | | | Level 2 | | | Level 3 | | | Total | |
| Common Stocks | | $ | 85,734,334 | | | $ | — | | | $ | — | | | $ | 85,734,334 | |
| Short-Term Investments | | | 393,727 | | | | — | | | | — | | | | 393,727 | |
| Total Investments | | | | | | | | | | | | | | | | |
| in Securities | | $ | 86,128,061 | | | $ | — | | | $ | — | | | $ | 86,128,061 | |
^ See Schedule of Investments for sector breakouts.
The Funds did not invest in any Level 3 securities during the period.
4. OTHER RELATED PARTY TRANSACTIONS
TrimTabs Asset Management, LLC. (“the Adviser”) serves as the investment adviser to the Funds. Pursuant to an Investment Advisory Agreement (“Investment Advisory Agreement”) between the Trust, on behalf of the Funds, and the Adviser, the Adviser provides investment advice to the Funds and oversees the day-to-day operations of the Funds, subject to the direction and control of the Board and the officers of the Trust. The Adviser administers the Funds’ business affairs, provides office facilities and equipment
TrimTabs ETF Trust
NOTES TO FINANCIAL STATEMENTS
January 31, 2021 (Unaudited) (Continued)
and certain clerical, bookkeeping and administrative services. The Adviser bears the costs of all advisory and non-advisory services required to operate the Funds, including payment of Trustee compensation, in exchange for a single unitary management fee. For services provided to the Funds, TTAC and TTAI each pay the Adviser 0.59% and DFHY and DFNV each pay the Adviser 0.69% at an annual rate based on each Fund’s average daily net assets. Certain officers and a Trustee of the Trust are affiliated with the Adviser and are not paid any fees by the Funds for serving in such capacities.
The Adviser has overall responsibility for overseeing the investment of the Funds’ assets, managing the Funds’ business affairs and providing certain clerical, bookkeeping and other administrative services for the Trust. Donoghue Forlines LLC (“Donoghue” or “the Sub-Adviser”) acts as the sub-adviser to DFHY and DFNV. The Sub-Adviser has responsibility to make day-to-day investment decisions for DFHY and DFNV. The sub-adviser had responsibility for selecting and continuously monitoring the Fund’s investments. Sub-Advisory fees earned by Donoghue are paid by the Adviser.
Pursuant to a Sub-Advisory Agreement between the Adviser and Donoghue (the “Sub-Advisory Agreement”), Donoghue is responsible for trading portfolio securities on behalf of DFHY and DFNV, including selecting broker-dealers to execute purchase and sale transactions as instructed by the Adviser or in connection with any rebalancing or reconstitution of DFHY’s and DFNV’s respective Indexes, subject to the supervision of the Adviser and the Board. For the services it provides to DFHY and DFNV, Donoghue is compensated by the Adviser from the management fees paid by DFHY and DFNV to the Adviser.
Quasar Distributors, LLC acts as the Fund’s principal underwriter in a continuous public offering of the Funds’ shares. The Trust has adopted a distribution and service plan (“Rule 12b-1 Plan”) pursuant to Rule 12b-1 under the 1940 Act. Under the Rule 12b-1 Plan, each Fund is authorized to pay distribution fees in connection with the sale and distribution of its shares and pay service fees in connection with the provision of ongoing services to shareholders. To date, the Rule 12b-1 Plan has not been implemented for the Funds and there is no current intention to implement the Rule 12b-1 Plan.
5. SERVICE AND CUSTODY AGREEMENTS
The Funds have entered into Service Agreements with U.S. Bancorp Fund Services, LLC (“Fund Services” or “Administrator”), doing business as U.S. Bank Global Fund Services and a Custody Agreement with U.S. Bank, N.A. (“USB”), an affiliate of Fund Services. Under these agreements, Fund Services and USB provide certain transfer agency, administrative, accounting and custody services and are paid by the Adviser under the unitary fee arrangement noted above.
TrimTabs ETF Trust
NOTES TO FINANCIAL STATEMENTS
January 31, 2021 (Unaudited) (Continued)
6. INVESTMENT TRANSACTIONS
For the period ended January 31, 2021, the aggregate purchases and sales of securities by each Fund, excluding short-term securities and in-kind transactions, were as follows:
| | | Purchases | | | Sales | |
| TTAC | | $ | 64,099,120 | | | $ | 63,406,983 | |
| TTAI | | $ | 4,662,014 | | | $ | 4,707,460 | |
| DFHY | | $ | 3,496,395 | | | $ | 2,901,385 | |
| DFNV | | $ | 292,246 | | | $ | — | |
For the six-months ended January 31, 2021, in-kind transactions associated with creations and redemptions were as follows:
| | | Purchases | | | Sales | |
| TTAC | | $ | 72,169,053 | | | $ | 17,784,472 | |
| TTAI | | $ | — | | | $ | — | |
| DFHY | | $ | 76,126,782 | | | $ | — | |
| DFNV | | $ | 84,743,838 | | | $ | 4,032,146 | |
For the six-months ended January 31, 2021, there were no long-term purchases or sales of U.S. Government Securities for the Funds.
7. INCOME TAX INFORMATION
The components of tax basis cost of investments and net unrealized appreciation for federal income tax purposes as of July 31, 2020 were as follows:
| | | TTAC | | | TTAI | |
| Tax cost of investments | | $ | 86,870,447 | | | $ | 9,256,689 | |
| Gross tax unrealized appreciation | | | 24,175,759 | | | | 2,224,079 | |
| Gross tax unrealized depreciation | | | (2,250,811 | ) | | | (388,768 | ) |
| Net tax unrealized appreciation | | | 21,924,948 | | | | 1,835,311 | |
| Undistributed ordinary income | | | 436,993 | | | | 85,613 | |
| Undistributed long-term capital gains | | | — | | | | — | |
| Total accumulated gain | | | 436,993 | | | | 85,613 | |
| Other accumulated loss | | | (15,428,976 | ) | | | (1,926,505 | ) |
| Distributable earnings (deficit) | | $ | 6,932,965 | | | $ | (5,581 | ) |
The difference between book and tax-basis cost is attributable to the realization for tax purposes of unrealized gains on investments in passive foreign investment companies and wash sales. Under tax law, certain capital and foreign currency losses realized after October 31 and within the taxable year are deemed to arise on the first business day of each Fund’s next taxable year.
TrimTabs ETF Trust
NOTES TO FINANCIAL STATEMENTS
January 31, 2021 (Unaudited) (Continued)
At July 31, 2020, the Funds had the following capital loss carryforwards:
| | | Short-Term | | | Long-Term | | | Expires |
| TTAC | | $ | 15,428,976 | | | $ | — | | | Indefinite |
| TTAI | | $ | 1,153,650 | | | $ | 772,855 | | | Indefinite |
The tax character of distributions paid by the Funds during the fiscal year ended July 31, 2020 and July 31, 2019 was as follows:
| | | Ordinary Income | |
| | | July 31, 2020 | | | July 31, 2019 | |
| TTAC | | $ | 915,650 | | | $ | 684,621 | |
| TTAI | | $ | 244,461 | | | $ | 92,157 | |
DFHY and DFNV were launched after July 31, 2020, therefore there is not any federal income tax information.
8. CERTAIN RISKS
Active and Frequent Trading Risk. Active and frequent trading of portfolio securities may result in increased transaction costs to the Fund, including brokerage commissions, dealer mark-ups and other transaction costs on the sale of the securities and on reinvestment in other securities, and may also result in higher taxes if Shares are held in a taxable account.
Asia-Pacific Risk. Investments in securities of issuers in Asia-Pacific countries involve risks that are specific to the Asia-Pacific region, including certain legal, regulatory, political and economic risks. Certain Asia-Pacific countries have experienced expropriation and/or nationalization of assets, confiscatory taxation, political instability, armed conflict and social instability as a result of religious, ethnic, socio-economic and/or political unrest. Some economies in this region are dependent on a range of commodities, and are strongly affected by international commodity prices and particularly vulnerable to price changes for these products. The market for securities in this region may also be directly influenced by the flow of international capital, and by the economic and market conditions of neighboring countries. Many Asia-Pacific economies have experienced rapid growth and industrialization, and there is no assurance that this growth rate will be maintained. Some Asia-Pacific economies are highly dependent on trade and economic conditions in other countries can impact these economies.
| | Japan Risk. The Japanese economy may be subject to considerable degrees of economic, political and social instability. Since 2000, Japan’s economic growth rate has remained relatively low. In addition, Japan is subject to the risk of natural disasters, such as earthquakes and tsunamis. |
Concentration Risk. A fund concentrated in an industry or group of industries is likely to present more risks than a fund that is broadly diversified over several industries or groups of industries. Compared to the broad market, an individual industry or group of related industries may be more strongly affected by changes in the economic climate, broad market shifts, moves in a particular dominant stock or regulatory changes.
TrimTabs ETF Trust
NOTES TO FINANCIAL STATEMENTS
January 31, 2021 (Unaudited) (Continued)
Depositary Receipts Risk. The risks of investments in depositary receipts are substantially similar to Foreign Investment Risks. In addition, depositary receipts may not track the price of the underlying foreign securities, and their value may change materially at times when the U.S. markets are not open for trading.
Derivatives Risk. A derivative instrument derives its value from an underlying security, currency, commodity, interest rate, index or other asset (collectively, “underlying asset”). The Fund’s investments in derivatives may pose risks in addition to and greater than those associated with investing directly in the underlying assets, including counterparty, leverage and liquidity risks. Derivatives may also be harder to value, less tax efficient and subject to changing government regulation that could impact the Fund’s ability to use certain derivatives or their cost. Derivatives strategies may not always be successful.
| | Futures Contracts Risk. Exchange-traded futures contracts are a type of derivative, which call for the future delivery of an asset, or cash settlement, at a certain stated price on a specified future date. Futures contracts involve the risk of imperfect correlation between movements in the price of the instruments and the price of the underlying assets. In addition, there is the risk that the Fund may not be able to enter into a closing transaction because of an illiquid market. Exchanges can limit the number of positions that can be held or controlled by the Fund or the Sub-Adviser, thus limiting the ability to implement the Fund’s strategies. Futures markets are highly volatile, and the use of futures may increase the volatility of the Fund’s NAV. |
Downside Protection Model Risk. Neither the Adviser nor the Sub-Adviser can offer assurances that the downside protection model employed by DFNV’s Underlying Index methodology will achieve its intended results, or that downside protection will be provided during periods of time when the Equity Portfolio is declining or during any period of time deemed to be a bear market. For example, the Underlying Index methodology would not have triggered a signal to employ the downside protection model during the recent market volatility experienced in March 2020. While significant dips occurred in the market at that time, the bear market environment was short lived, and markets began recovering relatively quickly. As discussed above, signals are typically only triggered during prolonged bear markets, meaning that the signal is triggered based on the duration of the decline not the amount of the decline. Accordingly, while the signal would not have triggered in March 2020, it would have triggered during the financial crisis of 2007-2008, during which a prolonged bear market occurred. Investment in a fund that utilizes a downside protection model that seeks to minimize risk only during certain prolonged bear market environments may not be appropriate for every investor seeking a particular risk profile.
Equity Investing Risk. An investment in TTAC, TTAI or DFNV involves risks similar to those of investing in any fund holding equity securities, such as market fluctuations, changes in interest rates and perceived trends in stock prices. The values of equity securities could decline generally or could underperform other investments. In addition, securities may decline in value due to factors affecting a specific issuer, market or securities markets generally.
TrimTabs ETF Trust
NOTES TO FINANCIAL STATEMENTS
January 31, 2021 (Unaudited) (Continued)
ETF Risk. As an ETF, the Fund is subject to the following risks:
| | Authorized Participants Concentration Risk. The Fund may have a limited number of financial institutions that may act as Authorized Participants (“APs”). To the extent that those APs exit the business or are unable to process creation and/or redemption orders, shares may trade at a discount to net asset value (or “NAV”) and possibly face delisting. |
| | |
| | Flash Crash Risk. Sharp price declines in securities owned by the Fund may trigger trading halts, which may result in the Fund’s shares trading in the market at an increasingly large discount to NAV during part (or all) of a trading day. Shareholders could suffer significant losses to the extent that they sell shares at these temporarily low market prices. |
| | |
| | International Closed Market Trading Risk. Because certain of the Fund’s investments trade in markets that are closed when the Fund and Exchange are open, there are likely to be deviations between the current prices of such investments and the prices at which such investments are valued by the Fund. As a result, shares may appear to trade at a significant discount or premium to NAV. |
| | |
| | Large Shareholder Risk. Certain shareholders, including the Adviser or an affiliate of the Adviser, or groups of related shareholders, such as those investing one or more model portfolios, may own a substantial amount of the Fund’s shares. Redemptions by large shareholders could have a significant negative impact on the Fund. In addition, transactions by large shareholders may account for a large percentage of the trading volume on the Exchange and may, therefore, have a material upward or downward effect on the market price of the Shares. |
| | |
| | Premium-Discount Risk. Shares may trade above or below their NAV. Accordingly, investors may pay more than NAV when purchasing Shares or receive less than NAV when selling Shares. The market prices of Shares will generally fluctuate in accordance with changes in NAV, changes in the relative supply of, and demand for Shares, and changes in the liquidity, or the perceived liquidity, of the Fund’s holdings. |
| | |
| | Secondary Market Trading Risk. Investors buying or selling Shares in the secondary market may pay brokerage commissions or other charges, which may be a significant proportional cost for investors seeking to buy or sell relatively small amounts of Shares. Although the Shares are listed on the Exchange, there can be no assurance that an active or liquid trading market for them will develop or be maintained. In addition, trading in Shares on the Exchange may be halted. |
Europe Risk. Decreasing imports or exports, changes in governmental or European Union (the “EU”) regulations on trade, changes in the exchange rate of the euro, the default or threat of default by an EU member country on its sovereign debt, and/or an economic recession in an EU member country may have a significant adverse effect on the securities of EU issuers. The European financial markets have recently experienced
TrimTabs ETF Trust
NOTES TO FINANCIAL STATEMENTS
January 31, 2021 (Unaudited) (Continued)
volatility and adversity due to concerns about withdrawal of member countries from the EU and economic downturns and rising government debt levels in several European countries. These events have adversely affected the exchange rate of the euro and may continue to significantly affect every country in Europe.
Foreign Investment Risk. Returns on investments in foreign securities could be more volatile than, or trail the returns on, investments in U.S. securities. Exposures to foreign securities entail special risks, including due to: differences in information available about foreign issuers; differences in investor protection standards in other jurisdictions; capital controls risks, including the risk of a foreign jurisdiction imposing restrictions on the ability to repatriate or transfer currency or other assets; political, diplomatic and economic risks; regulatory risks; and foreign market and trading risks, including the costs of trading and risks of settlement in foreign jurisdictions. In addition, the Fund’s investments in securities denominated in other currencies could decline due to changes in local currency relative to the value of the U.S. dollar, which may affect the Fund’s returns.
Geographic Region Risk. To the extent that the Fund invests a significant portion of its assets in a specific geographic region or a particular country, the Fund will generally have more exposure to that region or country’s economic risks. In the event of economic or political turmoil or a deterioration of diplomatic relations in a region or country where a significant portion of the Fund’s assets are invested, the Fund may experience substantial illiquidity or reduction in the value of the Fund’s investments. Adverse conditions in a certain region or country can also adversely affect securities of issuers in other countries whose economies appear to be unrelated.
High Yield (Junk Bond) Securities Risk. High yield securities and unrated securities of similar credit quality are considered to be speculative with respect to the issuer’s continuing ability to make principal and interest payments and are generally subject to greater levels of credit quality risk than investment grade securities. High yield securities are usually issued by companies, including smaller and medium capitalization companies, without long track records of sales and earnings, or with questionable credit strength. These companies may be particularly affected by interest rate increases, as they may find it more difficult to borrow money to continue or expand operations, or may have difficulty in repaying floating rate loans. These fixed-income securities are considered below “investment-grade.” The retail secondary market for these “junk bonds” may be less liquid than that of higher-rated fixed income securities, and adverse conditions could make it difficult at times to sell these securities or could result in lower prices than higher-rated fixed income securities. These risks can reduce the value of the shares of a High Yield Bond ETF and the income it earns.
Index-Based Strategy Risk. With respect to each of DFHY and DFNV, the Fund is managed as an index-based fund that seeks to track the performance of its Underlying Index. This differs from an actively managed fund, which typically seeks to outperform a benchmark index. As a result, the Fund may hold the component securities of the Underlying Index regardless of the current or projected performance of a specific
TrimTabs ETF Trust
NOTES TO FINANCIAL STATEMENTS
January 31, 2021 (Unaudited) (Continued)
security or the relevant market as a whole. Maintaining investments in securities regardless of market conditions or the performance of individual securities could cause the Fund’s returns to be lower than if the Fund employed an active strategy. The Fund will seek to track the Underlying Index in all market conditions, including during adverse market conditions when other funds may seek to take temporary defensive measures (such as investing significantly in cash or cash equivalents). Accordingly, unless the Underlying Index allocates significant portions of its assets to cash and/or cash equivalents during times of adverse market or economic conditions, the Fund may be subject to a higher level of market risk during such times than other funds. Additionally, the Fund generally rebalances and reconstitutes its portfolio, and implements downside protection allocations, in accordance with the Underlying Index and, therefore, any changes to the Underlying Index’s rebalance, reconstitution or downside protection trigger schedule will typically result in corresponding changes to the Fund’s rebalance, reconstitution or downside protection trigger schedule.
Index Correlation Risk. While the Sub-Adviser seeks to track the performance of the Underlying Index closely (i.e., to achieve a high degree of correlation with the Underlying Index), the Fund’s returns may not match or achieve a high degree of correlation with the returns of the Underlying Index due to operating expenses, transaction costs, cash flows, regulatory requirements and/or operational inefficiencies.
Index Calculation Risk. Each of DFHY’s and DFNV’s Underlying Index relies on various sources of information to assess the criteria of issuers included in the Underlying Index and to determine whether a “buy” or “sell” trigger should be issued, including information that may be based on assumptions and estimates. DFHY, DFNV, the Index Provider, the Adviser, the Sub-Adviser, the Underlying Index calculation agent and any of their affiliates cannot offer assurances that an Underlying Index’s calculation methodology or sources of information will provide an accurate assessment of included issuers or the appropriate trigger at any particular time.
Investment Risk. An investment in the Fund is not a deposit of a bank and is not insured or guaranteed by the Federal Deposit Insurance Corporation or any other government agency. When you sell your shares, they could be worth less than what you paid for them.
Large Capitalization Company Risk. Investments in large capitalization companies may underperform other segments of the market because they may be less responsive to competitive challenges and opportunities and unable to attain high growth rates during periods of economic expansion.
Liquidity Risk. Liquidity risk exists when a particular investment is difficult to purchase or sell. If a High Yield Bond ETF invests in illiquid securities or its portfolio securities otherwise become illiquid, it may reduce the returns of the High Yield Bond ETF because the High Yield Bond ETF may be unable to sell the illiquid securities at an advantageous time or price. In the event that a High Yield Bond ETF voluntarily or
TrimTabs ETF Trust
NOTES TO FINANCIAL STATEMENTS
January 31, 2021 (Unaudited) (Continued)
involuntarily liquidates its portfolio assets during periods of infrequent trading of its securities, the High Yield Bond ETF may not receive full value for those assets, which will reduce the value of the High Yield Bond ETF’s shares, and in turn, the value of the Fund’s investment in such shares.
Management Risk. Each of TTAC and TTAI is actively managed using proprietary investment strategies and processes that are based on quantitative stock selection rules and algorithms (the “quantitative investment process”). There can be no guarantee that the Fund will achieve its investment objective or that the quantitative investment process will produce intended results. The Fund may be adversely affected by imperfections, errors or limitations in the construction or implementation of the quantitative investment process and/or the Adviser’s ability to monitor and timely adjust the metrics or update the data or features underlying the quantitative investment process. Any of these factors could result in the Fund underperforming comparable investment vehicles.
Market Events Risk. The value of securities in the Fund’s portfolio may decline due to daily fluctuations in the securities markets that are generally beyond the Fund’s control, including the quality of the Fund’s investments, economic conditions, adverse investor sentiment, poor management decisions, lower demand for a company’s goods or services, and general market conditions. In a declining market, the prices for all securities (including those in the Fund’s portfolio) may decline, regardless of their long-term prospects. Security values tend to move in cycles, with periods when securities markets generally rise and periods when they generally decline. In addition, local, regional or global events such as war, acts of terrorism, the spread of infectious illness or other public health issue, recessions, or other events could have a significant impact on the Fund, its investments and the trading of its Shares. For example, an outbreak of an infectious respiratory illness, COVID-19, has resulted in travel restrictions, disruption of healthcare systems, prolonged quarantines, cancellations, supply chain disruptions, lower consumer demand, layoffs, ratings downgrades, defaults and other significant economic impacts. Certain markets have experienced temporary closures, extreme volatility, severe losses, reduced liquidity and increased trading costs. These events will have an impact on the Fund and its investments and could impact the Fund’s ability to purchase or sell securities or cause increased premiums or discounts to the Fund’s net asset value (“NAV”). The ongoing effects of COVID-19, and the length of its impact on the Fund or its investments, are unpredictable.
Sector Focus Risk. To the extent that the Fund’s investments are focused on a particular industry or group of industries or sector, the Fund is subject to loss due to adverse occurrences that may affect that industry or group of industries or sector. Focusing on a particular sector, industry or group of industries could increase the Fund’s volatility over the short term.
Small and Medium Capitalization Company Risk. Investing in securities of small and medium capitalization companies involves greater risk than customarily is associated with investing in larger, more established companies. These companies’ securities may be
TrimTabs ETF Trust
NOTES TO FINANCIAL STATEMENTS
January 31, 2021 (Unaudited) (Continued)
more volatile and less liquid than those of more established companies. Often, small and medium capitalization companies and the industries in which they focus are still evolving and, as a result, they may be more sensitive to changing market conditions. Small and medium capitalization companies may be particularly affected by interest rate increases, as they may find it more difficult to borrow money to continue or expand operations, or may have difficulty in repaying any loans which are floating rate.
Tactical Overlay Risk. Neither the Adviser nor the Sub-Adviser can offer assurances that the tactical overlay process employed by DFHY’s Underlying Index methodology will achieve its intended results. Investment in a fund that utilizes a tactical overlay that seeks to minimize risk may not be appropriate for every investor seeking a particular risk profile.
Underlying ETFs Risk. In seeking to track its Underlying Index, each of DFHY and DFNV may invest a portion of its assets in Underlying ETFs. In those situations, the Fund’s investment performance is directly related to the performance of the Underlying ETFs. The Fund’s net asset value (or “NAV”) will change with changes in the value of the Underlying ETFs based on their market valuations. An investment in the Fund will entail more costs and expenses than a direct investment in the Underlying ETFs. As the Underlying ETFs, or the Fund’s allocations among the Underlying ETFs, change from time to time, or to the extent that the total annual fund operating expenses of any Underlying ETF changes, the weighted average operating expenses borne by the Fund may increase or decrease.
U.S. Treasury Securities Risk. U.S. Treasury securities may differ from other securities in their interest rates, maturities, times of issuance and other characteristics and may provide relatively lower returns than those of other securities. Similar to other issuers, changes to the financial condition or credit rating of a government may cause the value of a Short-Term Treasury ETF’s investments to decline.
TrimTabs ETF Trust
ADDITIONAL INFORMATION
January 31, 2021 (Unaudited)
1. FREQUENCY DISTRIBUTION OF PREMIUMS AND DISCOUNTS
Information regarding how often shares of each Fund traded on the Exchange at a price above (i.e., at a premium) or below (i.e., at a discount) the NAV of the Fund is available on the Funds’ website at www.trimtabsfunds.com.
2. FEDERAL TAX INFORMATION
QUALIFIED DIVIDEND INCOME/DIVIDENDS RECEIVED DEDUCTION
For the fiscal year ended July 31, 2020, certain dividends paid by the Funds may be subject to a maximum tax rate of 23.8%, as provided for by the Jobs and Growth Tax Relief Reconciliation Act of 2003.
The percentage of dividends declared from ordinary income designated as qualified dividend income was as follows:
For corporate shareholders, the percent of ordinary income distributions qualifying for the corporate dividends received deduction for the fiscal year ended July 31, 2020, was as follows:
SHORT-TERM CAPITAL GAIN
The percentage of taxable ordinary income distributions that are designated as short-term capital gain distributions under Internal Revenue Section 871(k)(2)(C) for each Fund were as follows (unaudited):
3. DISCLOSURE OF PORTFOLIO HOLDINGS
The Funds file their complete schedule of portfolio holdings for their first and third fiscal quarters with the Securities and Exchange Commission (“SEC”) on Part F of Form N-PORT (or any successor form). The Funds’ Part F of Form N-PORT (or any successor form) is available without charge, upon request, by calling toll free at 1-800-617-0004. Furthermore, you may obtain the Part F of Form N-PORT (or any successor form) on the SEC’s website at www.sec.gov. Each Fund’s portfolio holdings are posted daily on their website at www.trimtabsfunds.com.
4. PROXY VOTING POLICIES AND PROCEDURES
A description of the policies and procedures the Funds use to determine how to vote proxies related to portfolio securities is provided in the Statement of Additional Information (“SAI”). The SAI is available without charge upon request by calling toll free at 1-800-617-0004, by accessing the SEC’s website at www.sec.gov or by accessing
TrimTabs ETF Trust
ADDITIONAL INFORMATION
January 31, 2021 (Unaudited) (Continued)
the Funds’ website at www.trimtabsfunds.com. Information on how the Funds voted proxies related to portfolio securities during the period ended June 30 is available without charge, upon request, by calling 1-800-617-0004 or by accessing the website of the SEC.
5. INVESTMENT ADVISORY AND SUB-ADVISORY AGREEMENT APPROVAL
At a meeting held on September 22, 2020, the Board of Trustees (the “Board”) of TrimTabs ETF Trust (the “Trust”), including the Trustees of the Trust who were not “interested persons,” as that term is defined in the Investment Company Act of 1940 (the “Independent Trustees”), reviewed and unanimously approved: (i) the investment advisory agreement (the “Advisory Agreement”) between TrimTabs Asset Management, LLC (“TTAM”) and the Trust, on behalf of each of TrimTabs Donoghue Forlines Tactical High Yield ETF (“DFHY”) and TrimTabs Donoghue Forlines Risk Managed Innovation ETF (“DFNV” and, together with DFHY, the “Funds” and, each, a “Fund”); and (ii) the investment sub-advisory agreement (the “Sub-Advisory Agreement”) between TTAM and Donoghue Forlines LLC (“Donoghue”) with respect to the Funds).
In evaluating the Advisory Agreement and Sub-Advisory Agreement, the Board, including the Independent Trustees, reviewed the materials furnished by TTAM and Donoghue. The Board considered the following factors, among others, in connection with its approval of the Advisory Agreement and Sub-Advisory Agreement: (1) the nature, extent, and quality of the services proposed to be provided by TTAM and Donoghue; (2) a comparison of fees and expenses of each Fund to its respective peer group (each, a “Peer Group”); (3) the proposed profitability to TTAM and Donoghue; (4) the extent to which economies of scale might be realized as each Fund grows; and (5) any ancillary benefits to be derived by TTAM and Donoghue from their relationships with the Funds.
In addition, prior to approving the Advisory Agreement and Sub-Advisory Agreement, the Independent Trustees met in executive session with counsel to the Independent Trustees without representatives of TTAM or Donoghue. The Independent Trustees reviewed with counsel to the Independent Trustees the legal standards applicable to their consideration of the Advisory Agreement and Sub-Advisory Agreement for each Fund. The Independent Trustees relied upon the advice of counsel and their own business judgment in determining the material factors to be considered in evaluating the Advisory Agreement and Sub-Advisory Agreement and the weight to be given to each such factor.
Nature, Extent and Quality of Services
With respect to the nature, extent and quality of the services to be provided by TTAM and Donoghue with respect to the Funds, the Board reviewed the services proposed to be provided by each of TTAM and Donoghue to the Funds, as well as the portfolio management services that Donoghue proposed to provide to the Funds. Among other things, the Board considered the quality of the services TTAM has historically provided to the Trust, information provided by Donoghue regarding the proposed portfolio management personnel for the Funds, and the financial condition of each of TTAM and
TrimTabs ETF Trust
ADDITIONAL INFORMATION
January 31, 2021 (Unaudited) (Continued)
Donoghue. The Board also considered that each Fund would operate pursuant to an index-based strategy pursuant to which TTAM’s affiliate would serve as index provider.
Based on their review and other considerations, the Board concluded, in the exercise of its reasonable business judgment, that the nature, extent and quality of the services proposed to be provided by TTAM and Donoghue supported approval of the Advisory Agreement and Sub-Advisory Agreement.
Comparative Fees and Expenses
The Board discussed the information provided by TTAM and Donoghue on the Funds’ proposed investment advisory fees and expenses. The Board reviewed the advisory fees and expense ratios to be paid by the Funds, and considered the fees and expenses paid by each Fund’s Peer Group. Specifically, the Board noted that DFNV’s proposed advisory fee and expense ratio were both higher than the median and average advisory fees and expense ratios of its Peer Group, but below the maximum and in line with several direct competitors. The Board also noted that DFHY’s advisory fee and expense ratio were both higher than the median and average advisory fees and expense ratios of its Peer Group, but below the maximum. With respect to DFHY, the Board also considered that a large portion of DFHY’s Peer Group included ETFs that represent portfolios of individual bonds, as opposed to risk-managed bond strategies, and thus would not be direct competitors to DFHY.
Based on their review and other considerations, the Board concluded, in the exercise of its reasonable business judgment, that each Fund’s fees and expenses supported approval of the Advisory Agreement and Sub-Advisory Agreement.
Costs and Profitability
The Board evaluated the compensation and benefits expected to be received by TTAM and Donoghue from their relationship with the Funds, taking into account projections of TTAM’s and Donoghue’s anticipated profitability at different asset levels. In this regard, the Board took into consideration that the advisory fees for the Funds were structured as “unitary fees,” pursuant to which TTAM would pay all expenses of each Fund, except for the management fee, payments under the Fund’s Rule 12b-1 plan (if any), brokerage expenses, acquired fund fees and expenses, taxes, interest (including borrowing costs and dividend expenses on securities sold short), litigation expenses and other extraordinary expenses (including litigation to which the Trust or the Fund may be a party and indemnification of the Trustees and officers with respect thereto), and considered the benefits that would accrue to the Funds as a result of this fee structure. The Board noted that TTAM would therefore be responsible for compensating the Trust’s other service providers and paying each Fund’s other expenses out of its own fees and resources. The Board also considered the extent to which Donoghue would bear a portion of each Fund’s expenses. The Board noted that, under the proposed Sub-Advisory Agreement, Donoghue would likely supplement a portion of the cost of operating the Funds for some period of time.
TrimTabs ETF Trust
ADDITIONAL INFORMATION
January 31, 2021 (Unaudited) (Continued)
Based on their review and other considerations, the Board concluded, in the exercise of its reasonable business judgment, that the estimated profits to be realized by TTAM and Donoghue with respect to the Funds appeared to be reasonable and supported approval of the Advisory Agreement and Sub-Advisory Agreement.
Economies of Scale
The Board considered the information provided by TTAM and Donoghue as to the extent to which economies of scale may be realized as the Funds grow and whether the anticipated fee levels reflect economies of scale for the benefit of shareholders. The Board noted that, because the advisory fee schedule for each Fund did not currently include breakpoints, any reduction in fixed costs associated with the management of the Funds would be enjoyed by TTAM and Donoghue; however, the Board also noted that the unitary fee structure provides a level of certainty in expenses for the Funds. The Board then considered whether the proposed advisory fee rates for the Funds were reasonable in relation to the projected asset sizes of the Funds. The Board considered TTAM’s and Donoghue ‘s views on their expectations for growth, noting that, initially, TTAM and Donoghue did not anticipate any material economies of scale.
Based on their review and other considerations, the Board concluded, in the exercise of its reasonable business judgment, that the possibility of realizing future economies of scale was not a material factor in connection with the approval of the Advisory Agreement and Sub-Advisory Agreement.
Ancillary Benefits
The Board then considered the extent to which TTAM and Donoghue might derive ancillary (or fall-out) benefits as a result of their relationships with the Funds. For example, the Board noted that TTAM and Donoghue may engage in soft dollar transactions in the future, although neither currently plans to do so. The Board also noted that TTAM and Donoghue may obtain a reputational benefit from the continued success of one or both Funds. Based on their review and other considerations, the Board concluded, in the exercise of its reasonable business judgment, that ancillary benefits were not a material factor in connection with the approval of the Advisory Agreement or Sub-Advisory Agreement.
Conclusion
Based on their review of the facts and circumstances related to the Advisory Agreement and Sub-Advisory Agreement, the Trustees concluded that each Fund could benefit from TTAM’s and Donoghue’s management. Thus, the Board determined that the approval of the Advisory Agreement and Sub-Advisory Agreement with respect to each Fund was appropriate and in the best interest of each Fund. In their deliberations, the Board did not identify any particular information that was all-important or controlling, and each Trustee may have attributed different weights to different factors. Based on their review, including consideration of each of the factors referenced above, the Trustees determined, in the exercise of their reasonable business judgment, that the advisory and sub-advisory
TrimTabs ETF Trust
ADDITIONAL INFORMATION
January 31, 2021 (Unaudited) (Continued)
arrangements for each Fund, as outlined in the Advisory Agreement and Sub-Advisory Agreement, respectively, were fair and reasonable in light of the services proposed to be performed, expenses to be incurred and such other matters as the Board considered relevant.
After full consideration of the above factors as well as other factors, the Board, including the Independent Trustees, unanimously approved the Advisory Agreement and Sub-Advisory Agreement on behalf of each Fund.
6. REVIEW OF LIQUIDITY RISK MANAGEMENT PROGRAM
Pursuant to Rule 22e-4 under the 1940 Act (the “Rule”), each series (each, a “Fund,” and, collectively, the “Funds”) of TrimTabs ETF Trust (the “Trust”) has adopted a liquidity risk management program (the “Program”) to govern the Funds’ approach to managing liquidity risk, which is the risk that a Fund would not be able to meet redemption requests without significant dilution of remaining investors’ interests in the Fund. The Program is overseen by TrimTabs Asset Management, LLC, investment adviser to the Funds, as the Funds’ Liquidity Risk Management Program Administrator (the “Program Administrator”), and the Program’s principal objectives include assessing, managing and periodically reviewing each Fund’s liquidity risk (no less frequently than annually), based on factors specific to the circumstances of the Funds. In this regard, each Fund qualifies as an “In-Kind ETF” under the Rule because it meets redemptions through in-kind transfers of securities, positions, and assets other than a de minimis amount of cash and publishes its portfolio holdings daily. In-Kind ETFs are exempt from the Rule’s classification and highly liquid investment minimum provisions.
At a meeting of the Board of Trustees of the Trust (the “Board”) held on September 22, 2020, the Board received a report from the Program Administrator (the “Report”) addressing the operation and management of the Program for the period from June 1, 2019 through May 31, 2020 (the “Review Period”), with respect to the following Funds: TrimTabs U.S. Free Cash Flow Quality ETF (“TTAC”) and TrimTabs International Free Cash Flow Quality ETF (“TTAI”). The Report noted that for the Review Period, the Program Administrator believed that the Program operated effectively in all material respects and that existing procedures, controls and safeguards were appropriately designed to enable the Program Administrator to administer the Program in compliance with the Rule. The Report noted that, during the Review Period, there were no events that created liquidity related concerns for TTAC or TTAI, as the Funds’ investments were all highly liquid and all orders were transacted in kind with only a de minimis amount of cash. Further, the Report noted that no material changes were made to the Program as a result of the Program Administrator’s annual review.
There can be no assurance that the Program will achieve its objectives in the future. Please refer to a Fund’s prospectus for more information regarding the Fund’s exposure to liquidity risk and other principal risks to which an investment in that Fund may be subject.
TrimTabs ETF Trust
ADDITIONAL INFORMATION
January 31, 2021 (Unaudited) (Continued)
7. TRUSTEES AND OFFICERS
Additional information about each Trustee of the Trust is set forth below. The address of each Trustee of the Trust is c/o TrimTabs Asset Management, LLC 1345 Avenue of the Americas, 2nd Floor, New York, NY, 10105. The Funds’ Statement of Additional Information includes additional information about the Trustees and is available without charge, upon request, by calling toll-free at 1-800-617-0004.
| | | Term of | | Number of | |
| | | Office | | Portfolios | Other |
| | | and | Principal | in Fund | Directorships |
| | Position(s) | Length | Occupation(s) | Complex | Held by Trustee |
| Name, Year | Held with | of Time | During Past | Overseen | During Past |
of Birth | the Trust | Served | Five Years | by Trustee | Five Years |
| Independent Trustees | | | | | |
| Stephen J. Posner | Trustee | Since | Retired Since | 4 | Director, TrimTabs |
| YOB: 1944 | | 2014 | 2014; Financial | | Investment Research |
| | | | Adviser, Wunderlich | | (2016-2017)** |
| | | | Securities, Inc. | | |
| | | | (2005-2014) | | |
| | | | | | |
| David A. Kelly | Trustee | Since | Founder and | 4 | Member, Audit |
| YOB: 1938 | | 2015 | President, Three | | Committee, |
| | | | Lakes Advisors, Inc. | | Greenwich Historical |
| | | | (1996-present) | | Society (2011-2013) |
| | | | | | |
| Interested Trustee* | | | | | |
| Charles Biderman | Trustee; | Trustee | Consultant, | 4 | None |
| YOB: 1946 | formerly | since | Informa TrimTabs | | |
| | President | 2014; | (2017-2017); | | |
| | | President | Founder, TrimTabs | | |
| | | from 2014 | Asset Management, | | |
| | | to 2017 | LLC (1990-present); | | |
| | | | Founder and Chief | | |
| | | | Executive Officer, | | |
| | | | TrimTabs Investment | | |
| | | | Research (1990-2017); | | |
| | | | President, TrimTabs | | |
| | | | Index Services, LLC | | |
| | | | (2014-2016) | | |
| * | Mr. Biderman is an “interested person,” as defined by the Investment Company Act of 1940, as amended, because of his employment with and ownership interest in TrimTabs. |
| ** | TrimTabs Investment Research does not control and is not controlled by or under common control with the Adviser. |
TrimTabs ETF Trust
ADDITIONAL INFORMATION
January 31, 2021 (Unaudited) (Continued)
| | | Term of | |
| | Position(s) | Office and | |
| Name, Year | Held with | Length of | |
of Birth | the Trust | Time Served | Principal Occupation(s) During Past Five Years |
| Officers | | | |
| Bob Shea | President | Since | CEO and Chief Investment Officer, TrimTabs Asset |
| YOB: 1962 | and | January 2021 | Management, LLC (2020-Present) and Portfolio |
| | Principal | | Manager (2021-Present); President and Co-Chief |
| | Executive | | Investment Officer, W.E. Donoghue & Co., LLC |
| | Officer | | (2017-2019); Co-Founder, CEO and Strategic Advisor, |
| | | | JA Forlines Global (2009-2017) |
| | | | |
| Derin Cohen | Chief | Chief | Chief Operating & Compliance Officer, TrimTabs Asset |
| YOB:1991 | Compliance | Compliance | Management, LLC (2019-present) and Vice President, |
| | Officer and | Officer, | Marketing and Operations (2017-2019); Lead |
| | Anti-Money | Anti-Money | Generation Associate, SinglePlatform (2017-2017); |
| | Laundering | Laundering | Internal Control Associate, Maxim Group LLC, |
| | Officer | Officer | (2013-2017) |
| | Formerly: | since 2019; | |
| | Vice | Vice President | |
| | President | (2018-2019) | |
| | | | |
| Vince (Qijun) Chen | Vice | Since 2019 | Quantitative Analyst, TrimTabs Asset Management, LLC |
| YOB: 1994 | President, | | (2017-Present) and Portfolio Manager (2021-Present); |
| | Treasurer, | | Application Developer, NYC Human Resources |
| | and | | Administration (2017-2017) |
| | Principal | | |
| | Financial | | |
| | Officer | | |
Investment Adviser
TrimTabs Asset Management, LLC
1345 Avenue of the Americas, 2nd Floor
New York, NY 10105
Investment Sub-Adviser
Donoghue Forlines LLC
One International Place, Suite 2920
Boston, MA 02110
Distributor
Quasar Distributors, LLC
111 East Kilbourn Avenue, Suite 2200
Milwaukee, WI 53202
Administrator, Fund Accountant & Transfer Agent
U.S. Bancorp Fund Services, LLC
615 East Michigan Street
Milwaukee, WI 53202
Custodian
U.S. Bank, N.A.
1555 North RiverCenter Drive, Suite 302
Milwaukee, WI 53212
Independent Registered Public Accounting Firm
BBD, LLP
1835 Market Street, 3rd Floor
Philadelphia, PA 19103
Legal Counsel
Stradley Ronon Stevens & Young, LLP
2005 Market Street, Suite 2600
Philadelphia, PA 19103-7018
Item 2. Code of Ethics.
Not applicable for semi-annual reports.
Item 3. Audit Committee Financial Expert.
Not applicable for semi-annual reports.
Item 4. Principal Accountant Fees and Services.
Not applicable for semi-annual reports.
Item 5. Audit Committee of Listed Registrants.
Not applicable for semi-annual reports.
Item 6. Investments.
Schedule of Investments is included as part of the report to shareholders filed under Item 1 of this Form.
Item 7. Disclosure of Proxy Voting Policies and Procedures for Closed-End Management Investment Companies.
Not applicable to open-end investment companies.
Item 8. Portfolio Managers of Closed-End Management Investment Companies.
Not applicable to open-end investment companies.
Item 9. Purchases of Equity Securities by Closed‑End Management Investment Company and Affiliated Purchasers.
Not applicable to open-end investment companies.
Item 10. Submission of Matters to a Vote of Security Holders.
There have been no material changes to the procedures by which shareholders may recommend nominees to the registrant’s board of TrimTabs ETF Trust.
Item 11. Controls and Procedures.
(a) | The Registrant’s President/Principal Executive Officer and Treasurer/Principal Financial Officer have reviewed the Registrant's disclosure controls and procedures (as defined in Rule 30a-3(c) under the Investment Company Act of 1940 (the “Act”)) as of a date within 90 days of the filing of this report, as required by Rule 30a-3(b) under the Act and Rules 13a-15(b) or 15d‑15(b) under the Securities Exchange Act of 1934. Based on their review, such officers have concluded that the disclosure controls and procedures are effective in ensuring that information required to be disclosed in this report is appropriately recorded, processed, summarized and reported and made known to them by others within the Registrant and by the Registrant’s service provider. |
(b) | There were no changes in the Registrant's internal control over financial reporting (as defined in Rule 30a-3(d) under the Act) that occurred during the period covered by this report that have materially affected, or are reasonably likely to materially affect, the Registrant's internal control over financial reporting. |
Item 12. Disclosure of Securities Lending Activities for Closed-End Management Investment Companies
Not applicable to open-end investment companies.
Item 13. Exhibits.
| (a) | (1) Any code of ethics or amendment thereto, that is the subject of the disclosure required by Item 2, to the extent that the registrant intends to satisfy Item 2 requirements through filing an exhibit. Not applicable. |
(3) Any written solicitation to purchase securities under Rule 23c‑1 under the Act sent or given during the period covered by the report by or on behalf of the registrant to 10 or more persons. Not applicable to open-end investment companies.
(4) Change in the registrant’s independent public accountant. There was no change in the registrant’s independent public accountant for the period covered by this report.
SIGNATURES
Pursuant to the requirements of the Securities Exchange Act of 1934 and the Investment Company Act of 1940, the registrant has duly caused this report to be signed on its behalf by the undersigned, thereunto duly authorized.
(Registrant) TrimTabs ETF Trust
By (Signature and Title)* /s/Bob Shea
Bob Shea, President (Principal Executive Officer)
Date April 1, 2021
Pursuant to the requirements of the Securities Exchange Act of 1934 and the Investment Company Act of 1940, this report has been signed below by the following persons on behalf of the registrant and in the capacities and on the dates indicated.
By (Signature and Title)* /s/Bob Shea
Bob Shea, President (Principal Executive Officer)
Date April 1, 2021
By (Signature and Title)* /s/Vince (Qijun) Chen
Vince (Qijun) Chen, Treasurer (Principal Financial Officer)
Date April 1, 2021
* Print the name and title of each signing officer under his or her signature.