UNITED STATES
SECURITIES AND EXCHANGE COMMISSION
Washington, D.C. 20549
FORM N-CSR
CERTIFIED SHAREHOLDER REPORT OF REGISTERED
MANAGEMENT INVESTMENT COMPANIES
Investment Company Act file number 811-22957
Invesco Management Trust
(Exact name of registrant as specified in charter)
11 Greenway Plaza, Suite 1000 Houston, Texas 77046
(Address of principal executive offices) (Zip code)
Sheri Morris 11 Greenway Plaza, Suite 1000 Houston, Texas 77046
(Name and address of agent for service)
Registrant’s telephone number, including area code: (713) 626-1919
Date of fiscal year end: 8/31
Date of reporting period: 8/31/21
ITEM 1. REPORTS TO STOCKHOLDERS.
(a) The Registrant’s annual report transmitted to shareholders pursuant to Rule 30e-1 under the Investment Company Act of 1940 is as follows:
(b) Not Applicable

| | |
| Annual Report to Shareholders | | August 31, 2021 |
Invesco Conservative Income Fund
Nasdaq:
A: ICIVX ∎ Y: ICIYX ∎ Institutional: ICIFX ∎ R6: ICIRX
Management’s Discussion of Fund Performance
| | | | |
Performance summary For the fiscal year ended August 31, 2021, Class A shares of Invesco Conservative Income Fund (the Fund), at net asset value (NAV), outperformed the ICE BofAML US Treasury Bill Index, the Fund’s broad market/style-specific benchmark. Your Fund’s long-term performance appears later in this report. | |
Fund vs. Indexes | | | | |
Total returns, 8/31/20 to 8/31/21 | | | | |
Class A Shares | | | 0.10 | % |
Class Y Shares | | | 0.34 | |
Institutional Class Shares | | | 0.34 | |
Class R6 Shares | | | 0.24 | |
ICE BofAML US Treasury Bill Index▼ (Broad Market/Style-Specific Index) | | | 0.08 | |
Lipper Ultra Short Obligations Funds Index∎ (Peer Group Index) | | | 0.65 | |
Source(s): ▼Bloomberg LP ; ∎Lipper Inc. | | | | |
| | |
Market conditions and your Fund The fiscal year was dominated by the corona-virus (COVID-19), which affected both overall US economic growth and financial markets alike. Despite continued concerns over the impact of the virus, investors witnessed an expanding US economy, solid corporate earnings, and an easier monetary policy by the US Federal Reserve (the Fed), which helped to propel risk assets higher, particularly equities. The economic recovery following the initial contraction caused by the onset of the virus was swift and more rapid than anticipated, with growth outcomes beating expectations due to a rapid re-opening of global economies and an effective and quick policy response. The first half of the fiscal year had markets experience an increase in volatility ahead of the November US presidential election, which saw the election of President Biden. The development of several vaccines with high levels of efficacy protecting against COVID-19 also made headlines, providing relief and serving as a catalyst for a strong market rally as well. The second half of the fiscal year saw the emergence of the Delta variant, along with an increase in vaccination rates. During the fiscal year, the Fed kept monetary policy accommodative, maintaining a zero-interest rate environment with the Federal Funds rate at a range of 0.00% to 0.25%.1 The Federal Open Markets | | rates at the very front end of the curve declined, with 3- and 6-month Treasury Bill yields decreasing 6 bps each to 0.04% and 0.05% respectively. The ICE BofA 0-3 months US Treasury Bill Index yielded 0.05% on August 31, 2021, down 5 bps from a year earlier.2 The three-month US dollar LIBOR also declined 12 bps to 0.12% over the fiscal year.2 During the fiscal year, the Fund’s outperformance versus its broad market/style-specific benchmark was primarily generated by the Fund’s overweight allocation to investment-grade corporate debt, commercial paper and asset-backed securities. Regarding corporate bond holdings, the Fund ended the fiscal year with an allocation of 31% in the financial sector, 4% in the industrial sector and 4% in consumer noncyclical. The Fund’s allocation to money market securities was 49% at the end of the fiscal year. Additionally, meaningful contributors to the Fund’s performance versus the broad market/style-specific benchmark during the fiscal year were corporate issues, credit card asset-backed securities and automobile asset-backed securities. The Fund’s duration exposure detracted from relative performance. However, this was offset by the positive contributions of sector and security selection. |
| | |
Committee (FOMC) also upheld monthly asset purchases at $120 billion per month throughout the fiscal year. One technical rate adjustment occurred during the fiscal year at the June FOMC meeting, where the committee moved to increase the administered rates on excess reserves (IOER) and reverse repurchase agreements (RRP) by 5 basis points (bps) to 15 bps and 5 bps, respectively (a basis point is one one-hundredth of a percentage point). This caused the floor on short rates to come up off the zero bound. The Treasury curve steepened over the fiscal year, with the ten-year US Treasury yield having increased 61 bps to 1.31%2 and reflecting inflation concerns, while interest | | We wish to remind you that the Fund is subject to interest rate risk, meaning when interest rates rise, the value of fixed-income securities tends to fall. The risk may be greater in the current market environment because interest rates are near historic lows. The degree to which the value of fixed-income securities may decline due to rising interest rates may vary depending on the speed and magnitude of the increase in interest rates, as well as individual security characteristics, such as price, maturity, duration, coupon and market forces, such as supply and demand for similar securities. We are monitoring interest rates, as well as the market, economic and geopolitical factors that may impact the direction, speed and magnitude of changes to interest rates across the maturity spectrum, including the potential impact of monetary |
policy changes by the Fed and foreign central banks. If interest rates rise or fall faster than expected, markets may experience increased volatility, which may affect the value and/or liquidity of certain of the Fund’s investments.
Thank you for investing in Invesco Conservative Income Fund.
1 Source: US Federal Reserve
2 Source: US Department of Treasury, Bloomberg
Portfolio manager(s):
Laurie Brignac
Joseph Madrid
Marques Mercier
The views and opinions expressed in management’s discussion of Fund performance are those of Invesco Advisers, Inc. These views and opinions are subject to change at any time based on factors such as market and economic conditions. These views and opinions may not be relied upon as investment advice or recommendations, or as an offer for a particular security. The information is not a complete analysis of every aspect of any market, country, industry, security or the Fund. Statements of fact are from sources considered reliable, but Invesco Advisers, Inc. makes no representation or warranty as to their completeness or accuracy. Although historical performance is no guarantee of future results, these insights may help you understand our investment management philosophy.
See important Fund and, if applicable, index disclosures later in this report.
| | |
| 2 | | Invesco Conservative Income Fund |
Your Fund’s Long-Term Performance
Results of a $10,000 Investment — Oldest Share Class(es) since Inception
Fund and index data from 7/1/14
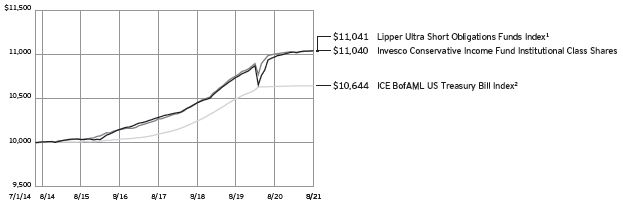
Past performance cannot guarantee future results.
The data shown in the chart include reinvested distributions and Fund expenses
including management fees. Index results include reinvested dividends. Performance of the peer group, if applicable, reflects fund expenses and management fees;
performance of a market index does not. Performance shown in the chart does not reflect deduction of taxes a shareholder would pay on Fund distributions or sale of Fund shares.
| | |
| 3 | | Invesco Conservative Income Fund |
| | | | |
Average Annual Total Returns As of 8/31/21 | | | | |
Class A Shares | | | | |
Inception | | | 1.28 | % |
5 Years | | | 1.59 | |
1 Year | | | 0.10 | |
Class Y Shares | | | | |
Inception | | | 1.39 | % |
5 Years | | | 1.70 | |
1 Year | | | 0.34 | |
Institutional Class Shares | | | | |
Inception (7/1/14) | | | 1.39 | % |
5 Years | | | 1.71 | |
1 Year | | | 0.34 | |
Class R6 Shares | | | | |
Inception | | | 1.40 | % |
5 Years | | | 1.73 | |
1 Year | | | 0.24 | |
Class A shares incepted on April 2, 2018. Performance shown prior to that date is that of Institutional Class shares restated to reflect the higher 12b-1 fees applicable to Class A shares.
Class Y shares incepted on December 10, 2019. Performance shown prior to that date is that of Institutional Class shares and includes the 12b-1 fees applicable to Institutional Class shares.
Class R6 shares incepted on May 15, 2020. Performance shown prior to that date is that of Institutional Class shares and includes the 12b-1 fees applicable to Institutional Class shares.
The performance data quoted represent past performance and cannot guarantee future results; current performance may be lower or higher. Please visit invesco.com/ performance for the most recent month-end performance. Performance figures reflect reinvested distributions and changes in net asset value unless otherwise stated. Performance figures do not reflect deduction of taxes a shareholder would pay on Fund distributions or sale of Fund shares. Investment return and principal value will fluctuate so that you may have a gain or loss when you sell shares.
Class A, Class Y, Institutional Class and Class R6 shares do not have a front-end sales charge or a CDSC; therefore, performance is at net asset value.
The performance of the Fund’s share classes will differ primarily due to different sales charge structures and/or class expenses.
Fund performance reflects any applicable fee waivers and/or expense reimbursements. Had the adviser not waived fees and/or reimbursed expenses currently or in the past, returns would have been lower. See current prospectus for more information.
| | |
| 4 | | Invesco Conservative Income Fund |
Supplemental Information
Invesco Conservative Income Fund’s investment objective is to provide capital preservation and current income while maintaining liquidity.
| ◾ | | Unless otherwise stated, information presented in this report is as of August 31, 2021, and is based on total net assets. |
| ◾ | | Unless otherwise noted, all data is provided by Invesco. |
| ◾ | | To access your Fund’s reports/prospectus, visit invesco.com/fundreports. |
About indexes used in this report
| ◾ | | The ICE BofAML US Treasury Bill Index tracks the performance of US dollar-denominated US Treasury Bills publicly issued in the US domestic market. |
| ◾ | | The Lipper Ultra Short Obligations Funds Index is an unmanaged index considered representative of ultra-short obligations funds tracked by Lipper. |
| ◾ | | The Fund is not managed to track the performance of any particular index, including the index(es) described here, and consequently, the performance of the Fund may deviate significantly from the performance of the index(es). |
| ◾ | | A direct investment cannot be made in an index. Unless otherwise indicated, index results include reinvested dividends, and they do not reflect sales charges. Performance of the peer group, if applicable, reflects fund expenses; performance of a market index does not. |
Liquidity Risk Management Program
In compliance with Rule 22e-4 under the Investment Company Act of 1940, as amended (the “Liquidity Rule”), the Fund has adopted and implemented a liquidity risk management program in accordance with the Liquidity Rule (the “Program”). The Program is reasonably designed to assess and manage the Fund’s liquidity risk, which is the risk that the Fund could not meet redemption requests without significant dilution of remaining investors’ interests in the Fund. The Board of Trustees of the Fund (the “Board”) has appointed Invesco Advisers, Inc. (“Invesco”), the Fund’s investment adviser, as the Program’s administrator, and Invesco has delegated oversight of the Program to the Liquidity Risk Management Committee (the
“Committee”), which is composed of senior representatives from relevant business groups at Invesco.
As required by the Liquidity Rule, the Program includes policies and procedures providing for an assessment, no less frequently than annually, of the Fund’s liquidity risk that takes into account, as relevant to the Fund’s liquidity risk: (1) the Fund’s investment strategy and liquidity of portfolio investments during both normal and reasonably foreseeable stressed conditions; (2) short-term and long-term cash flow projections for the Fund during both normal and reasonably foreseeable stressed conditions; and (3) the Fund’s holdings of cash and cash equivalents and any borrowing arrangements. The Liquidity Rule also requires the classification of the Fund’s investments into categories that reflect the assessment of their relative liquidity under current market conditions. The Fund classifies its investments into one of four categories defined in the Liquidity Rule: “Highly Liquid,” “Moderately Liquid,” “Less Liquid,” and “Illiquid.” Funds that are not invested primarily in “Highly Liquid Investments” that are assets (cash or investments that are reasonably expected to be convertible into cash within three business days without significantly changing the market value of the investment) are required to establish a “Highly Liquid Investment Minimum” (“HLIM”), which is the minimum percentage of net assets that must be invested in Highly Liquid Investments. Funds with HLIMs have procedures for addressing HLIM shortfalls, including reporting to the Board and the SEC (on a non-public basis) as required by the Program and the Liquidity Rule. In addition, the Fund may not acquire an investment if, immediately after the acquisition, over 15% of the Fund’s net assets would consist of “Illiquid Investments” that are assets (an
investment that cannot reasonably be expected to be sold or disposed of in current market conditions in seven calendar days or less without the sale or disposition significantly changing the market value of the investment). The Liquidity Rule and the Program also require reporting to the Board and the SEC (on a non-public basis) if a Fund’s holdings of Illiquid Investments exceed 15% of the Fund’s assets.
At a meeting held on March 22-24, 2021, the Committee presented a report to the Board that addressed the operation of the Program and assessed the Program’s adequacy and effectiveness of implementation (the “Report”). The Report covered the period from January 1, 2020 through December 31, 2020 (the “Program Reporting Period”). The Report discussed notable events affecting liquidity over the Program Reporting Period, including the impact of the coronavirus pandemic on the Fund and the overall market. The Report noted that there were no material changes to the Program during the Program Reporting Period.
The Report stated, in relevant part, that during the Program Reporting Period:
| ◾ | | The Program, as adopted and implemented, remained reasonably designed to assess and manage the Fund’s liquidity risk and was operated effectively to achieve that goal; |
| ◾ | | The Fund’s investment strategy remained appropriate for an open-end fund; |
| ◾ | | The Fund was able to meet requests for redemption without significant dilution of remaining investors’ interests in the Fund; |
| ◾ | | The Fund did not breach the 15% limit on Illiquid Investments; and |
| ◾ | | The Fund primarily held Highly Liquid Investments and therefore has not adopted an HLIM. |
|
This report must be accompanied or preceded by a currently effective Fund prospectus, which contains more complete information, including sales charges and expenses. Investors should read it carefully before investing. |
NOT FDIC INSURED | MAY LOSE VALUE | NO BANK GUARANTEE
| | |
| 5 | | Invesco Conservative Income Fund |
Fund Information
Portfolio Composition
| | |
By security type | | % of Total Investments |
U.S. Dollar Denominated Bonds & Notes | | 46.3% |
Commercial Paper | | 39.6 |
Repurchase Agreements | | 6.8 |
Asset-Backed Securities | | 5.2 |
Certificates of Deposit | | 1.5 |
U.S. Treasury Securities | | 0.6 |
Top Five Debt Issuers
| | | | |
| | | | | % of total net assets |
1. | | Entergy Corp. | | 1.2% |
2. | | Hitachi America Capital Ltd. | | 1.0 |
3. | | Lexington Parker Capital Co. LLC | | 0.9 |
4. | | Enel Finance America LLC | | 0.9 |
5. | | Keurig Dr Pepper, Inc. | | 0.9 |
The Fund’s holdings are subject to change, and there is no assurance that the Fund will continue to hold any particular security.
Data presented here are as of August 31, 2021.
| | |
| 6 | | Invesco Conservative Income Fund |
Schedule of Investments
August 31, 2021
| | | | | | | | | | | | | | | | |
| | | Interest
Rate | | | Maturity Date | | | Principal
Amount (000) | | | Value | |
U.S. Dollar Denominated Bonds & Notes-46.19%(a) | | | | | | | | | | | | | | | | |
Agricultural & Farm Machinery-0.07% | | | | | | | | | | | | | | | | |
John Deere Capital Corp. | | | 1.20% | | | | 04/06/2023 | | | $ | 2,687 | | | $ | 2,726,251 | |
Application Software-0.13% | | | | | | | | | | | | | | | | |
Intuit, Inc. | | | 0.65% | | | | 07/15/2023 | | | | 5,000 | | | | 5,030,966 | |
Automobile Manufacturers-2.77% | | | | | | | | | | | | | | | | |
American Honda Finance Corp. (3 mo. USD LIBOR + 0.37%)(b) | | | 0.50% | | | | 05/10/2023 | | | | 15,000 | | | | 15,058,461 | |
BMW US Capital LLC (Germany)(c) | | | 0.75% | | | | 08/12/2024 | | | | 11,111 | | | | 11,167,108 | |
Daimler Finance North America LLC (Germany)(c) | | | 2.55% | | | | 08/15/2022 | | | | 25,000 | | | | 25,537,072 | |
Daimler Finance North America LLC (Germany)(c) | | | 2.85% | | | | 01/06/2022 | | | | 3,441 | | | | 3,472,083 | |
Hyundai Capital America(c) | | | 0.88% | | | | 06/14/2024 | | | | 10,526 | | | | 10,490,570 | |
Hyundai Capital America(c) | | | 2.38% | | | | 02/10/2023 | | | | 6,485 | | | | 6,641,279 | |
Toyota Motor Credit Corp. (SOFR + 0.32%)(b) | | | 0.37% | | | | 04/06/2023 | | | | 20,000 | | | | 20,050,046 | |
Toyota Motor Credit Corp. | | | 0.50% | | | | 08/14/2023 | | | | 17,605 | | | | 17,676,256 | |
| | | | | | | | | | | | | | | | 110,092,875 | |
Biotechnology-1.86% | | | | | | | | | | | | | | | | |
AbbVie, Inc. (3 mo. USD LIBOR + 0.46%)(b) | | | 0.59% | | | | 11/19/2021 | | | | 28,777 | | | | 28,802,889 | |
AbbVie, Inc. | | | 5.00% | | | | 12/15/2021 | | | | 35,035 | | | | 35,096,180 | |
Gilead Sciences, Inc. | | | 0.75% | | | | 09/29/2023 | | | | 9,999 | | | | 10,002,105 | |
| | | | | | | | | | | | | | | | 73,901,174 | |
Construction Machinery & Heavy Trucks-0.36% | | | | | | | | | | | | | | | | |
Caterpillar Financial Services Corp. (3 mo. USD LIBOR + 0.20%)(b) | | | 0.32% | | | | 11/12/2021 | | | | 9,524 | | | | 9,525,186 | |
Caterpillar Financial Services Corp. (3 mo. USD LIBOR + 0.22%)(b) | | | 0.36% | | | | 01/06/2022 | | | | 4,938 | | | | 4,942,899 | |
| | | | | | | | | | | | | | | | 14,468,085 | |
Consumer Finance-0.96% | | | | | | | | | | | | | | | | |
American Express Co. (3 mo. USD LIBOR + 0.60%)(b) | | | 0.72% | | | | 11/05/2021 | | | | 18,663 | | | | 18,672,716 | |
American Express Co. | | | 2.50% | | | | 08/01/2022 | | | | 8,562 | | | | 8,724,368 | |
Capital One Bank USA N.A.(d) | | | 2.01% | | | | 01/27/2023 | | | | 10,715 | | | | 10,787,339 | |
| | | | | | | | | | | | | | | | 38,184,423 | |
Data Processing & Outsourced Services-0.44% | | | | | | | | | | | | | | | | |
Fidelity National Information Services, Inc. | | | 0.38% | | | | 03/01/2023 | | | | 3,572 | | | | 3,571,064 | |
PayPal Holdings, Inc. | | | 1.35% | | | | 06/01/2023 | | | | 9,687 | | | | 9,857,308 | |
PayPal Holdings, Inc. | | | 2.20% | | | | 09/26/2022 | | | | 4,013 | | | | 4,097,476 | |
| | | | | | | | | | | | | | | | 17,525,848 | |
Department Stores-0.37% | | | | | | | | | | | | | | | | |
7-Eleven, Inc.(c) | | | 0.63% | | | | 02/10/2023 | | | | 14,794 | | | | 14,783,471 | |
Diversified Banks-14.93% | | | | | | | | | | | | | | | | |
Australia & New Zealand Banking Group Ltd. (Australia) (3 mo. USD LIBOR + 0.49%)(b)(c) | | | 0.62% | | | | 11/21/2022 | | | | 11,163 | | | | 11,224,281 | |
Banco Santander S.A. (Spain)(d) | | | 0.70% | | | | 06/30/2024 | | | | 13,600 | | | | 13,644,208 | |
Bank of America Corp. | | | 2.50% | | | | 10/21/2022 | | | | 14,418 | | | | 14,462,093 | |
Bank of America Corp. | | | 3.30% | | | | 01/11/2023 | | | | 18,000 | | | | 18,749,721 | |
Bank of America Corp. | | | 4.10% | | | | 07/24/2023 | | | | 5,000 | | | | 5,355,107 | |
Bank of Nova Scotia (The) (Canada) | | | 0.65% | | | | 07/31/2024 | | | | 11,430 | | | | 11,439,051 | |
Bank of Nova Scotia (The) (Canada) | | | 1.63% | | | | 05/01/2023 | | | | 15,000 | | | | 15,332,986 | |
Banque Federative du Credit Mutuel S.A. (France)(c) | | | 0.65% | | | | 02/27/2024 | | | | 18,335 | | | | 18,350,432 | |
Banque Federative du Credit Mutuel S.A. (France)(c) | | | 2.13% | | | | 11/21/2022 | | | | 7,050 | | | | 7,212,089 | |
Banque Federative du Credit Mutuel S.A. (France)(c) | | | 2.70% | | | | 07/20/2022 | | | | 5,000 | | | | 5,110,080 | |
Banque Federative du Credit Mutuel S.A. (France)(c) | | | 3.75% | | | | 07/20/2023 | | | | 7,100 | | | | 7,534,869 | |
Canadian Imperial Bank of Commerce (Canada) | | | 0.45% | | | | 06/22/2023 | | | | 15,000 | | | | 15,004,274 | |
Canadian Imperial Bank of Commerce (Canada) | | | 0.50% | | | | 12/14/2023 | | | | 11,429 | | | | 11,416,290 | |
Canadian Imperial Bank of Commerce (Canada) (3 mo. USD LIBOR + 0.72%)(b) | | | 0.84% | | | | 06/16/2022 | | | | 6,732 | | | | 6,774,525 | |
See accompanying Notes to Financial Statements which are an integral part of the financial statements.
| | |
| 7 | | Invesco Conservative Income Fund |
| | | | | | | | | | | | | | | | |
| | | Interest
Rate | | | Maturity Date | | | Principal
Amount (000) | | | Value | |
Diversified Banks-(continued) | | | | | | | | | | | | | | | | |
Canadian Imperial Bank of Commerce (Canada) | | | 0.95% | | | | 06/23/2023 | | | $ | 17,045 | | | $ | 17,211,691 | |
Citigroup, Inc.(d) | | | 2.88% | | | | 07/24/2023 | | | | 11,030 | | | | 11,272,182 | |
Citizens Bank N.A. (3 mo. USD LIBOR + 0.72%)(b) | | | 0.85% | | | | 02/14/2022 | | | | 5,000 | | | | 5,012,518 | |
Cooperatieve Rabobank U.A. (Netherlands) | | | 2.75% | | | | 01/10/2023 | | | | 8,450 | | | | 8,736,927 | |
Federation des Caisses Desjardins du Quebec (Canada)(c) | | | 0.70% | | | | 05/21/2024 | | | | 9,869 | | | | 9,872,498 | |
HSBC Holdings PLC (United Kingdom)(d) | | | 0.73% | | | | 08/17/2024 | | | | 11,407 | | | | 11,431,920 | |
ING Groep N.V. (Netherlands) | | | 4.10% | | | | 10/02/2023 | | | | 14,025 | | | | 15,059,290 | |
JPMorgan Chase & Co. (SOFR + 0.58%)(b) | | | 0.63% | | | | 03/16/2024 | | | | 15,000 | | | | 15,086,657 | |
JPMorgan Chase & Co. | | | 3.25% | | | | 09/23/2022 | | | | 12,000 | | | | 12,387,299 | |
Lloyds Banking Group PLC (United Kingdom) | | | 3.00% | | | | 01/11/2022 | | | | 18,805 | | | | 18,993,254 | |
Lloyds Banking Group PLC (United Kingdom) | | | 4.05% | | | | 08/16/2023 | | | | 18,790 | | | | 20,068,611 | |
Mitsubishi UFJ Financial Group, Inc. (Japan) (3 mo. USD LIBOR + 0.79%)(b) | | | 0.92% | | | | 07/25/2022 | | | | 814 | | | | 819,370 | |
Mitsubishi UFJ Financial Group, Inc. (Japan) (3 mo. USD LIBOR + 1.06%)(b) | | | 1.18% | | | | 09/13/2021 | | | | 5,000 | | | | 5,001,695 | |
Mitsubishi UFJ Financial Group, Inc. (Japan) | | | 3.76% | | | | 07/26/2023 | | | | 10,955 | | | | 11,649,915 | |
Mizuho Financial Group, Inc. (Japan) (3 mo. USD LIBOR + 0.94%)(b) | | | 1.06% | | | | 02/28/2022 | | | | 15,702 | | | | 15,773,310 | |
MUFG Union Bank N.A. | | | 2.10% | | | | 12/09/2022 | | | | 4,500 | | | | 4,598,938 | |
National Australia Bank Ltd. (Australia) (3 mo. USD LIBOR + 0.71%)(b)(c) | | | 0.83% | | | | 11/04/2021 | | | | 20,000 | | | | 20,027,291 | |
National Bank of Canada (Canada)(d) | | | 0.90% | | | | 08/15/2023 | | | | 5,000 | | | | 5,025,879 | |
National Bank of Canada (Canada) | | | 2.10% | | | | 02/01/2023 | | | | 15,000 | | | | 15,368,387 | |
National Bank of Canada (Canada)(c) | | | 2.15% | | | | 10/07/2022 | | | | 8,714 | | | | 8,889,819 | |
Nordea Bank Abp (Finland)(c) | | | 1.00% | | | | 06/09/2023 | | | | 7,408 | | | | 7,501,798 | |
PNC Bank N.A.(d) | | | 2.03% | | | | 12/09/2022 | | | | 15,000 | | | | 15,071,524 | |
Royal Bank of Canada (Canada) | | | 0.50% | | | | 10/26/2023 | | | | 11,764 | | | | 11,796,034 | |
Royal Bank of Canada (Canada) (3 mo. USD LIBOR + 0.47%)(b) | | | 0.60% | | | | 04/29/2022 | | | | 10,000 | | | | 10,029,461 | |
Royal Bank of Canada (Canada) | | | 1.60% | | | | 04/17/2023 | | | | 20,000 | | | | 20,437,282 | |
Skandinaviska Enskilda Banken AB (Sweden)(c) | | | 0.55% | | | | 09/01/2023 | | | | 13,515 | | | | 13,554,464 | |
Standard Chartered PLC (United Kingdom)(c)(d) | | | 1.32% | | | | 10/14/2023 | | | | 4,546 | | | | 4,581,489 | |
Sumitomo Mitsui Financial Group, Inc. (Japan) | | | 0.51% | | | | 01/12/2024 | | | | 1,364 | | | | 1,363,019 | |
Sumitomo Mitsui Financial Group, Inc. (Japan) (3 mo. USD LIBOR + 1.14%)(b) | | | 1.27% | | | | 10/19/2021 | | | | 4,275 | | | | 4,281,625 | |
Sumitomo Mitsui Trust Bank Ltd. (Japan)(c) | | | 0.80% | | | | 09/12/2023 | | | | 11,103 | | | | 11,197,881 | |
Swedbank AB (Sweden)(c) | | | 0.60% | | | | 09/25/2023 | | | | 12,121 | | | | 12,154,860 | |
Swedbank AB (Sweden)(c) | | | 1.30% | | | | 06/02/2023 | | | | 12,000 | | | | 12,192,720 | |
Toronto-Dominion Bank (The) (Canada) | | | 0.45% | | | | 09/11/2023 | | | | 20,000 | | | | 20,025,934 | |
Toronto-Dominion Bank (The) (Canada) (3 mo. USD LIBOR + 0.35%)(b) | | | 0.49% | | | | 07/22/2022 | | | | 10,000 | | | | 10,003,940 | |
Toronto-Dominion Bank (The) (Canada) (SOFR + 0.48%)(b) | | | 0.53% | | | | 01/27/2023 | | | | 9,108 | | | | 9,163,421 | |
Toronto-Dominion Bank (The) (Canada) | | | 0.75% | | | | 06/12/2023 | | | | 15,000 | | | | 15,117,462 | |
U.S. Bank N.A. (3 mo. USD LIBOR + 0.38%)(b) | | | 0.51% | | | | 11/16/2021 | | | | 3,000 | | | | 3,001,716 | |
U.S. Bank N.A. (3 mo. USD LIBOR + 0.44%)(b) | | | 0.57% | | | | 05/23/2022 | | | | 10,000 | | | | 10,027,424 | |
Westpac Banking Corp. (Australia) | | | 2.00% | | | | 01/13/2023 | | | | 7,499 | | | | 7,684,988 | |
| | | | | | | | | | | | | | | | 593,084,499 | |
Diversified Capital Markets-2.19% | | | | | | | | | | | | | | | | |
Credit Suisse AG (Switzerland) (SOFR + 0.45%)(b) | | | 0.50% | | | | 02/04/2022 | | | | 15,000 | | | | 15,024,090 | |
Credit Suisse AG (Switzerland) | | | 0.50% | | | | 02/02/2024 | | | | 14,000 | | | | 13,989,725 | |
Credit Suisse AG (Switzerland) | | | 1.00% | | | | 05/05/2023 | | | | 13,636 | | | | 13,780,899 | |
Macquarie Bank Ltd. (Australia) (3 mo. USD LIBOR + 0.45%)(b)(c) | | | 0.58% | | | | 11/24/2021 | | | | 15,000 | | | | 15,016,461 | |
UBS AG (Switzerland)(c) | | | 0.38% | | | | 06/01/2023 | | | | 13,889 | | | | 13,884,156 | |
UBS AG (Switzerland)(c) | | | 0.70% | | | | 08/09/2024 | | | | 5,722 | | | | 5,728,319 | |
UBS Group AG (Switzerland)(c) | | | 2.65% | | | | 02/01/2022 | | | | 9,500 | | | | 9,597,206 | |
| | | | | | | | | | | | | | | | 87,020,856 | |
See accompanying Notes to Financial Statements which are an integral part of the financial statements.
| | |
| 8 | | Invesco Conservative Income Fund |
| | | | | | | | | | | | | | | | |
| | | Interest
Rate | | | Maturity Date | | | Principal
Amount (000) | | | Value | |
Electric Utilities-1.98% | | | | | | | | | | | | | | | | |
American Electric Power Co., Inc., Series M | | | 0.75% | | | | 11/01/2023 | | | $ | 4,557 | | | $ | 4,557,665 | |
Duke Energy Florida LLC, Series A (3 mo. USD LIBOR + 0.25%)(b) | | | 0.37% | | | | 11/26/2021 | | | | 5,000 | | | | 5,000,850 | |
Duke Energy Progress LLC, Series A (3 mo. USD LIBOR + 0.18%)(b) | | | 0.30% | | | | 02/18/2022 | | | | 9,756 | | | | 9,756,219 | |
Florida Power & Light Co. (SOFR + 0.25%)(b) | | | 0.30% | | | | 05/10/2023 | | | | 17,392 | | | | 17,396,500 | |
NextEra Energy Capital Holdings, Inc. (SOFR + 0.54%)(b) | | | 0.59% | | | | 03/01/2023 | | | | 3,704 | | | | 3,717,746 | |
NextEra Energy Capital Holdings, Inc. | | | 0.65% | | | | 03/01/2023 | | | | 15,460 | | | | 15,524,848 | |
NextEra Energy Capital Holdings, Inc. | | | 2.90% | | | | 04/01/2022 | | | | 9,107 | | | | 9,246,075 | |
Southern California Edison Co., Series D (3 mo. USD LIBOR + 0.27%)(b) | | | 0.39% | | | | 12/03/2021 | | | | 13,493 | | | | 13,496,007 | |
| | | | | | | | | | | | | | | | 78,695,910 | |
| | | | |
Financial Exchanges & Data-0.13% | | | | | | | | | | | | | | | | |
Intercontinental Exchange, Inc. | | | 0.70% | | | | 06/15/2023 | | | | 4,939 | | | | 4,966,051 | |
Gas Utilities-0.61% | | | | | | | | | | | | | | | | |
Atmos Energy Corp. (3 mo. USD LIBOR + 0.38%)(b) | | | 0.50% | | | | 03/09/2023 | | | | 9,756 | | | | 9,751,444 | |
CenterPoint Energy Resources Corp. (3 mo. USD LIBOR + 0.50%)(b) | | | 0.62% | | | | 03/02/2023 | | | | 14,493 | | | | 14,497,564 | |
| | | | | | | | | | | | | | | | 24,249,008 | |
| | | | |
Health Care Distributors-0.26% | | | | | | | | | | | | | | | | |
AmerisourceBergen Corp. | | | 0.74% | | | | 03/15/2023 | | | | 10,170 | | | | 10,187,886 | |
Industrial Conglomerates-0.23% | | | | | | | | | | | | | | | | |
Siemens Financieringsmaatschappij N.V. (Germany) (SOFR + 0.43%)(b)(c) | | | 0.48% | | | | 03/11/2024 | | | | 8,905 | | | | 8,974,716 | |
Integrated Oil & Gas-1.40% | | | | | | | | | | | | | | | | |
BP Capital Markets America, Inc. | | | 2.94% | | | | 04/06/2023 | | | | 23,220 | | | | 24,180,964 | |
Exxon Mobil Corp. | | | 1.57% | | | | 04/15/2023 | | | | 12,409 | | | | 12,663,704 | |
Shell International Finance B.V. (Netherlands) | | | 0.38% | | | | 09/15/2023 | | | | 13,333 | | | | 13,353,504 | |
Suncor Energy, Inc. (Canada) | | | 2.80% | | | | 05/15/2023 | | | | 5,116 | | | | 5,308,436 | |
| | | | | | | | | | | | | | | | 55,506,608 | |
| | | | |
Integrated Telecommunication Services-0.51% | | | | | | | | | | | | | | | | |
AT&T, Inc. (SOFR + 0.64%)(b) | | | 0.69% | | | | 03/25/2024 | | | | 9,918 | | | | 9,940,605 | |
Verizon Communications, Inc. (SOFR + 0.50%)(b) | | | 0.55% | | | | 03/22/2024 | | | | 10,417 | | | | 10,491,989 | |
| | | | | | | | | | | | | | | | 20,432,594 | |
| | | | |
Investment Banking & Brokerage-2.24% | | | | | | | | | | | | | | | | |
Goldman Sachs Group, Inc. (The) | | | 0.48% | | | | 01/27/2023 | | | | 13,250 | | | | 13,253,756 | |
Goldman Sachs Group, Inc. (The)(d) | | | 0.63% | | | | 11/17/2023 | | | | 26,389 | | | | 26,433,394 | |
Goldman Sachs Group, Inc. (The) | | | 5.75% | | | | 01/24/2022 | | | | 15,000 | | | | 15,328,399 | |
Morgan Stanley(d) | | | 0.56% | | | | 11/10/2023 | | | | 7,999 | | | | 8,014,421 | |
Morgan Stanley(d) | | | 0.73% | | | | 04/05/2024 | | | | 10,714 | | | | 10,750,847 | |
Morgan Stanley | | | 2.75% | | | | 05/19/2022 | | | | 15,000 | | | | 15,274,653 | |
| | | | | | | | | | | | | | | | 89,055,470 | |
Life & Health Insurance-5.65% | | | | | | | | | | | | | | | | |
Athene Global Funding (SOFR + 0.70%)(b)(c) | | | 0.75% | | | | 05/24/2024 | | | | 25,000 | | | | 25,144,572 | |
Athene Global Funding(c) | | | 0.95% | | | | 01/08/2024 | | | | 10,000 | | | | 10,063,924 | |
Athene Global Funding(c) | | | 1.20% | | | | 10/13/2023 | | | | 17,232 | | | | 17,461,186 | |
Athene Global Funding(c) | | | 2.80% | | | | 05/26/2023 | | | | 4,927 | | | | 5,120,960 | |
Brighthouse Financial Global Funding(c) | | | 0.60% | | | | 06/28/2023 | | | | 3,255 | | | | 3,259,141 | |
Equitable Financial Life Global Funding (SOFR + 0.39%)(b)(c) | | | 0.44% | | | | 04/06/2023 | | | | 20,000 | | | | 20,048,371 | |
Equitable Financial Life Global Funding(c) | | | 0.80% | | | | 08/12/2024 | | | | 11,429 | | | | 11,455,625 | |
GA Global Funding Trust(c) | | | 1.00% | | | | 04/08/2024 | | | | 17,218 | | | | 17,346,949 | |
Jackson National Life Global Funding (SOFR + 0.60%)(b)(c) | | | 0.65% | | | | 01/06/2023 | | | | 10,000 | | | | 10,056,461 | |
MassMutual Global Funding II (SOFR + 0.36%)(b)(c) | | | 0.41% | | | | 04/12/2024 | | | | 15,020 | | | | 15,056,896 | |
MassMutual Global Funding II(c) | | | 0.85% | | | | 06/09/2023 | | | | 14,150 | | | | 14,294,356 | |
MET Tower Global Funding (SOFR + 0.55%)(b)(c) | | | 0.60% | | | | 01/17/2023 | | | | 10,000 | | | | 10,056,584 | |
New York Life Global Funding (3 mo. USD LIBOR + 0.44%)(b)(c) | | | 0.56% | | | | 07/12/2022 | | | | 8,889 | | | | 8,921,137 | |
New York Life Global Funding(c) | | | 1.10% | | | | 05/05/2023 | | | | 3,244 | | | | 3,284,797 | |
Pacific Life Global Funding II(c) | | | 0.50% | | | | 09/23/2023 | | | | 13,636 | | | | 13,674,098 | |
Principal Life Global Funding II (SOFR + 0.45%)(b)(c) | | | 0.50% | | | | 04/12/2024 | | | | 5,883 | | | | 5,899,772 | |
See accompanying Notes to Financial Statements which are an integral part of the financial statements.
| | |
| 9 | | Invesco Conservative Income Fund |
| | | | | | | | | | | | | | | | |
| | | Interest
Rate | | | Maturity Date | | | Principal
Amount
(000) | | | Value | |
Life & Health Insurance-(continued) | | | | | | | | | | | | | | | | |
Principal Life Global Funding II(c) | | | 0.75% | | | | 08/23/2024 | | | $ | 8,695 | | | $ | 8,712,155 | |
Protective Life Global Funding(c) | | | 0.63% | | | | 10/13/2023 | | | | 5,082 | | | | 5,106,545 | |
Protective Life Global Funding(c) | | | 1.08% | | | | 06/09/2023 | | | | 15,500 | | | | 15,712,396 | |
Reliance Standard Life Global Funding II(c) | | | 2.15% | | | | 01/21/2023 | | | | 3,700 | | | | 3,783,278 | |
| | | | | | | | | | | | | | | | 224,459,203 | |
| | | | |
Managed Health Care-0.10% | | | | | | | | | | | | | | | | |
Humana, Inc. | | | 0.65% | | | | 08/03/2023 | | | | 3,889 | | | | 3,892,156 | |
Movies & Entertainment-0.12% | | | | | | | | | | | | | | | | |
Walt Disney Co. (The) (3 mo. USD LIBOR + 0.25%)(b) | | | 0.39% | | | | 09/01/2021 | | | | 4,762 | | | | 4,762,000 | |
Multi-line Insurance-0.34% | | | | | | | | | | | | | | | | |
Metropolitan Life Global Funding I (SOFR + 0.57%)(b)(c) | | | 0.62% | | | | 01/13/2023 | | | | 3,749 | | | | 3,771,421 | |
Metropolitan Life Global Funding I(c) | | | 0.90% | | | | 06/08/2023 | | | | 9,524 | | | | 9,622,209 | |
| | | | | | | | | | | | | | | | 13,393,630 | |
| | | | |
Multi-Utilities-0.54% | | | | | | | | | | | | | | | | |
Black Hills Corp. | | | 1.04% | | | | 08/23/2024 | | | | 10,667 | | | | 10,684,479 | |
DTE Energy Co., Series H | | | 0.55% | | | | 11/01/2022 | | | | 10,830 | | | | 10,860,048 | |
| | | | | | | | | | | | | | | | 21,544,527 | |
| | | | |
Oil & Gas Refining & Marketing-0.88% | | | | | | | | | | | | | | | | |
Phillips 66 | | | 0.90% | | | | 02/15/2024 | | | | 7,814 | | | | 7,818,813 | |
Phillips 66 | | | 3.70% | | | | 04/06/2023 | | | | 14,000 | | | | 14,707,381 | |
Phillips 66 | | | 4.30% | | | | 04/01/2022 | | | | 12,000 | | | | 12,278,481 | |
| | | | | | | | | | | | | | | | 34,804,675 | |
| | | | |
Oil & Gas Storage & Transportation-0.34% | | | | | | | | | | | | | | | | |
Enbridge, Inc. (Canada) (SOFR + 0.40%)(b) | | | 0.45% | | | | 02/17/2023 | | | | 3,571 | | | | 3,580,312 | |
TransCanada PipeLines Ltd. (Canada) | | | 2.50% | | | | 08/01/2022 | | | | 9,630 | | | | 9,825,198 | |
| | | | | | | | | | | | | | | | 13,405,510 | |
| | | | |
Other Diversified Financial Services-0.84% | | | | | | | | | | | | | | | | |
AIG Global Funding(c) | | | 0.80% | | | | 07/07/2023 | | | | 7,317 | | | | 7,384,171 | |
AIG Global Funding, Series 2019-A2, Class A(c) | | | 2.30% | | | | 07/01/2022 | | | | 5,000 | | | | 5,083,114 | |
USAA Capital Corp.(c) | | | 0.50% | | | | 05/01/2024 | | | | 7,500 | | | | 7,487,487 | |
USAA Capital Corp.(c) | | | 1.50% | | | | 05/01/2023 | | | | 12,960 | | | | 13,223,116 | |
| | | | | | | | | | | | | | | | 33,177,888 | |
| | | | |
Packaged Foods & Meats-0.15% | | | | | | | | | | | | | | | | |
Tyson Foods, Inc. | | | 4.50% | | | | 06/15/2022 | | | | 6,000 | | | | 6,133,951 | |
Paper Products-0.31% | | | | | | | | | | | | | | | | |
Georgia-Pacific LLC(c) | | | 3.73% | | | | 07/15/2023 | | | | 11,850 | | | | 12,492,796 | |
Personal Products-0.28% | | | | | | | | | | | | | | | | |
Unilever Capital Corp. (United Kingdom) | | | 0.38% | | | | 09/14/2023 | | | | 3,917 | | | | 3,924,075 | |
Unilever Capital Corp. (United Kingdom) | | | 0.63% | | | | 08/12/2024 | | | | 7,000 | | | | 7,010,044 | |
| | | | | | | | | | | | | | | | 10,934,119 | |
| | | | |
Pharmaceuticals-0.81% | | | | | | | | | | | | | | | | |
AstraZeneca PLC (United Kingdom) | | | 0.30% | | | | 05/26/2023 | | | | 10,000 | | | | 9,992,947 | |
Bayer US Finance II LLC (Germany)(c) | | | 3.88% | | | | 12/15/2023 | | | | 9,000 | | | | 9,602,719 | |
Bristol-Myers Squibb Co. | | | 0.54% | | | | 11/13/2023 | | | | 12,500 | | | | 12,507,191 | |
| | | | | | | | | | | | | | | | 32,102,857 | |
See accompanying Notes to Financial Statements which are an integral part of the financial statements.
| | |
| 10 | | Invesco Conservative Income Fund |
| | | | | | | | | | | | | | | | |
| | | Interest Rate | | | Maturity Date | | | Principal
Amount
(000) | | | Value | |
Regional Banks-1.99% | | | | | | | | | | | | | | | | |
Fifth Third Bancorp | | | 3.65 | % | | | 01/25/2024 | | | $ | 11,000 | | | $ | 11,775,859 | |
KeyBank N.A. (3 mo. USD LIBOR + 0.66%)(b) | | | 0.79 | % | | | 02/01/2022 | | | | 22,119 | | | | 22,180,552 | |
KeyBank N.A. | | | 1.25 | % | | | 03/10/2023 | | | | 10,901 | | | | 11,061,257 | |
KeyBank N.A. | | | 2.30 | % | | | 09/14/2022 | | | | 5,500 | | | | 5,620,914 | |
Svenska Handelsbanken AB (Sweden)(c) | | | 0.63 | % | | | 06/30/2023 | | | | 11,429 | | | | 11,490,465 | |
Truist Bank (3 mo. USD LIBOR + 0.59%)(b) | | | 0.71 | % | | | 05/17/2022 | | | | 14,167 | | | | 14,219,239 | |
Truist Financial Corp. (3 mo. USD LIBOR + 0.65%)(b) | | | 0.80 | % | | | 04/01/2022 | | | | 2,500 | | | | 2,507,731 | |
| | | | | | | | | | | | | | | | 78,856,017 | |
Retail REITs-0.42% | | | | | | | | | | | | | | | | |
Kimco Realty Corp. | | | 3.40 | % | | | 11/01/2022 | | | | 16,117 | | | | 16,602,574 | |
Semiconductors-0.50% | | | | | | | | | | | | | | | | |
NVIDIA Corp. | | | 0.31 | % | | | 06/15/2023 | | | | 20,000 | | | | 20,015,059 | |
Soft Drinks-0.11% | | | | | | | | | | | | | | | | |
PepsiCo, Inc. | | | 0.40 | % | | | 10/07/2023 | | | | 4,278 | | | | 4,294,495 | |
Specialized REITs-0.26% | | | | | | | | | | | | | | | | |
Public Storage (SOFR + 0.47%)(b) | | | 0.52 | % | | | 04/23/2024 | | | | 10,257 | | | | 10,274,097 | |
Systems Software-0.18% | | | | | | | | | | | | | | | | |
Oracle Corp. | | | 2.50 | % | | | 10/15/2022 | | | | 7,000 | | | | 7,169,658 | |
Technology Hardware, Storage & Peripherals-0.25% | | | | | | | | | | | | | | | | |
Apple, Inc. | | | 0.75 | % | | | 05/11/2023 | | | | 10,009 | | | | 10,098,585 | |
Thrifts & Mortgage Finance-0.68% | | | | | | | | | | | | | | | | |
Nationwide Building Society (United Kingdom)(c) | | | 0.55 | % | | | 01/22/2024 | | | | 18,195 | | | | 18,167,988 | |
Nationwide Building Society (United Kingdom)(c) | | | 2.00 | % | | | 01/27/2023 | | | | 8,571 | | | | 8,779,627 | |
| | | | | | | | | | | | | | | | 26,947,615 | |
Total U.S. Dollar Denominated Bonds & Notes (Cost $1,827,339,026) | | | | | | | | | | | | | | | 1,834,248,103 | |
Commercial Paper-39.52%(e) | | | | | | | | | | | | | | | | |
Asset-Backed Securities - Fully Supported Bank-1.51% | | | | | | | | | | | | | | | | |
Lexington Parker Capital Co. LLC(c) | | | 0.24 | % | | | 02/03/2022 | | | | 35,000 | | | | 34,979,222 | |
Mountcliff Funding LLC(c) | | | 0.23 | % | | | 09/07/2021 | | | | 25,000 | | | | 24,999,635 | |
| | | | | | | | | | | | | | | | 59,978,857 | |
Automobile Manufacturers-2.64% | | | | | | | | | | | | | | | | |
American Honda Finance Corp. | | | 0.19 | % | | | 09/03/2021 | | | | 23,000 | | | | 22,999,810 | |
Harley-Davidson Financial Services, Inc.(c) | | | 0.29%-0.31 | % | | | 10/04/2021 | | | | 25,000 | | | | 24,992,846 | |
Harley-Davidson Financial Services, Inc.(c) | | | 0.29 | % | | | 11/03/2021 | | | | 10,000 | | | | 9,993,387 | |
Harley-Davidson Financial Services, Inc.(c) | | | 0.32 | % | | | 12/01/2021 | | | | 20,000 | | | | 19,972,093 | |
Hyundai Capital America(c) | | | 0.16 | % | | | 11/01/2021 | | | | 6,900 | | | | 6,898,265 | |
Volkswagen Group of America Finance LLC (Germany)(c) | | | 0.52 | % | | | 11/08/2021 | | | | 20,000 | | | | 19,983,210 | |
| | | | | | | | | | | | | | | | 104,839,611 | |
Consumer Finance-1.23% | | | | | | | | | | | | | | | | |
General Motors Financial Co., Inc.(c) | | | 0.32 | % | | | 10/01/2021 | | | | 10,000 | | | | 9,996,590 | |
General Motors Financial Co., Inc.(c) | | | 0.32 | % | | | 10/12/2021 | | | | 15,000 | | | | 14,992,877 | |
General Motors Financial Co., Inc.(c) | | | 0.34 | % | | | 10/18/2021 | | | | 10,000 | | | | 9,994,467 | |
General Motors Financial Co., Inc.(c) | | | 0.34 | % | | | 10/25/2021 | | | | 14,000 | | | | 13,990,867 | |
| | | | | | | | | | | | | | | | 48,974,801 | |
Data Processing & Outsourced Services-0.81% | | | | | | | | | | | | | | | | |
Fidelity National Information Services, Inc.(c) | | | 0.19 | % | | | 09/13/2021 | | | | 29,000 | | | | 28,998,691 | |
Fidelity National Information Services, Inc.(c) | | | 0.20 | % | | | 09/23/2021 | | | | 3,000 | | | | 2,999,737 | |
| | | | | | | | | | | | | | | | 31,998,428 | |
Diversified Banks-5.23% | | | | | | | | | | | | | | | | |
ANZ New Zealand (Int’l) Ltd. (New Zealand)(c) | | | 0.19 | % | | | 08/24/2022 | | | | 25,000 | | | | 24,952,018 | |
Bank of Nova Scotia (The) (Canada)(c) | | | 0.23 | % | | | 05/05/2022 | | | | 12,000 | | | | 11,988,144 | |
Barclays U.S. CCP Funding LLC | | | 0.22 | % | | | 04/14/2022 | | | | 12,000 | | | | 11,990,562 | |
Canadian Imperial Bank of Commerce (Canada)(c) | | | 0.23 | % | | | 05/04/2022 | | | | 15,000 | | | | 14,983,908 | |
See accompanying Notes to Financial Statements which are an integral part of the financial statements.
| | |
| 11 | | Invesco Conservative Income Fund |
| | | | | | | | | | | | | | | | |
| | | Interest Rate | | | Maturity Date | | | Principal
Amount
(000) | | | Value | |
Diversified Banks-(continued) | | | | | | | | | | | | | | | | |
HSBC Bank PLC (United Kingdom)(c) | | | 0.27 | % | | | 02/01/2022 | | | $ | 25,000 | | | $ | 24,977,755 | |
HSBC USA, Inc.(c) | | | 0.38 | % | | | 10/22/2021 | | | | 16,000 | | | | 15,995,655 | |
HSBC USA, Inc.(c) | | | 0.32 | % | | | 08/05/2022 | | | | 15,000 | | | | 14,950,986 | |
National Bank of Canada (Canada)(c) | | | 0.20 | % | | | 08/23/2022 | | | | 25,000 | | | | 24,947,442 | |
NatWest Markets PLC (United Kingdom); Series G(c) | | | 0.30 | % | | | 06/21/2022 | | | | 18,050 | | | | 18,019,192 | |
Toronto-Dominion Bank (The) (Canada)(c) | | | 0.19 | % | | | 08/24/2022 | | | | 25,000 | | | | 24,963,900 | |
Westpac Banking Corp. (Australia)(c) | | | 0.20 | % | | | 08/18/2022 | | | | 20,000 | | | | 19,964,604 | |
| | | | | | | | | | | | | | | | 207,734,166 | |
Diversified Capital Markets-2.47% | | | | | | | | | | | | | | | | |
Enel Finance America LLC(c) | | | 0.42 | % | | | 02/18/2022 | | | | 35,000 | | | | 34,961,430 | |
Hitachi America Capital Ltd.(c) | | | 0.12 | % | | | 09/08/2021 | | | | 40,000 | | | | 39,998,889 | |
UBS AG (Switzerland) (SOFR + 0.19%)(b) | | | 0.20 | % | | | 06/16/2022 | | | | 23,000 | | | | 23,003,862 | |
| | | | | | | | | | | | | | | | 97,964,181 | |
Diversified Support Services-2.61% | | | | | | | | | | | | | | | | |
Brookfield Infrastructure Holdings Canada, Inc. (Canada) | | | 0.24 | % | | | 09/01/2021 | | | | 20,000 | | | | 19,999,931 | |
Brookfield Infrastructure Holdings Canada, Inc. (Canada) | | | 0.24 | % | | | 09/08/2021 | | | | 31,500 | | | | 31,499,062 | |
Brookfield Infrastructure Holdings Canada, Inc. (Canada) | | | 0.27 | % | | | 10/19/2021 | | | | 5,000 | | | | 4,998,707 | |
Enbridge US, Inc.(c) | | | 0.16 | % | | | 09/15/2021 | | | | 14,300 | | | | 14,299,255 | |
Enbridge US, Inc.(c) | | | 0.25 | % | | | 11/19/2021 | | | | 33,000 | | | | 32,986,213 | |
| | | | | | | | | | | | | | | | 103,783,168 | |
Electric Utilities-1.96% | | | | | | | | | | | | | | | | |
Entergy Corp.(c) | | | 0.20 | % | | | 09/07/2021 | | | | 15,475 | | | | 15,474,654 | |
Entergy Corp.(c) | | | 0.18 | % | | | 11/15/2021 | | | | 50,000 | | | | 49,979,944 | |
Oglethorpe Power Corp.(c) | | | 0.16 | % | | | 09/01/2021 | | | | 12,500 | | | | 12,499,957 | |
| | | | | | | | | | | | | | | | 77,954,555 | |
Environmental & Facilities Services-1.10% | | | | | | | | | | | | | | | | |
Waste Management, Inc.(c) | | | 0.35 | % | | | 04/04/2022 | | | | 5,500 | | | | 5,495,149 | |
Waste Management, Inc.(c) | | | 0.35 | % | | | 04/08/2022 | | | | 25,000 | | | | 24,977,389 | |
Waste Management, Inc.(c) | | | 0.31 | % | | | 08/16/2022 | | | | 13,250 | | | | 13,226,684 | |
| | | | | | | | | | | | | | | | 43,699,222 | |
Gas Utilities-0.24% | | | | | | | | | | | | | | | | |
WGL Holdings, Inc.(c) | | | 0.23 | % | | | 09/13/2021 | | | | 9,000 | | | | 8,999,594 | |
WGL Holdings, Inc.(c) | | | 0.25 | % | | | 10/04/2021 | | | | 500 | | | | 499,858 | |
| | | | | | | | | | | | | | | | 9,499,452 | |
General Merchandise Stores-0.06% | | | | | | | | | | | | | | | | |
Dollarama, Inc. (Canada)(c) | | | 0.18 | % | | | 10/08/2021 | | | | 2,275 | | | | 2,274,640 | |
Health Care Facilities-0.21% | | | | | | | | | | | | | | | | |
CommonSpirit Health; Series A | | | 0.22 | % | | | 12/02/2021 | | | | 8,500 | | | | 8,496,772 | |
Health Care Services-1.59% | | | | | | | | | | | | | | | | |
Cigna Corp.(c) | | | 0.21 | % | | | 09/14/2021 | | | | 20,000 | | | | 19,999,028 | |
Cigna Corp.(c) | | | 0.20 | % | | | 12/07/2021 | | | | 12,710 | | | | 12,703,150 | |
Cigna Corp.(c) | | | 0.21 | % | | | 12/09/2021 | | | | 15,500 | | | | 15,491,475 | |
Cigna Corp.(c) | | | 0.25 | % | | | 02/11/2022 | | | | 15,000 | | | | 14,984,283 | |
| | | | | | | | | | | | | | | | 63,177,936 | |
Home Furnishings-0.63% | | | | | | | | | | | | | | | | |
Leggett & Platt, Inc.(c) | | | 0.18 | % | | | 09/20/2021 | | | | 25,000 | | | | 24,998,153 | |
Household Products-0.75% | | | | | | | | | | | | | | | | |
Church & Dwight Co., Inc.(c) | | | 0.17 | % | | | 01/27/2022 | | | | 30,000 | | | | 29,970,945 | |
Integrated Oil & Gas-1.43% | | | | | | | | | | | | | | | | |
BP Capital Markets PLC (United Kingdom)(c) | | | 0.20 | % | | | 04/18/2022 | | | | 17,000 | | | | 16,980,667 | |
See accompanying Notes to Financial Statements which are an integral part of the financial statements.
| | |
| 12 | | Invesco Conservative Income Fund |
| | | | | | | | | | | | | | | | |
| | | Interest Rate | | | Maturity Date | | | Principal
Amount
(000) | | | Value | |
Integrated Oil & Gas-(continued) | | | | | | | | | | | | | | | | |
Suncor Energy, Inc. (Canada)(c) | | | 0.20 | % | | | 09/09/2021 | | | $ | 20,000 | | | $ | 19,999,375 | |
Suncor Energy, Inc. (Canada)(c) | | | 0.23 | % | | | 10/04/2021 | | | | 20,000 | | | | 19,997,205 | |
| | | | | | | | | | | | | | | | 56,977,247 | |
Integrated Telecommunication Services-1.82% | | | | | | | | | | | | | | | | |
AT&T, Inc.(c) | | | 0.37 | % | | | 10/21/2021 | | | | 16,750 | | | | 16,746,227 | |
AT&T, Inc.(c) | | | 0.38 | % | | | 11/16/2021 | | | | 14,000 | | | | 13,994,730 | |
AT&T, Inc.(c) | | | 0.38 | % | | | 11/18/2021 | | | | 15,000 | | | | 14,994,141 | |
AT&T, Inc.(c) | | | 0.42 | % | | | 12/15/2021 | | | | 6,475 | | | | 6,471,568 | |
AT&T, Inc.(c) | | | 0.40 | % | | | 12/16/2021 | | | | 20,000 | | | | 19,989,359 | |
| | | | | | | | | | | | | | | | 72,196,025 | |
Managed Health Care-1.41% | | | | | | | | | | | | | | | | |
Humana, Inc.(c) | | | 0.24 | % | | | 09/14/2021 | | | | 25,000 | | | | 24,997,229 | |
Humana, Inc.(c) | | | 0.26 | % | | | 11/05/2021 | | | | 11,000 | | | | 10,993,809 | |
Humana, Inc.(c) | | | 0.26 | % | | | 11/08/2021 | | | | 20,000 | | | | 19,988,194 | |
| | | | | | | | | | | | | | | | 55,979,232 | |
Movies & Entertainment-1.13% | | | | | | | | | | | | | | | | |
Walt Disney Co. (The)(c) | | | 0.26 | % | | | 12/29/2021 | | | | 25,000 | | | | 24,987,917 | |
Walt Disney Co. (The)(c) | | | 0.27 | % | | | 03/15/2022 | | | | 20,000 | | | | 19,979,746 | |
| | | | | | | | | | | | | | | | 44,967,663 | |
Multi-Utilities-1.63% | | | | | | | | | | | | | | | | |
Dominion Energy, Inc.(c) | | | 0.15 | % | | | 10/20/2021 | | | | 23,600 | | | | 23,594,690 | |
Sempra Energy(c) | | | 0.15 | % | | | 09/20/2021 | | | | 11,000 | | | | 10,999,187 | |
Sempra Energy(c) | | | 0.15 | % | | | 09/23/2021 | | | | 30,000 | | | | 29,997,374 | |
| | | | | | | | | | | | | | | | 64,591,251 | |
Oil & Gas Storage & Transportation-0.85% | | | | | | | | | | | | | | | | |
Energy Transfer L.P. | | | 0.35 | % | | | 09/01/2021 | | | | 33,800 | | | | 33,799,722 | |
Other Diversified Financial Services-1.74% | | | | | | | | | | | | | | | | |
White Plains Capital Co. LLC(c) | | | 0.28 | % | | | 09/21/2021 | | | | 1,300 | | | | 1,299,720 | |
White Plains Capital Co. LLC(c) | | | 0.75 | % | | | 10/13/2021 | | | | 25,000 | | | | 24,988,504 | |
White Plains Capital Co. LLC(c) | | | 0.78 | % | | | 10/27/2021 | | | | 10,500 | | | | 10,493,600 | |
White Plains Capital Co. LLC(c) | | | 0.55 | % | | | 11/09/2021 | | | | 20,000 | | | | 19,984,911 | |
White Plains Capital Co. LLC(c) | | | 0.78 | % | | | 11/16/2021 | | | | 12,500 | | | | 12,489,546 | |
| | | | | | | | | | | | | | | | 69,256,281 | |
Packaged Foods & Meats-2.32% | | | | | | | | | | | | | | | | |
Conagra Brands, Inc.(c) | | | 0.27 | % | | | 10/08/2021 | | | | 12,800 | | | | 12,796,149 | |
Conagra Brands, Inc.(c) | | | 0.30 | % | | | 10/15/2021 | | | | 30,000 | | | | 29,989,312 | |
Smithfield Foods, Inc.(c) | | | 0.18 | % | | | 09/03/2021 | | | | 24,250 | | | | 24,249,598 | |
Smithfield Foods, Inc.(c) | | | 0.17 | % | | | 09/07/2021 | | | | 25,000 | | | | 24,999,004 | |
| | | | | | | | | | | | | | | | 92,034,063 | |
Pharmaceuticals-1.27% | | | | | | | | | | | | | | | | |
Viatris, Inc.(c) | | | 0.35 | % | | | 09/24/2021 | | | | 20,000 | | | | 19,995,240 | |
Viatris, Inc.(c) | | | 0.45 | % | | | 10/18/2021 | | | | 20,000 | | | | 19,989,786 | |
Viatris, Inc.(c) | | | 0.47 | % | | | 12/15/2021 | | | | 10,500 | | | | 10,486,428 | |
| | | | | | | | | | | | | | | | 50,471,454 | |
Residential REITs-0.76% | | | | | | | | | | | | | | | | |
UDR, Inc.(c) | | | 0.16 | % | | | 10/07/2021 | | | | 30,000 | | | | 29,995,375 | |
Soft Drinks-1.37% | | | | | | | | | | | | | | | | |
Keurig Dr Pepper, Inc.(c) | | | 0.30 | % | | | 01/14/2022 | | | | 19,800 | | | | 19,783,843 | |
Keurig Dr Pepper, Inc.(c) | | | 0.25 | % | | | 02/07/2022 | | | | 34,500 | | | | 34,465,040 | |
| | | | | | | | | | | | | | | | 54,248,883 | |
See accompanying Notes to Financial Statements which are an integral part of the financial statements.
| | |
| 13 | | Invesco Conservative Income Fund |
| | | | | | | | | | | | | | | | |
| | | Interest Rate | | | Maturity Date | | | Principal
Amount
(000) | | | Value | |
Specialized Finance-0.75% | | | | | | | | | | | | | | | | |
Aviation Capital Group LLC(c) | | | 0.30 | % | | | 09/07/2021 | | | $ | 12,600 | | | $ | 12,599,816 | |
Aviation Capital Group LLC(c) | | | 0.33 | % | | | 09/17/2021 | | | | 17,000 | | | | 16,999,262 | |
| | | | | | | | | | | | | | | | 29,599,078 | |
Total Commercial Paper (Cost $1,569,221,450) | | | | | | | | | | | | | | | 1,569,461,161 | |
Asset-Backed Securities-5.18% | | | | | | | | | | | | | | | | |
Auto Loans/Leases-3.01% | | | | | | | | | | | | | | | | |
ARI Fleet Lease Trust; Series 2020-A, Class A2(c) | | | 1.77 | % | | | 08/15/2028 | | | | 2,767 | | | | 2,781,142 | |
BMW Vehicle Owner Trust; Series 2020 - A, Class A2 | | | 0.39 | % | | | 02/27/2023 | | | | 977 | | | | 977,033 | |
CarMax Auto Owner Trust; Series 2021 - 2, Class A2A | | | 0.27 | % | | | 06/17/2024 | | | | 9,000 | | | | 9,007,014 | |
Chesapeake Funding II LLC (Canada); | | | | | | | | | | | | | | | | |
Series 2018-3A, Class A1(c) | | | 3.39 | % | | | 01/15/2031 | | | | 2,391 | | | | 2,428,512 | |
Series 2019-1A, Class A1(c) | | | 2.94 | % | | | 04/15/2031 | | | | 2,207 | | | | 2,238,404 | |
Series 2020-1A, Class A2 (1 mo. USD LIBOR + 0.65%)(b)(c) | | | 0.75 | % | | | 08/16/2032 | | | | 3,675 | | | | 3,694,269 | |
Enterprise Fleet Financing LLC; | | | | | | | | | | | | | | | | |
Series 2019-1, Class A2(c) | | | 2.98 | % | | | 10/20/2024 | | | | 2,070 | | | | 2,083,787 | |
Series 2020-2, Class A2(c) | | | 0.61 | % | | | 07/20/2026 | | | | 18,201 | | | | 18,269,122 | |
Ford Credit Auto Owner Trust; Series 2020 - B, Class A2 | | | 0.50 | % | | | 02/15/2023 | | | | 2,074 | | | | 2,075,443 | |
HPEFS Equipment Trust; | | | | | | | | | | | | | | | | |
Series 2020-1A, Class A2(c) | | | 1.73 | % | | | 02/20/2030 | | | | 1,343 | | | | 1,345,964 | |
Series 2020-2A, Class A2(c) | | | 0.65 | % | | | 07/22/2030 | | | | 4,705 | | | | 4,709,600 | |
Mercedes - Benz Auto Receivables Trust; Series 2020 - 1, Class A2 | | | 0.46 | % | | | 03/15/2023 | | | | 1,677 | | | | 1,678,278 | |
NextGear Floorplan Master Owner Trust; | | | | | | | | | | | | | | | | |
Series 2019-1A, Class A1 (1 mo. USD LIBOR + 0.65%)(b)(c) | | | 0.75 | % | | | 02/15/2024 | | | | 12,750 | | | | 12,783,119 | |
Series 2019-2A, Class A1 (1 mo. USD LIBOR + 0.70%)(b)(c) | | | 0.80 | % | | | 10/15/2024 | | | | 10,000 | | | | 10,052,576 | |
Nissan Auto Lease Trust; Series 2020 - B, Class A2 | | | 0.34 | % | | | 12/15/2022 | | | | 4,444 | | | | 4,446,335 | |
Santander Retail Auto Lease Trust; | | | | | | | | | | | | | | | | |
Series 2020-B, Class A2(c) | | | 0.42 | % | | | 11/20/2023 | | | | 11,140 | | | | 11,159,531 | |
Series 2021-B, Class A2(c) | | | 0.31 | % | | | 01/22/2024 | | | | 11,000 | | | | 11,004,228 | |
Tesla Auto Lease Trust; | | | | | | | | | | | | | | | | |
Series 2019-A, Class A2(c) | | | 2.13 | % | | | 04/20/2022 | | | | 4,777 | | | | 4,792,197 | |
Series 2020-A, Class A2(c) | | | 0.55 | % | | | 05/22/2023 | | | | 1,287 | | | | 1,288,507 | |
Toyota Lease Owner Trust; Series 2021-A, Class A2(c) | | | 0.27 | % | | | 09/20/2023 | | | | 5,200 | | | | 5,203,248 | |
Volkswagen Auto Loan Enhanced Trust; Series 2020 - 1, Class A2A | | | 0.93 | % | | | 12/20/2022 | | | | 517 | | | | 517,525 | |
Wheels SPV 2 LLC; Series 2020-1A, Class A2(c) | | | 0.51 | % | | | 08/20/2029 | | | | 7,220 | | | | 7,234,691 | |
| | | | | | | | | | | | | | | | 119,770,525 | |
Consumer Finance-0.31% | | | | | | | | | | | | | | | | |
American Express Credit Account Master Trust; Series 2019-1, Class A | | | 2.87 | % | | | 10/15/2024 | | | | 12,000 | | | | 12,191,286 | |
Credit Cards-0.95% | | | | | | | | | | | | | | | | |
Capital One Multi-Asset Execution Trust; Series 2019-A1, Class A1 | | | 2.84 | % | | | 12/15/2024 | | | | 12,000 | | | | 12,146,497 | |
Citibank Credit Card Issuance Trust; Series 2016-A3, Class A3 (1 mo. USD LIBOR +
0.49%)(b) | | | 0.59 | % | | | 12/07/2023 | | | | 15,500 | | | | 15,519,843 | |
Evergreen Credit Card Trust (Canada); Series 2019-3, Class A (1 mo. USD LIBOR +
0.37%)(b)(c) | | | 0.47 | % | | | 10/16/2023 | | | | 10,200 | | | | 10,204,129 | |
| | | | | | | | | | | | | | | | 37,870,469 | |
Equipment Leasing-0.28% | | | | | | | | | | | | | | | | |
Dell Equipment Finance Trust; Series 2020-2, Class A2(c) | | | 0.47 | % | | | 10/24/2022 | | | | 5,404 | | | | 5,410,507 | |
MMAF Equipment Finance LLC; | | | | | | | | | | | | | | | | |
Series 2020-A, Class A2(c) | | | 0.74 | % | | | 04/09/2024 | | | | 2,819 | | | | 2,830,180 | |
Series 2020-BA, Class A2(c) | | | 0.38 | % | | | 08/14/2023 | | | | 2,760 | | | | 2,763,494 | |
| | | | | | | | | | | | | | | | 11,004,181 | |
Specialized Finance-0.63% | | | | | | | | | | | | | | | | |
Navient Private Education Refi Loan Trust; Series 2020-FA, Class A(c) | | | 1.22 | % | | | 07/15/2069 | | | | 13,119 | | | | 13,219,787 | |
Navient Student Loan Trust; | | | | | | | | | | | | | | | | |
Series 2017-4A, Class A2 (1 mo. USD LIBOR + 0.50%)(b)(c) | | | 0.58 | % | | | 09/27/2066 | | | | 10,317 | | | | 10,343,522 | |
Series 2019-2A, Class A1 (1 mo. USD LIBOR + 0.27%)(b)(c) | | | 0.35 | % | | | 02/27/2068 | | | | 489 | | | | 489,448 | |
See accompanying Notes to Financial Statements which are an integral part of the financial statements.
| | |
| 14 | | Invesco Conservative Income Fund |
| | | | | | | | | | | | | | | | |
| | | Interest Rate | | | Maturity Date | | | Principal
Amount (000) | | | Value | |
Specialized Finance-(continued) | | | | | | | | | | | | | | | | |
SoFi Professional Loan Program Trust; Series 2020-A, Class A1FX(c) | | | 2.06 | % | | | 05/15/2046 | | | $ | 1,004 | | | $ | 1,007,038 | |
| | | | | | | | | | | | | | | | 25,059,795 | |
Total Asset-Backed Securities (Cost $205,156,998) | | | | | | | | | | | | | | | 205,896,256 | |
Certificates of Deposit-1.53% | | | | | | | | | | | | | | | | |
Diversified Banks-1.01% | | | | | | | | | | | | | | | | |
Bank of Montreal (Canada) | | | 0.20 | % | | | 08/19/2022 | | | | 20,000 | | | | 20,001,564 | |
Lloyds Bank Corporate Markets PLC | | | 0.22 | % | | | 08/25/2022 | | | | 20,000 | | | | 19,999,600 | |
| | | | | | | | | | | | | | | | 40,001,164 | |
Regional Banks-0.52% | | | | | | | | | | | | | | | | |
MUFG Bank Ltd. | | | 0.23 | % | | | 07/15/2022 | | | | 755 | | | | 755,166 | |
Svenska Handelsbanken AB (Sweden) | | | 0.20 | % | | | 08/23/2022 | | | | 20,000 | | | | 19,999,602 | |
| | | | | | | | | | | | | | | | 20,754,768 | |
Total Certificates of Deposit (Cost $60,754,998) | | | | | | | | | | | | | | | 60,755,932 | |
U.S. Treasury Securities-0.59% | | | | | | | | | | | | | | | | |
U.S. Treasury Bills-0.59%(e) | | | | | | | | | | | | | | | | |
U.S. Treasury Bills (Cost $23,495,398) | | | 0.05 | % | | | 01/20/2022 | | | | 23,500 | | | | 23,496,318 | |
TOTAL INVESTMENTS IN SECURITIES (excluding Repurchase Agreements)-93.01%
(Cost $3,685,967,870) | | | | | | | | | | | | | | | 3,693,857,770 | |
| | | | |
| | | | | | | | | Repurchase
Amount | | | | |
Repurchase Agreements-6.79%(f) | | | | | | | | | | | | | | | | |
Citigroup Global Markets, Inc., joint open agreement dated 02/18/2021 (collateralized by
domestic and foreign corporate obligations valued at $55,112,252; 0.00% -
9.00%; 09/15/2021 - 03/01/2050)(g) | | | 0.39 | % | | | 09/01/2021 | | | | 30,009,866 | | | | 30,000,000 | |
Citigroup Global Markets, Inc., joint open agreement dated 03/17/2020 (collateralized by
domestic and foreign non-agency asset-backed securities, a domestic non-agency
mortgage-backed security and domestic and foreign corporate obligations valued at
$289,978,113; 0.00% - 22.85%; 01/09/2022 - 06/04/2081)(g) | | | 0.60 | % | | | 09/01/2021 | | | | 40,020,155 | | | | 40,000,000 | |
J.P. Morgan Securities LLC, joint open agreement dated 06/11/2021 (collateralized by
domestic and foreign corporate obligations valued at $82,196,178; 0.00% -
15.50%; 10/03/2021 - 08/15/2061)(g) | | | 0.37 | % | | | 09/01/2021 | | | | 45,014,150 | | | | 45,000,000 | |
J.P. Morgan Securities LLC, open agreement dated 03/02/2020 (collateralized by
domestic non-agency mortgage-backed securities and domestic corporate
obligations valued at $12,738,237; 0.00% - 6.75%; 09/15/2024 -
06/01/2055)(g) | | | 0.46 | % | | | 09/01/2021 | | | | 12,004,558 | | | | 12,000,000 | |
Nomura Securities International, Inc., joint term agreement dated 08/31/2021,
aggregate maturing value of $50,000,000 (collateralized by domestic non-agency
asset-backed securities and domestic non-agency mortgage-backed securities valued
at $54,879,345; 0.00% - 7.75%; 07/17/2026 - 02/25/2049)(b) | | | 0.74 | % | | | 12/31/2021 | | | | 25,000,000 | | | | 25,000,000 | |
RBC Capital Markets LLC, joint term agreement dated 08/27/2021, aggregate
maturing value of $95,003,510 (collateralized by a U.S. Treasury obligation,
domestic and foreign corporate obligations and domestic and foreign commercial
paper valued at $101,521,496; 0.00% - 13.00%; 09/03/2021 -
01/22/2078)(h) | | | 0.19 | % | | | 09/03/2021 | | | | 45,001,663 | | | | 45,000,000 | |
Societe Generale, joint term agreement dated 06/29/2021, aggregate maturing value
of $100,000,000 (collateralized by domestic non-agency asset-backed securities,
domestic and foreign corporate obligations and domestic non-agency
mortgage-backed securities valued at $109,707,787; 0.23% — 13.00%;
09/15/2021 - 08/01/2118)(b) | | | 0.49 | % | | | 01/03/2022 | | | | 50,000,000 | | | | 50,000,000 | |
Truist Securities, joint term agreement dated 08/27/2021, aggregate maturing value
of $45,014,000 (collateralized by U.S. Treasury obligations, a domestic agency
mortgage-backed security and domestic corporate obligations valued at
$49,221,959; 1.25% - 7.50%; 03/15/2022 - 07/01/2051) | | | 0.40 | % | | | 09/24/2021 | | | | 22,507,000 | | | | 22,500,000 | |
Total Repurchase Agreements (Cost $269,500,000) | | | | | | | | | | | | | | | 269,500,000 | |
TOTAL INVESTMENTS IN SECURITIES-99.80% (Cost $3,955,467,870) | | | | | | | | | | | | | | | 3,963,357,770 | |
OTHER ASSETS LESS LIABILITIES-0.20% | | | | | | | | | | | | | | | 7,930,103 | |
NET ASSETS-100.00% | | | | | | | | | | | | | | $ | 3,971,287,873 | |
See accompanying Notes to Financial Statements which are an integral part of the financial statements.
| | |
| 15 | | Invesco Conservative Income Fund |
Investment Abbreviations:
LIBOR -London Interbank Offered Rate
REITs -Real Estate Investment Trusts
SOFR -Secured Overnight Financing Rate
USD -U.S. Dollar
Notes to Schedule of Investments:
| (a) | Industry and/or sector classifications used in this report are generally according to the Global Industry Classification Standard, which was developed by and is the exclusive property and a service mark of MSCI Inc. and Standard & Poor’s. |
| (b) | Interest or dividend rate is redetermined periodically. Rate shown is the rate in effect on August 31, 2021. |
| (c) | Security purchased or received in a transaction exempt from registration under the Securities Act of 1933, as amended (the “1933 Act”). The security may be resold pursuant to an exemption from registration under the 1933 Act, typically to qualified institutional buyers. The aggregate value of these securities at August 31, 2021 was $2,166,271,063, which represented 54.55% of the Fund’s Net Assets. |
| (d) | Security issued at a fixed rate for a specific period of time, after which it will convert to a variable rate. |
| (e) | Security traded on a discount basis. The interest rate shown represents the discount rate at the time of purchase by the Fund. |
| (f) | Principal amount equals value at period end. See Note 1I. |
| (g) | Either party may terminate the agreement upon demand. Interest rate, principal amount and collateral are redetermined periodically. The Maturity Date represents the next reset date, and the Repurchase Amount is calculated based on the next reset date. |
| (h) | The Fund may demand payment of the term repurchase agreement upon one to seven business days’ notice depending on the timing of the demand. |
See accompanying Notes to Financial Statements which are an integral part of the financial statements.
| | |
| 16 | | Invesco Conservative Income Fund |
Statement of Assets and Liabilities
August 31, 2021
| | | | | |
Assets: | | | | | |
Investments in unaffiliated securities, excluding repurchase agreements, at value (Cost $3,685,967,870) | | | $ | 3,693,857,770 | |
Repurchase agreements, at value and cost | | | | 269,500,000 | |
Cash | | | | 71,788 | |
Receivable for: | | | | | |
Fund shares sold | | | | 9,677,058 | |
Interest | | | | 5,527,169 | |
Investment for trustee deferred compensation and retirement plans | | | | 43,416 | |
Other assets | | | | 101,220 | |
Total assets | | | | 3,978,778,421 | |
| |
Liabilities: | | | | | |
Payable for: | | | | | |
Fund shares reacquired | | | | 6,145,097 | |
Dividends | | | | 11,374 | |
Accrued fees to affiliates | | | | 1,265,160 | |
Accrued trustees’ and officers’ fees and benefits | | | | 8,864 | |
Accrued operating expenses | | | | 16,637 | |
Trustee deferred compensation and retirement plans | | | | 43,416 | |
Total liabilities | | | | 7,490,548 | |
Net assets applicable to shares outstanding | | | $ | 3,971,287,873 | |
| | | | | |
Net assets consist of: | | | | | |
Shares of beneficial interest | | | $ | 3,961,246,203 | |
Distributable earnings | | | | 10,041,670 | |
| | | | $ | 3,971,287,873 | |
| |
Net Assets: | | | | | |
Class A | | | $ | 1,065,418,292 | |
Class Y | | | $ | 575,250,228 | |
Institutional Class | | | $ | 2,322,979,541 | |
Class R6 | | | $ | 7,639,812 | |
| |
Shares outstanding, no par value, unlimited number of shares authorized: | | | | | |
Class A | | | | 105,692,379 | |
Class Y | | | | 57,081,657 | |
Institutional Class | | | | 230,498,986 | |
Class R6 | | | | 757,041 | |
Class A: | | | | | |
Net asset value and offering price per share | | | $ | 10.08 | |
Class Y: | | | | | |
Net asset value and offering price per share | | | $ | 10.08 | |
Institutional Class: | | | | | |
Net asset value and offering price per share | | | $ | 10.08 | |
Class R6: | | | | | |
Net asset value and offering price per share | | | $ | 10.09 | |
See accompanying Notes to Financial Statements which are an integral part of the financial statements.
| | |
| 17 | | Invesco Conservative Income Fund |
Statement of Operations
For the year ended August 31, 2021
| | | | |
Investment income: | | | | |
Interest | | | $26,486,314 | |
| |
Expenses: | | | | |
Advisory fees | | | 8,728,659 | |
Administrative services fees | | | 543,990 | |
Custodian fees | | | 22,467 | |
Distribution fees: | | | | |
Class A | | | 968,563 | |
Transfer agent fees - Class A | | | 758,771 | |
Transfer agent fees - Class Y | | | 431,367 | |
Transfer agent fees - Institutional Class | | | 207,960 | |
Transfer agent fees - Class R6 | | | 716 | |
Trustees’ and officers’ fees and benefits | | | 59,575 | |
Registration and filing fees | | | 448,020 | |
Reports to shareholders | | | 92,102 | |
Professional services fees | | | 86,626 | |
Other | | | 48,389 | |
Total expenses | | | 12,397,205 | |
Less: Fees waived and expenses reimbursed | | | (1,058,181 | ) |
Net expenses | | | 11,339,024 | |
Net investment income | | | 15,147,290 | |
Realized and unrealized gain (loss) from: | | | | |
Net realized gain from unaffiliated investment securities | | | 3,768,099 | |
Change in net unrealized appreciation (depreciation) of unaffiliated investment securities | | | (9,468,199 | ) |
Net realized and unrealized gain (loss) | | | (5,700,100 | ) |
Net increase in net assets resulting from operations | | | $ 9,447,190 | |
See accompanying Notes to Financial Statements which are an integral part of the financial statements.
| | |
| 18 | | Invesco Conservative Income Fund |
Statement of Changes in Net Assets
For the years ended August 31, 2021 and 2020
| | | | | | | | |
| | | 2021 | | | 2020 | |
Operations: | | | | | | | | |
Net investment income | | | $ 15,147,290 | | | | $ 46,927,687 | |
Net realized gain | | | 3,768,099 | | | | 124,203 | |
Change in net unrealized appreciation (depreciation) | | | (9,468,199 | ) | | | 7,801,743 | |
Net increase in net assets resulting from operations | | | 9,447,190 | | | | 54,853,633 | |
| | |
Distributions to shareholders from distributable earnings: | | | | | | | | |
Class A | | | (2,815,295 | ) | | | (11,049,218 | ) |
Class Y | | | (2,313,523 | ) | | | (3,136,095 | ) |
Institutional Class | | | (10,127,969 | ) | | | (32,549,704 | ) |
Class R6 | | | (4,504 | ) | | | (1,208 | ) |
Total distributions from distributable earnings | | | (15,261,291 | ) | | | (46,736,225 | ) |
| | |
Share transactions-net: | | | | | | | | |
Class A | | | 243,924,290 | | | | 184,046,567 | |
Class Y | | | 127,910,791 | | | | 446,555,894 | |
Institutional Class | | | 150,337,395 | | | | 256,163,481 | |
Class R6 | | | 7,516,456 | | | | 120,739 | |
Net increase in net assets resulting from share transactions | | | 529,688,932 | | | | 886,886,681 | |
Net increase in net assets | | | 523,874,831 | | | | 895,004,089 | |
| | |
Net assets: | | | | | | | | |
Beginning of year | | | 3,447,413,042 | | | | 2,552,408,953 | |
End of year | | | $3,971,287,873 | | | | $3,447,413,042 | |
See accompanying Notes to Financial Statements which are an integral part of the financial statements.
| | |
| 19 | | Invesco Conservative Income Fund |
Financial Highlights
The following schedule presents financial highlights for a share of the Fund outstanding throughout the periods indicated.
| | | | | | | | | | | | | | | | | | | | | | | | | | | | | | | | | | | | | | | | | | | | | | | | | | | | | | | | | | | | | | | | | | | | | | |
| | | Net asset
value,
beginning
of period | | Net
investment
income(a) | | Net gains
(losses)
on securities
(both
realized and
unrealized) | | Total from
investment
operations | | Dividends
from net
investment
income | | Distributions
from net
realized
gains | | Total
distributions | | Net asset
value, end
of period | | Total
return(b) | | Net assets,
end of period
(000’s omitted) | | Ratio of
expenses
to average
net assets
with fee waivers
and/or
expenses
absorbed | | Ratio of
expenses
to average net
assets without
fee waivers
and/or
expenses
absorbed | | Ratio of net
investment
income
to average
net assets | | Portfolio
turnover(c) |
Class A | | | | | | | | | | | | | | | | | | | | | | | | | | | | | | | | | | | | | | | | | | | | | | | | | | | | | | | | | | | | | | | | | | | | | | |
Year ended 08/31/21 | | | $ | 10.10 | | | | $ | 0.03 | | | | $ | (0.02 | ) | | | $ | 0.01 | | | | $ | (0.03 | ) | | | $ | (0.00 | ) | | | $ | (0.03 | ) | | | $ | 10.08 | | | | | 0.10 | % | | | $ | 1,065,418 | | | | | 0.40 | % | | | | 0.44 | % | | | | 0.29 | % | | | | 68 | % |
Year ended 08/31/20 | | | | 10.05 | | | | | 0.16 | | | | | 0.05 | | | | | 0.21 | | | | | (0.16 | ) | | | | - | | | | | (0.16 | ) | | | | 10.10 | | | | | 2.16 | | | | | 822,964 | | | | | 0.40 | | | | | 0.45 | | | | | 1.60 | | | | | 42 | |
Year ended 08/31/19 | | | | 10.02 | | | | | 0.25 | | | | | 0.03 | | | | | 0.28 | | | | | (0.25 | ) | | | | - | | | | | (0.25 | ) | | | | 10.05 | | | | | 2.82 | | | | | 636,809 | | | | | 0.40 | | | | | 0.49 | | | | | 2.50 | | | | | 18 | |
Period ended 08/31/18(d) | | | | 10.00 | | | | | 0.08 | | | | | 0.03 | | | | | 0.11 | | | | | (0.09 | ) | | | | - | | | | | (0.09 | ) | | | | 10.02 | | | | | 1.09 | | | | | 156,651 | | | | | 0.40 | (e) | | | | 0.47 | (e) | | | | 1.84 | (e) | | | | 35 | |
Class Y | | | | | | | | | | | | | | | | | | | | | | | | | | | | | | | | | | | | | | | | | | | | | | | | | | | | | | | | | | | | | | | | | | | | | | |
Year ended 08/31/21 | | | | 10.09 | | | | | 0.04 | | | | | (0.01 | ) | | | | 0.03 | | | | | (0.04 | ) | | | | (0.00 | ) | | | | (0.04 | ) | | | | 10.08 | | | | | 0.34 | | | | | 575,250 | | | | | 0.26 | | | | | 0.34 | | | | | 0.43 | | | | | 68 | |
Period ended 08/31/20(f) | | | | 10.04 | | | | | 0.13 | | | | | 0.03 | | | | | 0.16 | | | | | (0.11 | ) | | | | - | | | | | (0.11 | ) | | | | 10.09 | | | | | 1.64 | | | | | 448,154 | | | | | 0.28 | (e) | | | | 0.32 | (e) | | | | 1.72 | (e) | | | | 42 | |
Institutional Class | | | | | | | | | | | | | | | | | | | | | | | | | | | | | | | | | | | | | | | | | | | | | | | | | | | | | | | | | | | | | | | | | | | | | | |
Year ended 08/31/21 | | | | 10.09 | | | | | 0.04 | | | | | (0.01 | ) | | | | 0.03 | | | | | (0.04 | ) | | | | (0.00 | ) | | | | (0.04 | ) | | | | 10.08 | | | | | 0.34 | | | | | 2,322,980 | | | | | 0.26 | | | | | 0.27 | | | | | 0.43 | | | | | 68 | |
Year ended 08/31/20 | | | | 10.04 | | | | | 0.18 | | | | | 0.05 | | | | | 0.23 | | | | | (0.18 | ) | | | | - | | | | | (0.18 | ) | | | | 10.09 | | | | | 2.29 | | | | | 2,176,172 | | | | | 0.27 | | | | | 0.27 | | | | | 1.73 | | | | | 42 | |
Year ended 08/31/19 | | | | 10.01 | | | | | 0.26 | | | | | 0.03 | | | | | 0.29 | | | | | (0.26 | ) | | | | - | | | | | (0.26 | ) | | | | 10.04 | | | | | 2.93 | | | | | 1,915,600 | | | | | 0.30 | | | | | 0.31 | | | | | 2.60 | | | | | 18 | |
Year ended 08/31/18 | | | | 10.02 | | | | | 0.19 | | | | | (0.01 | ) | | | | 0.18 | | | | | (0.19 | ) | | | | - | | | | | (0.19 | ) | | | | 10.01 | | | | | 1.77 | | | | | 723,926 | | | | | 0.30 | | | | | 0.36 | | | | | 1.94 | | | | | 35 | |
Year ended 08/31/17 | | | | 10.02 | | | | | 0.12 | | | | | 0.00 | | | | | 0.12 | | | | | (0.12 | ) | | | | (0.00 | ) | | | | (0.12 | ) | | | | 10.02 | | | | | 1.23 | | | | | 288,308 | | | | | 0.28 | | | | | 0.41 | | | | | 1.22 | | | | | 61 | |
Class R6 | | | | | | | | | | | | | | | | | | | | | | | | | | | | | | | | | | | | | | | | | | | | | | | | | | | | | | | | | | | | | | | | | | | | | | |
Year ended 08/31/21 | | | | 10.11 | | | | | 0.04 | | | | | (0.02 | ) | | | | 0.02 | | | | | (0.04 | ) | | | | (0.00 | ) | | | | (0.04 | ) | | | | 10.09 | | | | | 0.24 | | | | | 7,640 | | | | | 0.27 | | | | | 0.31 | | | | | 0.42 | | | | | 68 | |
Period ended 08/31/20(g) | | | | 10.05 | | | | | 0.05 | | | | | 0.04 | | | | | 0.09 | | | | | (0.03 | ) | | | | - | | | | | (0.03 | ) | | | | 10.11 | | | | | 0.90 | | | | | 123 | | | | | 0.25 | (e) | | | | 0.29 | (e) | | | | 1.75 | (e) | | | | 42 | |
| (a) | Calculated using average shares outstanding. |
| (b) | Includes adjustments in accordance with accounting principles generally accepted in the United States of America and as such, the net asset value for financial reporting purposes and the returns based upon those net asset values may differ from the net asset value and returns for shareholder transactions. Not annualized for periods less than one year, if applicable. |
| (c) | Portfolio turnover is calculated at the fund level and is not annualized for periods less than one year, if applicable. |
| (d) | Commencement date of April 2, 2018. |
| (f) | Commencement date of December 10, 2019. |
| (g) | Commencement date of May 15, 2020. |
See accompanying Notes to Financial Statements which are an integral part of the financial statements.
| | |
| 20 | | Invesco Conservative Income Fund |
Notes to Financial Statements
August 31, 2021
NOTE 1—Significant Accounting Policies
Invesco Conservative Income Fund (the “Fund”) is a series portfolio of Invesco Management Trust (the “Trust”). The Trust is organized as a Delaware statutory trust and is registered under the Investment Company Act of 1940, as amended (the “1940 Act”), as an open-end series management investment company authorized to issue an unlimited number of shares of beneficial interest. Matters affecting the Fund or each class will be voted on exclusively by the shareholders of the Fund or each class.
The Fund’s investment objective is to provide capital preservation and current income while maintaining liquidity.
The Fund currently consists of four different classes of shares: Class A, Class Y, Institutional Class and Class R6. Class A, Class Y, Institutional Class and Class R6 shares are sold at net asset value.
The Fund is an investment company and accordingly follows the investment company accounting and reporting guidance in accordance with Financial Accounting Standards Board Accounting Standards Codification Topic 946, Financial Services–Investment Companies.
The following is a summary of the significant accounting policies followed by the Fund in the preparation of its financial statements.
| A. | Security Valuations - Securities, including restricted securities, are valued according to the following policy. |
Debt obligations (including convertible securities) and unlisted equities are fair valued using an evaluated quote provided by an independent pricing service. Evaluated quotes provided by the pricing service may be determined without exclusive reliance on quoted prices, and may reflect appropriate factors such as institution-size trading in similar groups of securities, developments related to specific securities, dividend rate (for unlisted equities), yield (for debt obligations), quality, type of issue, coupon rate (for debt obligations), maturity (for debt obligations), individual trading characteristics and other market data. Pricing services generally value debt obligations assuming orderly transactions of institutional round lot size, but a Fund may hold or transact in the same securities in smaller, odd lot sizes. Odd lots often trade at lower prices than institutional round lots. Debt obligations are subject to interest rate and credit risks. In addition, all debt obligations involve some risk of default with respect to interest and/or principal payments.
A security listed or traded on an exchange (except convertible securities) is valued at its last sales price or official closing price as of the close of the customary trading session on the exchange where the security is principally traded, or lacking any sales or official closing price on a particular day, the security may be valued at the closing bid price on that day. Securities traded in the over-the-counter market are valued based on prices furnished by independent pricing services or market makers. When such securities are valued by an independent pricing service they may be considered fair valued. Futures contracts are valued at the final settlement price set by an exchange on which they are principally traded. Listed options are valued at the mean between the last bid and asked prices from the exchange on which they are principally traded. Options not listed on an exchange are valued by an independent source at the mean between the last bid and asked prices. For purposes of determining net asset value (“NAV”) per share, futures and option contracts generally are valued 15 minutes after the close of the customary trading session of the New York Stock Exchange (“NYSE”).
Investments in open-end and closed-end registered investment companies that do not trade on an exchange are valued at the end-of-day net asset value per share. Investments in open-end and closed-end registered investment companies that trade on an exchange are valued at the last sales price or official closing price as of the close of the customary trading session on the exchange where the security is principally traded.
Foreign securities’ (including foreign exchange contracts) prices are converted into U.S. dollar amounts using the applicable exchange rates as of the close of the NYSE. If market quotations are available and reliable for foreign exchange-traded equity securities, the securities will be valued at the market quotations. Because trading hours for certain foreign securities end before the close of the NYSE, closing market quotations may become unreliable. If between the time trading ends on a particular security and the close of the customary trading session on the NYSE, events occur that the investment adviser determines are significant and make the closing price unreliable, the Fund may fair value the security. If the event is likely to have affected the closing price of the security, the security will be valued at fair value in good faith using procedures approved by the Board of Trustees. Adjustments to closing prices to reflect fair value may also be based on a screening process of an independent pricing service to indicate the degree of certainty, based on historical data, that the closing price in the principal market where a foreign security trades is not the current value as of the close of the NYSE. Foreign securities’ prices meeting the approved degree of certainty that the price is not reflective of current value will be priced at the indication of fair value from the independent pricing service. Multiple factors may be considered by the independent pricing service in determining adjustments to reflect fair value and may include information relating to sector indices, American Depositary Receipts and domestic and foreign index futures. Foreign securities may have additional risks including exchange rate changes, potential for sharply devalued currencies and high inflation, political and economic upheaval, the relative lack of issuer information, relatively low market liquidity and the potential lack of strict financial and accounting controls and standards.
Securities for which market prices are not provided by any of the above methods may be valued based upon quotes furnished by independent sources. The last bid price may be used to value equity securities. The mean between the last bid and asked prices is used to value debt obligations, including corporate loans.
Securities for which market quotations are not readily available or became unreliable are valued at fair value as determined in good faith by or under the supervision of the Trust’s officers following procedures approved by the Board of Trustees. Issuer specific events, market trends, bid/ asked quotes of brokers and information providers and other market data may be reviewed in the course of making a good faith determination of a security’s fair value.
The Fund may invest in securities that are subject to interest rate risk, meaning the risk that the prices will generally fall as interest rates rise and, conversely, the prices will generally rise as interest rates fall. Specific securities differ in their sensitivity to changes in interest rates depending on their individual characteristics. Changes in interest rates may result in increased market volatility, which may affect the value and/ or liquidity of certain Fund investments.
Valuations change in response to many factors including the historical and prospective earnings of the issuer, the value of the issuer’s assets, general market conditions which are not specifically related to the particular issuer, such as real or perceived adverse economic conditions, changes in the general outlook for revenues or corporate earnings, changes in interest or currency rates, regional or global instability, natural or environmental disasters, widespread disease or other public health issues, war, acts of terrorism or adverse investor sentiment generally and market liquidity. Because of the inherent uncertainties of valuation, the values reflected in the financial statements may materially differ from the value received upon actual sale of those investments.
B. Securities Transactions and Investment Income - Securities transactions are accounted for on a trade date basis. Realized gains or losses on sales are computed on the basis of specific identification of the securities sold. Interest income (net of withholding tax, if any) is recorded on the accrual basis from settlement date and includes coupon interest and amortization of premium and accretion of discount on debt securities as applicable. Pay-in-kind interest income and non-cash dividend income received in the form of securities in-lieu of cash are recorded at the fair value of the securities received. Dividend income (net of withholding tax, if any) is recorded on ex-dividend date.
The Fund may periodically participate in litigation related to Fund investments. As such, the Fund may receive proceeds from litigation settlements. Any proceeds received are included in the Statement of Operations as realized gain (loss) for investments no longer held and as unrealized gain (loss) for investments still held.
Brokerage commissions and mark ups are considered transaction costs and are recorded as an increase to the cost basis of securities purchased and/or a reduction of proceeds on a sale of securities. Such transaction costs are included in the determination of net realized and unrealized gain (loss) from investment securities reported in the Statement of Operations and the Statement of Changes in Net Assets and the net realized and unrealized gains (losses) on securities per share in the Financial Highlights. Transaction costs are included in the calculation of the Fund’s net asset value and, accordingly, they reduce the Fund’s total returns. These transaction costs are not considered operating expenses and are not reflected in net investment income reported in the Statement of Operations
| | |
| 21 | | Invesco Conservative Income Fund |
and the Statement of Changes in Net Assets, or the net investment income per share and the ratios of expenses and net investment income reported in the Financial Highlights, nor are they limited by any expense limitation arrangements between the Fund and the investment adviser.
The Fund allocates realized and unrealized capital gains and losses to a class based on the relative net assets of each class. The Fund allocates income to a class based on the relative value of the settled shares of each class.
| C. | Country Determination - For the purposes of making investment selection decisions and presentation in the Schedule of Investments, the investment adviser may determine the country in which an issuer is located and/or credit risk exposure based on various factors. These factors include the laws of the country under which the issuer is organized, where the issuer maintains a principal office, the country in which the issuer derives 50% or more of its total revenues and the country that has the primary market for the issuer’s securities, as well as other criteria. Among the other criteria that may be evaluated for making this determination are the country in which the issuer maintains 50% or more of its assets, the type of security, financial guarantees and enhancements, the nature of the collateral and the sponsor organization. Country of issuer and/or credit risk exposure has been determined to be the United States of America, unless otherwise noted. |
| D. | Distributions - Distributions from net investment income, if any, are declared daily and paid monthly. Distributions from net realized capital gain, if any, are generally declared and paid annually and recorded on the ex-dividend date. The Fund may elect to treat a portion of the proceeds from redemptions as distributions for federal income tax purposes. |
| E. | Federal Income Taxes - The Fund intends to comply with the requirements of Subchapter M of the Internal Revenue Code of 1986, as amended (the “Internal Revenue Code”), necessary to qualify as a regulated investment company and to distribute substantially all of the Fund’s taxable earnings to shareholders. As such, the Fund will not be subject to federal income taxes on otherwise taxable income (including net realized capital gain) that is distributed to shareholders. |
Therefore, no provision for federal income taxes is recorded in the financial statements.
The Fund recognizes the tax benefits of uncertain tax positions only when the position is more likely than not to be sustained. Management has analyzed the Fund’s uncertain tax positions and concluded that no liability for unrecognized tax benefits should be recorded related to uncertain tax positions. Management is not aware of any tax positions for which it is reasonably possible that the total amounts of unrecognized tax benefits will change materially in the next 12 months.
The Fund files tax returns in the U.S. Federal jurisdiction and certain other jurisdictions. Generally, the Fund is subject to examinations by such taxing authorities for up to three years after the filing of the return for the tax period.
| F. | Expenses - Fees provided for under the Rule 12b-1 plan of a particular class of the Fund are charged to the operations of such class. Transfer agency fees and expenses and other shareholder recordkeeping fees and expenses attributable to Class R6 are charged to such class. Transfer agency fees and expenses and other shareholder recordkeeping fees and expenses relating to all other classes are allocated among those classes based on relative net assets. All other expenses are allocated among the classes based on relative net assets. |
| G. | Accounting Estimates - The preparation of financial statements in conformity with accounting principles generally accepted in the United States of America (“GAAP”) requires management to make estimates and assumptions that affect the reported amounts of assets and liabilities at the date of the financial statements and the reported amounts of revenues and expenses during the reporting period including estimates and assumptions related to taxation. Actual results could differ from those estimates by a significant amount. In addition, the Fund monitors for material events or transactions that may occur or become known after the period-end date and before the date the financial statements are released to print. |
| H. | Indemnifications - Under the Trust’s organizational documents, each Trustee, officer, employee or other agent of the Trust is indemnified against certain liabilities that may arise out of the performance of their duties to the Fund. Additionally, in the normal course of business, the Fund enters into contracts, including the Fund’s servicing agreements, that contain a variety of indemnification clauses. The Fund’s maximum exposure under these arrangements is unknown as this would involve future claims that may be made against the Fund that have not yet occurred. The risk of material loss as a result of such indemnification claims is considered remote. |
| I. | Repurchase Agreements - The Fund may enter into repurchase agreements. Collateral on repurchase agreements, including the Fund’s pro-rata interest in joint repurchase agreements, is taken into possession by the Fund upon entering into the repurchase agreement. Collateral consisting of U.S. Government Securities and U.S. Government Sponsored Agency Securities is marked to market daily to ensure its market value is at least 102% of the sales price of the repurchase agreement. Collateral consisting of non-government securities is marked to market daily to ensure its market value is at least 105% of the sales price of the repurchase agreement. The investments in some repurchase agreements, pursuant to procedures approved by the Board of Trustees, are through participation with other mutual funds, private accounts and certain non-registered investment companies managed by the investment advisor or its affiliates (“Joint repurchase agreements”). The principal amount of the repurchase agreement is equal to the value at period-end. If the seller of a repurchase agreement fails to repurchase the security in accordance with the terms of the agreement, the Fund might incur expenses in enforcing its rights, and could experience losses, including a decline in the value of the collateral and loss of income. |
| J. | LIBOR Risk - The Fund may invest in financial instruments that utilize LIBOR as the reference or benchmark rate for variable interest rate calculations. On July 27, 2017, the head of the United Kingdom’s Financial Conduct Authority announced a desire to phase out the use of LIBOR by the end of 2021. Although many LIBOR rates will be phased out at the end of 2021 as originally intended, a selection of widely used USD LIBOR rates will continue to be published until June 2023 in order to assist with the transition. There remains uncertainty regarding the effect of the LIBOR transition process and therefore any impact of a transition away from LIBOR on the Fund or the instruments in which the Fund invests cannot yet be determined. There is no assurance that the composition or characteristics of any alternative reference rate will be similar to or produce the same value or economic equivalence as LIBOR or that instruments using an alternative rate will have the same volume or liquidity. Any such effects of the transition away from LIBOR and the adoption of alternative reference rates could result in losses to the Fund. |
| K. | Other Risks - The Fund may invest in obligations issued by agencies and instrumentalities of the U.S. Government that may vary in the level of support they receive from the government. The government may choose not to provide financial support to government sponsored agencies or instrumentalities if it is not legally obligated to do so. In this case, if the issuer defaulted, the Fund may not be able to recover its investment in such issuer from the U.S. Government. Many securities purchased by the Fund are not guaranteed by the U.S. Government. |
| L. | COVID-19 Risk - The COVID-19 strain of coronavirus has resulted in instances of market closures and dislocations, extreme volatility, liquidity constraints and increased trading costs. Efforts to contain its spread have resulted in travel restrictions, disruptions of healthcare systems, business operations and supply chains, layoffs, lower consumer demand, and defaults, among other significant economic impacts that have disrupted global economic activity across many industries. Such economic impacts may exacerbate other pre-existing political, social and economic risks locally or globally. |
The ongoing effects of COVID-19 are unpredictable and may result in significant and prolonged effects on the Fund’s performance.
NOTE 2 – Advisory Fees and Other Fees Paid to Affiliates
The Trust has entered into a master investment advisory agreement with Invesco Advisers, Inc. (the “Adviser” or “Invesco”). Under the terms of the investment advisory agreement, the Fund accrues daily and pays monthly an advisory fee to the Adviser based on the annual rate of the Fund’s average daily net assets as follows:
| | | | |
| Average Daily Net Assets | | Rate | |
First $ 1 billion | | | 0.25 | % |
Over $1 billion | | | 0.22 | % |
| | |
| 22 | | Invesco Conservative Income Fund |
For the year ended August 31, 2021, the effective advisory fees incurred by the Fund was 0.23%.
Under the terms of a master sub-advisory agreement between the Adviser and each of Invesco Asset Management Deutschland GmbH, Invesco Asset Management Limited, Invesco Asset Management (Japan) Limited, Invesco Hong Kong Limited, Invesco Senior Secured Management, Inc. and Invesco Canada Ltd. and separate sub-advisory agreements with Invesco Capital Management LLC and Invesco Asset Management (India) Private Limited (collectively, the “Affiliated Sub-Advisers”) the Adviser, not the Fund, will pay 40% of the fees paid to the Adviser to any such Affiliated Sub-Adviser(s) that provide(s) discretionary investment management services to the Fund based on the percentage of assets allocated to such Affiliated Sub-Adviser(s).
Effective June 1, 2021, the Adviser has contractually agreed, through at least December 31, 2021, to waive advisory fees and/or reimburse expenses of all shares to the extent necessary to limit total annual fund operating expenses after fee waiver and/or expense reimbursement (excluding certain items discussed below) of Class A, Class Y, Institutional Class and Class R6 shares to 0.40%, 0.30%, 0.30% and 0.30%, respectively, of the Fund’s average daily net assets (the “expense limits”). Prior to June 1, 2021, the Adviser had contractually agreed to waive advisory fees and/or reimburse expenses of all shares to the extent necessary to limit total annual fund operating expenses after fee waiver and/or expense reimbursement (excluding certain items discussed below) of Class A, Class Y, Institutional Class and Class R6 shares to 0.40%, 0.25%, 0.30% and 0.25%, respectively, of the Fund’s average daily net assets. In determining the Adviser’s obligation to waive advisory fees and/or reimburse expenses, the following expenses are not taken into account, and could cause the total annual fund operating expenses after fee waiver and/or expense reimbursement to exceed the number reflected above: (1) interest; (2) taxes; (3) dividend expense on short sales; (4) extraordinary or non-routine items, including litigation expenses; and (5) expenses that the Fund has incurred but did not actually pay because of an expense offset arrangement. Unless Invesco continues the fee waiver agreement, it will terminate on December 31, 2021. During its term, the fee waiver agreement cannot be terminated or amended to increase the expense limits or reduce the advisory fee waiver without approval of the Board of Trustees.
Further, the Adviser has contractually agreed, through at least June 30, 2023, to waive the advisory fee payable by the Fund in an amount equal to 100% of the net advisory fees the Adviser receives from the affiliated money market funds on investments by the Fund of uninvested cash in such affiliated money market funds.
For the year ended August 31, 2021, the Adviser waived advisory fees of $410,429 and reimbursed class level expenses of $215,981, $431,367, $0 and $404 of Class A, Class Y, Institutional Class and Class R6 shares, respectively.
The Trust has entered into a master administrative services agreement with Invesco pursuant to which the Fund has agreed to pay Invesco for certain administrative costs incurred in providing accounting services to the Fund. For the year ended August 31, 2021, expenses incurred under the agreement are shown in the Statement of Operations as Administrative services fees. Also, Invesco has entered into a sub-administration agreement whereby The Bank of New York Mellon (“BNY Mellon”) serves as custodian and fund accountant and provides certain administrative services to the Fund.
The Trust has entered into a transfer agency and service agreement with Invesco Investment Services, Inc. (“IIS”) pursuant to which each Fund has agreed to pay IIS a fee for providing transfer agency and shareholder services to the Fund. For the year ended August 31, 2021, expenses incurred under the agreement are shown in the Statement of Operations as Transfer agent fees.
The Trust has entered into a master distribution agreement with Invesco Distributors, Inc. (“IDI”) to serve as the distributor for the Fund. The Trust has adopted plans pursuant to Rule 12b-1 under the 1940 Act with respect to the Fund’s Class A shares (the “Plan”). The Fund, pursuant to the Plan, pays IDI compensation at the annual rate of 0.10% of the Fund’s average daily net assets of Class A shares. The fees are accrued daily and paid monthly. Of the Plan payments, up to 0.10% of the average daily net assets of Class A shares may be paid to furnish continuing personal shareholder services to customers who purchase and own shares of such class. For the year ended August 31, 2021, expenses incurred under the Plans are shown in the Statement of Operations as Distribution fees.
Certain officers and trustees of the Trust are officers and directors of the Adviser, IIS and/or IDI.
NOTE 3–Additional Valuation Information
GAAP defines fair value as the price that would be received to sell an asset or paid to transfer a liability in an orderly transaction between market participants at the measurement date, under current market conditions. GAAP establishes a hierarchy that prioritizes the inputs to valuation methods, giving the highest priority to readily available unadjusted quoted prices in an active market for identical assets (Level 1) and the lowest priority to significant unobservable inputs (Level 3), generally when market prices are not readily available or are unreliable. Based on the valuation inputs, the securities or other investments are tiered into one of three levels. Changes in valuation methods may result in transfers in or out of an investment’s assigned level:
| | Level 1 – | Prices are determined using quoted prices in an active market for identical assets. |
| | Level 2 – | Prices are determined using other significant observable inputs. Observable inputs are inputs that other market participants may use in pricing a security. These may include quoted prices for similar securities, interest rates, prepayment speeds, credit risk, yield curves, loss severities, default rates, discount rates, volatilities and others. |
| | Level 3 – | Prices are determined using significant unobservable inputs. In situations where quoted prices or observable inputs are unavailable (for example, when there is little or no market activity for an investment at the end of the period), unobservable inputs may be used. Unobservable inputs reflect the Fund’s own assumptions about the factors market participants would use in determining fair value of the securities or instruments and would be based on the best available information. |
As of August 31, 2021, all of the securities in this Fund were valued based on Level 2 inputs (see the Schedule of Investments for security categories). The level assigned to the securities valuations may not be an indication of the risk or liquidity associated with investing in those securities. Because of the inherent uncertainties of valuation, the values reflected in the financial statements may materially differ from the value received upon actual sale of those investments.
NOTE 4–Trustees’ and Officers’ Fees and Benefits
Trustees’ and Officers’ Fees and Benefits include amounts accrued by the Fund to pay remuneration to certain Trustees and Officers of the Fund.
NOTE 5–Cash Balances
The Fund may borrow for leveraging in an amount up to 5% of the Fund’s total assets (excluding the amount borrowed) at the time the borrowing is made. In doing so, the Fund is permitted to temporarily carry a negative or overdrawn balance in its account with BNY Mellon, the custodian bank. To compensate the custodian bank for such overdrafts, the overdrawn Fund may either (i) leave funds as a compensating balance in the account so the custodian bank can be compensated by earning the additional interest; or (ii) compensate by paying the custodian bank at a rate agreed upon by the custodian bank and Invesco, not to exceed the contractually agreed upon rate. The Fund may not purchase additional securities when any borrowings from banks exceed 5% of the Fund’s total assets.
| | |
| 23 | | Invesco Conservative Income Fund |
NOTE 6–Distributions to Shareholders and Tax Components of Net Assets
| | |
Tax Character of Distributions to Shareholders Paid During the Years Ended August 31, 2021 and August 31, 2020: | | |
| | | | | | | | | | | | |
| | | 2021 | | | | | | 2020 | |
Ordinary income* | | $ | 15,171,255 | | | | | | | $ | 46,736,225 | |
Long-term capital gain | | | 90,036 | | | | | | | | - | |
Total distributions | | $ | 15,261,291 | | | | | | | $ | 46,736,225 | |
| * | Includes short-term capital gain distributions, if any. |
| | |
Tax Components of Net Assets at Period-End: | | |
| | | | |
| | | 2021 | |
Undistributed ordinary income | | $ | 258,455 | |
Undistributed long-term capital gains | | | 3,040,913 | |
Net unrealized appreciation – investments | | | 7,889,889 | |
Temporary book/tax differences | | | (42,031 | ) |
Capital loss carryforward | | | (1,105,556 | ) |
Shares of beneficial interest | | | 3,961,246,203 | |
Total net assets | | $ | 3,971,287,873 | |
The difference between book-basis and tax-basis unrealized appreciation (depreciation) is due to differences in the timing of recognition of gains and losses on investments for tax and book purposes. The Fund’s net unrealized appreciation difference is attributable primarily to wash sales.
Capital loss carryforward is calculated and reported as of a specific date. Results of transactions and other activity after that date may affect the amount of capital loss carryforward actually available for the Fund to utilize. The ability to utilize capital loss carryforward in the future may be limited under the Internal Revenue Code and related regulations based on the results of future transactions.
The Fund has a capital loss carryforward as of August 31, 2021, as follows:
Capital Loss Carryforward*
| | | | | | | | | | | | | | | | | | | | |
Expiration | | Short-Term | | | | | | Long-Term | | | | | | Total | |
Not subject to expiration | | | $303,312 | | | | | | | $ | 802,244 | | | | | | | $ | 1,105,556 | |
| * | Capital loss carryforwards are reduced for limitations, if any, to the extent required by the Internal Revenue Code and may be further limited depending upon a variety of factors, including the realization of net unrealized gains or losses as of the date of any reorganization. |
NOTE 7–Investment Transactions
The aggregate amount of investment securities (other than short-term securities, U.S. Government obligations and money market funds, if any) purchased and sold by the Fund during the year ended August 31, 2021 was $1,283,006,798 and $1,324,646,262, respectively. Cost of investments, including any derivatives, on a tax basis includes the adjustments for financial reporting purposes as of the most recently completed federal income tax reporting period-end.
Unrealized Appreciation (Depreciation) of Investments on a Tax Basis
| | | | |
Aggregate unrealized appreciation of investments | | | $8,131,484 | |
Aggregate unrealized (depreciation) of investments | | | (241,595 | ) |
Net unrealized appreciation of investments | | | $7,889,889 | |
Cost of investments for tax purposes is $3,955,467,881.
NOTE 8–Share Information
| | | | | | | | | | | | | | | | | | | | |
| | | Summary of Share Activity | |
| | | Years ended August 31, | |
| | | 2021(a) | | | | | | 2020 | |
| | | Shares | | | Amount | | | | | | Shares | | | Amount | |
Sold: | | | | | | | | | | | | | | | | | | | | |
Class A | | | 95,646,360 | | | $ | 964,678,291 | | | | | | | | 77,145,331 | | | $ | 775,637,678 | |
Class Y(b) | | | 49,844,061 | | | | 502,686,546 | | | | | | | | 60,415,575 | | | | 606,993,540 | |
Institutional Class | | | 188,148,435 | | | | 1,897,519,129 | | | | | | | | 229,965,235 | | | | 2,310,890,614 | |
Class R6(c) | | | 824,167 | | | | 8,317,103 | | | | | | | | 3,275 | | | | 33,075 | |
Issued as reinvestment of dividends: | | | | | | | | | | | | | | | | | | | | |
Class A | | | 197,520 | | | | 1,992,370 | | | | | | | | 731,067 | | | | 7,342,681 | |
Class Y(b) | | | 184,539 | | | | 1,862,096 | | | | | | | | 264,356 | | | | 2,655,951 | |
Institutional Class | | | 574,996 | | | | 5,798,846 | | | | | | | | 2,021,601 | | | | 20,303,749 | |
Class R6(c) | | | 379 | | | | 3,824 | | | | | | | | 97 | | | | 984 | |
| | |
| 24 | | Invesco Conservative Income Fund |
| | | | | | | | | | | | | | | | | | | | |
| | Summary of Share Activity | |
| | | Years ended August 31, | |
| | | 2021(a) | | | | | | 2020 | |
| | | Shares | | | Amount | | | | | | Shares | | | Amount | |
| | | | | | |
Issued in connection with acquisitions:(d) | | | | | | | | | | | | | | | | | | | | |
Class A | | | - | | | $ | - | | | | | | | | 1,033,619 | | | $ | 10,385,540 | |
Class Y(b) | | | - | | | | - | | | | | | | | 2,903,298 | | | | 29,167,724 | |
Class R6(c) | | | - | | | | - | | | | | | | | 43,297 | | | | 435,374 | |
Reacquired: | | | | | | | | | | | | | | | | | | | | |
Class A | | | (71,669,623 | ) | | | (722,746,371 | ) | | | | | | | (60,775,054 | ) | | | (609,319,332 | ) |
Class Y(b) | | | (37,352,052 | ) | | | (376,637,851 | ) | | | | | | | (19,178,120 | ) | | | (192,261,321 | ) |
Institutional Class | | | (173,832,234 | ) | | | (1,752,980,580 | ) | | | | | | | (207,082,456 | ) | | | (2,075,030,882 | ) |
Class R6(c) | | | (79,650 | ) | | | (804,471 | ) | | | | | | | (34,524 | ) | | | (348,694 | ) |
Net increase in share activity | | | 52,486,898 | | | $ | 529,688,932 | | | | | | | | 87,456,597 | | | $ | 886,886,681 | |
| (a) | There are entities that are record owners of more than 5% of the outstanding shares of the Fund and in the aggregate own 75% of the outstanding shares of the Fund. IDI has an agreement with these entities to sell Fund shares. The Fund, Invesco and/or Invesco affiliates may make payments to these entities, which are considered to be related to the Fund, for providing services to the Fund, Invesco and/or Invesco affiliates including but not limited to services such as securities brokerage, distribution, third party record keeping and account servicing. The Fund has no knowledge as to whether all or any portion of the shares owned of record by these entities are also owned beneficially. |
| (b) | Commencement date of December 10, 2019. |
| (c) | Commencement date of May 15, 2020. |
| (d) | After the close of business on May 15, 2020, the Fund acquired all the net assets of Invesco Oppenheimer Ultra-Short Duration Fund (the “Target Fund”) pursuant to a plan of reorganization approved by the Board of Trustees of the Fund on February 14, 2020. The reorganization was executed in order to reduce overlap and increase efficiencies in the Adviser’s product line. The acquisition was accomplished by a tax-free exchange of 3,980,214 shares of the Fund for 8,007,337 shares outstanding of the Target Fund as of the close of business on May 15, 2020. Shares of the Target Fund were exchanged for the like class of shares of the Fund, based on the relative net asset value of the Target Fund to the net asset value of the Fund on the close of business, May 15, 2020. The Target Fund’s net assets as of the close of business on May 15, 2020 of $39,988,638, including $63,687 of unrealized appreciation, were combined with those of the Fund. The net assets of the Fund immediately before the acquisition were $2,709,611,128 and $2,749,599,766 immediately after the acquisition. |
The pro forma results of operations for the year ended August 31, 2020 assuming the reorganization had been completed on September 1, 2019, the beginning of the annual reporting period are as follows:
| | | | |
Net investment income | | | $48,143,521 | |
Net realized and unrealized gains | | | 7,914,087 | |
Change in net assets resulting from operations | | | $56,057,608 | |
As the combined investment portfolios have been managed as a single integrated portfolio since the acquisition was completed, it is not practicable to separate the amounts of revenue and earnings of the Target Fund that has been included in the Fund’s Statement of Operations since May 16, 2020.
| | |
| 25 | | Invesco Conservative Income Fund |
Report of Independent Registered Public Accounting Firm
To the Board of Trustees of Invesco Management Trust and Shareholders of Invesco Conservative Income Fund
Opinion on the Financial Statements
We have audited the accompanying statement of assets and liabilities, including the schedule of investments, of Invesco Conservative Income Fund (constituting Invesco Management Trust, referred to hereafter as the “Fund”) as of August 31, 2021, the related statement of operations for the year ended August 31, 2021, the statement of changes in net assets for each of the two years in the period ended August 31, 2021, including the related notes, and the financial highlights for each of the periods indicated therein (collectively referred to as the “financial statements”). In our opinion, the financial statements present fairly, in all material respects, the financial position of the Fund as of August 31, 2021, the results of its operations for the year then ended, the changes in its net assets for each of the two years in the period ended August 31, 2021 and the financial highlights for each of the periods indicated therein in conformity with accounting principles generally accepted in the United States of America.
Basis for Opinion
These financial statements are the responsibility of the Fund’s management. Our responsibility is to express an opinion on the Fund’s financial statements based on our audits. We are a public accounting firm registered with the Public Company Accounting Oversight Board (United States) (PCAOB) and are required to be independent with respect to the Fund in accordance with the U.S. federal securities laws and the applicable rules and regulations of the Securities and Exchange Commission and the PCAOB.
We conducted our audits of these financial statements in accordance with the standards of the PCAOB. Those standards require that we plan and perform the audit to obtain reasonable assurance about whether the financial statements are free of material misstatement, whether due to error or fraud.
Our audits included performing procedures to assess the risks of material misstatement of the financial statements, whether due to error or fraud, and performing procedures that respond to those risks. Such procedures included examining, on a test basis, evidence regarding the amounts and disclosures in the financial statements. Our audits also included evaluating the accounting principles used and significant estimates made by management, as well as evaluating the overall presentation of the financial statements. Our procedures included confirmation of securities owned as of August 31, 2021 by correspondence with the custodian and brokers; when replies were not received from brokers, we performed other auditing procedures. We believe that our audits provide a reasonable basis for our opinion.
/s/PricewaterhouseCoopers LLP
Houston, Texas
October 25, 2021
We have served as the auditor of one or more investment companies in the Invesco group of investment companies since at least 1995. We have not been able to determine the specific year we began serving as auditor.
| | |
| 26 | | Invesco Conservative Income Fund |
Calculating your ongoing Fund expenses
Example
As a shareholder of the Fund, you incur two types of costs: (1) transaction costs, which may include sales charges (loads) on purchase payments or contingent deferred sales charges on redemptions, if any; and (2) ongoing costs, including management fees, distribution and/or service (12b-1) fees, and other Fund expenses. This example is intended to help you understand your ongoing costs (in dollars) of investing in the Fund and to compare these costs with ongoing costs of investing in other mutual funds. The example is based on an investment of $1,000 invested at the beginning of the period and held for the entire period March 1, 2021 through August 31, 2021.
Actual expenses
The table below provides information about actual account values and actual expenses. You may use the information in this table, together with the amount you invested, to estimate the expenses that you paid over the period. Simply divide your account value by $1,000 (for example, an $8,600 account value divided by $1,000 = 8.6), then multiply the result by the number in the table under the heading entitled “Actual Expenses Paid During Period” to estimate the expenses you paid on your account during this period.
Hypothetical example for comparison purposes
The table below also provides information about hypothetical account values and hypothetical expenses based on the Fund’s actual expense ratio and an assumed rate of return of 5% per year before expenses, which is not the Fund’s actual return.
The hypothetical account values and expenses may not be used to estimate the actual ending account balance or expenses you paid for the period. You may use this information to compare the ongoing costs of investing in the Fund and other funds. To do so, compare this 5% hypothetical example with the 5% hypothetical examples that appear in the shareholder reports of the other funds.
Please note that the expenses shown in the table are meant to highlight your ongoing costs only and do not reflect any transaction costs, such as sales charges (loads) on purchase payments or contingent deferred sales charges on redemptions, if any. Therefore, the hypothetical information is useful in comparing ongoing costs only, and will not help you determine the relative total costs of owning different funds. In addition, if these transaction costs were included, your costs would have been higher.
| | | | | | | | | | | | | | | | | | | | | | | | | | | | | | |
Class | | Beginning Account Value (03/01/21) | | ACTUAL | | HYPOTHETICAL (5% annual return before expenses) | | Annualized Expense Ratio |
| Ending Account Value (08/31/21)1 | | Expenses Paid During Period2 | | Ending Account Value (08/31/21) | | Expenses Paid During Period2 |
A | | | | $1,000.00 | | | | | $999.80 | | | | | $2.02 | | | | | $1,023.19 | | | | | $2.04 | | | | | 0.40% | |
Y | | | | 1,000.00 | | | | | 1,001.40 | | | | | 1.41 | | | | | 1,023.79 | | | | | 1.43 | | | | | 0.28 | |
Institutional | | | | 1,000.00 | | | | | 1,001.50 | | | | | 1.31 | | | | | 1,023.89 | | | | | 1.33 | | | | | 0.26 | |
R6 | | | | 1,000.00 | | | | | 1,001.50 | | | | | 1.41 | | | | | 1,023.79 | | | | | 1.43 | | | | | 0.28 | |
| 1 | The actual ending account value is based on the actual total return of the Fund for the period March 1, 2021 through August 31, 2021, after actual expenses and will differ from the hypothetical ending account value which is based on the Fund’s expense ratio and a hypothetical annual return of 5% before expenses. |
| 2 | Expenses are equal to the Fund’s annualized expense ratio as indicated above multiplied by the average account value over the period, multiplied by 184/365 to reflect the most recent fiscal half year. |
| | |
| 27 | | Invesco Conservative Income Fund |
Approval of Investment Advisory and Sub-Advisory Contracts
At meetings held on June 10, 2021, the Board of Trustees (the Board or the Trustees) of Invesco Management Trust as a whole, and the independent Trustees, who comprise over 75% of the Board, voting separately, approved the continuance of the Invesco Conservative Income Fund’s (the Fund) Master Investment Advisory Agreement with Invesco Advisers, Inc. (Invesco Advisers and the investment advisory agreement) and the Master Intergroup Sub-Advisory Contract for Mutual Funds with Invesco Asset Management Deutschland GmbH, Invesco Asset Management Limited, Invesco Asset Management (Japan) Limited, Invesco Hong Kong Limited, Invesco Senior Secured Management, Inc. and Invesco Canada Ltd. and separate sub-advisory contracts with Invesco Capital Management LLC and Invesco Asset Management (India) Private Limited (collectively, the Affiliated Sub-Advisers and the sub-advisory contracts) for another year, effective July 1, 2021. After evaluating the factors discussed below, among others, the Board approved the renewal of the Fund’s investment advisory agreement and the sub-advisory contracts and determined that the compensation payable thereunder by the Fund to Invesco Advisers and by Invesco Advisers to the Affiliated Sub-Advisers is fair and reasonable.
The Board’s Evaluation Process
The Board has established an Investments Committee, which in turn has established Sub-Committees that meet throughout the year to review the performance of funds advised by Invesco Advisers (the Invesco Funds). The Sub-Committees meet regularly with portfolio managers for their assigned Invesco Funds and other members of management to review detailed information about investment performance and portfolio attributes of these funds. The Board has established additional standing and ad hoc committees that meet regularly throughout the year to review matters within their purview. The Board took into account evaluations and reports that it received from its committees and sub-committees, as well as the information provided to the Board and its committees and sub-committees throughout the year, in considering whether to approve each Invesco Fund’s investment advisory agreement and sub-advisory contracts.
As part of the contract renewal process, the Board reviews and considers information provided in response to detailed requests for information submitted to management by the independent Trustees with assistance from legal counsel to the independent Trustees. The Board receives comparative investment performance and fee and expense data regarding the Invesco Funds prepared by Broadridge Financial Solutions, Inc. (Broadridge), an independent mutual fund data provider, as well as information on the composition of the peer groups provided by Broadridge and its methodology for determining peer groups. The Board also receives an independent written evaluation from the Senior Officer, an officer of the Invesco Funds who reports directly to the independent Trustees. The Senior Officer’s evaluation is prepared as part of his responsibility to manage the process by which the Invesco Funds’ proposed management fees are negotiated during the annual contract renewal process to ensure they are negotiated in a manner
that is at arms’ length and reasonable. In addition to meetings with Invesco Advisers and fund counsel throughout the year and as part of meetings convened on April 27, 2021 and June 10, 2021, the independent Trustees also discussed the continuance of the investment advisory agreement and sub-advisory contracts in separate sessions with the Senior Officer and with independent legal counsel.
The discussion below is a summary of the Senior Officer’s independent written evaluation with respect to the Fund’s investment advisory agreement and sub-advisory contracts, as well as a discussion of the material factors and related conclusions that formed the basis for the Board’s approval of the Fund’s investment advisory agreement and sub-advisory contracts. The Trustees’ review and conclusions are based on the comprehensive consideration of all information presented to them during the course of the year and in prior years and are not the result of any single determinative factor. Moreover, one Trustee may have weighed a particular piece of information or factor differently than another Trustee. The information received and considered by the Board was current as of various dates prior to the Board’s approval on June 10, 2021.
Factors and Conclusions and Summary of Independent Written Fee Evaluation
| A. | Nature, Extent and Quality of Services Provided by Invesco Advisers and the Affiliated Sub-Advisers |
The Board reviewed the nature, extent and quality of the advisory services provided to the Fund by Invesco Advisers under the Fund’s investment advisory agreement, and the credentials and experience of the officers and employees of Invesco Advisers who provide these services, including the Fund’s portfolio manager(s). The Board’s review included consideration of Invesco Advisers’ investment process and oversight, credit analysis, and research capabilities. The Board considered information regarding Invesco Advisers’ programs for and resources devoted to risk management, including management of investment, enterprise, operational, liquidity, valuation and compliance risks, and technology used to manage such risks. The Board also received and reviewed information about Invesco Advisers’ role as administrator of the Invesco Funds’ liquidity risk management program. The Board received a description of Invesco Advisers’ business continuity plans and of its approach to data privacy and cybersecurity, including related testing. The Board considered how the cybersecurity and business continuity plans of Invesco Advisers Advisers and its key service providers operated in the increased remote working environment resulting from the novel coronavirus (“COVID-19”) pandemic. The Board also considered non-advisory services that Invesco Advisers and its affiliates provide to the Invesco Funds such as various back office support functions, third party oversight, internal audit, valuation, portfolio trading and legal and compliance. The Board observed that Invesco Advisers has been able to effectively manage, operate and oversee the Invesco Funds through the challenging COVID-19 pandemic period. The Board reviewed and considered the benefits to shareholders of investing in a Fund that is part of the family of funds under the umbrella of
Invesco Ltd., Invesco Advisers’ parent company, and noted Invesco Ltd.’s depth and experience in running an investment management business, as well as its commitment of financial and other resources to such business. The Board concluded that the nature, extent and quality of the services provided to the Fund by Invesco Advisers are appropriate and satisfactory.
The Board reviewed the services that may be provided by the Affiliated Sub-Advisers under the sub-advisory contracts and the credentials and experience of the officers and employees of the Affiliated Sub-Advisers who provide these services. The Board noted the Affiliated Sub-Advisers’ expertise with respect to certain asset classes and that the Affiliated Sub-Advisers have offices and personnel that are located in financial centers around the world. As a result, the Board noted that the Affiliated Sub-Advisers can provide research and investment analysis on the markets and economies of various countries in which the Fund may invest, make recommendations regarding securities and assist with security trades. The Board concluded that the sub-advisory contracts may benefit the Fund and its shareholders by permitting Invesco Advisers to use the resources and talents of the Affiliated Sub-Advisers in managing the Fund. The Board concluded that the nature, extent and quality of the services that may be provided to the Fund by the Affiliated Sub-Advisers are appropriate and satisfactory.
| B. | Fund Investment Performance |
The Board considered Fund investment performance as a relevant factor in considering whether to approve the investment advisory agreement. The Board did not view Fund investment performance as a relevant factor in considering whether to approve the sub-advisory contracts for the Fund, as no Affiliated Sub-Adviser currently manages assets of the Fund.
The Board compared the Fund’s investment performance over multiple time periods ending December 31, 2020 to the performance of funds in the Broadridge performance universe and against the ICE BofAML U.S. Treasury Bill Index (Index). The Board noted that performance of Institutional Class shares of the Fund was in the second quintile of its performance universe for the one, three and five year periods (the first quintile being the best performing funds and the fifth quintile being the worst performing funds). The Board noted that performance of Institutional Class shares of the Fund was above the performance of the Index for the one, three and five year periods. The Board recognized that the performance data reflects a snapshot in time as of a particular date and that selecting a different performance period could produce different results. The Board also reviewed more recent Fund performance as well as other performance metrics, which did not change its conclusions.
| C. | Advisory and Sub-Advisory Fees and Fund Expenses |
The Board compared the Fund’s contractual management fee rate to the contractual management fee rates of funds in the Fund’s Broadridge expense group. The Board noted that the contractual management fee rate for Institutional Class shares of the Fund was below the median contractual management fee rate of funds in its expense group.
| | |
| 28 | | Invesco Conservative Income Fund |
The Board noted that the term “contractual management fee” for funds in the expense group may include both advisory and certain non-portfolio management administrative services fees, but that Broadridge is not able to provide information on a fund by fund basis as to what is included. The Board also reviewed the methodology used by Broadridge in calculating expense group information, which includes using each fund’s contractual management fee schedule (including any applicable breakpoints) as reported in the most recent prospectus or statement of additional information for each fund in the expense group. The Board also considered comparative information regarding the Fund’s total expense ratio and its various components.
The Board noted that Invesco Advisers has contractually agreed to waive fees and/or limit expenses of the Fund for the term disclosed in the Fund’s registration statement in an amount necessary to limit total annual operating expenses to a specified percentage of average daily net assets for each class of the Fund.
The Board noted that Invesco Advisers and the Affiliated Sub-Advisers do not manage other similarly managed mutual funds or client accounts.
The Board also considered the services that may be provided by the Affiliated Sub-Advisers pursuant to the sub-advisory contracts, as well as the fees payable by Invesco Advisers to the Affiliated Sub-Advisers pursuant to the sub-advisory contracts.
| D. | Economies of Scale and Breakpoints |
The Board considered the extent to which there may be economies of scale in the provision of advisory services to the Fund and the Invesco Funds, and the extent to which such economies of scale are shared with the Fund and the Invesco Funds. The Board considered that the Fund benefits from economies of scale through contractual breakpoints in the Fund’s advisory fee schedule, which generally operate to reduce the Fund’s expense ratio as it grows in size. The Board requested and received additional information from Invesco Advisers regarding the levels of the Fund’s breakpoints in light of current assets. The Board noted that the Fund also shares in economies of scale through Invesco Advisers’ ability to negotiate lower fee arrangements with third party service providers. The Board noted that the Fund may also benefit from economies of scale through initial fee setting, fee waivers and expense reimbursements, as well as Invesco Advisers’ investment in its business, including investments in business infrastructure, technology and cybersecurity.
| E. | Profitability and Financial Resources |
The Board reviewed information from Invesco Advisers concerning the costs of the advisory and other services that Invesco Advisers and its affiliates provide to the Fund and the Invesco Funds and the profitability of Invesco Advisers and its affiliates in providing these services in the aggregate and on an individual Fund-by-Fund basis. The Board considered the methodology used for calculating profitability and noted that such methodology had recently been reviewed and enhanced. The Board noted that Invesco Advisers continues to operate at a net profit from services Invesco Advisers and its affiliates provide to the Invesco Funds in the aggregate and to most Funds individually. The Board did not deem the level of profits realized by Invesco Advisers and its affiliates from providing such services to be excessive, given the nature, extent and quality of the services provided. The Board noted that Invesco
Advisers provided information demonstrating that Invesco Advisers is financially sound and has the resources necessary to perform its obligations under the investment advisory agreement, and provided representations indicating that the Affiliated Sub-Advisers are financially sound and have the resources necessary to perform their obligations under the sub-advisory contracts.
| F. | Collateral Benefits to Invesco Advisers and its Affiliates |
The Board considered various other benefits received by Invesco Advisers and its affiliates from the relationship with the Fund, including the fees received for providing administrative, transfer agency and distribution services to the Fund. The Board received comparative information regarding fees charged for these services, including information provided by Broadridge and other independent sources. The Board reviewed the performance of Invesco Advisers and its affiliates in providing these services and the organizational structure employed to provide these services. The Board noted that these services are provided to the Fund pursuant to written contracts that are reviewed and subject to approval on an annual basis by the Board based on its determination that the services are required for the operation of the Fund.
The Board considered the benefits realized by Invesco Advisers and the Affiliated Sub-Advisers as a result of portfolio brokerage transactions executed through “soft dollar” arrangements. Invesco Advisers noted that the Fund does not execute brokerage transactions through “soft dollar” arrangements to any significant degree.
The Board considered that the Fund’s uninvested cash and cash collateral from any securities lending arrangements may be invested in registered money market funds or, with regard to securities lending cash collateral, unregistered funds that comply with Rule 2a-7 (collectively referred to as “affiliated money market funds”) advised by Invesco Advisers. The Board considered information regarding the returns of the affiliated money market funds relative to comparable overnight investments, as well as the fees paid by the affiliated money market funds to Invesco Advisers and its affiliates. In this regard, the Board noted that Invesco Advisers receives advisory fees from these affiliated money market funds attributable to the Fund’s investments. The Board also noted that Invesco Advisers has contractually agreed to waive through varying periods an amount equal to 100% of the net advisory fee Invesco Advisers receives from the affiliated money market funds with respect to the Fund’s investment in the affiliated money market funds of uninvested cash, but not cash collateral. The Board concluded that the advisory fees payable to Invesco Advisers from the Fund’s investment of cash collateral from any securities lending arrangements in the affiliated money market funds are for services that are not duplicative of services provided by Invesco Advisers to the Fund.
The Board also received information about commissions that an affiliated broker may receive for executing certain trades for the Fund. Invesco Advisers and the Affiliated Sub-Advisers advised the Board of the benefits to the Fund of executing trades through the affiliated broker and that such trades were executed in compliance with rules under the federal securities laws and consistent with best execution obligations.
| | |
| 29 | | Invesco Conservative Income Fund |
Tax Information
Form 1099-DIV, Form 1042-S and other year-end tax information provide shareholders with actual calendar year amounts that should be included in their tax returns. Shareholders should consult their tax advisors.
The following distribution information is being provided as required by the Internal Revenue Code or to meet a specific state’s requirement.
The Fund designates the following amounts or, if subsequently determined to be different, the maximum amount allowable for its fiscal year ended August 31, 2021:
| | | | | | | | |
Federal and State Income Tax | | | | | | |
| | | | | | | | |
Long-Term Capital Gain Distributions | | | $90,036 | |
Qualified Dividend Income* | | | 0.00% | |
Corporate Dividends Received Deduction* | | | 0.00% | |
U.S. Treasury Obligations* | | | 0.80% | |
Business Interest Income* | | | 100.00% | |
| | * | The above percentages are based on ordinary income dividends paid to shareholders during the Fund’s fiscal year. |
| | |
| 30 | | Invesco Conservative Income Fund |
Trustees and Officers
The address of each trustee and officer is Invesco Management Trust (the “Trust”), 11 Greenway Plaza, Suite 1000, Houston, Texas 77046-1173. The trustees serve for the life of the Trust, subject to their earlier death, incapacitation, resignation, retirement or removal as more specifically provided in the Trust’s organizational documents. Each officer serves for a one year term or until their successors are elected and qualified. Column two below includes length of time served with predecessor entities, if any.
| | | | | | | | | | |
Name, Year of Birth and Position(s) Held with the Trust | | Trustee and/or Officer Since | | Principal Occupation(s) During Past 5 Years | | Number of Funds in Fund Complex Overseen by Trustee | | | Other Directorship(s) Held by Trustee During Past 5 Years |
| Interested Trustee | | | | | | | | |
| Martin L. Flanagan1 – 1960 Trustee and Vice Chair | | 2014 | | Executive Director, Chief Executive Officer and President, Invesco Ltd. (ultimate parent of Invesco and a global investment management firm); Trustee and Vice Chair, The Invesco Funds; Vice Chair, Investment Company Institute; and Member of Executive Board, SMU Cox School of Business Formerly: Advisor to the Board, Invesco Advisers, Inc. (formerly known as Invesco Institutional (N.A.), Inc.); Chairman and Chief Executive Officer, Invesco Advisers, Inc. (registered investment adviser); Director, Chairman, Chief Executive Officer and President, Invesco Holding Company (US), Inc. (formerly IVZ Inc.) (holding company), Invesco Group Services, Inc. (service provider) and Invesco North American Holdings, Inc. (holding company); Director, Chief Executive Officer and President, Invesco Holding Company Limited (parent of Invesco and a global investment management firm); Director, Invesco Ltd.; Chairman, Investment Company Institute and President, Co-Chief Executive Officer, Co-President, Chief Operating Officer and Chief Financial Officer, Franklin Resources, Inc. (global investment management organization) | | | 184 | | | None |
| 1 | Mr. Flanagan is considered an interested person (within the meaning of Section 2(a)(19) of the 1940 Act) of the Trust because he is an officer of the Adviser to the Trust, and an officer and a director of Invesco Ltd., ultimate parent of the Adviser. |
| | |
| T-1 | | Invesco Conservative Income Fund |
Trustees and Officers–(continued)
| | | | | | | | | | |
Name, Year of Birth and Position(s) Held with the Trust | | Trustee and/or Officer Since | | Principal Occupation(s) During Past 5 Years | | Number of Funds in Fund Complex Overseen by Trustee | | | Other Directorship(s) Held by Trustee During Past 5 Years |
Independent Trustees | | | | | | | | |
Christopher L. Wilson - 1957 Trustee and Chair | | 2017 | | Retired Formerly: Director, TD Asset Management USA Inc. (mutual fund complex) (22 portfolios); Managing Partner, CT2, LLC (investing and consulting firm); President/Chief Executive Officer, Columbia Funds, Bank of America Corporation; President/Chief Executive Officer, CDC IXIS Asset Management Services, Inc.; Principal & Director of Operations, Scudder Funds, Scudder, Stevens & Clark, Inc.; Assistant Vice President, Fidelity Investments | | | 184 | | | Director, ISO New England, Inc. (non-profit organization managing regional electricity market) Formerly: enaible, Inc. (artificial intelligence technology) |
Beth Ann Brown - 1968 Trustee | | 2019 | | Independent Consultant Formerly: Head of Intermediary Distribution, Managing Director, Strategic Relations, Managing Director, Head of National Accounts, Senior Vice President, National Account Manager and Senior Vice President, Key Account Manager, Columbia Management Investment Advisers LLC; Vice President, Key Account Manager, Liberty Funds Distributor, Inc.; and Trustee of certain Oppenheimer Funds | | | 184 | | | Director, Board of Directors of Caron Engineering Inc.; Advisor, Board of Advisors of Caron Engineering Inc.; President and Director, Acton Shapleigh Youth Conservation Corps (non-profit); and President and Director of Grahamtastic Connection (non-profit) |
Jack M. Fields - 1952 Trustee | | 2014 | | Chief Executive Officer, Twenty First Century Group, Inc. (government affairs company); and Board Member, Impact(Ed) (non-profit) Formerly: Owner and Chief Executive Officer, Dos Angeles Ranch L.P. (cattle, hunting, corporate entertainment); Director, Insperity, Inc. (formerly known as Administaff) (human resources provider); Chief Executive Officer, Texana Timber LP (sustainable forestry company); Director of Cross Timbers Quail Research Ranch (non-profit); and member of the U.S. House of Representatives | | | 184 | | | Member, Board of Directors of Baylor College of Medicine |
Cynthia Hostetler - 1962 Trustee | | 2017 | | Non-Executive Director and Trustee of a number of public and private business corporations Formerly: Director, Aberdeen Investment Funds (4 portfolios); Director, Artio Global Investment LLC (mutual fund complex); Director, Edgen Group, Inc. (specialized energy and infrastructure products distributor); Director, Genesee & Wyoming, Inc. (railroads); Head of Investment Funds and Private Equity, Overseas Private Investment Corporation; President, First Manhattan Bancorporation, Inc.; Attorney, Simpson Thacher & Bartlett LLP | | | 184 | | | Resideo Technologies, Inc. (smart home technology); Vulcan Materials Company (construction materials company); Trilinc Global Impact Fund; Textainer Group Holdings, (shipping container leasing company); Investment Company Institute (professional organization); Independent Directors Council (professional organization) Eisenhower Foundation (non-profit) |
Eli Jones - 1961 Trustee | | 2016 | | Professor and Dean Emeritus, Mays Business School - Texas A&M University Formerly: Dean, Mays Business School-Texas A&M University; Professor and Dean, Walton College of Business, University of Arkansas and E.J. Ourso College of Business, Louisiana State University; Director, Arvest Bank | | | 184 | | | Insperity, Inc. (formerly known as Administaff) (human resources provider); First Financial Bancorp (regional bank) |
Elizabeth Krentzman - 1959 Trustee | | 2019 | | Formerly: Principal and Chief Regulatory Advisor for Asset Management Services and U.S. Mutual Fund Leader of Deloitte & Touche LLP; General Counsel of the Investment Company Institute (trade association); National Director of the Investment Management Regulatory Consulting Practice, Principal, Director and Senior Manager of Deloitte & Touche LLP; Assistant Director of the Division of Investment Management - Office of Disclosure and Investment Adviser Regulation of the U.S. Securities and Exchange Commission and various positions with the Division of Investment Management – Office of Regulatory Policy of the U.S. Securities and Exchange Commission; Associate at Ropes & Gray LLP; and Trustee of certain Oppenheimer Funds | | | 184 | | | Trustee of the University of Florida National Board Foundation; Member of the Cartica Funds Board of Directors (private investment funds) Formerly: Member of the University of Florida Law Center Association, Inc. Board of Trustees, Audit Committee, and Membership Committee |
Anthony J. LaCava, Jr. - 1956 Trustee | | 2019 | | Formerly: Director and Member of the Audit Committee, Blue Hills Bank (publicly traded financial institution) and Managing Partner, KPMG LLP | | | 184 | | | Blue Hills Bank; Chairman, Bentley University; Member, Business School Advisory Council; and Nominating Committee, KPMG LLP |
| | |
| T-2 | | Invesco Conservative Income Fund |
Trustees and Officers–(continued)
| | | | | | | | |
Name, Year of Birth and Position(s) Held with the Trust | | Trustee and/or Officer
Since | | Principal Occupation(s) During Past 5 Years | | Number of
Funds in Fund Complex Overseen by Trustee | | Other Directorship(s) Held by Trustee During Past 5 Years |
Independent Trustees–(continued) | | | | |
Prema Mathai-Davis - 1950 Trustee | | 2014 | | Retired Formerly: Co-Founder & Partner of Quantalytics Research, LLC, (a FinTech Investment Research Platform for the Self-Directed Investor); Trustee of YWCA Retirement Fund; CEO of YWCA of the USA; Board member of the NY Metropolitan Transportation Authority; Commissioner of the NYC Department of Aging; Board member of Johns Hopkins Bioethics Institute | | 184 | | None |
Joel W. Motley - 1952 Trustee | | 2019 | | Director of Office of Finance, Federal Home Loan Bank System; Managing Director of Carmona Motley Inc. (privately held financial advisor); Member of the Council on Foreign Relations and its Finance and Budget Committee; Chairman Emeritus of Board of Human Rights Watch and Member of its Investment Committee; and Member of Investment Committee and Board of Historic Hudson Valley (non-profit cultural organization) Formerly: Managing Director of Public Capital Advisors, LLC (privately held financial advisor); Managing Director of Carmona Motley Hoffman, Inc. (privately held financial advisor); Trustee of certain Oppenheimer Funds; Director of Columbia Equity Financial Corp. (privately held financial advisor); and Member of the Vestry of Trinity Church Wall Street | | 184 | | Member of Board of Trust for Mutual Understanding (non-profit promoting the arts and environment); Member of Board of Greenwall Foundation (bioethics research foundation) and its Investment Committee; Member of Board of Friends of the LRC (non-profit legal advocacy); Board Member and Investment Committee Member of Pulitzer Center for Crisis Reporting (non-profit journalism) |
Teresa M. Ressel – 1962 Trustee | | 2017 | | Non-executive director and trustee of a number of public and private business corporations Formerly: Chief Executive Officer, UBS Securities LLC (investment banking); Chief Operating Officer, UBS AG Americas (investment banking); Sr. Management Team Olayan America, The Olayan Group (international investor/commercial/industrial); Assistant Secretary for Management & Budget and Designated Chief Financial Officer, U.S. Department of Treasury; Director, Atlantic Power Corporation (power generation company) and ON Semiconductor Corporation (semiconductor manufacturing) | | 184 | | Formerly: Elucida Oncology (nanotechnology & medical particles company) |
Ann Barnett Stern - 1957 Trustee | | 2017 | | President, Chief Executive Officer and Board Member, Houston Endowment, Inc. a private philanthropic institution Formerly: Executive Vice President, Texas Children’s Hospital; Vice President, General Counsel and Corporate Compliance Officer, Texas Children’s Hospital; Attorney at Beck, Redden and Secrest, LLP and Andrews and Kurth LLP | | 184 | | Director and Audit Committee member of Federal Reserve Bank of Dallas; Trustee and Board Chair of Good Reason Houston (nonprofit); Trustee, Vice Chair, Chair of Nomination/Governance Committee, Chair of Personnel Committee of Holdsworth Center (nonprofit); Trustee and Investment Committee member of University of Texas Law School Foundation (nonprofit); Board Member of Greater Houston Partnership |
Robert C. Troccoli - 1949 Trustee | | 2016 | | Retired Formerly: Adjunct Professor, University of Denver - Daniels College of Business; and Managing Partner, KPMG LLP | | 184 | | None |
Daniel S. Vandivort - 1954 Trustee | | 2019 | | President, Flyway Advisory Services LLC (consulting and property management) | | 184 | | Formerly: Trustee, Board of Trustees, Treasurer and Chairman of the Audit Committee, Huntington Disease Foundation of America; Trustee and Governance Chair, of certain Oppenheimer Funds |
| | |
| T-3 | | Invesco Conservative Income Fund |
Trustees and Officers–(continued)
| | | | | | | | |
Name, Year of Birth and Position(s) Held with the Trust | | Trustee and/or Officer Since | | Principal Occupation(s) During Past 5 Years | | Number of Funds in Fund Complex Overseen by Trustee | | Other Directorship(s) Held by Trustee During Past 5 Years |
| Independent Trustees–(continued) | | | | |
James D. Vaughn - 1945 Trustee | | 2019 | | Retired Formerly: Managing Partner, Deloitte & Touche LLP; Trustee and Chairman of the Audit Committee, Schroder Funds; Board Member, Mile High United Way, Boys and Girls Clubs, Boy Scouts, Colorado Business Committee for the Arts, Economic Club of Colorado and Metro Denver Network (economic development corporation); and Trustee of certain Oppenheimer Funds | | 184 | | Board member and Chairman of Audit Committee of AMG National Trust Bank; Trustee University of South Dakota Foundation; Board member, Audit Committee Member and past Board Chair, Junior Achievement (non-profit) |
| | |
| T-4 | | Invesco Conservative Income Fund |
Trustees and Officers–(continued)
| | | | | | | | | | | | | | |
Name, Year of Birth and Position(s) Held with the Trust | | Trustee and/or Officer Since | | Principal Occupation(s) During Past 5 Years | | | | Number of
Funds in
Fund Complex
Overseen by
Trustee | | | Other
Directorship(s)
Held by Trustee
During Past 5
Years | |
Officers | | | | | | | | | | | | |
Sheri Morris - 1964 President and Principal Executive Officer | | 2014 | | Head of Global Fund Services, Invesco Ltd.; President and Principal Executive Officer, The Invesco Funds; Vice President, Invesco Exchange-Traded Fund Trust, Invesco Exchange-Traded Fund Trust II, Invesco India Exchange-Traded Fund Trust, Invesco Actively Managed Exchange-Traded Fund Trust, Invesco Actively Managed Exchange-Traded Commodity Fund Trust and Invesco Exchange-Traded Self-Indexed Fund Trust; and Vice President, OppenheimerFunds, Inc. Formerly: Vice President, Treasurer and Principal Financial Officer, The Invesco Funds; Vice President, Invesco AIM Advisers, Inc., Invesco AIM Capital Management, Inc. and Invesco AIM Private Asset Management, Inc.; Assistant Vice President and Assistant Treasurer, The Invesco Funds; Vice President and Assistant Vice President, Invesco Advisers, Inc.; Assistant Vice President, Invesco AIM Capital Management, Inc. and Invesco AIM Private Asset Management, Inc.; Treasurer, Invesco Exchange-Traded Fund Trust, Invesco Exchange-Traded Fund Trust II, Invesco India Exchange-Traded Fund Trust and Invesco Actively Managed Exchange-Traded Fund Trust and Senior Vice President, Invesco Advisers, Inc. (formerly known as Invesco Institutional (N.A.), Inc.) (registered investment adviser) | | | | | N/A | | | | N/A | |
Russell C. Burk - 1958 Senior Vice President and Senior Officer | | 2014 | | Senior Vice President and Senior Officer, The Invesco Funds | | | | | N/A | | | | N/A | |
Jeffrey H. Kupor - 1968 Senior Vice President, Chief Legal Officer and Secretary | | 2018 | | Head of Legal of the Americas, Invesco Ltd.; Senior Vice President and Secretary, Invesco Advisers, Inc. (formerly known as Invesco Institutional (N.A.), Inc.) (registered investment adviser); Senior Vice President and Secretary, Invesco Distributors, Inc. (formerly known as Invesco AIM Distributors, Inc.); Vice President and Secretary, Invesco Investment Services, Inc. (formerly known as Invesco AIM Investment Services, Inc.) Senior Vice President, Chief Legal Officer and Secretary, The Invesco Funds; Secretary and General Counsel, Invesco Investment Advisers LLC (formerly known as Van Kampen Asset Management); Secretary and General Counsel, Invesco Capital Markets, Inc. (formerly known as Van Kampen Funds Inc.) and Chief Legal Officer, Invesco Exchange-Traded Fund Trust, Invesco Exchange-Traded Fund Trust II, Invesco India Exchange-Traded Fund Trust, Invesco Actively Managed Exchange-Traded Fund Trust, Invesco Actively Managed Exchange-Traded Commodity Fund Trust and Invesco Exchange-Traded Self-Indexed Fund Trust;; Secretary and Vice President, Harbourview Asset Management Corporation; Secretary and Vice President, OppenheimerFunds, Inc. and Invesco Managed Accounts, LLC; Secretary and Senior Vice President, OFI Global Institutional, Inc.; Secretary and Vice President, OFI SteelPath, Inc.; Secretary and Vice President, Oppenheimer Acquisition Corp.; Secretary and Vice President, Shareholder Services, Inc.; Secretary and Vice President, Trinity Investment Management Corporation Formerly: Secretary and Vice President, Jemstep, Inc.; Head of Legal, Worldwide Institutional, Invesco Ltd.; Secretary and General Counsel, INVESCO Private Capital Investments, Inc.; Senior Vice President, Secretary and General Counsel, Invesco Management Group, Inc. (formerly known as Invesco AIM Management Group, Inc.); Assistant Secretary, INVESCO Asset Management (Bermuda) Ltd.; Secretary and General Counsel, Invesco Private Capital, Inc.; Assistant Secretary and General Counsel, INVESCO Realty, Inc.; Secretary and General Counsel, Invesco Senior Secured Management, Inc.; Secretary, Sovereign G./P. Holdings Inc.; and Secretary, Invesco Indexing LLC; Secretary, W.L. Ross & Co., LLC | | | | | N/A | | | | N/A | |
| | |
| T-5 | | Invesco Conservative Income Fund |
Trustees and Officers–(continued)
| | | | | | | | | | | | | | |
Name, Year of Birth and Position(s) Held with the Trust | | Trustee and/or Officer Since | | Principal Occupation(s) During Past 5 Years | | | |
| Number of
Funds in Fund Complex Overseen by Trustee |
| |
| Other
Directorship(s) Held by Trustee During Past 5 Years |
|
Officers–(continued) | | | | | | | | | | |
Andrew R. Schlossberg - 1974 Senior Vice President | | 2019 | | Head of the Americas and Senior Managing Director, Invesco Ltd.; Director and Senior Vice President, Invesco Advisers, Inc. (formerly known as Invesco Institutional (N.A.), Inc.) (registered investment adviser); Director and Chairman, Invesco Investment Services, Inc. (formerly known as Invesco AIM Investment Services, Inc.) (registered transfer agent); Senior Vice President, The Invesco Funds; Director, Invesco Investment Advisers LLC (formerly known as Van Kampen Asset Management); Director, President and Chairman, Invesco Insurance Agency, Inc. Formerly: Director, President and Chairman, Invesco Insurance Agency, Inc.; Director, Invesco UK Limited; Director and Chief Executive, Invesco Asset Management Limited and Invesco Fund Managers Limited; Assistant Vice President, The Invesco Funds; Senior Vice President, Invesco Advisers, Inc. (formerly known as Invesco Institutional (N.A.), Inc.) (registered investment adviser); Director and Chief Executive, Invesco Administration Services Limited and Invesco Global Investment Funds Limited; Director, Invesco Distributors, Inc.; Head of EMEA, Invesco Ltd.; President, Invesco Actively Managed Exchange-Traded Commodity Fund Trust, Invesco Actively Managed Exchange-Traded Fund Trust, Invesco Exchange-Traded Fund Trust, Invesco Exchange-Traded Fund Trust II and Invesco India Exchange-Traded Fund Trust; Managing Director and Principal Executive Officer, Invesco Capital Management LLC | | | | | N/A | | | | N/A | |
John M. Zerr - 1962 Senior Vice President | | 2014 | | Chief Operating Officer of the Americas; Senior Vice President, Invesco Advisers, Inc. (formerly known as Invesco Institutional (N.A.), Inc.) (registered investment adviser); Senior Vice President, Invesco Distributors, Inc. (formerly known as Invesco AIM Distributors, Inc.); Director and Vice President, Invesco Investment Services, Inc. (formerly known as Invesco AIM Investment Services, Inc.) Senior Vice President, The Invesco Funds; Managing Director, Invesco Capital Management LLC; Director, Invesco Investment Advisers LLC (formerly known as Van Kampen Asset Management); Senior Vice President, Invesco Capital Markets, Inc. (formerly known as Van Kampen Funds Inc.); Manager, Invesco Indexing LLC; Manager, Invesco Specialized Products, LLC; Member, Invesco Canada Funds Advisory Board; Director, President and Chief Executive Officer, Invesco Corporate Class Inc. (corporate mutual fund company); and Director, Chairman, President and Chief Executive Officer, Invesco Canada Ltd. (formerly known as Invesco Trimark Ltd./Invesco Trimark Ltèe) (registered investment adviser and registered transfer agent); President, Invesco, Inc.; President, Invesco Global Direct Real Estate Feeder GP Ltd.; President, Invesco IP Holdings(Canada) Ltd; President, Invesco Global Direct Real Estate GP Ltd.; President, Invesco Financial Services Ltd. / Services Financiers Invesco Ltée; President, Trimark Investments Ltd./Placements Trimark Ltée and Director and Chairman, Invesco Trust Company Formerly: Director and Senior Vice President, Invesco Insurance Agency, Inc.; Director and Senior Vice President, Invesco Management Group, Inc. (formerly known as Invesco AIM Management Group, Inc.); Secretary and General Counsel, Invesco Management Group, Inc. (formerly known as Invesco AIM Management Group, Inc.); Secretary, Invesco Investment Services, Inc. (formerly known as Invesco AIM Investment Services, Inc.); Chief Legal Officer and Secretary, The Invesco Funds; Secretary and General Counsel, Invesco Investment Advisers LLC (formerly known as Van Kampen Asset Management); Secretary and General Counsel, Invesco Capital Markets, Inc. (formerly known as Van Kampen Funds Inc.); Chief Legal Officer, Invesco Exchange-Traded Fund Trust, Invesco Exchange-Traded Fund Trust II, Invesco India Exchange-Traded Fund Trust, Invesco Actively Managed Exchange-Traded Fund Trust, Invesco Actively Managed Exchange-Traded Commodity Fund Trust and Invesco Exchange-Traded Self-Indexed Fund Trust; Secretary, Invesco Indexing LLC; Director, Secretary, General Counsel and Senior Vice President, Van Kampen Exchange Corp.; Director, Vice President and Secretary, IVZ Distributors, Inc. (formerly known as INVESCO Distributors, Inc.); Director and Vice President, INVESCO Funds Group, Inc.; Director and Vice President, Van Kampen Advisors Inc.; Director, Vice President, Secretary and General Counsel, Van Kampen Investor Services Inc.;Director and Secretary, Invesco Distributors, Inc. (formerly known as Invesco AIM Distributors, Inc.); Director, Senior Vice President, General Counsel and Secretary, Invesco AIM Advisers, Inc. and Van Kampen Investments Inc.; Director, Vice President and Secretary, Fund Management Company; Director, Senior Vice President, Secretary, General Counsel and Vice President, Invesco AIM Capital Management, Inc.; Chief Operating Officer and General Counsel, Liberty Ridge Capital, Inc. (an investment adviser) | | | | | N/A | | | | N/A | |
| | |
| T-6 | | Invesco Conservative Income Fund |
Trustees and Officers–(continued)
| | | | | | | | | | | | |
Name, Year of Birth and Position(s) Held with the Trust | | Trustee and/or Officer Since | | Principal Occupation(s) During Past 5 Years | | | | Number of Funds in Fund Complex Overseen by Trustee | | Other Directorship(s) Held by Trustee During Past 5 Years | |
Officers–(continued) | | | | | | | | |
Gregory G. McGreevey - 1962 Senior Vice President | | 2014 | | Senior Managing Director, Invesco Ltd.; Director, Chairman, President, and Chief Executive Officer, Invesco Advisers, Inc. (formerly known as Invesco Institutional (N.A.), Inc.) (registered investment adviser); Director, Invesco Mortgage Capital, Inc. and Invesco Senior Secured Management, Inc.; and Senior Vice President, The Invesco Funds; and President, SNW Asset Management Corporation and Invesco Managed Accounts, LLC; Chairman and Director, Invesco Private Capital, Inc.; Chairman and Director, INVESCO Private Capital Investments, Inc.; Chairman and Director, INVESCO Realty, Inc. Chairman and Director, INVESCO Realty, Inc.; and Senior Vice President, Invesco Group Services, Inc. Formerly: Senior Vice President, Invesco Management Group, Inc. and Invesco Advisers, Inc.; Assistant Vice President, The Invesco Funds | | | | N/A | | | N/A | |
Adrien Deberghes - 1967 Principal Financial Officer, Treasurer and Vice President | | 2020 | | Head of the Fund Office of the CFO and Fund Administration; Vice President, Invesco Advisers, Inc.; Principal Financial Officer, Treasurer and Vice President, The Invesco Funds; Vice President, Invesco Exchange-Traded Fund Trust, Invesco Exchange-Traded Fund Trust II, Invesco India Exchange-Traded Fund Trust, Invesco Actively Managed Exchange-Traded Fund Trust, Invesco Actively Managed Exchange-Traded Commodity Fund Trust and Invesco Exchange-Traded Self-Indexed Fund Trust Formerly: Senior Vice President and Treasurer, Fidelity Investments | | | | N/A | | | N/A | |
Crissie M. Wisdom - 1969 Anti-Money Laundering Compliance Officer | | 2014 | | Anti-Money Laundering and OFAC Compliance Officer for Invesco U.S. entities including: Invesco Advisers, Inc. and its affiliates, Invesco Capital Markets, Inc., Invesco Distributors, Inc., Invesco Investment Services, Inc., The Invesco Funds, Invesco Capital Management, LLC, Invesco Trust Company; and Fraud Prevention Manager for Invesco Investment Services, Inc. | | | | N/A | | | N/A | |
Todd F. Kuehl - 1969 Chief Compliance Officer and Senior Vice President | | 2020 | | Chief Compliance Officer, Invesco Advisers, Inc. (registered investment adviser); and Chief Compliance Officer, The Invesco Funds and Senior Vice President Formerly: Managing Director and Chief Compliance Officer, Legg Mason (Mutual Funds); Chief Compliance Officer, Legg Mason Private Portfolio Group (registered investment adviser) | | | | N/A | | | N/A | |
Michael McMaster – 1962 Chief Tax Officer, Vice President and Assistant Treasurer | | 2020 | | Head of Global Fund Services Tax; Chief Tax Officer, Vice President and Assistant Treasurer, The Invesco Funds; Vice President, Invesco Advisers, Inc.; Assistant Treasurer, Invesco Capital Management LLC, Assistant Treasurer and Chief Tax Officer, Invesco Exchange-Traded Fund Trust, Invesco Exchange-Traded Fund Trust II, Invesco India Exchange-Traded Fund Trust, Invesco Actively Managed Exchange-Traded Fund Trust, Invesco Actively Managed Exchange-Traded Commodity Fund Trust and Invesco Exchange-Traded Self-Indexed Fund Trust; Assistant Treasurer, Invesco Specialized Products, LLC Formerly: Senior Vice President – Managing Director of Tax Services, U.S. Bank Global Fund Services (GFS) | | | | N/A | | | N/A | |
The Statement of Additional Information of the Trust includes additional information about the Fund’s Trustees and is available upon request, without charge, by calling 1.800.959.4246. Please refer to the Fund’s Statement of Additional Information for information on the Fund’s sub-advisers.
| | | | | | |
| Office of the Fund | | Investment0 Adviser | | Distributor | | Auditors |
11 Greenway Plaza, Suite 1000 Houston, TX 77046-1173 | | Invesco Advisers, Inc. 1555 Peachtree Street, N.E. Atlanta, GA 30309 | | Invesco Distributors, Inc. 11 Greenway Plaza, Suite 1000 Houston, TX 77046-1173 | | PricewaterhouseCoopers LLP
1000 Louisiana Street, Suite 5800Houston, TX 77002-5678 |
| | | |
Counsel to the Fund Stradley Ronon Stevens & Young, LLP 2005 Market Street, Suite 2600 Philadelphia, PA 19103-7018 | | Counsel to the Independent Trustees Goodwin Procter LLP 901 New York Avenue, N.W. Washington, D.C. 20001 | | Transfer Agent Invesco Investment Services, Inc. 11 Greenway Plaza, Suite 1000 Houston, TX 77046-1173 | | Custodian
Bank of New York Mellon 2 Hanson Place Brooklyn, NY 11217-1431 |
| | |
| T-7 | | Invesco Conservative Income Fund |
(This page intentionally left blank)
(This page intentionally left blank)

Go paperless with eDelivery
Visit invesco.com/edelivery to enjoy the convenience and security of anytime electronic access to your investment documents.
With eDelivery, you can elect to have any or all of the following materials delivered straight to your inbox to download, save and print from your own computer:
| ◾ | | Fund reports and prospectuses |
Invesco mailing information
Send general correspondence to Invesco Investment Services, Inc., P.O. Box 219078, Kansas City, MO 64121-9078.
Important notice regarding delivery of security holder documents
To reduce Fund expenses, only one copy of most shareholder documents may be mailed to shareholders with multiple accounts at the same address (Householding). Mailing of your shareholder documents may be householded indefinitely unless you instruct us otherwise. If you do not want the mailing of these documents to be combined with those for other members of your household, please contact Invesco Investment Services, Inc. at 800 959 4246 or contact your financial institution. We will begin sending you individual copies for each account within 30 days after receiving your request.
Fund holdings and proxy voting information
The Fund provides a complete list of its portfolio holdings four times each fiscal year, at the end of each fiscal quarter. For the second and fourth quarters, the list appears, respectively, in the Fund’s semiannual and annual reports to shareholders. For the first and third quarters, the Fund files the list with the Securities and Exchange Commission (SEC) as an exhibit to its reports on Form N-PORT. The most recent list of portfolio holdings is available at invesco.com/completeqtrholdings. Shareholders can also look up the Fund’s Form N-PORT filings on the SEC website, sec.gov. The SEC file numbers for the Fund are shown below.
A description of the policies and procedures that the Fund uses to determine how to vote proxies relating to portfolio securities is available without charge, upon request, from our Client Services department at 800 959 4246, or at invesco.com/ corporate/about-us/esg. The information is also available on the SEC website, sec.gov.
Information regarding how the Fund voted proxies related to its portfolio securities during the most recent 12-month period ended June 30 is available at invesco.com/proxysearch. This information is also available on the SEC website, sec.gov.
Invesco Advisers, Inc. is an investment adviser; it provides investment advisory services to individual and institutional clients and does not sell securities. Invesco Distributors, Inc. is the US distributor for Invesco Ltd.’s retail mutual funds, exchange-traded funds and institutional money market funds. Both are wholly owned, indirect subsidiaries of Invesco Ltd.

| | | | | | | | |
| SEC file number(s): 811-22957 and 333-195218 | | Invesco Distributors, Inc. | | | | CINC-AR-1 | | |
ITEM 2. CODE OF ETHICS.
There were no amendments to the Code of Ethics (the “Code”) that applies to the Registrant’s Principal Executive Officer (“PEO”) and Principal Financial Officer (“PFO”) during the period covered by the report. The Registrant did not grant any waivers, including implicit waivers, from any provisions of the Code to the PEO or PFO during the period covered by this report.
ITEM 3. AUDIT COMMITTEE FINANCIAL EXPERT.
The Board of Trustees has determined that the Registrant has at least one audit committee financial expert serving on its Audit Committee. The Audit Committee financial experts are Cynthia Hostetler, Anthony J. LaCava, Jr., Robert C. Troccoli and James Vaughn. Cynthia Hostetler, Anthony J. LaCava, Jr., Robert C. Troccoli and James Vaughn are “independent” within the meaning of that term as used in Form N-CSR.
ITEM 4. PRINCIPAL ACCOUNTANT FEES AND SERVICES.
(a) to (d)
Fees Billed by PwC Related to the Registrant
PricewaterhouseCoopers LLC (“PwC”) billed the Registrant aggregate fees for services rendered to the Registrant for the last two fiscal years as shown in the following table. The Audit Committee pre-approved all audit and non-audit services provided to the Registrant.
| | | | | | | | |
| | | Fees Billed for
Services Rendered
to the Registrant
for fiscal year end
2021 | | | Fees Billed for
Services Rendered
to the Registrant
for fiscal year end
2020 | |
Audit Fees | | $ | 38,150 | | | $ | 44,407 | |
Audit-Related Fees(1) | | $ | 0 | | | $ | 5,500 | |
Tax Fees(2) | | $ | 19,564 | | | $ | 14,327 | |
All Other Fees | | $ | 0 | | | $ | 0 | |
| | | | | | | | |
Total Fees | | $ | 57,714 | | | $ | 64,234 | |
| | (1) | Audit-Related Fees for the fiscal year ended August 31, 2020 includes fees billed for reviewing regulatory filings. |
| | (2) | Tax Fees for the fiscal years ended August 31, 2021 and August 31, 2020 includes fees billed for preparation of U.S. Tax Returns and Taxable Income calculations, including excise tax and year-to-date estimates for various book-to-tax differences. |
Fees Billed by PwC Related to Invesco and Invesco Affiliates
PwC billed Invesco Advisers, Inc. (“Invesco”), the Registrant’s adviser, and any entity controlling, controlled by or under common control with Invesco that provides ongoing services to the Registrant (“Invesco Affiliates”) aggregate fees for pre-approved non-audit services rendered to Invesco and Invesco Affiliates for the last two fiscal years as shown in the following table. The Audit Committee pre-approved all non-audit services provided to Invesco and Invesco Affiliates that were required to be pre-approved.
| | | | | | | | |
| | | Fees Billed for Non-Audit
Services Rendered to
Invesco and Invesco
Affiliates for fiscal year
end 2021 That Were
Required
to be Pre-Approved
by the Registrant’s
Audit Committee | | | Fees Billed for Non-Audit
Services Rendered to
Invesco and Invesco
Affiliates for fiscal year
end 2020 That Were
Required
to be Pre-Approved
by the Registrant’s
Audit Committee | |
Audit-Related Fees(1) | | $ | 821,000 | | | $ | 701,000 | |
Tax Fees | | $ | 0 | | | $ | 0 | |
All Other Fees | | $ | 0 | | | $ | 0 | |
| | | | | | | | |
Total Fees | | $ | 821,000 | | | $ | 701,000 | |
| (1) | Audit-Related Fees for the fiscal years ended 2021 and 2020 include fees billed related to reviewing controls at a service organization. |
(e)(1)
PRE-APPROVAL OF AUDIT AND NON-AUDIT SERVICES
POLICIES AND PROCEDURES
As adopted by the Audit Committees
of the Invesco Funds (the “Funds”)
Last Amended March 29, 2017
| | I. | Statement of Principles |
The Audit Committees (the “Audit Committee”) of the Boards of Trustees of the Funds (the “Board”) have adopted these policies and procedures (the “Procedures”) with respect to the pre-approval of audit and non-audit services to be provided by the Funds’ independent auditor (the “Auditor”) to the Funds, and to the Funds’ investment adviser(s) and any entity controlling, controlled by, or under common control with the investment adviser(s) that provides ongoing services to the Funds (collectively, “Service Affiliates”).
Under Section 202 of the Sarbanes-Oxley Act of 2002, all audit and non-audit services provided to the Funds by the Auditor must be preapproved by the Audit Committee. Rule 2-01 of Regulation S-X requires that the Audit Committee also pre-approve a Service Affiliate’s engagement of the Auditor for non-audit services if the engagement relates directly to the operations and financial reporting of the Funds (a “Service Affiliate’s Covered Engagement”).
These Procedures set forth the procedures and the conditions pursuant to which the Audit Committee may pre-approve audit and non-audit services for the Funds and a Service Affiliate’s Covered Engagement pursuant to rules and regulations of the Securities and Exchange Commission (“SEC”) and other organizations and regulatory bodies applicable to the Funds (“Applicable Rules”).1 They address both general pre-approvals without consideration of specific case-by-case services (“general pre-approvals”) and pre-approvals on a case-by-case basis (“specific pre-approvals”). Any services requiring pre-approval that are not within the scope of general pre-approvals hereunder are subject to specific pre-approval. These Procedures also address the delegation by the Audit Committee of pre-approval authority to the Audit Committee Chair or Vice Chair.
| | II. | Pre-Approval of Fund Audit Services |
The annual Fund audit services engagement, including terms and fees, is subject to specific pre-approval by the Audit Committee. Audit services include the annual financial statement audit and other procedures required to be performed by an independent auditor to be able to form an opinion on the Funds’ financial statements. The Audit Committee will receive, review and consider sufficient information concerning a proposed Fund audit engagement to make a reasonable evaluation of the Auditor’s qualifications and independence. The Audit Committee will oversee the Fund audit services engagement as necessary, including approving any changes in terms, audit scope, conditions and fees.
In addition to approving the Fund audit services engagement at least annually and specifically approving any changes, the Audit Committee may generally or specifically pre-approve engagements for other audit services, which are those services that only an independent auditor reasonably can provide. Other audit services may include services associated with SEC registration statements, periodic reports and other documents filed with the SEC.
| | III. | General and Specific Pre-Approval of Non-Audit Fund Services |
The Audit Committee will consider, at least annually, the list of General Pre-Approved Non-Audit Services which list may be terminated or modified at any time by the Audit Committee. To inform the Audit Committee’s review and approval of General Pre-Approved Non-Audit Services, the Funds’ Treasurer (or his or her designee) and Auditor shall provide such information regarding independence or other matters as the Audit Committee may request.
Any services or fee ranges that are not within the scope of General Pre-Approved Non-Audit Services have not received general pre-approval and require specific pre-approval. Each request for specific pre-approval by the Audit Committee for services to be provided by the Auditor to the Funds must be submitted to the Audit Committee by the Funds’ Treasurer (or his or her designee) and must include detailed information about the services to be provided, the fees or fee ranges to be charged, and other relevant information sufficient to allow the Audit Committee to consider whether to pre-approve such engagement, including evaluating whether the provision of such services will impair the independence of the Auditor and is otherwise consistent with Applicable Rules.
| 1 | Applicable Rules include, for example, New York Stock Exchange (“NYSE”) rules applicable to closed-end funds managed by Invesco and listed on NYSE. |
| | IV. | Non-Audit Service Types |
The Audit Committee may provide either general or specific pre-approval of audit-related, tax or other services, each as described in more detail below.
“Audit-related services” are assurance and related services that are reasonably related to the performance of the audit or review of the Fund’s financial statements or that are traditionally performed by an independent auditor. Audit-related services include, among others, accounting consultations related to accounting, financial reporting or disclosure matters not classified as “Audit services”; assistance with understanding and implementing new accounting and financial reporting guidance from rulemaking authorities; services related to mergers, acquisitions or dispositions; compliance with ratings agency requirements and interfund lending activities; and assistance with internal control reporting requirements.
“Tax services” include, but are not limited to, the review and signing of the Funds’ federal tax returns, the review of required distributions by the Funds and consultations regarding tax matters such as the tax treatment of new investments or the impact of new regulations. The Audit Committee will not approve proposed services of the Auditor which the Audit Committee believes are to be provided in connection with a service or transaction initially recommended by the Auditor, the sole business purpose of which may be tax avoidance and the tax treatment of which may not be supported in the Internal Revenue Code and related regulations. The Audit Committee will consult with the Funds’ Treasurer (or his or her designee) and may consult with outside counsel or advisers as necessary to ensure the consistency of tax services rendered by the Auditor with the foregoing policy. The Auditor shall not represent any Fund or any Service Affiliate before a tax court, district court or federal court of claims.
Each request to provide tax services under either the general or specific pre-approval of the Audit Committee will include a description from the Auditor in writing of (i) the scope of the service, the fee structure for the engagement, and any side letter or other amendment to the engagement letter, or any other agreement (whether oral, written, or otherwise) between the Auditor and the Funds, relating to the service; and (ii) any compensation arrangement or other agreement, such as a referral agreement, a referral fee or fee-sharing arrangement, between the Auditor (or an affiliate of the Auditor) and any person (other than the Funds or Service Affiliates receiving the services) with respect to the promoting, marketing, or recommending of a transaction covered by the service. The Auditor will also discuss with the Audit Committee the potential effects of the services on the independence of the Auditor, and document the substance of its discussion with the Audit Committee.
The Audit Committee may pre-approve other non-audit services so long as the Audit Committee believes that the service will not impair the independence of the Auditor. Appendix I includes a list of services that the Auditor is prohibited from performing by the SEC rules. Appendix I also includes a list of services that would impair the Auditor’s independence unless the Audit Committee reasonably concludes that the results of the services will not be subject to audit procedures during an audit of the Funds’ financial statements.
| | V. | Pre-Approval of Service Affiliate’s Covered Engagements |
Rule 2-01 of Regulation S-X requires that the Audit Committee pre-approve a Service Affiliate’s engagement of the Auditor for non-audit services if the engagement relates directly to the operations and financial reporting of the Funds, defined above as a “Service Affiliate’s Covered Engagement”.
The Audit Committee may provide either general or specific pre-approval of any Service Affiliate’s Covered Engagement, including for audit-related, tax or other services, as described above, if the Audit Committee believes that the provision of the services to a Service Affiliate will not impair the independence of the Auditor with respect to the Funds. Any Service Affiliate’s Covered Engagements that are not within the scope of General Pre-Approved Non-Audit Services have not received general pre-approval and require specific pre-approval.
Each request for specific pre-approval by the Audit Committee of a Service Affiliate’s Covered Engagement must be submitted to the Audit Committee by the Funds’ Treasurer (or his or her designee) and must include detailed information about the services to be provided, the fees or fee ranges to be charged, a description of the current status of the pre-approval process involving other audit committees in the Invesco investment company complex (as defined in Rule 2-201 of Regulation S-X) with respect to the proposed engagement, and other relevant information sufficient to allow the Audit Committee to consider whether the provision of such services will impair the independence of the Auditor from the Funds. Additionally, the Funds’ Treasurer (or his or her designee) and the Auditor will provide the Audit Committee with a statement that the proposed engagement requires pre-approval by the Audit Committee, the proposed engagement, in their view, will not impair the independence of the Auditor and is consistent with Applicable Rules, and the description of the proposed engagement provided to the Audit Committee is consistent with that presented to or approved by the Invesco audit committee.
Information about all Service Affiliate engagements of the Auditor for non-audit services, whether or not subject to pre-approval by the Audit Committee, shall be provided to the Audit Committee at least quarterly, to allow the Audit Committee to consider whether the provision of such services is compatible with maintaining the Auditor’s independence from the Funds. The Funds’ Treasurer and Auditor shall provide the Audit Committee with sufficiently detailed information about the scope of services provided and the fees for such services, to ensure that the Audit Committee can adequately consider whether the provision of such services is compatible with maintaining the Auditor’s independence from the Funds.
| | VI. | Pre-Approved Fee Levels or Established Amounts |
Pre-approved fee levels or ranges for audit and non-audit services to be provided by the Auditor to the Funds, and for a Service Affiliate’s Covered Engagement, under general pre-approval or specific pre-approval will be set periodically by the Audit Committee. Any proposed fees exceeding 110% of the maximum pre-approved fee levels or ranges for such services or engagements will be promptly presented to the Audit Committee and will require specific pre-approval by the Audit Committee before payment of any additional fees is made.
The Audit Committee hereby delegates, subject to the dollar limitations set forth below, specific authority to its Chair, or in his or her absence, Vice Chair, to pre-approve audit and non-audit services proposed to be provided by the Auditor to the Funds and/or a Service Affiliate’s Covered Engagement, between Audit Committee meetings. Such delegation does not preclude the Chair or Vice Chair from declining, on a case by case basis, to exercise his or her delegated authority and instead convening the Audit Committee to consider and pre-approve any proposed services or engagements.
Notwithstanding the foregoing, the Audit Committee must pre-approve: (a) any non-audit services to be provided to the Funds for which the fees are estimated to exceed $500,000; (b) any Service Affiliate’s Covered Engagement for which the fees are estimated to exceed $500,000; or (c) any cost increase to any previously approved service or engagement that exceeds the greater of $250,000 or 50% of the previously approved fees up to a maximum increase of $500,000.
| | VIII. | Compliance with Procedures |
Notwithstanding anything herein to the contrary, failure to pre-approve any services or engagements that are not required to be pre-approved pursuant to the de minimis exception provided for in Rule 2-01(c)(7)(i)(C) of Regulation S-X shall not constitute a violation of these Procedures. The Audit Committee has designated the Funds’ Treasurer to ensure services and engagements are pre-approved in compliance with these Procedures. The Funds’ Treasurer will immediately report to the Chair of the Audit Committee, or the Vice Chair in his or her absence, any breach of these Procedures that comes to the attention of the Funds’ Treasurer or any services or engagements that are not required to be pre-approved pursuant to the de minimis exception provided for in Rule 2-01(c)(7)(i)(C) of Regulation S-X.
On at least an annual basis, the Auditor will provide the Audit Committee with a summary of all non-audit services provided to any entity in the investment company complex (as defined in section 2-01(f)(14) of Regulation S-X, including the Funds and Service Affiliates) that were not pre-approved, including the nature of services provided and the associated fees.
| | IX. | Amendments to Procedures |
All material amendments to these Procedures must be approved in advance by the Audit Committee. Non-material amendments to these Procedures may be made by the Legal and Compliance Departments and will be reported to the Audit Committee at the next regularly scheduled meeting of the Audit Committee.
Appendix I
Non-Audit Services That May Impair the Auditor’s Independence
The Auditor is not independent if, at any point during the audit and professional engagement, the Auditor provides the following non-audit services:
| | • | | Broker-dealer, investment adviser, or investment banking services ; |
| | • | | Expert services unrelated to the audit; |
| | • | | Any service or product provided for a contingent fee or a commission; |
| | • | | Services related to marketing, planning, or opining in favor of the tax treatment of confidential transactions or aggressive tax position transactions, a significant purpose of which is tax avoidance; |
| | • | | Tax services for persons in financial reporting oversight roles at the Fund; and |
| | • | | Any other service that the Public Company Oversight Board determines by regulation is impermissible. |
An Auditor is not independent if, at any point during the audit and professional engagement, the Auditor provides the following non-audit services unless it is reasonable to conclude that the results of the services will not be subject to audit procedures during an audit of the Funds’ financial statements:
| | • | | Bookkeeping or other services related to the accounting records or financial statements of the audit client; |
| | • | | Financial information systems design and implementation; |
| | • | | Appraisal or valuation services, fairness opinions, or contribution-in-kind reports; |
| | • | | Actuarial services; and |
| | • | | Internal audit outsourcing services. |
(e)(2) There were no amounts that were pre-approved by the Audit Committee pursuant to the de minimus exception under Rule 2-01 of Regulation S-X.
(f) Not applicable.
(g) In addition to the amounts shown in the tables above, PwC billed Invesco and Invesco Affiliates aggregate fees of $5,966,000 for the fiscal year ended August 31, 2021 and $5,769,000 for the fiscal year ended August 31, 2020. In total, PwC billed the Registrant, Invesco and Invesco Affiliates aggregate non-audit fees of $6,806,564 for the fiscal year ended August 31, 2021 and $6,484,327 for the fiscal year ended August 31, 2020.
PwC provided audit services to the Investment Company complex of approximately $31 million.
(h) The Audit Committee also has considered whether the provision of non-audit services that were rendered to Invesco and Invesco Affiliates that were not required to be pre-approved pursuant to SEC regulations, if any, is compatible with maintaining PwC’s independence.
ITEM 5. AUDIT COMMITTEE OF LISTED REGISTRANTS.
Not applicable.
ITEM 6. SCHEDULE OF INVESTMENTS.
Investments in securities of unaffiliated issuers is included as part of the reports to stockholders filed under Item 1 of this Form.
ITEM 7. DISCLOSURE OF PROXY VOTING POLICIES AND PROCEDURES FOR CLOSED-END MANAGEMENT INVESTMENT COMPANIES.
Not applicable.
ITEM 8. PORTFOLIO MANAGERS OF CLOSED-END MANAGEMENT COMPANIES.
Not applicable.
ITEM 9. PURCHASES OF EQUITY SECURITIES BY CLOSED-END MANAGEMENT INVESTMENT COMPANY AND AFFILIATED PURCHASERS.
Not applicable.
ITEM 10. SUBMISSION OF MATTERS TO A VOTE OF SECURITY HOLDERS.
None
ITEM 11. CONTROLS AND PROCEDURES.
| | (a) | As of October 21, 2021, an evaluation was performed under the supervision and with the participation of the officers of the Registrant, including the Principal Executive Officer (“PEO”) and Principal Financial Officer (“PFO”), to assess the effectiveness of the Registrant’s disclosure controls and procedures, as that term is defined in Rule 30a-3(c) under the Investment Company Act of 1940 (“Act”), as amended. Based on that evaluation, the Registrant’s officers, including the PEO and PFO, concluded that, as of October 21, 2021, the Registrant’s disclosure controls and procedures were reasonably designed so as to ensure: (1) that information required to be disclosed by the Registrant on Form N-CSR is recorded, processed, summarized and reported within the time periods specified by the rules and forms of the Securities and Exchange Commission; and (2) that material information relating to the Registrant is made known to the PEO and PFO as appropriate to allow timely decisions regarding required disclosure. |
| | (b) | There have been no changes in the Registrant’s internal control over financial reporting (as defined in Rule 30a-3(d) under the Act) that occurred during the period covered by this report that have materially affected, or are reasonably likely to materially affect, the Registrant’s internal control over financial reporting. |
ITEM 12. DISCLOSURE OF SECURITIES LENDING ACTIVITIES FOR CLOSED-END MANAGEMENT INVESTMENT COMPANIES.
Not applicable.
SIGNATURES
Pursuant to the requirements of the Securities Exchange Act of 1934 and the Investment Company Act of 1940, the Registrant has duly caused this report to be signed on its behalf by the undersigned, thereunto duly authorized.
Registrant: Invesco Management Trust
| | |
| By: | | /s/ Sheri Morris |
| | Sheri Morris |
| | Principal Executive Officer |
| |
| Date: | | November 4, 2021 |
Pursuant to the requirements of the Securities and Exchange Act of 1934 and the Investment Company Act of 1940, this report has been signed below by the following persons on behalf of the Registrant and in the capacities and on the dates indicated.
| | |
| By: | | /s/ Sheri Morris |
| | Sheri Morris |
| | Principal Executive Officer |
| |
| Date: | | November 4, 2021 |
| | |
| By: | | /s/ Adrien Deberghes |
| | Adrien Deberghes |
| | Principal Financial Officer |
| |
| Date: | | November 4, 2021 |