
Investor Presentation April 2022
CB Financial Services, Inc. (Nasdaq: CBFV) April 2022 Page 2 Forward-Looking Statements Statements contained in this investor presentation that are not historical facts may constitute forward-looking statements as that term is defined in the Private Securities Litigation Reform Act of 1995 and such forward-looking statements are subject to significant risks and uncertainties. The Company intends such forward-looking statements to be covered by the safe harbor provisions contained in the Act. The Company’s ability to predict results or the actual effect of future plans or strategies is inherently uncertain. Factors which could have a material adverse effect on the operations and future prospects of the Company and its subsidiaries include, but are not limited to, general and local economic conditions, the scope and duration of economic contraction as a result of the COVID-19 pandemic and its effects on the Company’s business and that of the Company’s customers, changes in market interest rates, deposit flows, demand for loans, real estate values and competition, competitive products and pricing, the ability of our customers to make scheduled loan payments, loan delinquency rates and trends, our ability to manage the risks involved in our business, our ability to control costs and expenses, inflation, market and monetary fluctuations, changes in federal and state legislation and regulation applicable to our business, actions by our competitors, and other factors that may be disclosed in the Company’s periodic reports as filed with the Securities and Exchange Commission. These risks and uncertainties should be considered in evaluating forward-looking statements and undue reliance should not be placed on such statements. The Company assumes no obligation to update any forward-looking statements except as may be required by applicable law or regulation. Explanation of Use of Non-GAAP Financial Measures In addition to financial measures presented in accordance with generally accepted accounting principles (“GAAP”), we use, and this investor presentation contains or references, certain non-GAAP financial measures. We believe these non-GAAP financial measures provide useful information in understanding our underlying results of operations or financial position and our business and performance trends as they facilitate comparisons with the performance of other companies in the financial services industry. Non-GAAP adjusted items impacting the Company's financial performance are identified to assist investors in providing a complete understanding of factors and trends affecting the Company’s business and in analyzing the Company’s operating results on the same basis as that applied by management. Although we believe that these non- GAAP financial measures enhance the understanding of our business and performance, they should not be considered an alternative to GAAP or considered to be more important than financial results determined in accordance with GAAP, nor are they necessarily comparable with non- GAAP measures which may be presented by other companies. Where non-GAAP financial measures are used, the comparable GAAP financial measure, as well as the reconciliation to the comparable GAAP financial measure, can be found herein.

Company Overview

CB Financial Services, Inc. (Nasdaq: CBFV) April 2022 Page 4 At a Glance – CB Financial Services, Inc. Shareholder Information Share Price $23.69 Shares Outstanding 5.2M Public Float 4.6M Market Cap 122.2M Total Stockholder’s Equity $122.2M Book Value per Share $23.69 Tangible Book Value per Share (1) $20.86 Price to Book Value 1.00X Price to Tangible Book Value (1) 1.14X P/E LTM (LTM EPS of $2.22) 10.7x P/E LTM (LTM Adjusted EPS of $2.07) (1) 11.4x • Community Bank headquartered in Southwestern PA • Founded in 1901 • Community Bank operates 11 offices in Greene, Allegheny, Washington, Fayette, and Westmoreland Counties in southwestern Pennsylvania, and three offices in Marshall and Ohio Counties in West Virginia. • Financial Overview – Assets: $1.44 billion – Loans: $1.02 billion – Deposits: $1.25 billion • Focused on investing in organic growth initiatives while also returning capital to shareholders via share repurchases. Corporate Overview • All daily trading information/multiples as of April 26, 2022 • All other financial information as of March 31, 2022 (1) Refer to Non-GAAP Financial Measures in the Appendix for the calculation of the measure and reconciliation to the most comparable GAAP measure.
CB Financial Services, Inc. (Nasdaq: CBFV) April 2022 Page 5 Our Enduring Purpose MISSION: We partner with individuals, businesses and communities to realize their dreams, protect their financial futures and improve their lives CORE VALUES: Take care of each other / Always do the right thing / Protect the Bank / Work hard to achieve our goals / Give and expect mutual respect / Enjoy life everyday OUR CORNERSTONE: Client experience first
CB Financial Services, Inc. (Nasdaq: CBFV) April 2022 Page 6 Investment Thesis: Well-Positioned to Achieve Better than Peer Results Solid Fundamental Leadership ◦ Executive team with an average of over 25 years experience in lending, finance, and credit ◦ Led by CEO John Montgomery, an accomplished bank executive with over 30 years of experience Market Presence with Brand Recognition ◦ 120 Year History ◦ Serving Stable Southwestern PA market Blending Efficiency with Technology ◦ Optimization efforts implemented in 2020-2021 are yielding measurable reductions in non- interest expense and resilience ◦ Improved profitability while continuing to invest in digital marketing and technology
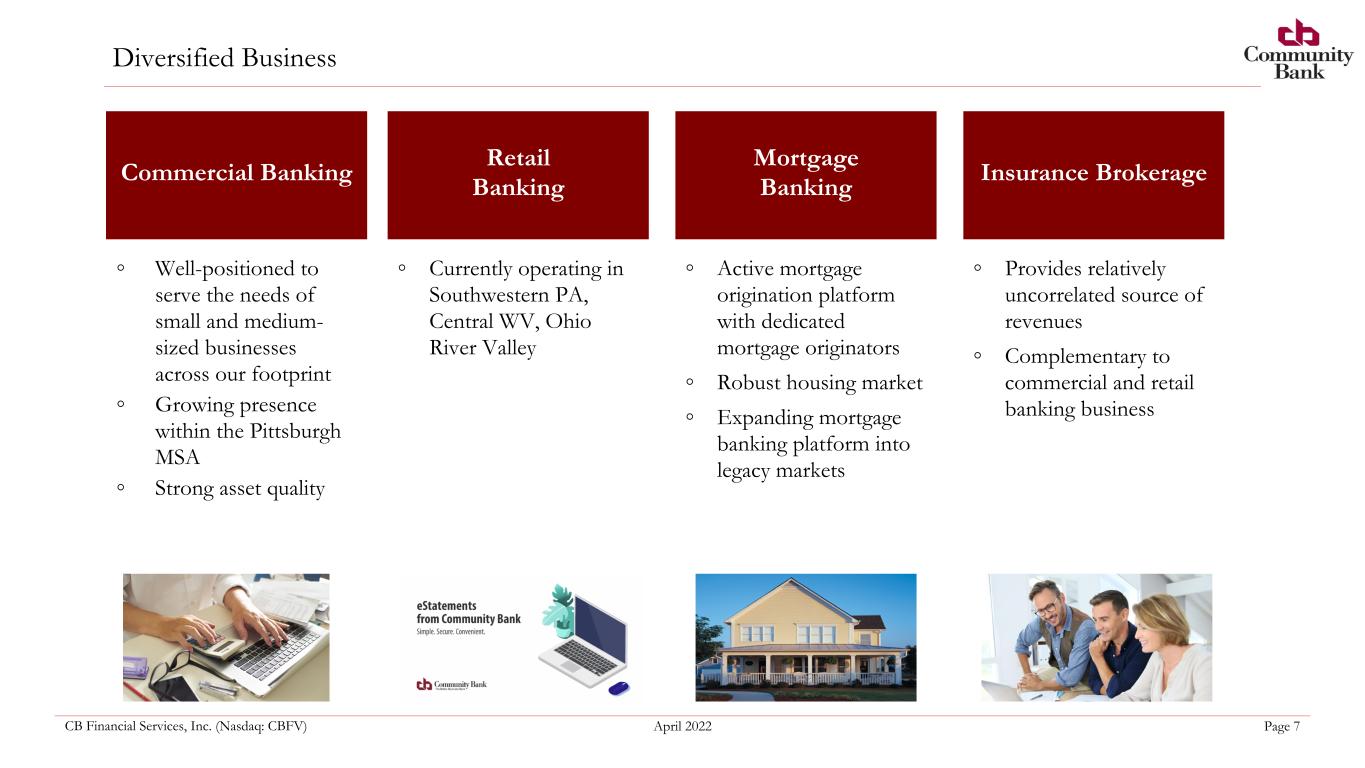
CB Financial Services, Inc. (Nasdaq: CBFV) April 2022 Page 7 Diversified Business ◦ Well-positioned to serve the needs of small and medium- sized businesses across our footprint ◦ Growing presence within the Pittsburgh MSA ◦ Strong asset quality Commercial Banking Retail Banking Mortgage Banking Insurance Brokerage ◦ Active mortgage origination platform with dedicated mortgage originators ◦ Robust housing market ◦ Expanding mortgage banking platform into legacy markets ◦ Provides relatively uncorrelated source of revenues ◦ Complementary to commercial and retail banking business ◦ Currently operating in Southwestern PA, Central WV, Ohio River Valley
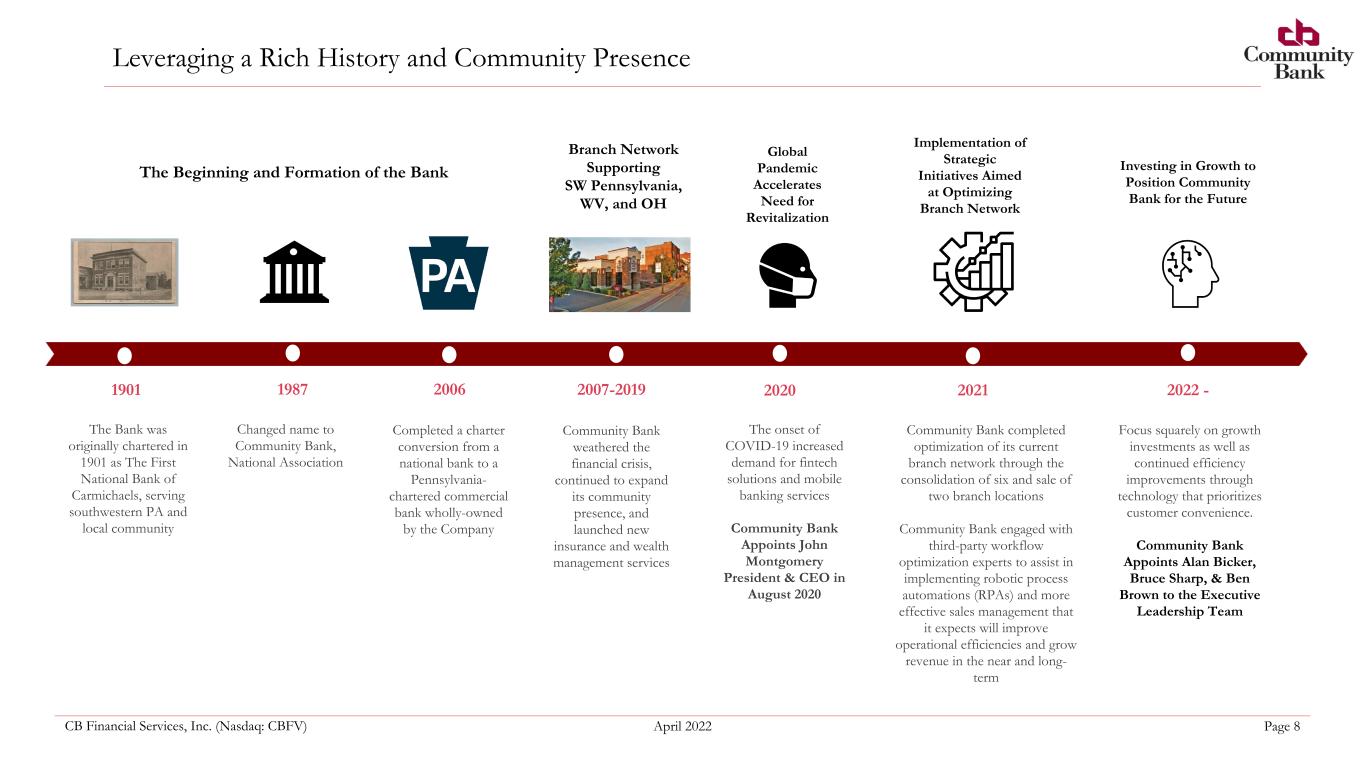
CB Financial Services, Inc. (Nasdaq: CBFV) April 2022 Page 8 Leveraging a Rich History and Community Presence 1901 1987 2006 2007-2019 2020 2021 The Bank was originally chartered in 1901 as The First National Bank of Carmichaels, serving southwestern PA and local community Changed name to Community Bank, National Association Community Bank weathered the financial crisis, continued to expand its community presence, and launched new insurance and wealth management services The onset of COVID-19 increased demand for fintech solutions and mobile banking services Community Bank Appoints John Montgomery President & CEO in August 2020 The Beginning and Formation of the Bank Branch Network Supporting SW Pennsylvania, WV, and OH Global Pandemic Accelerates Need for Revitalization Completed a charter conversion from a national bank to a Pennsylvania- chartered commercial bank wholly-owned by the Company Community Bank completed optimization of its current branch network through the consolidation of six and sale of two branch locations Community Bank engaged with third-party workflow optimization experts to assist in implementing robotic process automations (RPAs) and more effective sales management that it expects will improve operational efficiencies and grow revenue in the near and long- term Implementation of Strategic Initiatives Aimed at Optimizing Branch Network 2022 - Investing in Growth to Position Community Bank for the Future Focus squarely on growth investments as well as continued efficiency improvements through technology that prioritizes customer convenience. Community Bank Appoints Alan Bicker, Bruce Sharp, & Ben Brown to the Executive Leadership Team
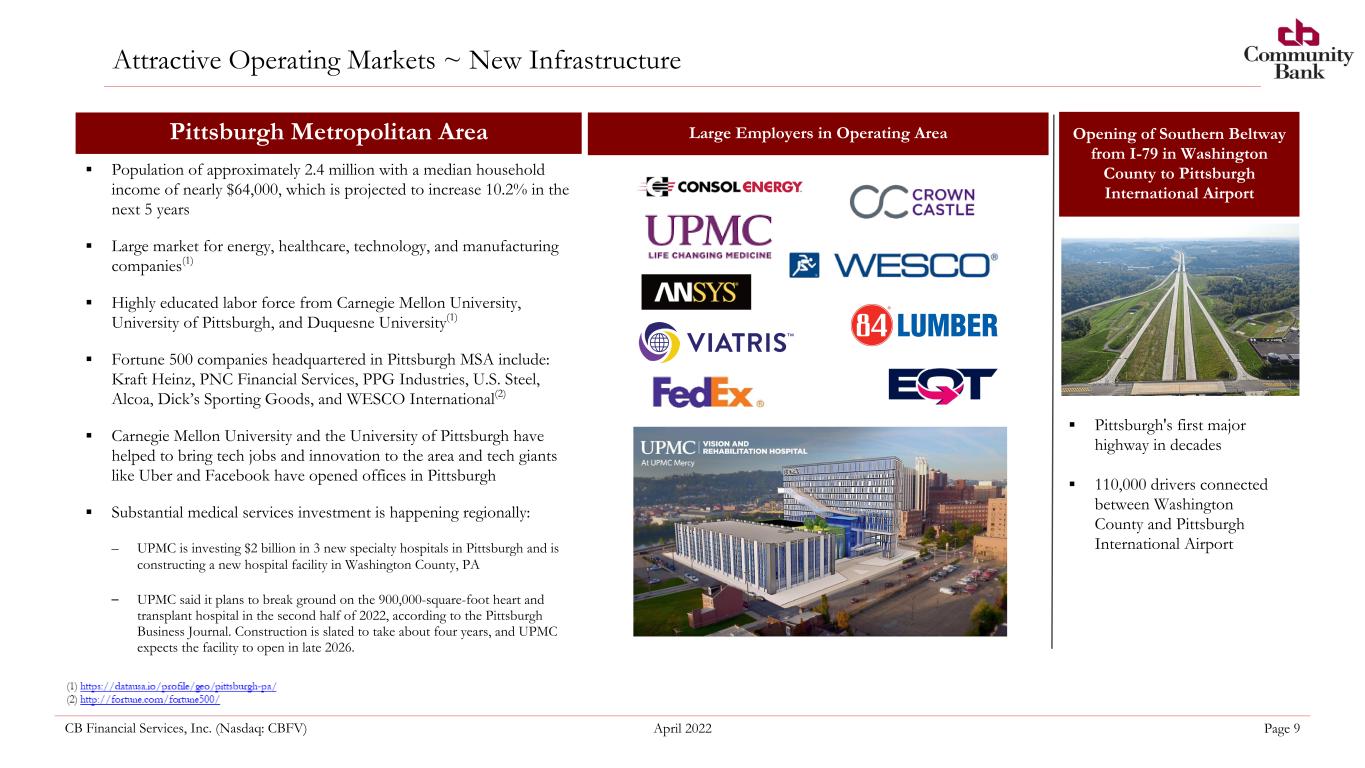
CB Financial Services, Inc. (Nasdaq: CBFV) April 2022 Page 9 ▪ Population of approximately 2.4 million with a median household income of nearly $64,000, which is projected to increase 10.2% in the next 5 years ▪ Large market for energy, healthcare, technology, and manufacturing companies(1) ▪ Highly educated labor force from Carnegie Mellon University, University of Pittsburgh, and Duquesne University(1) ▪ Fortune 500 companies headquartered in Pittsburgh MSA include: Kraft Heinz, PNC Financial Services, PPG Industries, U.S. Steel, Alcoa, Dick’s Sporting Goods, and WESCO International(2) ▪ Carnegie Mellon University and the University of Pittsburgh have helped to bring tech jobs and innovation to the area and tech giants like Uber and Facebook have opened offices in Pittsburgh ▪ Substantial medical services investment is happening regionally: – UPMC is investing $2 billion in 3 new specialty hospitals in Pittsburgh and is constructing a new hospital facility in Washington County, PA – UPMC said it plans to break ground on the 900,000-square-foot heart and transplant hospital in the second half of 2022, according to the Pittsburgh Business Journal. Construction is slated to take about four years, and UPMC expects the facility to open in late 2026. Large Employers in Operating AreaPittsburgh Metropolitan Area Attractive Operating Markets ~ New Infrastructure Opening of Southern Beltway from I-79 in Washington County to Pittsburgh International Airport ▪ Pittsburgh's first major highway in decades ▪ 110,000 drivers connected between Washington County and Pittsburgh International Airport
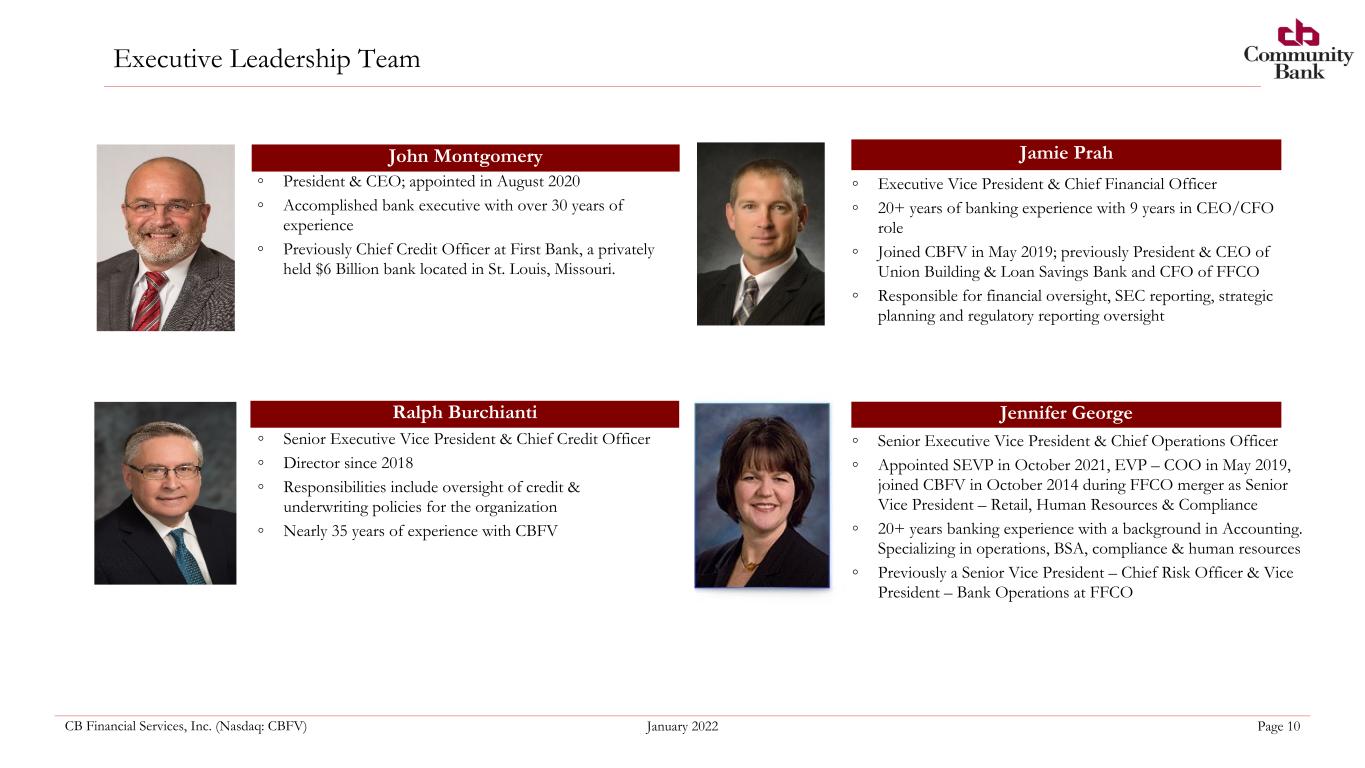
CB Financial Services, Inc. (Nasdaq: CBFV) January 2022 Page 10 ◦ President & CEO; appointed in August 2020 ◦ Accomplished bank executive with over 30 years of experience ◦ Previously Chief Credit Officer at First Bank, a privately held $6 Billion bank located in St. Louis, Missouri. Jamie Prah ◦ Executive Vice President & Chief Financial Officer ◦ 20+ years of banking experience with 9 years in CEO/CFO role ◦ Joined CBFV in May 2019; previously President & CEO of Union Building & Loan Savings Bank and CFO of FFCO ◦ Responsible for financial oversight, SEC reporting, strategic planning and regulatory reporting oversight John Montgomery Ralph Burchianti ◦ Senior Executive Vice President & Chief Credit Officer ◦ Director since 2018 ◦ Responsibilities include oversight of credit & underwriting policies for the organization ◦ Nearly 35 years of experience with CBFV Executive Leadership Team Jennifer George ◦ Senior Executive Vice President & Chief Operations Officer ◦ Appointed SEVP in October 2021, EVP – COO in May 2019, joined CBFV in October 2014 during FFCO merger as Senior Vice President – Retail, Human Resources & Compliance ◦ 20+ years banking experience with a background in Accounting. Specializing in operations, BSA, compliance & human resources ◦ Previously a Senior Vice President – Chief Risk Officer & Vice President – Bank Operations at FFCO
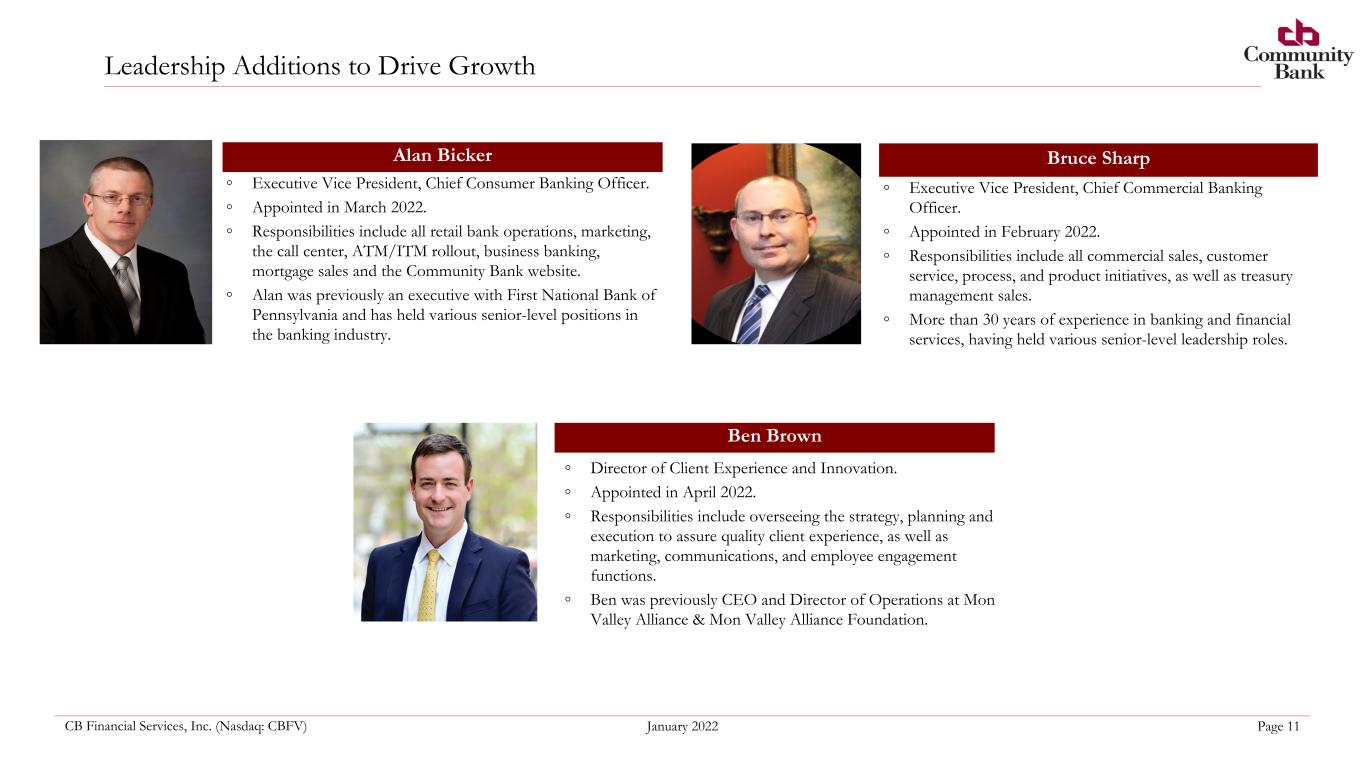
CB Financial Services, Inc. (Nasdaq: CBFV) January 2022 Page 11 Leadership Additions to Drive Growth Alan Bicker ◦ Executive Vice President, Chief Consumer Banking Officer. ◦ Appointed in March 2022. ◦ Responsibilities include all retail bank operations, marketing, the call center, ATM/ITM rollout, business banking, mortgage sales and the Community Bank website. ◦ Alan was previously an executive with First National Bank of Pennsylvania and has held various senior-level positions in the banking industry. Bruce Sharp ◦ Executive Vice President, Chief Commercial Banking Officer. ◦ Appointed in February 2022. ◦ Responsibilities include all commercial sales, customer service, process, and product initiatives, as well as treasury management sales. ◦ More than 30 years of experience in banking and financial services, having held various senior-level leadership roles. Ben Brown ◦ Director of Client Experience and Innovation. ◦ Appointed in April 2022. ◦ Responsibilities include overseeing the strategy, planning and execution to assure quality client experience, as well as marketing, communications, and employee engagement functions. ◦ Ben was previously CEO and Director of Operations at Mon Valley Alliance & Mon Valley Alliance Foundation.

2022 Update
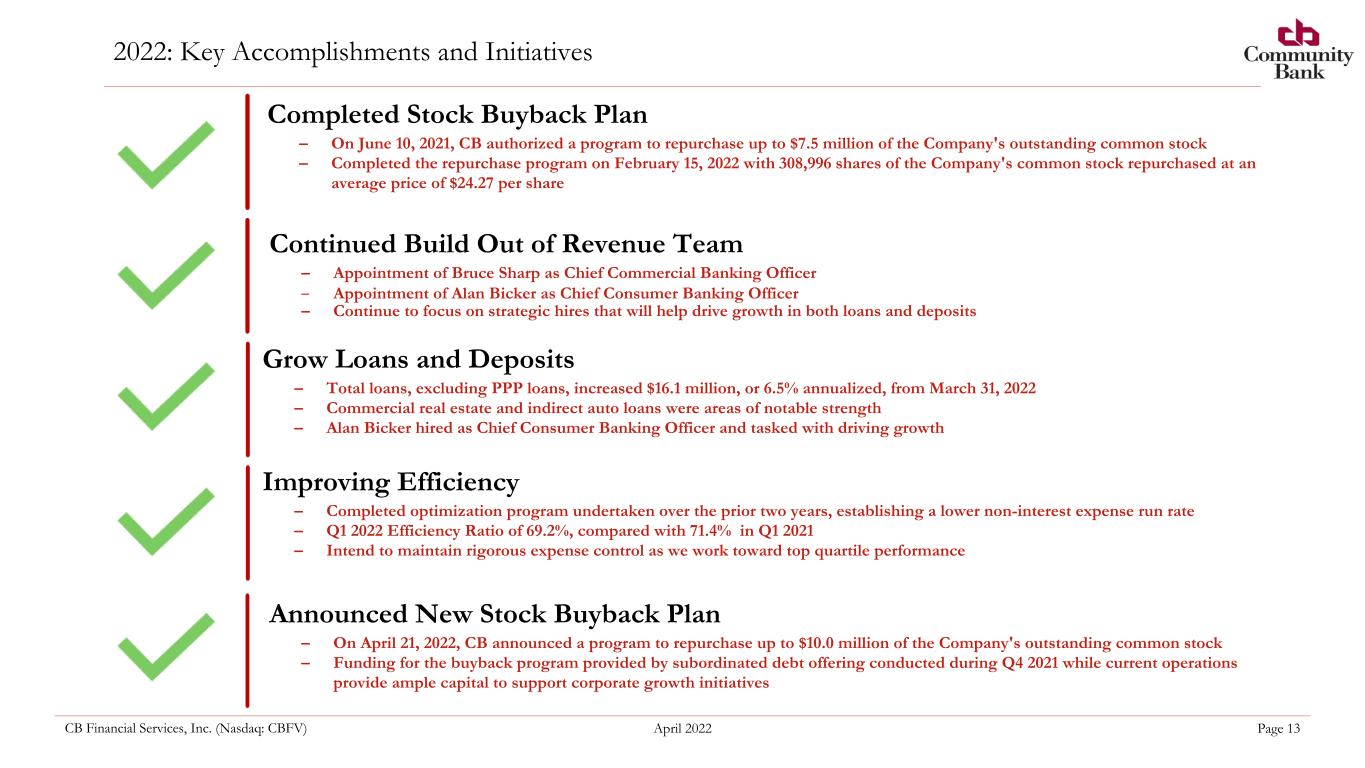
CB Financial Services, Inc. (Nasdaq: CBFV) April 2022 Page 13 2022: Key Accomplishments and Initiatives 01 03 02 Well-positioned to capitalize on continued U.S. housing market recovery Continued Build Out of Revenue Team – Appointment of Bruce Sharp as Chief Commercial Banking Officer – Appointment of Alan Bicker as Chief Consumer Banking Officer – Continue to focus on strategic hires that will help drive growth in both loans and deposits Grow Loans and Deposits – Total loans, excluding PPP loans, increased $16.1 million, or 6.5% annualized, from March 31, 2022 – Commercial real estate and indirect auto loans were areas of notable strength – Alan Bicker hired as Chief Consumer Banking Officer and tasked with driving growth Completed Stock Buyback Plan – On June 10, 2021, CB authorized a program to repurchase up to $7.5 million of the Company's outstanding common stock – Completed the repurchase program on February 15, 2022 with 308,996 shares of the Company's common stock repurchased at an average price of $24.27 per share 02 Announced New Stock Buyback Plan – On April 21, 2022, CB announced a program to repurchase up to $10.0 million of the Company's outstanding common stock – Funding for the buyback program provided by subordinated debt offering conducted during Q4 2021 while current operations provide ample capital to support corporate growth initiatives Improving Efficiency – Completed optimization program undertaken over the prior two years, establishing a lower non-interest expense run rate – Q1 2022 Efficiency Ratio of 69.2%, compared with 71.4% in Q1 2021 – Intend to maintain rigorous expense control as we work toward top quartile performance
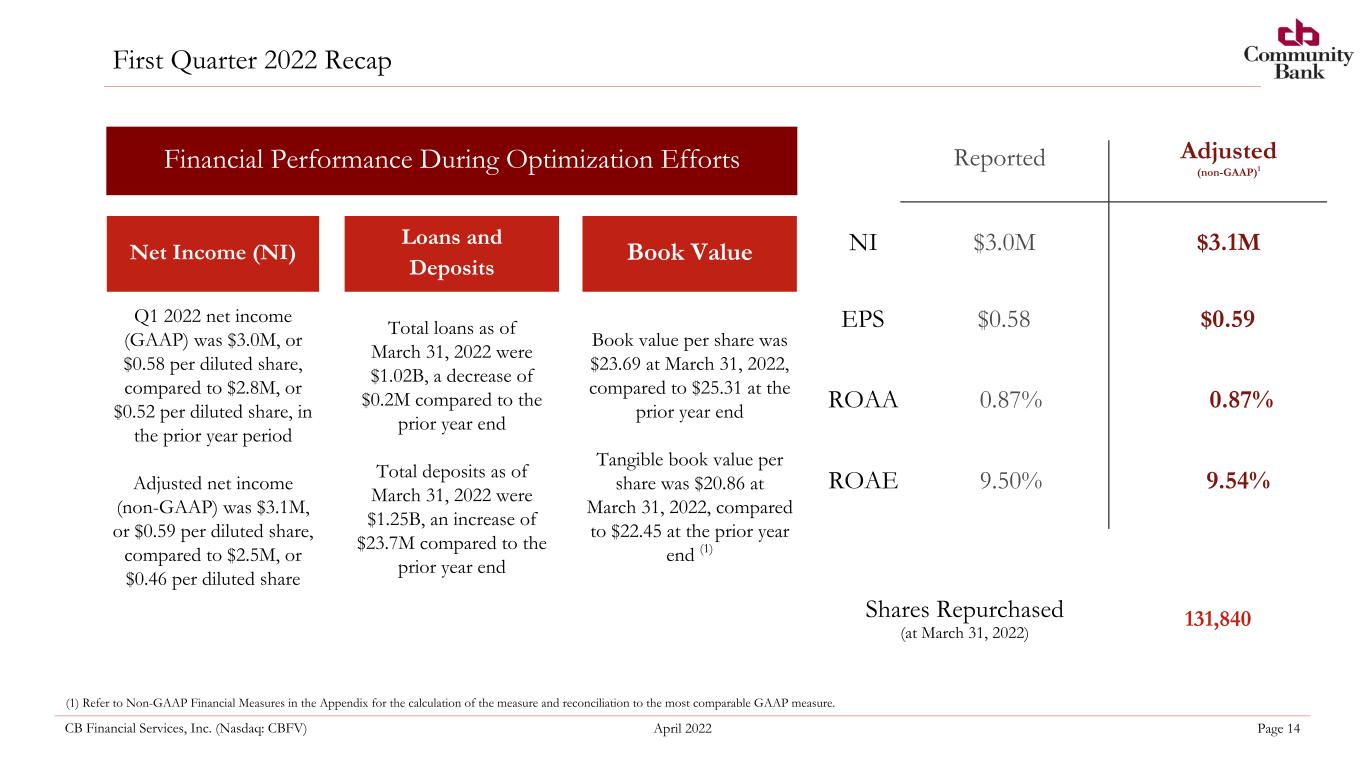
CB Financial Services, Inc. (Nasdaq: CBFV) April 2022 Page 14 First Quarter 2022 Recap Financial Performance During Optimization Efforts (1) Refer to Non-GAAP Financial Measures in the Appendix for the calculation of the measure and reconciliation to the most comparable GAAP measure. (comparison to December 31, 2020) Reported Adjusted (non-GAAP) $3.1M Reported Adjusted (non-GAAP)1 NI $3.0M $0.59EPS $0.58 0.87% 0.87% 9.54% 9.50% ROAA ROAE Net Income (NI) Loans and Deposits Book Value Q1 2022 net income (GAAP) was $3.0M, or $0.58 per diluted share, compared to $2.8M, or $0.52 per diluted share, in the prior year period Adjusted net income (non-GAAP) was $3.1M, or $0.59 per diluted share, compared to $2.5M, or $0.46 per diluted share Total loans as of March 31, 2022 were $1.02B, a decrease of $0.2M compared to the prior year end Total deposits as of March 31, 2022 were $1.25B, an increase of $23.7M compared to the prior year end Book value per share was $23.69 at March 31, 2022, compared to $25.31 at the prior year end Tangible book value per share was $20.86 at March 31, 2022, compared to $22.45 at the prior year end (1) 131,840Shares Repurchased (at March 31, 2022)
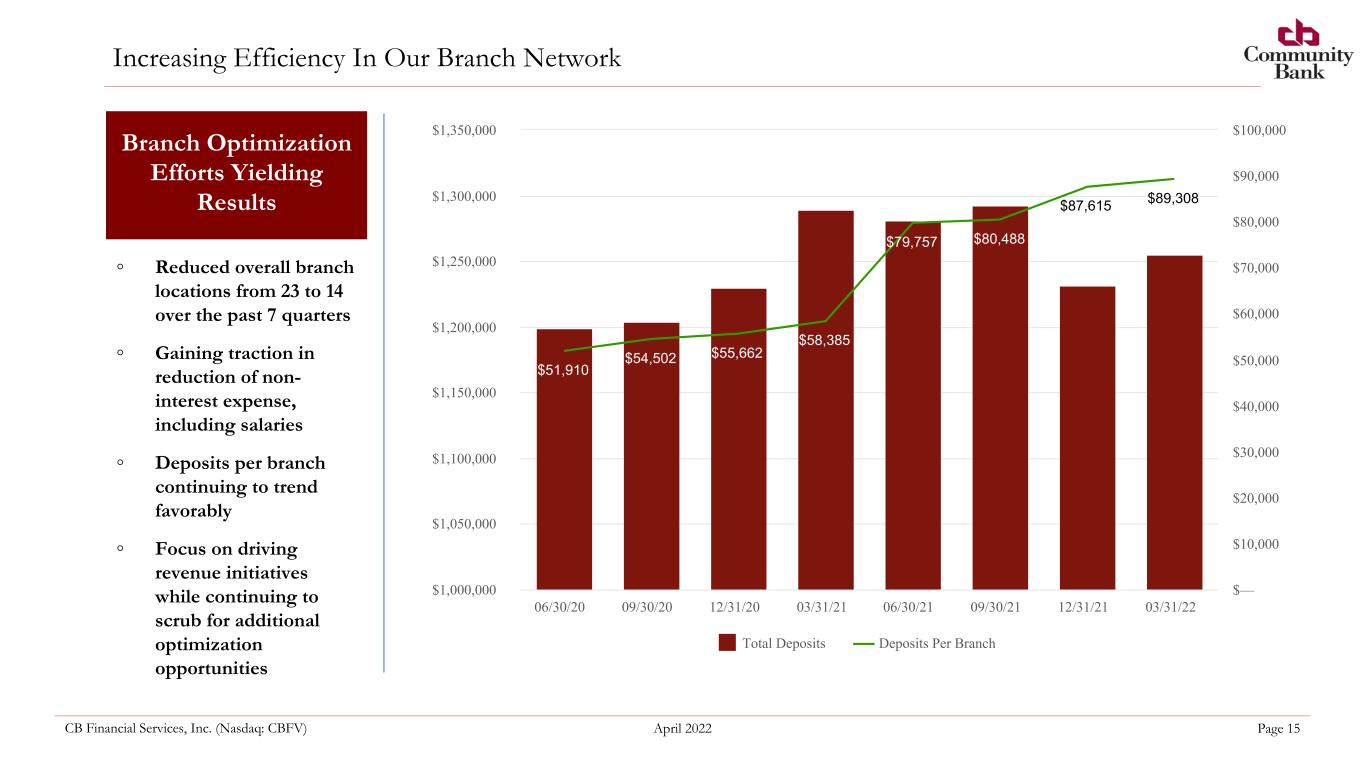
CB Financial Services, Inc. (Nasdaq: CBFV) April 2022 Page 15 Increasing Efficiency In Our Branch Network ◦ Reduced overall branch locations from 23 to 14 over the past 7 quarters ◦ Gaining traction in reduction of non- interest expense, including salaries ◦ Deposits per branch continuing to trend favorably ◦ Focus on driving revenue initiatives while continuing to scrub for additional optimization opportunities Branch Optimization Efforts Yielding Results $51,910 $54,502 $55,662 $58,385 $79,757 $80,488 $87,615 $89,308 Total Deposits Deposits Per Branch 06/30/20 09/30/20 12/31/20 03/31/21 06/30/21 09/30/21 12/31/21 03/31/22 $1,000,000 $1,050,000 $1,100,000 $1,150,000 $1,200,000 $1,250,000 $1,300,000 $1,350,000 $— $10,000 $20,000 $30,000 $40,000 $50,000 $60,000 $70,000 $80,000 $90,000 $100,000
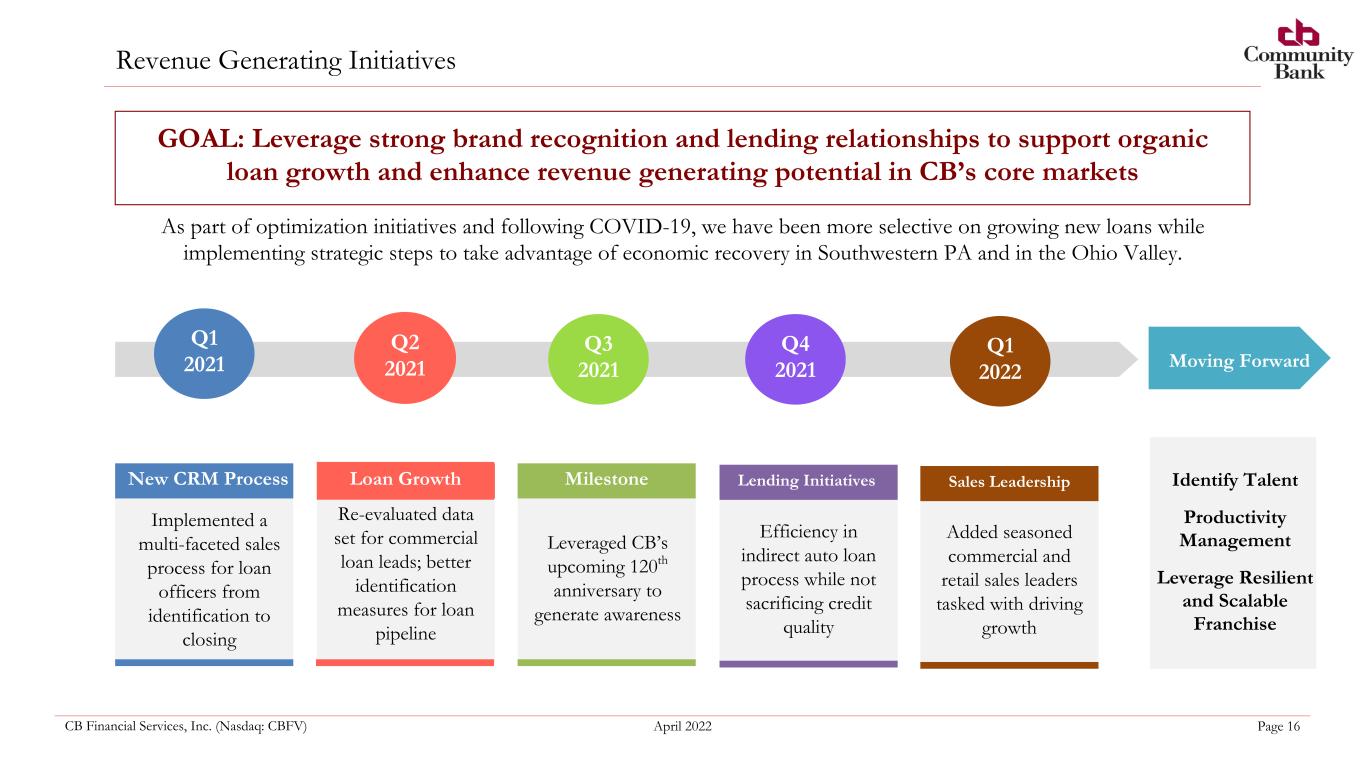
CB Financial Services, Inc. (Nasdaq: CBFV) April 2022 Page 16 Revenue Generating Initiatives GOAL: Leverage strong brand recognition and lending relationships to support organic loan growth and enhance revenue generating potential in CB’s core markets As part of optimization initiatives and following COVID-19, we have been more selective on growing new loans while implementing strategic steps to take advantage of economic recovery in Southwestern PA and in the Ohio Valley. Q1 2021 Q2 2021 Q3 2021 Q4 2021 New CRM Process Implemented a multi-faceted sales process for loan officers from identification to closing Lending Initiatives Efficiency in indirect auto loan process while not sacrificing credit quality Milestone Leveraged CB’s upcoming 120th anniversary to generate awareness Loan Growth Re-evaluated data set for commercial loan leads; better identification measures for loan pipeline Moving Forward Identify Talent Productivity Management Leverage Resilient and Scalable Franchise Q1 2022 Sales Leadership Added seasoned commercial and retail sales leaders tasked with driving growth
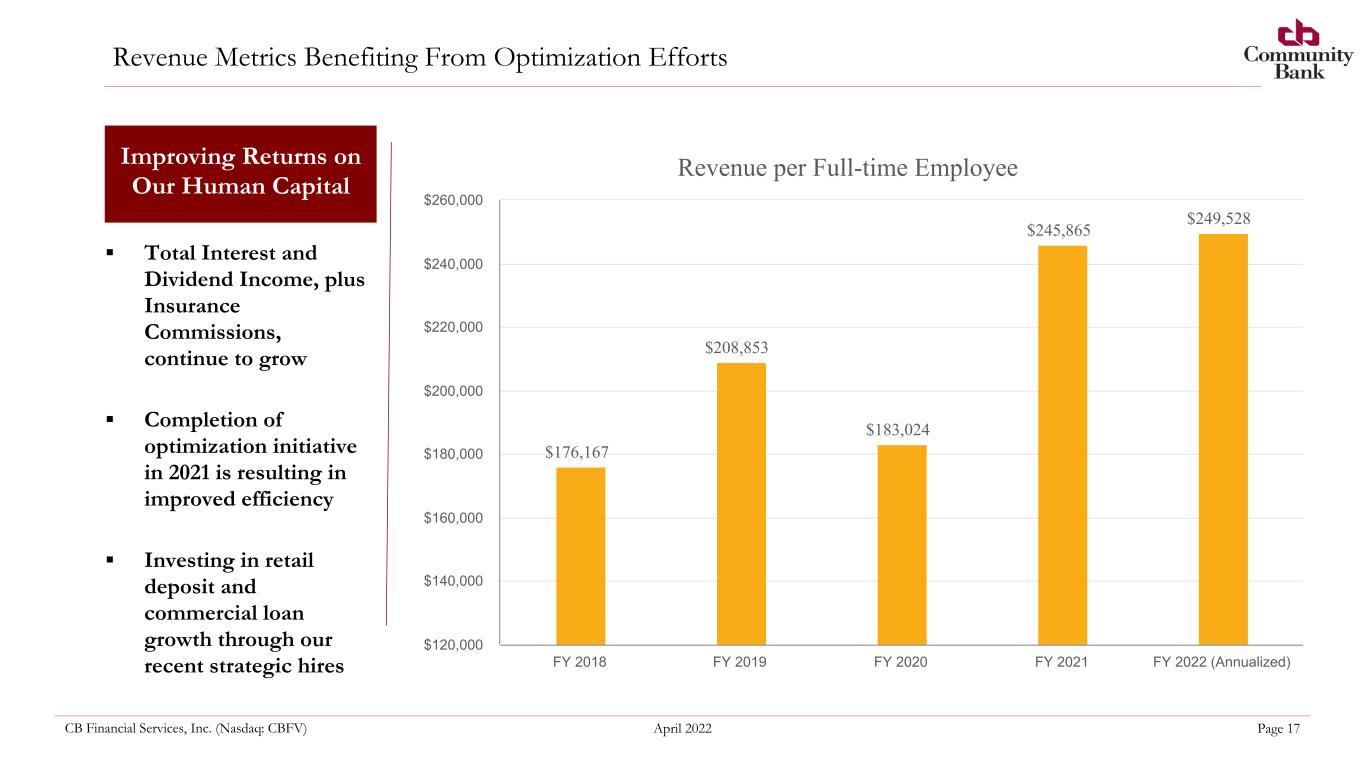
CB Financial Services, Inc. (Nasdaq: CBFV) April 2022 Page 17 Revenue Metrics Benefiting From Optimization Efforts ▪ Total Interest and Dividend Income, plus Insurance Commissions, continue to grow ▪ Completion of optimization initiative in 2021 is resulting in improved efficiency ▪ Investing in retail deposit and commercial loan growth through our recent strategic hires Improving Returns on Our Human Capital Revenue per Full-time Employee $176,167 $208,853 $183,024 $245,865 $249,528 FY 2018 FY 2019 FY 2020 FY 2021 FY 2022 (Annualized) $120,000 $140,000 $160,000 $180,000 $200,000 $220,000 $240,000 $260,000
CB Financial Services, Inc. (Nasdaq: CBFV) April 2022 Page 18 • Empower our experienced, high-quality employees to provide superior customer service in all aspects of our business ◦ Net Promoter Score of 45 vs. a banking industry average of 34 (higher number represents an increasingly satisfied customer base)1 • Create a sales and service culture which builds full relationships with our customers • Utilize technology investments to enhance speed of process while improving customer experience • Enhance profitability and efficiency potential while continuing to invest for future growth • Continue our track record of opportunistic growth in the robust Pittsburgh Metropolitan and across our footprint • Evolve toward more electronic/digital products and processes driving greater efficiency and expand our brand awareness in our market by utilizing digital and other outlets • Leverage our credit culture and strong loan underwriting as a foundation to uphold our asset quality metrics Building on Core Strengths Be the Community Bank of choice across our footprint for residents and small and medium-sized businesses (1) Net promoter score based on 3rd party customer survey results. Banking industry average net promoter score: https://customergauge.com/benchmarks/blog/financial-services-nps-benchmarks

CB Financial Services, Inc. (Nasdaq: CBFV) April 2022 Page 19 Historically Low Rates Creates NIM Pressures on All Banks Disruption by Technology and FinTech Online and Mobile Delivery of Services is Essential Evaluating Market Changes ~ Need to Adapt Changing Consumer Behavior Requirements for Instant Service to Fulfill Expectations (One Click) 0%
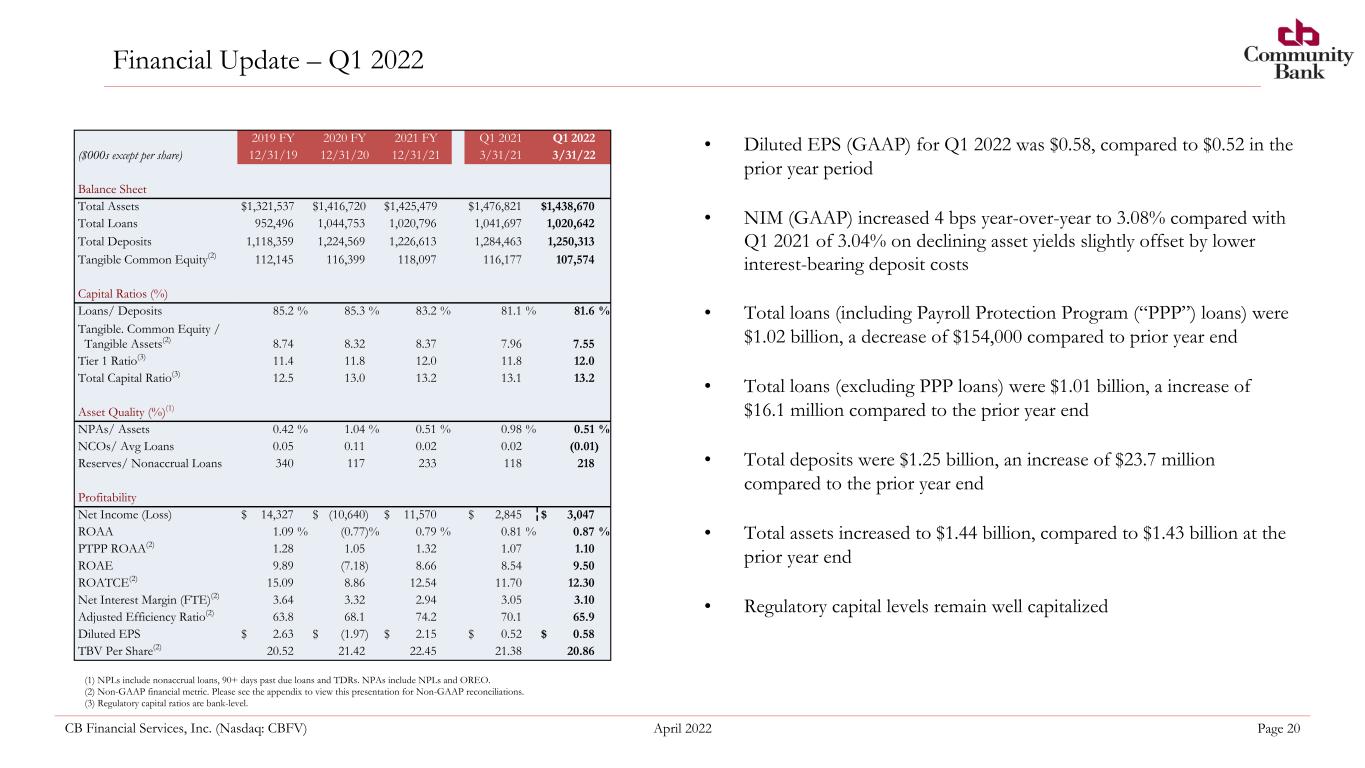
CB Financial Services, Inc. (Nasdaq: CBFV) April 2022 Page 20 Financial Update – Q1 2022 2019 FY 2020 FY 2021 FY Q1 2021 Q1 2022 ($000s except per share) 12/31/19 12/31/20 12/31/21 3/31/21 3/31/22 Balance Sheet Total Assets $ 1,321,537 $ 1,416,720 $ 1,425,479 $ 1,476,821 $ 1,438,670 Total Loans 952,496 1,044,753 1,020,796 1,041,697 1,020,642 Total Deposits 1,118,359 1,224,569 1,226,613 1,284,463 1,250,313 Tangible Common Equity(2) 112,145 116,399 118,097 116,177 107,574 Capital Ratios (%) Loans/ Deposits 85.2 % 85.3 % 83.2 % 81.1 % 81.6 % Tangible. Common Equity / Tangible Assets(2) 8.74 8.32 8.37 7.96 7.55 Tier 1 Ratio(3) 11.4 11.8 12.0 11.8 12.0 Total Capital Ratio(3) 12.5 13.0 13.2 13.1 13.2 Asset Quality (%)(1) NPAs/ Assets 0.42 % 1.04 % 0.51 % 0.98 % 0.51 % NCOs/ Avg Loans 0.05 0.11 0.02 0.02 (0.01) Reserves/ Nonaccrual Loans 340 117 233 118 218 Profitability Net Income (Loss) $ 14,327 $ (10,640) $ 11,570 $ 2,845 $ 3,047 ROAA 1.09 % (0.77) % 0.79 % 0.81 % 0.87 % PTPP ROAA(2) 1.28 1.05 1.32 1.07 1.10 ROAE 9.89 (7.18) 8.66 8.54 9.50 ROATCE(2) 15.09 8.86 12.54 11.70 12.30 Net Interest Margin (FTE)(2) 3.64 3.32 2.94 3.05 3.10 Adjusted Efficiency Ratio(2) 63.8 68.1 74.2 70.1 65.9 Diluted EPS $ 2.63 $ (1.97) $ 2.15 $ 0.52 $ 0.58 TBV Per Share(2) 20.52 21.42 22.45 21.38 20.86 • Diluted EPS (GAAP) for Q1 2022 was $0.58, compared to $0.52 in the prior year period • NIM (GAAP) increased 4 bps year-over-year to 3.08% compared with Q1 2021 of 3.04% on declining asset yields slightly offset by lower interest-bearing deposit costs • Total loans (including Payroll Protection Program (“PPP”) loans) were $1.02 billion, a decrease of $154,000 compared to prior year end • Total loans (excluding PPP loans) were $1.01 billion, a increase of $16.1 million compared to the prior year end • Total deposits were $1.25 billion, an increase of $23.7 million compared to the prior year end • Total assets increased to $1.44 billion, compared to $1.43 billion at the prior year end • Regulatory capital levels remain well capitalized (1) NPLs include nonaccrual loans, 90+ days past due loans and TDRs. NPAs include NPLs and OREO. (2) Non-GAAP financial metric. Please see the appendix to view this presentation for Non-GAAP reconciliations. (3) Regulatory capital ratios are bank-level.

Key Financial Metrics
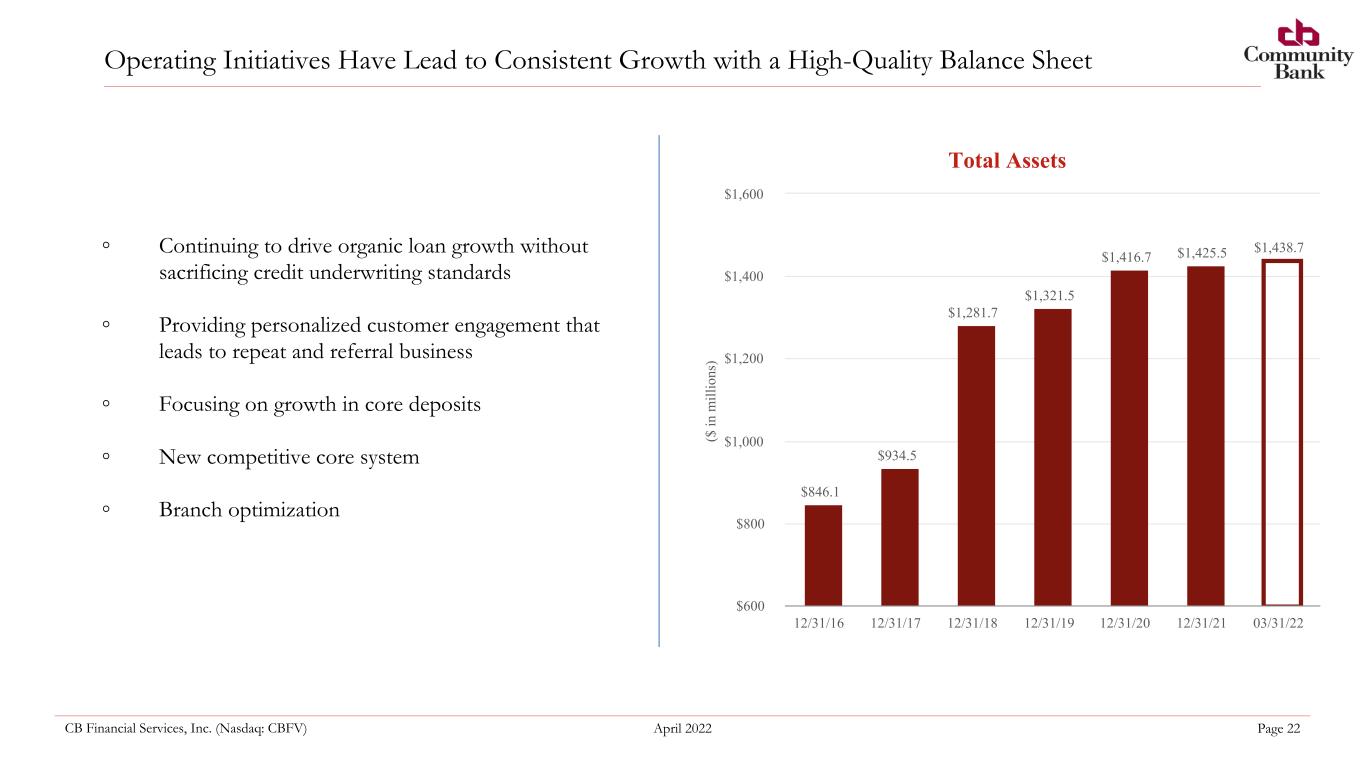
CB Financial Services, Inc. (Nasdaq: CBFV) April 2022 Page 22 ◦ Continuing to drive organic loan growth without sacrificing credit underwriting standards ◦ Providing personalized customer engagement that leads to repeat and referral business ◦ Focusing on growth in core deposits ◦ New competitive core system ◦ Branch optimization Operating Initiatives Have Lead to Consistent Growth with a High-Quality Balance Sheet ($ in m ill io ns ) Total Assets $846.1 $934.5 $1,281.7 $1,321.5 $1,416.7 $1,425.5 $1,438.7 12/31/16 12/31/17 12/31/18 12/31/19 12/31/20 12/31/21 03/31/22 $600 $800 $1,000 $1,200 $1,400 $1,600

CB Financial Services, Inc. (Nasdaq: CBFV) April 2022 Page 23 Expertise in Commercial Real Estate Commercial & Industrial 6.6% Real Estate- Construction 5.3% Real Estate- Commercial 41.9% Real Estate- Residential 31.1% Consumer 14.1% Other 1.0% Loan Growth Trend and CRE Loan Composition (as of March 31, 2022) ($ in m ill io ns ) Total Loans $683.4 $681.9 $912.9 $952.8 $1,044.8 $1,020.8 $1,020.6 12/31/16 12/31/17 12/31/18 12/31/19 12/31/20 12/31/21 03/31/22 $500.0 $600.0 $700.0 $800.0 $900.0 $1,000.0 $1,100.0
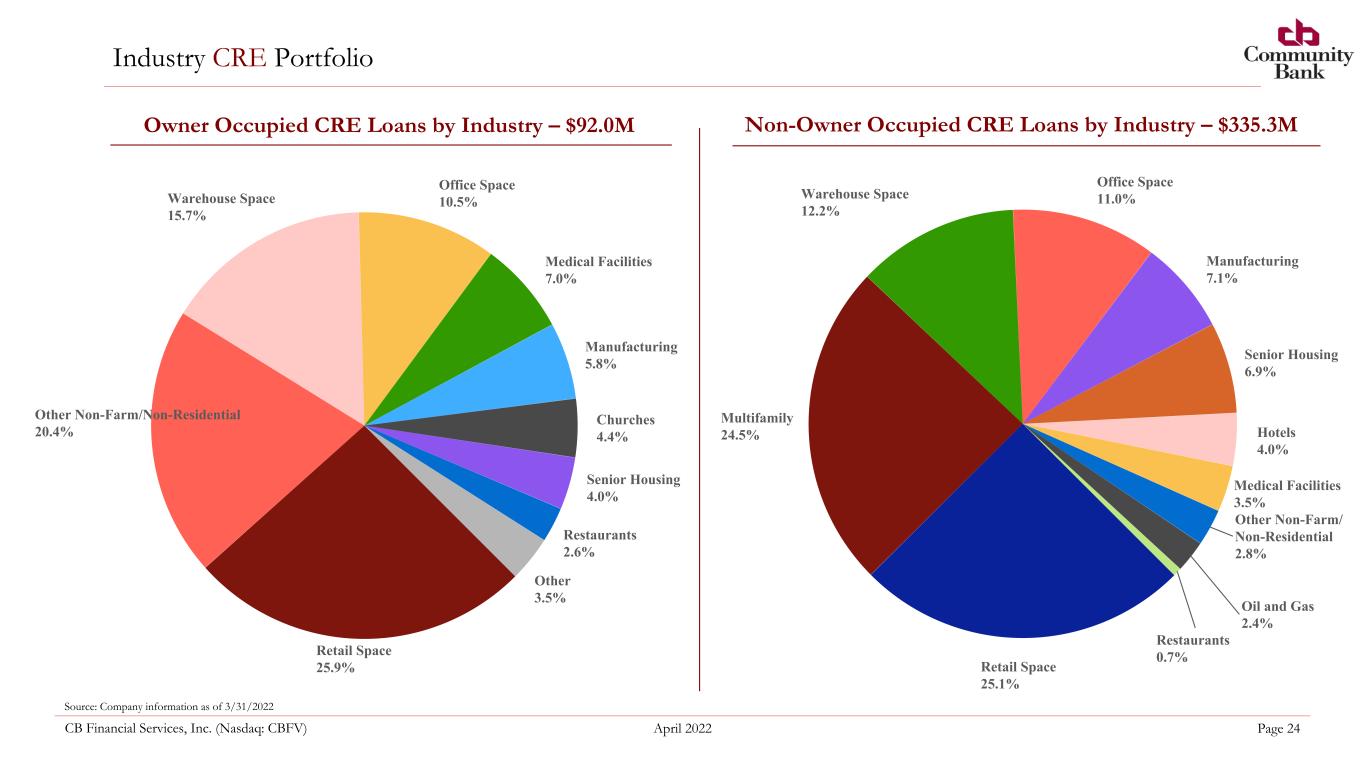
CB Financial Services, Inc. (Nasdaq: CBFV) April 2022 Page 24 Industry CRE Portfolio Owner Occupied CRE Loans by Industry – $92.0M Non-Owner Occupied CRE Loans by Industry – $335.3M Source: Company information as of 3/31/2022 Retail Space 25.9% Other Non-Farm/Non-Residential 20.4% Warehouse Space 15.7% Office Space 10.5% Medical Facilities 7.0% Manufacturing 5.8% Churches 4.4% Senior Housing 4.0% Restaurants 2.6% Other 3.5% Retail Space 25.1% Multifamily 24.5% Warehouse Space 12.2% Office Space 11.0% Manufacturing 7.1% Senior Housing 6.9% Hotels 4.0% Medical Facilities 3.5% Other Non-Farm/ Non-Residential 2.8% Oil and Gas 2.4% Restaurants 0.7%
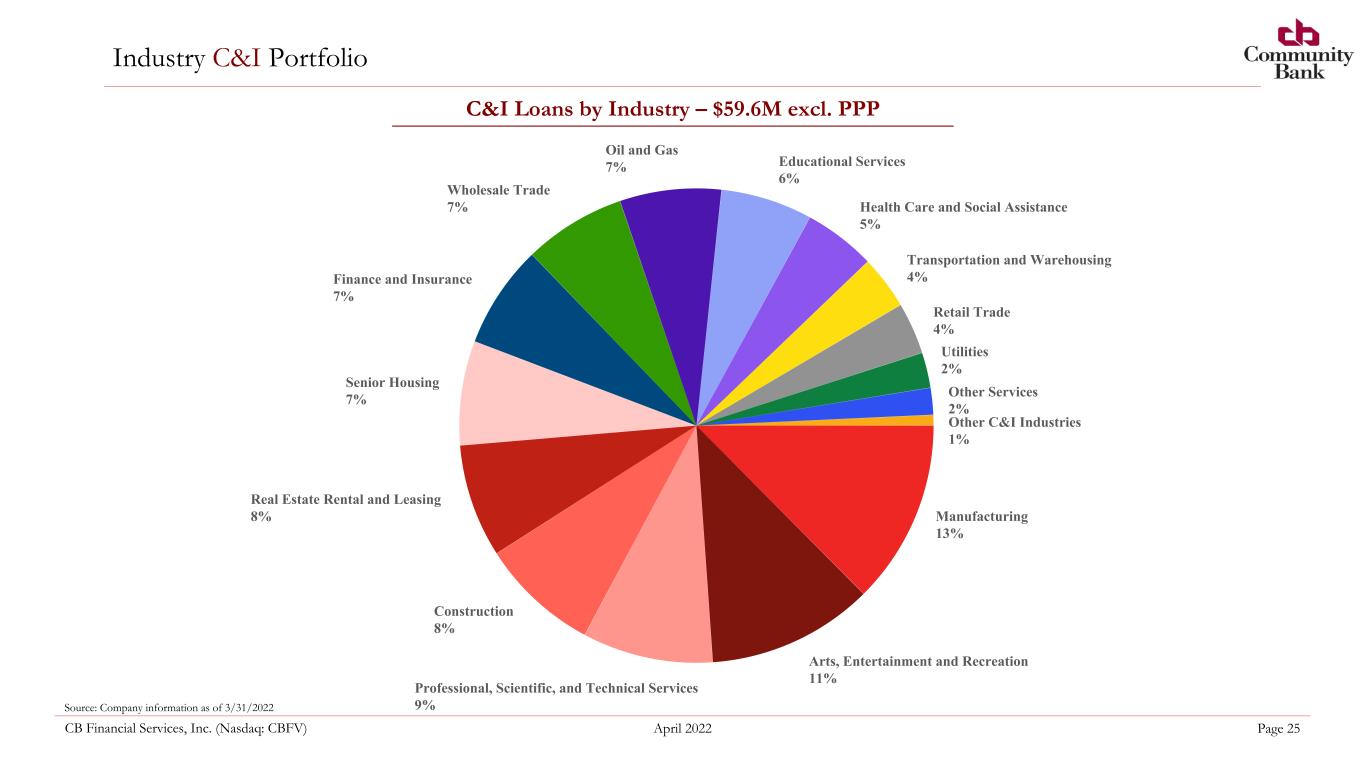
CB Financial Services, Inc. (Nasdaq: CBFV) April 2022 Page 25 Industry C&I Portfolio C&I Loans by Industry – $59.6M excl. PPP Source: Company information as of 3/31/2022 Manufacturing 13% Arts, Entertainment and Recreation 11% Professional, Scientific, and Technical Services 9% Construction 8% Real Estate Rental and Leasing 8% Senior Housing 7% Finance and Insurance 7% Wholesale Trade 7% Oil and Gas 7% Educational Services 6% Health Care and Social Assistance 5% Transportation and Warehousing 4% Retail Trade 4% Utilities 2% Other Services 2% Other C&I Industries 1%
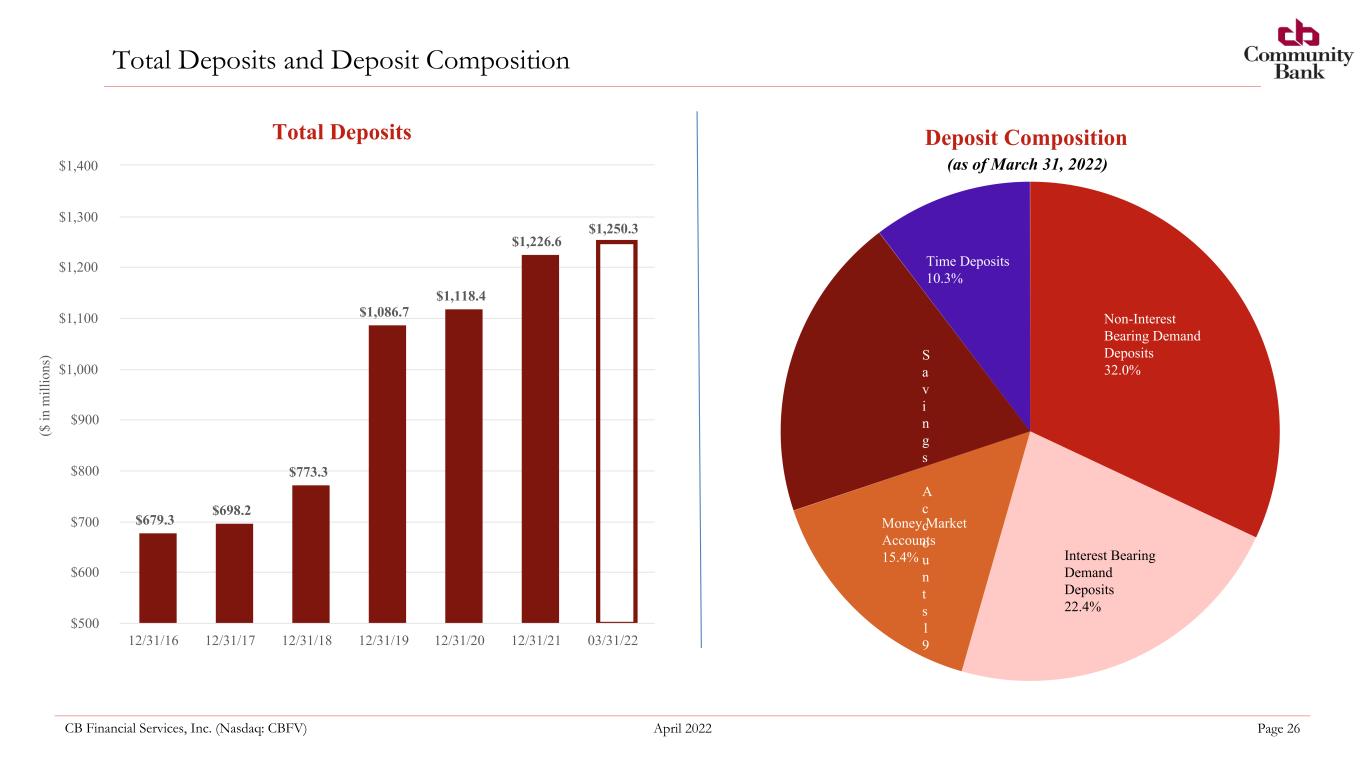
CB Financial Services, Inc. (Nasdaq: CBFV) April 2022 Page 26 Total Deposits and Deposit Composition (as of March 31, 2022) ($ in m ill io ns ) Total Deposits $679.3 $698.2 $773.3 $1,086.7 $1,118.4 $1,226.6 $1,250.3 12/31/16 12/31/17 12/31/18 12/31/19 12/31/20 12/31/21 03/31/22 $500 $600 $700 $800 $900 $1,000 $1,100 $1,200 $1,300 $1,400 Deposit Composition Non-Interest Bearing Demand Deposits 32.0% Interest Bearing Demand Deposits 22.4% Money Market Accounts 15.4% S a v i n g s A c c o u n t s 1 9 . 8 % Time Deposits 10.3%
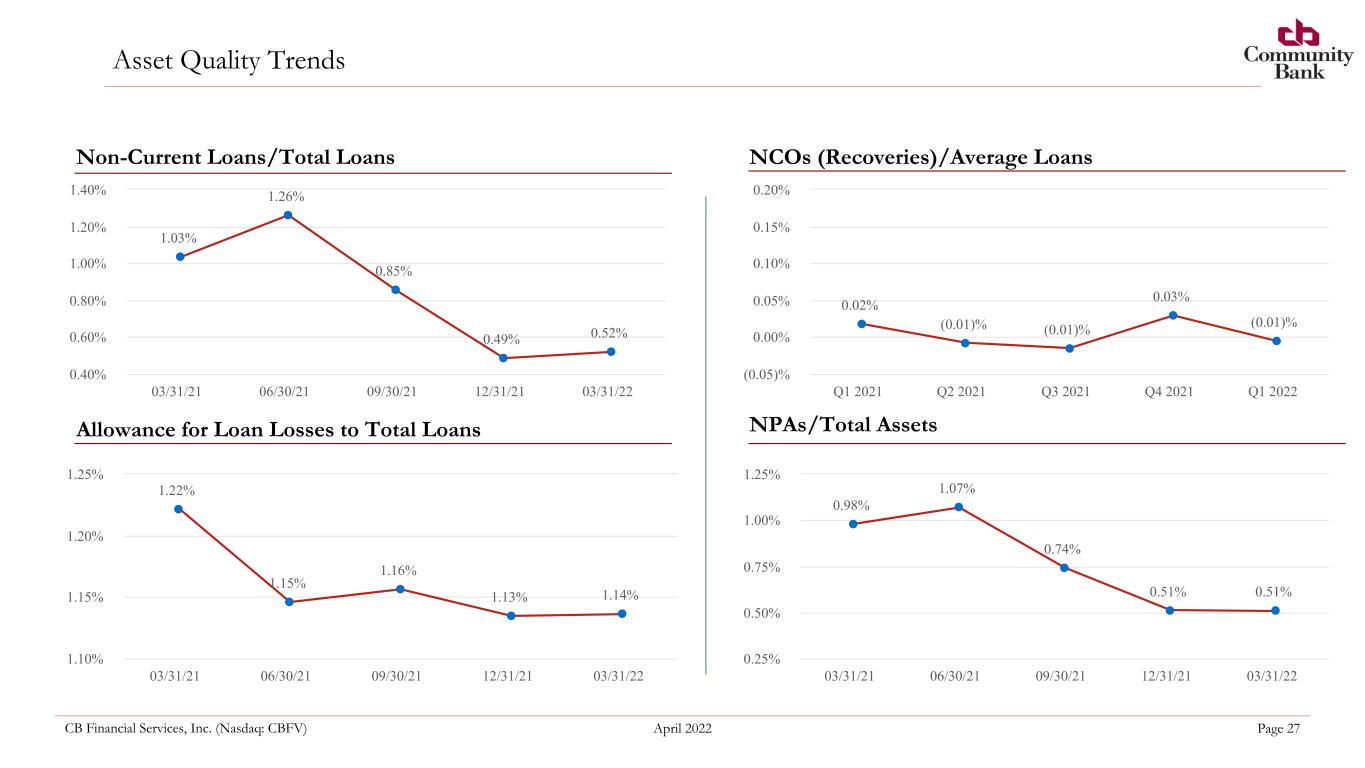
CB Financial Services, Inc. (Nasdaq: CBFV) April 2022 Page 27 Asset Quality Trends NCOs (Recoveries)/Average LoansNon-Current Loans/Total Loans Allowance for Loan Losses to Total Loans NPAs/Total Assets 1.03% 1.26% 0.85% 0.49% 0.52% 03/31/21 06/30/21 09/30/21 12/31/21 03/31/22 0.40% 0.60% 0.80% 1.00% 1.20% 1.40% 0.02% (0.01)% (0.01)% 0.03% (0.01)% Q1 2021 Q2 2021 Q3 2021 Q4 2021 Q1 2022 (0.05)% 0.00% 0.05% 0.10% 0.15% 0.20% 1.22% 1.15% 1.16% 1.13% 1.14% 03/31/21 06/30/21 09/30/21 12/31/21 03/31/22 1.10% 1.15% 1.20% 1.25% 0.98% 1.07% 0.74% 0.51% 0.51% 03/31/21 06/30/21 09/30/21 12/31/21 03/31/22 0.25% 0.50% 0.75% 1.00% 1.25%
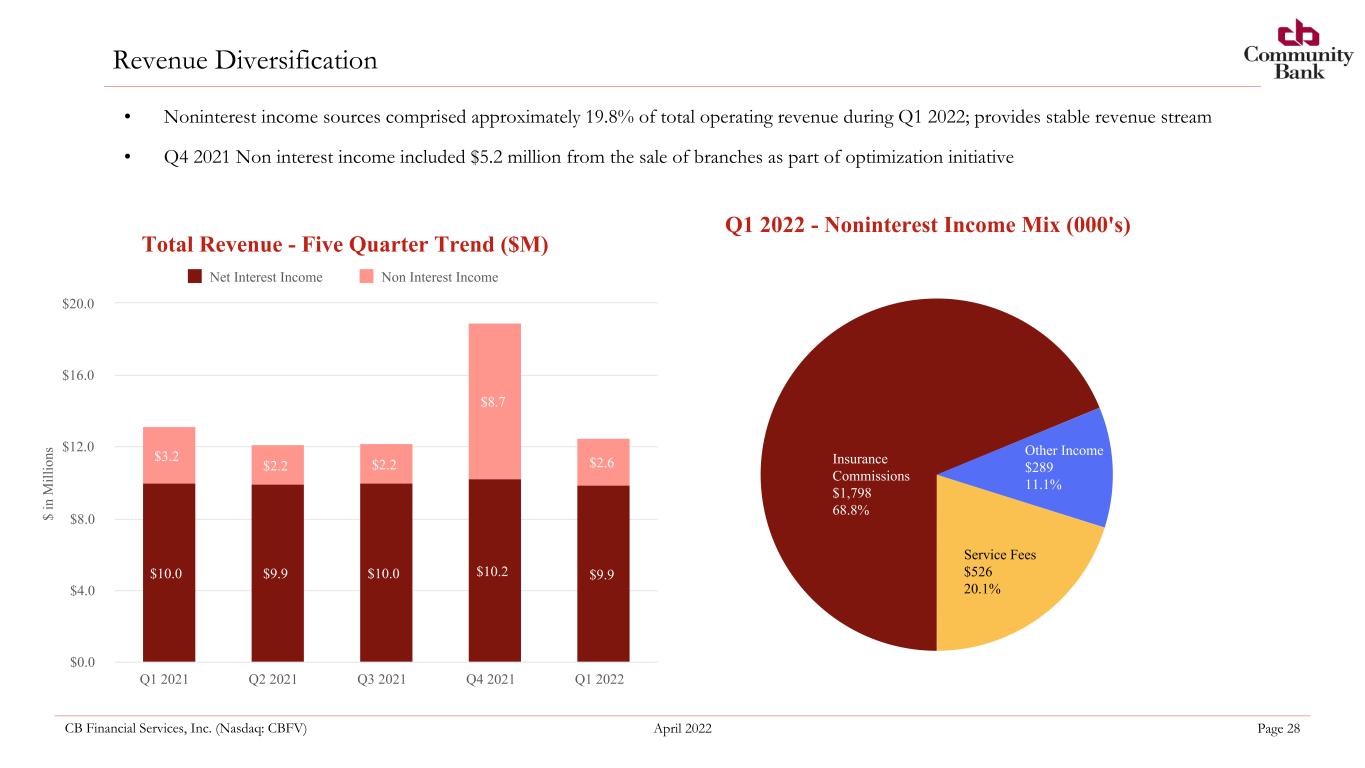
CB Financial Services, Inc. (Nasdaq: CBFV) April 2022 Page 28 Revenue Diversification • Noninterest income sources comprised approximately 19.8% of total operating revenue during Q1 2022; provides stable revenue stream • Q4 2021 Non interest income included $5.2 million from the sale of branches as part of optimization initiative $ in M ill io ns Total Revenue - Five Quarter Trend ($M) $10.0 $9.9 $10.0 $10.2 $9.9 $3.2 $2.2 $2.2 $8.7 $2.6 Net Interest Income Non Interest Income Q1 2021 Q2 2021 Q3 2021 Q4 2021 Q1 2022 $0.0 $4.0 $8.0 $12.0 $16.0 $20.0 Q1 2022 - Noninterest Income Mix (000's) Insurance Commissions $1,798 68.8% Other Income $289 11.1% Service Fees $526 20.1%
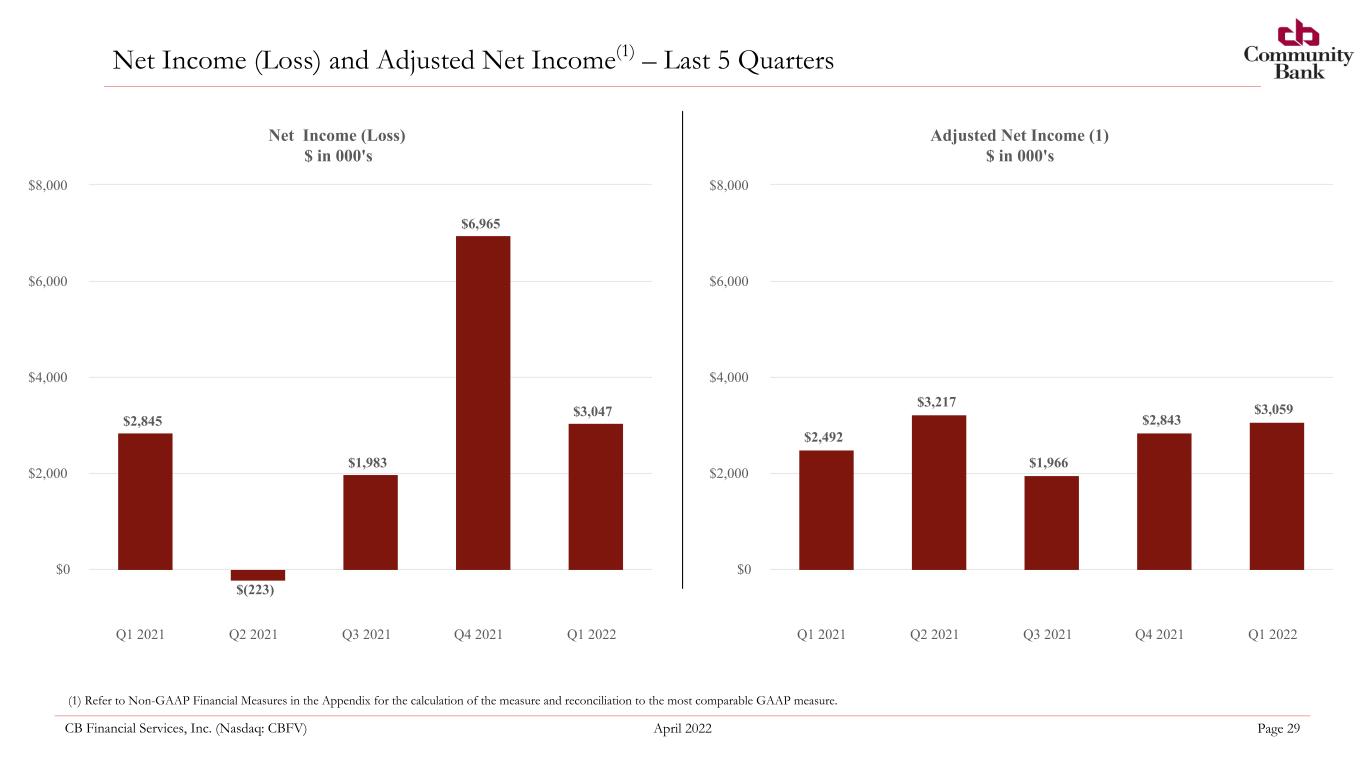
CB Financial Services, Inc. (Nasdaq: CBFV) April 2022 Page 29 Net Income (Loss) and Adjusted Net Income(1) – Last 5 Quarters (1) Refer to Non-GAAP Financial Measures in the Appendix for the calculation of the measure and reconciliation to the most comparable GAAP measure. Net Income (Loss) $ in 000's $2,845 $1,983 $6,965 $3,047 $(223) Q1 2021 Q2 2021 Q3 2021 Q4 2021 Q1 2022 $0 $2,000 $4,000 $6,000 $8,000 Adjusted Net Income (1) $ in 000's $2,492 $3,217 $1,966 $2,843 $3,059 Q1 2021 Q2 2021 Q3 2021 Q4 2021 Q1 2022 $0 $2,000 $4,000 $6,000 $8,000

CB Financial Services, Inc. (Nasdaq: CBFV) April 2022 Page 30 EPS - Diluted and Adjusted EPS - Diluted(1) – Last 5 Quarters (1) Refer to Non-GAAP Financial Measures in the Appendix for the calculation of the measure and reconciliation to the most comparable GAAP measure. EPS - Diluted 0.52 (0.04) 0.37 1.31 0.58 Q1 2021 Q2 2021 Q3 2021 Q4 2021 Q1 2022 (0.25) 0.00 0.25 0.50 0.75 1.00 1.25 1.50 Adjusted EPS - Diluted 0.46 0.59 0.36 0.53 0.59 Q1 2021 Q2 2021 Q3 2021 Q4 2021 Q1 2022 (0.25) 0.00 0.25 0.50 0.75 1.00 1.25 1.50 (1)
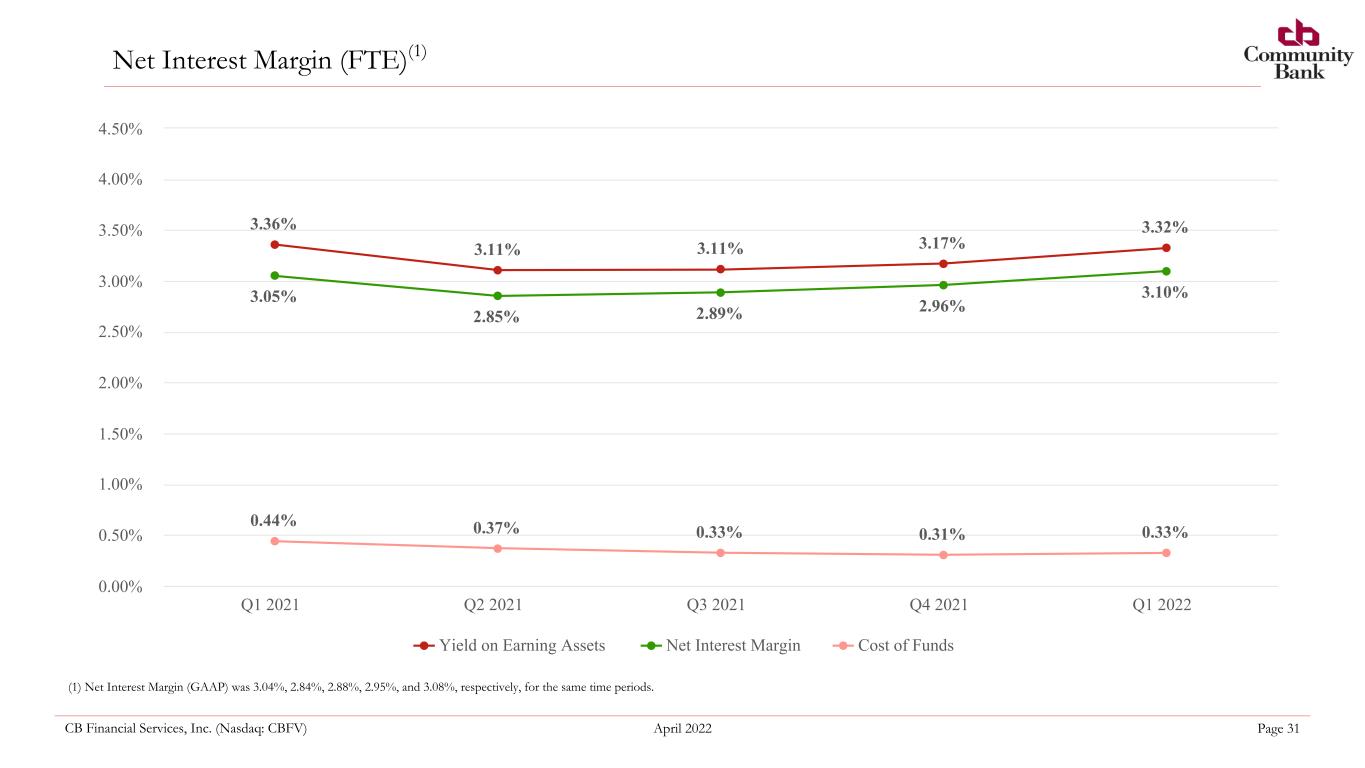
CB Financial Services, Inc. (Nasdaq: CBFV) April 2022 Page 31 Net Interest Margin (FTE)(1) (1) Net Interest Margin (GAAP) was 3.04%, 2.84%, 2.88%, 2.95%, and 3.08%, respectively, for the same time periods. 3.36% 3.11% 3.11% 3.17% 3.32% 3.05% 2.85% 2.89% 2.96% 3.10% 0.44% 0.37% 0.33% 0.31% 0.33% Yield on Earning Assets Net Interest Margin Cost of Funds Q1 2021 Q2 2021 Q3 2021 Q4 2021 Q1 2022 0.00% 0.50% 1.00% 1.50% 2.00% 2.50% 3.00% 3.50% 4.00% 4.50%
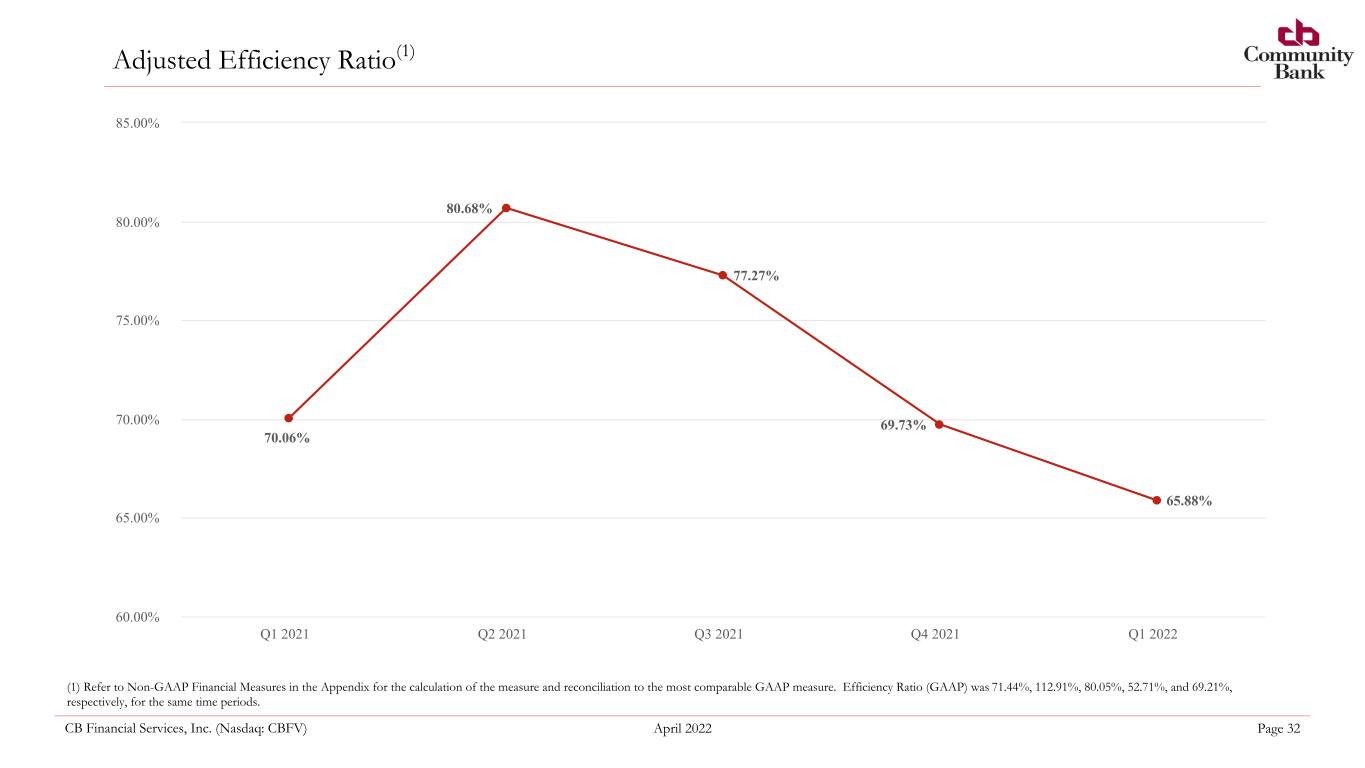
CB Financial Services, Inc. (Nasdaq: CBFV) April 2022 Page 32 Adjusted Efficiency Ratio(1) (1) Refer to Non-GAAP Financial Measures in the Appendix for the calculation of the measure and reconciliation to the most comparable GAAP measure. Efficiency Ratio (GAAP) was 71.44%, 112.91%, 80.05%, 52.71%, and 69.21%, respectively, for the same time periods. 70.06% 80.68% 77.27% 69.73% 65.88% Q1 2021 Q2 2021 Q3 2021 Q4 2021 Q1 2022 60.00% 65.00% 70.00% 75.00% 80.00% 85.00%
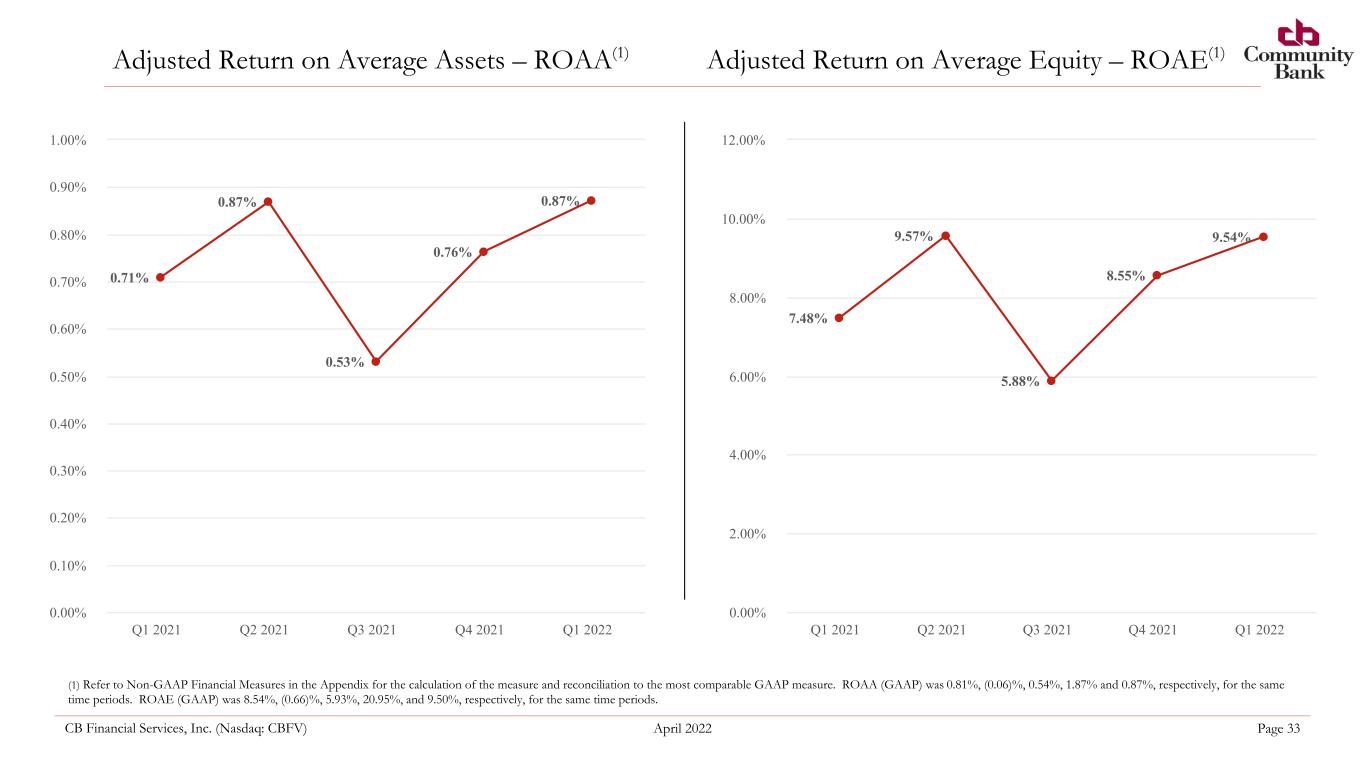
CB Financial Services, Inc. (Nasdaq: CBFV) April 2022 Page 33 Adjusted Return on Average Assets – ROAA(1) Adjusted Return on Average Equity – ROAE(1) (1) Refer to Non-GAAP Financial Measures in the Appendix for the calculation of the measure and reconciliation to the most comparable GAAP measure. ROAA (GAAP) was 0.81%, (0.06)%, 0.54%, 1.87% and 0.87%, respectively, for the same time periods. ROAE (GAAP) was 8.54%, (0.66)%, 5.93%, 20.95%, and 9.50%, respectively, for the same time periods. 0.71% 0.87% 0.53% 0.76% 0.87% Q1 2021 Q2 2021 Q3 2021 Q4 2021 Q1 2022 0.00% 0.10% 0.20% 0.30% 0.40% 0.50% 0.60% 0.70% 0.80% 0.90% 1.00% 7.48% 9.57% 5.88% 8.55% 9.54% Q1 2021 Q2 2021 Q3 2021 Q4 2021 Q1 2022 0.00% 2.00% 4.00% 6.00% 8.00% 10.00% 12.00%
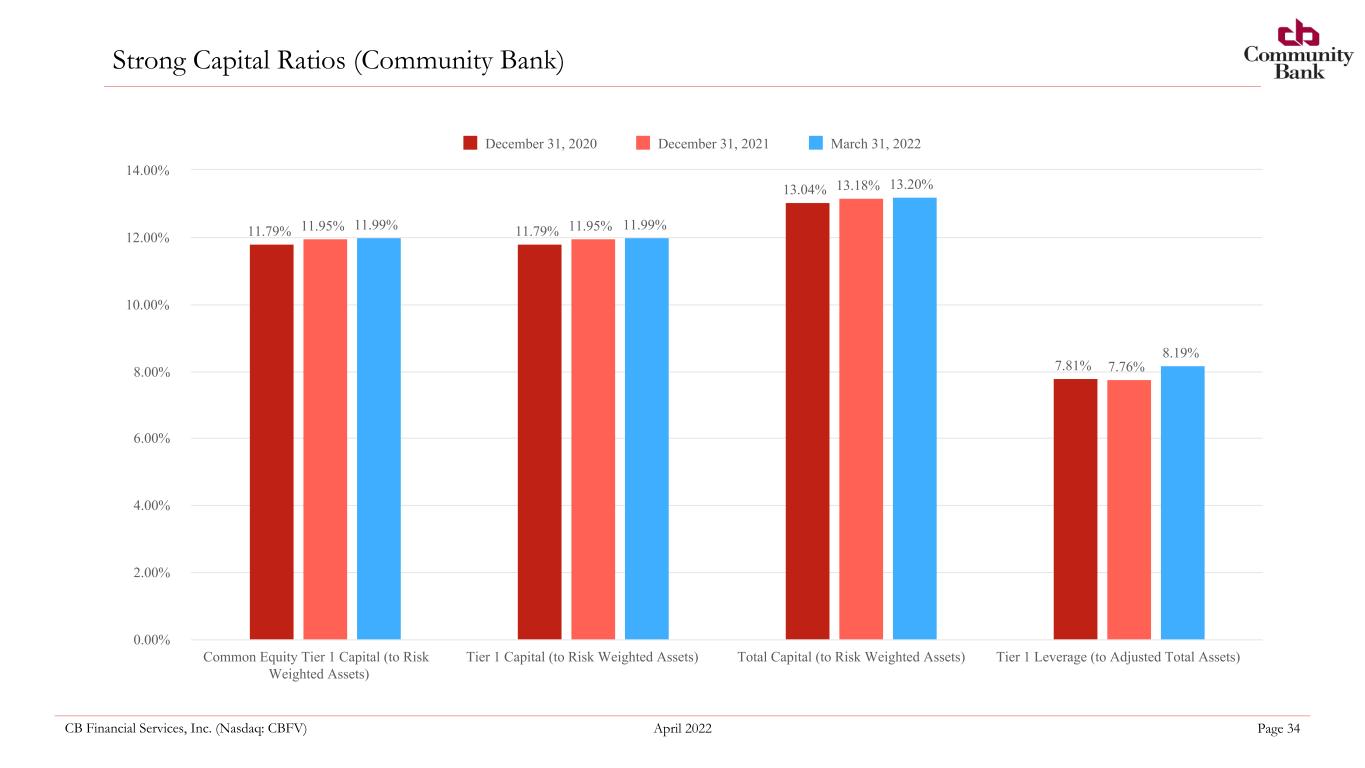
CB Financial Services, Inc. (Nasdaq: CBFV) April 2022 Page 34 Strong Capital Ratios (Community Bank) 11.79% 11.79% 13.04% 7.81% 11.95% 11.95% 13.18% 7.76% 11.99% 11.99% 13.20% 8.19% December 31, 2020 December 31, 2021 March 31, 2022 Common Equity Tier 1 Capital (to Risk Weighted Assets) Tier 1 Capital (to Risk Weighted Assets) Total Capital (to Risk Weighted Assets) Tier 1 Leverage (to Adjusted Total Assets) 0.00% 2.00% 4.00% 6.00% 8.00% 10.00% 12.00% 14.00%

CB Financial Services, Inc. (Nasdaq: CBFV) April 2022 Page 35 Interest Rate Risk Sensitivity Estimated % Change in Net Interest Income Over: 0 – 12 Months (1) 13 – 24 Months (2) Change in Interest Rates Actual Actual Up 400 bps 13.81% 19.51% Up 300 bps 11.23% 15.46% Up 200 bps 7.99% 10.86% Up 100 bps 2.93% 4.41% Down 100 bps (5.52)% (7.61)% Source: Company information as of 3/31/22. (1) Assumes a parallel shift in the yield curve over 12 months, with no change thereafter. (2) Assumes a parallel shift in the yield curve over 24 months, with no change thereafter. • The sensitivity is measured as a percentage change in net interest income given the stated changes in interest rates compared to net interest income with rates unchanged in the same period
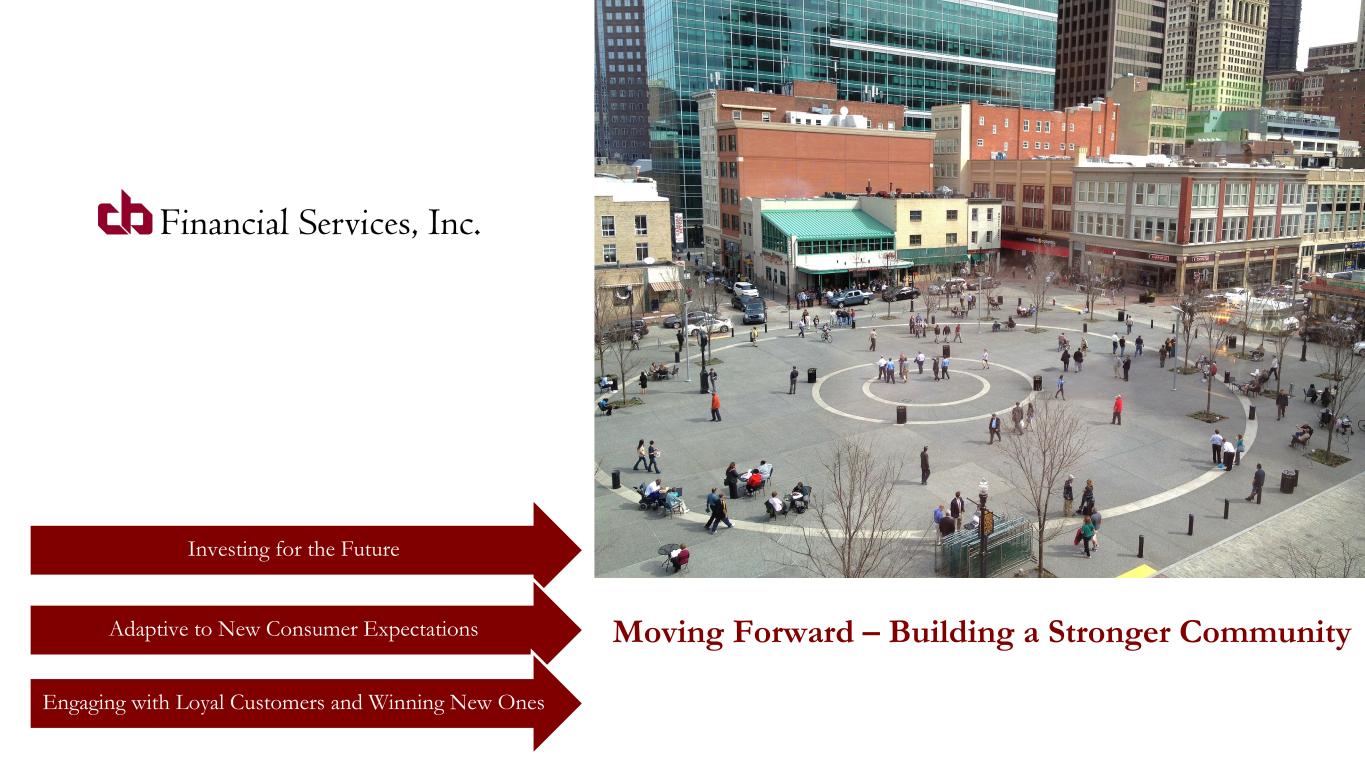
Moving Forward – Building a Stronger Community Investing for the Future Adaptive to New Consumer Expectations Engaging with Loyal Customers and Winning New Ones

CB Financial Services, Inc. (Nasdaq: CBFV) April 2022 Page 37 Contact Information Company Contact: John H. Montgomery President and Chief Executive Officer Phone: (724) 225-2400 Investor Relations Jeremy Hellman, CFA Phone: (212) 836-9626 Email: jhellman@equityny.com NASDAQ Global Market: CBFV 100 N. Market Street Carmichaels, PA 15320 Phone: 724-966-5041 Fax: 724-966-7867

Appendix
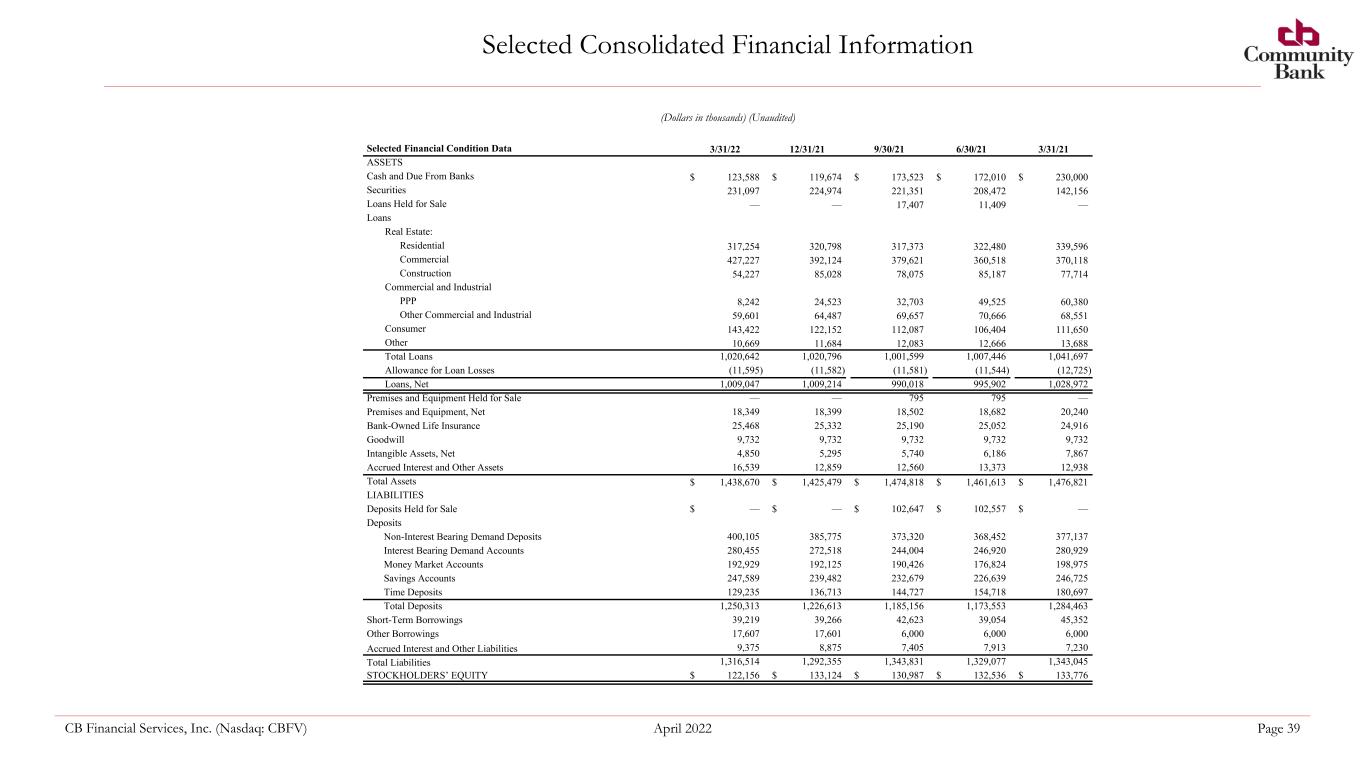
CB Financial Services, Inc. (Nasdaq: CBFV) April 2022 Page 39 Selected Consolidated Financial Information (Dollars in thousands) (Unaudited) Selected Financial Condition Data 3/31/22 12/31/21 9/30/21 6/30/21 3/31/21 ASSETS Cash and Due From Banks $ 123,588 $ 119,674 $ 173,523 $ 172,010 $ 230,000 Securities 231,097 224,974 221,351 208,472 142,156 Loans Held for Sale — — 17,407 11,409 — Loans Real Estate: Residential 317,254 320,798 317,373 322,480 339,596 Commercial 427,227 392,124 379,621 360,518 370,118 Construction 54,227 85,028 78,075 85,187 77,714 Commercial and Industrial PPP 8,242 24,523 32,703 49,525 60,380 Other Commercial and Industrial 59,601 64,487 69,657 70,666 68,551 Consumer 143,422 122,152 112,087 106,404 111,650 Other 10,669 11,684 12,083 12,666 13,688 Total Loans 1,020,642 1,020,796 1,001,599 1,007,446 1,041,697 Allowance for Loan Losses (11,595) (11,582) (11,581) (11,544) (12,725) Loans, Net 1,009,047 1,009,214 990,018 995,902 1,028,972 Premises and Equipment Held for Sale — — 795 795 — Premises and Equipment, Net 18,349 18,399 18,502 18,682 20,240 Bank-Owned Life Insurance 25,468 25,332 25,190 25,052 24,916 Goodwill 9,732 9,732 9,732 9,732 9,732 Intangible Assets, Net 4,850 5,295 5,740 6,186 7,867 Accrued Interest and Other Assets 16,539 12,859 12,560 13,373 12,938 Total Assets $ 1,438,670 $ 1,425,479 $ 1,474,818 $ 1,461,613 $ 1,476,821 LIABILITIES Deposits Held for Sale $ — $ — $ 102,647 $ 102,557 $ — Deposits Non-Interest Bearing Demand Deposits 400,105 385,775 373,320 368,452 377,137 Interest Bearing Demand Accounts 280,455 272,518 244,004 246,920 280,929 Money Market Accounts 192,929 192,125 190,426 176,824 198,975 Savings Accounts 247,589 239,482 232,679 226,639 246,725 Time Deposits 129,235 136,713 144,727 154,718 180,697 Total Deposits 1,250,313 1,226,613 1,185,156 1,173,553 1,284,463 Short-Term Borrowings 39,219 39,266 42,623 39,054 45,352 Other Borrowings 17,607 17,601 6,000 6,000 6,000 Accrued Interest and Other Liabilities 9,375 8,875 7,405 7,913 7,230 Total Liabilities 1,316,514 1,292,355 1,343,831 1,329,077 1,343,045 STOCKHOLDERS’ EQUITY $ 122,156 $ 133,124 $ 130,987 $ 132,536 $ 133,776
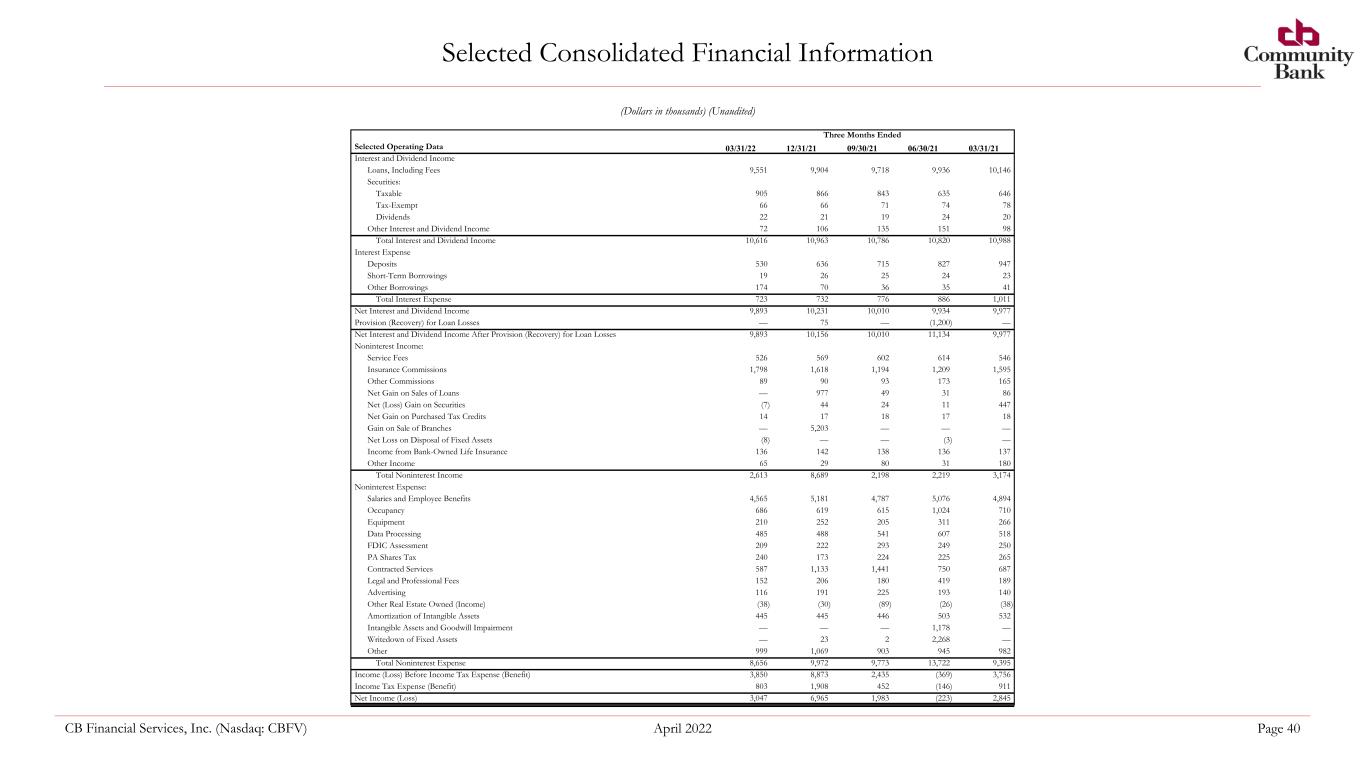
CB Financial Services, Inc. (Nasdaq: CBFV) April 2022 Page 40 Selected Consolidated Financial Information Three Months Ended Selected Operating Data 03/31/22 12/31/21 09/30/21 06/30/21 03/31/21 Interest and Dividend Income Loans, Including Fees 9,551 9,904 9,718 9,936 10,146 Securities: Taxable 905 866 843 635 646 Tax-Exempt 66 66 71 74 78 Dividends 22 21 19 24 20 Other Interest and Dividend Income 72 106 135 151 98 Total Interest and Dividend Income 10,616 10,963 10,786 10,820 10,988 Interest Expense Deposits 530 636 715 827 947 Short-Term Borrowings 19 26 25 24 23 Other Borrowings 174 70 36 35 41 Total Interest Expense 723 732 776 886 1,011 Net Interest and Dividend Income 9,893 10,231 10,010 9,934 9,977 Provision (Recovery) for Loan Losses — 75 — (1,200) — Net Interest and Dividend Income After Provision (Recovery) for Loan Losses 9,893 10,156 10,010 11,134 9,977 Noninterest Income: Service Fees 526 569 602 614 546 Insurance Commissions 1,798 1,618 1,194 1,209 1,595 Other Commissions 89 90 93 173 165 Net Gain on Sales of Loans — 977 49 31 86 Net (Loss) Gain on Securities (7) 44 24 11 447 Net Gain on Purchased Tax Credits 14 17 18 17 18 Gain on Sale of Branches — 5,203 — — — Net Loss on Disposal of Fixed Assets (8) — — (3) — Income from Bank-Owned Life Insurance 136 142 138 136 137 Other Income 65 29 80 31 180 Total Noninterest Income 2,613 8,689 2,198 2,219 3,174 Noninterest Expense: Salaries and Employee Benefits 4,565 5,181 4,787 5,076 4,894 Occupancy 686 619 615 1,024 710 Equipment 210 252 205 311 266 Data Processing 485 488 541 607 518 FDIC Assessment 209 222 293 249 250 PA Shares Tax 240 173 224 225 265 Contracted Services 587 1,133 1,441 750 687 Legal and Professional Fees 152 206 180 419 189 Advertising 116 191 225 193 140 Other Real Estate Owned (Income) (38) (30) (89) (26) (38) Amortization of Intangible Assets 445 445 446 503 532 Intangible Assets and Goodwill Impairment — — — 1,178 — Writedown of Fixed Assets — 23 2 2,268 — Other 999 1,069 903 945 982 Total Noninterest Expense 8,656 9,972 9,773 13,722 9,395 Income (Loss) Before Income Tax Expense (Benefit) 3,850 8,873 2,435 (369) 3,756 Income Tax Expense (Benefit) 803 1,908 452 (146) 911 Net Income (Loss) 3,047 6,965 1,983 (223) 2,845 (Dollars in thousands) (Unaudited)
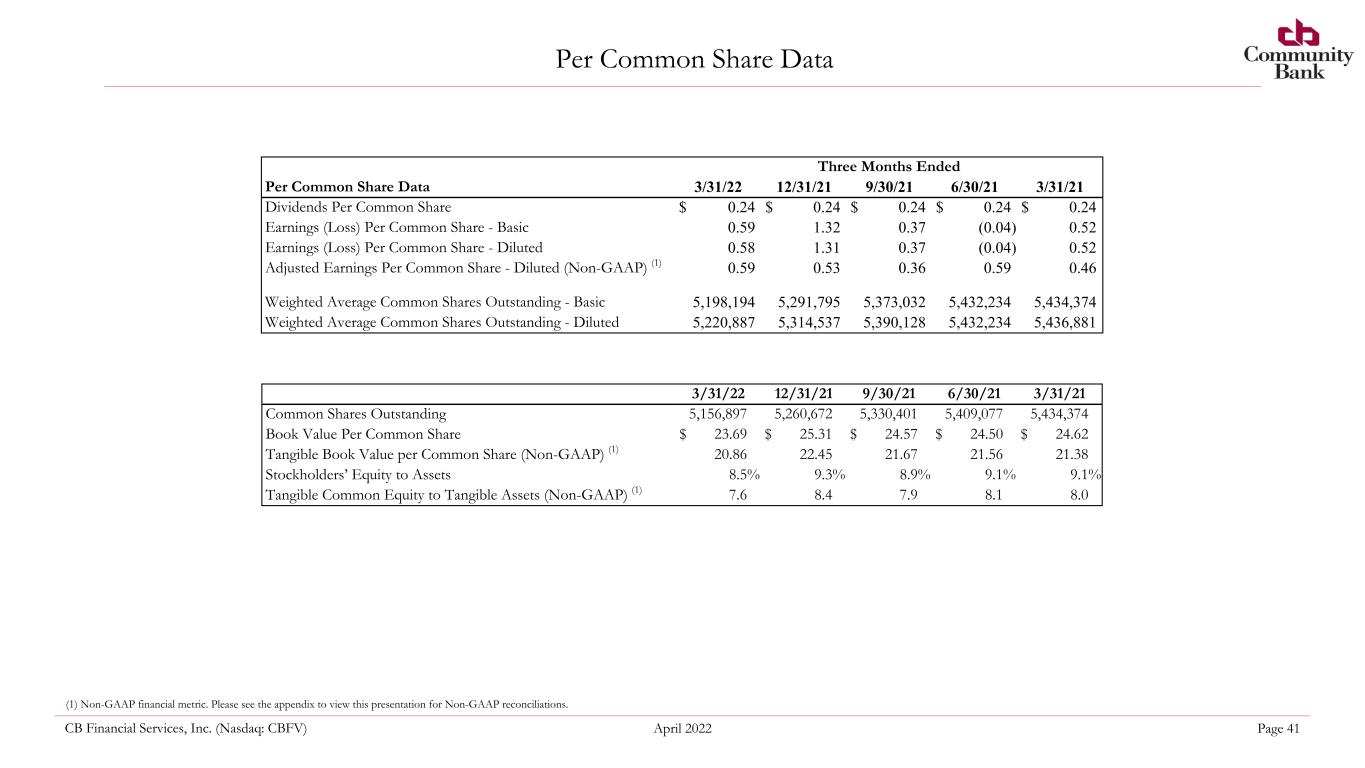
CB Financial Services, Inc. (Nasdaq: CBFV) April 2022 Page 41 Per Common Share Data (1) Non-GAAP financial metric. Please see the appendix to view this presentation for Non-GAAP reconciliations. Three Months Ended Per Common Share Data 3/31/22 12/31/21 9/30/21 6/30/21 3/31/21 Dividends Per Common Share $ 0.24 $ 0.24 $ 0.24 $ 0.24 $ 0.24 Earnings (Loss) Per Common Share - Basic 0.59 1.32 0.37 (0.04) 0.52 Earnings (Loss) Per Common Share - Diluted 0.58 1.31 0.37 (0.04) 0.52 Adjusted Earnings Per Common Share - Diluted (Non-GAAP) (1) 0.59 0.53 0.36 0.59 0.46 Weighted Average Common Shares Outstanding - Basic 5,198,194 5,291,795 5,373,032 5,432,234 5,434,374 Weighted Average Common Shares Outstanding - Diluted 5,220,887 5,314,537 5,390,128 5,432,234 5,436,881 3/31/22 12/31/21 9/30/21 6/30/21 3/31/21 Common Shares Outstanding 5,156,897 5,260,672 5,330,401 5,409,077 5,434,374 Book Value Per Common Share $ 23.69 $ 25.31 $ 24.57 $ 24.50 $ 24.62 Tangible Book Value per Common Share (Non-GAAP) (1) 20.86 22.45 21.67 21.56 21.38 Stockholders’ Equity to Assets 8.5 % 9.3 % 8.9 % 9.1 % 9.1 % Tangible Common Equity to Tangible Assets (Non-GAAP) (1) 7.6 8.4 7.9 8.1 8.0
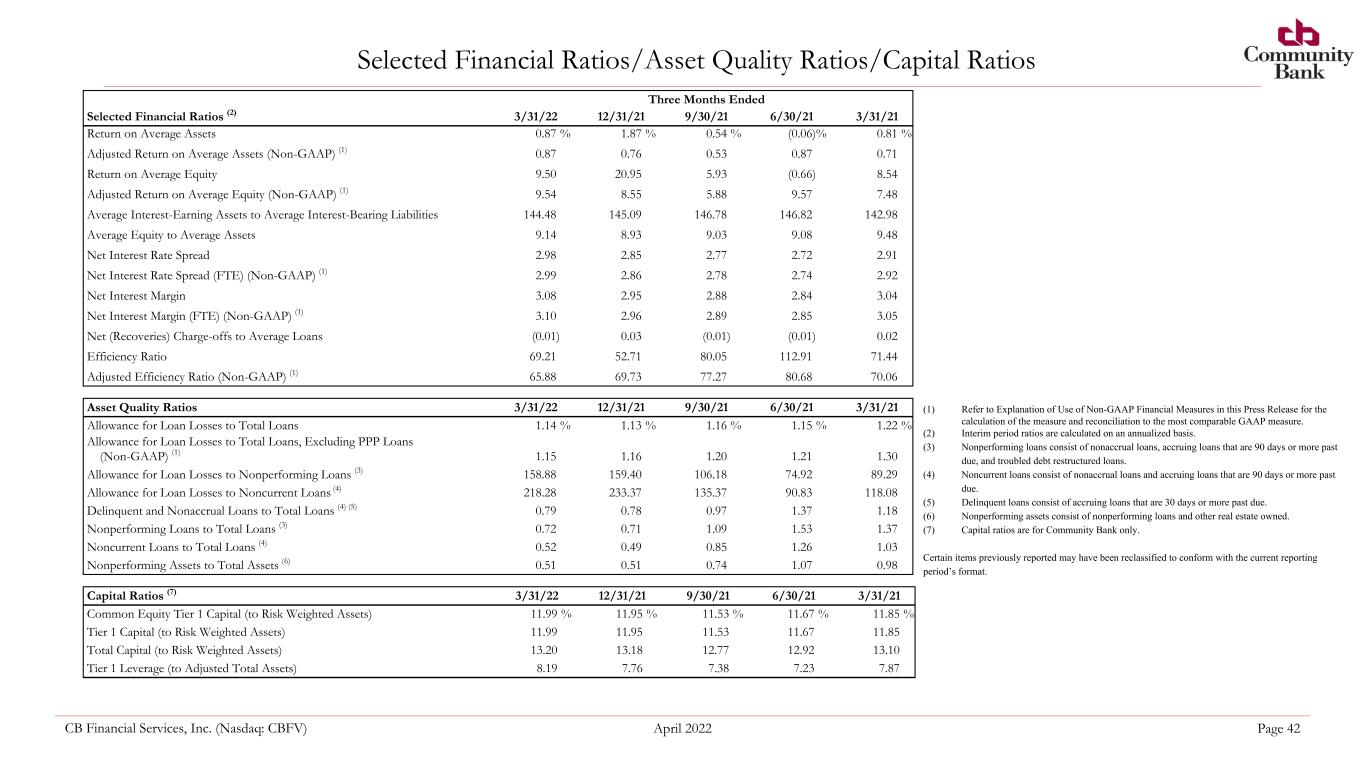
CB Financial Services, Inc. (Nasdaq: CBFV) April 2022 Page 42 Selected Financial Ratios/Asset Quality Ratios/Capital Ratios Three Months Ended Selected Financial Ratios (2) 3/31/22 12/31/21 9/30/21 6/30/21 3/31/21 Return on Average Assets 0.87 % 1.87 % 0.54 % (0.06) % 0.81 % Adjusted Return on Average Assets (Non-GAAP) (1) 0.87 0.76 0.53 0.87 0.71 Return on Average Equity 9.50 20.95 5.93 (0.66) 8.54 Adjusted Return on Average Equity (Non-GAAP) (1) 9.54 8.55 5.88 9.57 7.48 Average Interest-Earning Assets to Average Interest-Bearing Liabilities 144.48 145.09 146.78 146.82 142.98 Average Equity to Average Assets 9.14 8.93 9.03 9.08 9.48 Net Interest Rate Spread 2.98 2.85 2.77 2.72 2.91 Net Interest Rate Spread (FTE) (Non-GAAP) (1) 2.99 2.86 2.78 2.74 2.92 Net Interest Margin 3.08 2.95 2.88 2.84 3.04 Net Interest Margin (FTE) (Non-GAAP) (1) 3.10 2.96 2.89 2.85 3.05 Net (Recoveries) Charge-offs to Average Loans (0.01) 0.03 (0.01) (0.01) 0.02 Efficiency Ratio 69.21 52.71 80.05 112.91 71.44 Adjusted Efficiency Ratio (Non-GAAP) (1) 65.88 69.73 77.27 80.68 70.06 Asset Quality Ratios 3/31/22 12/31/21 9/30/21 6/30/21 3/31/21 Allowance for Loan Losses to Total Loans 1.14 % 1.13 % 1.16 % 1.15 % 1.22 % Allowance for Loan Losses to Total Loans, Excluding PPP Loans (Non-GAAP) (1) 1.15 1.16 1.20 1.21 1.30 Allowance for Loan Losses to Nonperforming Loans (3) 158.88 159.40 106.18 74.92 89.29 Allowance for Loan Losses to Noncurrent Loans (4) 218.28 233.37 135.37 90.83 118.08 Delinquent and Nonaccrual Loans to Total Loans (4) (5) 0.79 0.78 0.97 1.37 1.18 Nonperforming Loans to Total Loans (3) 0.72 0.71 1.09 1.53 1.37 Noncurrent Loans to Total Loans (4) 0.52 0.49 0.85 1.26 1.03 Nonperforming Assets to Total Assets (6) 0.51 0.51 0.74 1.07 0.98 Capital Ratios (7) 3/31/22 12/31/21 9/30/21 6/30/21 3/31/21 Common Equity Tier 1 Capital (to Risk Weighted Assets) 11.99 % 11.95 % 11.53 % 11.67 % 11.85 % Tier 1 Capital (to Risk Weighted Assets) 11.99 11.95 11.53 11.67 11.85 Total Capital (to Risk Weighted Assets) 13.20 13.18 12.77 12.92 13.10 Tier 1 Leverage (to Adjusted Total Assets) 8.19 7.76 7.38 7.23 7.87 (1) Refer to Explanation of Use of Non-GAAP Financial Measures in this Press Release for the calculation of the measure and reconciliation to the most comparable GAAP measure. (2) Interim period ratios are calculated on an annualized basis. (3) Nonperforming loans consist of nonaccrual loans, accruing loans that are 90 days or more past due, and troubled debt restructured loans. (4) Noncurrent loans consist of nonaccrual loans and accruing loans that are 90 days or more past due. (5) Delinquent loans consist of accruing loans that are 30 days or more past due. (6) Nonperforming assets consist of nonperforming loans and other real estate owned. (7) Capital ratios are for Community Bank only. Certain items previously reported may have been reclassified to conform with the current reporting period’s format.
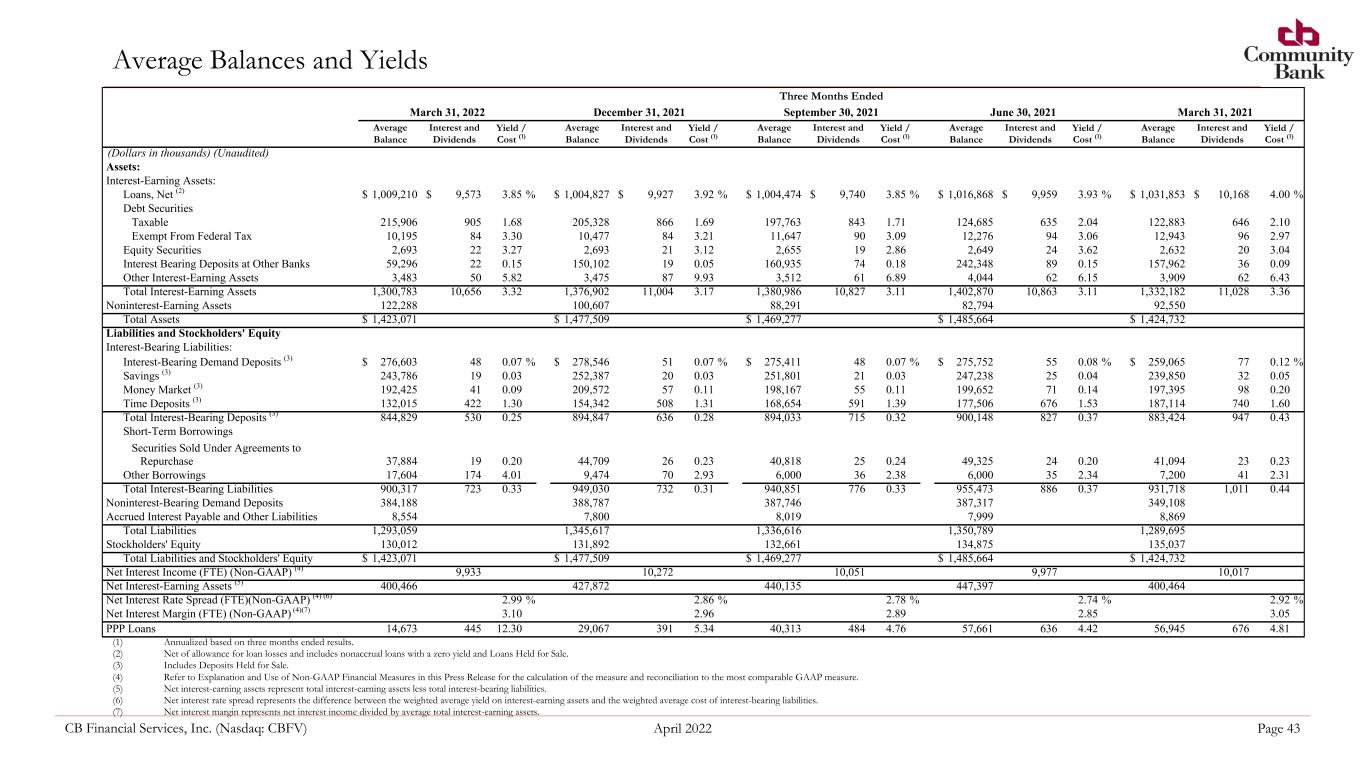
CB Financial Services, Inc. (Nasdaq: CBFV) April 2022 Page 43 Average Balances and Yields (1) Annualized based on three months ended results. (2) Net of allowance for loan losses and includes nonaccrual loans with a zero yield and Loans Held for Sale. (3) Includes Deposits Held for Sale. (4) Refer to Explanation and Use of Non-GAAP Financial Measures in this Press Release for the calculation of the measure and reconciliation to the most comparable GAAP measure. (5) Net interest-earning assets represent total interest-earning assets less total interest-bearing liabilities. (6) Net interest rate spread represents the difference between the weighted average yield on interest-earning assets and the weighted average cost of interest-bearing liabilities. (7) Net interest margin represents net interest income divided by average total interest-earning assets. Three Months Ended March 31, 2022 December 31, 2021 September 30, 2021 June 30, 2021 March 31, 2021 Average Balance Interest and Dividends Yield / Cost (1) Average Balance Interest and Dividends Yield / Cost (1) Average Balance Interest and Dividends Yield / Cost (1) Average Balance Interest and Dividends Yield / Cost (1) Average Balance Interest and Dividends Yield / Cost (1) (Dollars in thousands) (Unaudited) Assets: Interest-Earning Assets: Loans, Net (2) $ 1,009,210 $ 9,573 3.85 % $ 1,004,827 $ 9,927 3.92 % $ 1,004,474 $ 9,740 3.85 % $ 1,016,868 $ 9,959 3.93 % $ 1,031,853 $ 10,168 4.00 % Debt Securities Taxable 215,906 905 1.68 205,328 866 1.69 197,763 843 1.71 124,685 635 2.04 122,883 646 2.10 Exempt From Federal Tax 10,195 84 3.30 10,477 84 3.21 11,647 90 3.09 12,276 94 3.06 12,943 96 2.97 Equity Securities 2,693 22 3.27 2,693 21 3.12 2,655 19 2.86 2,649 24 3.62 2,632 20 3.04 Interest Bearing Deposits at Other Banks 59,296 22 0.15 150,102 19 0.05 160,935 74 0.18 242,348 89 0.15 157,962 36 0.09 Other Interest-Earning Assets 3,483 50 5.82 3,475 87 9.93 3,512 61 6.89 4,044 62 6.15 3,909 62 6.43 Total Interest-Earning Assets 1,300,783 10,656 3.32 1,376,902 11,004 3.17 1,380,986 10,827 3.11 1,402,870 10,863 3.11 1,332,182 11,028 3.36 Noninterest-Earning Assets 122,288 100,607 88,291 82,794 92,550 Total Assets $ 1,423,071 $ 1,477,509 $ 1,469,277 $ 1,485,664 $ 1,424,732 Liabilities and Stockholders' Equity Interest-Bearing Liabilities: Interest-Bearing Demand Deposits (3) $ 276,603 48 0.07 % $ 278,546 51 0.07 % $ 275,411 48 0.07 % $ 275,752 55 0.08 % $ 259,065 77 0.12 % Savings (3) 243,786 19 0.03 252,387 20 0.03 251,801 21 0.03 247,238 25 0.04 239,850 32 0.05 Money Market (3) 192,425 41 0.09 209,572 57 0.11 198,167 55 0.11 199,652 71 0.14 197,395 98 0.20 Time Deposits (3) 132,015 422 1.30 154,342 508 1.31 168,654 591 1.39 177,506 676 1.53 187,114 740 1.60 Total Interest-Bearing Deposits (3) 844,829 530 0.25 894,847 636 0.28 894,033 715 0.32 900,148 827 0.37 883,424 947 0.43 Short-Term Borrowings Securities Sold Under Agreements to Repurchase 37,884 19 0.20 44,709 26 0.23 40,818 25 0.24 49,325 24 0.20 41,094 23 0.23 Other Borrowings 17,604 174 4.01 9,474 70 2.93 6,000 36 2.38 6,000 35 2.34 7,200 41 2.31 Total Interest-Bearing Liabilities 900,317 723 0.33 949,030 732 0.31 940,851 776 0.33 955,473 886 0.37 931,718 1,011 0.44 Noninterest-Bearing Demand Deposits 384,188 388,787 387,746 387,317 349,108 Accrued Interest Payable and Other Liabilities 8,554 7,800 8,019 7,999 8,869 Total Liabilities 1,293,059 1,345,617 1,336,616 1,350,789 1,289,695 Stockholders' Equity 130,012 131,892 132,661 134,875 135,037 Total Liabilities and Stockholders' Equity $ 1,423,071 $ 1,477,509 $ 1,469,277 $ 1,485,664 $ 1,424,732 Net Interest Income (FTE) (Non-GAAP) (4) 9,933 10,272 10,051 9,977 10,017 Net Interest-Earning Assets (5) 400,466 427,872 440,135 447,397 400,464 Net Interest Rate Spread (FTE)(Non-GAAP) (4) (6) 2.99 % 2.86 % 2.78 % 2.74 % 2.92 % Net Interest Margin (FTE) (Non-GAAP) (4)(7) 3.10 2.96 2.89 2.85 3.05 PPP Loans 14,673 445 12.30 29,067 391 5.34 40,313 484 4.76 57,661 636 4.42 56,945 676 4.81
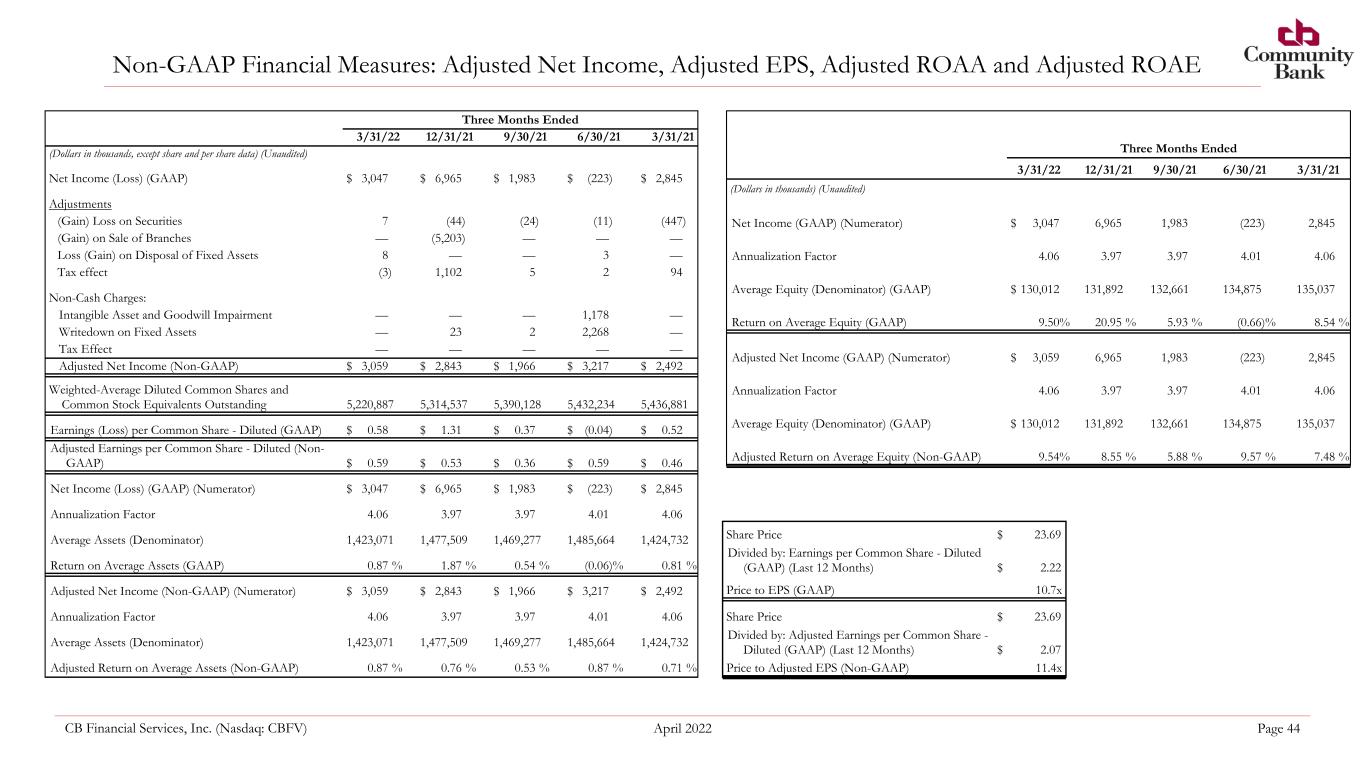
CB Financial Services, Inc. (Nasdaq: CBFV) April 2022 Page 44 Non-GAAP Financial Measures: Adjusted Net Income, Adjusted EPS, Adjusted ROAA and Adjusted ROAE Three Months Ended 3/31/22 12/31/21 9/30/21 6/30/21 3/31/21 (Dollars in thousands, except share and per share data) (Unaudited) Net Income (Loss) (GAAP) $ 3,047 $ 6,965 $ 1,983 $ (223) $ 2,845 Adjustments (Gain) Loss on Securities 7 (44) (24) (11) (447) (Gain) on Sale of Branches — (5,203) — — — Loss (Gain) on Disposal of Fixed Assets 8 — — 3 — Tax effect (3) 1,102 5 2 94 Non-Cash Charges: Intangible Asset and Goodwill Impairment — — — 1,178 — Writedown on Fixed Assets — 23 2 2,268 — Tax Effect — — — — — Adjusted Net Income (Non-GAAP) $ 3,059 $ 2,843 $ 1,966 $ 3,217 $ 2,492 Weighted-Average Diluted Common Shares and Common Stock Equivalents Outstanding 5,220,887 5,314,537 5,390,128 5,432,234 5,436,881 Earnings (Loss) per Common Share - Diluted (GAAP) $ 0.58 $ 1.31 $ 0.37 $ (0.04) $ 0.52 Adjusted Earnings per Common Share - Diluted (Non- GAAP) $ 0.59 $ 0.53 $ 0.36 $ 0.59 $ 0.46 Net Income (Loss) (GAAP) (Numerator) $ 3,047 $ 6,965 $ 1,983 $ (223) $ 2,845 Annualization Factor 4.06 3.97 3.97 4.01 4.06 Average Assets (Denominator) 1,423,071 1,477,509 1,469,277 1,485,664 1,424,732 Return on Average Assets (GAAP) 0.87 % 1.87 % 0.54 % (0.06) % 0.81 % Adjusted Net Income (Non-GAAP) (Numerator) $ 3,059 $ 2,843 $ 1,966 $ 3,217 $ 2,492 Annualization Factor 4.06 3.97 3.97 4.01 4.06 Average Assets (Denominator) 1,423,071 1,477,509 1,469,277 1,485,664 1,424,732 Adjusted Return on Average Assets (Non-GAAP) 0.87 % 0.76 % 0.53 % 0.87 % 0.71 % Three Months Ended 3/31/22 12/31/21 9/30/21 6/30/21 3/31/21 (Dollars in thousands) (Unaudited) Net Income (GAAP) (Numerator) $ 3,047 6,965 1,983 (223) 2,845 Annualization Factor 4.06 3.97 3.97 4.01 4.06 Average Equity (Denominator) (GAAP) $ 130,012 131,892 132,661 134,875 135,037 Return on Average Equity (GAAP) 9.50 % 20.95 % 5.93 % (0.66) % 8.54 % Adjusted Net Income (GAAP) (Numerator) $ 3,059 6,965 1,983 (223) 2,845 Annualization Factor 4.06 3.97 3.97 4.01 4.06 Average Equity (Denominator) (GAAP) $ 130,012 131,892 132,661 134,875 135,037 Adjusted Return on Average Equity (Non-GAAP) 9.54 % 8.55 % 5.88 % 9.57 % 7.48 % Share Price $ 23.69 Divided by: Earnings per Common Share - Diluted (GAAP) (Last 12 Months) $ 2.22 Price to EPS (GAAP) 10.7x Share Price $ 23.69 Divided by: Adjusted Earnings per Common Share - Diluted (GAAP) (Last 12 Months) $ 2.07 Price to Adjusted EPS (Non-GAAP) 11.4x
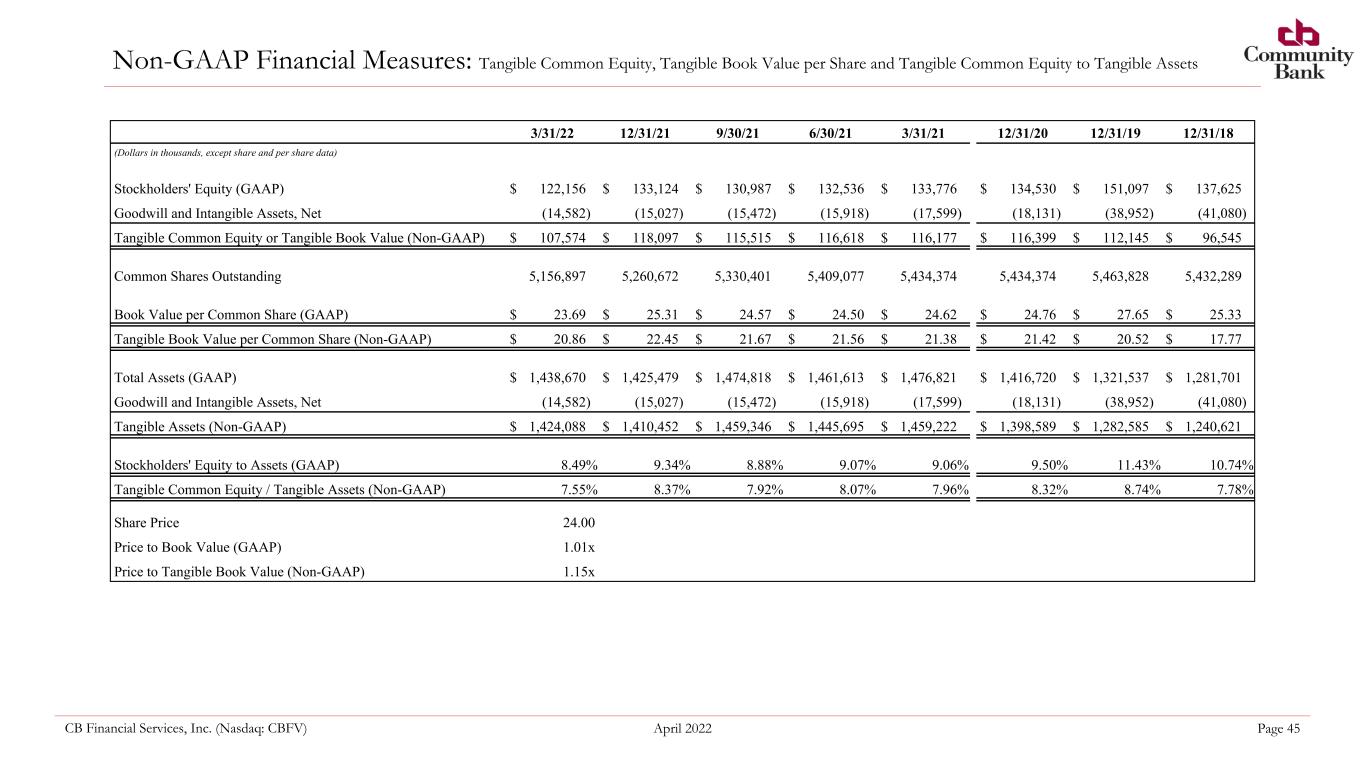
CB Financial Services, Inc. (Nasdaq: CBFV) April 2022 Page 45 Non-GAAP Financial Measures: Tangible Common Equity, Tangible Book Value per Share and Tangible Common Equity to Tangible Assets 3/31/22 12/31/21 9/30/21 6/30/21 3/31/21 12/31/20 12/31/19 12/31/18 (Dollars in thousands, except share and per share data) Stockholders' Equity (GAAP) $ 122,156 $ 133,124 $ 130,987 $ 132,536 $ 133,776 $ 134,530 $ 151,097 $ 137,625 Goodwill and Intangible Assets, Net (14,582) (15,027) (15,472) (15,918) (17,599) (18,131) (38,952) (41,080) Tangible Common Equity or Tangible Book Value (Non-GAAP) $ 107,574 $ 118,097 $ 115,515 $ 116,618 $ 116,177 $ 116,399 $ 112,145 $ 96,545 Common Shares Outstanding 5,156,897 5,260,672 5,330,401 5,409,077 5,434,374 5,434,374 5,463,828 5,432,289 Book Value per Common Share (GAAP) $ 23.69 $ 25.31 $ 24.57 $ 24.50 $ 24.62 $ 24.76 $ 27.65 $ 25.33 Tangible Book Value per Common Share (Non-GAAP) $ 20.86 $ 22.45 $ 21.67 $ 21.56 $ 21.38 $ 21.42 $ 20.52 $ 17.77 Total Assets (GAAP) $ 1,438,670 $ 1,425,479 $ 1,474,818 $ 1,461,613 $ 1,476,821 $ 1,416,720 $ 1,321,537 $ 1,281,701 Goodwill and Intangible Assets, Net (14,582) (15,027) (15,472) (15,918) (17,599) (18,131) (38,952) (41,080) Tangible Assets (Non-GAAP) $ 1,424,088 $ 1,410,452 $ 1,459,346 $ 1,445,695 $ 1,459,222 $ 1,398,589 $ 1,282,585 $ 1,240,621 Stockholders' Equity to Assets (GAAP) 8.49 % 9.34 % 8.88 % 9.07 % 9.06 % 9.50 % 11.43 % 10.74 % Tangible Common Equity / Tangible Assets (Non-GAAP) 7.55 % 8.37 % 7.92 % 8.07 % 7.96 % 8.32 % 8.74 % 7.78 % Share Price 24.00 Price to Book Value (GAAP) 1.01x Price to Tangible Book Value (Non-GAAP) 1.15x
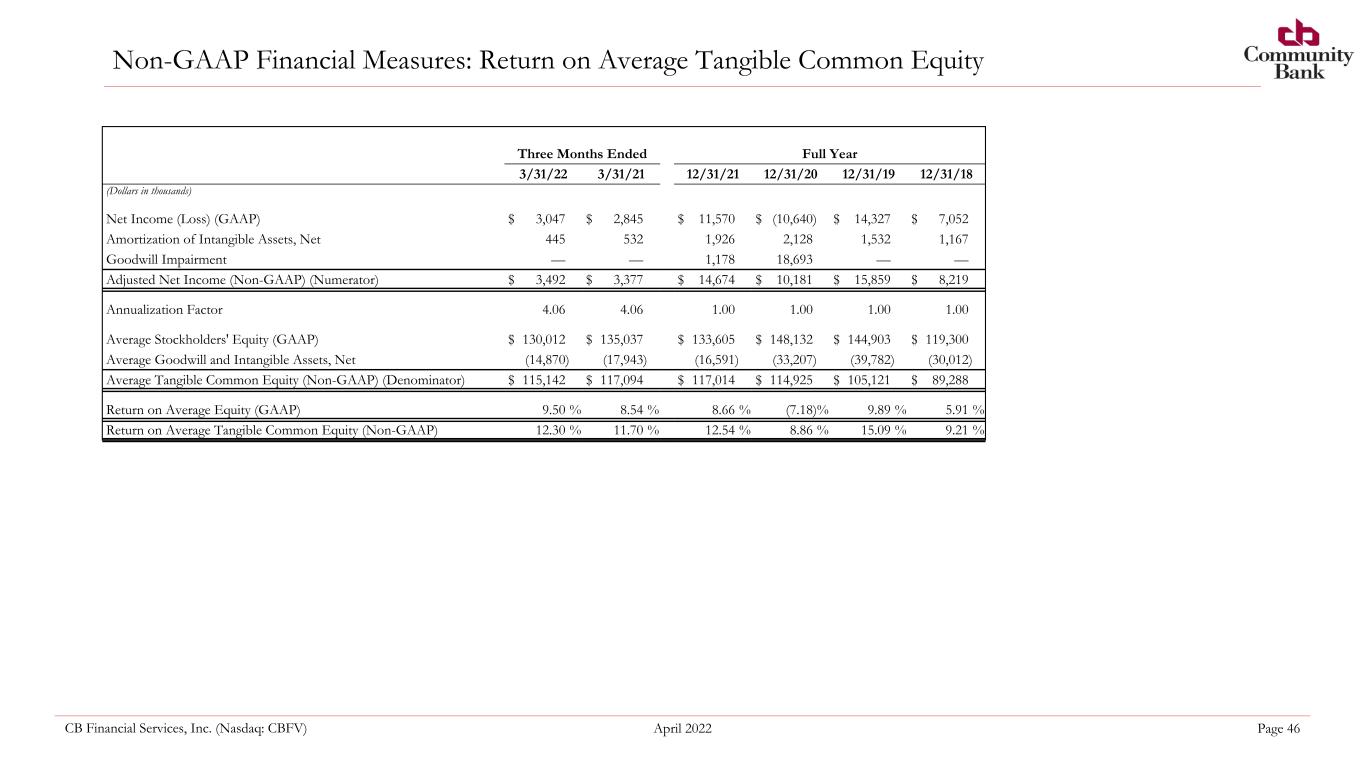
CB Financial Services, Inc. (Nasdaq: CBFV) April 2022 Page 46 Non-GAAP Financial Measures: Return on Average Tangible Common Equity Three Months Ended Full Year 3/31/22 3/31/21 12/31/21 12/31/20 12/31/19 12/31/18 (Dollars in thousands) Net Income (Loss) (GAAP) $ 3,047 $ 2,845 $ 11,570 $ (10,640) $ 14,327 $ 7,052 Amortization of Intangible Assets, Net 445 532 1,926 2,128 1,532 1,167 Goodwill Impairment — — 1,178 18,693 — — Adjusted Net Income (Non-GAAP) (Numerator) $ 3,492 $ 3,377 $ 14,674 $ 10,181 $ 15,859 $ 8,219 Annualization Factor 4.06 4.06 1.00 1.00 1.00 1.00 Average Stockholders' Equity (GAAP) $ 130,012 $ 135,037 $ 133,605 $ 148,132 $ 144,903 $ 119,300 Average Goodwill and Intangible Assets, Net (14,870) (17,943) (16,591) (33,207) (39,782) (30,012) Average Tangible Common Equity (Non-GAAP) (Denominator) $ 115,142 $ 117,094 $ 117,014 $ 114,925 $ 105,121 $ 89,288 Return on Average Equity (GAAP) 9.50 % 8.54 % 8.66 % (7.18) % 9.89 % 5.91 % Return on Average Tangible Common Equity (Non-GAAP) 12.30 % 11.70 % 12.54 % 8.86 % 15.09 % 9.21 %
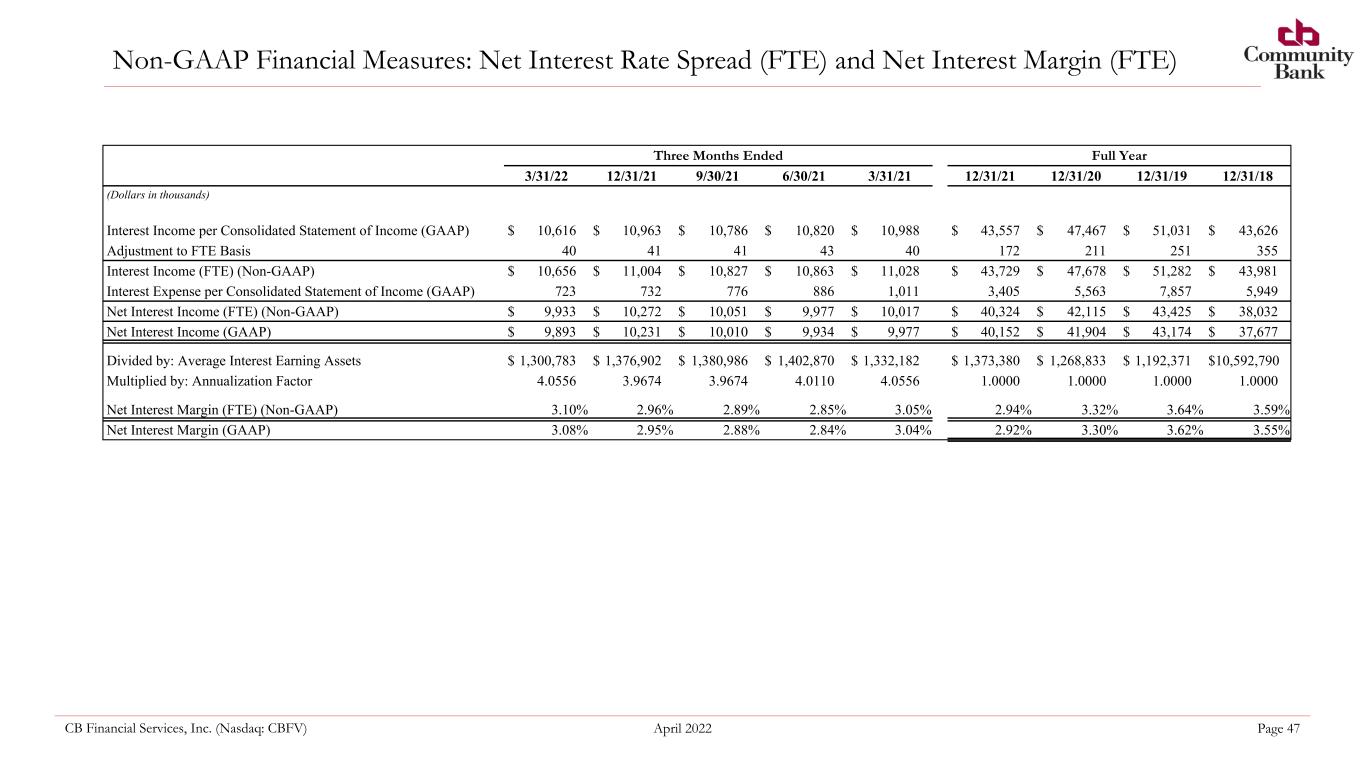
CB Financial Services, Inc. (Nasdaq: CBFV) April 2022 Page 47 Non-GAAP Financial Measures: Net Interest Rate Spread (FTE) and Net Interest Margin (FTE) Three Months Ended Full Year 3/31/22 12/31/21 9/30/21 6/30/21 3/31/21 12/31/21 12/31/20 12/31/19 12/31/18 (Dollars in thousands) Interest Income per Consolidated Statement of Income (GAAP) $ 10,616 $ 10,963 $ 10,786 $ 10,820 $ 10,988 $ 43,557 $ 47,467 $ 51,031 $ 43,626 Adjustment to FTE Basis 40 41 41 43 40 172 211 251 355 Interest Income (FTE) (Non-GAAP) $ 10,656 $ 11,004 $ 10,827 $ 10,863 $ 11,028 $ 43,729 $ 47,678 $ 51,282 $ 43,981 Interest Expense per Consolidated Statement of Income (GAAP) 723 732 776 886 1,011 3,405 5,563 7,857 5,949 Net Interest Income (FTE) (Non-GAAP) $ 9,933 $ 10,272 $ 10,051 $ 9,977 $ 10,017 $ 40,324 $ 42,115 $ 43,425 $ 38,032 Net Interest Income (GAAP) $ 9,893 $ 10,231 $ 10,010 $ 9,934 $ 9,977 $ 40,152 $ 41,904 $ 43,174 $ 37,677 Divided by: Average Interest Earning Assets $ 1,300,783 $ 1,376,902 $ 1,380,986 $ 1,402,870 $ 1,332,182 $ 1,373,380 $ 1,268,833 $ 1,192,371 $ 10,592,790 Multiplied by: Annualization Factor 4.0556 3.9674 3.9674 4.0110 4.0556 1.0000 1.0000 1.0000 1.0000 Net Interest Margin (FTE) (Non-GAAP) 3.10 % 2.96 % 2.89 % 2.85 % 3.05 % 2.94 % 3.32 % 3.64 % 3.59 % Net Interest Margin (GAAP) 3.08 % 2.95 % 2.88 % 2.84 % 3.04 % 2.92 % 3.30 % 3.62 % 3.55 %
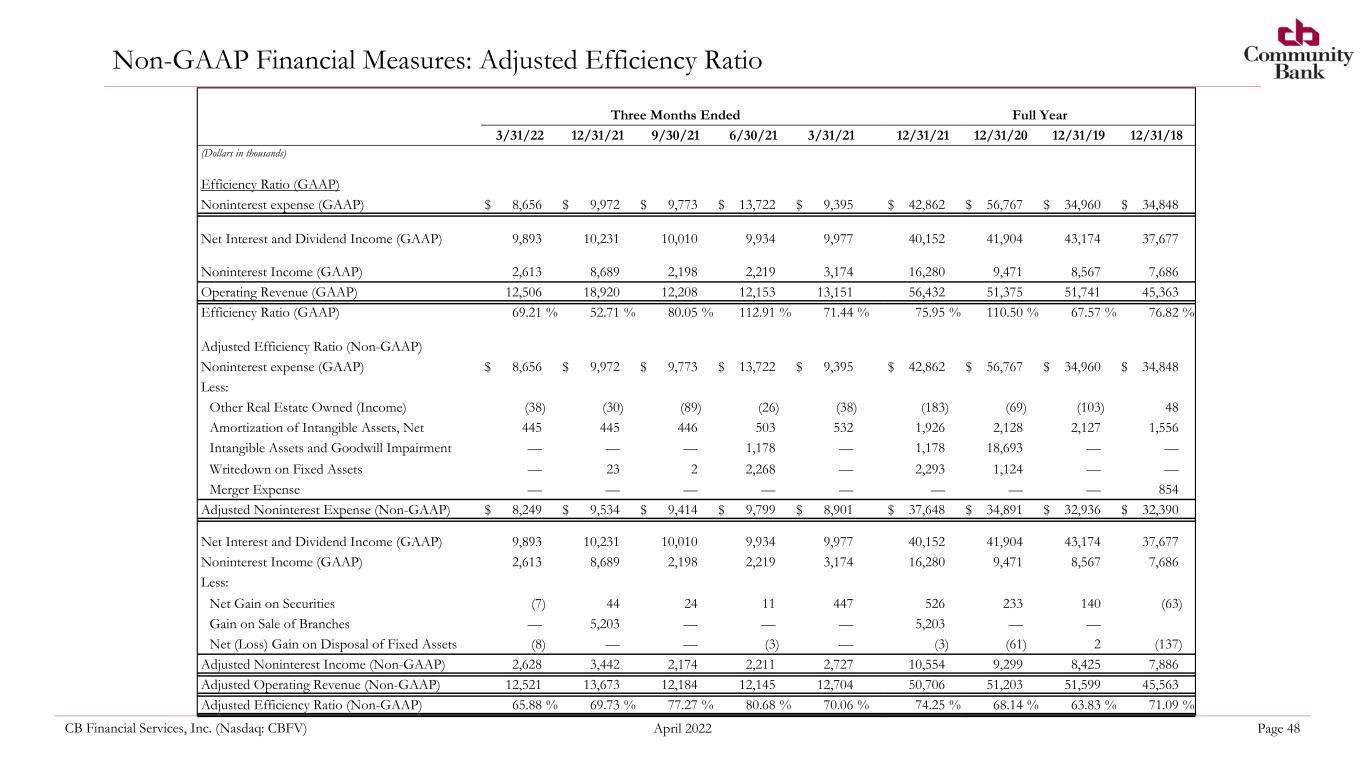
CB Financial Services, Inc. (Nasdaq: CBFV) April 2022 Page 48 Non-GAAP Financial Measures: Adjusted Efficiency Ratio Three Months Ended Full Year 3/31/22 12/31/21 9/30/21 6/30/21 3/31/21 12/31/21 12/31/20 12/31/19 12/31/18 (Dollars in thousands) Efficiency Ratio (GAAP) Noninterest expense (GAAP) $ 8,656 $ 9,972 $ 9,773 $ 13,722 $ 9,395 $ 42,862 $ 56,767 $ 34,960 $ 34,848 Net Interest and Dividend Income (GAAP) 9,893 10,231 10,010 9,934 9,977 40,152 41,904 43,174 37,677 Noninterest Income (GAAP) 2,613 8,689 2,198 2,219 3,174 16,280 9,471 8,567 7,686 Operating Revenue (GAAP) 12,506 18,920 12,208 12,153 13,151 56,432 51,375 51,741 45,363 Efficiency Ratio (GAAP) 69.21 % 52.71 % 80.05 % 112.91 % 71.44 % 75.95 % 110.50 % 67.57 % 76.82 % Adjusted Efficiency Ratio (Non-GAAP) Noninterest expense (GAAP) $ 8,656 $ 9,972 $ 9,773 $ 13,722 $ 9,395 $ 42,862 $ 56,767 $ 34,960 $ 34,848 Less: Other Real Estate Owned (Income) (38) (30) (89) (26) (38) (183) (69) (103) 48 Amortization of Intangible Assets, Net 445 445 446 503 532 1,926 2,128 2,127 1,556 Intangible Assets and Goodwill Impairment — — — 1,178 — 1,178 18,693 — — Writedown on Fixed Assets — 23 2 2,268 — 2,293 1,124 — — Merger Expense — — — — — — — — 854 Adjusted Noninterest Expense (Non-GAAP) $ 8,249 $ 9,534 $ 9,414 $ 9,799 $ 8,901 $ 37,648 $ 34,891 $ 32,936 $ 32,390 Net Interest and Dividend Income (GAAP) 9,893 10,231 10,010 9,934 9,977 40,152 41,904 43,174 37,677 Noninterest Income (GAAP) 2,613 8,689 2,198 2,219 3,174 16,280 9,471 8,567 7,686 Less: Net Gain on Securities (7) 44 24 11 447 526 233 140 (63) Gain on Sale of Branches — 5,203 — — — 5,203 — — Net (Loss) Gain on Disposal of Fixed Assets (8) — — (3) — (3) (61) 2 (137) Adjusted Noninterest Income (Non-GAAP) 2,628 3,442 2,174 2,211 2,727 10,554 9,299 8,425 7,886 Adjusted Operating Revenue (Non-GAAP) 12,521 13,673 12,184 12,145 12,704 50,706 51,203 51,599 45,563 Adjusted Efficiency Ratio (Non-GAAP) 65.88 % 69.73 % 77.27 % 80.68 % 70.06 % 74.25 % 68.14 % 63.83 % 71.09 %
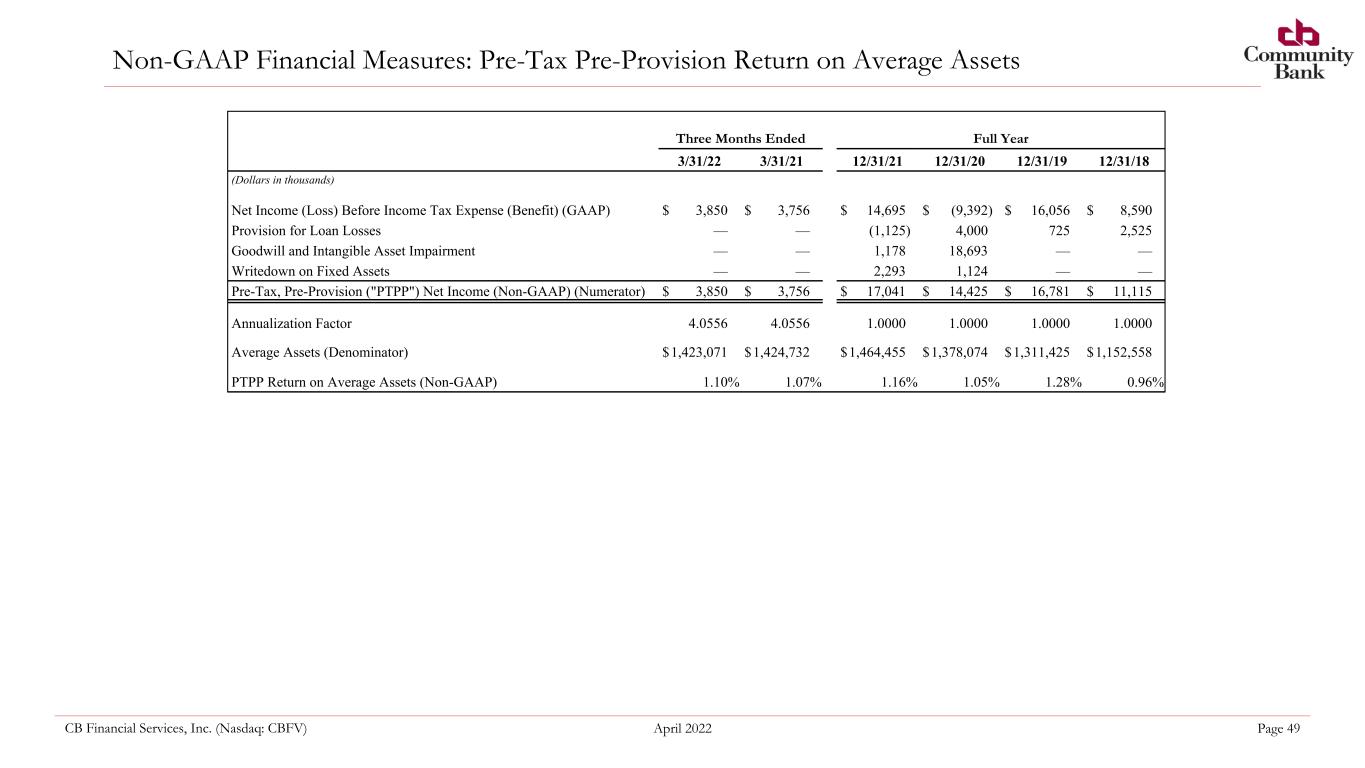
CB Financial Services, Inc. (Nasdaq: CBFV) April 2022 Page 49 Non-GAAP Financial Measures: Pre-Tax Pre-Provision Return on Average Assets Three Months Ended Full Year 3/31/22 3/31/21 12/31/21 12/31/20 12/31/19 12/31/18 (Dollars in thousands) Net Income (Loss) Before Income Tax Expense (Benefit) (GAAP) $ 3,850 $ 3,756 $ 14,695 $ (9,392) $ 16,056 $ 8,590 Provision for Loan Losses — — (1,125) 4,000 725 2,525 Goodwill and Intangible Asset Impairment — — 1,178 18,693 — — Writedown on Fixed Assets — — 2,293 1,124 — — Pre-Tax, Pre-Provision ("PTPP") Net Income (Non-GAAP) (Numerator) $ 3,850 $ 3,756 $ 17,041 $ 14,425 $ 16,781 $ 11,115 Annualization Factor 4.0556 4.0556 1.0000 1.0000 1.0000 1.0000 Average Assets (Denominator) $ 1,423,071 $ 1,424,732 $ 1,464,455 $ 1,378,074 $ 1,311,425 $ 1,152,558 PTPP Return on Average Assets (Non-GAAP) 1.10 % 1.07 % 1.16 % 1.05 % 1.28 % 0.96 %


