Exhibit 99.2
| FORWARD-LOOKING STATEMENTS |

This supplemental information contains forward-looking statements within the meaning of the federal securities laws. You can identify these statements by our use of the words “assumes,” “believes,” “estimates,” “expects,” “guidance,” “intends,” “plans,” “projects” and similar expressions that do not relate to historical matters. You should exercise caution in interpreting and relying on forward-looking statements because they involve known and unknown risks, uncertainties and other factors which are, in some cases, beyond our control and could materially affect actual results, performance or achievements. These factors include, without limitation, the ability to enter into new leases or renew leases on favorable terms; dependence on tenants’ financial condition; the risk we may lose a major tenant or that a major tenant may be adversely impacted by market and economic conditions, including elevated inflation and interest rates; trends in the office real estate industry including telecommuting, flexible work schedules, open workplaces and teleconferencing; the uncertainties of real estate development, acquisition and disposition activity; the ability to effectively integrate acquisitions; fluctuations in interest rates and the costs and availability of financing; the ability of our joint venture partners to satisfy their obligations; the effects of local, national and international economic and market conditions and the impact of elevated inflation and interest rates on such market conditions; the effects of acquisitions, dispositions and possible impairment charges on our operating results; the negative impact of any future pandemic, endemic or outbreak of infectious disease on the U.S., regional and global economies and our tenants’ financial condition and results of operations; regulatory changes, including changes to tax laws and regulations; and other risks and uncertainties detailed from time to time in our filings with the U.S. Securities and Exchange Commission. We do not undertake a duty to update or revise any forward-looking statement, whether as a result of new information, future events or otherwise.
- 2 -
| TABLE OF CONTENTS |

|
| Page | |
| Overview |
| |
|
| 4 | |
|
| 5 | |
|
| 6 | |
|
|
|
|
| Selected Financial Information |
| |
|
| 7 | |
|
| 8 | |
|
| 9 | |
|
| 10 | |
|
| 11 | |
|
| 12 | |
|
| Earnings Before Interest, Taxes, Depreciation and Amortization for Real Estate (“EBITDAre”) | 13 |
|
| 14 - 16 | |
|
| 17 - 20 | |
|
|
|
|
| Joint Ventures and Funds |
| |
|
| 21 - 26 | |
|
| 27 - 32 | |
|
| 33 - 38 | |
|
|
|
|
| Debt and Capitalization Data |
| |
|
| 39 | |
|
| 40 | |
|
| 41 | |
|
|
|
|
| Selected Property Data |
| |
|
| 42 - 44 | |
|
| 45 | |
|
| 46 - 47 | |
|
| 48 - 50 | |
|
| 51 - 52 | |
|
|
|
|
|
|
|
|
| 53 | ||
| 54 - 55 | ||
- 3 -
| COMPANY PROFILE |

Paramount Group, Inc. (“Paramount” or the “Company”) is a fully-integrated real estate investment trust that owns, operates, manages, acquires and redevelops high-quality, Class A office properties located in select central business district submarkets of New York and San Francisco. Paramount is focused on maximizing the value of its portfolio by leveraging the sought-after locations of its assets and its proven property management capabilities to attract and retain high-quality tenants.
MANAGEMENT
Albert Behler | Chairman, Chief Executive Officer and President |
Wilbur Paes | Chief Operating Officer, Chief Financial Officer and Treasurer |
Peter Brindley | Executive Vice President, Head of Real Estate |
Gage Johnson | Senior Vice President, General Counsel and Secretary |
Ermelinda Berberi | Senior Vice President, Chief Accounting Officer |
BOARD OF DIRECTORS
Albert Behler | Director, Chairman of the Board |
Thomas Armbrust | Director |
Martin Bussmann | Director, Lead Independent Director, Chair of Nominating and Corporate Governance Committee |
Karin Klein | Director |
Katharina Otto-Bernstein | Director |
Mark Patterson | Director |
Hitoshi Saito | Director |
Paula Sutter | Director, Chair of Audit Committee |
Greg Wright | Director, Chair of Compensation Committee |
COMPANY INFORMATION
Corporate Headquarters |
| Investor Relations | Stock Exchange Listing | Trading Symbol |
1633 Broadway |
| IR@pgre.com | New York Stock Exchange | PGRE |
New York, NY 10019 |
| (212) 492-2298 |
|
|
(212) 237-3100 |
|
|
|
|
- 4 -
| COMMON SHARE DATA |

(unaudited)
|
|
|
| Three Months Ended |
| |||||||||||||||||
| Share Price: | June 30, 2024 |
|
| March 31, 2024 |
|
| December 31, 2023 |
|
| September 30, 2023 |
|
| June 30, 2023 |
| |||||||
| High | $ | 5.10 |
|
| $ | 5.36 |
|
| $ | 5.92 |
|
| $ | 5.43 |
|
| $ | 4.92 |
| ||
|
| Low | $ | 4.30 |
|
| $ | 4.21 |
|
| $ | 4.06 |
|
| $ | 4.20 |
|
| $ | 4.10 |
| |
|
| Closing (end of period) | $ | 4.63 |
|
| $ | 4.69 |
|
| $ | 5.17 |
|
| $ | 4.62 |
|
| $ | 4.43 |
| |
|
|
|
|
|
|
|
|
|
|
|
|
|
|
|
|
|
| |||||
| Dividends per common share | $ | 0.035 |
|
| $ | 0.035 |
|
| $ | 0.035 |
|
| $ | 0.035 |
|
| $ | 0.035 |
| ||
| Annualized dividends per common share | $ | 0.14 |
|
| $ | 0.14 |
|
| $ | 0.14 |
|
| $ | 0.14 |
|
| $ | 0.14 |
| ||
| Dividend yield (on closing share price) |
| 3.0 | % |
|
| 3.0 | % |
|
| 2.7 | % |
|
| 3.0 | % |
|
| 3.2 | % | ||
- 5 -
| GUIDANCE |

(unaudited and in thousands, except square feet, % and per share amounts)
|
|
|
|
|
|
|
|
|
|
|
|
|
|
|
|
| Change at the |
| |||
|
|
|
|
|
|
|
|
|
|
| Full Year 2024 |
|
| Midpoint of |
| ||||||
(Amounts per diluted share) |
| Low |
|
| High |
|
| Prior Guidance |
| ||||||||||||
|
|
|
| Estimated net loss attributable to common stockholders |
| $ | (0.11 | ) |
| $ | (0.07 | ) |
|
|
| ||||||
|
|
|
| Our share of real estate depreciation and amortization |
|
| 0.92 |
|
|
| 0.92 |
|
|
|
| ||||||
|
|
|
| Estimated FFO (1) |
|
| 0.81 |
|
|
| 0.85 |
|
|
|
| ||||||
|
|
|
| Adjustments for non-core items (2) |
|
| (0.05 | ) |
|
| (0.05 | ) |
|
|
| ||||||
|
|
|
| Estimated Core FFO (1)(3) |
| $ | 0.76 |
|
| $ | 0.80 |
|
| $ | - |
| |||||
|
|
|
|
|
|
|
|
|
|
|
|
|
|
|
|
|
|
| |||
|
| Operating Assumptions: |
|
|
|
|
|
|
|
|
| ||||||||||
|
|
| Leasing Activity (square feet) |
|
| 725,000 |
|
|
| 900,000 |
|
|
| - |
| ||||||
|
|
| PGRE's share of Same Store Leased % (1) at year end |
|
| 86.1 | % |
|
| 88.1 | % |
|
| - |
| ||||||
|
|
| Decrease in PGRE's share of Same Store Cash NOI (1) |
|
| (4.5 | %) |
|
| (2.5 | %) |
|
| 1.0 | % | ||||||
|
|
| Decrease in PGRE's share of Same Store NOI (1) |
|
| (3.5 | %) |
|
| (1.5 | %) |
|
| 0.5 | % | ||||||
|
|
|
|
|
|
|
|
|
|
|
|
|
|
|
|
|
|
| |||
|
| Financial Assumptions (at share): |
|
|
|
|
|
|
|
|
| ||||||||||
|
|
| Estimated net loss |
| $ | (25,500 | ) |
| $ | (15,500 | ) |
| $ | (3,500 | ) | ||||||
|
|
|
| Depreciation and amortization |
| 215,500 |
|
|
| 215,500 |
|
|
| 2,500 |
| ||||||
|
|
|
| General and administrative expenses |
| 65,500 |
|
|
| 63,500 |
|
|
| 1,000 |
| ||||||
|
|
|
| Interest and debt expense, including amortization of deferred financing costs |
| 143,500 |
|
|
| 141,500 |
|
|
| 1,500 |
| ||||||
|
|
|
| Other, net (primarily non-cash gain on extinguishment of IPO related tax liability) |
| (12,000 | ) |
|
| (12,000 | ) |
|
| 1,000 |
| ||||||
|
|
|
| Fee and other income, net of income taxes |
| (33,000 | ) |
|
| (34,000 | ) |
|
| - |
| ||||||
|
|
| NOI (1) |
|
| 354,000 |
|
|
| 359,000 |
|
|
| 2,500 |
| ||||||
|
|
|
| Straight-line rent adjustments and above and below-market lease revenue, net |
| (20,000 | ) |
|
| (21,000 | ) |
|
| - |
| ||||||
|
|
| Cash NOI (1) |
| $ | 334,000 |
|
| $ | 338,000 |
|
| $ | 2,500 |
| ||||||
(1)
See page 54 for our definition of this measure.
(2)
Represents non-core items for the six months ended June 30, 2024, that are listed in the table on page 11. The Company is not making projections for non-core items that may impact its financial results for the remainder of 2024, which may include realized and unrealized gains or losses on real estate related fund investments, acquisition and transaction related costs and other items that are not included in Core FFO.
(3)
We are updating and narrowing our Estimated Core FFO Guidance for the full year of 2024, which is reconciled above to estimated net loss attributable to common stockholders per diluted share in accordance with accounting principles generally accepted in the United States of America (“GAAP”). The estimated net loss attributable to common stockholders per diluted share is not a projection and is being provided solely to satisfy the disclosure requirements of the U.S. Securities and Exchange Commission (“SEC”). Except as described above, these estimates reflect management’s view of current and future market conditions, including assumptions with respect to rental rates, occupancy levels and the earnings impact of the events referenced in our earnings release issued on July 31, 2024 and otherwise to be referenced during our conference call scheduled for August 1, 2024. These estimates do not include the impact on operating results from possible future property acquisitions or dispositions, or realized and unrealized gains and losses on real estate related fund investments. There can be no assurance that our actual results will not differ materially from the estimates set forth above.
- 6 -
| FINANCIAL HIGHLIGHTS |

(unaudited and in thousands, except per share amounts)
|
|
|
| Three Months Ended |
|
| Six Months Ended |
| ||||||||||||||
SELECTED FINANCIAL DATA |
| June 30, 2024 |
|
| June 30, 2023 |
|
| March 31, 2024 |
|
| June 30, 2024 |
|
| June 30, 2023 |
| |||||||
| Net (loss) income per share - basic and diluted | $ | (0.04 | ) |
| $ | (0.22 | ) |
| $ | 0.05 |
|
| $ | 0.01 |
|
| $ | (0.21 | ) | ||
|
|
|
|
|
|
|
|
|
|
|
|
|
|
|
|
|
| |||||
| Core FFO (1) per share - diluted | $ | 0.20 |
|
| $ | 0.17 |
|
| $ | 0.22 |
|
| $ | 0.42 |
|
| $ | 0.42 |
| ||
|
|
|
|
|
|
|
|
|
|
|
|
|
|
|
|
|
| |||||
| PGRE's share of Adjusted EBITDAre (1) | $ | 82,032 |
|
| $ | 71,184 |
|
| $ | 86,921 |
|
| $ | 168,953 |
|
| $ | 160,275 |
| ||
|
|
|
|
|
|
|
|
|
|
|
|
|
|
|
|
|
| |||||
| PGRE's share of Cash NOI (1) | $ | 86,543 |
|
| $ | 87,979 |
|
| $ | 88,977 |
|
| $ | 175,520 |
|
| $ | 177,779 |
| ||
|
|
|
|
|
|
|
|
|
|
|
|
|
|
|
|
|
| |||||
| PGRE's share of NOI (1) | $ | 90,636 |
|
| $ | 79,547 |
|
| $ | 93,583 |
|
| $ | 184,219 |
|
| $ | 175,748 |
| ||
|
|
|
|
|
|
|
|
|
|
|
|
|
|
|
|
|
| |||||
| Same Store % Change |
| Same Store Cash NOI (1) |
|
| Same Store NOI (1) |
|
|
|
|
|
|
|
|
|
| ||||||
|
|
|
|
|
|
|
|
|
|
|
|
|
|
|
|
|
| |||||
| Three Months Ended June 30, 2024 vs. June 30, 2023 |
| 0.1 | % |
|
| (1.3 | %) |
|
|
|
|
|
|
|
|
| |||||
|
|
|
|
|
|
|
|
|
|
|
|
|
|
|
|
|
| |||||
| Six Months Ended June 30, 2024 vs. June 30, 2023 |
| (0.7 | %) |
|
| (2.4 | %) |
|
|
|
|
|
|
|
|
| |||||
PORTFOLIO STATISTICS (at PGRE’s Share)
|
|
|
|
|
|
|
|
|
|
|
|
|
| % Change |
| |||||||||||||
|
|
|
|
|
|
|
|
|
|
|
|
|
| June 30, 2024 |
|
| June 30, 2024 |
|
| June 30, 2024 |
| |||||||
|
| 2024 |
|
| 2023 |
|
| vs. |
|
| vs. |
|
| vs. |
| |||||||||||||
Same Store Leased % (1) |
| June 30, |
|
| March 31, |
|
| December 31, |
|
| June 30, |
|
| March 31, 2024 |
|
| December 31, 2023 |
|
| June 30, 2023 |
| |||||||
New York |
|
| 86.9 | % |
|
| 90.1 | % |
|
| 90.2 | % |
|
| 90.5 | % |
|
| (3.2 | %) |
|
| (3.3 | %) |
|
| (3.6 | %) |
San Francisco |
|
| 84.2 | % |
|
| 85.5 | % |
|
| 89.8 | % |
|
| 91.6 | % |
|
| (1.3 | %) |
|
| (5.6 | %) |
|
| (7.4 | %) |
Weighted Average |
|
| 86.3 | % |
|
| 89.1 | % |
|
| 90.1 | % |
|
| 90.7 | % |
|
| (2.8 | %) |
|
| (3.8 | %) |
|
| (4.4 | %) |
(1)
See page 54 for our definition of this measure.
- 7 -
| CONSOLIDATED BALANCE SHEETS |
(unaudited and in thousands)
|
|
|
|
|
|
|
| June 30, 2024 |
|
| March 31, 2024 |
|
| December 31, 2023 |
| |||
Assets: |
|
|
|
|
|
|
|
| ||||||||||
| Real estate, at cost: |
|
|
|
|
|
|
|
| |||||||||
|
| Land | $ | 1,966,237 |
|
| $ | 1,966,237 |
|
| $ | 1,966,237 |
| |||||
|
| Buildings and improvements |
| 6,276,347 |
|
|
| 6,278,863 |
|
|
| 6,250,379 |
| |||||
|
|
|
|
|
|
|
|
| 8,242,584 |
|
|
| 8,245,100 |
|
|
| 8,216,616 |
|
|
| Accumulated depreciation and amortization |
| (1,550,341 | ) |
|
| (1,524,078 | ) |
|
| (1,471,819 | ) | |||||
| Real estate, net |
| 6,692,243 |
|
|
| 6,721,022 |
|
|
| 6,744,797 |
| ||||||
| Cash and cash equivalents |
| 307,461 |
|
|
| 276,235 |
|
|
| 428,208 |
| ||||||
| Restricted cash |
| 164,639 |
|
|
| 171,776 |
|
|
| 81,391 |
| ||||||
| Accounts and other receivables |
| 13,917 |
|
|
| 16,048 |
|
|
| 18,053 |
| ||||||
| Real estate related fund investments |
| - |
|
|
| - |
|
|
| 775 |
| ||||||
| Investments in unconsolidated real estate related funds |
| 4,536 |
|
|
| 4,603 |
|
|
| 4,549 |
| ||||||
| Investments in unconsolidated joint ventures |
| 130,087 |
|
|
| 132,788 |
|
|
| 132,239 |
| ||||||
| Deferred rent receivable |
| 353,769 |
|
|
| 353,826 |
|
|
| 351,209 |
| ||||||
| Deferred charges, net |
| 105,812 |
|
|
| 107,407 |
|
|
| 108,751 |
| ||||||
| Intangible assets, net |
| 57,612 |
|
|
| 62,609 |
|
|
| 68,005 |
| ||||||
| Other assets |
| 71,788 |
|
|
| 83,411 |
|
|
| 68,238 |
| ||||||
Total assets | $ | 7,901,864 |
|
| $ | 7,929,725 |
|
| $ | 8,006,215 |
| |||||||
|
|
|
|
|
|
|
|
|
|
|
|
|
|
|
| |||
Liabilities: |
|
|
|
|
|
|
|
| ||||||||||
| Notes and mortgages payable, net | $ | 3,672,103 |
|
| $ | 3,669,850 |
|
| $ | 3,803,484 |
| ||||||
| Revolving credit facility |
| - |
|
|
| - |
|
|
| - |
| ||||||
| Accounts payable and accrued expenses |
| 110,789 |
|
|
| 115,038 |
|
|
| 114,463 |
| ||||||
| Dividends and distributions payable |
| 8,382 |
|
|
| 8,376 |
|
|
| 8,360 |
| ||||||
| Intangible liabilities, net |
| 24,125 |
|
|
| 26,026 |
|
|
| 28,003 |
| ||||||
| Other liabilities |
| 30,802 |
|
|
| 31,774 |
|
|
| 37,017 |
| ||||||
Total liabilities |
| 3,846,201 |
|
|
| 3,851,064 |
|
|
| 3,991,327 |
| |||||||
|
|
|
|
|
|
|
|
|
|
|
|
|
|
|
| |||
Equity: |
|
|
|
|
|
|
|
| ||||||||||
| Paramount Group, Inc. equity |
| 3,181,913 |
|
|
| 3,199,050 |
|
|
| 3,203,285 |
| ||||||
| Noncontrolling interests in: |
|
|
|
|
|
|
|
| |||||||||
|
| Consolidated joint ventures |
| 485,983 |
|
|
| 480,542 |
|
|
| 413,925 |
| |||||
|
| Consolidated real estate related funds |
| 93,340 |
|
|
| 103,886 |
|
|
| 110,589 |
| |||||
|
| Operating Partnership |
| 294,427 |
|
|
| 295,183 |
|
|
| 287,089 |
| |||||
Total equity |
| 4,055,663 |
|
|
| 4,078,661 |
|
|
| 4,014,888 |
| |||||||
|
|
|
|
|
|
|
|
|
|
|
|
|
|
|
| |||
Total liabilities and equity | $ | 7,901,864 |
|
| $ | 7,929,725 |
|
| $ | 8,006,215 |
| |||||||
- 8 -
| CONSOLIDATED STATEMENTS OF INCOME |

(unaudited and in thousands, except per share amounts)
|
|
|
|
|
| Three Months Ended |
|
| Six Months Ended |
|
| ||||||||||||||
|
|
|
|
|
| June 30, 2024 |
|
| June 30, 2023 |
|
| March 31, 2024 |
|
| June 30, 2024 |
|
| June 30, 2023 |
|
| |||||
Revenues: |
|
|
|
|
|
|
|
|
|
|
|
|
|
|
| ||||||||||
| Rental revenue (1) | $ | 179,678 |
|
| $ | 165,506 |
|
| $ | 179,723 |
|
| $ | 359,401 |
|
| $ | 347,219 |
|
| ||||
| Fee and other income (1) |
| 7,730 |
|
|
| 7,156 |
|
|
| 9,154 |
|
|
| 16,884 |
|
|
| 13,917 |
|
| ||||
Total revenues |
| 187,408 |
|
|
| 172,662 |
|
|
| 188,877 |
|
|
| 376,285 |
|
|
| 361,136 |
|
| |||||
|
|
|
|
|
|
|
|
|
|
|
|
|
|
|
|
|
|
|
|
| |||||
Expenses: |
|
|
|
|
|
|
|
|
|
|
|
|
|
|
| ||||||||||
| Operating |
| 74,192 |
|
|
| 71,078 |
|
|
| 71,740 |
|
|
| 145,932 |
|
|
| 141,387 |
|
| ||||
| Depreciation and amortization |
| 61,735 |
|
|
| 62,627 |
|
|
| 61,114 |
|
|
| 122,849 |
|
|
| 121,515 |
|
| ||||
| General and administrative |
| 16,632 |
|
|
| 16,224 |
|
|
| 16,634 |
|
|
| 33,266 |
|
|
| 30,847 |
|
| ||||
| Transaction related costs |
| 423 |
|
|
| 63 |
|
|
| 178 |
|
|
| 601 |
|
|
| 191 |
|
| ||||
Total expenses |
| 152,982 |
|
|
| 149,992 |
|
|
| 149,666 |
|
|
| 302,648 |
|
|
| 293,940 |
|
| |||||
|
|
|
|
|
|
|
|
|
|
|
|
|
|
|
|
|
|
|
|
| |||||
Other income (expense): |
|
|
|
|
|
|
|
|
|
|
|
|
|
|
| ||||||||||
| Loss from real estate related fund investments (1) |
| (27 | ) |
|
| (42,644 | ) |
|
| (43 | ) |
|
| (70 | ) |
|
| (39,094 | ) |
| ||||
| (Loss) income from unconsolidated real estate related funds |
| (15 | ) |
|
| 32 |
|
|
| 105 |
|
|
| 90 |
|
|
| (146 | ) |
| ||||
| Loss from unconsolidated joint ventures |
| (771 | ) |
|
| (28,402 | ) | (2) |
| (1,346 | ) |
|
| (2,117 | ) |
|
| (34,164 | ) | (2) | ||||
| Interest and other income, net (1) |
| 3,893 |
|
|
| 2,967 |
|
|
| 19,420 |
|
|
| 23,313 |
|
|
| 5,892 |
|
| ||||
| Interest and debt expense |
| (40,004 | ) |
|
| (36,879 | ) |
|
| (40,269 | ) |
|
| (80,273 | ) |
|
| (73,338 | ) |
| ||||
(Loss) income before income taxes |
| (2,498 | ) |
|
| (82,256 | ) |
|
| 17,078 |
|
|
| 14,580 |
|
|
| (73,654 | ) |
| |||||
| Income tax expense |
| (362 | ) |
|
| (573 | ) |
|
| (347 | ) |
|
| (709 | ) |
|
| (861 | ) |
| ||||
Net (loss) income |
| (2,860 | ) |
|
| (82,829 | ) |
|
| 16,731 |
|
|
| 13,871 |
|
|
| (74,515 | ) |
| |||||
Less net (income) loss attributable to noncontrolling interests in: |
|
|
|
|
|
|
|
|
|
|
|
|
|
|
| ||||||||||
| Consolidated joint ventures |
| (6,269 | ) |
|
| (5,351 | ) |
|
| (5,206 | ) |
|
| (11,475 | ) |
|
| (10,992 | ) |
| ||||
| Consolidated real estate related funds |
| 589 |
|
|
| 37,301 |
|
|
| (762 | ) |
|
| (173 | ) |
|
| 36,478 |
|
| ||||
| Operating Partnership |
| 721 |
|
|
| 3,341 |
|
|
| (898 | ) |
|
| (177 | ) |
|
| 3,220 |
|
| ||||
Net (loss) income attributable to common stockholders | $ | (7,819 | ) |
| $ | (47,538 | ) |
| $ | 9,865 |
|
| $ | 2,046 |
|
| $ | (45,809 | ) |
| |||||
| Per diluted share | $ | (0.04 | ) |
| $ | (0.22 | ) |
| $ | 0.05 |
|
| $ | 0.01 |
|
| $ | (0.21 | ) |
| ||||
(1)
See page 10 for details.
(2)
Includes our share of a non-cash real estate impairment loss of $24,734 related to 60 Wall Street. See pages 30 and 32 for details.
- 9 -
| SELECT INCOME STATEMENT DATA |

(unaudited and in thousands)
|
| Three Months Ended |
|
| Six Months Ended |
|
| ||||||||||||||
Rental Revenue: | June 30, 2024 |
|
| June 30, 2023 |
|
| March 31, 2024 |
|
| June 30, 2024 |
|
| June 30, 2023 |
|
| ||||||
| Property rentals | $ | 157,178 |
|
| $ | 156,015 |
|
| $ | 157,595 |
|
| $ | 314,773 |
|
| $ | 314,478 |
|
|
| Tenant reimbursements |
| 19,375 |
|
|
| 13,270 |
|
|
| 16,990 |
|
|
| 36,365 |
|
|
| 27,728 |
|
|
| Straight-line rent adjustments |
| 464 |
|
|
| (7,511 | ) | (1) |
| 2,854 |
|
|
| 3,318 |
|
|
| 245 |
| (1) |
| Amortization of above and below-market leases, net |
| 1,632 |
|
|
| 1,448 |
|
|
| 1,340 |
|
|
| 2,972 |
|
|
| 2,484 |
|
|
| Lease termination income |
| 1,029 |
|
|
| 2,284 |
|
|
| 944 |
|
|
| 1,973 |
|
|
| 2,284 |
|
|
Total rental revenue | $ | 179,678 |
|
| $ | 165,506 |
|
| $ | 179,723 |
|
| $ | 359,401 |
|
| $ | 347,219 |
|
| |
(1)
Includes non-cash straight-line rent receivable write-offs aggregating $13,906 comprised of (i) a $7,343 write-off related to the surrendered JPMorgan Chase space and (ii) a $6,563 write-off related to the terminated SVB Securities lease.
|
| Three Months Ended |
|
| Six Months Ended |
|
| ||||||||||||||
Fee and Other Income: | June 30, 2024 |
|
| June 30, 2023 |
|
| March 31, 2024 |
|
| June 30, 2024 |
|
| June 30, 2023 |
|
| ||||||
| Asset management | $ | 2,317 |
|
| $ | 2,326 |
|
| $ | 2,305 |
|
| $ | 4,622 |
|
| $ | 4,501 |
|
|
| Property management |
| 1,657 |
|
|
| 1,831 |
|
|
| 1,744 |
|
|
| 3,401 |
|
|
| 3,693 |
|
|
| Acquisition, disposition, leasing and other |
| 330 |
|
|
| 819 |
|
|
| 2,199 |
|
|
| 2,529 |
|
|
| 1,339 |
|
|
| Total fee income |
| 4,304 |
|
|
| 4,976 |
|
|
| 6,248 |
|
|
| 10,552 |
|
|
| 9,533 |
|
|
| Other (primarily parking income and tenant requested services, |
| 3,426 |
|
|
| 2,180 |
|
|
| 2,906 |
|
|
| 6,332 |
|
|
| 4,384 |
|
|
Total fee and other income | $ | 7,730 |
|
| $ | 7,156 |
|
| $ | 9,154 |
|
| $ | 16,884 |
|
| $ | 13,917 |
|
| |
|
| Three Months Ended |
|
| Six Months Ended |
|
| ||||||||||||||
Loss from Real Estate Related Fund Investments | June 30, 2024 |
|
| June 30, 2023 |
|
| March 31, 2024 |
|
| June 30, 2024 |
|
| June 30, 2023 |
|
| ||||||
| Net investment (loss) income | $ | (27 | ) |
| $ | 3,048 |
|
| $ | 732 |
|
| $ | 705 |
|
| $ | 7,709 |
|
|
| Net realized and unrealized losses |
| - |
|
|
| (45,692 | ) | (1) |
| (775 | ) |
|
| (775 | ) |
|
| (46,803 | ) | (1) |
Loss from real estate related fund investments | $ | (27 | ) |
| $ | (42,644 | ) |
| $ | (43 | ) |
| $ | (70 | ) |
| $ | (39,094 | ) |
| |
(1)
Represents realized and unrealized losses on real estate mezzanine loan investments made by Fund X, of which our share, net of amounts attributable to noncontrolling interests, was $5,950 and $6,094 for the three and six months ended June 30, 2023, respectively.
|
| Three Months Ended |
|
| Six Months Ended |
|
| ||||||||||||||
Interest and Other Income, net: | June 30, 2024 |
|
| June 30, 2023 |
|
| March 31, 2024 |
|
| June 30, 2024 |
|
| June 30, 2023 |
|
| ||||||
| Interest income, net | $ | 3,893 |
|
| $ | 2,967 |
|
| $ | 3,983 |
|
| $ | 7,876 |
|
| $ | 5,892 |
|
|
| Non-cash gain on extinguishment of IPO related tax liability |
| - |
|
|
| - |
|
|
| 15,437 |
|
|
| 15,437 |
|
|
| - |
|
|
Total interest and other income, net | $ | 3,893 |
|
| $ | 2,967 |
|
| $ | 19,420 |
|
| $ | 23,313 |
|
| $ | 5,892 |
|
| |
- 10 -
| FFO |

(unaudited and in thousands, except share and per share amounts)
|
|
|
|
| Three Months Ended |
|
| Six Months Ended |
| ||||||||||||||
|
|
|
|
| June 30, 2024 |
|
| June 30, 2023 |
|
| March 31, 2024 |
|
| June 30, 2024 |
|
| June 30, 2023 |
| |||||
Reconciliation of net (loss) income to FFO and Core FFO: |
|
|
|
|
|
|
|
|
|
|
|
|
|
|
| ||||||||
| Net (loss) income |
| $ | (2,860 | ) |
| $ | (82,829 | ) |
| $ | 16,731 |
|
| $ | 13,871 |
|
| $ | (74,515 | ) | ||
| Real estate depreciation and amortization (including our share of |
|
| 65,035 |
|
|
| 72,096 |
|
|
| 64,424 |
|
|
| 129,459 |
|
|
| 140,527 |
| ||
| Our share of a non-cash real estate impairment loss related to |
|
| - |
|
|
| 24,734 |
|
|
| - |
|
|
| - |
|
|
| 24,734 |
| ||
| Amounts attributable to noncontrolling interests in consolidated joint |
|
| (15,585 | ) |
|
| 22,406 |
|
|
| (15,885 | ) |
|
| (31,470 | ) |
|
| 6,401 |
| ||
| FFO attributable to the Operating Partnership |
|
| 46,590 |
|
|
| 36,407 |
|
|
| 65,270 |
|
|
| 111,860 |
|
|
| 97,147 |
| ||
| Amounts attributable to noncontrolling interests in the |
|
| (3,935 | ) |
|
| (2,390 | ) |
|
| (5,449 | ) |
|
| (9,384 | ) |
|
| (6,351 | ) | ||
| FFO attributable to common stockholders (1) |
| $ | 42,655 |
|
| $ | 34,017 |
|
| $ | 59,821 |
|
| $ | 102,476 |
|
| $ | 90,796 |
| ||
| Per diluted share |
| $ | 0.20 |
|
| $ | 0.16 |
|
| $ | 0.28 |
|
| $ | 0.47 |
|
| $ | 0.42 |
| ||
|
|
|
|
|
|
|
|
|
|
|
|
|
|
|
|
|
| ||||||
|
|
|
|
|
|
|
|
|
|
|
|
|
|
|
|
|
|
| |||||
| FFO attributable to the Operating Partnership |
| $ | 46,590 |
|
| $ | 36,407 |
|
| $ | 65,270 |
|
| $ | 111,860 |
|
| $ | 97,147 |
| ||
| Adjustments for non-core items: |
|
|
|
|
|
|
|
|
|
|
|
|
|
|
| |||||||
|
| Non-cash gain on extinguishment of IPO related tax liability |
| - |
|
|
| - |
|
|
| (15,437 | ) |
|
| (15,437 | ) |
|
| - |
| ||
|
| Non-core assets (2) |
| - |
|
|
| (1,660 | ) |
|
| - |
|
|
| - |
|
|
| (3,276 | ) | ||
|
| Our share of realized and unrealized gains and losses from |
| (692 | ) |
|
| 5,618 |
|
|
| 720 |
|
|
| 28 |
|
|
| 3,756 |
| ||
|
| Other, net (primarily adjustments related to unconsolidated |
|
| 1,537 |
|
|
| (642 | ) |
|
| 1,751 |
|
|
| 3,288 |
|
|
| 573 |
| |
| Core FFO attributable to the Operating Partnership |
|
| 47,435 |
|
|
| 39,723 |
|
|
| 52,304 |
|
|
| 99,739 |
|
|
| 98,200 |
| ||
| Amounts attributable to noncontrolling interests in the |
| (4,007 | ) |
|
| (2,608 | ) |
|
| (4,366 | ) |
|
| (8,373 | ) |
|
| (6,422 | ) | |||
| Core FFO attributable to common stockholders (1) |
| $ | 43,428 |
|
| $ | 37,115 |
|
| $ | 47,938 |
|
| $ | 91,366 |
|
| $ | 91,778 |
| ||
| Per diluted share |
| $ | 0.20 |
|
| $ | 0.17 |
|
| $ | 0.22 |
|
| $ | 0.42 |
|
| $ | 0.42 |
| ||
|
|
|
|
|
|
|
|
|
|
|
|
|
|
|
|
|
|
| |||||
Reconciliation of weighted average shares outstanding: |
|
|
|
|
|
|
|
|
|
|
|
|
|
|
| ||||||||
| Weighted average shares outstanding |
|
| 217,204,870 |
|
|
| 217,003,931 |
|
|
| 217,105,686 |
|
|
| 217,155,278 |
|
|
| 216,784,737 |
| ||
| Effect of dilutive securities |
|
| 27,125 |
|
|
| 11,089 |
|
|
| 80,723 |
|
|
| 53,699 |
|
|
| 31,669 |
| ||
| Denominator for FFO and Core FFO per diluted share |
|
| 217,231,995 |
|
|
| 217,015,020 |
|
|
| 217,186,409 |
|
|
| 217,208,977 |
|
|
| 216,816,406 |
| ||
(1)
See page 54 for our definition of this measure.
(2)
Represents Market Center and 111 Sutter Street.
- 11 -
| FAD |

(unaudited and in thousands)
|
|
|
|
|
| Three Months Ended |
|
| Six Months Ended |
| ||||||||||||||
|
|
|
|
|
| June 30, 2024 |
|
| June 30, 2023 |
|
| March 31, 2024 |
|
| June 30, 2024 |
|
| June 30, 2023 |
| |||||
Reconciliation of Core FFO to FAD: |
|
|
|
|
|
|
|
|
|
|
|
|
|
| ||||||||||
| Core FFO attributable to the Operating Partnership | $ | 47,435 |
|
| $ | 39,723 |
|
| $ | 52,304 |
|
| $ | 99,739 |
|
| $ | 98,200 |
| ||||
| Adjustments to arrive at FAD (including our share of |
|
|
|
|
|
|
|
|
|
|
|
|
|
| |||||||||
|
| Straight-line rent |
| (1,116 | ) |
|
| 7,515 |
|
|
| (3,387 | ) |
|
| (4,503 | ) |
|
| (176 | ) | |||
|
| Amortization of above and below-market leases, net |
| (1,949 | ) |
|
| (2,239 | ) |
|
| (1,658 | ) |
|
| (3,607 | ) |
|
| (4,077 | ) | |||
|
| Amortization of deferred financing costs |
| 2,703 |
|
|
| 1,779 |
|
|
| 2,443 |
|
|
| 5,146 |
|
|
| 3,672 |
| |||
|
| Amortization of stock-based compensation expense |
| 5,068 |
|
|
| 4,214 |
|
|
| 6,194 |
|
|
| 11,262 |
|
|
| 9,331 |
| |||
|
| Expenditures to maintain assets |
| (9,182 | ) |
|
| (20,117 | ) |
|
| (10,944 | ) |
|
| (20,126 | ) |
|
| (25,779 | ) | |||
|
| Second generation tenant improvements |
| (11,814 | ) |
|
| (6,548 | ) |
|
| (25,370 | ) |
|
| (37,184 | ) |
|
| (19,086 | ) | |||
|
| Non-core assets (1) |
| - |
|
|
| 1,591 |
|
|
| - |
|
|
| - |
|
|
| 2,138 |
| |||
|
| Amounts attributable to noncontrolling interests in |
| (682 | ) |
|
| 4,538 |
|
|
| 4,311 |
|
|
| 3,629 |
|
|
| 12,623 |
| |||
| FAD attributable to the Operating Partnership |
| 30,463 |
|
|
| 30,456 |
|
|
| 23,893 |
|
|
| 54,356 |
|
|
| 76,846 |
| ||||
| Amounts attributable to noncontrolling interests in the |
| (2,573 | ) |
|
| (1,999 | ) |
|
| (1,995 | ) |
|
| (4,568 | ) |
|
| (5,024 | ) | ||||
| FAD attributable to common stockholders (2) (3) | $ | 27,890 |
|
| $ | 28,457 |
|
| $ | 21,898 |
|
| $ | 49,788 |
|
| $ | 71,822 |
| ||||
|
|
|
|
|
|
|
|
|
|
|
|
|
|
|
|
|
|
|
| |||||
| Dividends declared on common stock | $ | 7,611 |
|
| $ | 7,606 |
|
| $ | 7,607 |
|
| $ | 15,218 |
|
| $ | 24,440 |
| ||||
|
|
|
|
|
|
|
|
|
|
|
|
|
|
|
|
|
|
|
| |||||
| FAD payout ratio (2) |
| 27.3 | % |
|
| 26.7 | % |
|
| 34.7 | % |
|
| 30.6 | % |
|
| 34.0 | % | ||||
(1)
Represents Market Center and 111 Sutter Street.
(2)
See page 54 for our definition of this measure.
(3)
FAD attributable to common stockholders and FAD payout ratios are not necessarily indicative of future FAD amounts or future FAD payout ratios due to fluctuations in the timing of payments for tenant improvements and leasing commissions versus rents received from leases for which such costs are incurred.
- 12 -
| EBITDAre |

(unaudited and in thousands)
|
|
|
|
|
| Three Months Ended |
|
| Six Months Ended |
| ||||||||||||||
|
|
|
|
|
| June 30, 2024 |
|
| June 30, 2023 |
|
| March 31, 2024 |
|
| June 30, 2024 |
|
| June 30, 2023 |
| |||||
Reconciliation of net (loss) income to EBITDAre and |
|
|
|
|
|
|
|
|
|
|
|
|
|
| ||||||||||
| Net (loss) income | $ | (2,860 | ) |
| $ | (82,829 | ) |
| $ | 16,731 |
|
| $ | 13,871 |
|
| $ | (74,515 | ) | ||||
| Adjustments to arrive at EBITDAre (including our share of |
|
|
|
|
|
|
|
|
|
|
|
|
|
| |||||||||
|
| Depreciation and amortization |
| 65,035 |
|
|
| 72,096 |
|
|
| 64,424 |
|
|
| 129,459 |
|
|
| 140,527 |
| |||
|
| Interest and debt expense |
| 42,258 |
|
|
| 42,746 |
|
|
| 42,787 |
|
|
| 85,045 |
|
|
| 86,419 |
| |||
|
| Our share of a non-cash real estate impairment loss |
| - |
|
|
| 24,734 |
|
|
| - |
|
|
| - |
|
|
| 24,734 |
| |||
|
| Income tax expense |
| 363 |
|
|
| 580 |
|
|
| 351 |
|
|
| 714 |
|
|
| 873 |
| |||
|
| Amounts attributable to noncontrolling interests in |
| (23,566 | ) |
|
| 14,935 |
|
|
| (23,938 | ) |
|
| (47,504 | ) |
|
| (10,113 | ) | |||
| PGRE's share of EBITDAre (1) | $ | 81,230 |
|
| $ | 72,262 |
|
| $ | 100,355 |
|
|
| 181,585 |
|
|
| 167,925 |
| ||||
| Adjustments to arrive at Adjusted EBITDAre: |
| ||||||||||||||||||||||
|
| Non-cash gain on extinguishment of IPO related |
| - |
|
|
| - |
|
|
| (15,437 | ) |
|
| (15,437 | ) |
|
| - |
| |||
|
| Non-core assets (2) |
| - |
|
|
| (5,433 | ) |
|
| - |
|
|
| - |
|
|
| (10,730 | ) | |||
|
| Our share of EBITDAre from consolidated and |
| (735 | ) |
|
| 4,842 |
|
|
| 516 |
|
|
| (219 | ) |
|
| 3,654 |
| |||
|
| Other, net (primarily adjustments related to |
| 1,537 |
|
|
| (487 | ) |
|
| 1,487 |
|
|
| 3,024 |
|
|
| (574 | ) | |||
| PGRE's share of Adjusted EBITDAre (1) | $ | 82,032 |
|
| $ | 71,184 |
|
| $ | 86,921 |
|
|
| 168,953 |
|
|
| 160,275 |
| ||||
(1)
See page 54 for our definition of this measure.
(2)
Represents Market Center and 111 Sutter Street.
- 13 -
| NOI |

(unaudited and in thousands)
|
|
|
|
|
| Three Months Ended |
|
| Six Months Ended |
| ||||||||||||||
|
|
|
|
|
| June 30, 2024 |
|
| June 30, 2023 |
|
| March 31, 2024 |
|
| June 30, 2024 |
|
| June 30, 2023 |
| |||||
Reconciliation of net (loss) income to NOI and Cash NOI: |
|
|
|
|
|
|
|
|
|
|
|
|
| |||||||||||
| Net (loss) income | $ | (2,860 | ) |
| $ | (82,829 | ) |
| $ | 16,731 |
|
| $ | 13,871 |
|
| $ | (74,515 | ) | ||||
| Adjustments to arrive at NOI: |
| ||||||||||||||||||||||
|
| Fee income |
| (4,304 | ) |
|
| (4,976 | ) |
|
| (6,248 | ) |
|
| (10,552 | ) |
|
| (9,533 | ) | |||
|
| Depreciation and amortization |
| 61,735 |
|
|
| 62,627 |
|
|
| 61,114 |
|
|
| 122,849 |
|
|
| 121,515 |
| |||
|
| General and administrative |
| 16,632 |
|
|
| 16,224 |
|
|
| 16,634 |
|
|
| 33,266 |
|
|
| 30,847 |
| |||
|
| Loss from real estate related fund investments |
| 27 |
|
|
| 42,644 |
|
|
| 43 |
|
|
| 70 |
|
|
| 39,094 |
| |||
|
| Loss from unconsolidated joint ventures |
| 771 |
|
|
| 28,402 |
|
|
| 1,346 |
|
|
| 2,117 |
|
|
| 34,164 |
| |||
|
| NOI from unconsolidated joint ventures (excluding |
| 5,625 |
|
|
| 10,720 |
|
|
| 5,602 |
|
|
| 11,227 |
|
|
| 21,101 |
| |||
|
| Interest and other income, net |
| (3,893 | ) |
|
| (2,967 | ) |
|
| (19,420 | ) |
|
| (23,313 | ) |
|
| (5,892 | ) | |||
|
| Interest and debt expense |
| 40,004 |
|
|
| 36,879 |
|
|
| 40,269 |
|
|
| 80,273 |
|
|
| 73,338 |
| |||
|
| Income tax expense |
| 362 |
|
|
| 573 |
|
|
| 347 |
|
|
| 709 |
|
|
| 861 |
| |||
|
| Non-core assets (1) |
| - |
|
|
| (5,217 | ) |
|
| - |
|
|
| - |
|
|
| (10,293 | ) | |||
|
| Other, net |
| 438 |
|
|
| 31 |
|
|
| 73 |
|
|
| 511 |
|
|
| 337 |
| |||
|
| Amounts attributable to noncontrolling interests in |
| (23,901 | ) |
|
| (22,564 | ) |
|
| (22,908 | ) |
|
| (46,809 | ) |
|
| (45,276 | ) | |||
| PGRE's share of NOI (2) | $ | 90,636 |
|
| $ | 79,547 |
|
| $ | 93,583 |
|
| $ | 184,219 |
|
| $ | 175,748 |
| ||||
| Adjustments to arrive at Cash NOI: |
|
|
|
|
|
|
|
|
|
|
|
|
|
| |||||||||
|
| Straight-line rent (including our share of |
| (1,116 | ) |
|
| 7,515 |
|
|
| (3,387 | ) |
|
| (4,503 | ) |
|
| (176 | ) | |||
|
| Amortization of above and below-market leases, net |
| (1,949 | ) |
|
| (2,239 | ) |
|
| (1,658 | ) |
|
| (3,607 | ) |
|
| (4,077 | ) | |||
|
| Non-core assets (1) |
| - |
|
|
| 299 |
|
|
| - |
|
|
| - |
|
|
| 560 |
| |||
|
| Amounts attributable to noncontrolling interests in |
| (1,028 | ) |
|
| 2,857 |
|
|
| 439 |
|
|
| (589 | ) |
|
| 5,724 |
| |||
| PGRE's share of Cash NOI (2) | $ | 86,543 |
|
| $ | 87,979 |
|
| $ | 88,977 |
|
| $ | 175,520 |
|
| $ | 177,779 |
| ||||
(1)
Represents Market Center and 111 Sutter Street.
(2)
See page 54 for our definition of this measure.
- 14 -
| NOI |
(unaudited and in thousands)
|
|
|
|
|
| Three Months Ended June 30, 2024 |
| |||||||||||||
|
|
|
|
|
| Total |
|
| New York |
|
| San Francisco |
|
| Other |
| ||||
Reconciliation of net (loss) income to NOI and Cash NOI: |
|
|
|
|
|
|
|
|
|
| ||||||||||
| Net (loss) income | $ | (2,860 | ) |
| $ | (4,941 | ) |
| $ | 16,268 |
|
| $ | (14,187 | ) | ||||
| Adjustments to arrive at NOI: |
|
|
|
|
|
|
|
|
|
| |||||||||
|
| Fee income |
| (4,304 | ) |
|
| - |
|
|
| - |
|
|
| (4,304 | ) | |||
|
| Depreciation and amortization |
| 61,735 |
|
|
| 41,910 |
|
|
| 18,662 |
|
|
| 1,163 |
| |||
|
| General and administrative |
| 16,632 |
|
|
| - |
|
|
| - |
|
|
| 16,632 |
| |||
|
| Loss from real estate related fund investments |
| 27 |
|
|
| - |
|
|
| - |
|
|
| 27 |
| |||
|
| Loss (income) from unconsolidated joint ventures |
| 771 |
|
|
| (56 | ) |
|
| 63 |
|
|
| 764 |
| |||
|
| NOI from unconsolidated joint ventures (excluding One Steuart Lane) |
| 5,625 |
|
|
| 3,480 |
|
|
| 2,063 |
|
|
| 82 |
| |||
|
| Interest and other income, net |
| (3,893 | ) |
|
| (1,031 | ) |
|
| (295 | ) |
|
| (2,567 | ) | |||
|
| Interest and debt expense |
| 40,004 |
|
|
| 26,526 |
|
|
| 12,719 |
|
|
| 759 |
| |||
|
| Income tax expense |
| 362 |
|
|
| 8 |
|
|
| 79 |
|
|
| 275 |
| |||
|
| Other, net |
| 438 |
|
|
| - |
|
|
| - |
|
|
| 438 |
| |||
|
| Amounts attributable to noncontrolling interests in consolidated joint ventures |
| (23,901 | ) |
|
| (2,500 | ) |
|
| (21,401 | ) |
|
| - |
| |||
| PGRE's share of NOI (1) for the three months ended June 30, 2024 | $ | 90,636 |
|
| $ | 63,396 |
|
| $ | 28,158 |
|
| $ | (918 | ) | ||||
| PGRE's share of NOI (1) for the three months ended June 30, 2023 | $ | 79,547 |
|
| $ | 58,813 |
|
| $ | 21,414 |
|
| $ | (680 | ) | ||||
|
|
|
|
|
|
|
|
|
|
|
|
|
|
|
|
| ||||
| PGRE's share of NOI for the three months ended June 30, 2024 | $ | 90,636 |
|
| $ | 63,396 |
|
| $ | 28,158 |
|
| $ | (918 | ) | ||||
| Adjustments to arrive at Cash NOI: |
|
|
|
|
|
|
|
|
|
|
| ||||||||
|
| Straight-line rent (including our share of unconsolidated joint ventures) |
| (1,116 | ) |
|
| (4,266 | ) |
|
| 3,327 |
|
|
| (177 | ) | |||
|
| Amortization of above and below-market leases, net (including our share of |
| (1,949 | ) |
|
| (893 | ) |
|
| (1,056 | ) |
|
| - |
| |||
|
| Amounts attributable to noncontrolling interests in |
| (1,028 | ) |
|
| (153 | ) |
|
| (875 | ) |
|
| - |
| |||
| PGRE's share of Cash NOI (1) for the three months ended June 30, 2024 | $ | 86,543 |
|
| $ | 58,084 |
|
| $ | 29,554 |
|
| $ | (1,095 | ) | ||||
| PGRE's share of Cash NOI (1) for the three months ended June 30, 2023 | $ | 87,979 |
|
| $ | 63,056 |
|
| $ | 25,865 |
|
| $ | (942 | ) | ||||
(1)
See page 54 for our definition of this measure.
- 15 -
| NOI |
(unaudited and in thousands)
|
|
|
|
|
| Six Months Ended June 30, 2024 |
| |||||||||||||
|
|
|
|
|
| Total |
|
| New York |
|
| San Francisco |
|
| Other |
| ||||
Reconciliation of net income (loss) to NOI and Cash NOI: |
|
|
|
|
|
|
|
|
|
| ||||||||||
| Net income (loss) | $ | 13,871 |
|
| $ | (6,219 | ) |
| $ | 29,257 |
|
| $ | (9,167 | ) | ||||
| Adjustments to arrive at NOI: |
|
|
|
|
|
|
|
|
|
| |||||||||
|
| Fee income |
| (10,552 | ) |
|
| - |
|
|
| - |
|
|
| (10,552 | ) | |||
|
| Depreciation and amortization |
| 122,849 |
|
|
| 83,204 |
|
|
| 37,232 |
|
|
| 2,413 |
| |||
|
| General and administrative |
| 33,266 |
|
|
| - |
|
|
| - |
|
|
| 33,266 |
| |||
|
| Loss from real estate related fund investments |
| 70 |
|
|
| - |
|
|
| - |
|
|
| 70 |
| |||
|
| Loss from unconsolidated joint ventures |
| 2,117 |
|
|
| 1,630 |
|
|
| 365 |
|
|
| 122 |
| |||
|
| NOI from unconsolidated joint ventures (excluding One Steuart Lane) |
| 11,227 |
|
|
| 7,035 |
|
|
| 4,110 |
|
|
| 82 |
| |||
|
| Interest and other income, net |
| (23,313 | ) |
|
| (1,824 | ) |
|
| (681 | ) |
|
| (20,808 | ) | |||
|
| Interest and debt expense |
| 80,273 |
|
|
| 53,099 |
|
|
| 25,664 |
|
|
| 1,510 |
| |||
|
| Income tax expense |
| 709 |
|
|
| 16 |
|
|
| 84 |
|
|
| 609 |
| |||
|
| Other, net |
| 511 |
|
|
| - |
|
|
| - |
|
|
| 511 |
| |||
|
| Amounts attributable to noncontrolling interests in consolidated joint ventures |
| (46,809 | ) |
|
| (5,176 | ) |
|
| (41,633 | ) |
|
| - |
| |||
| PGRE's share of NOI (1) for the six months ended June 30, 2024 | $ | 184,219 |
|
| $ | 131,765 |
|
| $ | 54,398 |
|
| $ | (1,944 | ) | ||||
| PGRE's share of NOI (1) for the six months ended June 30, 2023 | $ | 175,748 |
|
| $ | 127,258 |
|
| $ | 50,302 |
|
| $ | (1,812 | ) | ||||
|
|
|
|
|
|
|
|
|
|
|
|
|
|
|
|
| ||||
| PGRE's share of NOI for the six months ended June 30, 2024 | $ | 184,219 |
|
| $ | 131,765 |
|
| $ | 54,398 |
|
| $ | (1,944 | ) | ||||
| Adjustments to arrive at Cash NOI: |
|
|
|
|
|
|
|
|
|
|
| ||||||||
|
| Straight-line rent (including our share of unconsolidated joint ventures) |
| (4,503 | ) |
|
| (8,175 | ) |
|
| 3,743 |
|
|
| (71 | ) | |||
|
| Amortization of above and below-market leases, net (including our share of |
| (3,607 | ) |
|
| (1,508 | ) |
|
| (2,099 | ) |
|
| - |
| |||
|
| Amounts attributable to noncontrolling interests in |
| (589 | ) |
|
| (265 | ) |
|
| (324 | ) |
|
| - |
| |||
| PGRE's share of Cash NOI (1) for the six months ended June 30, 2024 | $ | 175,520 |
|
| $ | 121,817 |
|
| $ | 55,718 |
|
| $ | (2,015 | ) | ||||
| PGRE's share of Cash NOI (1) for the six months ended June 30, 2023 | $ | 177,779 |
|
| $ | 128,002 |
|
| $ | 51,529 |
|
| $ | (1,752 | ) | ||||
(1)
See page 54 for our definition of this measure.
- 16 -
| SAME STORE CASH NOI |

(unaudited and in thousands)
SAME STORE CASH NOI (1) | Three Months Ended June 30, 2024 |
| |||||||||||||||||||
|
|
|
|
|
|
| Total |
|
| New York |
|
| San Francisco |
|
| Other |
| ||||
| PGRE's share of Cash NOI for the three months ended June 30, 2024 | $ | 86,543 |
|
| $ | 58,084 |
|
| $ | 29,554 |
|
| $ | (1,095 | ) | |||||
|
| Non-same store adjustments: |
|
|
|
|
|
|
|
|
|
|
| ||||||||
|
| Lease termination income |
| (1,029 | ) |
|
| (1,029 | ) |
|
| - |
|
|
| - |
| ||||
|
| Other, net |
| 1,476 |
|
|
| 372 |
|
|
| 9 |
|
|
| 1,095 |
| ||||
| PGRE's share of Same Store Cash NOI for the three months ended |
|
|
|
|
|
|
|
|
|
|
| |||||||||
|
| June 30, 2024 | $ | 86,990 |
|
| $ | 57,427 |
|
| $ | 29,563 |
|
| $ | - |
| ||||
|
|
|
|
|
|
|
|
|
|
|
|
|
|
|
|
|
| ||||
|
|
|
|
|
|
|
|
|
|
|
|
|
|
|
|
|
| ||||
|
|
|
|
|
|
|
|
|
|
|
|
|
|
|
|
|
| ||||
|
|
|
|
|
|
| Three Months Ended June 30, 2023 |
| |||||||||||||
|
|
|
|
|
|
| Total |
|
| New York |
|
| San Francisco |
|
| Other |
| ||||
| PGRE's share of Cash NOI for the three months ended June 30, 2023 | $ | 87,979 |
|
| $ | 63,056 |
|
| $ | 25,865 |
|
| $ | (942 | ) | |||||
|
| Non-same store adjustments: |
|
|
|
|
|
|
|
|
|
|
| ||||||||
|
| Lease termination income |
| (2,055 | ) |
|
| (2,055 | ) |
|
| - |
|
|
| - |
| ||||
|
| Other, net |
| 948 |
|
|
| 6 |
|
|
| - |
|
|
| 942 |
| ||||
| PGRE's share of Same Store Cash NOI for the three months ended |
|
|
|
|
|
|
|
|
|
|
| |||||||||
|
| June 30, 2023 | $ | 86,872 |
|
| $ | 61,007 |
|
| $ | 25,865 |
|
| $ | - |
| ||||
|
|
|
|
|
|
|
|
|
|
|
|
|
|
|
|
| |||||
|
|
|
|
|
|
|
|
|
|
|
|
|
|
|
|
| |||||
| % Increase (decrease) |
| 0.1 | % |
|
| (5.9 | %) |
|
| 14.3 | % |
|
|
| ||||||
(1)
See page 54 for our definition of this measure.
- 17 -
| SAME STORE CASH NOI |
(unaudited and in thousands)
SAME STORE CASH NOI (1) | Six Months Ended June 30, 2024 |
| |||||||||||||||||||
|
|
|
|
|
|
| Total |
|
| New York |
|
| San Francisco |
|
| Other |
| ||||
| PGRE's share of Cash NOI for the six months ended June 30, 2024 | $ | 175,520 |
|
| $ | 121,817 |
|
| $ | 55,718 |
|
| $ | (2,015 | ) | |||||
|
| Non-same store adjustments: |
|
|
|
|
|
|
|
|
|
|
| ||||||||
|
| Lease termination income |
| (1,973 | ) |
|
| (1,973 | ) |
|
| - |
|
|
| - |
| ||||
|
| Other, net |
| 2,674 |
|
|
| 650 |
|
|
| 9 |
|
|
| 2,015 |
| ||||
| PGRE's share of Same Store Cash NOI for the six months ended |
|
|
|
|
|
|
|
|
|
|
| |||||||||
|
| June 30, 2024 | $ | 176,221 |
|
| $ | 120,494 |
|
| $ | 55,727 |
|
| $ | - |
| ||||
|
|
|
|
|
|
|
|
|
|
|
|
|
|
|
|
|
| ||||
|
|
|
|
|
|
|
|
|
|
|
|
|
|
|
|
|
| ||||
|
|
|
|
|
|
|
|
|
|
|
|
|
|
|
|
|
| ||||
|
|
|
|
|
|
| Six Months Ended June 30, 2023 |
| |||||||||||||
|
|
|
|
|
|
| Total |
|
| New York |
|
| San Francisco |
|
| Other |
| ||||
| PGRE's share of Cash NOI for the six months ended June 30, 2023 | $ | 177,779 |
|
| $ | 128,002 |
|
| $ | 51,529 |
|
| $ | (1,752 | ) | |||||
|
| Non-same store adjustments: |
|
|
|
|
|
|
|
|
|
|
| ||||||||
|
| Lease termination income |
| (2,055 | ) |
|
| (2,055 | ) |
|
| - |
|
|
| - |
| ||||
|
| Other, net |
| 1,763 |
|
|
| 11 |
|
|
| - |
|
|
| 1,752 |
| ||||
| PGRE's share of Same Store Cash NOI for the six months ended |
|
|
|
|
|
|
|
|
|
|
| |||||||||
|
| June 30, 2023 | $ | 177,487 |
|
| $ | 125,958 |
|
| $ | 51,529 |
|
| $ | - |
| ||||
|
|
|
|
|
|
|
|
|
|
|
|
|
|
|
|
| |||||
|
|
|
|
|
|
|
|
|
|
|
|
|
|
|
|
| |||||
| % (Decrease) increase |
| (0.7 | %) |
|
| (4.3 | %) |
|
| 8.1 | % |
|
|
| ||||||
(1)
See page 54 for our definition of this measure.
- 18 -
| SAME STORE NOI |
(unaudited and in thousands)
SAME STORE NOI (1) | Three Months Ended June 30, 2024 |
| ||||||||||||||||||||
|
|
|
|
|
|
|
| Total |
|
| New York |
|
| San Francisco |
|
| Other |
| ||||
| PGRE's share of NOI for the three months ended June 30, 2024 | $ | 90,636 |
|
| $ | 63,396 |
|
| $ | 28,158 |
|
| $ | (918 | ) | ||||||
|
| Non-same store adjustments: |
|
|
|
|
|
|
|
|
|
|
|
| ||||||||
|
| Lease termination income |
| (1,029 | ) |
|
| (1,029 | ) |
|
| - |
|
|
| - |
| |||||
|
| Other, net |
| 1,299 |
|
|
| 372 |
|
|
| 9 |
|
|
| 918 |
| |||||
| PGRE's share of Same Store NOI for the three months ended |
|
|
|
|
|
|
|
|
|
|
| ||||||||||
|
| June 30, 2024 | $ | 90,906 |
|
| $ | 62,739 |
|
| $ | 28,167 |
|
| $ | - |
| |||||
|
|
|
|
|
|
|
|
|
|
|
|
|
|
|
|
|
|
| ||||
|
|
|
|
|
|
|
|
|
|
|
|
|
|
|
|
|
|
| ||||
|
|
|
|
|
|
|
|
|
|
|
|
|
|
|
|
|
|
| ||||
|
|
|
|
|
|
|
| Three Months Ended June 30, 2023 |
| |||||||||||||
|
|
|
|
|
|
|
| Total |
|
| New York |
|
| San Francisco |
|
| Other |
| ||||
| PGRE's share of NOI for the three months ended June 30, 2023 | $ | 79,547 |
|
| $ | 58,813 |
|
| $ | 21,414 |
|
| $ | (680 | ) | ||||||
|
| Non-same store adjustments: |
|
|
|
|
|
|
|
|
|
|
|
| ||||||||
|
| Lease termination income |
| (2,055 | ) |
|
| (2,055 | ) |
|
| - |
|
|
| - |
| |||||
|
| Non-cash write-offs of straight-line rent receivables |
| 13,906 |
|
|
| 6,563 |
| (2) |
| 7,343 |
| (2) |
| - |
| |||||
|
| Other, net |
| 686 |
|
|
| 6 |
|
|
| - |
|
|
| 680 |
| |||||
| PGRE's share of Same Store NOI for the three months ended |
|
|
|
|
|
|
|
|
|
|
| ||||||||||
|
| June 30, 2023 | $ | 92,084 |
|
| $ | 63,327 |
|
| $ | 28,757 |
|
| $ | - |
| |||||
|
|
|
|
|
|
|
|
|
|
|
|
|
|
|
|
|
|
| ||||
|
|
|
|
|
|
|
|
|
|
|
|
|
|
|
|
|
|
| ||||
| % Decrease |
| (1.3 | %) |
|
| (0.9 | %) |
|
| (2.1 | %) |
|
|
| |||||||
(1)
See page 54 for our definition of this measure.
(2)
Represents write-offs related to the terminated SVB Securities lease at 1301 Avenue of the Americas in our New York portfolio and the surrendered JPMorgan Chase space at One Front Street in our San Francisco portfolio.
- 19 -
| SAME STORE NOI |
(unaudited and in thousands)
SAME STORE NOI (1) | Six Months Ended June 30, 2024 |
| ||||||||||||||||||||
|
|
|
|
|
|
|
| Total |
|
| New York |
|
| San Francisco |
|
| Other |
| ||||
| PGRE's share of NOI for the six months ended June 30, 2024 | $ | 184,219 |
|
| $ | 131,765 |
|
| $ | 54,398 |
|
| $ | (1,944 | ) | ||||||
|
| Non-same store adjustments: |
|
|
|
|
|
|
|
|
|
|
|
| ||||||||
|
| Lease termination income |
| (1,973 | ) |
|
| (1,973 | ) |
|
| - |
|
|
| - |
| |||||
|
| Other, net |
| 2,603 |
|
|
| 650 |
|
|
| 9 |
|
|
| 1,944 |
| |||||
| PGRE's share of Same Store NOI for the six months ended |
|
|
|
|
|
|
|
|
|
|
| ||||||||||
|
| June 30, 2024 | $ | 184,849 |
|
| $ | 130,442 |
|
| $ | 54,407 |
|
| $ | - |
| |||||
|
|
|
|
|
|
|
|
|
|
|
|
|
|
|
|
|
|
| ||||
|
|
|
|
|
|
|
|
|
|
|
|
|
|
|
|
|
|
| ||||
|
|
|
|
|
|
|
|
|
|
|
|
|
|
|
|
|
|
| ||||
|
|
|
|
|
|
|
| Six Months Ended June 30, 2023 |
| |||||||||||||
|
|
|
|
|
|
|
| Total |
|
| New York |
|
| San Francisco |
|
| Other |
| ||||
| PGRE's share of NOI for the six months ended June 30, 2023 | $ | 175,748 |
|
| $ | 127,258 |
|
| $ | 50,302 |
|
| $ | (1,812 | ) | ||||||
|
| Non-same store adjustments: |
|
|
|
|
|
|
|
|
|
|
|
| ||||||||
|
| Lease termination income |
| (2,055 | ) |
|
| (2,055 | ) |
|
| - |
|
|
| - |
| |||||
|
| Non-cash write-offs of straight-line rent receivables |
| 13,906 |
|
|
| 6,563 |
| (2) |
| 7,343 |
| (2) |
| - |
| |||||
|
| Other, net |
| 1,823 |
|
|
| 11 |
|
|
| - |
|
|
| 1,812 |
| |||||
| PGRE's share of Same Store NOI for the six months ended |
|
|
|
|
|
|
|
|
|
|
| ||||||||||
|
| June 30, 2023 | $ | 189,422 |
|
| $ | 131,777 |
|
| $ | 57,645 |
|
| $ | - |
| |||||
|
|
|
|
|
|
|
|
|
|
|
|
|
|
|
|
|
|
| ||||
|
|
|
|
|
|
|
|
|
|
|
|
|
|
|
|
|
|
| ||||
| % Decrease |
| (2.4 | %) |
|
| (1.0 | %) |
|
| (5.6 | %) |
|
|
| |||||||
(1)
See page 54 for our definition of this measure.
(2)
Represents write-offs related to the terminated SVB Securities lease at 1301 Avenue of the Americas in our New York portfolio and the surrendered JPMorgan Chase space at One Front Street in our San Francisco portfolio.
- 20 -
| CONSOLIDATED JOINT VENTURES – BALANCE SHEETS |
(unaudited and in thousands)
|
|
|
| As of June 30, 2024 |
| |||||||||||||
|
|
|
| Total Consolidated |
|
| 1633 |
|
| One Market |
|
| 300 Mission |
| ||||
|
|
|
| Joint Ventures |
|
| Broadway |
|
| Plaza |
|
| Street |
| ||||
PGRE Ownership |
|
|
| 90.0% |
|
| 49.0% |
|
| 31.1% |
| |||||||
|
|
|
|
|
|
|
|
|
|
|
|
|
|
| ||||
Assets: |
|
|
|
|
|
|
|
|
|
|
| |||||||
| Real estate, net | $ | 3,241,357 |
|
| $ | 1,652,613 |
|
| $ | 1,125,631 |
|
| $ | 463,113 |
| ||
| Cash and cash equivalents |
| 113,229 |
|
|
| 79,992 |
|
|
| 14,117 |
|
|
| 19,120 |
| ||
| Restricted cash |
| 86,015 |
|
|
| 78 |
|
|
| 85,937 |
|
|
| - |
| ||
| Accounts and other receivables |
| 8,753 |
|
|
| 4,313 |
|
|
| 3,782 |
|
|
| 658 |
| ||
| Deferred rent receivable |
| 202,548 |
|
|
| 96,312 |
|
|
| 80,908 |
|
|
| 25,328 |
| ||
| Deferred charges, net |
| 41,580 |
|
|
| 20,416 |
|
|
| 13,659 |
|
|
| 7,505 |
| ||
| Intangible assets, net |
| 32,588 |
|
|
| 27,975 |
|
|
| 4,066 |
|
|
| 547 |
| ||
| Other assets |
| 12,022 |
|
|
| 1,998 |
|
|
| 8,426 |
|
|
| 1,598 |
| ||
Total Assets | $ | 3,738,092 |
|
| $ | 1,883,697 |
|
| $ | 1,336,526 |
|
| $ | 517,869 |
| |||
|
|
|
|
|
|
|
|
|
|
|
|
|
|
| ||||
Liabilities: |
|
|
|
|
|
|
|
|
|
|
| |||||||
| Notes and mortgages payable, net | $ | 2,317,687 |
|
| $ | 1,244,606 |
|
| $ | 841,454 |
|
| $ | 231,627 |
| ||
| Accounts payable and accrued expenses |
| 53,697 |
|
|
| 15,336 |
|
|
| 26,985 |
|
|
| 11,376 |
| ||
| Intangible liabilities, net |
| 14,803 |
|
|
| 10,880 |
|
|
| 3,693 |
|
|
| 230 |
| ||
| Other liabilities |
| 5,917 |
|
|
| 910 |
|
|
| 4,895 |
|
|
| 112 |
| ||
Total Liabilities |
| 2,392,104 |
|
|
| 1,271,732 |
|
|
| 877,027 |
|
|
| 243,345 |
| |||
|
|
|
|
|
|
|
|
|
|
|
|
|
|
| ||||
Equity: |
|
|
|
|
|
|
|
|
|
|
| |||||||
| Paramount Group, Inc. equity |
| 860,005 |
|
|
| 550,310 |
|
|
| 225,223 |
|
|
| 84,472 |
| ||
| Noncontrolling interests |
| 485,983 |
|
|
| 61,655 |
|
|
| 234,276 |
|
|
| 190,052 |
| ||
Total Equity |
| 1,345,988 |
|
|
| 611,965 |
|
|
| 459,499 |
|
|
| 274,524 |
| |||
|
|
|
|
|
|
|
|
|
|
|
|
| ||||||
Total Liabilities and Equity | $ | 3,738,092 |
|
| $ | 1,883,697 |
|
| $ | 1,336,526 |
|
| $ | 517,869 |
| |||
- 21 -
| CONSOLIDATED JOINT VENTURES – BALANCE SHEETS |
(unaudited and in thousands)
|
|
|
| As of December 31, 2023 |
| |||||||||||||
|
|
|
| Total Consolidated |
|
| 1633 |
|
| One Market |
|
| 300 Mission |
| ||||
|
|
|
| Joint Ventures |
|
| Broadway |
|
| Plaza |
|
| Street |
| ||||
PGRE Ownership |
|
|
| 90.0% |
|
| 49.0% |
|
| 31.1% |
| |||||||
|
|
|
|
|
|
|
|
|
|
|
|
|
|
| ||||
Assets: |
|
|
|
|
|
|
|
|
|
|
| |||||||
| Real estate, net | $ | 3,284,532 |
|
| $ | 1,675,890 |
|
| $ | 1,141,827 |
|
| $ | 466,815 |
| ||
| Cash and cash equivalents |
| 145,320 |
|
|
| 59,111 |
|
|
| 74,276 |
|
|
| 11,933 |
| ||
| Restricted cash |
| 1,319 |
|
|
| 78 |
|
|
| 1,241 |
|
|
| - |
| ||
| Accounts and other receivables |
| 9,871 |
|
|
| 3,814 |
|
|
| 5,323 |
|
|
| 734 |
| ||
| Deferred rent receivable |
| 207,938 |
|
|
| 99,426 |
|
|
| 84,395 |
|
|
| 24,117 |
| ||
| Deferred charges, net |
| 45,190 |
|
|
| 21,915 |
|
|
| 15,093 |
|
|
| 8,182 |
| ||
| Intangible assets, net |
| 38,209 |
|
|
| 32,044 |
|
|
| 5,407 |
|
|
| 758 |
| ||
| Other assets |
| 7,365 |
|
|
| 850 |
|
|
| 6,015 |
|
|
| 500 |
| ||
Total Assets | $ | 3,739,744 |
|
| $ | 1,893,128 |
|
| $ | 1,333,577 |
|
| $ | 513,039 |
| |||
|
|
|
|
|
|
|
|
|
|
|
|
|
|
| ||||
Liabilities: |
|
|
|
|
|
|
|
|
|
|
| |||||||
| Notes and mortgages payable, net | $ | 2,450,401 |
|
| $ | 1,244,109 |
|
| $ | 974,764 |
|
| $ | 231,528 |
| ||
| Accounts payable and accrued expenses |
| 48,862 |
|
|
| 9,825 |
|
|
| 28,260 |
|
|
| 10,777 |
| ||
| Intangible liabilities, net |
| 17,180 |
|
|
| 11,903 |
|
|
| 4,959 |
|
|
| 318 |
| ||
| Other liabilities |
| 4,833 |
|
|
| 156 |
|
|
| 4,631 |
|
|
| 46 |
| ||
Total Liabilities |
| 2,521,276 |
|
|
| 1,265,993 |
|
|
| 1,012,614 |
|
|
| 242,669 |
| |||
|
|
|
|
|
|
|
|
|
|
|
|
|
|
| ||||
Equity: |
|
|
|
|
|
|
|
|
|
|
| |||||||
| Paramount Group, Inc. equity |
| 804,543 |
|
|
| 563,957 |
|
|
| 157,341 |
|
|
| 83,245 |
| ||
| Noncontrolling interests |
| 413,925 |
|
|
| 63,178 |
|
|
| 163,622 |
|
|
| 187,125 |
| ||
Total Equity |
| 1,218,468 |
|
|
| 627,135 |
|
|
| 320,963 |
|
|
| 270,370 |
| |||
|
|
|
|
|
|
|
|
|
|
|
|
| ||||||
Total Liabilities and Equity | $ | 3,739,744 |
|
| $ | 1,893,128 |
|
| $ | 1,333,577 |
|
| $ | 513,039 |
| |||
- 22 -
| CONSOLIDATED JOINT VENTURES – OPERATING RESULTS |

(unaudited and in thousands)
|
|
|
| Three Months Ended June 30, 2024 |
| |||||||||||||
|
|
|
| Total Consolidated |
|
| 1633 |
|
| One Market |
|
| 300 Mission |
| ||||
|
|
|
| Joint Ventures |
|
| Broadway |
|
| Plaza |
|
| Street |
| ||||
Total revenues | $ | 105,619 |
|
| $ | 48,371 |
|
| $ | 43,048 |
|
| $ | 14,200 |
| |||
Total operating expenses |
| 37,146 |
|
|
| 19,973 |
|
|
| 12,823 |
|
|
| 4,350 |
| |||
Net operating income (1) |
| 68,473 |
|
|
| 28,398 |
|
|
| 30,225 |
|
|
| 9,850 |
| |||
Depreciation and amortization |
| (30,745 | ) |
|
| (15,851 | ) |
|
| (10,848 | ) |
|
| (4,046 | ) | |||
Interest and other income, net |
| 1,067 |
|
|
| 772 |
|
|
| 154 |
|
|
| 141 |
| |||
Interest and debt expense |
| (22,420 | ) |
|
| (9,701 | ) |
|
| (10,061 | ) |
|
| (2,658 | ) | |||
Income before income taxes |
| 16,375 |
|
|
| 3,618 |
|
|
| 9,470 |
|
|
| 3,287 |
| |||
Income tax expense |
| (87 | ) |
|
| (8 | ) |
|
| (79 | ) |
|
| - |
| |||
Net income | $ | 16,288 |
|
| $ | 3,610 |
|
| $ | 9,391 |
|
| $ | 3,287 |
| |||
|
|
|
|
|
|
|
|
|
|
|
|
|
|
| ||||
|
|
|
|
|
|
|
|
|
|
|
|
|
|
| ||||
PGRE's share |
|
|
|
|
|
|
|
|
|
|
| |||||||
Ownership | Total |
|
| 90.0% |
|
| 49.0% |
|
| 31.1% |
| |||||||
| Net income | $ | 8,861 |
|
| $ | 3,247 |
|
| $ | 4,597 |
|
| $ | 1,017 |
| ||
| Management fee income |
| 1,158 |
|
|
| 346 |
|
|
| 215 |
|
|
| 597 |
| ||
| PGRE's share of net income |
| 10,019 |
|
|
| 3,593 |
|
|
| 4,812 |
|
|
| 1,614 |
| ||
| Real estate depreciation and amortization |
| 20,840 |
|
|
| 14,266 |
|
|
| 5,315 |
|
|
| 1,259 |
| ||
| FFO/Core FFO (1) | $ | 30,859 |
|
| $ | 17,859 |
|
| $ | 10,127 |
|
| $ | 2,873 |
| ||
|
|
|
|
|
|
|
|
|
|
|
|
|
|
| ||||
|
|
|
|
|
|
|
|
|
|
|
|
|
|
| ||||
Noncontrolling interests' share |
|
|
|
|
|
|
|
|
|
|
| |||||||
Ownership | Total |
|
| 10.0% |
|
| 51.0% |
|
| 68.9% |
| |||||||
| Net income | $ | 7,427 |
|
| $ | 363 |
|
| $ | 4,794 |
|
| $ | 2,270 |
| ||
| Management fee expense |
| (1,158 | ) |
|
| (346 | ) |
|
| (215 | ) |
|
| (597 | ) | ||
| Net income attributable to noncontrolling interests |
| 6,269 |
|
|
| 17 |
|
|
| 4,579 |
|
|
| 1,673 |
| ||
| Real estate depreciation and amortization |
| 9,905 |
|
|
| 1,585 |
|
|
| 5,533 |
|
|
| 2,787 |
| ||
| FFO/Core FFO (1) | $ | 16,174 |
|
| $ | 1,602 |
|
| $ | 10,112 |
|
| $ | 4,460 |
| ||
(1)
See page 54 for our definition of these measures.
- 23 -
| CONSOLIDATED JOINT VENTURES – OPERATING RESULTS |
(unaudited and in thousands)
|
|
|
| Three Months Ended June 30, 2023 |
| |||||||||||||
|
|
|
| Total Consolidated |
|
| 1633 |
|
| One Market |
|
| 300 Mission |
| ||||
|
|
|
| Joint Ventures |
|
| Broadway |
|
| Plaza |
|
| Street |
| ||||
Total revenues | $ | 104,119 |
|
| $ | 50,394 |
|
| $ | 41,321 |
|
| $ | 12,404 |
| |||
Total operating expenses |
| 35,089 |
|
|
| 18,785 |
|
|
| 12,122 |
|
|
| 4,182 |
| |||
Net operating income (1) |
| 69,030 |
|
|
| 31,609 |
|
|
| 29,199 |
|
|
| 8,222 |
| |||
Depreciation and amortization |
| (28,747 | ) |
|
| (14,197 | ) |
|
| (10,671 | ) |
|
| (3,879 | ) | |||
Interest and other income, net |
| 715 |
|
|
| 505 |
|
|
| 164 |
|
|
| 46 |
| |||
Interest and debt expense |
| (22,386 | ) |
|
| (9,702 | ) |
|
| (10,193 | ) |
|
| (2,491 | ) | |||
Income before income taxes |
| 18,612 |
|
|
| 8,215 |
|
|
| 8,499 |
|
|
| 1,898 |
| |||
Income tax benefit (expense) |
| 96 |
|
|
| (5 | ) |
|
| 128 |
|
|
| (27 | ) | |||
Net income | $ | 18,708 |
|
| $ | 8,210 |
|
| $ | 8,627 |
|
| $ | 1,871 |
| |||
|
|
|
|
|
|
|
|
|
|
|
|
|
|
| ||||
|
|
|
|
|
|
|
|
|
|
|
|
|
|
| ||||
PGRE's share |
|
|
|
|
|
|
|
|
|
|
| |||||||
Ownership | Total |
|
| 90.0% |
|
| 49.0% |
|
| 31.1% |
| |||||||
| Net income | $ | 12,186 |
|
| $ | 7,389 |
|
| $ | 4,220 |
|
| $ | 577 |
| ||
| Management fee income |
| 1,171 |
|
|
| 419 |
|
|
| 192 |
|
|
| 560 |
| ||
| PGRE's share of net income |
| 13,357 |
|
|
| 7,808 |
|
|
| 4,412 |
|
|
| 1,137 |
| ||
| Real estate depreciation and amortization |
| 19,209 |
|
|
| 12,777 |
|
|
| 5,229 |
|
|
| 1,203 |
| ||
| FFO/Core FFO (1) | $ | 32,566 |
|
| $ | 20,585 |
|
| $ | 9,641 |
|
| $ | 2,340 |
| ||
|
|
|
|
|
|
|
|
|
|
|
|
|
|
| ||||
|
|
|
|
|
|
|
|
|
|
|
|
|
|
| ||||
Noncontrolling interests' share |
|
|
|
|
|
|
|
|
|
|
| |||||||
Ownership | Total |
|
| 10.0% |
|
| 51.0% |
|
| 68.9% |
| |||||||
| Net income | $ | 6,522 |
|
| $ | 821 |
|
| $ | 4,407 |
|
| $ | 1,294 |
| ||
| Management fee expense |
| (1,171 | ) |
|
| (419 | ) |
|
| (192 | ) |
|
| (560 | ) | ||
| Net income attributable to noncontrolling interests |
| 5,351 |
|
|
| 402 |
|
|
| 4,215 |
|
|
| 734 |
| ||
| Real estate depreciation and amortization |
| 9,538 |
|
|
| 1,420 |
|
|
| 5,442 |
|
|
| 2,676 |
| ||
| FFO/Core FFO (1) | $ | 14,889 |
|
| $ | 1,822 |
|
| $ | 9,657 |
|
| $ | 3,410 |
| ||
(1)
See page 54 for our definition of these measures.
- 24 -
| CONSOLIDATED JOINT VENTURES – OPERATING RESULTS |
(unaudited and in thousands)
|
|
|
| Six Months Ended June 30, 2024 |
| |||||||||||||
|
|
|
| Total Consolidated |
|
| 1633 |
|
| One Market |
|
| 300 Mission |
| ||||
|
|
|
| Joint Ventures |
|
| Broadway |
|
| Plaza |
|
| Street |
| ||||
Total revenues | $ | 208,256 |
|
| $ | 97,177 |
|
| $ | 83,804 |
|
| $ | 27,275 |
| |||
Total operating expenses |
| 71,619 |
|
|
| 38,591 |
|
|
| 24,762 |
|
|
| 8,266 |
| |||
Net operating income (1) |
| 136,637 |
|
|
| 58,586 |
|
|
| 59,042 |
|
|
| 19,009 |
| |||
Depreciation and amortization |
| (62,253 | ) |
|
| (32,589 | ) |
|
| (21,652 | ) |
|
| (8,012 | ) | |||
Interest and other income, net |
| 1,955 |
|
|
| 1,274 |
|
|
| 428 |
|
|
| 253 |
| |||
Interest and debt expense |
| (45,066 | ) |
|
| (19,402 | ) |
|
| (20,344 | ) |
|
| (5,320 | ) | |||
Income before income taxes |
| 31,273 |
|
|
| 7,869 |
|
|
| 17,474 |
|
|
| 5,930 |
| |||
Income tax expense |
| (98 | ) |
|
| (16 | ) |
|
| (81 | ) |
|
| (1 | ) | |||
Net income | $ | 31,175 |
|
| $ | 7,853 |
|
| $ | 17,393 |
|
| $ | 5,929 |
| |||
|
|
|
|
|
|
|
|
|
|
|
|
|
|
| ||||
|
|
|
|
|
|
|
|
|
|
|
|
|
|
| ||||
PGRE's share |
|
|
|
|
|
|
|
|
|
|
| |||||||
Ownership | Total |
|
| 90.0% |
|
| 49.0% |
|
| 31.1% |
| |||||||
| Net income | $ | 17,423 |
|
| $ | 7,067 |
|
| $ | 8,518 |
|
| $ | 1,838 |
| ||
| Management fee income |
| 2,277 |
|
|
| 687 |
|
|
| 433 |
|
|
| 1,157 |
| ||
| PGRE's share of net income |
| 19,700 |
|
|
| 7,754 |
|
|
| 8,951 |
|
|
| 2,995 |
| ||
| Real estate depreciation and amortization |
| 42,431 |
|
|
| 29,330 |
|
|
| 10,609 |
|
|
| 2,492 |
| ||
| FFO/Core FFO (1) | $ | 62,131 |
|
| $ | 37,084 |
|
| $ | 19,560 |
|
| $ | 5,487 |
| ||
|
|
|
|
|
|
|
|
|
|
|
|
|
|
| ||||
|
|
|
|
|
|
|
|
|
|
|
|
|
|
| ||||
Noncontrolling interests' share |
|
|
|
|
|
|
|
|
|
|
| |||||||
Ownership | Total |
|
| 10.0% |
|
| 51.0% |
|
| 68.9% |
| |||||||
| Net income | $ | 13,752 |
|
| $ | 786 |
|
| $ | 8,875 |
|
| $ | 4,091 |
| ||
| Management fee expense |
| (2,277 | ) |
|
| (687 | ) |
|
| (433 | ) |
|
| (1,157 | ) | ||
| Net income attributable to noncontrolling interests |
| 11,475 |
|
|
| 99 |
|
|
| 8,442 |
|
|
| 2,934 |
| ||
| Real estate depreciation and amortization |
| 19,822 |
|
|
| 3,259 |
|
|
| 11,043 |
|
|
| 5,520 |
| ||
| FFO/Core FFO (1) | $ | 31,297 |
|
| $ | 3,358 |
|
| $ | 19,485 |
|
| $ | 8,454 |
| ||
(1)
See page 54 for our definition of these measures.
- 25 -
| CONSOLIDATED JOINT VENTURES – OPERATING RESULTS |
(unaudited and in thousands)
|
|
|
| Six Months Ended June 30, 2023 |
| |||||||||||||
|
|
|
| Total Consolidated |
|
| 1633 |
|
| One Market |
|
| 300 Mission |
| ||||
|
|
|
| Joint Ventures |
|
| Broadway |
|
| Plaza |
|
| Street |
| ||||
Total revenues | $ | 206,068 |
|
| $ | 99,536 |
|
| $ | 81,293 |
|
| $ | 25,239 |
| |||
Total operating expenses |
| 69,027 |
|
|
| 37,637 |
|
|
| 23,413 |
|
|
| 7,977 |
| |||
Net operating income (1) |
| 137,041 |
|
|
| 61,899 |
|
|
| 57,880 |
|
|
| 17,262 |
| |||
Depreciation and amortization |
| (57,480 | ) |
|
| (28,378 | ) |
|
| (21,331 | ) |
|
| (7,771 | ) | |||
Interest and other income, net |
| 1,561 |
|
|
| 917 |
|
|
| 387 |
|
|
| 257 |
| |||
Interest and debt expense |
| (44,567 | ) |
|
| (19,301 | ) |
|
| (20,284 | ) |
|
| (4,982 | ) | |||
Income before income taxes |
| 36,555 |
|
|
| 15,137 |
|
|
| 16,652 |
|
|
| 4,766 |
| |||
Income tax benefit (expense) |
| 75 |
|
|
| (5 | ) |
|
| 127 |
|
|
| (47 | ) | |||
Net income | $ | 36,630 |
|
| $ | 15,132 |
|
| $ | 16,779 |
|
| $ | 4,719 |
| |||
|
|
|
|
|
|
|
|
|
|
|
|
|
|
| ||||
|
|
|
|
|
|
|
|
|
|
|
|
|
|
| ||||
PGRE's share |
|
|
|
|
|
|
|
|
|
|
| |||||||
Ownership | Total |
|
| 90.0% |
|
| 49.0% |
|
| 31.1% |
| |||||||
| Net income | $ | 23,291 |
|
| $ | 13,617 |
|
| $ | 8,214 |
|
| $ | 1,460 |
| ||
| Management fee income |
| 2,347 |
|
|
| 826 |
|
|
| 385 |
|
|
| 1,136 |
| ||
| PGRE's share of net income |
| 25,638 |
|
|
| 14,443 |
|
|
| 8,599 |
|
|
| 2,596 |
| ||
| Real estate depreciation and amortization |
| 38,408 |
|
|
| 25,541 |
|
|
| 10,453 |
|
|
| 2,414 |
| ||
| FFO/Core FFO (1) | $ | 64,046 |
|
| $ | 39,984 |
|
| $ | 19,052 |
|
| $ | 5,010 |
| ||
|
|
|
|
|
|
|
|
|
|
|
|
|
|
| ||||
|
|
|
|
|
|
|
|
|
|
|
|
|
|
| ||||
Noncontrolling interests' share |
|
|
|
|
|
|
|
|
|
|
| |||||||
Ownership | Total |
|
| 10.0% |
|
| 51.0% |
|
| 68.9% |
| |||||||
| Net income | $ | 13,339 |
|
| $ | 1,515 |
|
| $ | 8,565 |
|
| $ | 3,259 |
| ||
| Management fee expense |
| (2,347 | ) |
|
| (826 | ) |
|
| (385 | ) |
|
| (1,136 | ) | ||
| Net income attributable to noncontrolling interests |
| 10,992 |
|
|
| 689 |
|
|
| 8,180 |
|
|
| 2,123 |
| ||
| Real estate depreciation and amortization |
| 19,072 |
|
|
| 2,837 |
|
|
| 10,878 |
|
|
| 5,357 |
| ||
| FFO/Core FFO (1) | $ | 30,064 |
|
| $ | 3,526 |
|
| $ | 19,058 |
|
| $ | 7,480 |
| ||
(1)
See page 54 for our definition of these measures.
- 26 -
| UNCONSOLIDATED JOINT VENTURES – BALANCE SHEETS |
(unaudited and in thousands)
|
|
|
|
| As of June 30, 2024 |
| ||||||||||||||||||||||||||||||
|
|
|
|
|
|
|
|
|
|
|
|
|
|
|
|
|
|
|
|
|
|
|
| Non-Core Assets |
| |||||||||||
|
|
|
|
|
|
|
|
| 712 Fifth |
|
| 55 Second |
|
| 60 Wall |
|
| One Steuart |
|
|
|
|
| Market |
|
| 111 Sutter |
| ||||||||
|
|
|
|
|
| Total |
|
| Avenue |
|
| Street |
|
| Street (1) |
|
| Lane |
|
| Other (2) |
|
| Center |
|
| Street |
| ||||||||
|
|
|
|
|
|
|
|
|
|
|
|
|
|
|
|
|
|
|
|
|
|
|
|
|
|
|
|
| ||||||||
PGRE Ownership |
|
|
| 50.0% |
|
| 44.1% |
|
| 5.0% |
|
| 35.0% (3) |
|
| Various |
|
| 67.0% |
|
| 49.0% |
| |||||||||||||
Assets: |
|
|
|
|
|
|
|
|
|
|
|
|
|
|
|
|
|
|
|
|
|
|
| |||||||||||||
| Real estate, net | $ | 1,572,781 |
|
| $ | 215,706 |
|
| $ | 225,980 |
|
| $ | 578,884 |
|
| $ | 50 |
|
| $ | 145,223 |
|
| $ | 267,936 |
|
| $ | 139,002 |
| ||||
| Cash and cash equivalents |
| 90,761 |
|
|
| 26,277 |
|
|
| 22,726 |
|
|
| 18,000 |
|
|
| 15,080 |
|
|
| 3,833 |
|
|
| 2,929 |
|
|
| 1,916 |
| ||||
| Restricted cash |
| 79,496 |
|
|
| 5,969 |
|
|
| - |
|
|
| 65,118 |
|
|
| - |
|
|
| - |
|
|
| 7,210 |
|
|
| 1,199 |
| ||||
| Accounts and other receivables |
| 8,102 |
|
|
| 5,117 |
|
|
| 554 |
|
|
| 227 |
|
|
| 123 |
|
|
| 21 |
|
|
| 1,038 |
|
|
| 1,022 |
| ||||
| Deferred rent receivable |
| 38,347 |
|
|
| 21,076 |
|
|
| 4,438 |
|
|
| - |
|
|
| - |
|
|
| 3,846 |
|
|
| 6,112 |
|
|
| 2,875 |
| ||||
| Deferred charges, net |
| 15,667 |
|
|
| 8,941 |
|
|
| 1,755 |
|
|
| - |
|
|
| - |
|
|
| - |
|
|
| 4,045 |
|
|
| 926 |
| ||||
| Intangible assets, net |
| 46,414 |
|
|
| - |
|
|
| 4,012 |
|
|
| - |
|
|
| - |
|
|
| 36,985 |
|
|
| 4,342 |
|
|
| 1,075 |
| ||||
| For-sale residential condominium units |
| 236,635 |
|
|
| - |
|
|
| - |
|
|
| - |
|
|
| 236,635 |
|
|
| - |
|
|
| - |
|
|
| - |
| ||||
| Other assets |
| 22,526 |
|
|
| 389 |
|
|
| 666 |
|
|
| 10,149 |
|
|
| 81 |
|
|
| 2,170 |
|
|
| 8,602 |
|
|
| 469 |
| ||||
Total Assets | $ | 2,110,729 |
|
| $ | 283,475 |
|
| $ | 260,131 |
|
| $ | 672,378 |
|
| $ | 251,969 |
|
| $ | 192,078 |
|
| $ | 302,214 |
|
| $ | 148,484 |
| |||||
|
|
|
|
|
|
|
|
|
|
|
|
|
|
|
|
|
|
|
|
|
|
|
|
|
|
|
|
| ||||||||
Liabilities: |
|
|
|
|
|
|
|
|
|
|
|
|
|
|
|
|
|
|
|
|
|
|
| |||||||||||||
| Notes and mortgages payable, net | $ | 1,756,732 |
|
| $ | 298,802 |
|
| $ | 187,148 |
|
| $ | 582,483 |
|
| $ | - |
|
| $ | 106,899 |
|
| $ | 415,038 |
|
| $ | 166,362 |
| ||||
| Accounts payable and accrued expenses |
| 41,870 |
|
|
| 6,642 |
|
|
| 3,323 |
|
|
| 15,722 |
|
|
| 2,000 |
|
|
| 3,007 |
|
|
| 7,300 |
|
|
| 3,876 |
| ||||
| Intangible liabilities, net |
| 2,881 |
|
|
| - |
|
|
| 2,231 |
|
|
| - |
|
|
| - |
|
|
| - |
|
|
| 301 |
|
|
| 349 |
| ||||
| Other liabilities |
| 73,520 |
|
|
| 249 |
|
|
| 202 |
|
|
| 68,667 |
|
|
| 19 |
|
|
| 1,379 |
|
|
| 1,969 |
|
|
| 1,035 |
| ||||
Total Liabilities |
| 1,875,003 |
|
|
| 305,693 |
|
|
| 192,904 |
|
|
| 666,872 |
|
|
| 2,019 |
|
|
| 111,285 |
|
|
| 424,608 |
|
|
| 171,622 |
| |||||
|
|
|
|
|
|
|
|
|
|
|
|
|
|
|
|
|
|
|
|
|
|
|
|
|
|
|
|
| ||||||||
|
|
|
|
|
|
|
|
|
|
|
|
|
|
|
|
|
|
|
|
|
|
|
|
|
|
|
|
| ||||||||
Total Equity |
| 235,726 |
|
|
| (22,218 | ) |
|
| 67,227 |
|
|
| 5,506 |
|
|
| 249,950 |
|
|
| 80,793 |
|
|
| (122,394 | ) |
|
| (23,138 | ) | |||||
|
|
|
|
|
|
|
|
|
|
|
|
|
|
|
|
|
|
|
|
|
|
|
|
|
|
|
|
| ||||||||
Total Liabilities and Equity | $ | 2,110,729 |
|
| $ | 283,475 |
|
| $ | 260,131 |
|
| $ | 672,378 |
|
| $ | 251,969 |
|
| $ | 192,078 |
|
| $ | 302,214 |
|
| $ | 148,484 |
| |||||
(1)
This property has been taken “out-of-service” for redevelopment.
(2)
Represents 1600 Broadway and Oder-Center, Germany.
(3)
RDF, our consolidated Residential Development Fund, owns a 35% economic interest in One Steuart Lane, a for-sale residential condominium project. Our economic interest in One Steuart Lane (based on our 7.4% interest in RDF) is 2.6%.
- 27 -
| UNCONSOLIDATED JOINT VENTURES – BALANCE SHEETS |
(unaudited and in thousands)
|
|
|
|
| As of December 31, 2023 |
| ||||||||||||||||||||||||||||||
|
|
|
|
|
|
|
|
|
|
|
|
|
|
|
|
|
|
|
|
|
|
|
| Non-Core Assets |
| |||||||||||
|
|
|
|
|
|
|
|
| 712 Fifth |
|
| 55 Second |
|
| 60 Wall |
|
| One Steuart |
|
|
|
|
| Market |
|
| 111 Sutter |
| ||||||||
|
|
|
|
|
| Total |
|
| Avenue |
|
| Street |
|
| Street (1) |
|
| Lane |
|
| Other (2) |
|
| Center |
|
| Street |
| ||||||||
|
|
|
|
|
|
|
|
|
|
|
|
|
|
|
|
|
|
|
|
|
|
|
|
|
|
|
|
| ||||||||
PGRE Ownership |
|
|
| 50.0% |
|
| 44.1% |
|
| 5.0% |
|
| 35.0% (3) |
|
| Various |
|
| 67.0% |
|
| 49.0% |
| |||||||||||||
Assets: |
|
|
|
|
|
|
|
|
|
|
|
|
|
|
|
|
|
|
|
|
|
|
| |||||||||||||
| Real estate, net | $ | 1,528,595 |
|
| $ | 219,297 |
|
| $ | 230,516 |
|
| $ | 517,147 |
|
| $ | 50 |
|
| $ | 147,046 |
|
| $ | 272,113 |
|
| $ | 142,426 |
| ||||
| Cash and cash equivalents |
| 67,499 |
|
|
| 24,516 |
|
|
| 21,318 |
|
|
| 794 |
|
|
| 10,822 |
|
|
| 2,709 |
|
|
| 5,300 |
|
|
| 2,040 |
| ||||
| Restricted cash |
| 99,856 |
|
|
| 5,480 |
|
|
| - |
|
|
| 80,600 |
|
|
| 49 |
|
|
| - |
|
|
| 12,286 |
|
|
| 1,441 |
| ||||
| Accounts and other receivables |
| 8,601 |
|
|
| 4,960 |
|
|
| 585 |
|
|
| 150 |
|
|
| 123 |
|
|
| 20 |
|
|
| 1,539 |
|
|
| 1,224 |
| ||||
| Deferred rent receivable |
| 35,448 |
|
|
| 18,844 |
|
|
| 4,242 |
|
|
| - |
|
|
| - |
|
|
| 3,130 |
|
|
| 6,145 |
|
|
| 3,087 |
| ||||
| Deferred charges, net |
| 13,643 |
|
|
| 8,989 |
|
|
| 1,120 |
|
|
| - |
|
|
| - |
|
|
| - |
|
|
| 2,540 |
|
|
| 994 |
| ||||
| Intangible assets, net |
| 52,164 |
|
|
| - |
|
|
| 6,283 |
|
|
| - |
|
|
| - |
|
|
| 38,548 |
|
|
| 5,809 |
|
|
| 1,524 |
| ||||
| For-sale residential condominium units |
| 246,824 |
|
|
| - |
|
|
| - |
|
|
| - |
|
|
| 246,824 |
|
|
| - |
|
|
| - |
|
|
| - |
| ||||
| Other assets |
| 26,487 |
|
|
| 227 |
|
|
| 269 |
|
|
| 11,538 |
|
|
| 130 |
|
|
| 1,097 |
|
|
| 13,032 |
|
|
| 194 |
| ||||
Total Assets | $ | 2,079,117 |
|
| $ | 282,313 |
|
| $ | 264,333 |
|
| $ | 610,229 |
|
| $ | 257,998 |
|
| $ | 192,550 |
|
| $ | 318,764 |
|
| $ | 152,930 |
| |||||
|
|
|
|
|
|
|
|
|
|
|
|
|
|
|
|
|
|
|
|
|
|
|
|
|
|
|
|
| ||||||||
Liabilities: |
|
|
|
|
|
|
|
|
|
|
|
|
|
|
|
|
|
|
|
|
|
|
| |||||||||||||
| Notes and mortgages payable, net | $ | 1,744,706 |
|
| $ | 298,596 |
|
| $ | 187,068 |
|
| $ | 575,000 |
|
| $ | - |
|
| $ | 107,764 |
|
| $ | 412,996 |
|
| $ | 163,282 |
| ||||
| Accounts payable and accrued expenses |
| 92,770 |
|
|
| 7,542 |
|
|
| 5,025 |
|
|
| 62,148 |
|
|
| 2,663 |
|
|
| 1,266 |
|
|
| 9,830 |
|
|
| 4,296 |
| ||||
| Intangible liabilities, net |
| 5,026 |
|
|
| - |
|
|
| 3,919 |
|
|
| - |
|
|
| - |
|
|
| - |
|
|
| 462 |
|
|
| 645 |
| ||||
| Other liabilities |
| 5,692 |
|
|
| 178 |
|
|
| 208 |
|
|
| 1,408 |
|
|
| 25 |
|
|
| 663 |
|
|
| 2,967 |
|
|
| 243 |
| ||||
Total Liabilities |
| 1,848,194 |
|
|
| 306,316 |
|
|
| 196,220 |
|
|
| 638,556 |
|
|
| 2,688 |
|
|
| 109,693 |
|
|
| 426,255 |
|
|
| 168,466 |
| |||||
|
|
|
|
|
|
|
|
|
|
|
|
|
|
|
|
|
|
|
|
|
|
|
|
|
|
|
|
| ||||||||
|
|
|
|
|
|
|
|
|
|
|
|
|
|
|
|
|
|
|
|
|
|
|
|
|
|
|
|
| ||||||||
Total Equity |
| 230,923 |
|
|
| (24,003 | ) |
|
| 68,113 |
|
|
| (28,327 | ) |
|
| 255,310 |
|
|
| 82,857 |
|
|
| (107,491 | ) |
|
| (15,536 | ) | |||||
|
|
|
|
|
|
|
|
|
|
|
|
|
|
|
|
|
|
|
|
|
|
|
|
|
|
|
|
| ||||||||
Total Liabilities and Equity | $ | 2,079,117 |
|
| $ | 282,313 |
|
| $ | 264,333 |
|
| $ | 610,229 |
|
| $ | 257,998 |
|
| $ | 192,550 |
|
| $ | 318,764 |
|
| $ | 152,930 |
| |||||
(1)
This property has been taken “out-of-service” for redevelopment.
(2)
Represents 1600 Broadway and Oder-Center, Germany.
(3)
RDF, our consolidated Residential Development Fund, owns a 35% economic interest in One Steuart Lane, a for-sale residential condominium project. Our economic interest in One Steuart Lane (based on our 7.4% interest in RDF) is 2.6%.
- 28 -
| UNCONSOLIDATED JOINT VENTURES – OPERATING RESULTS |
(unaudited and in thousands)
|
|
|
|
| Three Months Ended June 30, 2024 |
| |||||||||||||||||||||||||||||
|
|
|
|
|
|
|
|
|
|
|
|
|
|
|
|
|
|
|
|
|
|
| Non-Core Assets |
| |||||||||||
|
|
|
|
|
|
|
| 712 Fifth |
|
| 55 Second |
|
| 60 Wall |
|
| One Steuart |
|
|
|
|
| Market |
|
| 111 Sutter |
| ||||||||
|
|
|
|
| Total |
|
| Avenue |
|
| Street |
|
| Street (1) |
|
| Lane |
|
| Other (2) |
|
| Center |
|
| Street |
| ||||||||
Total revenues | $ | 38,493 |
|
| $ | 12,461 |
|
| $ | 8,174 |
|
| $ | - |
|
| $ | 1,771 |
| (3) | $ | 4,352 |
|
| $ | 8,136 |
|
| $ | 3,599 |
| ||||
Total operating expenses |
| 23,921 |
|
|
| 5,846 |
|
|
| 3,506 |
|
|
| 83 |
|
|
| 4,219 |
| (3) |
| 1,561 |
|
|
| 6,465 |
|
|
| 2,241 |
| ||||
Net operating income (loss) (4) |
| 14,572 |
|
|
| 6,615 |
|
|
| 4,668 |
|
|
| (83 | ) |
|
| (2,448 | ) |
|
| 2,791 |
|
|
| 1,671 |
|
|
| 1,358 |
| ||||
Depreciation and amortization |
| (12,606 | ) |
|
| (3,522 | ) |
|
| (3,199 | ) |
|
| - |
|
|
| - |
|
|
| (1,077 | ) |
|
| (2,833 | ) |
|
| (1,975 | ) | ||||
Interest and other income, net |
| 1,870 |
|
|
| 212 |
|
|
| 239 |
|
|
| 1,190 |
|
|
| 176 |
|
|
| 13 |
|
|
| 36 |
|
|
| 4 |
| ||||
Interest and debt expense |
| (12,358 | ) |
|
| (2,674 | ) |
|
| (1,856 | ) |
|
| - |
|
|
| - |
|
|
| (1,060 | ) |
|
| (3,632 | ) |
|
| (3,136 | ) | ||||
(Loss) income before income taxes |
| (8,522 | ) |
|
| 631 |
|
|
| (148 | ) |
|
| 1,107 |
|
|
| (2,272 | ) |
|
| 667 |
|
|
| (4,758 | ) |
|
| (3,749 | ) | ||||
Income tax expense |
| (9 | ) |
|
| - |
|
|
| (2 | ) |
|
| - |
|
|
| (1 | ) |
|
| (3 | ) |
|
| (3 | ) |
|
| - |
| ||||
Net (loss) income | $ | (8,531 | ) |
| $ | 631 |
|
| $ | (150 | ) |
| $ | 1,107 |
|
| $ | (2,273 | ) |
| $ | 664 |
|
| $ | (4,761 | ) |
| $ | (3,749 | ) | ||||
|
|
|
|
|
|
|
|
|
|
|
|
|
|
|
|
|
|
|
|
|
|
|
|
|
|
|
| ||||||||
|
|
|
|
|
|
|
|
|
|
|
|
|
|
|
|
|
|
|
|
|
|
|
|
|
|
|
| ||||||||
PGRE's share |
|
|
|
|
|
|
|
|
|
|
|
|
|
|
|
|
|
|
|
|
|
|
| ||||||||||||
Ownership | Total |
|
| 50.0% |
|
| 44.1% |
|
| 5.0% |
|
| 35.0% |
|
| Various |
|
| 67.0% |
|
| 49.0% |
| ||||||||||||
| Net (loss) income | $ | (5,452 | ) |
| $ | 316 |
|
| $ | (60 | ) |
| $ | 56 |
|
| $ | (796 | ) |
| $ | 60 |
|
| $ | (3,192 | ) |
| $ | (1,836 | ) | |||
| Step-up basis adjustment |
| (31 | ) |
|
| - |
|
|
| (3 | ) |
|
| - |
|
|
| (2 | ) |
|
| (26 | ) |
|
| - |
|
|
| - |
| |||
| Adjustments to equity in earnings of |
| 4,712 |
|
|
| (316 | ) |
|
| - |
|
|
| - |
|
|
| - |
|
|
| - |
|
|
| 3,192 |
|
|
| 1,836 |
| |||
| PGRE's share of net (loss) income |
| (771 | ) |
|
| - |
|
|
| (63 | ) |
|
| 56 |
|
|
| (798 | ) |
|
| 34 |
|
|
| - |
|
|
| - |
| |||
| Real estate depreciation and amortization |
| 3,300 |
|
|
| 1,761 |
|
|
| 1,413 |
|
|
| - |
|
|
| - |
|
|
| 126 |
|
|
| - |
|
|
| - |
| |||
| FFO (4) |
| 2,529 |
|
|
| 1,761 |
|
|
| 1,350 |
|
|
| 56 |
|
|
| (798 | ) |
|
| 160 |
|
|
| - |
|
|
| - |
| |||
| Adjustments to equity in earnings of |
| 316 |
|
|
| 316 |
|
|
| - |
|
|
| - |
|
|
| - |
|
|
| - |
|
|
| - |
|
|
| - |
| |||
| FFO attributable to One Steuart Lane |
| 798 |
|
|
| - |
|
|
| - |
|
|
| - |
|
|
| 798 |
|
|
| - |
|
|
| - |
|
|
| - |
| |||
| Other non-core items |
| - |
|
|
| - |
|
|
| - |
|
|
| - |
|
|
| - |
|
|
| - |
|
|
| - |
|
|
| - |
| |||
| Core FFO (4) | $ | 3,643 |
|
| $ | 2,077 |
|
| $ | 1,350 |
|
| $ | 56 |
|
| $ | - |
|
| $ | 160 |
|
| $ | - |
|
| $ | - |
| |||
(1)
This property has been taken “out-of-service” for redevelopment.
(2)
Represents 1600 Broadway and Oder-Center, Germany.
(3)
Includes proceeds and cost of sales from the sale of residential condominium units at One Steuart Lane.
(4)
See page 54 for our definition of this measure.
- 29 -
| UNCONSOLIDATED JOINT VENTURES – OPERATING RESULTS |
(unaudited and in thousands)
|
|
|
|
| Three Months Ended June 30, 2023 |
| |||||||||||||||||||||||||||||
|
|
|
|
|
|
|
|
|
|
|
|
|
|
|
|
|
|
|
|
|
|
| Non-Core Assets |
| |||||||||||
|
|
|
|
|
|
|
| 712 Fifth |
|
| 55 Second |
|
| 60 Wall |
|
| One Steuart |
|
|
|
|
| Market |
|
| 111 Sutter |
| ||||||||
|
|
|
|
| Total |
|
| Avenue |
|
| Street |
|
| Street (1) |
|
| Lane |
|
| Other (2) |
|
| Center |
|
| Street |
| ||||||||
Total revenues | $ | 44,246 |
|
| $ | 12,188 |
|
| $ | 8,061 |
|
| $ | - |
|
| $ | 2,921 |
| (3) | $ | 3,743 |
|
| $ | 14,201 |
|
| $ | 3,132 |
| ||||
Total operating expenses |
| 24,990 |
|
|
| 5,726 |
|
|
| 3,436 |
|
|
| 111 |
|
|
| 5,314 |
| (3) |
| 1,186 |
|
|
| 7,295 |
|
|
| 1,922 |
| ||||
Net operating income (loss) (4) |
| 19,256 |
|
|
| 6,462 |
|
|
| 4,625 |
|
|
| (111 | ) |
|
| (2,393 | ) |
|
| 2,557 |
|
|
| 6,906 |
|
|
| 1,210 |
| ||||
Depreciation and amortization |
| (17,713 | ) |
|
| (2,865 | ) |
|
| (4,034 | ) |
|
| - |
|
|
| (18 | ) |
|
| (1,076 | ) |
|
| (7,548 | ) |
|
| (2,172 | ) | ||||
Interest and other income (loss), net |
| 783 |
|
|
| 241 |
|
|
| 155 |
|
|
| (3 | ) |
|
| 57 |
|
|
| 11 |
|
|
| 317 |
|
|
| 5 |
| ||||
Interest and debt expense |
| (17,915 | ) |
|
| (2,674 | ) |
|
| (1,856 | ) |
|
| (4,869 | ) |
|
| (1,074 | ) |
|
| (1,036 | ) |
|
| (3,522 | ) |
|
| (2,884 | ) | ||||
Real estate impairment loss |
| (455,893 | ) |
|
| - |
|
|
| - |
|
|
| (455,893 | ) |
|
| - |
|
|
| - |
|
|
| - |
|
|
| - |
| ||||
(Loss) income before income taxes |
| (471,482 | ) |
|
| 1,164 |
|
|
| (1,110 | ) |
|
| (460,876 | ) |
|
| (3,428 | ) |
|
| 456 |
|
|
| (3,847 | ) |
|
| (3,841 | ) | ||||
Income tax expense |
| (19 | ) |
|
| - |
|
|
| (14 | ) |
|
| - |
|
|
| - |
|
|
| (4 | ) |
|
| (1 | ) |
|
| - |
| ||||
Net (loss) income | $ | (471,501 | ) |
| $ | 1,164 |
|
| $ | (1,124 | ) |
| $ | (460,876 | ) |
| $ | (3,428 | ) |
| $ | 452 |
|
| $ | (3,848 | ) |
| $ | (3,841 | ) | ||||
|
|
|
|
|
|
|
|
|
|
|
|
|
|
|
|
|
|
|
|
|
|
|
|
|
|
|
| ||||||||
|
|
|
|
|
|
|
|
|
|
|
|
|
|
|
|
|
|
|
|
|
|
|
|
|
|
|
| ||||||||
|
|
|
|
|
|
|
|
|
|
|
|
|
|
|
|
|
|
|
|
|
|
|
|
|
|
|
| ||||||||
PGRE's share |
|
|
|
|
|
|
|
|
|
|
|
|
|
|
|
|
|
|
|
|
|
|
| ||||||||||||
Ownership | Total |
|
| 50.0% |
|
| 44.1% |
|
| 5.0% |
|
| 35.0% |
|
| Various |
|
| 67.0% |
|
| 49.0% |
| ||||||||||||
| Net (loss) income | $ | (27,107 | ) |
| $ | 582 |
|
| $ | (496 | ) |
| $ | (22,422 | ) |
| $ | (353 | ) |
| $ | 44 |
|
| $ | (2,579 | ) |
| $ | (1,883 | ) | |||
| Step-up basis adjustment |
| (2,596 | ) |
|
| - |
|
|
| (3 | ) |
|
| (2,562 | ) |
|
| (5 | ) |
|
| (26 | ) |
|
| - |
|
|
| - |
| |||
| Adjustments to equity in earnings of |
| 1,301 |
|
|
| (582 | ) |
|
| - |
|
|
| - |
|
|
| - |
|
|
| - |
|
|
| - |
|
|
| 1,883 |
| |||
| PGRE's share of net (loss) income |
| (28,402 | ) |
|
| - |
|
|
| (499 | ) |
|
| (24,984 | ) |
|
| (358 | ) |
|
| 18 |
|
|
| (2,579 | ) |
|
| - |
| |||
| Real estate depreciation and amortization |
| 9,469 |
|
|
| 1,433 |
|
|
| 1,782 |
|
|
| - |
|
|
| 6 |
|
|
| 126 |
|
|
| 5,057 |
|
|
| 1,065 |
| |||
| Real estate impairment loss |
| 24,734 |
|
|
| - |
|
|
| - |
|
|
| 24,734 |
|
|
| - |
|
|
| - |
|
|
| - |
|
|
| - |
| |||
| FFO (4) |
| 5,801 |
|
|
| 1,433 |
|
|
| 1,283 |
|
|
| (250 | ) |
|
| (352 | ) |
|
| 144 |
|
|
| 2,478 |
|
|
| 1,065 |
| |||
| Adjustments to equity in earnings of |
| (1,301 | ) |
|
| 582 |
|
|
| - |
|
|
| - |
|
|
| - |
|
|
| - |
|
|
| - |
|
|
| (1,883 | ) | |||
| FFO attributable to One Steuart Lane |
| 352 |
|
|
| - |
|
|
| - |
|
|
| - |
|
|
| 352 |
|
|
| - |
|
|
| - |
|
|
| - |
| |||
| Adjustments for non-core assets |
| (1,660 | ) |
|
| - |
|
|
| - |
|
|
| - |
|
|
| - |
|
|
| - |
|
|
| (2,478 | ) |
|
| 818 |
| |||
| Other non-core items |
| 244 |
|
|
| - |
|
|
| - |
|
|
| 244 |
|
|
| - |
|
|
| - |
|
|
| - |
|
|
| - |
| |||
| Core FFO (4) | $ | 3,436 |
|
| $ | 2,015 |
|
| $ | 1,283 |
|
| $ | (6 | ) |
| $ | - |
|
| $ | 144 |
|
| $ | - |
|
| $ | - |
| |||
(1)
This property has been taken “out-of-service” for redevelopment.
(2)
Represents 1600 Broadway and Oder-Center, Germany.
(3)
Includes proceeds and cost of sales from the sale of residential condominium units at One Steuart Lane.
(4)
See page 54 for our definition of this measure.
- 30 -
| UNCONSOLIDATED JOINT VENTURES – OPERATING RESULTS |
(unaudited and in thousands)
|
|
|
|
| Six Months Ended June 30, 2024 |
| |||||||||||||||||||||||||||||
|
|
|
|
|
|
|
|
|
|
|
|
|
|
|
|
|
|
|
|
|
|
| Non-Core Assets |
| |||||||||||
|
|
|
|
|
|
|
| 712 Fifth |
|
| 55 Second |
|
| 60 Wall |
|
| One Steuart |
|
|
|
|
| Market |
|
| 111 Sutter |
| ||||||||
|
|
|
|
| Total |
|
| Avenue |
|
| Street |
|
| Street (1) |
|
| Lane |
|
| Other (2) |
|
| Center |
|
| Street |
| ||||||||
Total revenues | $ | 89,427 |
|
| $ | 25,243 |
|
| $ | 16,169 |
|
| $ | - |
|
| $ | 15,837 |
| (3) | $ | 8,227 |
|
| $ | 16,745 |
|
| $ | 7,206 |
| ||||
Total operating expenses |
| 56,360 |
|
|
| 11,870 |
|
|
| 6,893 |
|
|
| 101 |
|
|
| 16,403 |
| (3) |
| 3,489 |
|
|
| 13,068 |
|
|
| 4,536 |
| ||||
Net operating income (loss) (4) |
| 33,067 |
|
|
| 13,373 |
|
|
| 9,276 |
|
|
| (101 | ) |
|
| (566 | ) |
|
| 4,738 |
|
|
| 3,677 |
|
|
| 2,670 |
| ||||
Depreciation and amortization |
| (25,768 | ) |
|
| (6,628 | ) |
|
| (6,893 | ) |
|
| - |
|
|
| - |
|
|
| (2,152 | ) |
|
| (6,067 | ) |
|
| (4,028 | ) | ||||
Interest and other income, net |
| 2,496 |
|
|
| 388 |
|
|
| 476 |
|
|
| 1,188 |
|
|
| 330 |
|
|
| 25 |
|
|
| 81 |
|
|
| 8 |
| ||||
Interest and debt expense |
| (29,947 | ) |
|
| (5,347 | ) |
|
| (3,713 | ) |
|
| (5,255 | ) |
|
| - |
|
|
| (2,138 | ) |
|
| (7,244 | ) |
|
| (6,250 | ) | ||||
(Loss) income before income taxes |
| (20,152 | ) |
|
| 1,786 |
|
|
| (854 | ) |
|
| (4,168 | ) |
|
| (236 | ) |
|
| 473 |
|
|
| (9,553 | ) |
|
| (7,600 | ) | ||||
Income tax expense |
| (25 | ) |
|
| - |
|
|
| (8 | ) |
|
| (2 | ) |
|
| (3 | ) |
|
| (4 | ) |
|
| (5 | ) |
|
| (3 | ) | ||||
Net (loss) income | $ | (20,177 | ) |
| $ | 1,786 |
|
| $ | (862 | ) |
| $ | (4,170 | ) |
| $ | (239 | ) |
| $ | 469 |
|
| $ | (9,558 | ) |
| $ | (7,603 | ) | ||||
|
|
|
|
|
|
|
|
|
|
|
|
|
|
|
|
|
|
|
|
|
|
|
|
|
|
|
| ||||||||
|
|
|
|
|
|
|
|
|
|
|
|
|
|
|
|
|
|
|
|
|
|
|
|
|
|
|
| ||||||||
PGRE's share |
|
|
|
|
|
|
|
|
|
|
|
|
|
|
|
|
|
|
|
|
|
|
| ||||||||||||
Ownership | Total |
|
| 50.0% |
|
| 44.1% |
|
| 5.0% |
|
| 35.0% |
|
| Various |
|
| 67.0% |
|
| 49.0% |
| ||||||||||||
| Net (loss) income | $ | (9,853 | ) |
| $ | 893 |
|
| $ | (360 | ) |
| $ | (207 | ) |
| $ | (84 | ) |
| $ | 39 |
|
| $ | (6,409 | ) |
| $ | (3,725 | ) | |||
| Step-up basis adjustment |
| (81 | ) |
|
| - |
|
|
| (5 | ) |
|
| - |
|
|
| (23 | ) |
|
| (53 | ) |
|
| - |
|
|
| - |
| |||
| Adjustments to equity in earnings of |
| 7,817 |
|
|
| (893 | ) |
|
| - |
|
|
| (1,424 | ) |
|
| - |
|
|
| - |
|
|
| 6,409 |
|
|
| 3,725 |
| |||
| PGRE's share of net loss |
| (2,117 | ) |
|
| - |
|
|
| (365 | ) |
|
| (1,631 | ) |
|
| (107 | ) |
|
| (14 | ) |
|
| - |
|
|
| - |
| |||
| Real estate depreciation and amortization |
| 6,610 |
|
|
| 3,314 |
|
|
| 3,044 |
|
|
| - |
|
|
| - |
|
|
| 252 |
|
|
| - |
|
|
| - |
| |||
| FFO (4) |
| 4,493 |
|
|
| 3,314 |
|
|
| 2,679 |
|
|
| (1,631 | ) |
|
| (107 | ) |
|
| 238 |
|
|
| - |
|
|
| - |
| |||
| Adjustments to equity in earnings of |
| 2,317 |
|
|
| 893 |
|
|
| - |
|
|
| 1,424 |
|
|
| - |
|
|
| - |
|
|
| - |
|
|
| - |
| |||
| FFO attributable to One Steuart Lane |
| 107 |
|
|
| - |
|
|
| - |
|
|
| - |
|
|
| 107 |
|
|
| - |
|
|
| - |
|
|
| - |
| |||
| Other non-core items |
| 263 |
|
|
| - |
|
|
| - |
|
|
| 263 |
|
|
| - |
|
|
| - |
|
|
| - |
|
|
| - |
| |||
| Core FFO (4) | $ | 7,180 |
|
| $ | 4,207 |
|
| $ | 2,679 |
|
| $ | 56 |
|
| $ | - |
|
| $ | 238 |
|
| $ | - |
|
| $ | - |
| |||
(1)
This property has been taken “out-of-service” for redevelopment.
(2)
Represents 1600 Broadway and Oder-Center, Germany.
(3)
Includes proceeds and cost of sales from the sale of residential condominium units at One Steuart Lane.
(4)
See page 54 for our definition of this measure.
- 31 -
| UNCONSOLIDATED JOINT VENTURES – OPERATING RESULTS |
(unaudited and in thousands)
|
|
|
|
| Six Months Ended June 30, 2023 |
| |||||||||||||||||||||||||||||
|
|
|
|
|
|
|
|
|
|
|
|
|
|
|
|
|
|
|
|
|
|
| Non-Core Assets |
| |||||||||||
|
|
|
|
|
|
|
| 712 Fifth |
|
| 55 Second |
|
| 60 Wall |
|
| One Steuart |
|
|
|
|
| Market |
|
| 111 Sutter |
| ||||||||
|
|
|
|
| Total |
|
| Avenue |
|
| Street |
|
| Street (1) |
|
| Lane |
|
| Other (2) |
|
| Center |
|
| Street |
| ||||||||
Total revenues | $ | 86,224 |
|
| $ | 24,407 |
|
| $ | 15,925 |
|
| $ | - |
|
| $ | 2,921 |
| (3) | $ | 8,346 |
|
| $ | 28,286 |
|
| $ | 6,339 |
| ||||
Total operating expenses |
| 49,691 |
|
|
| 11,555 |
|
|
| 6,912 |
|
|
| 215 |
|
|
| 8,477 |
| (3) |
| 3,907 |
|
|
| 14,621 |
|
|
| 4,004 |
| ||||
Net operating income (loss) (4) |
| 36,533 |
|
|
| 12,852 |
|
|
| 9,013 |
|
|
| (215 | ) |
|
| (5,556 | ) |
|
| 4,439 |
|
|
| 13,665 |
|
|
| 2,335 |
| ||||
Depreciation and amortization |
| (35,478 | ) |
|
| (5,655 | ) |
|
| (8,149 | ) |
|
| - |
|
|
| (37 | ) |
|
| (2,048 | ) |
|
| (15,113 | ) |
|
| (4,476 | ) | ||||
Interest and other income (loss), net |
| 1,492 |
|
|
| 496 |
|
|
| 280 |
|
|
| (5 | ) |
|
| 56 |
|
|
| 7 |
|
|
| 634 |
|
|
| 24 |
| ||||
Interest and debt expense |
| (33,361 | ) |
|
| (5,319 | ) |
|
| (3,713 | ) |
|
| (4,869 | ) |
|
| (4,792 | ) |
|
| (2,027 | ) |
|
| (6,987 | ) |
|
| (5,654 | ) | ||||
Real estate impairment loss |
| (455,893 | ) |
|
| - |
|
|
| - |
|
|
| (455,893 | ) |
|
| - |
|
|
| - |
|
|
| - |
|
|
| - |
| ||||
(Loss) income before income taxes |
| (486,707 | ) |
|
| 2,374 |
|
|
| (2,569 | ) |
|
| (460,982 | ) |
|
| (10,329 | ) |
|
| 371 |
|
|
| (7,801 | ) |
|
| (7,771 | ) | ||||
Income tax expense |
| (30 | ) |
|
| - |
|
|
| (19 | ) |
|
| - |
|
|
| (2 | ) |
|
| (4 | ) |
|
| (3 | ) |
|
| (2 | ) | ||||
Net (loss) income | $ | (486,737 | ) |
| $ | 2,374 |
|
| $ | (2,588 | ) |
| $ | (460,982 | ) |
| $ | (10,331 | ) |
| $ | 367 |
|
| $ | (7,804 | ) |
| $ | (7,773 | ) | ||||
|
|
|
|
|
|
|
|
|
|
|
|
|
|
|
|
|
|
|
|
|
|
|
|
|
|
|
| ||||||||
|
|
|
|
|
|
|
|
|
|
|
|
|
|
|
|
|
|
|
|
|
|
|
|
|
|
|
| ||||||||
|
|
|
|
|
|
|
|
|
|
|
|
|
|
|
|
|
|
|
|
|
|
|
|
|
|
|
| ||||||||
PGRE's share |
|
|
|
|
|
|
|
|
|
|
|
|
|
|
|
|
|
|
|
|
|
|
| ||||||||||||
Ownership | Total |
|
| 50.0% |
|
| 44.1% |
|
| 5.0% |
|
| 35.0% |
|
| Various |
|
| 67.0% |
|
| 49.0% |
| ||||||||||||
| Net (loss) income | $ | (34,151 | ) |
| $ | 1,187 |
|
| $ | (1,133 | ) |
| $ | (22,427 | ) |
| $ | (2,769 | ) |
| $ | 35 |
|
| $ | (5,234 | ) |
| $ | (3,810 | ) | |||
| Step-up basis adjustment |
| (2,636 | ) |
|
| - |
|
|
| (5 | ) |
|
| (2,574 | ) |
|
| (5 | ) |
|
| (52 | ) |
|
| - |
|
|
| - |
| |||
| Adjustments to equity in earnings of |
| 2,623 |
|
|
| (1,187 | ) |
|
| - |
|
|
| - |
|
|
| - |
|
|
| - |
|
|
| - |
|
|
| 3,810 |
| |||
| PGRE's share of net loss |
| (34,164 | ) |
|
| - |
|
|
| (1,138 | ) |
|
| (25,001 | ) |
|
| (2,774 | ) |
|
| (17 | ) |
|
| (5,234 | ) |
|
| - |
| |||
| Real estate depreciation and amortization |
| 19,012 |
|
|
| 2,828 |
|
|
| 3,598 |
|
|
| 12 |
|
|
| 13 |
|
|
| 241 |
|
|
| 10,126 |
|
|
| 2,194 |
| |||
| Real estate impairment loss |
| 24,734 |
|
|
| - |
|
|
| - |
|
|
| 24,734 |
|
|
| - |
|
|
| - |
|
|
| - |
|
|
| - |
| |||
| FFO (4) |
| 9,582 |
|
|
| 2,828 |
|
|
| 2,460 |
|
|
| (255 | ) |
|
| (2,761 | ) |
|
| 224 |
|
|
| 4,892 |
|
|
| 2,194 |
| |||
| Adjustments to equity in earnings of |
| (2,623 | ) |
|
| 1,187 |
|
|
| - |
|
|
| - |
|
|
| - |
|
|
| - |
|
|
| - |
|
|
| (3,810 | ) | |||
| FFO attributable to One Steuart Lane |
| 2,761 |
|
|
| - |
|
|
| - |
|
|
| - |
|
|
| 2,761 |
|
|
| - |
|
|
| - |
|
|
| - |
| |||
| Adjustments for non-core assets |
| (3,276 | ) |
|
| - |
|
|
| - |
|
|
| - |
|
|
| - |
|
|
| - |
|
|
| (4,892 | ) |
|
| 1,616 |
| |||
| Other non-core items |
| 244 |
|
|
| - |
|
|
| - |
|
|
| 244 |
|
|
| - |
|
|
| - |
|
|
| - |
|
|
| - |
| |||
| Core FFO (4) | $ | 6,688 |
|
| $ | 4,015 |
|
| $ | 2,460 |
|
| $ | (11 | ) |
| $ | - |
|
| $ | 224 |
|
| $ | - |
|
| $ | - |
| |||
(1)
This property has been taken “out-of-service” for redevelopment.
(2)
Represents 1600 Broadway and Oder-Center, Germany.
(3)
Includes proceeds and cost of sales from the sale of residential condominium units at One Steuart Lane.
(4)
See page 54 for our definition of this measure.
- 32 -
| REAL ESTATE RELATED FUNDS – BALANCE SHEETS |
|
|
|
| As of June 30, 2024 |
|
| As of June 30, 2024 |
| ||||||||||
|
|
|
| Consolidated Funds |
|
|
|
| ||||||||||
|
|
|
| Total |
|
|
|
|
| Residential |
|
| Total |
| ||||
|
|
|
| Consolidated Funds |
|
| Fund X |
|
| Development Fund |
|
| Unconsolidated Funds (1) |
| ||||
PGRE Ownership |
|
|
| 13.0% |
|
| 7.4% |
|
| Various |
| |||||||
Assets: |
|
|
|
|
|
|
|
|
|
|
| |||||||
| Cash and cash equivalents | $ | 12,084 |
|
| $ | 425 |
|
| $ | 11,659 |
|
| $ | 15,077 |
| ||
| Accounts and other receivables |
| 11 |
|
|
| - |
|
|
| 11 |
|
|
| - |
| ||
| Real estate related fund investments (2) |
| - |
|
|
| - |
|
|
| - |
|
|
| 333,383 |
| ||
| Investments in unconsolidated joint ventures |
| 88,050 |
|
|
| - |
|
|
| 88,050 |
| (3) |
| - |
| ||
| Other assets |
| 13 |
|
|
| 13 |
|
|
| - |
|
|
| 583 |
| ||
Total Assets | $ | 100,158 |
|
| $ | 438 |
|
| $ | 99,720 |
|
| $ | 349,043 |
| |||
|
|
|
|
|
|
|
|
|
|
|
|
|
|
| ||||
Liabilities: |
|
|
|
|
|
|
|
|
|
|
| |||||||
| Accounts payable and accrued expenses | $ | 66 |
|
| $ | 34 |
|
| $ | 32 |
|
| $ | 83 |
| ||
| Other liabilities |
| 7 |
|
|
| 4 |
|
|
| 3 |
|
|
| 1 |
| ||
Total Liabilities |
| 73 |
|
|
| 38 |
|
|
| 35 |
|
|
| 84 |
| |||
|
|
|
|
|
|
|
|
|
|
|
|
|
|
| ||||
Equity: |
|
|
|
|
|
|
|
|
|
|
| |||||||
| Paramount Group, Inc. equity |
| 6,745 |
|
|
| 52 |
|
|
| 6,693 |
|
|
| 4,536 |
| ||
| Joint Venture Partners' equity |
| 93,340 |
|
|
| 348 |
|
|
| 92,992 |
|
|
| 344,423 |
| ||
Total Equity |
| 100,085 |
|
|
| 400 |
|
|
| 99,685 |
|
|
| 348,959 |
| |||
|
|
|
|
|
|
|
|
|
|
|
|
| ||||||
Total Liabilities and Equity | $ | 100,158 |
|
| $ | 438 |
|
| $ | 99,720 |
|
| $ | 349,043 |
| |||
(1)
Represents Paramount Group Real Estate Fund VII, LP (“Fund VII”), Paramount Group Real Estate Fund VII-H, LP (“Fund VII-H”) and Paramount Group Real Estate Fund VIII, LP (“Fund VIII”).
(2)
Primarily represents investments in mezzanine loans.
(3)
Represents Residential Development Fund’s 35.0% ownership interest in One Steuart Lane.
- 33 -
| REAL ESTATE RELATED FUNDS – BALANCE SHEETS |
(unaudited and in thousands)
|
|
|
| As of December 31, 2023 |
|
| As of December 31, 2023 |
| ||||||||||
|
|
|
| Consolidated Funds |
|
|
|
| ||||||||||
|
|
|
| Total |
|
|
|
|
| Residential |
|
| Total |
| ||||
|
|
|
| Consolidated Funds |
|
| Fund X |
|
| Development Fund |
|
| Unconsolidated Funds (1) |
| ||||
PGRE Ownership |
|
|
| 13.0% |
|
| 7.4% |
|
| Various |
| |||||||
Assets: |
|
|
|
|
|
|
|
|
|
|
| |||||||
| Cash and cash equivalents | $ | 29,715 |
|
| $ | 9,353 |
|
| $ | 20,362 |
|
| $ | 14,274 |
| ||
| Accounts and other receivables |
| 134 |
|
|
| - |
|
|
| 134 |
|
|
| - |
| ||
| Real estate related fund investments (2) |
| 775 |
|
|
| 775 |
|
|
| - |
|
|
| 335,353 |
| ||
| Investments in unconsolidated joint ventures |
| 89,949 |
|
|
| - |
|
|
| 89,949 |
| (3) |
| - |
| ||
| Other assets |
| 9 |
|
|
| 9 |
|
|
| - |
|
|
| 459 |
| ||
Total Assets | $ | 120,582 |
|
| $ | 10,137 |
|
| $ | 110,445 |
|
| $ | 350,086 |
| |||
|
|
|
|
|
|
|
|
|
|
|
|
|
|
| ||||
Liabilities: |
|
|
|
|
|
|
|
|
|
|
| |||||||
| Accounts payable and accrued expenses | $ | 90 |
|
| $ | 55 |
|
| $ | 35 |
|
| $ | 88 |
| ||
| Other liabilities |
| 1,019 |
|
|
| 1,014 |
|
|
| 5 |
|
|
| 1 |
| ||
Total Liabilities |
| 1,109 |
|
|
| 1,069 |
|
|
| 40 |
|
|
| 89 |
| |||
|
|
|
|
|
|
|
|
|
|
|
|
|
|
| ||||
Equity: |
|
|
|
|
|
|
|
|
|
|
| |||||||
| Paramount Group, Inc. equity |
| 8,884 |
|
|
| 1,181 |
|
|
| 7,703 |
|
|
| 4,549 |
| ||
| Joint Venture Partners' equity |
| 110,589 |
|
|
| 7,887 |
|
|
| 102,702 |
|
|
| 345,448 |
| ||
Total Equity |
| 119,473 |
|
|
| 9,068 |
|
|
| 110,405 |
|
|
| 349,997 |
| |||
|
|
|
|
|
|
|
|
|
|
|
|
| ||||||
Total Liabilities and Equity | $ | 120,582 |
|
| $ | 10,137 |
|
| $ | 110,445 |
|
| $ | 350,086 |
| |||
(1)
Represents Fund VII, Fund VII-H and Fund VIII.
(2)
Primarily represents investments in mezzanine loans.
(3)
Represents Residential Development Fund’s 35.0% ownership interest in One Steuart Lane.
- 34 -
| REAL ESTATE RELATED FUNDS – OPERATING RESULTS |
(unaudited and in thousands)
|
|
|
|
|
| Three Months Ended |
| ||||||||||
|
|
| Three Months Ended June 30, 2024 |
|
| June 30, 2024 |
| ||||||||||
|
|
| Consolidated Funds |
|
|
|
| ||||||||||
|
|
| Total |
|
|
|
|
| Residential |
|
| Total |
| ||||
|
|
| Consolidated Funds |
|
| Fund X |
|
| Development Fund |
|
| Unconsolidated Funds (1) |
| ||||
Net investment (loss) income | $ | (27 | ) |
| $ | (27 | ) |
| $ | - |
|
| $ | 2,466 |
| ||
Net unrealized losses |
| - |
|
|
| - |
|
|
| - |
|
|
| (3,640 | ) | ||
Loss from real estate related fund investments |
| (27 | ) |
|
| (27 | ) |
|
| - |
|
|
| (1,174 | ) | ||
Loss from unconsolidated joint ventures |
| (798 | ) |
|
| - |
|
|
| (798 | ) |
|
| - |
| ||
Interest and other income, net |
| 187 |
|
|
| - |
|
|
| 187 |
|
|
| - |
| ||
Net loss | $ | (638 | ) |
| $ | (27 | ) |
| $ | (611 | ) |
| $ | (1,174 | ) | ||
|
|
|
|
|
|
|
|
|
|
|
|
|
| ||||
|
|
|
|
|
|
|
|
|
|
|
|
|
| ||||
PGRE's share |
|
|
|
|
|
|
|
|
|
|
| ||||||
Ownership | Total |
|
| 13.0% |
|
| 7.4% |
|
| Total |
| ||||||
| Net loss / FFO | $ | (49 | ) |
| $ | (3 | ) |
| $ | (46 | ) |
| $ | (15 | ) | |
| FFO attributable to One Steuart Lane |
| 59 |
|
|
| - |
|
|
| 59 |
|
|
| - |
| |
| Realized and unrealized gains and losses from real estate |
| - |
|
|
| - |
|
|
| - |
|
|
| 47 |
| |
| Core FFO (2) | $ | 10 |
|
| $ | (3 | ) |
| $ | 13 |
|
| $ | 32 |
| |
|
|
|
|
|
|
|
|
|
|
|
|
|
| ||||
|
|
|
|
|
|
|
|
|
|
|
|
|
| ||||
Noncontrolling interests' share |
|
|
|
|
|
|
|
|
|
|
| ||||||
Ownership | Total |
|
| 87.0% |
|
| 92.6% |
|
|
|
| ||||||
| Net loss / FFO | $ | (589 | ) |
| $ | (24 | ) |
| $ | (565 | ) |
|
|
| ||
| FFO attributable to One Steuart Lane |
| 739 |
|
|
| - |
|
|
| 739 |
|
|
|
| ||
| Core FFO (2) | $ | 150 |
|
| $ | (24 | ) |
| $ | 174 |
|
|
|
| ||
(1)
Represents Fund VII, Fund VII-H and Fund VIII.
(2)
See page 54 for our definition of this measure.
- 35 -
| REAL ESTATE RELATED FUNDS – OPERATING RESULTS |
(unaudited and in thousands)
|
|
|
|
|
| Three Months Ended |
| ||||||||||
|
|
| Three Months Ended June 30, 2023 |
|
| June 30, 2023 |
| ||||||||||
|
|
| Consolidated Funds |
|
|
|
| ||||||||||
|
|
| Total |
|
|
|
|
| Residential |
|
| Total |
| ||||
|
|
| Consolidated Fund |
|
| Fund X |
|
| Development Fund |
|
| Unconsolidated Funds (1) |
| ||||
Net investment income | $ | 3,048 |
|
| $ | 3,048 |
|
| $ | - |
|
| $ | 1,967 |
| ||
Net realized losses |
| (1,224 | ) |
|
| (1,224 | ) |
|
| - |
|
|
| - |
| ||
Net unrealized (losses) gains |
| (44,468 | ) |
|
| (44,468 | ) |
|
| - |
|
|
| 514 |
| ||
(Loss) income from real estate related fund investments |
| (42,644 | ) |
|
| (42,644 | ) |
|
| - |
|
|
| 2,481 |
| ||
Loss from unconsolidated joint ventures |
| (358 | ) |
|
| - |
|
|
| (358 | ) |
|
| - |
| ||
Interest and other income, net |
| 449 |
|
|
| - |
|
|
| 449 |
|
|
| - |
| ||
Net (loss) income | $ | (42,553 | ) |
| $ | (42,644 | ) |
| $ | 91 |
|
| $ | 2,481 |
| ||
|
|
|
|
|
|
|
|
|
|
|
|
|
| ||||
PGRE's share |
|
|
|
|
|
|
|
|
|
|
| ||||||
Ownership | Total |
|
| 13.0% |
|
| 7.4% |
|
| Total |
| ||||||
| Net (loss) income | $ | (5,551 | ) |
| $ | (5,553 | ) |
| $ | 2 |
|
| $ | 32 |
| |
| Management fee income |
| 299 |
|
|
| 299 |
|
|
| - |
|
|
| - |
| |
| PGRE's share of net (loss) income |
| (5,252 | ) |
|
| (5,254 | ) |
|
| 2 |
|
|
| 32 |
| |
| Real estate depreciation and amortization |
| - |
|
|
| - |
|
|
| - |
|
|
| - |
| |
| FFO (2) |
| (5,252 | ) |
|
| (5,254 | ) |
|
| 2 |
|
|
| 32 |
| |
| FFO attributable to One Steuart Lane |
| 26 |
|
|
| - |
|
|
| 26 |
|
|
| - |
| |
| Realized and unrealized gains and losses from real estate |
| 5,950 |
|
|
| 5,950 |
|
|
| - |
|
|
| (6 | ) | |
| Core FFO (2) | $ | 724 |
|
| $ | 696 |
|
| $ | 28 |
|
| $ | 26 |
| |
|
|
|
|
|
|
|
|
|
|
|
|
|
| ||||
Noncontrolling interests' share |
|
|
|
|
|
|
|
|
|
|
| ||||||
Ownership | Total |
|
| 87.0% |
|
| 92.6% |
|
|
|
| ||||||
| Net (loss) income | $ | (37,002 | ) |
| $ | (37,091 | ) |
| $ | 89 |
|
|
|
| ||
| Management fee expense |
| (299 | ) |
|
| (299 | ) |
|
| - |
|
|
|
| ||
| Net (loss) income attributable to joint venture partners |
| (37,301 | ) |
|
| (37,390 | ) |
|
| 89 |
|
|
|
| ||
| Real estate depreciation and amortization |
| 6 |
|
|
| - |
|
|
| 6 |
|
|
|
| ||
| FFO (2) |
| (37,295 | ) |
|
| (37,390 | ) |
|
| 95 |
|
|
|
| ||
| FFO attributable to One Steuart Lane |
| 326 |
|
|
| - |
|
|
| 326 |
|
|
|
| ||
| Realized and unrealized gains and losses from real estate |
| 39,742 |
|
|
| 39,742 |
|
|
| - |
|
|
|
| ||
| Core FFO (2) | $ | 2,773 |
|
| $ | 2,352 |
|
| $ | 421 |
|
|
|
| ||
(1)
Represents Fund VII, Fund VII-H and Fund VIII.
(2)
See page 54 for our definition of this measure.
- 36 -
| REAL ESTATE RELATED FUNDS – OPERATING RESULTS |
(unaudited and in thousands)
|
|
|
|
|
| Six Months Ended |
| ||||||||||
|
|
| Six Months Ended June 30, 2024 |
|
| June 30, 2024 |
| ||||||||||
|
|
| Consolidated Funds |
|
|
|
| ||||||||||
|
|
| Total |
|
|
|
|
| Residential |
|
| Total |
| ||||
|
|
| Consolidated Funds |
|
| Fund X |
|
| Development Fund |
|
| Unconsolidated Funds (1) |
| ||||
Net investment income | $ | 705 |
|
| $ | 705 |
|
| $ | - |
|
| $ | 8,985 |
| ||
Net unrealized losses |
| (775 | ) |
|
| (775 | ) |
|
| - |
|
|
| (2,021 | ) | ||
(Loss) income from real estate related fund investments |
| (70 | ) |
|
| (70 | ) |
|
| - |
|
|
| 6,964 |
| ||
Loss from unconsolidated joint ventures |
| (107 | ) |
|
| - |
|
|
| (107 | ) |
|
| - |
| ||
Interest and other income, net |
| 387 |
|
|
| - |
|
|
| 387 |
|
|
| - |
| ||
Net income (loss) | $ | 210 |
|
| $ | (70 | ) |
| $ | 280 |
|
| $ | 6,964 |
| ||
|
|
|
|
|
|
|
|
|
|
|
|
|
| ||||
|
|
|
|
|
|
|
|
|
|
|
|
|
| ||||
PGRE's share |
|
|
|
|
|
|
|
|
|
|
| ||||||
Ownership | Total |
|
| 13.0% |
|
| 7.4% |
|
| Total |
| ||||||
| Net income / FFO | $ | 37 |
|
| $ | 4 |
|
| $ | 33 |
|
| $ | 90 |
| |
| FFO attributable to One Steuart Lane |
| 8 |
|
|
| - |
|
|
| 8 |
|
|
| - |
| |
| Realized and unrealized gains and losses from real estate |
| 101 |
|
|
| 101 |
|
|
| - |
|
|
| 26 |
| |
| Core FFO (2) | $ | 146 |
|
| $ | 105 |
|
| $ | 41 |
|
| $ | 116 |
| |
|
|
|
|
|
|
|
|
|
|
|
|
|
| ||||
|
|
|
|
|
|
|
|
|
|
|
|
|
| ||||
Noncontrolling interests' share |
|
|
|
|
|
|
|
|
|
|
| ||||||
Ownership | Total |
|
| 87.0% |
|
| 92.6% |
|
|
|
| ||||||
| Net income (loss) / FFO | $ | 173 |
|
| $ | (74 | ) |
| $ | 247 |
|
|
|
| ||
| FFO attributable to One Steuart Lane |
| 99 |
|
|
| - |
|
|
| 99 |
|
|
|
| ||
| Realized and unrealized gains and losses from real estate |
| 674 |
|
|
| 674 |
|
|
| - |
|
|
|
| ||
| Core FFO (2) | $ | 946 |
|
| $ | 600 |
|
| $ | 346 |
|
|
|
| ||
(1)
Represents Fund VII, Fund VII-H and Fund VIII.
(2)
See page 54 for our definition of this measure.
- 37 -
| REAL ESTATE RELATED FUNDS – OPERATING RESULTS |
(unaudited and in thousands)
|
|
|
|
|
| Six Months Ended |
| ||||||||||
|
|
| Six Months Ended June 30, 2023 |
|
| June 30, 2023 |
| ||||||||||
|
|
| Consolidated Funds |
|
|
|
| ||||||||||
|
|
| Total |
|
|
|
|
| Residential |
|
| Total |
| ||||
|
|
| Consolidated Fund |
|
| Fund X |
|
| Development Fund |
|
| Unconsolidated Funds (1) |
| ||||
Net investment income | $ | 7,709 |
|
| $ | 7,709 |
|
| $ | - |
|
| $ | 5,541 |
| ||
Net realized losses |
| (1,224 | ) |
|
| (1,224 | ) |
|
| - |
|
|
| - |
| ||
Net unrealized losses |
| (45,579 | ) |
|
| (45,579 | ) |
|
| - |
|
|
| (16,888 | ) | ||
Loss from real estate related fund investments |
| (39,094 | ) |
|
| (39,094 | ) |
|
| - |
|
|
| (11,347 | ) | ||
Loss from unconsolidated joint ventures |
| (2,774 | ) |
|
| - |
|
|
| (2,774 | ) |
|
| - |
| ||
Interest and other income, net |
| 612 |
|
|
| - |
|
|
| 612 |
|
|
| - |
| ||
Loss before income taxes |
| (41,256 | ) |
|
| (39,094 | ) |
|
| (2,162 | ) |
|
| (11,347 | ) | ||
Income tax expense |
| (1 | ) |
|
| - |
|
|
| (1 | ) |
|
| - |
| ||
Net loss | $ | (41,257 | ) |
| $ | (39,094 | ) |
| $ | (2,163 | ) |
| $ | (11,347 | ) | ||
|
|
|
|
|
|
|
|
|
|
|
|
|
| ||||
PGRE's share |
|
|
|
|
|
|
|
|
|
|
| ||||||
Ownership | Total |
|
| 13.0% |
|
| 7.4% |
|
| Total |
| ||||||
| Net loss | $ | (5,349 | ) |
| $ | (5,091 | ) |
| $ | (258 | ) |
| $ | (146 | ) | |
| Management fee income |
| 570 |
|
|
| 570 |
|
|
| - |
|
|
| - |
| |
| PGRE's share of net loss |
| (4,779 | ) |
|
| (4,521 | ) |
|
| (258 | ) |
|
| (146 | ) | |
| Real estate depreciation and amortization |
| - |
|
|
| - |
|
|
| - |
|
|
| - |
| |
| FFO (2) |
| (4,779 | ) |
|
| (4,521 | ) |
|
| (258 | ) |
|
| (146 | ) | |
| FFO attributable to One Steuart Lane |
| 205 |
|
|
| - |
|
|
| 205 |
|
|
| - |
| |
| Realized and unrealized gains and losses from real estate |
| 6,094 |
|
|
| 6,094 |
|
|
| - |
|
|
| 218 |
| |
| Core FFO (2) | $ | 1,520 |
|
| $ | 1,573 |
|
| $ | (53 | ) |
| $ | 72 |
| |
|
|
|
|
|
|
|
|
|
|
|
|
|
| ||||
Noncontrolling interests' share |
|
|
|
|
|
|
|
|
|
|
| ||||||
Ownership | Total |
|
| 87.0% |
|
| 92.6% |
|
|
|
| ||||||
| Net loss | $ | (35,908 | ) |
| $ | (34,003 | ) |
| $ | (1,905 | ) |
|
|
| ||
| Management fee expense |
| (570 | ) |
|
| (570 | ) |
|
| - |
|
|
|
| ||
| Net loss attributable to joint venture partners |
| (36,478 | ) |
|
| (34,573 | ) |
|
| (1,905 | ) |
|
|
| ||
| Real estate depreciation and amortization |
| 13 |
|
|
| - |
|
|
| 13 |
|
|
|
| ||
| FFO (2) |
| (36,465 | ) |
|
| (34,573 | ) |
|
| (1,892 | ) |
|
|
| ||
| FFO attributable to One Steuart Lane |
| 2,556 |
|
|
| - |
|
|
| 2,556 |
|
|
|
| ||
| Realized and unrealized gains and losses from real estate |
| 40,709 |
|
|
| 40,709 |
|
|
| - |
|
|
|
| ||
| Core FFO (2) | $ | 6,800 |
|
| $ | 6,136 |
|
| $ | 664 |
|
|
|
| ||
(1)
Represents Fund VII, Fund VII-H and Fund VIII.
(2)
See page 54 for our definition of this measure.
- 38 -
| CAPITAL STRUCTURE |
(unaudited and in thousands, except share, unit and per share amounts)
|
|
|
|
|
|
|
| As of June 30, 2024 |
|
| ||||||||||
Debt (1): |
|
|
| At 100% |
|
| At PGRE's Share (2) |
|
| Excluding Non-Core Debt (3) |
|
| ||||||||
| Notes and mortgages payable (secured debt): |
|
|
|
|
|
|
|
|
|
|
|
| |||||||
| Consolidated debt |
|
|
| $ | 3,692,050 |
|
| $ | 2,973,680 |
|
| $ | 2,973,680 |
|
| ||||
| Unconsolidated joint ventures debt |
|
|
|
| 1,183,160 |
|
|
| 272,099 |
|
|
| 272,099 |
|
| ||||
| Non-core unconsolidated joint ventures debt |
|
|
|
| 581,911 |
|
|
| 359,931 |
|
|
| - |
|
| ||||
| Revolving Credit Facility (unsecured debt) |
|
|
|
| - |
|
|
| - |
|
|
| - |
|
| ||||
| Total debt |
|
|
| $ | 5,457,121 |
|
|
| 3,605,710 |
| (A) |
| 3,245,779 |
| (A) | ||||
|
|
|
|
|
|
|
|
|
|
|
|
|
|
|
|
| ||||
|
|
|
|
|
|
|
|
|
|
|
|
|
|
|
|
| ||||
|
|
|
|
|
|
|
|
|
|
|
|
|
|
|
|
| ||||
|
|
|
|
| Shares / Units |
|
| Share Price as of |
|
|
|
|
|
|
|
| ||||
Equity: | Outstanding |
|
| June 30, 2024 |
|
|
|
|
|
|
|
| ||||||||
| Common stock |
| 217,455,051 |
|
| $ | 4.63 |
|
|
| 1,006,817 |
|
|
| 1,006,817 |
|
| |||
| Operating Partnership units |
| 20,103,251 |
|
|
| 4.63 |
|
|
| 93,078 |
|
|
| 93,078 |
|
| |||
| Total equity |
| 237,558,302 |
|
|
| 4.63 |
|
|
| 1,099,895 |
|
|
| 1,099,895 |
|
| |||
|
|
|
|
|
|
|
|
|
|
|
|
|
|
|
|
| ||||
|
|
|
|
|
|
|
|
|
|
|
|
|
|
|
|
| ||||
Total Market Capitalization | $ | 4,705,605 |
|
| $ | 4,345,674 |
|
| ||||||||||||
|
|
|
|
|
|
|
|
|
|
|
|
|
|
|
|
| ||||
PGRE's share of cash and cash equivalents and restricted cash (2) |
|
| $ | 417,758 |
| (B) | $ | 409,438 |
| (B) | ||||||||||
|
|
|
|
|
|
|
|
|
|
|
|
|
|
|
|
| ||||
PGRE's share of net debt (2) (A - B) |
|
| $ | 3,187,952 |
|
| $ | 2,836,341 |
|
| ||||||||||
|
|
|
|
|
|
| ||||||||||||||
PGRE's share of Net Debt to Annualized Adjusted EBITDAre (2) | 9.7x |
|
| 8.6x |
|
| ||||||||||||||
(1)
Represents contractual amounts due pursuant to the respective debt agreements.
(2)
See page 54 for our definition of this measure.
(3)
Excludes debt on Market Center and 111 Sutter Street.
- 39 -
| DEBT ANALYSIS |

(unaudited)
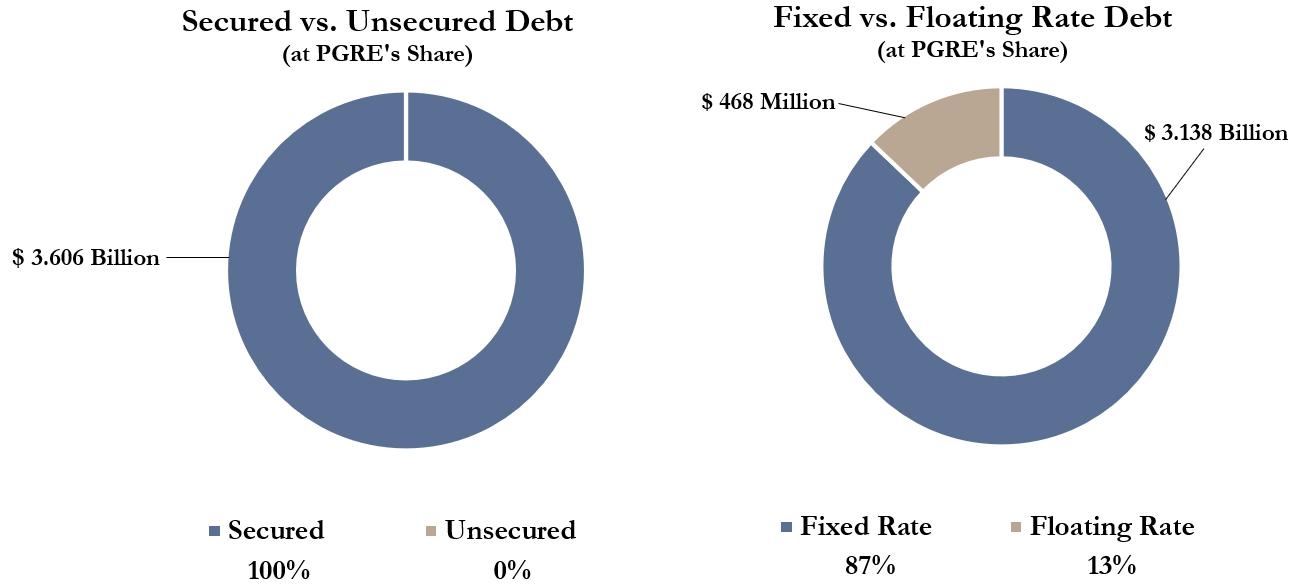
Revolving Credit Facility Covenants: (1) | Required |
| Actual |
|
| PGRE's Share of Total Debt (2) Composition | |||||||||||||
| Total Debt / Total Assets | Less than 60% | 46.8% |
|
|
|
|
|
| Weighted Average |
|
| |||||||
| Secured Debt / Total Assets | Less than 50% | 46.8% |
|
|
|
|
|
| Interest Rate |
| Years to Maturity |
|
| |||||
| Fixed Charge Coverage | Greater than 1.5x | 2.79x |
|
|
| Secured vs. Unsecured Debt: |
|
|
|
|
| |||||||
| Unsecured Debt / Unencumbered Assets | Less than 60% | 0.0% |
|
|
|
| Secured Debt | 3.92% |
| 3.1 |
|
| ||||||
| Unencumbered Interest Coverage | Greater than 1.75x | 37.50x |
|
|
|
| Unsecured Debt | - % |
| - |
|
| ||||||
|
|
|
|
|
|
|
|
|
|
|
|
| Total | 3.92% |
| 3.1 |
|
| |
|
|
|
|
|
|
|
|
|
|
|
|
|
|
|
|
|
|
|
|
|
|
|
|
|
|
|
|
|
|
|
| Fixed vs. Floating Rate Debt: |
|
|
|
|
| ||
|
|
|
|
|
|
|
|
|
|
|
|
| Fixed Rate Debt | 3.31% |
| 3.3 |
|
| |
|
|
|
|
|
|
|
|
|
|
|
|
| Floating Rate Debt | 8.01% |
| 2.1 |
|
| |
|
|
|
|
|
|
|
|
|
|
| Total | 3.92% |
| 3.1 |
|
| |||
|
|
|
|
|
|
|
|
|
|
|
| ||||||||
(1)
This section presents ratios as of June 30, 2024 in accordance with the terms of our revolving credit facility agreement, which has been filed with the SEC. We are not presenting these ratios and the related calculations for any other purpose or for any other period, and are not intending for these measures to otherwise provide information to investors about our financial condition or results of operations. Investors should not rely on these measures other than for purposes of considering our compliance with the revolving credit facility.
(2)
See page 54 for our definition of this measure.
- 40 -
| DEBT MATURITIES |
(unaudited and in thousands)
Notes and mortgages payable (secured) | Paramount |
|
| PGRE's Share of Debt |
|
|
|
|
| ||||||||||||||||||||||||||||||
Consolidated Debt: | Ownership |
|
| 2024 |
|
| 2025 |
|
| 2026 |
|
| 2027 |
|
| 2028 |
|
| Thereafter |
|
| Total |
|
| Rate |
|
| ||||||||||||
| 31 West 52nd Street ($500,000) |
| 100.0 | % |
| $ | - |
|
| $ | - |
|
| $ | 500,000 |
|
| $ | - |
|
| $ | - |
|
| $ | - |
|
| $ | 500,000 |
|
|
| 3.80 | % |
| ||
| 1301 Avenue of the Americas ($860,000) |
| 100.0 | % |
|
| - |
|
|
| - |
|
|
| 860,000 |
|
|
| - |
|
|
| - |
|
|
| - |
|
|
| 860,000 |
|
|
| 4.87 | % | (1) | ||
| 300 Mission Street ($232,050) |
| 31.1 | % |
|
| - |
|
|
| - |
|
|
| 72,168 |
|
|
| - |
|
|
| - |
|
|
| - |
|
|
| 72,168 |
|
|
| 4.50 | % |
| ||
| One Market Plaza ($850,000) |
| 49.0 | % |
|
| - |
|
|
| - |
|
|
| - |
|
|
| 416,500 |
|
|
| - |
|
|
| - |
|
|
| 416,500 |
|
|
| 4.08 | % |
| ||
| 1633 Broadway ($1,250,000) |
| 90.0 | % |
|
| - |
|
|
| - |
|
|
| - |
|
|
| - |
|
|
| - |
|
|
| 1,125,012 |
|
|
| 1,125,012 |
|
|
| 2.99 | % |
| ||
|
|
|
|
|
|
|
|
|
|
|
|
|
|
|
|
|
|
|
|
|
|
|
|
|
|
|
|
|
|
| |||||||||
Unconsolidated JV Debt: |
|
|
|
|
|
|
|
|
|
|
|
|
|
|
|
|
|
|
|
|
|
|
| ||||||||||||||||
| 55 Second Street ($187,500) |
| 44.1 | % |
|
| - |
|
|
| - |
|
|
| 82,669 |
|
|
| - |
|
|
| - |
|
|
| - |
|
|
| 82,669 |
|
|
| 3.88 | % |
| ||
| 712 Fifth Avenue ($300,000) |
| 50.0 | % |
|
| - |
|
|
| - |
|
|
| - |
|
|
| 150,000 |
|
|
| - |
|
|
| - |
|
|
| 150,000 |
|
|
| 3.39 | % |
| ||
| Oder-Center, Germany ($10,483) |
| 9.5 | % |
|
| - |
|
|
| - |
|
|
| - |
|
|
| - |
|
|
| 996 |
|
|
| - |
|
|
| 996 |
|
|
| 5.50 | % |
| ||
| 60 Wall Street ($587,177) |
| 5.0 | % |
|
| - |
|
|
| - |
|
|
| - |
|
|
| - |
|
|
| - |
|
|
| 29,418 |
|
|
| 29,418 |
|
|
| 9.70 | % | (2) | ||
| 1600 Broadway ($98,000) |
| 9.2 | % |
|
| - |
|
|
| - |
|
|
| - |
|
|
| - |
|
|
| - |
|
|
| 9,016 |
|
|
| 9,016 |
|
|
| 3.45 | % |
| ||
|
|
|
|
|
|
|
|
|
|
|
|
|
|
|
|
|
|
|
|
|
|
|
|
|
|
|
|
|
|
| |||||||||
Non-Core Unconsolidated JV Debt: |
|
|
|
|
|
|
|
|
|
|
|
|
|
|
|
|
|
|
|
|
|
|
|
|
|
| |||||||||||||
| 111 Sutter Street ($166,387) |
| 49.0 | % |
|
| - |
|
|
| 81,530 |
|
|
| - |
|
|
| - |
|
|
| - |
|
|
| - |
|
|
| 81,530 |
|
|
| 7.48 | % | (3) | ||
| Market Center ($415,524) |
| 67.0 | % |
|
| - |
|
|
| 278,401 |
|
|
| - |
|
|
| - |
|
|
| - |
|
|
| - |
|
|
| 278,401 |
|
|
| 3.23 | % | (4) | ||
|
|
|
|
|
|
|
|
|
|
|
|
|
|
|
|
|
|
|
|
|
|
|
|
|
|
|
|
|
|
| |||||||||
Revolving Credit Facility (unsecured) |
| 100.0 | % |
|
| - |
|
|
| - |
|
|
| - |
|
|
| - |
|
|
| - |
|
|
| - |
|
|
| - |
|
|
| - | % |
| |||
|
|
|
|
|
|
|
|
|
|
|
|
|
|
|
|
|
|
|
|
|
|
|
|
|
|
|
|
|
|
| |||||||||
PGRE's Share of Total Debt (5) |
|
| $ | - |
|
| $ | 359,931 |
|
| $ | 1,514,837 |
|
| $ | 566,500 |
|
| $ | 996 |
|
| $ | 1,163,446 |
|
| $ | 3,605,710 |
|
|
|
|
| ||||||
| Weighted average rate |
|
|
| - | % |
|
| 4.19 | % |
|
| 4.44 | % |
|
| 3.90 | % |
|
| 5.50 | % |
|
| 3.16 | % |
|
| 3.92 | % |
|
|
|
| |||||
| % of debt maturing |
|
|
| - | % |
|
| 10.0 | % |
|
| 42.0 | % |
|
| 15.7 | % |
|
| 0.0 | % |
|
| 32.3 | % |
|
| 100.0 | % |
|
|
|
| |||||
|
|
|
|
|
|
|
|
|
|
|
|
|
|
|
|
|
|
|
|
|
|
|
|
|
|
|
|
|
|
| |||||||||
PGRE's Share of Total Debt Excluding Non-Core Assets | $ | - |
|
| $ | - |
|
| $ | 1,514,837 |
|
| $ | 566,500 |
|
| $ | 996 |
|
| $ | 1,163,446 |
|
| $ | 3,245,779 |
|
|
|
|
| ||||||||
| Weighted average rate |
|
|
| - | % |
|
| - | % |
|
| 4.44 | % |
|
| 3.90 | % |
|
| 5.50 | % |
|
| 3.16 | % |
|
| 3.89 | % |
|
|
|
| |||||
| % of debt maturing |
|
|
| - | % |
|
| - | % |
|
| 46.7 | % |
|
| 17.5 | % |
|
| 0.0 | % |
|
| 35.8 | % |
|
| 100.0 | % |
|
|
|
| |||||
(1)
Consists of (i) $500,000 of variable rate loans that have been fixed at 2.49% by interest rate swaps through August 2024 and (ii) $360,000 of variable rate loans that bear interest at SOFR plus 368 basis points, where SOFR has been capped at 4.50% through August 2024.
(2)
Consists of (i) a $16,008 A-Note that bears interest at SOFR plus 245 basis points, of which 4.00% is current and the remaining interest will be accrued and (ii) a $13,410 B-Note that will accrue interest at a fixed rate of 12.00%.
(3)
This loan bears interest at a rate of SOFR plus 215 basis points.
(4)
Consists of (i) a $269,340 variable rate loan that has been fixed at 3.11% by an interest rate swap through December 2024 and (ii) a $9,061 variable rate loan that bears interest at SOFR plus 161 basis points.
(5)
See page 54 for our definition of this measure.
- 41 -
| PORTFOLIO SUMMARY – TOTAL |

(unaudited and in thousands, except square feet and per square foot amounts)
|
|
|
|
|
|
|
|
|
|
| Annualized Rent (1) |
|
| Square Feet |
| ||||||||||||||||
|
|
|
|
| % |
|
| % |
|
|
|
|
| Per |
|
| In |
|
| Out-of- |
|
|
|
| |||||||
|
|
| Leased (1) |
|
| Occupied (1) |
|
| Amount |
|
| Square Foot (2) |
|
| Service |
|
| Service |
|
| Total |
| |||||||||
Same Store Portfolio |
|
|
|
|
|
|
|
|
|
|
|
|
|
|
|
|
|
|
|
| |||||||||||
| Weighted average |
| 86.3 | % |
|
| 83.4 | % |
| $ | 789,458 |
|
| $ | 92.79 |
|
|
| 10,323,270 |
|
|
| - |
|
|
| 10,323,270 |
| |||
| PGRE's share |
|
| 86.3 | % |
|
| 82.7 | % |
| $ | 597,894 |
|
| $ | 88.70 |
|
|
| 8,292,891 |
|
|
| - |
|
|
| 8,292,891 |
| ||
|
|
|
|
|
|
|
|
|
|
|
|
|
|
|
|
|
|
|
|
|
|
|
|
| |||||||
Non-Same Store Portfolio (3) |
|
|
|
|
|
|
|
|
|
|
|
|
|
|
|
|
|
|
|
| |||||||||||
| Weighted average |
| 50.4 | % |
|
| 50.2 | % |
| $ | 43,681 |
|
| $ | 87.02 |
|
|
| 1,026,892 |
|
|
| 1,643,651 |
|
|
| 2,670,543 |
| |||
| PGRE's share |
|
| 48.6 | % |
|
| 48.3 | % |
| $ | 26,823 |
|
| $ | 86.99 |
|
|
| 638,271 |
|
|
| 82,347 |
|
|
| 720,618 |
| ||
|
|
|
|
|
|
|
|
|
|
|
|
|
|
|
|
|
|
|
|
|
|
|
|
| |||||||
Total Portfolio |
|
|
|
|
|
|
|
|
|
|
|
|
|
|
|
|
|
|
|
| |||||||||||
| Weighted average |
| 83.0 | % |
|
| 80.3 | % |
| $ | 833,139 |
|
| $ | 92.47 |
|
|
| 11,350,162 |
|
|
| 1,643,651 |
|
|
| 12,993,813 |
| |||
| PGRE's share |
|
| 83.6 | % |
|
| 80.3 | % |
| $ | 624,717 |
|
| $ | 88.62 |
|
|
| 8,931,162 |
|
|
| 82,347 |
|
|
| 9,013,509 |
| ||
|
|
|
|
|
|
|
|
|
|
|
|
|
|
|
|
|
|
|
|
|
|
|
|
| |||||||
|
|
| Leased % (1) (at PGRE's Share) |
| |||||||||||||||||
|
|
| June 30, 2024 |
|
| March 31, 2024 |
|
| December 31, 2023 |
|
| September 30, 2023 |
|
| June 30, 2023 |
| |||||
Total Portfolio |
|
|
|
|
| ||||||||||||||||
New York |
|
|
| 86.9 | % |
|
| 90.1 | % |
|
| 90.2 | % |
|
| 90.4 | % |
|
| 90.5 | % |
San Francisco |
|
|
| 74.9 | % |
|
| 76.8 | % |
|
| 80.8 | % |
|
| 82.0 | % |
|
| 87.2 | % |
Weighted Average |
|
| 83.6 | % |
|
| 86.5 | % |
|
| 87.7 | % |
|
| 88.1 | % |
|
| 89.6 | % | |
(1)
See page 54 for our definition of this measure.
(2)
Represents office and retail space only.
(3)
Includes (i) 60 Wall Street in our New York portfolio, which has been taken “out-of-service” for redevelopment and (ii) Market Center and 111 Sutter Street in our San Francisco portfolio.
- 42 -
| PORTFOLIO SUMMARY – NEW YORK |
(unaudited and in thousands, except square feet and per square foot amounts)
|
|
|
|
|
|
|
|
|
|
|
|
| Annualized Rent (1) |
|
| Square Feet |
|
|
| |||||||||||||||||
|
|
|
| Paramount |
|
| % |
|
| % |
|
|
|
|
| Per |
|
| In |
|
| Out-of- |
|
|
|
|
|
| ||||||||
Property |
| Ownership |
|
| Leased (1) |
|
| Occupied (1) |
|
| Amount |
|
| Square Foot (2) |
|
| Service |
|
| Service |
|
| Total |
|
| Key Tenants | ||||||||||
1633 Broadway |
|
|
|
|
|
|
|
|
|
|
|
|
|
|
|
|
|
|
|
|
|
|
|
|
| |||||||||||
| Office |
| 90.0 | % |
|
| 94.0 | % |
|
| 94.0 | % |
| $ | 179,907 |
|
| $ | 84.52 |
|
|
| 2,275,229 |
|
|
| - |
|
|
| 2,275,229 |
|
| Allianz, Morgan Stanley, Warner Music Group, ICBC, | ||
|
|
|
|
|
|
|
|
|
|
|
|
|
|
|
|
|
|
|
|
|
|
|
|
|
| Showtime Networks, New Mountain Capital, MongoDB, | ||||||||||
|
|
|
|
|
|
|
|
|
|
|
|
|
|
|
|
|
|
|
|
|
|
|
|
|
| Bleacher Report, Kasowitz, Benson, Torres & Friedman | ||||||||||
| Retail / Theater |
| 90.0 | % |
|
| 97.7 | % |
|
| 97.7 | % |
|
| 11,772 |
|
|
| 69.57 |
|
|
| 253,611 |
|
|
| - |
|
|
| 253,611 |
|
| Gershwin Theatre, Thespian Theatre, Equinox, Din Tai Fung | ||
|
|
|
|
| 90.0 | % |
|
| 94.4 | % |
|
| 94.4 | % |
|
| 191,679 |
|
|
| 84.12 |
|
|
| 2,528,840 |
|
|
| - |
|
|
| 2,528,840 |
|
|
|
1301 Avenue of the Americas |
|
|
|
|
|
|
|
|
|
|
|
|
|
|
|
|
|
|
|
|
|
|
|
| ||||||||||||
| Office |
| 100.0 | % |
|
| 89.2 | % |
|
| 81.9 | % |
|
| 117,643 |
|
|
| 85.56 |
|
|
| 1,698,309 |
|
|
| - |
|
|
| 1,698,309 |
|
| Credit Agricole, Norton Rose Fulbright, CohnReznick, | ||
|
|
|
|
|
|
|
|
|
|
|
|
|
|
|
|
|
|
|
|
|
|
|
|
| Swiss Re, Oaktree Capital, ArentFox Schiff, Citizens Bank, | |||||||||||
|
|
|
|
|
|
|
|
|
|
|
|
|
|
|
|
|
|
|
|
|
|
|
|
|
|
|
| O'Melveny & Myers | ||||||||
| Retail / Paramount Club |
| 100.0 | % |
|
| 100.0 | % |
|
| 89.6 | % |
|
| 3,655 |
|
|
| 191.97 |
|
|
| 50,885 |
|
|
| - |
|
|
| 50,885 |
|
| Ocean Prime, Starbucks, Citizens Bank | ||
|
|
|
|
| 100.0 | % |
|
| 89.5 | % |
|
| 82.1 | % |
|
| 121,298 |
|
|
| 86.54 |
|
|
| 1,749,194 |
|
|
| - |
|
|
| 1,749,194 |
|
|
|
1325 Avenue of the Americas |
|
|
|
|
|
|
|
|
|
|
|
|
|
|
|
|
|
|
|
|
|
|
|
| ||||||||||||
| Office |
| 100.0 | % |
|
| 97.3 | % |
|
| 90.4 | % |
|
| 48,595 |
|
|
| 68.13 |
|
|
| 809,383 |
|
|
| - |
|
|
| 809,383 |
|
| McGraw Hill, Olshan Frome Wolosky, Hilton, Evercore, | ||
|
|
|
|
|
|
|
|
|
|
|
|
|
|
|
|
|
|
|
|
|
|
|
|
|
| Major League Baseball Players Association | ||||||||||
| Retail |
| 100.0 | % |
|
| 96.7 | % |
|
| 96.7 | % |
|
| 1,479 |
|
|
| 95.79 |
|
|
| 15,502 |
|
|
| - |
|
|
| 15,502 |
|
| La Grande Boucherie | ||
|
|
|
|
| 100.0 | % |
|
| 97.3 | % |
|
| 90.5 | % |
|
| 50,074 |
|
|
| 68.57 |
|
|
| 824,885 |
|
|
| - |
|
|
| 824,885 |
|
|
|
31 West 52nd Street |
|
|
|
|
|
|
|
|
|
|
|
|
|
|
|
|
|
|
|
|
|
|
|
| ||||||||||||
| Office |
| 100.0 | % |
|
| 65.8 | % |
|
| 51.7 | % |
|
| 36,975 |
|
|
| 95.75 |
|
|
| 747,767 |
|
|
| - |
|
|
| 747,767 |
|
| Pillsbury Winthrop Shaw Pittman, Centerview Partners, | ||
|
|
|
|
|
|
|
|
|
|
|
|
|
|
|
|
|
|
|
|
|
|
|
|
|
| Bracewell, Providence Equity Partners, Wilson Sonsini | ||||||||||
| Retail |
| 100.0 | % |
|
| 87.1 | % |
|
| 87.1 | % |
|
| 4,919 |
|
|
| 124.47 |
|
|
| 25,915 |
|
|
| - |
|
|
| 25,915 |
|
| Fogo De Chao, MoMA Design Store | ||
|
|
|
|
| 100.0 | % |
|
| 66.5 | % |
|
| 52.8 | % |
|
| 41,894 |
|
|
| 97.34 |
|
|
| 773,682 |
|
|
| - |
|
|
| 773,682 |
|
|
|
900 Third Avenue |
|
|
|
|
|
|
|
|
|
|
|
|
|
|
|
|
|
|
|
|
|
|
|
|
| |||||||||||
| Office |
| 100.0 | % |
|
| 68.6 | % |
|
| 68.6 | % |
|
| 28,261 |
|
|
| 71.91 |
|
|
| 575,592 |
|
|
| - |
|
|
| 575,592 |
|
| Shiseido, Tannenbaum Helpern Syracuse & Hirschtritt, | ||
|
|
|
|
|
|
|
|
|
|
|
|
|
|
|
|
|
|
|
|
|
|
|
|
|
| Littler Mendelson | ||||||||||
| Retail |
| 100.0 | % |
|
| 81.7 | % |
|
| 81.7 | % |
|
| 1,396 |
|
|
| 101.86 |
|
|
| 16,144 |
|
|
| - |
|
|
| 16,144 |
|
| Bank of America | ||
|
|
|
|
| 100.0 | % |
|
| 69.0 | % |
|
| 69.0 | % |
|
| 29,657 |
|
|
| 72.88 |
|
|
| 591,736 |
|
|
| - |
|
|
| 591,736 |
|
|
|
712 Fifth Avenue |
|
|
|
|
|
|
|
|
|
|
|
|
|
|
|
|
|
|
|
|
|
|
|
|
| |||||||||||
| Office |
| 50.0 | % |
|
| 80.5 | % |
|
| 78.8 | % |
|
| 45,028 |
|
|
| 121.70 |
|
|
| 469,077 |
|
|
| - |
|
|
| 469,077 |
|
| CVC Advisors, abrdn, OMI Management, Riverstone Holdings, | ||
|
|
|
|
|
|
|
|
|
|
|
|
|
|
|
|
|
|
|
|
|
|
|
|
|
| Pictet Asset Management | ||||||||||
| Retail |
| 50.0 | % |
|
| 24.1 | % |
|
| 24.1 | % |
|
| 8,187 |
|
|
| 455.10 |
|
|
| 74,423 |
|
|
| - |
|
|
| 74,423 |
|
| Harry Winston | ||
|
|
|
|
| 50.0 | % |
|
| 72.8 | % |
|
| 71.3 | % |
|
| 53,215 |
|
|
| 137.12 |
|
|
| 543,500 |
|
|
| - |
|
|
| 543,500 |
|
|
|
1600 Broadway |
|
|
|
|
|
|
|
|
|
|
|
|
|
|
|
|
|
|
|
|
|
|
|
| ||||||||||||
| Retail |
| 9.2 | % |
|
| 100.0 | % |
|
| 100.0 | % |
|
| 10,925 |
|
|
| 324.35 |
|
|
| 25,693 |
|
|
| - |
|
|
| 25,693 |
|
| M&M's World | ||
60 Wall Street (3) |
|
|
|
|
|
|
|
|
|
|
|
|
|
|
|
|
|
|
|
|
|
|
|
| ||||||||||||
| Office |
| 5.0 | % |
| N/A |
|
| N/A |
|
| N/A |
|
| N/A |
|
|
| - |
|
|
| 1,643,651 |
|
|
| 1,643,651 |
|
|
| ||||||
|
|
|
|
|
|
|
|
|
|
|
|
|
|
|
|
|
|
|
|
|
|
|
|
|
|
|
|
| ||||||||
| New York: |
|
|
|
|
|
|
|
|
|
|
|
|
|
|
|
|
|
|
|
|
|
|
|
| |||||||||||
| Weighted average |
| 86.7 | % |
|
| 82.4 | % |
| $ | 498,742 |
|
| $ | 87.70 |
|
|
| 7,037,530 |
|
|
| 1,643,651 |
|
|
| 8,681,181 |
|
|
| ||||||
| PGRE's share |
|
|
| 86.9 | % |
|
| 82.3 | % |
| $ | 443,049 |
|
| $ | 84.87 |
|
|
| 6,489,592 |
|
|
| 82,347 |
|
|
| 6,571,939 |
|
|
| ||||
(1)
See page 54 for our definition of this measure.
(2)
Represents office and retail space only.
(3)
This property has been taken “out-of-service” for redevelopment.
- 43 -
| PORTFOLIO SUMMARY – SAN FRANCISCO |

(unaudited and in thousands, except square feet and per square foot amounts)
|
|
|
|
|
|
|
|
|
|
|
|
| Annualized Rent (1) |
|
| Square Feet |
|
|
| |||||||||||||||||
|
|
|
| Paramount |
|
| % |
|
| % |
|
|
|
|
| Per |
|
| In |
|
| Out-of- |
|
|
|
|
|
| ||||||||
Property |
| Ownership |
|
| Leased (1) |
|
| Occupied (1) |
|
| Amount |
|
| Square Foot (2) |
|
| Service |
|
| Service |
|
| Total |
|
| Key Tenants | ||||||||||
One Market Plaza |
|
|
|
|
|
|
|
|
|
|
|
|
|
|
|
|
|
|
|
|
|
|
|
| ||||||||||||
| Office |
| 49.0 | % |
|
| 92.1 | % |
|
| 92.1 | % |
| $ | 160,991 |
|
| $ | 112.72 |
|
|
| 1,555,642 |
|
|
| - |
|
|
| 1,555,642 |
|
| Google, Morgan Lewis & Bockius, Visa, | ||
|
|
|
|
|
|
|
|
|
|
|
|
|
|
|
|
|
|
|
|
|
|
|
|
|
| The Capital Group, Autodesk, Citigroup, | ||||||||||
|
|
|
|
|
|
|
|
|
|
|
|
|
|
|
|
|
|
|
|
|
|
|
|
|
| Duane Morris, Thoma Bravo, PJT Partners | ||||||||||
| Retail |
| 49.0 | % |
|
| 61.0 | % |
|
| 61.0 | % |
|
| 4,589 |
|
|
| 78.60 |
|
|
| 53,874 |
|
|
| - |
|
|
| 53,874 |
|
| Starbucks, STK Steak House, | ||
|
|
|
|
|
|
|
|
|
|
|
|
|
|
|
|
|
|
|
|
|
|
|
|
|
|
|
| One Market Restaurant | ||||||||
|
|
|
|
| 49.0 | % |
|
| 91.0 | % |
|
| 91.0 | % |
|
| 165,580 |
|
|
| 112.01 |
|
|
| 1,609,516 |
|
|
| - |
|
|
| 1,609,516 |
|
|
|
300 Mission Street |
|
|
|
|
|
|
|
|
|
|
|
|
|
|
|
|
|
|
|
|
|
|
|
| ||||||||||||
| Office |
| 31.1 | % |
|
| 80.8 | % |
|
| 80.8 | % |
|
| 48,708 |
|
|
| 99.80 |
|
|
| 604,837 |
|
|
| - |
|
|
| 604,837 |
|
| Autodesk, Glassdoor, Instacart | ||
| Retail |
| 31.1 | % |
|
| 88.5 | % |
|
| 88.5 | % |
|
| 3,365 |
|
|
| 75.38 |
|
|
| 49,172 |
|
|
| - |
|
|
| 49,172 |
|
| Equinox | ||
|
|
|
|
| 31.1 | % |
|
| 81.4 | % |
|
| 81.4 | % |
|
| 52,073 |
|
|
| 97.81 |
|
|
| 654,009 |
|
|
| - |
|
|
| 654,009 |
|
|
|
One Front Street |
|
|
|
|
|
|
|
|
|
|
|
|
|
|
|
|
|
|
|
|
|
|
|
| ||||||||||||
| Office |
| 100.0 | % |
|
| 76.0 | % |
|
| 76.0 | % |
|
| 44,078 |
|
|
| 91.91 |
|
|
| 631,661 |
|
|
| - |
|
|
| 631,661 |
|
| JPMorgan Chase, Coinbase, JLL, Cigna | ||
| Retail |
| 100.0 | % |
|
| 89.0 | % |
|
| 89.0 | % |
|
| 1,172 |
|
|
| 98.12 |
|
|
| 13,137 |
|
|
| - |
|
|
| 13,137 |
|
| JPMorgan Chase | ||
|
|
|
|
| 100.0 | % |
|
| 76.3 | % |
|
| 76.3 | % |
|
| 45,250 |
|
|
| 92.06 |
|
|
| 644,798 |
|
|
| - |
|
|
| 644,798 |
|
|
|
55 Second Street |
|
|
|
|
|
|
|
|
|
|
|
|
|
|
|
|
|
|
|
|
|
|
|
| ||||||||||||
| Office |
| 44.1 | % |
|
| 85.4 | % |
|
| 85.4 | % |
|
| 26,885 |
|
|
| 85.24 |
|
|
| 369,935 |
|
|
| - |
|
|
| 369,935 |
|
| KPMG, Intercom, Rippling, UKG, | ||
|
|
|
|
|
|
|
|
|
|
|
|
|
|
|
|
|
|
|
|
|
|
|
|
|
| Alston & Bird | ||||||||||
| Retail |
| 44.1 | % |
|
| 100.0 | % |
|
| 100.0 | % |
|
| 928 |
|
|
| 113.17 |
|
|
| 7,482 |
|
|
| - |
|
|
| 7,482 |
|
| Sutter West Bay Medical, Bluestone Lane | ||
|
|
|
|
| 44.1 | % |
|
| 85.7 | % |
|
| 85.7 | % |
|
| 27,813 |
|
|
| 85.89 |
|
|
| 377,417 |
|
|
| - |
|
|
| 377,417 |
|
|
|
Market Center (3) |
|
|
|
|
|
|
|
|
|
|
|
|
|
|
|
|
|
|
|
|
|
|
|
| ||||||||||||
| Office |
| 67.0 | % |
|
| 46.8 | % |
|
| 46.4 | % |
|
| 29,949 |
|
|
| 86.88 |
|
|
| 744,584 |
|
|
| - |
|
|
| 744,584 |
|
| Mindspace, Bank of Communications, | ||
|
|
|
|
|
|
|
|
|
|
|
|
|
|
|
|
|
|
|
|
|
|
|
|
|
| Crowe, Mayer Brown, Raymond James, Waymo | ||||||||||
| Retail |
| 67.0 | % |
|
| 0.6 | % |
|
| 0.6 | % |
|
| 155 |
|
|
| - |
|
|
| 5,940 |
|
|
| - |
|
|
| 5,940 |
|
|
| ||
|
|
|
|
| 67.0 | % |
|
| 46.4 | % |
|
| 46.0 | % |
|
| 30,104 |
|
|
| 86.88 |
|
|
| 750,524 |
|
|
| - |
|
|
| 750,524 |
|
|
|
111 Sutter Street (3) |
|
|
|
|
|
|
|
|
|
|
|
|
|
|
|
|
|
|
|
|
|
|
|
| ||||||||||||
| Office |
| 49.0 | % |
|
| 53.1 | % |
|
| 53.1 | % |
|
| 11,878 |
|
|
| 91.31 |
|
|
| 247,010 |
|
|
| - |
|
|
| 247,010 |
|
| Turo, Natural Resource Defense Council | ||
| Retail |
| 49.0 | % |
|
| 86.7 | % |
|
| 86.7 | % |
|
| 1,699 |
|
|
| 66.82 |
|
|
| 29,358 |
|
|
| - |
|
|
| 29,358 |
|
| 24 Hour Fitness | ||
|
|
|
|
| 49.0 | % |
|
| 56.7 | % |
|
| 56.7 | % |
|
| 13,577 |
|
|
| 87.31 |
|
|
| 276,368 |
|
|
| - |
|
|
| 276,368 |
|
|
|
|
|
|
|
|
|
|
|
|
|
|
|
|
|
|
|
|
|
|
|
|
|
|
|
|
|
|
|
| ||||||||
| San Francisco: |
|
|
|
|
|
|
|
|
|
|
|
|
|
|
|
|
|
|
|
|
|
|
|
| |||||||||||
| Weighted average |
| 76.9 | % |
|
| 76.9 | % |
| $ | 334,397 |
|
| $ | 100.42 |
|
|
| 4,312,632 |
|
|
| - |
|
|
| 4,312,632 |
|
|
| ||||||
| PGRE's share |
|
|
| 74.9 | % |
|
| 74.8 | % |
| $ | 181,668 |
|
| $ | 99.07 |
|
|
| 2,441,570 |
|
|
| - |
|
|
| 2,441,570 |
|
|
| ||||
(1)
See page 54 for our definition of this measure.
(2)
Represents office and retail space only.
(3)
These assets are being treated as non-core.
- 44 -
| TOP TENANTS AND INDUSTRY DIVERSIFICATION |

(unaudited and in thousands, except square feet and per square foot amounts)
|
|
|
|
|
|
|
|
|
|
| PGRE's Share of |
| ||||||||||||||
|
|
|
|
|
|
|
| Total |
|
| Total |
|
| Annualized Rent (1) |
|
| % of |
| ||||||||
Top 10 Tenants: |
|
| Lease |
| Square Feet |
|
| Square Feet |
|
|
|
|
| Per Square |
|
| Annualized |
| ||||||||
As of June 30, 2024 | Property |
| Expiration |
| Occupied (2) |
|
| Occupied (2) |
|
| Amount |
|
| Foot (2) |
|
| Rent |
| ||||||||
| JPMorgan Chase | One Front Street |
| Jun-2025 |
|
| 241,854 |
|
|
| 241,854 |
|
| $ | 21,075 |
|
| $ | 86.83 |
|
|
| 3.4 | % | ||
|
|
|
|
|
| Dec-2029 |
|
| 76,999 |
|
|
| 76,999 |
|
|
| 8,198 |
|
|
| 106.47 |
|
|
| 1.3 | % |
|
|
|
|
|
| Dec-2030 |
|
| 25,157 |
|
|
| 25,157 |
|
|
| 2,451 |
|
|
| 96.87 |
|
|
| 0.4 | % |
|
|
|
|
|
|
|
|
| 344,010 |
|
|
| 344,010 |
|
|
| 31,724 |
|
|
| 91.96 |
|
|
| 5.1 | % |
| Allianz | 1633 Broadway |
| Jan-2031 |
|
| 320,911 |
|
|
| 288,823 |
|
|
| 29,172 |
|
|
| 101.00 |
|
|
| 4.7 | % | ||
| Norton Rose Fulbright | 1301 Avenue of the Americas |
| Mar-2032 |
|
| 111,589 |
|
|
| 111,589 |
|
|
| 10,284 |
|
|
| 92.15 |
|
|
| 1.6 | % | ||
|
|
|
|
|
| Sep-2034 |
|
| 179,286 |
|
|
| 179,286 |
|
|
| 17,898 |
|
|
| 95.51 |
|
|
| 2.9 | % |
|
|
|
|
|
|
|
|
| 290,875 |
|
|
| 290,875 |
|
|
| 28,182 |
|
|
| 94.22 |
|
|
| 4.5 | % |
| Morgan Stanley | 1633 Broadway |
| Mar-2032 |
|
| 260,829 |
|
|
| 234,749 |
|
|
| 20,448 |
|
|
| 87.11 |
|
|
| 3.3 | % | ||
| Warner Music Group | 1633 Broadway |
| Jul-2029 |
|
| 288,250 |
|
|
| 259,428 |
|
|
| 18,690 |
|
|
| 71.08 |
|
|
| 3.0 | % | ||
| Showtime Networks | 1633 Broadway |
| Jan-2026 |
|
| 253,196 |
|
|
| 227,879 |
|
|
| 17,783 |
|
|
| 76.34 |
|
|
| 2.8 | % | ||
| One Market Plaza |
| Apr-2025 |
|
| 339,833 |
|
|
| 166,518 |
|
|
| 16,645 |
|
|
| 99.53 |
|
|
| 2.7 | % | |||
| Wilson Sonsini | 1301 Avenue of the Americas |
| Aug-2025 |
|
| 61,048 |
|
|
| 61,048 |
|
|
| 6,127 |
|
|
| 100.36 |
|
|
| 1.0 | % | ||
|
|
|
| One Market Plaza |
| Oct-2032 |
|
| 84,224 |
|
|
| 41,270 |
|
|
| 4,979 |
|
|
| 120.67 |
|
|
| 0.8 | % |
|
|
|
| 31 West 52nd Street |
| Feb-2041 |
|
| 26,451 |
| (3) |
| 26,451 |
| (3) |
| 2,143 |
|
|
| 81.02 |
|
|
| 0.3 | % |
|
|
|
|
|
|
|
|
| 171,723 |
|
|
| 128,769 |
|
|
| 13,249 |
|
|
| 102.89 |
|
|
| 2.1 | % |
| O'Melveny & Myers | 1301 Avenue of the Americas |
| Feb-2040 |
|
| 160,708 |
| (4) |
| 160,708 |
| (4) |
| 12,908 |
|
|
| 80.00 |
|
|
| 2.1 | % | ||
| Credit Agricole | 1301 Avenue of the Americas |
| Apr-2035 |
|
| 159,308 |
|
|
| 159,308 |
|
|
| 12,047 |
|
|
| 74.24 |
|
|
| 1.9 | % | ||
|
|
|
|
|
| PGRE's Share of |
| |||||||||||||
Industry Diversification: | Square Feet |
|
| % of Occupied |
|
| Annualized |
|
| % of |
| |||||||||
As of June 30, 2024 | Occupied |
|
| Square Feet |
|
| Rent (1) |
|
| Annualized Rent |
| |||||||||
| Legal Services |
|
| 1,555,637 |
|
|
| 21.7 | % |
| $ | 139,095 |
|
|
| 22.3 | % | |||
| Technology and Media |
|
| 1,454,999 |
|
|
| 20.3 | % |
|
| 123,727 |
|
|
| 19.8 | % | |||
| Financial Services, all others |
|
| 1,130,633 |
|
|
| 15.9 | % |
|
| 108,764 |
|
|
| 17.4 | % | |||
| Financial Services - Commercial and Investment Banking |
|
| 1,243,261 |
|
|
| 17.3 | % |
|
| 107,553 |
|
|
| 17.2 | % | |||
| Insurance |
|
| 400,965 |
|
|
| 5.6 | % |
|
| 39,534 |
|
|
| 6.3 | % | |||
| Retail |
|
| 160,099 |
|
|
| 2.2 | % |
|
| 18,620 |
|
|
| 3.0 | % | |||
| Travel and Leisure |
|
| 187,429 |
|
|
| 2.6 | % |
|
| 12,828 |
|
|
| 2.1 | % | |||
| Consumer Products |
|
| 121,732 |
|
|
| 1.7 | % |
|
| 10,477 |
|
|
| 1.7 | % | |||
| Other Professional Services |
|
| 109,363 |
|
|
| 1.5 | % |
|
| 10,060 |
|
|
| 1.6 | % | |||
| Other |
|
| 805,488 |
|
|
| 11.2 | % |
|
| 54,059 |
|
|
| 8.6 | % | |||
(1)
See page 54 for our definition of this measure.
(2)
Represents office and retail space only.
(3)
Excludes 105,756 square feet that is leased through February 2041 but is not currently occupied.
(4)
Excludes 29,499 square feet that is leased through February 2040 but is not currently occupied.
- 45 -
| LEASING ACTIVITY (1) |

(unaudited)
|
|
|
|
| Total |
| New York |
| San Francisco | |
|
|
|
|
|
|
|
|
|
|
|
Three Months Ended June 30, 2024 |
|
|
|
|
|
|
| |||
|
|
|
|
|
|
|
|
|
|
|
Total square feet leased | 198,505 |
| 177,858 |
| 20,647 (2) |
| ||||
|
|
|
|
|
|
|
|
|
|
|
PGRE's share of total square feet leased: |
| 158,592 |
| 158,592 |
| - |
| |||
Initial rent (3) |
| $ 74.55 |
| $ 74.55 |
| $ - |
| |||
Weighted average lease term (in years) |
| 8.6 |
| 8.6 |
| - |
| |||
Tenant improvements and leasing commissions: |
|
|
|
|
|
|
| |||
Per square foot |
| $ 110.56 |
| $ 110.56 |
| $ - |
| |||
Per square foot per annum |
| $ 12.85 |
| $ 12.85 |
| $ - |
| |||
Percentage of initial rent |
| 17.2% |
| 17.2% |
| - % |
| |||
Rent concessions: |
|
|
|
|
|
|
| |||
Average free rent period (in months) |
| 11.0 |
| 11.0 |
| - |
| |||
Average free rent period per annum (in months) |
| 1.3 |
| 1.3 |
| - |
| |||
|
|
|
|
|
|
|
|
|
|
|
Second generation space: (3) |
|
|
|
|
|
|
| |||
Square feet |
| 98,862 |
| 98,862 |
| - |
| |||
Cash basis: |
|
|
|
|
|
|
| |||
Initial rent (3) |
| $ 71.28 |
| $ 71.28 |
| $ - |
| |||
Prior escalated rent (3) |
| $ 70.60 |
| $ 70.60 |
| $ - |
| |||
Percentage increase |
| 1.0% |
| 1.0% |
| - % |
| |||
GAAP basis: |
|
|
|
|
|
|
| |||
Straight-line rent |
| $ 68.45 |
| $ 68.45 |
| $ - |
| |||
Prior straight-line rent |
| $ 70.86 |
| $ 70.86 |
| $ - |
| |||
Percentage decrease |
| (3.4%) |
| (3.4%) |
| - % |
| |||
(1)
The leasing statistics, except for square feet leased, represent office space only.
(2)
Represents leases executed at Market Center and 111 Sutter Street, which are treated as non-core assets and accordingly excluded from the statistics below.
(3)
See page 54 for our definition of this measure.
- 46 -
| LEASING ACTIVITY (1) |
(unaudited)
|
|
|
|
| Total |
| New York |
| San Francisco | |
|
|
|
|
|
|
|
|
|
|
|
Six Months Ended June 30, 2024 |
|
|
|
|
|
|
| |||
|
|
|
|
|
|
|
|
|
|
|
Total square feet leased | 475,222 |
| 294,862 |
| 180,360 (2) |
| ||||
|
|
|
|
|
|
|
|
|
|
|
PGRE's share of total square feet leased: |
| 329,114 |
| 268,112 |
| 61,002 |
| |||
Initial rent (3) |
| $ 71.58 |
| $ 72.39 |
| $ 68.00 |
| |||
Weighted average lease term (in years) |
| 8.3 |
| 9.7 |
| 1.8 |
| |||
Tenant improvements and leasing commissions: |
|
|
|
|
|
|
| |||
Per square foot |
| $ 96.53 |
| $ 117.29 |
| $ 5.32 |
| |||
Per square foot per annum |
| $ 11.69 |
| $ 12.05 |
| $ 3.04 |
| |||
Percentage of initial rent |
| 16.3% |
| 16.6% |
| 4.5% |
| |||
Rent concessions: |
|
|
|
|
|
|
| |||
Average free rent period (in months) |
| 5.7 |
| 7.0 |
| - |
| |||
Average free rent period per annum (in months) |
| 0.7 |
| 0.7 |
| - |
| |||
|
|
|
|
|
|
|
|
|
|
|
Second generation space: (3) |
|
|
|
|
|
|
| |||
Square feet |
| 193,837 |
| 132,835 |
| 61,002 |
| |||
Cash basis: |
|
|
|
|
|
|
| |||
Initial rent (3) |
| $ 69.87 |
| $ 70.73 |
| $ 68.00 |
| |||
Prior escalated rent (3) |
| $ 70.95 |
| $ 70.25 |
| $ 72.48 |
| |||
Percentage (decrease) increase |
| (1.5%) |
| 0.7% |
| (6.2%) |
| |||
GAAP basis: |
|
|
|
|
|
|
| |||
Straight-line rent |
| $ 67.54 |
| $ 67.37 |
| $ 67.91 |
| |||
Prior straight-line rent |
| $ 75.77 (4) |
| $ 69.23 |
| $ 90.02 (4) |
| |||
Percentage decrease |
| (10.9%) (4) |
| (2.7%) |
| (24.6%) (4) |
| |||
(1)
The leasing statistics, except for square feet leased, represent office space only.
(2)
Includes an aggregate of 42,034 square feet leased at Market Center and 111 Sutter Street, which are treated as non-core assets and accordingly excluded from the statistics below.
(3)
See page 54 for our definition of this measure.
(4)
The negative mark-to-market on a GAAP basis was driven primarily by a FAS 141 below-market lease adjustment that was included in the prior GAAP rent. Excluding the below-market lease adjustment from the prior GAAP rent, the mark-to-market on a GAAP basis would have been negative 2.8% for the total portfolio and negative 3.1% for San Francisco.
- 47 -
| LEASE EXPIRATIONS – TOTAL PORTFOLIO |

(unaudited and in thousands, except square feet and per square foot amounts)
|
|
|
| Total |
|
| PGRE's Share of |
| |||||||||||||||
Year of |
|
| Square Feet |
|
| Square Feet |
|
| Annualized Rent (1) |
|
| % of |
| ||||||||||
Lease Expiration (2) |
|
| of Expiring Leases |
|
| of Expiring Leases |
|
| Amount |
|
| Per Square Foot (3) |
|
| Annualized Rent |
| |||||||
|
|
|
|
|
|
|
|
|
|
|
|
|
|
|
|
|
| ||||||
| Month to Month |
|
|
| 8,322 |
|
|
| 5,907 |
|
| $ | 769 |
|
| $ | - |
|
|
| 0.1 | % | |
|
|
|
|
|
|
|
|
|
|
|
|
|
|
|
|
|
| ||||||
| 3Q 2024 |
|
|
| 115,070 |
|
|
| 93,987 |
|
|
| 9,520 |
|
|
| 101.45 |
|
|
| 1.5 | % | |
| 4Q 2024 |
|
|
| 119,441 |
|
|
| 99,959 |
|
|
| 7,622 |
|
|
| 76.27 |
|
|
| 1.2 | % | |
| Total 2024 |
|
|
| 234,511 |
|
|
| 193,946 |
|
|
| 17,142 |
|
|
| 88.44 |
|
|
| 2.7 | % | |
|
|
|
|
|
|
|
|
|
|
|
|
|
|
|
|
|
| ||||||
| 1Q 2025 |
|
|
| 149,362 |
|
|
| 123,758 |
|
|
| 11,405 |
|
|
| 92.51 |
|
|
| 1.8 | % | |
| 2Q 2025 |
|
|
| 503,225 |
|
|
| 297,522 |
|
|
| 29,658 |
|
|
| 99.54 |
|
|
| 4.6 | % | |
| Remaining 2025 |
|
|
| 764,547 |
|
|
| 592,380 |
|
|
| 53,226 |
|
|
| 89.82 |
|
|
| 8.2 | % | |
| Total 2025 |
|
|
| 1,417,134 |
|
|
| 1,013,660 |
|
|
| 94,289 |
|
|
| 92.99 |
|
|
| 14.6 | % | |
|
| 2026 |
|
|
| 1,520,129 |
|
|
| 1,016,143 |
|
|
| 91,458 |
|
|
| 87.67 |
|
|
| 14.1 | % |
|
| 2027 |
|
|
| 326,304 |
|
|
| 246,388 |
|
|
| 22,778 |
|
|
| 92.11 |
|
|
| 3.5 | % |
|
| 2028 |
|
|
| 361,089 |
|
|
| 265,211 |
|
|
| 21,096 |
|
|
| 79.56 |
|
|
| 3.3 | % |
| Thereafter |
|
|
| 5,548,133 |
|
|
| 4,724,970 |
|
|
| 398,821 |
|
|
| 87.35 |
|
|
| 61.7 | % | |
|
|
|
|
|
|
|
|
|
|
|
|
|
|
|
|
|
| ||||||
Total portfolio excluding non-core assets (4): |
|
|
|
|
|
|
|
|
|
|
|
|
| ||||||||||
|
|
|
|
|
|
|
|
|
|
|
|
|
|
|
|
|
| ||||||
|
|
|
| Total |
|
| PGRE's Share of |
| |||||||||||||||
Year of |
|
| Square Feet |
|
| Square Feet |
|
| Annualized Rent (1) |
|
| % of |
| ||||||||||
Lease Expiration (2) |
|
| of Expiring Leases |
|
| of Expiring Leases |
|
| Amount |
|
| Per Square Foot (3) |
|
| Annualized Rent |
| |||||||
|
|
|
|
|
|
|
|
|
|
|
|
|
|
|
|
|
| ||||||
| Month to Month |
|
|
| 6,576 |
|
|
| 4,862 |
|
| $ | 698 |
|
| $ | - |
|
|
| 0.1 | % | |
|
|
|
|
|
|
|
|
|
|
|
|
|
|
|
|
|
| ||||||
| 3Q 2024 |
|
|
| 105,325 |
|
|
| 87,458 |
|
|
| 8,894 |
|
|
| 101.82 |
|
|
| 1.4 | % | |
| 4Q 2024 |
|
|
| 90,298 |
|
|
| 82,829 |
|
|
| 6,007 |
|
|
| 72.55 |
|
|
| 1.0 | % | |
| Total 2024 |
|
|
| 195,623 |
|
|
| 170,287 |
|
|
| 14,901 |
|
|
| 87.55 |
|
|
| 2.4 | % | |
|
|
|
|
|
|
|
|
|
|
|
|
|
|
|
|
|
| ||||||
| 1Q 2025 |
|
|
| 118,020 |
|
|
| 107,063 |
|
|
| 9,741 |
|
|
| 91.13 |
|
|
| 1.6 | % | |
| 2Q 2025 |
|
|
| 496,116 |
|
|
| 292,759 |
|
|
| 29,153 |
|
|
| 99.44 |
|
|
| 4.7 | % | |
| Remaining 2025 |
|
|
| 743,760 |
|
|
| 578,453 |
|
|
| 52,173 |
|
|
| 90.17 |
|
|
| 8.4 | % | |
| Total 2025 |
|
|
| 1,357,896 |
|
|
| 978,275 |
|
|
| 91,067 |
|
|
| 93.04 |
|
|
| 14.7 | % | |
|
| 2026 |
|
|
| 1,430,513 |
|
|
| 958,436 |
|
|
| 85,990 |
|
|
| 87.29 |
|
|
| 13.9 | % |
|
| 2027 |
|
|
| 266,873 |
|
|
| 213,657 |
|
|
| 19,436 |
|
|
| 90.57 |
|
|
| 3.1 | % |
|
| 2028 |
|
|
| 180,619 |
|
|
| 147,180 |
|
|
| 11,924 |
|
|
| 81.01 |
|
|
| 1.9 | % |
| Thereafter |
|
|
| 5,472,686 |
|
|
| 4,683,496 |
|
|
| 395,398 |
|
|
| 87.39 |
|
|
| 63.9 | % | |
(1)
See page 54 for our definition of this measure.
(2)
Leases that expire on the last day of the quarter are treated as occupied and are reflected as expiring space in the following quarter.
(3)
Represents office and retail space only.
(4)
Non-core assets consist of Market Center and 111 Sutter Street.
- 48 -
| LEASE EXPIRATIONS – NEW YORK |

(unaudited and in thousands, except square feet and per square foot amounts)
|
|
|
| Total |
|
| PGRE's Share of |
| |||||||||||||||
Year of |
|
| Square Feet |
|
| Square Feet |
|
| Annualized Rent (1) |
|
| % of |
| ||||||||||
Lease Expiration (2) |
|
| of Expiring Leases |
|
| of Expiring Leases |
|
| Amount |
|
| Per Square Foot (3) |
|
| Annualized Rent |
| |||||||
|
|
|
|
|
|
|
|
|
|
|
|
|
|
|
|
|
| ||||||
| Month to Month |
|
|
| 2,596 |
|
|
| 2,421 |
|
| $ | 489 |
|
| $ | - |
|
|
| 0.1 | % | |
|
|
|
|
|
|
|
|
|
|
|
|
|
|
|
|
|
| ||||||
| 3Q 2024 |
|
|
| 83,487 |
|
|
| 76,758 |
|
|
| 7,427 |
|
|
| 96.92 |
|
|
| 1.6 | % | |
| 4Q 2024 |
|
|
| 90,006 |
|
|
| 82,686 |
|
|
| 5,994 |
|
|
| 72.49 |
|
|
| 1.3 | % | |
| Total 2024 |
|
|
| 173,493 |
|
|
| 159,444 |
|
|
| 13,421 |
|
|
| 84.21 |
|
|
| 2.9 | % | |
|
|
|
|
|
|
|
|
|
|
|
|
|
|
|
|
|
| ||||||
| 1Q 2025 |
|
|
| 27,222 |
|
|
| 18,462 |
|
|
| 1,510 |
|
|
| 81.82 |
|
|
| 0.3 | % | |
| 2Q 2025 |
|
|
| 118,259 |
|
|
| 107,887 |
|
|
| 10,324 |
|
|
| 95.61 |
|
|
| 2.2 | % | |
| Remaining 2025 |
|
|
| 303,023 |
|
|
| 260,107 |
|
|
| 23,992 |
|
|
| 92.24 |
|
|
| 5.2 | % | |
| Total 2025 |
|
|
| 448,504 |
|
|
| 386,456 |
|
|
| 35,826 |
|
|
| 92.68 |
|
|
| 7.7 | % | |
|
| 2026 |
|
|
| 654,925 |
|
|
| 605,524 |
|
|
| 49,867 |
|
|
| 78.37 |
|
|
| 10.7 | % |
|
| 2027 |
|
|
| 187,349 |
|
|
| 168,997 |
|
|
| 14,745 |
|
|
| 86.73 |
|
|
| 3.2 | % |
|
| 2028 |
|
|
| 118,584 |
|
|
| 98,024 |
|
|
| 7,550 |
|
|
| 76.71 |
|
|
| 1.6 | % |
| Thereafter |
|
|
| 4,512,767 |
|
|
| 4,217,576 |
|
|
| 343,526 |
|
|
| 84.57 |
|
|
| 73.8 | % | |
(1)
See page 54 for our definition of this measure.
(2)
Leases that expire on the last day of the quarter are treated as occupied and are reflected as expiring space in the following quarter.
(3)
Represents office and retail space only.
- 49 -
| LEASE EXPIRATIONS – SAN FRANCISCO |

(unaudited and in thousands, except square feet and per square foot amounts)
|
|
|
| Total |
|
| PGRE's Share of |
| |||||||||||||||
Year of |
|
| Square Feet |
|
| Square Feet |
|
| Annualized Rent (1) |
|
| % of |
| ||||||||||
Lease Expiration (2) |
|
| of Expiring Leases |
|
| of Expiring Leases |
|
| Amount |
|
| Per Square Foot (3) |
|
| Annualized Rent |
| |||||||
|
|
|
|
|
|
|
|
|
|
|
|
|
|
|
|
|
| ||||||
| Month to Month |
|
|
| 5,726 |
|
|
| 3,486 |
|
| $ | 280 |
|
| $ | - |
|
|
| 0.2 | % | |
|
|
|
|
|
|
|
|
|
|
|
|
|
|
|
|
|
| ||||||
| 3Q 2024 |
|
|
| 31,583 |
|
|
| 17,229 |
|
|
| 2,093 |
|
|
| 121.62 |
|
|
| 1.2 | % | |
| 4Q 2024 |
|
|
| 29,435 |
|
|
| 17,273 |
|
|
| 1,628 |
|
|
| 94.41 |
|
|
| 0.9 | % | |
| Total 2024 |
|
|
| 61,018 |
|
|
| 34,502 |
|
|
| 3,721 |
|
|
| 107.98 |
|
|
| 2.1 | % | |
|
|
|
|
|
|
|
|
|
|
|
|
|
|
|
|
|
| ||||||
| 1Q 2025 |
|
|
| 122,140 |
|
|
| 105,296 |
|
|
| 9,895 |
|
|
| 94.40 |
|
|
| 5.5 | % | |
| 2Q 2025 |
|
|
| 384,966 |
|
|
| 189,635 |
|
|
| 19,334 |
|
|
| 101.80 |
|
|
| 10.7 | % | |
| Remaining 2025 |
|
|
| 461,524 |
|
|
| 332,273 |
|
|
| 29,234 |
|
|
| 87.92 |
|
|
| 16.2 | % | |
| Total 2025 |
|
|
| 968,630 |
|
|
| 627,204 |
|
|
| 58,463 |
|
|
| 93.18 |
|
|
| 32.4 | % | |
|
| 2026 |
|
|
| 865,204 |
|
|
| 410,619 |
|
|
| 41,591 |
|
|
| 101.25 |
|
|
| 23.0 | % |
|
| 2027 |
|
|
| 138,955 |
|
|
| 77,391 |
|
|
| 8,033 |
|
|
| 103.65 |
|
|
| 4.4 | % |
|
| 2028 |
|
|
| 242,505 |
|
|
| 167,187 |
|
|
| 13,546 |
|
|
| 81.24 |
|
|
| 7.4 | % |
| Thereafter |
|
|
| 1,035,366 |
|
|
| 507,394 |
|
|
| 55,295 |
|
|
| 109.02 |
|
|
| 30.5 | % | |
|
|
|
|
|
|
|
|
|
|
|
|
|
|
|
|
|
| ||||||
San Francisco excluding non-core assets (4): |
|
|
|
|
|
|
|
|
|
|
|
|
| ||||||||||
|
|
|
| Total |
|
| PGRE's Share of |
| |||||||||||||||
Year of |
|
| Square Feet |
|
| Square Feet |
|
| Annualized Rent (1) |
|
| % of |
| ||||||||||
Lease Expiration (2) |
|
| of Expiring Leases |
|
| of Expiring Leases |
|
| Amount |
|
| Per Square Foot (3) |
|
| Annualized Rent |
| |||||||
|
|
|
|
|
|
|
|
|
|
|
|
|
|
|
|
|
| ||||||
| Month to Month |
|
|
| 3,980 |
|
|
| 2,441 |
|
| $ | 209 |
|
| $ | - |
|
|
| 0.1 | % | |
|
|
|
|
|
|
|
|
|
|
|
|
|
|
|
|
|
| ||||||
| 3Q 2024 |
|
|
| 21,838 |
|
|
| 10,700 |
|
|
| 1,467 |
|
|
| 136.80 |
|
|
| 1.0 | % | |
| 4Q 2024 |
|
|
| 292 |
|
|
| 143 |
|
|
| 13 |
|
|
| 117.49 |
|
|
| - |
| |
| Total 2024 |
|
|
| 22,130 |
|
|
| 10,843 |
|
|
| 1,480 |
|
|
| 136.60 |
|
|
| 1.0 | % | |
|
|
|
|
|
|
|
|
|
|
|
|
|
|
|
|
|
| ||||||
| 1Q 2025 |
|
|
| 90,798 |
|
|
| 88,601 |
|
|
| 8,231 |
|
|
| 93.08 |
|
|
| 5.3 | % | |
| 2Q 2025 |
|
|
| 377,857 |
|
|
| 184,872 |
|
|
| 18,829 |
|
|
| 101.69 |
|
|
| 12.3 | % | |
| Remaining 2025 |
|
|
| 440,737 |
|
|
| 318,346 |
|
|
| 28,181 |
|
|
| 88.49 |
|
|
| 18.3 | % | |
| Total 2025 |
|
|
| 909,392 |
|
|
| 591,819 |
|
|
| 55,241 |
|
|
| 93.28 |
|
|
| 35.9 | % | |
|
| 2026 |
|
|
| 775,588 |
|
|
| 352,912 |
|
|
| 36,123 |
|
|
| 102.43 |
|
|
| 23.5 | % |
|
| 2027 |
|
|
| 79,524 |
|
|
| 44,660 |
|
|
| 4,691 |
|
|
| 104.87 |
|
|
| 3.0 | % |
|
| 2028 |
|
|
| 62,035 |
|
|
| 49,156 |
|
|
| 4,374 |
|
|
| 89.66 |
|
|
| 2.8 | % |
| Thereafter |
|
|
| 959,919 |
|
|
| 465,920 |
|
|
| 51,872 |
|
|
| 111.40 |
|
|
| 33.7 | % | |
(1)
See page 54 for our definition of this measure.
(2)
Leases that expire on the last day of the quarter are treated as occupied and are reflected as expiring space in the following quarter.
(3)
Represents office and retail space only.
(4)
Non-core assets consist of Market Center and 111 Sutter Street.
- 50 -
| CASH BASIS CAPITAL EXPENDITURES |

(1)
(unaudited and in thousands)
|
| Three Months Ended June 30, 2024 |
| |||||||||||||
|
| Total (1) |
|
| New York |
|
| San Francisco (1) |
|
| Other |
| ||||
Capital Expenditures (including our share of unconsolidated joint ventures): (2) |
|
|
|
|
|
|
|
|
|
|
| |||||
Expenditures to maintain assets | $ | 9,182 |
|
| $ | 6,807 |
|
| $ | 2,367 |
|
| $ | 8 |
| |
Second generation tenant improvements |
| 10,821 |
|
|
| 10,610 |
|
|
| 211 |
|
|
| - |
| |
Second generation leasing commissions |
| 993 |
|
|
| 669 |
|
|
| 324 |
|
|
| - |
| |
Total Capital Expenditures |
| 20,996 |
|
|
| 18,086 |
|
|
| 2,902 |
|
|
| 8 |
| |
Amounts attributable to noncontrolling interests in consolidated joint ventures |
| (1,051 | ) |
|
| (229 | ) |
|
| (822 | ) |
|
| - |
| |
PGRE's share of Total Capital Expenditures | $ | 19,945 |
|
| $ | 17,857 |
|
| $ | 2,080 |
|
| $ | 8 |
| |
|
|
|
|
|
|
|
|
|
|
|
| |||||
Redevelopment Expenditures (including our share of unconsolidated joint ventures): (2) |
|
|
|
|
|
|
|
|
|
|
| |||||
Paramount Club | $ | 5,609 |
|
| $ | 5,609 |
|
| $ | - |
|
| $ | - |
| |
Other |
| 278 |
|
|
| 278 |
|
|
| - |
|
|
| - |
| |
Total Redevelopment Expenditures |
| 5,887 |
|
|
| 5,887 |
|
|
| - |
|
|
| - |
| |
Amounts attributable to noncontrolling interests in consolidated joint ventures |
| - |
|
|
| - |
|
|
| - |
|
|
| - |
| |
PGRE's share of Total Redevelopment Expenditures | $ | 5,887 |
|
| $ | 5,887 |
|
| $ | - |
|
| $ | - |
| |
|
|
|
|
|
|
|
|
|
|
|
| |||||
|
|
|
|
|
|
|
|
|
|
|
|
| ||||
|
|
|
|
|
|
|
|
|
|
|
|
| ||||
|
| Three Months Ended June 30, 2023 |
| |||||||||||||
|
| Total |
|
| New York |
|
| San Francisco |
|
| Other |
| ||||
Capital Expenditures (including our share of unconsolidated joint ventures): (2) |
|
|
|
|
|
|
|
|
|
|
| |||||
Expenditures to maintain assets | $ | 20,117 |
|
| $ | 16,004 |
|
| $ | 3,778 |
|
| $ | 335 |
| |
Second generation tenant improvements |
| 4,319 |
|
|
| 2,917 |
|
|
| 1,402 |
|
|
| - |
| |
Second generation leasing commissions |
| 2,229 |
|
|
| 1,715 |
|
|
| 514 |
|
|
| - |
| |
Total Capital Expenditures |
| 26,665 |
|
|
| 20,636 |
|
|
| 5,694 |
|
|
| 335 |
| |
Amounts attributable to noncontrolling interests in consolidated joint ventures |
| (1,841 | ) |
|
| (78 | ) |
|
| (1,763 | ) |
|
| - |
| |
PGRE's share of Total Capital Expenditures | $ | 24,824 |
|
| $ | 20,558 |
|
| $ | 3,931 |
|
| $ | 335 |
| |
|
|
|
|
|
|
|
|
|
|
|
| |||||
Redevelopment Expenditures (including our share of unconsolidated joint ventures): (2) |
|
|
|
|
|
|
|
|
|
|
| |||||
Paramount Club | $ | 6,270 |
|
| $ | 6,270 |
|
| $ | - |
|
| $ | - |
| |
Other |
| 405 |
|
|
| 405 |
|
|
| - |
|
|
| - |
| |
Total Redevelopment Expenditures |
| 6,675 |
|
|
| 6,675 |
|
|
| - |
|
|
| - |
| |
Amounts attributable to noncontrolling interests in consolidated joint ventures |
| - |
|
|
| - |
|
|
| - |
|
|
| - |
| |
PGRE's share of Total Redevelopment Expenditures | $ | 6,675 |
|
| $ | 6,675 |
|
| $ | - |
|
| $ | - |
| |
(1)
Excludes Market Center and 111 Sutter Street.
(2)
See page 54 for our definition of this measure.
- 51 -
| CASH BASIS CAPITAL EXPENDITURES |
(1)
(unaudited and in thousands)
|
| Six Months Ended June 30, 2024 |
| |||||||||||||
|
| Total (1) |
|
| New York |
|
| San Francisco (1) |
|
| Other |
| ||||
Capital Expenditures (including our share of unconsolidated joint ventures): (2) |
|
|
|
|
|
|
|
|
|
|
| |||||
Expenditures to maintain assets | $ | 20,126 |
|
| $ | 15,248 |
|
| $ | 4,845 |
|
| $ | 33 |
| |
Second generation tenant improvements |
| 35,442 |
|
|
| 29,877 |
|
|
| 5,565 |
|
|
| - |
| |
Second generation leasing commissions |
| 1,742 |
|
|
| 1,412 |
|
|
| 330 |
|
|
| - |
| |
Total Capital Expenditures |
| 57,310 |
|
|
| 46,537 |
|
|
| 10,740 |
|
|
| 33 |
| |
Amounts attributable to noncontrolling interests in consolidated joint ventures |
| (5,514 | ) |
|
| (419 | ) |
|
| (5,095 | ) |
|
| - |
| |
PGRE's share of Total Capital Expenditures | $ | 51,796 |
|
| $ | 46,118 |
|
| $ | 5,645 |
|
| $ | 33 |
| |
|
|
|
|
|
|
|
|
|
|
|
| |||||
Redevelopment Expenditures (including our share of unconsolidated joint ventures): (2) |
|
|
|
|
|
|
|
|
|
|
| |||||
Paramount Club | $ | 9,817 |
|
| $ | 9,817 |
|
| $ | - |
|
| $ | - |
| |
Other |
| 315 |
|
|
| 315 |
|
|
| - |
|
|
| - |
| |
Total Redevelopment Expenditures |
| 10,132 |
|
|
| 10,132 |
|
|
| - |
|
|
| - |
| |
Amounts attributable to noncontrolling interests in consolidated joint ventures |
| - |
|
|
| - |
|
|
| - |
|
|
| - |
| |
PGRE's share of Total Redevelopment Expenditures | $ | 10,132 |
|
| $ | 10,132 |
|
| $ | - |
|
| $ | - |
| |
|
|
|
|
|
|
|
|
|
|
|
| |||||
|
|
|
|
|
|
|
|
|
|
|
|
| ||||
|
|
|
|
|
|
|
|
|
|
|
|
| ||||
|
| Six Months Ended June 30, 2023 |
| |||||||||||||
|
| Total |
|
| New York |
|
| San Francisco |
|
| Other |
| ||||
Capital Expenditures (including our share of unconsolidated joint ventures): (2) |
|
|
|
|
|
|
|
|
|
|
| |||||
Expenditures to maintain assets | $ | 25,779 |
|
| $ | 19,992 |
|
| $ | 5,431 |
|
| $ | 356 |
| |
Second generation tenant improvements |
| 15,147 |
|
|
| 5,680 |
|
|
| 9,467 |
|
|
| - |
| |
Second generation leasing commissions |
| 3,939 |
|
|
| 2,271 |
|
|
| 1,668 |
|
|
| - |
| |
Total Capital Expenditures |
| 44,865 |
|
|
| 27,943 |
|
|
| 16,566 |
|
|
| 356 |
| |
Amounts attributable to noncontrolling interests in consolidated joint ventures |
| (7,274 | ) |
|
| (298 | ) |
|
| (6,976 | ) |
|
| - |
| |
PGRE's share of Total Capital Expenditures | $ | 37,591 |
|
| $ | 27,645 |
|
| $ | 9,590 |
|
| $ | 356 |
| |
|
|
|
|
|
|
|
|
|
|
|
| |||||
Redevelopment Expenditures (including our share of unconsolidated joint ventures): (2) |
|
|
|
|
|
|
|
|
|
|
| |||||
Paramount Club | $ | 8,925 |
|
| $ | 8,925 |
|
| $ | - |
|
| $ | - |
| |
Other |
| 868 |
|
|
| 868 |
|
|
| - |
|
|
| - |
| |
Total Redevelopment Expenditures |
| 9,793 |
|
|
| 9,793 |
|
|
| - |
|
|
| - |
| |
Amounts attributable to noncontrolling interests in consolidated joint ventures |
| - |
|
|
| - |
|
|
| - |
|
|
| - |
| |
PGRE's share of Total Redevelopment Expenditures | $ | 9,793 |
|
| $ | 9,793 |
|
| $ | - |
|
| $ | - |
| |
(1)
Excludes Market Center and 111 Sutter Street.
(2)
See page 54 for our definition of this measure.
- 52 -
| RESEARCH COVERAGE (1) |
(1)
Camille Bonnel | Thomas Catherwood | Steve Sakwa | |
Bank of America Merrill Lynch | BTIG | Evercore ISI | |
(416) 369-2140 | (212) 738-6140 | (212) 446-9462 | |
camille.bonnel@bofa.com | tcatherwood@btig.com | steve.sakwa@evercoreisi.com | |
|
|
| |
Dylan Burzinski | Vikram Malhotra | Ronald Kamdem | |
Green Street Advisors | Mizuho Securities USA Inc. | Morgan Stanley | |
(949) 640-8780 | (212) 282-3827 | (212) 296-8319 | |
dburzinski@greenstreet.com | vikram.malhotra@mizuhogroup.com | ronald.kamdem@morganstanley.com | |
|
|
|
|
Blaine Heck | Andrew Rosivach |
|
|
Wells Fargo | Wolfe Research |
|
|
(443) 263-6529 | (646) 582-9250 |
|
|
blaine.heck@wellsfargo.com | arosivach@wolferesearch.com |
|
|
(1)
With the exception of Green Street Advisors, an independent research firm, the equity analysts listed above are those analysts that, according to First Call Corporation, have published research material on the Company and are listed as covering the Company. Please note that any opinions, estimates or forecasts regarding the Company’s performance made by such analysts do not represent the opinions, estimates or forecasts of the Company or its management. The Company does not, by its reference above, imply its endorsement of or concurrence with any information, conclusions or recommendations made by any such analysts.
- 53 -
| DEFINITIONS |

We use and present various non-GAAP measures in this Supplemental Operating and Financial Data report. The following section contains definitions of these measures, describes our use of them and provides information regarding why we believe they are meaningful. Other real estate companies may use different methodologies for calculating these measures, and accordingly, our presentation of these measures may not be comparable to other real estate companies. These non-GAAP measures should not be considered a substitute for, and should only be considered together with and as a supplement to, financial information presented in accordance with GAAP. In the first quarter of 2024, we updated our presentation of Core FFO attributable to common stockholders, FAD attributable to common stockholders, Adjusted EBITDAre, NOI and Cash NOI to exclude the impact of Market Center and 111 Sutter Street, which we have designated as non-core assets. Accordingly, we have recast the presentation for all prior periods presented to reflect this change.
Funds from Operations (“FFO”) is a supplemental measure of our performance. FFO is presented in accordance with the definition adopted by the National Association of Real Estate Investment Trusts (“Nareit”). Nareit defines FFO as net income or loss, calculated in accordance with GAAP, adjusted to exclude depreciation and amortization from real estate assets, impairment losses on certain real estate assets and gains or losses from the sale of certain real estate assets or from change in control of certain real estate assets, including our share of such adjustments of unconsolidated joint ventures. FFO is commonly used in the real estate industry to assist investors and analysts in comparing results of real estate companies because it excludes the effect of real estate depreciation and amortization and net gains on sales, which are based on historical costs and implicitly assume that the value of real estate diminishes predictably over time, rather than fluctuating based on existing market conditions. FFO is not intended to be a measure of cash flow or liquidity. We present FFO attributable to common stockholders which represents the Company’s share of FFO, net of amounts attributable to noncontrolling interests.
Core Funds from Operations (“Core FFO”) is an alternative measure of our operating performance, which adjusts FFO for certain other items that we believe enhance the comparability of our FFO across periods. Core FFO, when applicable, excludes the impact of certain items, including, transaction related costs, realized and unrealized gains or losses on real estate related fund investments, unrealized gains or losses on interest rate swaps, severance costs, gains or losses on early extinguishment of debt and other non-core adjustments, in order to reflect the Core FFO of our real estate portfolio and operations. In future periods, we may also exclude other items from Core FFO that we believe may help investors compare our results. Core FFO is not intended to be a measure of cash flow or liquidity. We present Core FFO attributable to common stockholders which represents the Company’s share of Core FFO, net of amounts attributable to noncontrolling interests.
Funds Available for Distribution (“FAD”) is a supplemental measure of our operating performance and is calculated as Core FFO adjusted for (i) capital expenditures to maintain assets, (ii) tenant improvements and leasing commissions incurred for second generation leases, (iii) straight-line rent adjustments, (iv) amortization of above and below-market leases, (v) amortization of stock-based compensation expense and (vi) amortization of deferred financing costs. FAD is commonly used in the real estate industry along with cash flow from operating activities as a measure of the ability to generate cash from operations and the ability to fund cash needs and make distributions to our stockholders. FAD provides information regarding our operating performance that would not otherwise be available and is useful to investors and analysts in assessing our operating performance. Additionally, although FAD is not intended to be a liquidity measure, as it does not make adjustments for the changes in working capital, we believe that FAD may provide investors and analysts with useful supplemental information regarding our ability to generate cash from operations and our ability to make distributions to our stockholders. Furthermore, we believe that FAD is frequently used by investors and analysts in evaluating our performance as a REIT. We present FAD attributable to common stockholders which represents the Company’s share of FAD, net of amounts attributable to noncontrolling interests. FAD payout ratio is calculated by dividing dividends declared on common stock by FAD attributable to common stockholders.
Earnings Before Interest, Taxes, Depreciation and Amortization for Real Estate (“EBITDAre”) is a supplemental measure of our operating performance. EBITDAre is presented in accordance with the definition adopted by Nareit. Nareit defines EBITDAre as GAAP net income (loss) adjusted to exclude interest expense, income taxes, depreciation and amortization expenses, net gains from sales of depreciated real estate assets and impairment losses on depreciable real estate, including our share of such adjustments of unconsolidated joint ventures. EBITDAre provides information regarding our operating performance that would not otherwise be available and may be useful to an investor in assessing our ability to incur and service debt. EBITDAre should not be considered as an indication of our financial performance or a measure of our cash flow or liquidity. We also present PGRE’s share of EBITDAre which represents our share of EBITDAre generated by our consolidated and unconsolidated joint ventures, based on our percentage ownership in the underlying assets.
- 54 -
| DEFINITIONS - CONTINUED |

Adjusted EBITDAre is a supplemental measure that is calculated by adjusting EBITDAre to eliminate the impact of the performance of our real estate related funds, unrealized gains or losses on interest rate swaps, transaction related costs, gains or losses on early extinguishment of debt and certain other items that may vary from period to period. Adjusted EBITDAre enhances the comparability of EBITDAre across periods. In future periods, we may also exclude other items from Adjusted EBITDAre that we believe may help investors compare our results. We also present PGRE’s share of Adjusted EBITDAre, which represents our share of Adjusted EBITDAre generated by our consolidated and unconsolidated joint ventures based on our percentage ownership in the underlying assets.
Net Operating Income (“NOI”) is used to measure the operating performance of our properties. NOI consists of rental revenue (which includes property rentals, tenant reimbursements and lease termination income) and certain other property-related revenue less operating expenses (which includes property-related expenses such as cleaning, security, repairs and maintenance, utilities, property administration and real estate taxes). We also present Cash NOI which deducts from NOI, straight-line rent adjustments and the amortization of above and below-market leases, including our share of such adjustments of unconsolidated joint ventures. In addition, we present PGRE’s share of NOI and Cash NOI which represents our share of NOI and Cash NOI of consolidated and unconsolidated joint ventures, based on our percentage ownership in the underlying assets. We use NOI and Cash NOI internally as performance measures and believe they provide useful information to investors regarding our financial condition and results of operations because they reflect only those income and expense items that are incurred at the property level.
Same Store NOI is used to measure the operating performance of properties in our New York and San Francisco portfolios that were owned by us in a similar manner during both the current period and prior reporting periods, and represents Same Store NOI from consolidated and unconsolidated joint ventures based on our percentage ownership in the underlying assets. Same Store NOI also excludes lease termination income, impairment of receivables arising from operating leases and certain other items that may vary from period to period. We also present Same Store Cash NOI, which excludes the effect of non-cash items such as the straight-line rent adjustments and the amortization of above and below-market leases.
PGRE’s Share of Total Debt represents our share of debt of consolidated and unconsolidated joint ventures, based on our percentage ownership in the underlying assets. We believe that PGRE’s share of total debt provides useful information to investors regarding our financial condition because it includes our share of debt from unconsolidated joint ventures and excludes the noncontrolling interests’ share of debt from consolidated joint ventures that is attributable to our partners.
PGRE’s Share of Cash and Cash Equivalents and Restricted Cash represents our share of cash and cash equivalents and restricted cash of consolidated and unconsolidated joint ventures, based on our percentage ownership in the underlying assets.
PGRE’s Share of Net Debt is calculated by subtracting PGRE’s share of cash and cash equivalents and restricted cash from PGRE’s Share of Total Debt. PGRE’s share of Net Debt to Annualized Adjusted EBITDAre is calculated by dividing PGRE's share of Net Debt by PGRE's share of Annualized Adjusted EBITDAre.
Annualized Rent represents the end of period monthly base rent plus escalations in accordance with the lease terms, multiplied by 12.
Leased % represents percentage of square feet that is leased, including signed leases not yet commenced.
Same Store Leased % represents percentage of square feet that is leased, including signed leases not yet commenced, for properties that were owned by us in a similar manner during both the current period and prior reporting periods.
Occupied % represents the percentage of space for which we have commenced rental revenue in accordance with GAAP.
Initial Rent represents the weighted average cash basis starting rent per square foot and does not include free rent or periodic step-ups in rent.
Prior Escalated Rent represents the weighted average cash basis rent (including reimbursements) per square foot at expiration.
Second Generation Space represents space leased in the current period (i) prior to its originally scheduled expiration, or (ii) that has been vacant for less than twelve months.
Capital Expenditures consist of expenditures to maintain assets, tenant improvement allowances and leasing commissions. Expenditures to Maintain Assets include capital expenditures to maintain current revenues. Second Generation Tenant Improvements and Leasing Commissions represent tenant improvements and leasing commissions incurred in leasing second generation space. First Generation Leasing Costs and Other Capital Expenditures include capital expenditures completed in the year of acquisition and the following two years that were planned at the time of acquisition, as well as tenant improvements and leasing commissions on space leased that has been vacant for more than twelve months. Redevelopment Expenditures consist of hard and soft costs related to the development of a property in getting it ready for its intended use.
- 55 -