Exhibit 99.2

SUPPLEMENTAL OPERATING AND FINANCIAL DATA
FOR THE QUARTER ENDED DECEMBER 31, 2015
| | |
 | | FORWARD-LOOKING STATEMENTS |
This supplemental information contains forward-looking statements within the meaning of the Federal securities laws. You can identify these statements by our use of the words “assumes,” “believes,” “estimates,” “expects,” “guidance,” “intends,” “plans,” “projects” and similar expressions that do not relate to historical matters. You should exercise caution in interpreting and relying on forward-looking statements because they involve known and unknown risks, uncertainties and other factors which are, in some cases, beyond our control and could materially affect actual results, performance or achievements. These factors include, without limitation, the ability to enter into new leases or renew leases on favorable terms, dependence on tenants’ financial condition, the uncertainties of real estate development, acquisition and disposition activity, the ability to effectively integrate acquisitions, the costs and availability of financing, the ability of our joint venture partners to satisfy their obligations, the effects of local, national and international economic and market conditions, the effects of acquisitions, dispositions and possible impairment charges on our operating results, regulatory changes and other risks and uncertainties detailed from time to time in our filings with the Securities and Exchange Commission. We do not undertake a duty to update or revise any forward-looking statement, whether as a result of new information, future events or otherwise.
- 2 -
| | |
| | TABLE OF CONTENTS |
| | |
| | | Page |
Company Profile | | 4 |
| |
Research Coverage | | 5 |
| |
Selected Financial Information | | |
Financial Highlights | | 6 |
Consolidated Balance Sheets | | 7 |
Consolidated Statements of Income | | 8 |
Funds From Operations (“FFO”) | | 9 |
Funds Available for Distribution (“FAD”) | | 10 |
Net Operating Income (“NOI”) | | 11 |
Earnings Before Interest, Taxes, Depreciation and Amortization (“EBITDA”) | | 12 |
Consolidated Joint Ventures and Funds | | 13 - 14 |
Unconsolidated Joint Ventures | | 15 - 16 |
Capital Structure | | 17 |
Debt Analysis | | 18 |
Debt Maturities | | 19 |
| |
Selected Property Data | | |
Portfolio Summary | | 20 |
Funds Summary | | 21 |
Top Tenants and Industry Diversification | | 22 |
Leasing Activity | | 23 - 24 |
Lease Expirations | | 25 |
Capital Expenditures - Cash Basis | | 26 |
| |
Definitions | | 27-28 |
- 3 -
| | |
| | COMPANY PROFILE |
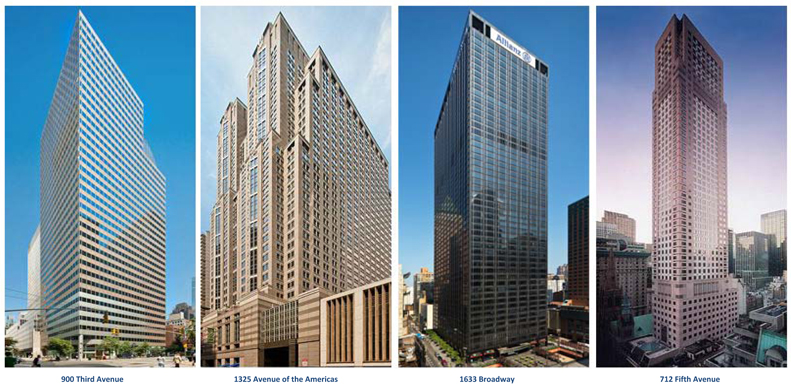
Paramount Group, Inc. (“Paramount”) is a fully-integrated real estate investment trust that owns, operates, manages, acquires and redevelops high-quality, Class A office properties located in select central business district submarkets of New York City, Washington, D.C. and San Francisco. Paramount is focused on maximizing the value of its portfolio by leveraging the sought-after locations of its assets and its proven property management capabilities to attract and retain high-quality tenants.
| | | | | | |
EXECUTIVE MANAGEMENT | | | | | | |
| Albert Behler | | Chairman, Chief Executive Officer and President |
| Michael Walsh | | Executive Vice President, Chief Financial Officer and Treasurer |
| Jolanta Bott | | Executive Vice President, Operations and Human Resources |
| Theodore Koltis | | Executive Vice President, Leasing |
| Daniel Lauer | | Executive Vice President, Chief Investment Officer |
| Ralph DiRuggiero | | Senior Vice President, Property Management |
| Gage Johnson | | Senior Vice President, General Counsel and Secretary |
| Vito Messina | | Senior Vice President, Asset Management |
| Wilbur Paes | | Senior Vice President, Chief Accounting Officer |
| | | |
BOARD OF DIRECTORS | | | | | | |
| Albert Behler | | Director, Chairman of the Board |
| Thomas Armbrust | | Director |
| Dan Emmett | | Director, Chair of Audit Committee |
| Lizanne Galbreath | | Director, Chair of Compensation Committee |
| Peter Linneman | | Director, Chair of Nominating and Corporate Governance Committee; Lead Independent Director |
| David O’Connor | | Director | | | | |
| Katharina Otto-Bernstein | | Director | | | | |
| | | |
COMPANY INFORMATION | | | | | | |
Corporate Headquarters | | Investor Relations | | Stock Exchange Listing | | Trading Symbol |
| 1633 Broadway, Suite 1801 | | IR@paramount-group.com | | New York Stock Exchange | | PGRE |
| New York, NY 10019 | | (212) 492-2298 | | | | |
| (212) 237-3100 | | | | | | |
- 4 -
| | |
| | RESEARCH COVERAGE(1) |
| | | | | | |
| James Feldman | | Thomas Lesnick | | Vin Chao | | Gabe Hilmoe |
| Bank of America Merrill Lynch | | Capital One Securities, Inc. | | Deutsche Bank | | Evercore ISI |
| (646) 855-5808 | | (571) 633-8191 | | (212) 250-6799 | | (212) 446-9459 |
| | | |
| Brad Burke | | Jed Reagan | | Richard Anderson | | Sumit Sharma |
| Goldman Sachs | | Green Street Advisors | | Mizuho Securities USA Inc. | | Morgan Stanley |
| (917) 343-2082 | | (949) 640-8780 | | (212) 205-8445 | | (212) 761-7567 |
| | | |
| Ross Nussbaum | | Brendan Maiorana | | | | |
| UBS | | Wells Fargo | | | | |
| (212) 713-2484 | | (443) 263-6516 | | | | |
| (1) | With the exception of Green Street Advisors, an independent research firm, the equity analysts listed above are those analysts that, according to First Call Corporation, have published research material on the Company and are listed as covering the Company. Please note that any opinions, estimates or forecasts regarding the Company’s performance made by such analysts do not represent the opinions, estimates or forecasts of the Company or its management. The Company does not by its reference above, imply its endorsement of or concurrence with any information, conclusions or recommendations made by any of such analysts. |
- 5 -
| | |
| | FINANCIAL HIGHLIGHTS |
| (unaudited and in thousands, except square feet and per share data) |
| | | | | | | | | | | | | | | | |
| | | Quarter Ended | |
| SELECTED FINANCIAL DATA | | December 31, 2015 | | | September 30, 2015 | | | June 30, 2015 | | | March 31, 2015 | |
Total revenues | | $ | 170,528 | | | $ | 167,726 | | | $ | 162,928 | | | $ | 161,226 | |
Pro rata share of NOI(1) | | $ | 96,812 | | | $ | 91,428 | | | $ | 92,452 | | | $ | 87,969 | |
Pro rata share of Cash NOI(1) | | $ | 75,320 | | | $ | 77,223 | | | $ | 80,457 | | | $ | 75,341 | |
Net income (loss) attributable to common stockholders | | $ | 8,905 | | | $ | 1,116 | | | $ | (4,709 | ) | | $ | (9,731 | ) |
Per share—basic and diluted | | $ | 0.04 | | | $ | 0.01 | | | $ | (0.02 | ) | | $ | (0.05 | ) |
FFO attributable to common stockholders (1) | | $ | 61,559 | | | $ | 51,810 | | | $ | 52,663 | | | $ | 43,317 | |
Per share—diluted | | $ | 0.29 | | | $ | 0.24 | | | $ | 0.25 | | | $ | 0.20 | |
FFO payout ratio(1) | | | 32.7 | % | | | 38.9 | % | | | 38.3 | % | | | 46.5 | % |
Core FFO attributable to common stockholders (1) | | $ | 45,188 | | | $ | 42,330 | | | $ | 46,315 | | | $ | 38,963 | |
Per share—diluted | | $ | 0.21 | | | $ | 0.20 | | | $ | 0.22 | | | $ | 0.18 | |
Core FFO payout ratio(1) | | | 44.6 | % | | | 47.6 | % | | | 43.5 | % | | | 51.7 | % |
FAD attributable to common stockholders (1) | | $ | (404 | ) | | $ | 22,449 | | | $ | 21,635 | | | $ | 16,852 | |
FAD payout ratio(1) | | | n/a | | | | 89.8 | % | | | 93.1 | % | | | 119.6 | % |
| |
| COMMON SHARE DATA | | | |
| |
| | | Quarter Ended | |
Share Price: | | December 31, 2015 | | | September 30, 2015 | | | June 30, 2015 | | | March 31, 2015 | |
High | | $ | 18.56 | | | $ | 18.35 | | | $ | 19.73 | | | $ | 20.21 | |
Low | | $ | 16.50 | | | $ | 15.65 | | | $ | 16.97 | | | $ | 17.66 | |
Closing (end of period) | | $ | 18.10 | | | $ | 16.80 | | | $ | 17.16 | | | $ | 19.30 | |
Dividends per common share | | $ | 0.095 | | | $ | 0.095 | | | $ | 0.095 | | | $ | 0.095 | (2) |
Annualized dividends per common share | | $ | 0.380 | | | $ | 0.380 | | | $ | 0.380 | | | $ | 0.380 | |
Dividend yield (on closing share price) | | | 2.1 | % | | | 2.3 | % | | | 2.2 | % | | | 2.0 | % |
| |
| PORTFOLIO STATISTICS | | | |
| | | | |
| | | Number of | | | Square | | | % Leased(1) | | | % Occupied(1) | |
Region: | | Properties | | | Feet | | | at December 31, 2015 | | | at December 31, 2015 | |
New York | | | 6 | | | | 7,152,207 | | | | 95.7 | % | | | 89.1 | % |
Washington, D.C. | | | 5 | | | | 1,602,655 | | | | 90.3 | % | | | 88.8 | % |
San Francisco | | | 1 | | | | 1,611,125 | | | | 98.4 | % | | | 97.2 | % |
| | | | | | | | | | | | | | | | |
| | | 12 | | | | 10,365,987 | | | | 95.3 | % | | | 90.3 | % |
| | | | | | | | | | | | | | | | |
| (1) | See page 27 for our definition of this measure. |
| (2) | Excludes the $0.039 cash dividend for the 38 day period following the completion of our initial public offering and related formation transactions and ending on December 31, 2014. |
- 6 -
| | |
| | CONSOLIDATED BALANCE SHEETS |
| (unaudited and in thousands) | | |
| | | | | | | | | | | | | | | | | | | | |
| | | December 31, 2015 | | | September 30, 2015 | | | June 30, 2015 | | | March 31, 2015 | | | December 31, 2014 | |
ASSETS: | | | | | | | | | | | | | | | | | | | | |
Rental Property | | | | | | | | | | | | | | | | | | | | |
Land | | $ | 2,042,071 | | | $ | 2,042,071 | | | $ | 2,042,071 | | | $ | 2,042,071 | | | $ | 2,042,071 | |
Buildings and improvements | | | 5,610,046 | | | | 5,567,789 | | | | 5,534,885 | | | | 5,503,475 | | | | 5,488,168 | |
| | | | | | | | | | | | | | | | | | | | |
| | | 7,652,117 | | | | 7,609,860 | | | | 7,576,956 | | | | 7,545,546 | | | | 7,530,239 | |
Accumulated depreciation and amortization | | | (243,089 | ) | | | (202,105 | ) | | | (162,377 | ) | | | (121,165 | ) | | | (81,050 | ) |
| | | | | | | | | | | | | | | | | | | | |
Rental Property, net | | | 7,409,028 | | | | 7,407,755 | | | | 7,414,579 | | | | 7,424,381 | | | | 7,449,189 | |
Real estate fund investments | | | 416,438 | | | | 336,393 | | | | 335,545 | | | | 324,282 | | | | 323,387 | |
Preferred equity investments (see page 13) | | | 53,941 | | | | — | | | | — | | | | — | | | | — | |
Investments in unconsolidated joint ventures | | | 7,102 | | | | 6,537 | | | | 6,128 | | | | 6,370 | | | | 5,749 | |
Cash and cash equivalents | | | 143,884 | | | | 418,095 | | | | 438,088 | | | | 380,889 | | | | 438,599 | |
Restricted cash | | | 41,823 | | | | 92,696 | | | | 45,737 | | | | 53,864 | | | | 55,728 | |
Marketable securities | | | 21,521 | | | | 20,365 | | | | 21,524 | | | | 21,386 | | | | 20,159 | |
Deferred rent receivable | | | 77,792 | | | | 58,117 | | | | 40,308 | | | | 24,261 | | | | 8,267 | |
Accounts and other receivables, net | | | 10,844 | | | | 12,313 | | | | 10,781 | | | | 12,863 | | | | 7,692 | |
Deferred charges, net | | | 93,905 | | | | 54,467 | | | | 49,547 | | | | 43,713 | | | | 39,165 | |
Intangible assets, net | | | 511,207 | | | | 546,432 | | | | 583,126 | | | | 629,021 | | | | 669,385 | |
Other assets | | | 6,658 | | | | 33,636 | | | | 9,529 | | | | 31,948 | | | | 13,121 | |
| | | | | | | | | | | | | | | | | | | | |
Total Assets | | $ | 8,794,143 | | | $ | 8,986,806 | | | $ | 8,954,892 | | | $ | 8,952,978 | | | $ | 9,030,441 | |
| | | | | | | | | | | | | | | | | | | | |
| | | | | |
LIABILITIES: | | | | | | | | | | | | | | | | | | | | |
Notes and mortgages payable | | $ | 2,941,524 | | | $ | 2,853,735 | | | $ | 2,853,237 | | | $ | 2,852,754 | | | $ | 2,852,287 | |
Revolving credit facility | | | 20,000 | | | | — | | | | — | | | | — | | | | — | |
Due to affiliates(1) | | | 27,299 | | | | 27,299 | | | | 27,299 | | | | 27,299 | | | | 27,299 | |
Loans payable to noncontrolling interests | | | 45,662 | | | | 44,822 | | | | 43,981 | | | | 43,188 | | | | 42,195 | |
Accounts payable and accrued expenses | | | 102,730 | | | | 97,157 | | | | 96,595 | | | | 78,282 | | | | 93,472 | |
Dividends and distributions payable | | | 25,067 | | | | 25,066 | | | | 25,066 | | | | — | | | | — | |
Deferred income taxes | | | 2,533 | | | | 2,560 | | | | 2,659 | | | | 3,183 | | | | 2,861 | |
Interest rate swap liabilities | | | 93,936 | | | | 163,301 | | | | 160,473 | | | | 182,218 | | | | 194,196 | |
Intangible liabilities, net | | | 179,741 | | | | 193,042 | | | | 201,839 | | | | 210,964 | | | | 219,228 | |
Other liabilities | | | 45,101 | | | | 44,958 | | | | 45,922 | | | | 45,742 | | | | 43,950 | |
| | | | | | | | | | | | | | | | | | | | |
Total Liabilities | | | 3,483,593 | | | | 3,451,940 | | | | 3,457,071 | | | | 3,443,630 | | | | 3,475,488 | |
| | | | | | | | | | | | | | | | | | | | |
EQUITY: | | | | | | | | | | | | | | | | | | | | |
Paramount Group, Inc. stockholders’ equity | | | 3,761,017 | | | | 3,855,843 | | | | 3,889,542 | | | | 3,829,373 | | | | 3,910,862 | |
Noncontrolling interests in consolidated joint ventures and funds | | | 651,486 | | | | 781,343 | | | | 703,596 | | | | 685,176 | | | | 685,888 | |
Noncontrolling interests in Operating Partnership | | | 898,047 | | | | 897,680 | | | | 904,683 | | | | 994,799 | | | | 958,203 | |
| | | | | | | | | | | | | | | | | | | | |
Total Equity | | | 5,310,550 | | | | 5,534,866 | | | | 5,497,821 | | | | 5,509,348 | | | | 5,554,953 | |
| | | | | | | | | | | | | | | | | | | | |
TOTAL LIABILITIES AND EQUITY | | $ | 8,794,143 | | | $ | 8,986,806 | | | $ | 8,954,892 | | | $ | 8,952,978 | | | $ | 9,030,441 | |
| | | | | | | | | | | | | | | | | | | | |
| (1) | Represents notes payable to affiliates, which are due in October 2017 and bear interest at a fixed rate of 0.50%. |
- 7 -
| | |
| | CONSOLIDATED STATEMENTS OF INCOME |
| (unaudited and in thousands, except share and per share data) | | |
| | | | | | | | | | | | | | | | |
| | | Quarter Ended | |
| | | December 31, 2015 | | | September 30, 2015 | | | June 30, 2015 | | | March 31, 2015 | |
REVENUES: | | | | | | | | | | | | | | | | |
Property rentals | | $ | 124,559 | | | $ | 127,176 | | | $ | 128,954 | | | $ | 126,402 | |
Straight-line rent adjustments | | | 19,663 | | | | 17,817 | | | | 16,091 | | | | 15,951 | |
Amortization of below-market leases, net | | | 6,678 | | | | 1,477 | | | | 872 | | | | 890 | |
| | | | | | | | | | | | | | | | |
Rental income | | | 150,900 | | | | 146,470 | | | | 145,917 | | | | 143,243 | |
Tenant reimbursement income | | | 10,929 | | | | 14,405 | | | | 12,063 | | | | 13,488 | |
Fee income | | | 4,848 | | | | 2,085 | | | | 1,780 | | | | 1,535 | |
Other Income | | | 3,851 | | | | 4,766 | | | | 3,168 | | | | 2,960 | |
| | | | | | | | | | | | | | | | |
Total revenues | | | 170,528 | | | | 167,726 | | | | 162,928 | | | | 161,226 | |
EXPENSES: | | | | | | | | | | | | | | | | |
Operating | | | 61,735 | | | | 63,354 | | | | 57,781 | | | | 61,884 | |
Depreciation and amortization | | | 70,966 | | | | 70,654 | | | | 79,421 | | | | 73,583 | |
General and administrative(1) | | | 13,644 | | | | 6,666 | | | | 9,133 | | | | 12,613 | |
Acquisition and transaction related costs | | | 523 | | | | 485 | | | | 8,208 | | | | 1,139 | |
| | | | | | | | | | | | | | | | |
Total expenses | | | 146,868 | | | | 141,159 | | | | 154,543 | | | | 149,219 | |
Operating income | | | 23,660 | | | | 26,567 | | | | 8,385 | | | | 12,007 | |
Income from real estate fund investments | | | 7,749 | | | | 10,933 | | | | 14,072 | | | | 5,221 | |
Income from unconsolidated joint ventures | | | 2,406 | | | | 1,458 | | | | 2,011 | | | | 975 | |
Unrealized gain on interest rate swaps | | | 26,263 | | | | 15,772 | | | | 21,747 | | | | 11,978 | |
Interest and other income (loss), net(2) | | | 1,268 | | | | (1,763 | ) | | | 512 | | | | 854 | |
Interest and debt expense | | | (41,421 | ) | | | (42,821 | ) | | | (42,236 | ) | | | (41,888 | ) |
| | | | | | | | | | | | | | | | |
Net income (loss) before income taxes | | | 19,925 | | | | 10,146 | | | | 4,491 | | | | (10,853 | ) |
Income tax benefit (expense) | | | 140 | | | | (789 | ) | | | (1,343 | ) | | | (574 | ) |
| | | | | | | | | | | | | | | | |
Net income (loss) | | | 20,065 | | | | 9,357 | | | | 3,148 | | | | (11,427 | ) |
Less net (income) loss attributable to noncontrolling interests in: | | | | | | | | | | | | | | | | |
Consolidated joint ventures and funds | | | (8,991 | ) | | | (7,969 | ) | | | (9,004 | ) | | | (668 | ) |
Operating Partnership | | | (2,169 | ) | | | (272 | ) | | | 1,147 | | | | 2,364 | |
| | | | | | | | | | | | | | | | |
Net income (loss) attributable to common stockholders | | $ | 8,905 | | | $ | 1,116 | | | $ | (4,709 | ) | | $ | (9,731 | ) |
| | | | | | | | | | | | | | | | |
| | | | |
Weighted average common shares outstanding | | | | | | | | | | | | | | | | |
Basic | | | 212,106,718 | | | | 212,106,718 | | | | 212,106,718 | | | | 212,106,718 | |
| | | | | | | | | | | | | | | | |
Diluted | | | 212,111,790 | | | | 212,108,079 | | | | 212,106,718 | | | | 212,106,718 | |
| | | | | | | | | | | | | | | | |
Net income (loss) per share attributable to common stockholders | | | | | | | | | | | | | | | | |
Basic | | $ | 0.04 | | | $ | 0.01 | | | $ | (0.02 | ) | | $ | (0.05 | ) |
| | | | | | | | | | | | | | | | |
Diluted | | $ | 0.04 | | | $ | 0.01 | | | $ | (0.02 | ) | | $ | (0.05 | ) |
| | | | | | | | | | | | | | | | |
| (1) | Excluding the mark-to-market of investments in our deferred compensation plan, general and administrative expenses were $12,602, $8,606, $8,771 and $11,880 for the quarters ended December 31, 2015, September 30, 2015, June 30, 2015 and March 31, 2015, respectively. |
| (2) | Excluding the mark-to-market of investments in our deferred compensation plan, interest and other income (loss), net was $226, $177, $150 and $121 for the quarters ended December 31, 2015, September 30, 2015, June 30, 2015 and March 31, 2015, respectively. |
- 8 -
| | |
| | FUNDS FROM OPERATIONS (“FFO”) |
(unaudited and in thousands, except share and per share data) | | |
| | | | | | | | | | | | | | | | |
| | | Quarter Ended | |
| | | December 31, 2015 | | | September 30, 2015 | | | June 30, 2015 | | | March 31, 2015 | |
Reconciliation of net income (loss) to FFO and Core FFO: | | | | | | | | | | | | | | | | |
Net income (loss) | | $ | 20,065 | | | $ | 9,357 | | | $ | 3,148 | | | $ | (11,427 | ) |
Real estate depreciation and amortization | | | 70,966 | | | | 70,654 | | | | 79,421 | | | | 73,583 | |
Pro rata share of real estate depreciation and amortization of unconsolidated joint ventures | | | 1,503 | | | | 1,512 | | | | 1,530 | | | | 1,476 | |
| | | | | | | | | | | | | | | | |
FFO(1) | | | 92,534 | | | | 81,523 | | | | 84,099 | | | | 63,632 | |
Less FFO attributable to noncontrolling interests in consolidated joint ventures and funds | | | (15,982 | ) | | | (17,094 | ) | | | (18,614 | ) | | | (9,789 | ) |
| | | | | | | | | | | | | | | | |
FFO attributable to Paramount Group Operating Partnership | | | 76,552 | | | | 64,429 | | | | 65,485 | | | | 53,843 | |
Less FFO attributable to noncontrolling interests in Operating Partnership | | | (14,993 | ) | | | (12,619 | ) | | | (12,822 | ) | | | (10,526 | ) |
| | | | | | | | | | | | | | | | |
FFO attributable to common stockholders(1) | | $ | 61,559 | | | $ | 51,810 | | | $ | 52,663 | | | $ | 43,317 | |
| | | | | | | | | | | | | | | | |
Per diluted share | | $ | 0.29 | | | $ | 0.24 | | | $ | 0.25 | | | $ | 0.20 | |
| | | | | | | | | | | | | | | | |
| | | | |
FFO | | $ | 92,534 | | | $ | 81,523 | | | $ | 84,099 | | | $ | 63,632 | |
Non-core (income) expense: | | | | | | | | | | | | | | | | |
Transfer taxes due in connection with the sale of shares by a former joint venture partner | | | — | | | | — | | | | 5,872 | | | | — | |
Acquisition and transaction related costs | | | 523 | | | | 485 | | | | 2,336 | | | | 1,139 | |
Predecessor income tax true-up | | | — | | | | — | | | | 721 | | | | — | |
Severance costs | | | — | | | | — | | | | — | | | | 3,315 | |
Unrealized gain on interest rate swaps | | | (26,263 | ) | | | (15,772 | ) | | | (21,747 | ) | | | (11,978 | ) |
Pro rata share of unrealized gain on interest rate swaps of an unconsolidated joint venture | | | (1,065 | ) | | | (37 | ) | | | (624 | ) | | | (386 | ) |
| | | | | | | | | | | | | | | | |
Core FFO(1) | | | 65,729 | | | | 66,199 | | | | 70,657 | | | | 55,722 | |
Less Core FFO attributable to noncontrolling interests in consolidated joint ventures and funds | | | (9,535 | ) | | | (13,560 | ) | | | (13,065 | ) | | | (7,291 | ) |
| | | | | | | | | | | | | | | | |
Core FFO attributable to Paramount Group Operating Partnership | | | 56,194 | | | | 52,639 | | | | 57,592 | | | | 48,431 | |
Less Core FFO attributable to noncontrolling interests in Operating Partnership | | | (11,006 | ) | | | (10,309 | ) | | | (11,277 | ) | | | (9,468 | ) |
| | | | | | | | | | | | | | | | |
Core FFO attributable to common stockholders(1) | | $ | 45,188 | | | $ | 42,330 | | | $ | 46,315 | | | $ | 38,963 | |
| | | | | | | | | | | | | | | | |
Per diluted share | | $ | 0.21 | | | $ | 0.20 | | | $ | 0.22 | | | $ | 0.18 | |
| | | | | | | | | | | | | | | | |
Reconciliation of weighted average shares outstanding: | | | | | | | | | | | | | | | | |
Weighted average shares outstanding | | | 212,106,718 | | | | 212,106,718 | | | | 212,106,718 | | | | 212,106,718 | |
Effect of dilutive securities | | | 5,072 | | | | 1,361 | | | | 5,004 | | | | 11,928 | |
| | | | | | | | | | | | | | | | |
Denominator for FFO per diluted share | | | 212,111,790 | | | | 212,108,079 | | | | 212,111,722 | | | | 212,118,646 | |
| | | | | | | | | | | | | | | | |
| (1) | See page 27 for our definition of this measure. |
- 9 -
| | |
| | FUNDS AVAILABLE FOR DISTRIBUTION (“FAD”) |
(unaudited and in thousands) | | |
| | | | | | | | | | | | | | | | |
| | | Quarter Ended | |
| | | December 31, 2015 | | | September 30, 2015 | | | June 30, 2015 | | | March 31, 2015 | |
Reconciliation of Core FFO to FAD: | | | | | | | | | | | | | | | | |
Core FFO | | $ | 65,729 | | | $ | 66,199 | | | $ | 70,657 | | | $ | 55,722 | |
Add: | | | | | | | | | | | | | | | | |
Amortization of stock-based compensation expense (recurring) | | | 1,297 | | | | 1,613 | | | | 1,370 | | | | 1,174 | |
Amortization of deferred financing costs (including pro rata share of unconsolidated joint ventures) | | | 862 | | | | 635 | | | | 688 | | | | 584 | |
Less: | | | | | | | | | | | | | | | | |
Recurring tenant improvements, leasing commissions and other capital expenditures | | | (41,325 | ) | | | (12,703 | ) | | | (16,882 | ) | | | (18,093 | ) |
Straight-line rent adjustments | | | (19,663 | ) | | | (17,817 | ) | | | (16,091 | ) | | | (15,951 | ) |
Unrealized gains on real estate fund investments | | | (4,435 | ) | | | (1,830 | ) | | | (11,264 | ) | | | (873 | ) |
Amortization of below-market leases, net | | | (6,678 | ) | | | (1,477 | ) | | | (872 | ) | | | (890 | ) |
Pro rata share of straight-line rent adjustments of unconsolidated joint ventures | | | 175 | | | | 146 | | | | 48 | | | | 41 | |
| | | | | | | | | | | | | | | | |
FAD(1) | | | (4,038 | ) | | | 34,766 | | | | 27,654 | | | | 21,714 | |
Less FAD attributable to noncontrolling interests in consolidated joint ventures and funds | | | 3,536 | | | | (6,849 | ) | | | (751 | ) | | | (768 | ) |
| | | | | | | | | | | | | | | | |
FAD attributable to Paramount Group Operating Partnership | | | (502 | ) | | | 27,917 | | | | 26,903 | | | | 20,946 | |
Less FAD attributable to noncontrolling interests in Operating Partnership | | | 98 | | | | (5,468 | ) | | | (5,268 | ) | | | (4,094 | ) |
| | | | | | | | | | | | | | | | |
FAD attributable to common stockholders(1) (2) | | $ | (404 | ) | | $ | 22,449 | | | $ | 21,635 | | | $ | 16,852 | |
| | | | | | | | | | | | | | | | |
| | | | |
FAD payout ratio(1) (2) | | | n/a | | | | 89.8 | % | | | 93.1 | % | | | 119.6 | % |
| | | | | | | | | | | | | | | | |
| (1) | See page 27 for our definition of this measure. |
| (2) | FAD attributable to common stockholders and the related payout ratios on a quarterly basis are not necessarily indicative of future FAD and related payout ratios due to the fluctuation in the timing of tenant improvements, leasing commissions and cash rents received from leases for which such costs are incurred. |
- 10 -
| | |
| | NET OPERATING INCOME (“NOI”) |
(unaudited and in thousands) | | |
| | | | | | | | | | | | | | | | |
| | | Quarter Ended | |
| | | December 31, 2015 | | | September 30, 2015 | | | June 30, 2015 | | | March 31, 2015 | |
Reconciliation of net income (loss) to NOI and Cash NOI: | | | | | | | | | | | | | | | | |
Net income (loss) | | $ | 20,065 | | | $ | 9,357 | | | $ | 3,148 | | | $ | (11,427 | ) |
Add: | | | | | | | | | | | | | | | | |
Depreciation and amortization | | | 70,966 | | | | 70,654 | | | | 79,421 | | | | 73,583 | |
General and administrative expenses | | | 13,644 | | | | 6,666 | | | | 9,133 | | | | 12,613 | |
Interest and debt expense | | | 41,421 | | | | 42,821 | | | | 42,236 | | | | 41,888 | |
Transfer taxes due in connection with the sale of shares by a former joint venture partner | | | — | | | | — | | | | 5,872 | | | | — | |
Acquisition and transaction related costs | | | 523 | | | | 485 | | | | 2,336 | | | | 1,139 | |
Income tax (benefit) expense | | | (140 | ) | | | 789 | | | | 1,343 | | | | 574 | |
NOI from unconsolidated joint ventures | | | 4,218 | | | | 4,303 | | | | 4,278 | | | | 3,781 | |
Less: | | | | | | | | | | | | | | | | |
Income from real estate fund investments | | | (7,749 | ) | | | (10,933 | ) | | | (14,072 | ) | | | (5,221 | ) |
Income from unconsolidated joint ventures | | | (2,406 | ) | | | (1,458 | ) | | | (2,011 | ) | | | (975 | ) |
Fee income | | | (4,848 | ) | | | (2,085 | ) | | | (1,780 | ) | | | (1,535 | ) |
Unrealized gain on interest rate swap | | | (26,263 | ) | | | (15,772 | ) | | | (21,747 | ) | | | (11,978 | ) |
Interest and other (income) loss, net | | | (1,268 | ) | | | 1,763 | | | | (512 | ) | | | (854 | ) |
| | | | | | | | | | | | | | | | |
NOI(1) | | | 108,163 | | | | 106,590 | | | | 107,645 | | | | 101,588 | |
Less NOI attributable to noncontrolling interests in consolidated joint ventures | | | (11,351 | ) | | | (15,162 | ) | | | (15,193 | ) | | | (13,619 | ) |
| | | | | | | | | | | | | | | | |
Pro rata share of NOI(1) | | $ | 96,812 | | | $ | 91,428 | | | $ | 92,452 | | | $ | 87,969 | |
| | | | | | | | | | | | | | | | |
| | | | |
NOI | | $ | 108,163 | | | $ | 106,590 | | | $ | 107,645 | | | $ | 101,588 | |
Less: | | | | | | | | | | | | | | | | |
Straight-line rent adjustments | | | (19,663 | ) | | | (17,817 | ) | | | (16,091 | ) | | | (15,951 | ) |
Amortization of below-market leases, net | | | (6,678 | ) | | | (1,477 | ) | | | (872 | ) | | | (890 | ) |
Pro rata share of straight-line rent adjustments of unconsolidated joint ventures | | | 175 | | | | 146 | | | | 48 | | | | 41 | |
| | | | | | | | | | | | | | | | |
Cash NOI(1) | | | 81,997 | | | | 87,442 | | | | 90,730 | | | | 84,788 | |
Less Cash NOI attributable to noncontrolling interests in consolidated joint ventures | | | (6,677 | ) | | | (10,219 | ) | | | (10,273 | ) | | | (9,447 | ) |
| | | | | | | | | | | | | | | | |
Pro rata share of Cash NOI(1) | | $ | 75,320 | | | $ | 77,223 | | | $ | 80,457 | | | $ | 75,341 | |
| | | | | | | | | | | | | | | | |
| (1) | See page 27 for our definition of this measure. |
- 11 -
| | |
| | EARNINGS BEFORE INTEREST, TAXES, DEPRECIATION AND AMORTIZATION (“EBITDA”) |
(unaudited and in thousands) | | |
| | | | | | | | | | | | | | | | |
| | | Quarter Ended | |
| | | December 31, 2015 | | | September 30, 2015 | | | June 30, 2015 | | | March 31, 2015 | |
Reconciliation of net income (loss) to EBITDA and Adjusted EBITDA: | | | | | | | | | | | | | | | | |
Net income (loss) | | $ | 20,065 | | | $ | 9,357 | | | $ | 3,148 | | | $ | (11,427 | ) |
Add: | | | | | | | | | | | | | | | | |
Depreciation and amortization | | | 70,966 | | | | 70,654 | | | | 79,421 | | | | 73,583 | |
Interest and debt expense | | | 41,421 | | | | 42,821 | | | | 42,236 | | | | 41,888 | |
Income tax (benefit) expense | | | (140 | ) | | | 789 | | | | 1,343 | | | | 574 | |
Pro rata share of above adjustments of unconsolidated joint ventures | | | 2,880 | | | | 2,885 | | | | 2,895 | | | | 3,190 | |
| | | | | | | | | | | | | | | | |
EBITDA(1) | | | 135,192 | | | | 126,506 | | | | 129,043 | | | | 107,808 | |
Less EBITDA attributable to noncontrolling interests in consolidated joint ventures and funds | | | (23,416 | ) | | | (27,466 | ) | | | (28,071 | ) | | | (19,323 | ) |
| | | | | | | | | | | | | | | | |
Pro rata share of EBITDA(1) | | $ | 111,776 | | | $ | 99,040 | | | $ | 100,972 | | | $ | 88,485 | |
| | | | | | | | | | | | | | | | |
| | | | |
EBITDA | | $ | 135,192 | | | $ | 126,506 | | | $ | 129,043 | | | $ | 107,808 | |
Add: | | | | | | | | | | | | | | | | |
Transfer taxes due in connection with the sale of shares by a former joint venture partner | | | — | | | | — | | | | 5,872 | | | | — | |
Acquisition and transaction related costs | | | 523 | | | | 485 | | | | 2,336 | | | | 1,139 | |
Severance costs | | | — | | | | — | | | | — | | | | 3,315 | |
Less: | | | | | | | | | | | | | | | | |
Unrealized gain on interest rate swaps | | | (26,263 | ) | | | (15,772 | ) | | | (21,747 | ) | | | (11,978 | ) |
EBITDA from real estate fund investments | | | (6,114 | ) | | | (9,730 | ) | | | (15,124 | ) | | | (4,010 | ) |
Pro rata share of unrealized gain on interest rate swaps of an unconsolidated joint venture | | | (1,065 | ) | | | (37 | ) | | | (624 | ) | | | (386 | ) |
| | | | | | | | | | | | | | | | |
Adjusted EBITDA(1) | | | 102,273 | | | | 101,452 | | | | 99,756 | | | | 95,888 | |
Less Adjusted EBITDA attributable to noncontrolling interests in consolidated joint ventures | | | (11,401 | ) | | | (14,934 | ) | | | (14,936 | ) | | | (13,411 | ) |
| | | | | | | | | | | | | | | | |
Pro rata share of Adjusted EBITDA(1) | | $ | 90,872 | | | $ | 86,518 | | | $ | 84,820 | | | $ | 82,477 | |
| | | | | | | | | | | | | | | | |
| (1) | See page 27 for our definition of this measure. |
- 12 -
| | |
| | CONSOLIDATED JOINT VENTURES AND FUNDS - BALANCE SHEETS |
| (unaudited and in thousands) | | |
| | | | | | | | | | | | | | | | |
| | | As of December 31, 2015 | |
| | | One | | | Real Estate | | | PGRESS Equity | | | | |
| | | Market Plaza | | | Funds(1) | | | Holdings L.P.(2) | | | Total | |
| Ownership % | | 49.0% | | | Various | | | 25.4% | | | | |
ASSETS: | | | | | | | | | | | | | | | | |
Rental property, net | | $ | 1,276,358 | | | $ | 67,286 | | | $ | — | | | $ | 1,343,644 | |
Real estate fund investments | | | — | | | | 416,438 | | | | — | | | | 416,438 | |
Preferred equity investments | | | — | | | | — | | | | 53,941 | | | | 53,941 | |
Cash and cash equivalents | | | 6,539 | | | | 14,495 | | | | 576 | | | | 21,610 | |
Restricted cash | | | 13,188 | | | | — | | | | — | | | | 13,188 | |
Deferred rent receivable | | | 18,386 | | | | — | | | | — | | | | 18,386 | |
Accounts and other receivables, net | | | 327 | | | | 287 | | | | — | | | | 614 | |
Deferred charges, net | | | 4,958 | | | | — | | | | — | | | | 4,958 | |
Intangible assets, net | | | 71,305 | | | | — | | | | — | | | | 71,305 | |
Other assets | | | 664 | | | | 16 | | | | — | | | | 680 | |
| | | | | | | | | | | | | | | | |
Total Assets | | $ | 1,391,725 | | | $ | 498,522 | | | $ | 54,517 | | | $ | 1,944,764 | |
| | | | | | | | | | | | | | | | |
| | | | |
LIABILITIES: | | | | | | | | | | | | | | | | |
Notes and mortgages payable | | $ | 857,037 | | | $ | — | | | $ | — | | | $ | 857,037 | |
Loans payable to noncontrolling interests | | | — | | | | 45,662 | | | | — | | | | 45,662 | |
Accounts payable and accrued expenses | | | 28,548 | | | | 936 | | | | — | | | | 29,484 | |
Interest rate swap liabilities | | | 55,404 | | | | — | | | | — | | | | 55,404 | |
Intangible liabilities, net | | | 65,011 | | | | — | | | | — | | | | 65,011 | |
Other liabilities | | | 2,659 | | | | 184 | | | | 229 | | | | 3,072 | |
| | | | | | | | | | | | | | | | |
Total Liabilities | | | 1,008,659 | | | | 46,782 | | | | 229 | | | | 1,055,670 | |
| | | | | | | | | | | | | | | | |
EQUITY: | | | | | | | | | | | | | | | | |
Paramount Group, Inc. stockholders’ equity | | | 187,282 | | | | 37,103 | | | | 13,223 | | | | 237,608 | |
Noncontrolling interests in consolidated joint ventures and funds | | | 195,784 | | | | 414,637 | | | | 41,065 | | | | 651,486 | |
| | | | | | | | | | | | | | | | |
Total Equity | | | 383,066 | | | | 451,740 | | | | 54,288 | | | | 889,094 | |
| | | | | | | | | | | | | | | | |
TOTAL LIABILITIES AND EQUITY | | $ | 1,391,725 | | | $ | 498,522 | | | $ | 54,517 | | | $ | 1,944,764 | |
| | | | | | | | | | | | | | | | |
| (1) | See page 21 for details of our ownership interest in the Funds and the Funds’ ownership interest in the underlying investments. |
| (2) | On December 16, 2015, we acquired PGRESS-A, which owned a 20% interest in a PGRESS Equity Holdings L.P., for $12,150,000. PGRESS Equity Holdings L.P. owns certain preferred equity investments that are also owned by PGRESS and PGRESS-H (together with PGRESS-A, the “PGRESS Funds”). Prior to our acquisition of PGRESS-A, we owned a 5.4% interest in the underlying investments held by the PGRESS and PGRESS-H Funds, which were consolidated into our consolidated financial statements and were reflected as a component of “real estate funds” above. Subsequent to our acquisition of PGRESS-A, we are required to consolidate PGRESS Equity Holdings L.P. Accordingly, we reclassified the underlying investments to “preferred equity investments.” |
- 13 -
| | |
| | CONSOLIDATED JOINT VENTURES AND FUNDS - OPERATING RESULTS |
| (unaudited and in thousands) | | |
| | | | | | | | | | | | |
| | | Quarter Ended December 31, 2015 | |
| | | One | | | Real Estate | | | | |
| | | Market Plaza | | | Funds(1) | | | Total | |
Total revenues | | $ | 30,652 | | | $ | 814 | | | $ | 31,466 | |
Total operating expenses | | | 8,216 | | | | 559 | | | | 8,775 | |
| | | | | | | | | | | | |
Net operating income | | | 22,436 | | | | 255 | | | | 22,691 | |
Depreciation and amortization expense | | | (13,246 | ) | | | (259 | ) | | | (13,505 | ) |
Income from real estate fund investments | | | — | | | | 7,749 | | | | 7,749 | |
Unrealized gain on interest rate swaps | | | 12,642 | | | | — | | | | 12,642 | |
Interest and other income, net | | | 5 | | | | — | | | | 5 | |
Interest and debt expense | | | (13,907 | ) | | | (841 | ) | | | (14,748 | ) |
| | | | | | | | | | | | |
Net income before income taxes | | | 7,930 | | | | 6,904 | | | | 14,834 | |
Income tax expense | | | — | | | | (1 | ) | | | (1 | ) |
| | | | | | | | | | | | |
Net income | | $ | 7,930 | | | $ | 6,903 | | | $ | 14,833 | |
| | | | | | | | | | | | |
| | | |
| | | | | | | | | | |
| Paramount Group, Inc.’s pro rata share Ownership % | | 49.0% | | | Various | | | Total | |
Net income | | $ | 3,391 | | | $ | 535 | | | $ | 3,926 | |
Add: Management fee income | | | 44 | | | | 1,742 | | | | 1,786 | |
Add: Carried interest | | | — | | | | 130 | | | | 130 | |
| | | | | | | | | | | | |
Net income attributable to Paramount Group, Inc. | | | 3,435 | | | | 2,407 | | | | 5,842 | |
Add: Real estate depreciation and amortization | | | 6,491 | | | | 23 | | | | 6,514 | |
| | | | | | | | | | | | |
FFO(2) | | | 9,926 | | | | 2,430 | | | | 12,356 | |
Less: Unrealized gain on interest rate swaps | | | (6,195 | ) | | | — | | | | (6,195 | ) |
| | | | | | | | | | | | |
Core FFO(2) | | $ | 3,731 | | | $ | 2,430 | | | $ | 6,161 | |
| | | | | | | | | | | | |
| | | |
| | | | | | | | | | |
| Noncontrolling Interests’ pro rata share Ownership % | | 51.0% | | | Various | | | Total | |
Net income | | $ | 4,539 | | | $ | 6,368 | | | $ | 10,907 | |
Less: Management fee expense | | | (44 | ) | | | (1,742 | ) | | | (1,786 | ) |
Less: Carried interest | | | — | | | | (130 | ) | | | (130 | ) |
| | | | | | | | | | | | |
Net income attributable to noncontrolling interests | | | 4,495 | | | | 4,496 | | | | 8,991 | |
Add: Real estate depreciation and amortization | | | 6,755 | | | | 236 | | | | 6,991 | |
| | | | | | | | | | | | |
FFO(2) | | | 11,250 | | | | 4,732 | | | | 15,982 | |
Less: Unrealized gain on interest rate swaps | | | (6,447 | ) | | | — | | | | (6,447 | ) |
| | | | | | | | | | | | |
Core FFO(2) | | $ | 4,803 | | | $ | 4,732 | | | $ | 9,535 | |
| | | | | | | | | | | | |
| (1) | See page 21 for details of our ownership interest in the Funds and the Funds’ ownership interest in the underlying investments. |
| (2) | See page 27 for our definition of this measure. |
- 14 -
| | |
| | UNCONSOLIDATED JOINT VENTURES - BALANCE SHEETS |
| (unaudited and in thousands) | | |
| | | | | | | | | | | | |
| | | As of December 31, 2015 | |
| | | 712 | | | Oder-Center, | | | | |
| | | Fifth Avenue | | | Germany(1) | | | Total | |
| Ownership % | | 50.0% | | | 9.5% | | | | |
ASSETS: | | | | | | | | | | | | |
Rental property, net | | $ | 214,139 | | | $ | 6,626 | | | $ | 220,765 | |
Cash and cash equivalents | | | 17,341 | | | | 1,047 | | | | 18,388 | |
Restricted Cash | | | 323 | | | | — | | | | 323 | |
Deferred rent receivable | | | 12,479 | | | | — | | | | 12,479 | |
Accounts and other receivables, net | | | 1,179 | | | | — | | | | 1,179 | |
Deferred charges, net | | | 10,622 | | | | — | | | | 10,622 | |
Other assets | | | 311 | | | | 181 | | | | 492 | |
| | | | | | | | | | | | |
Total Assets | | $ | 256,394 | | | $ | 7,854 | | | $ | 264,248 | |
| | | | | | | | | | | | |
LIABILITIES: | | | | | | | | | | | | |
Notes and mortgages payable | | $ | 246,500 | | | $ | 24,143 | | | $ | 270,643 | |
Accounts payable and accrued expenses | | | 5,324 | | | | 126 | | | | 5,450 | |
Interest rate swap liabilities | | | 9,146 | | | | — | | | | 9,146 | |
Other liabilities | | | 530 | | | | 119 | | | | 649 | |
| | | | | | | | | | | | |
Total Liabilities | | | 261,500 | | | | 24,388 | | | | 285,888 | |
| | | | | | | | | | | | |
Total Equity | | | (5,106 | ) | | | (16,534 | ) | | | (21,640 | ) |
| | | | | | | | | | | | |
TOTAL LIABILITIES AND EQUITY | | $ | 256,394 | | | $ | 7,854 | | | $ | 264,248 | |
| | | | | | | | | | | | |
(1) We account for our interest in Oder-Center on a one quarter lag basis.
- 15 -
| | |
| | UNCONSOLIDATED JOINT VENTURES - OPERATING RESULTS |
| (unaudited and in thousands) | | |
| | | | | | | | | | | | |
| | | Quarter Ended December 31, 2015 | |
| | | 712 | | | Oder-Center, | | | | |
| | | Fifth Avenue | | | Germany(2) | | | Total | |
Total revenues | | $ | 13,649 | | | $ | 1,133 | | | $ | 14,782 | |
Total operating expenses | | | 5,398 | | | | 170 | | | | 5,568 | |
| | | | | | | | | | | | |
Net operating income | | | 8,251 | | | | 963 | | | | 9,214 | |
Depreciation and amortization expense | | | (2,935 | ) | | | (96 | ) | | | (3,031 | ) |
Unrealized gain on interest rate swaps | | | 2,129 | | | | — | | | | 2,129 | |
Interest and other income, net | | | 7 | | | | — | | | | 7 | |
Interest and debt expense | | | (2,699 | ) | | | (281 | ) | | | (2,980 | ) |
| | | | | | | | | | | | |
Net income before income taxes | | | 4,753 | | | | 586 | | | | 5,339 | |
Income tax expense | | | — | | | | (3 | ) | | | (3 | ) |
| | | | | | | | | | | | |
Net income | | $ | 4,753 | | | $ | 583 | | | $ | 5,336 | |
| | | | | | | | | | | | |
| | | |
| | | | | | | | | | |
| Paramount Group, Inc.’s pro rata share Ownership % | | 50.0% | | | 9.5% | | | Total | |
Net income | | $ | 2,376 | | | $ | 56 | | | $ | 2,432 | |
Less: Step-up basis adjustment | | | — | | | | (26 | ) | | | (26 | ) |
| | | | | | | | | | | | |
Net income attributable to Paramount Group, Inc. | | | 2,376 | | | | 30 | | | | 2,406 | |
Add: Real estate depreciation and amortization | | | 1,468 | | | | 35 | | | | 1,503 | |
| | | | | | | | | | | | |
FFO(1) | | | 3,844 | | | | 65 | | | | 3,909 | |
Less: Unrealized gain on interest rate swaps | | | (1,065 | ) | | | — | | | | (1,065 | ) |
| | | | | | | | | | | | |
Core FFO(1) | | $ | 2,779 | | | $ | 65 | | | $ | 2,844 | |
| | | | | | | | | | | | |
| | | |
| | | | | | | | | | |
| Joint Venture Partners’ pro rata share Ownership % | | 50.0% | | | 90.5% | | | Total | |
Net income | | $ | 2,377 | | | $ | 527 | | | $ | 2,904 | |
Add: Real estate depreciation and amortization | | | 1,468 | | | | 89 | | | | 1,557 | |
| | | | | | | | | | | | |
FFO(1) | | | 3,845 | | | | 616 | | | | 4,461 | |
Less: Unrealized gain on interest rate swaps | | | (1,065 | ) | | | — | | | | (1,065 | ) |
| | | | | | | | | | | | |
Core FFO(1) | | $ | 2,780 | | | $ | 616 | | | $ | 3,396 | |
| | | | | | | | | | | | |
| (1) | See page 27 for our definition of this measure. |
| (2) | We account for our interest in Oder-Center on a one quarter lag basis. |
- 16 -
| | |
| | CAPITAL STRUCTURE |
| (unaudited and in thousands, except share and per share data) |
| | | | | | | | | | | | |
| | | | | | | | | As of December 31, 2015 | |
Debt: | | | | | | | | | | | | |
Consolidated debt: | | | | | | | | | | | | |
Notes and mortgages payable | | | | | | | | | | $ | 2,941,524 | |
$1.0 billion revolving credit facility | | | | | | | | | | | 20,000 | |
| | | | | | | | | | | | |
| | | | | | | | | | | 2,961,524 | |
Less: | | | | | | | | | | | | |
Noncontrolling interests’ share of consolidated debt (One Market Plaza) | | | | | | | | | | | (437,089 | ) |
Add: | | | | | | | | | | | | |
Pro rata share of unconsolidated joint venture debt (712 Fifth Avenue and Oder-Center, Germany) | | | | | | | | | | | 125,544 | |
| | | | | | | | | | | | |
Total debt | | | | | | | | | | | 2,649,979 | |
| | | | | | | | | | | | |
| | | |
| | | Shares / Units
Outstanding | | | Share Price at
December 31, 2015 | | | | |
Equity: | | | | | | | | | | | | |
Common stock | | | 212,112,137 | | | $ | 18.10 | | | | 3,839,229 | |
Operating Partnership units | | | 51,660,088 | | | | 18.10 | | | | 935,048 | |
| | | | | | | | | | | | |
| | | 263,772,225 | | | | 18.10 | | | | 4,774,277 | |
| | | | | | | | | | | | |
Total Market Capitalization | | | | | | | | | | $ | 7,424,256 | |
| | | | | | | | | | | | |
- 17 -
| | |
| | DEBT ANALYSIS |
| (unaudited and in thousands) | | |
| | | | | | | | | | | | | | | | | | | | | | | | |
| | | Total Debt | | | Fixed Rate Debt | | | Variable Rate Debt | |
| Consolidated Debt: | | Amount | | | Rate | | | Amount | | | Rate | | | Amount | | | Rate | |
1633 Broadway | | $ | 1,013,544 | | | | 3.52 | % | | $ | 1,000,000 | | | | 3.54 | % | | $ | 13,544 | | | | 2.15 | % |
31 West 52nd Street | | | 413,490 | | | | 4.23 | % | | | 237,600 | | | | 6.04 | % | | | 175,890 | | | | 1.79 | % |
900 Third Avenue | | | 274,337 | | | | 4.22 | % | | | 162,000 | | | | 5.98 | % | | | 112,337 | | | | 1.69 | % |
Waterview | | | 210,000 | | | | 5.76 | % | | | 210,000 | | | | 5.76 | % | | | — | | | | — | |
1899 Pennsylvania Avenue | | | 89,116 | | | | 4.88 | % | | | 89,116 | | | | 4.88 | % | | | — | | | | — | |
Liberty Place | | | 84,000 | | | | 4.50 | % | | | 84,000 | | | | 4.50 | % | | | — | | | | — | |
One Market Plaza | | | 857,037 | | | | 6.14 | % | | | 857,037 | | | | 6.14 | % | | | — | | | | — | |
$1.0 Billion Revolving Credit Facility | | | 20,000 | | | | 1.54 | % | | | — | | | | — | | | | 20,000 | | | | 1.54 | % |
| | | | | | | | | | | | | | | | | | | | | | | | |
Total consolidated debt | | | 2,961,524 | | | | 4.66 | % | | | 2,639,753 | | | | 5.01 | % | | | 321,771 | | | | 1.75 | % |
Noncontrolling interests’ share | | | (437,089 | ) | | | 6.14 | % | | | (437,089 | ) | | | 6.14 | % | | | — | | | | | |
| | | | | | | | | | | | | | | | | | | | | | | | |
Pro rata share of consolidated debt | | $ | 2,524,435 | | | | 4.40 | % | | $ | 2,202,664 | | | | 4.79 | % | | $ | 321,771 | | | | 1.75 | % |
| | | | | | | | | | | | | | | | | | | | | | | | |
Unconsolidated Joint Venture Debt: | | | | | | | | | | | | | | | | | | | | | | | | |
712 Fifth Avenue | | $ | 246,500 | | | | 4.22 | % | | $ | 135,000 | | | | 5.78 | % | | $ | 111,500 | | | | 2.34 | % |
Oder-Center, Germany | | | 24,143 | | | | 4.62 | % | | | 24,143 | | | | 4.62 | % | | | — | | | | — | |
| | | | | | | | | | | | | | | | | | | | | | | | |
Total unconsolidated debt | | | 270,643 | | | | 4.26 | % | | | 159,143 | | | | 5.60 | % | | | 111,500 | | | | 2.34 | % |
Joint venture partners’ share | | | (145,099 | ) | | | 4.28 | % | | | (89,349 | ) | | | 5.49 | % | | | (55,750 | ) | | | 2.34 | % |
| | | | | | | | | | | | | | | | | | | | | | | | |
Pro rata share of unconsolidated debt | | $ | 125,544 | | | | 4.23 | % | | $ | 69,794 | | | | 5.74 | % | | $ | 55,750 | | | | 2.34 | % |
| | | | | | | | | | | | | | | | | | | | | | | | |
Pro Rata Share of Total Debt | | $ | 2,649,979 | | | | 4.39 | % | | $ | 2,272,458 | | | | 4.82 | % | | $ | 377,521 | | | | 1.84 | % |
| | | | | | | | | | | | | | | | | | | | | | | | |
| | | | | | |
Revolving Credit Facility
Covenants: (1) | | Required | | Actual | |
Total Debt / Total Assets | | Less than 60% | | | 42.7 | % |
Secured Debt / Total Assets | | Less than 45% | | | 38.9 | % |
Fixed Charge Coverage | | Greater than 1.5x | | | 2.4x | |
Unsecured Debt /Unencumbered Assets | | Less than 60% | | | 14.6 | % |
Unencumbered Interest Coverage | | Greater than 1.75x | | | 19.8x | |
| | | | | | | | |
| Debt Composition: | | Amount | | | % | |
Fixed rate debt: | | | | | | | | |
Pro rata consolidated fixed rate debt | | $ | 2,202,664 | | | | | |
Pro rata unconsolidated fixed rate debt | | | 69,794 | | | | | |
| | | | | | | | |
Total fixed rate debt | | | 2,272,458 | | | | 85.8 | % |
| | | | | | | | |
Variable rate debt: | | | | | | | | |
Pro rata consolidated variable rate debt | | | 321,771 | | | | | |
Pro rata unconsolidated variable rate debt | | | 55,750 | | | | | |
| | | | | | | | |
Total variable rate debt | | | 377,521 | | | | 14.2 | % |
| | | | | | | | |
Pro Rata Share of Total Debt | | $ | 2,649,979 | | | | 100.0 | % |
| | | | | | | | |
| (1) | This section presents ratios as of December 31, 2015 in accordance with the terms of the Company’s revolving credit facility, which has been filed with the SEC. Management is not presenting these ratios and the related calculations for any other purpose or for any other period, and is not intending for these measures to otherwise provide information to investors about the Company’s financial condition or results of operations. Investors should not rely on these measures other than for purposes of testing our compliance with the revolving credit facility. |
- 18 -
| | |
| | DEBT MATURITIES |
(unaudited and in thousands) | | |
| | | | | | | | | | | | | | | | | | | | | | | | | | | | |
| Consolidated Debt: | | 2016 | | | 2017 | | | 2018 | | | 2019 | | | 2020 | | | Thereafter | | | Total | |
31 West 52nd Street | | $ | — | | | $ | 413,490 | | | $ | — | | | $ | — | | | $ | — | | | $ | — | | | $ | 413,490 | |
900 Third Avenue | | | — | | | | 274,337 | | | | — | | | | — | | | | — | | | | — | | | | 274,337 | |
Waterview | | | — | | | | 210,000 | | | | — | | | | — | | | | — | | | | — | | | | 210,000 | |
Liberty Place | | | — | | | | — | | | | 84,000 | | | | — | | | | — | | | | — | | | | 84,000 | |
One Market Plaza | | | — | | | | — | | | | — | | | | 857,037 | | | | — | | | | — | | | | 857,037 | |
1899 Pennsylvania Avenue | | | — | | | | — | | | | — | | | | — | | | | 89,116 | | | | — | | | | 89,116 | |
1633 Broadway | | | — | | | | — | | | | — | | | | — | | | | — | | | | 1,013,544 | | | | 1,013,544 | |
Revolving Credit Facility | | | — | | | | — | | | | 20,000 | | | | — | | | | — | | | | — | | | | 20,000 | |
| | | | | | | | | | | | | | | | | | | | | | | | | | | | |
Total consolidated debt | | | — | | | | 897,827 | | | | 104,000 | | | | 857,037 | | | | 89,116 | | | | 1,013,544 | | | | 2,961,524 | |
Noncontrolling interests’ share | | | — | | | | — | | | | — | | | | (437,089 | ) | | | — | | | | — | | | | (437,089 | ) |
| | | | | | | | | | | | | | | | | | | | | | | | | | | | |
Pro rata share of consolidated debt | | $ | — | | | $ | 897,827 | | | $ | 104,000 | | | $ | 419,948 | | | $ | 89,116 | | | $ | 1,013,544 | | | $ | 2,524,435 | |
| | | | | | | | | | | | | | | | | | | | | | | | | | | | |
| | | | | | | |
Unconsolidated Joint Venture Debt: | | | | | | | | | | | | | | | | | | | | | | | | | | | | |
712 Fifth Avenue | | $ | — | | | $ | — | | | $ | 246,500 | | | $ | — | | | $ | — | | | $ | — | | | $ | 246,500 | |
Oder-Center, Germany | | | — | | | | — | | | | — | | | | — | | | | — | | | | 24,143 | | | | 24,143 | |
| | | | | | | | | | | | | | | | | | | | | | | | | | | | |
Total unconsolidated debt | | | — | | | | — | | | | 246,500 | | | | — | | | | — | | | | 24,143 | | | | 270,643 | |
Joint venture partners’ share | | | — | | | | — | | | | (123,250 | ) | | | — | | | | — | | | | (21,849 | ) | | | (145,099 | ) |
| | | | | | | | | | | | | | | | | | | | | | | | | | | | |
Pro rata share of unconsolidated debt | | $ | — | | | $ | — | | | $ | 123,250 | | | $ | — | | | $ | — | | | $ | 2,294 | | | $ | 125,544 | |
| | | | | | | | | | | | | | | | | | | | | | | | | | | | |
Pro rata share of total debt | | $ | — | | | $ | 897,827 | | | $ | 227,250 | | | $ | 419,948 | | | $ | 89,116 | | | $ | 1,015,838 | | | $ | 2,649,979 | |
| | | | | | | | | | | | | | | | | | | | | | | | | | | | |
| | | | | | | |
Weighted average rate | | | — | | | | 4.59 | % | | | 4.09 | % | | | 6.14 | % | | | 4.88 | % | | | 3.52 | % | | | 4.39 | % |
| | | | | | | | | | | | | | | | | | | | | | | | | | | | |
% of Debt Maturing | | | — | | | | 33.9 | % | | | 8.6 | % | | | 15.8 | % | | | 3.4 | % | | | 38.3 | % | | | 100.0 | % |
| | | | | | | | | | | | | | | | | | | | | | | | | | | | |
- 19 -
| | |
| | PORTFOLIO SUMMARY |
(unaudited) | | |
| | | | | | | | | | | | | | | | | | | | | | | | | | |
| | | | | % | | | Square | | | % | | | % | | | Annualized Rent (2) | |
Property | | Submarket | | Ownership | | | Feet (1) | | | Leased (2) | | | Occupied (2) | | | Amount | | | Per Square Foot (3) | |
As of December 31, 2015 | | | | | | | | | | | | | | | | | | | | | | | | | | |
New York: | | | | | | | | | | | | | | | | | | | | | | | | | | |
1633 Broadway | | West Side | | | 100.0 | % | | | 2,643,065 | | | | 92.7 | % | | | 83.5 | % | | $ | 141,165,000 | | | $ | 69.60 | |
1301 Avenue of the Americas | | Sixth Ave / Rock Center | | | 100.0 | % | | | 1,767,992 | | | | 97.0 | % | | | 85.5 | % | | | 112,348,000 | | | | 75.04 | |
1325 Avenue of the Americas | | Sixth Ave / Rock Center | | | 100.0 | % | | | 814,892 | | | | 96.5 | % | | | 94.2 | % | | | 49,875,000 | | | | 67.27 | |
31 West 52nd Street | | Sixth Ave /Rock Center | | | 100.0 | % | | | 786,647 | | | | 100.0 | % | | | 100.0 | % | | | 60,298,000 | | | | 79.09 | |
900 Third Avenue | | East Side | | | 100.0 | % | | | 596,270 | | | | 96.0 | % | | | 95.2 | % | | | 41,479,000 | | | | 73.79 | |
712 Fifth Avenue | | Madison/Fifth | | | 50.0 | % | | | 543,341 | | | | 98.5 | % | | | 98.5 | % | | | 55,658,000 | | | | 104.52 | |
| | | | | | | | | | | | | | | | | | | | | | | | | | |
Subtotal / Weighted Average | | | | | | | | | 7,152,207 | | | | 95.7 | % | | | 89.1 | % | | | 460,823,000 | | | | 75.36 | |
| | | | | | | | | | | | | | | | | | | | | | | | | | |
Washington, D.C.: | | | | | | | | | | | | | | | | | | | | | | | | | | |
Waterview | | Rosslyn, VA | | | 100.0 | % | | | 647,243 | | | | 98.9 | % | | | 98.9 | % | | | 34,086,000 | | | | 51.41 | |
425 Eye Street | | East End | | | 100.0 | % | | | 380,090 | | | | 96.5 | % | | | 90.1 | % | | | 15,292,000 | | | | 45.72 | |
2099 Pennsylvania Avenue | | CBD | | | 100.0 | % | | | 208,636 | | | | 62.0 | % | | | 62.0 | % | | | 10,034,000 | | | | 77.32 | |
1899 Pennsylvania Avenue | | CBD | | | 100.0 | % | | | 192,481 | | | | 88.8 | % | | | 88.8 | % | | | 13,471,000 | | | | 79.85 | |
Liberty Place | | East End | | | 100.0 | % | | | 174,205 | | | | 80.1 | % | | | 80.1 | % | | | 10,872,000 | | | | 76.52 | |
| | | | | | | | | | | | | | | | | | | | | | | | | | |
Subtotal /Weighted Average | | | | | | | | | 1,602,655 | | | | 90.3 | % | | | 88.8 | % | | | 83,755,000 | | | | 58.31 | |
| | | | | | | | | | | | | | | | | | | | | | | | | | |
San Francisco: | | | | | | | | | | | | | | | | | | | | | | | | | | |
One Market Plaza | | South Financial District | | | 49.0 | % | | | 1,611,125 | | | | 98.4 | % | | | 97.2 | % | | | 98,006,000 | | | | 63.63 | |
| | | | | | | | | | | | | | | | | | | | | | | | | | |
Total / Weighted Average | | | | | | | | | 10,365,987 | | | | 95.3 | % | | | 90.3 | % | | $ | 642,584,000 | | | $ | 70.71 | |
| | | | | | | | | | | | | | | | | | | | | | | | | | |
| (1) | Represents the remeasured square feet, which includes an aggregate of 164,742 square feet of either REBNY or BOMA remeasurement adjustments that are not reflected in current leases. |
| (2) | See page 27 for our definition of this measure. |
| (3) | Excludes square feet and revenue from parking, storage, theater, signage and roof space. |
- 20 -
| | |
| | FUNDS SUMMARY |
(unaudited) | | |
Property Funds:
The following is a summary of the Property Funds, our ownership interests in these Funds and the Funds’ ownership interest in the underlying investments, as of December 31, 2015.
| | | | | | | | | | | | | | | | | | | | |
| | | %
Ownership | | | 60 Wall
Street | | | One Market
Plaza | | | 50 Beale
Street | | | 670 Broadway | |
Fund II | | | 10.0 | % | | | 46.3 | % | | | — | | | | — | | | | — | |
Fund III | | | 3.1 | % | | | 16.0 | % | | | 2.0 | % | | | — | | | | — | |
Fund VII/VII-H | | | 7.2 | % | | | — | | | | — | | | | 42.8 | % | | | 100.0 | % |
| | | | | | | | | | | | | | | | | | | | |
Total Property Funds | | | | | | | 62.3 | % | | | 2.0 | % | | | 42.8 | % | | | 100.0 | % |
Other Investors | | | | | | | 37.7 | % | | | 98.0 | %(1) | | | 57.2 | % | | | — | |
| | | | | | | | | | | | | | | | | | | | |
Total | | | | | | | 100.0 | % | | | 100.0 | % | | | 100.0 | % | | | 100.0 | % |
| | | | | | | | | | | | | | | | | | | | |
The following is a summary of the Property Fund investments and our ownership interests in the underlying investments, as of December 31, 2015.
| | | | | | | | | | | | | | | | | | | | | | | | | | |
| | | | | % | | | Square | | | % | | | % | | | Annualized Rent(2) | |
| | | Submarket | | Ownership | | | Feet | | | Leased | | | Occupied | | | Amount | | | Per Square Foot (3) | |
60 Wall Street | | Downtown | | | 5.1 | % | | | 1,625,483 | | | | 100.0 | % | | | 100.0 | % | | $ | 67,000,000 | (4) | | $ | 41.22 | (4) |
50 Beale Street | | South Financial District | | | 3.1 | % | | | 663,483 | | | | 98.6 | % | | | 98.6 | % | | | 33,783,000 | | | | 52.77 | |
670 Broadway | | South Financial District | | | 7.2 | % | | | 75,945 | | | | 71.3 | % | | | 37.5 | % | | | 1,486,000 | | | | 63.27 | |
Alternative Investment Funds:
The following is a summary of our ownership interests in the Alternative Investment Funds and the Funds’ underlying investments, as of December 31, 2015.
| | | | | | | | | | | | | | | | | | | | | | |
| | | | | % | | | | | | | | | Investment | |
Investment | | Investment Type | | Ownership | | | Interest Rate | | | Initial Maturity | | | Total | | | Our Share | |
26 Broadway(5) | | Mezzanine Loan | | | 1.7 | % | | | 8.3 | % | | | Jan-2022 | | | $ | 46,678,000 | | | $ | 794,000 | |
1440 Broadway(6) | | Mezzanine Loan | | | 1.7 | % | | | 6.4 | % | | | Oct-2019 | | | | 40,619,000 | | | | 691,000 | |
700 Eighth Ave(7) | | Mortgage/Mezzanine Loans | | | 1.7 | % | | | 6.4 | % | | | Dec-2016 | | | | 80,317,000 | | | | 1,365,000 | |
| | | | | | | | | | | | | | | | | | | | | | |
| | | | | | | | | | | | | | | | $ | 167,614,000 | | | $ | 2,850,000 | |
| | | | | | | | | | | | | | | | | | | | | | |
| (1) | Includes a 49.0% direct ownership interest held by us. |
| (2) | See page 27 for our definition of this measure. |
| (3) | Excludes square feet and revenue from parking, storage, signage and roof space. |
| (4) | Represents triple net base rent only. |
| (5) | Represents a $46,000,000 mezzanine loan secured by the equity interest in the owner of 26 Broadway and bears interest at a fixed rate of 8.3%. |
| (6) | Represents a $40,000,000 mezzanine loan secured by the equity interest in the owner of 1440 Broadway and bears interest at LIBOR plus 600 bps. |
| (7) | Represents a senior mortgage and mezzanine loan aggregating $80,000,000 secured by 700 Eighth Avenue, and bears interest at LIBOR plus 600 bps. |
- 21 -
| | |
| | TOP TENANTS AND INDUSTRY DIVERSIFICATION |
| (unaudited) | | |
| | | | | | | | | | | | | | | | | | | | | | | | |
| | | Lease
Expiration | | | Square Feet
Occupied | | | % of Total
Square Feet | | | Annualized Rent(1) | | | % of Annualized
Rent | |
| Top 10 Tenants: | | | | | Amount | | | Per Square Foot | | |
As of December 31, 2015 | | | | | | | | | | | | | | | | | | | | | | | | |
The Corporate Executive Board Company | | | Jan-2028 | | | | 625,062 | | | | 6.0 | % | | $ | 32,048,000 | | | $ | 51.27 | | | | 5.0 | % |
Barclays Capital, Inc. | | | Dec-2020 | | | | 497,418 | | | | 4.8 | % | | | 29,071,000 | | | | 58.44 | | | | 4.5 | % |
Allianz Global Investors, LP | | | Jan-2031 | (2) | | | 326,457 | (2) | | | 3.1 | % | | | 26,170,000 | | | | 80.16 | | | | 4.1 | % |
Clifford Chance LLP | | | Jun-2024 | | | | 328,992 | | | | 3.2 | % | | | 25,510,000 | | | | 77.54 | | | | 4.0 | % |
Credit Agricole Corporate & Investment Bank | | | Feb-2023 | | | | 311,291 | | | | 3.0 | % | | | 24,726,000 | | | | 79.43 | | | | 3.8 | % |
Commerzbank AG | | | May-2016 | (3) | | | 287,535 | (3) | | | 2.8 | % | | | 24,271,000 | | | | 84.41 | | | | 3.8 | % |
Google, Inc. | | | Apr-2025 | | | | 275,822 | | | | 2.7 | % | | | 17,495,000 | | | | 63.43 | | | | 2.7 | % |
Deloitte & Touche, LLP | | | Mar-2016 | | | | 212,052 | | | | 2.0 | % | | | 16,735,000 | | | | 78.92 | | | | 2.6 | % |
WMG Acquisition Corp. (Warner Music Group) | | | Jul-2029 | | | | 293,487 | | | | 2.8 | % | | | 16,311,000 | | | | 55.58 | | | | 2.5 | % |
Chadbourne & Parke LLP | | | Sep-2034 | | | | 203,102 | | | | 2.0 | % | | | 15,884,000 | | | | 78.21 | | | | 2.5 | % |
| | | | | | | | | | | | | | | | |
| | | Square Feet | | | % of Occupied | | | Annualized | | | % of Annualized | |
| Industry Diversification: | | Occupied | | | Square Feet | | | Rent | | | Rent | |
As of December 31, 2015 | | | | | | | | | | | | | | | | |
Legal Services | | | 1,782,122 | | | | 19.4 | % | | $ | 131,355,000 | | | | 20.4 | % |
Financial Services - Commercial and Investment Banking | | | 1,726,657 | | | | 18.8 | % | | | 124,469,000 | | | | 19.4 | % |
Financial Services - All other | | | 1,396,171 | | | | 15.2 | % | | | 112,087,000 | | | | 17.4 | % |
Technology and Media | | | 1,433,307 | | | | 15.6 | % | | | 89,537,000 | | | | 14.0 | % |
Retail | | | 321,436 | | | | 3.5 | % | | | 28,326,000 | | | | 4.4 | % |
Insurance | | | 338,399 | | | | 3.7 | % | | | 26,869,000 | | | | 4.2 | % |
Accounting | | | 275,263 | | | | 3.0 | % | | | 20,718,000 | | | | 3.2 | % |
Real Estate | | | 205,835 | | | | 2.2 | % | | | 15,677,000 | | | | 2.4 | % |
Government | | | 316,700 | | | | 3.5 | % | | | 14,677,000 | | | | 2.3 | % |
Other | | | 1,385,376 | | | | 15.1 | % | | | 78,869,000 | | | | 12.3 | % |
| (1) | See page 27 for our definition of this measure. |
| (2) | 5,546 of the square feet leased expires in December 2016. |
| (3) | As of December 31, 2015, 144,712 of this square footage has been leased to other tenants pursuant to signed leases that are expected to commence following the May 2016 expiration. |
- 22 -
| | |
| | LEASING ACTIVITY |
| (unaudited) | | |
| | | | | | | | | | | | | | | | |
| | | Total(1) | | | New York (1) | | | Washington, D.C. | | | San Francisco | |
Quarter Ended December 31, 2015: | | | | | | | | | | | | | | | | |
Total square feet leased | | | 647,828 | | | | 478,451 | | | | — | | | | 169,377 | |
Pro rata share of total square feet leased: | | | 561,446 | | | | 478,451 | | | | — | | | | 82,995 | |
Initial rent(2) | | $ | 79.80 | | | $ | 78.90 | | | $ | — | | | $ | 85.01 | |
Weighted average lease term (in years) | | | 13.0 | | | | 14.2 | | | | — | | | | 5.9 | |
Tenant improvements and leasing commissions: | | | | | | | | | | | | | | | | |
Per square foot | | $ | 96.77 | | | $ | 107.03 | | | $ | — | | | $ | 37.63 | |
Per square foot per annum | | $ | 7.46 | | | $ | 7.54 | | | $ | — | | | $ | 6.40 | |
Percentage of initial rent | | | 9.4 | % | | | 9.6 | % | | | — | | | | 7.5 | % |
Rent concessions: | | | | | | | | | | | | | | | | |
Average free rent period (in months) | | | 10.0 | | | | 11.0 | | | | — | | | | 3.9 | |
Average free rent period per annum (in months) | | | 0.8 | | | | 0.8 | | | | — | | | | 0.7 | |
Second generation space:(2) | | | | | | | | | | | | | | | | |
Square feet | | | 443,336 | | | | 360,341 | | | | — | | | | 82,995 | |
Cash basis: | | | | | | | | | | | | | | | | |
Initial rent(2) | | $ | 79.68 | | | $ | 78.45 | | | $ | — | | | $ | 85.01 | |
Prior escalated rent | | $ | 67.95 | | | $ | 70.51 | | | $ | — | | | $ | 56.81 | |
Percentage increase | | | 17.3 | % | | | 11.3 | % | | | — | | | | 49.6 | % |
GAAP basis: | | | | | | | | | | | | | | | | |
Straight-line rent | | $ | 80.75 | | | $ | 79.83 | | | $ | — | | | $ | 84.72 | |
Prior straight-line rent | | $ | 67.61 | | | $ | 70.51 | | | $ | — | | | $ | 55.00 | |
Percentage increase | | | 19.4 | % | | | 13.2 | % | | | — | | | | 54.0 | % |
| (1) | The leasing statistics (excluding square feet leased) include the effect of a lease extension for the parking garage at 31 West 52nd Street. |
| (2) | See page 27 for our definition of this measure. |
- 23 -
| | |
| | LEASING ACTIVITY |
| (unaudited) | | |
| | | | | | | | | | | | | | | | |
| | | Total(1) | | | New York(1) | | | Washington, D.C. | | | San Francisco | |
Year Ended December 31, 2015: | | | | | | | | | | | | | | | | |
Total square feet leased | | | 1,393,770 | | | | 1,074,761 | | | | 49,633 | | | | 269,376 | |
Pro rata share of total square feet leased: | | | 1,220,654 | | | | 1,039,027 | | | | 49,633 | | | | 131,994 | |
Initial rent(2) | | $ | 78.48 | | | $ | 78.37 | | | $ | 56.58 | | | $ | 87.64 | |
Weighted average lease term (in years) | | | 11.9 | | | | 12.6 | | | | 11.1 | | | | 6.2 | |
Tenant improvements and leasing commissions: | | | | | | | | | | | | | | | | |
Per square foot | | $ | 89.71 | | | $ | 95.80 | | | $ | 92.63 | | | $ | 40.70 | |
Per square foot per annum | | $ | 7.55 | | | $ | 7.57 | | | $ | 8.35 | | | $ | 6.60 | |
Percentage of initial rent | | | 9.6 | % | | | 9.7 | % | | | 14.8 | % | | | 7.5 | % |
Rent concessions: | | | | | | | | | | | | | | | | |
Average free rent period (in months) | | | 9.6 | | | | 10.4 | | | | 10.3 | | | | 3.2 | |
Average free rent period per annum (in months) | | | 0.8 | | | | 0.8 | | | | 0.9 | | | | 0.5 | |
Second generation space:(2) | | | | | | | | | | | | | | | | |
Square feet | | | 930,514 | | | | 787,585 | | | | 20,770 | | | | 122,159 | |
Cash basis: | | | | | | | | | | | | | | | | |
Initial rent(2) | | $ | 79.52 | | | $ | 78.31 | | | $ | 78.62 | | | $ | 87.47 | |
Prior escalated rent | | $ | 68.78 | | | $ | 70.59 | | | $ | 64.86 | | | $ | 57.79 | |
Percentage increase | | | 15.6 | % | | | 10.9 | % | | | 21.2 | % | | | 51.3 | % |
GAAP basis: | | | | | | | | | | | | | | | | |
Straight-line rent | | $ | 79.60 | | | $ | 78.54 | | | $ | 77.00 | | | $ | 86.85 | |
Prior straight-line rent | | $ | 68.62 | | | $ | 70.95 | | | $ | 51.72 | | | $ | 56.48 | |
Percentage increase | | | 16.0 | % | | | 10.7 | % | | | 48.9 | % | | | 53.8 | % |
| (1) | The leasing statistics (excluding square feet leased) include the effect of a lease extension for the parking garage at 31 West 52nd Street. |
| (2) | See page 27 for our definition of this measure. |
- 24 -
| | |
| | LEASE EXPIRATIONS |
| (unaudited) | | |
| | | | | | | | | | | | | | | | |
| Year of | | Square Feet | | | Annualized Rent(1) | | | % of | |
Lease Expiration(2) | | of Expiring Leases | | | Amount | | | Per Square Foot (3) | | | Annualized Rent | |
Month to Month | | | 5,593 | | | $ | 631,000 | | | $ | 104.08 | | | | 0.1 | % |
| | | | | | | | | | | | | | | | |
1Q 2016 | | | 9,111 | | | | 911,000 | | | | 100.00 | | | | 0.1 | % |
2Q 2016 | | | 366,010 | | | | 30,019,000 | | | | 81.49 | | | | 4.5 | % |
3Q 2016 | | | 160,772 | | | | 11,675,000 | | | | 72.65 | | | | 1.7 | % |
4Q 2016 | | | 27,427 | | | | 2,045,000 | | | | 76.28 | | | | 0.3 | % |
| | | | | | | | | | | | | | | | |
Total 2016 | | | 563,320 | | | | 44,650,000 | | | | 79.02 | | | | 6.6 | % |
| | | | |
2017 | | | 553,297 | | | | 40,453,000 | | | | 73.75 | | | | 6.0 | % |
2018 | | | 323,095 | | | | 25,631,000 | | | | 79.20 | | | | 3.8 | % |
2019 | | | 500,762 | | | | 37,617,000 | | | | 75.50 | | | | 5.6 | % |
2020 | | | 465,698 | | | | 32,852,000 | | | | 79.17 | | | | 4.9 | % |
2021 | | | 1,521,322 | | | | 89,931,000 | | | | 59.99 | | | | 13.4 | % |
2022 | | | 531,263 | | | | 35,346,000 | | | | 73.97 | | | | 5.3 | % |
2023 | | | 670,462 | | | | 53,101,000 | | | | 79.70 | | | | 7.9 | % |
2024 | | | 682,055 | | | | 53,564,000 | | | | 78.99 | | | | 8.0 | % |
2025 | | | 465,438 | | | | 34,118,000 | | | | 73.43 | | | | 5.1 | % |
Thereafter | | | 3,300,647 | | | | 223,413,000 | | | | 67.23 | | | | 33.3 | % |
| (1) | See page 27 for our definition of this measure. |
| (2) | Leases that expire on the last day of the quarter are treated as occupied and are reflected as expiring space in the following quarter. |
| (3) | Excludes square feet and revenue from parking, storage, theater, signage and roof space. |
- 25 -
| | |
| | CAPITAL EXPENDITURES - CASH BASIS |
(unaudited and in thousands) | | |
| | | | | | | | | | | | | | | | |
| | | Quarter Ended | |
| | | December 31, 2015 | | | September 30, 2015 | | | June 30, 2015 | | | March 31, 2015 | |
Capital expenditures to maintain assets: | | | | | | | | | | | | | | | | |
Recurring(1) | | $ | 5,549 | | | $ | 3,101 | | | $ | 273 | | | $ | 3,754 | |
Non-recurring(1) | | | — | | | | — | | | | — | | | | — | |
| | | | | | | | | | | | | | | | |
Total capital expenditures to maintain assets | | $ | 5,549 | | | $ | 3,101 | | | $ | 273 | | | $ | 3,754 | |
| | | | | | | | | | | | | | | | |
Tenant improvements: | | | | | | | | | | | | | | | | |
Recurring(1) | | $ | 10,064 | | | $ | 5,298 | | | $ | 13,254 | | | $ | 10,795 | |
Non-recurring(1) | | | 14,470 | | | | 10,555 | | | | 1,431 | | | | 1,693 | |
| | | | | | | | | | | | | | | | |
Total tenant improvements | | $ | 24,534 | | | $ | 15,853 | | | $ | 14,685 | | | $ | 12,488 | |
| | | | | | | | | | | | | | | | |
Leasing commissions: | | | | | | | | | | | | | | | | |
Recurring(1) | | $ | 25,712 | | | $ | 4,304 | | | $ | 3,355 | | | $ | 3,544 | |
Non-recurring(1) | | | 7,890 | | | | 1,124 | | | | 1,678 | | | | 2,587 | |
| | | | | | | | | | | | | | | | |
Total leasing commissions | | $ | 33,602 | | | $ | 5,428 | | | $ | 5,033 | | | $ | 6,131 | |
| | | | | | | | | | | | | | | | |
Total capital expenditures, tenant improvements and leasing commissions: | | | | | | | | | | | | | | | | |
Total recurring(1) | | $ | 41,325 | | | $ | 12,703 | | | $ | 16,882 | | | $ | 18,093 | |
Total non-recurring(1) | | | 22,360 | | | | 11,679 | | | | 3,109 | | | | 4,280 | |
| | | | | | | | | | | | | | | | |
Total capital expenditures, tenant improvements and leasing commissions | | $ | 63,685 | | | $ | 24,382 | | | $ | 19,991 | | | $ | 22,373 | |
| | | | | | | | | | | | | | | | |
Development expenditures(1) | | | | | | | | | | | | | | | | |
One Market Plaza—Lobby and Retail repositioning | | $ | 3,973 | | | $ | 3,421 | | | $ | 3,866 | | | $ | 5,301 | |
1633 Broadway—Plaza and Retail development(2) | | | 3,940 | | | | 2,873 | | | | 879 | | | | 93 | |
Other | | | 708 | | | | 679 | | | | 576 | | | | — | |
| | | | | | | | | | | | | | | | |
Total Development expenditures | | $ | 8,621 | | | $ | 6,973 | | | $ | 5,321 | | | $ | 5,394 | |
| | | | | | | | | | | | | | | | |
| (1) | See page 27 for our definition of this measure. |
| (2) | Of the $15,000 budget, $8,683 has been expended as of December 31, 2015. |
- 26 -
| | |
| | DEFINITIONS |
Funds from Operations (“FFO”)is calculated in accordance with the definition adopted by National Association of Real Estate Investment Trusts (“NAREIT”). NAREIT defines FFO as GAAP net income or loss adjusted to exclude net gains from sales of depreciated real estate assets, impairment losses on depreciable real estate and depreciation and amortization expense from real estate assets, including our share of such adjustments of unconsolidated joint ventures. FFO is commonly used in the real estate industry to assist investors and analysts in comparing results of real estate companies because it excludes the effect of real estate depreciation and amortization and net gains on sales, which are based on historical costs and implicitly assume that the value of real estate diminishes predictably over time, rather than fluctuating based on existing market conditions.FFO attributable to common stockholdersrepresents the pro rata share of FFO that is attributable to common stockholders and is calculated by reducing noncontrolling interest in consolidated joint ventures and funds and noncontrolling interest in Operating Partnership’s pro rata share of FFO from FFO.
FFO Payout Ratio is calculated as dividends per share divided by FFO per share.
Core Funds from Operations (“Core FFO”)is calculated by adjusting FFO for certain other items, including acquisition and transaction related costs and unrealized gains or losses on interest rate swaps, including our share of such adjustments of unconsolidated joint ventures. We present Core FFO as an alternative measure of our operating performance, which adjusts FFO for items that we believe enhance the comparability of our FFO across periods. In future periods, we may also exclude other items from Core FFO that we believe may help investors compare our results.Core FFO attributable to common stockholdersrepresents the pro rata share of Core FFO that is attributable to common stockholders and is calculated by reducing noncontrolling interest in consolidated joint ventures and funds and noncontrolling interest in Operating Partnership’s pro rata share of Core FFO from Core FFO.
Core FFO Payout Ratio is calculated as dividends per share divided by Core FFO per share.
Funds Available for Distribution (“FAD”)is calculated as Core FFO less (i) recurring tenant improvements, leasing commissions and other capital expenditures (ii) straight-line rent adjustments (iii) unrealized gains on real estate fund investments and (iv) amortization of above and below-market leases, net, plus (v) amortization of stock-based compensation expense and (vi) amortization of deferred financing costs. FAD is commonly used in the real estate industry as a measure of the ability to fund cash needs and make dividend payments. FAD does not represent cash generated from operating activities determined in accordance with GAAP, as presented in our consolidated statements of cash flow and may not be comparable to other real estate companies.FAD attributable to common stockholdersrepresents the pro rata share of FAD that is attributable to common stockholders and is calculated by reducing noncontrolling interest in consolidated joint ventures and funds and noncontrolling interest in Operating Partnership’s pro rata share of FAD from FAD.
FAD Payout Ratio is calculated as total dividends divided by FAD.
Net Operating Income (“NOI”)is a metric we use to measure the operating performance of our properties, and consists of property-related revenue (which includes rental revenue, tenant reimbursement income and certain other income) less operating expenses (which includes building expenses such as cleaning, security, repairs and maintenance, utilities, property administration and real estate taxes). We also presentCash NOIwhich deducts from NOI, straight-line rent adjustments and the amortization of above and below-market leases, net, including our share of such adjustments of unconsolidated joint ventures. In addition, we present ourPro rata share of NOI and Cash NOIwhich represents our share of NOI and Cash NOI of consolidated and unconsolidated joint ventures, based on our percentage ownership in the underlying assets. NOI and Cash NOI are metrics we use to measure the operating performance of our properties. We use these metrics internally as performance measures and believe they provide useful information to investors regarding our financial condition and results of operations because they reflect only those income and expense items that are incurred at property level. Other real estate companies may use different methodologies for calculating NOI and Cash NOI, and accordingly, our presentation of NOI and Cash NOI may not be comparable to other real estate companies.
- 27 -
| | |
| | DEFINITIONS - CONTINUED |
Earnings Before Interest, Taxes, Depreciation and Amortization (“EBITDA”)is calculated as net income plus interest expense, income taxes, depreciation and amortization expenses. We present EBITDA because we believe that EBITDA, along with cash flow from operating activities, investing activities and financing activities, provides investors with an additional indicator of its ability to incur and service debt. EBITDA should not be considered as an alternative to net income (determined in accordance with GAAP), as an indication of our financial performance, as an alternative to net cash flows from operating activities (determined in accordance with GAAP), or as a measure of its liquidity.
Adjusted Earnings Before Interest, Taxes, Depreciation and Amortization (“Adjusted EBITDA”)is calculated by adjusting EBITDA to eliminate the impact of the performance of our real estate funds, gains and losses on interest rate swaps, acquisition and transaction costs and certain other items that may vary from period to period. We also present our pro rata share of Adjusted EBITDA, which represents our share of the Adjusted EBITDA generated by our consolidated and unconsolidated operating assets based on our percentage ownership of such assets. Adjusted EBITDA helps compare our operating performance from period to period by removing from our operating results the impact of our capital structure (primarily interest charges from our consolidated outstanding debt and the impact of our interest rate swaps), certain non-cash expenses (primarily depreciation and amortization on our assets), the formation and performance of our real estate funds and acquisition and transaction costs that may vary from period to period. In future periods, we may also exclude other items from Adjusted EBITDA that we believe may help investors compare our results. Adjusted EBITDA should not be considered as an alternative to net income (loss) determined in accordance with GAAP. Other real estate companies may use different methodologies for calculating Adjusted EBITDA or similar metrics, and accordingly, our presentation of Adjusted EBITDA may not be comparable to other real estate companies.
Annualized Rent represents the end of period monthly base rent plus escalations in accordance with the lease terms, multiplied by 12.
Occupied %represents the percentage of space for which we have commenced rental revenue in accordance with GAAP.
Leased %represents percentage of square feet that is leased, including signed leases not yet commenced.
Initial Rentrepresents the weighted average cash basis starting rent per square foot and does not include free rent or periodic step-ups in rent.
Second Generation Spacerelates to space leased that has not been vacant for more than twelve months.
Capital Expendituresconsist of expenditures to maintain assets, tenant improvement allowances and leasing commissions.Recurring Capital Expendituresinclude capital expenditures to maintain current revenues and tenant improvements and leasing commissions related to space leased that has not been vacant for more than twelve months.Nonrecurring Capital Expendituresinclude capital expenditures completed in the year of acquisition and the following two years that were planned at the time of acquisition, as well as tenant improvements and leasing commissions on space leased that has been vacant for more than twelve months.Development Expendituresconsist of hard and soft costs related to the development of a property in getting it ready for its intended use.
- 28 -