Exhibit (c)(4)
Preliminary Draft – Confidential
The Conflicts Committee of the Board of Directors of VTTI Energy Partners GP LLC
Discussion Materials Regarding Project Terminal Velocity April 21, 2017
Evercore
vtti
energy partners

Preliminary Draft – Confidential
These materials have been prepared by Evercore Group L.L.C. (“Evercore”) for the Conflicts Committee of the Board of Directors of VTTI Energy Partners GP LLC (“VTGP”) to whom such materials are directly addressed and delivered and may not be used or relied upon for any purpose other than as specifically contemplated by a written agreement with Evercore. These materials are based on information provided by or on behalf of the Board and/or other potential transaction participants, from public sources or otherwise reviewed by Evercore. Evercore assumes no responsibility for independent investigation or verification of such information and has relied on such information being complete and accurate in all material respects. To the extent such information includes estimates and forecasts of future financial performance prepared by or reviewed with the management of the Board and/or other potential transaction participants or obtained from public sources, Evercore has assumed that such estimates and forecasts have been reasonably prepared on bases reflecting the best currently available estimates and judgments of such management (or, with respect to estimates and forecasts obtained from public sources, represent reasonable estimates). No representation or warranty, express or implied, is made as to the accuracy or completeness of such information and nothing contained herein is, or shall be relied upon as, a representation, whether as to the past, the present or the future. These materials were designed for use by specific persons familiar with the business and affairs of the Board. These materials are not intended to provide the sole basis for evaluating, and should not be considered a recommendation with respect to, any transaction or other matter. These materials have been developed by and are proprietary to Evercore and were prepared exclusively for the benefit and internal use of the Board.
These materials were compiled on a confidential basis for use by the Board in evaluating the potential transaction described herein and not with a view to public disclosure or filing thereof under state or federal securities laws, and may not be reproduced, disseminated, quoted or referred to, in whole or in part, without the prior written consent of Evercore.
These materials do not constitute an offer or solicitation to sell or purchase any securities and are not a commitment by Evercore (or any affiliate) to provide or arrange any financing for any transaction or to purchase any security in connection therewith. Evercore assumes no obligation to update or otherwise revise these materials. These materials may not reflect information known to other professionals in other business areas of Evercore and its affiliates.
Evercore and its affiliates do not provide legal, accounting or tax advice. Accordingly, any statements contained herein as to tax matters were neither written nor intended by Evercore or its affiliates to be used and cannot be used by any taxpayer for the purpose of avoiding tax penalties that may be imposed on such taxpayer. Each person should seek legal, accounting and tax advice based on his, her or its particular circumstances from independent advisors regarding the impact of the transactions or matters described herein.
Evercore
vtti
energy partners
Preliminary Draft – Confidential
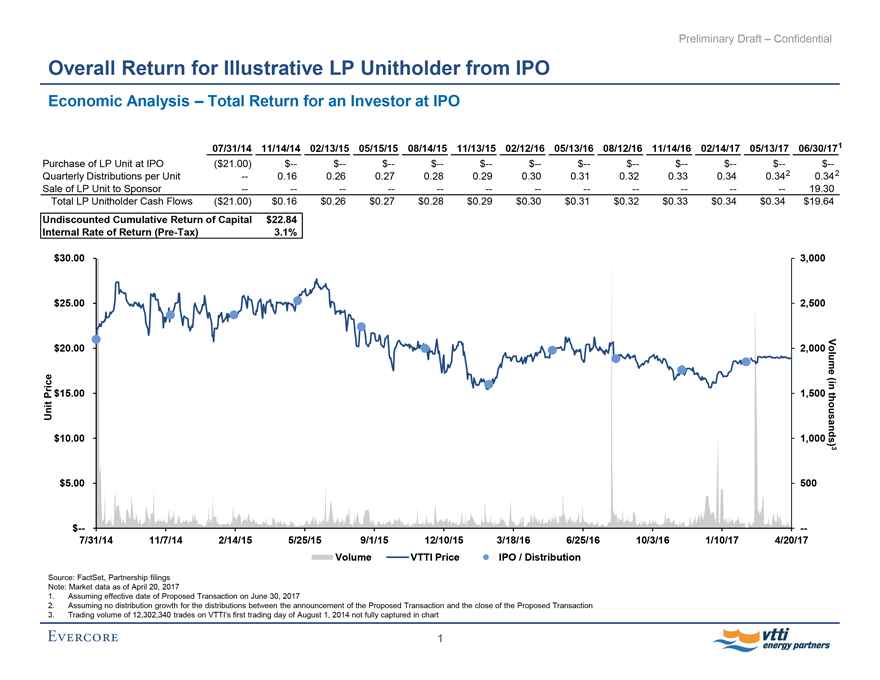
Overall Return for Illustrative LP Unitholder from IPO
Economic Analysis – Total Return for an Investor at IPO
07/31/14 11/14/14 02/13/15 05/15/15 08/14/15 11/13/15 02/12/16 05/13/16 08/12/16 11/14/16 02/14/17 05/13/17 06/30/171
Purchase of LP Unit at IPO ($21.00) $— $— $— $— $— $— $— $— $— $— $— $—
Quarterly Distributions per Unit — 0.16 0.26 0.27 0.28 0.29 0.30 0.31 0.32 0.33 0.34 0.342 0.34 2
Sale of LP Unit to Sponsor — — — — — — — — — — — — 19.30
Total LP Unitholder Cash Flows ($21.00) $0.16 $0.26 $0.27 $0.28 $0.29 $0.30 $0.31 $0.32 $0.33 $0.34 $0.34 $19.64
Undiscounted Cumulative Return of Capital $22.84
Internal Rate of Return(Pre-Tax) 3.1%
Unit Price Volume (in thousands)3
$30.00 3,000
$25.00 2,500
$20.00 2,000
$15.00 1,500
$10.00 1,000
$5.00 500
$— —
7/31/14 11/7/14 2/14/15 5/25/15 9/1/15 12/10/15 3/18/16 6/25/16 10/3/16 1/10/17 4/20/17
Volume VTTI Price IPO / Distribution
Source: FactSet, Partnership filings Note: Market data as of April 20, 2017
1. Assuming effective date of Proposed Transaction on June 30, 2017
2. Assuming no distribution growth for the distributions between the announcement of the Proposed Transaction and the close of the Proposed Transaction
3. Trading volume of 12,302,340 trades on VTTI’s first trading day of August 1, 2014 not fully captured in chart
Evercore 1 vtti energy partners
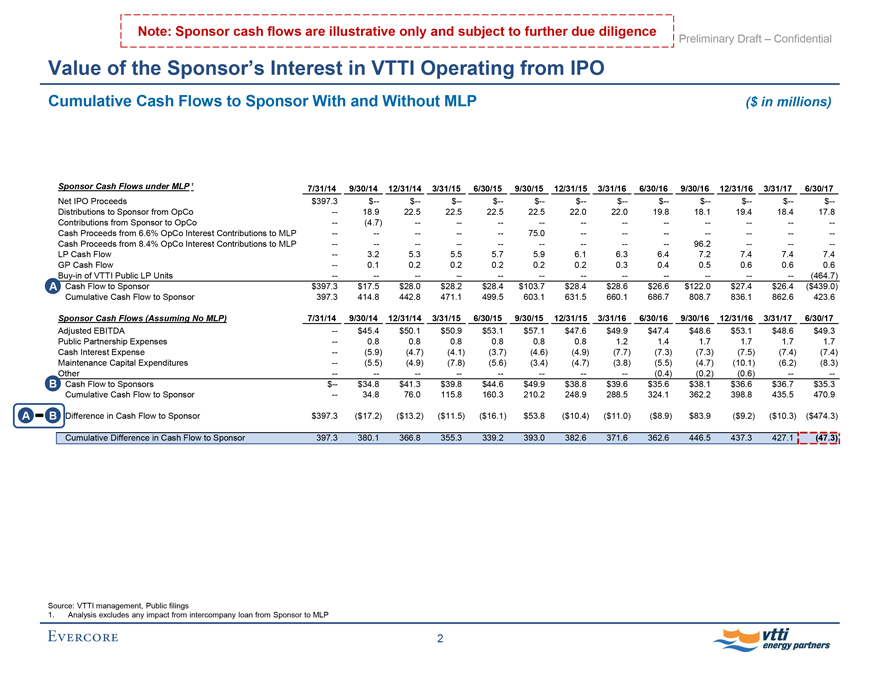
Note: Sponsor cash flows are illustrative only and subject to further due diligence
Preliminary Draft – Confidential
Value of the Sponsor’s Interest in VTTI Operating from IPO
Cumulative Cash Flows to Sponsor With and Without MLP ($ in millions)
Sponsor Cash Flows under MLP 1 7/31/14 9/30/14 12/31/14 3/31/15 6/30/15 9/30/15 12/31/15 3/31/16 6/30/16 9/30/16 12/31/16 3/31/17 6/30/17
Net IPO Proceeds $397.3 $— $— $— $— $— $— $— $— $— $— $— $—
Distributions to Sponsor from OpCo — 18.9 22.5 22.5 22.5 22.5 22.0 22.0 19.8 18.1 19.4 18.4 17.8
Contributions from Sponsor to OpCo — (4.7) — — — — — — — — — — —
Cash Proceeds from 6.6% OpCo Interest Contributions to MLP — — — — — 75.0 — — — — — — —
Cash Proceeds from 8.4% OpCo Interest Contributions to MLP — — — — — — — — — 96.2 — — —
LP Cash Flow — 3.2 5.3 5.5 5.7 5.9 6.1 6.3 6.4 7.2 7.4 7.4 7.4
GP Cash Flow — 0.1 0.2 0.2 0.2 0.2 0.2 0.3 0.4 0.5 0.6 0.6 0.6
Buy-in of VTTI Public LP Units — — — — — — — — — — — — (464.7)
A Cash Flow to Sponsor $397.3 $17.5 $28.0 $28.2 $28.4 $103.7 $28.4 $28.6 $26.6 $122.0 $27.4 $26.4 ($439.0)
Cumulative Cash Flow to Sponsor 397.3 414.8 442.8 471.1 499.5 603.1 631.5 660.1 686.7 808.7 836.1 862.6 423.6
Sponsor Cash Flows (Assuming No MLP) 7/31/14 9/30/14 12/31/14 3/31/15 6/30/15 9/30/15 12/31/15 3/31/16 6/30/16 9/30/16 12/31/16 3/31/17 6/30/17
Adjusted EBITDA — $45.4 $50.1 $50.9 $53.1 $57.1 $47.6 $49.9 $47.4 $48.6 $53.1 $48.6 $49.3
Public Partnership Expenses — 0.8 0.8 0.8 0.8 0.8 0.8 1.2 1.4 1.7 1.7 1.7 1.7
Cash Interest Expense — (5.9) (4.7) (4.1) (3.7) (4.6) (4.9) (7.7) (7.3) (7.3) (7.5) (7.4) (7.4)
Maintenance Capital Expenditures — (5.5) (4.9) (7.8) (5.6) (3.4) (4.7) (3.8) (5.5) (4.7) (10.1) (6.2) (8.3)
Other — — — — — — — — (0.4) (0.2) (0.6) — —
B Cash Flow to Sponsors $— $34.8 $41.3 $39.8 $44.6 $49.9 $38.8 $39.6 $35.6 $38.1 $36.6 $36.7 $35.3
Cumulative Cash Flow to Sponsor — 34.8 76.0 115.8 160.3 210.2 248.9 288.5 324.1 362.2 398.8 435.5 470.9
A - B Difference in Cash Flow to Sponsor $397.3 ($17.2) ($13.2) ($11.5) ($16.1) $53.8 ($10.4) ($11.0) ($8.9) $83.9 ($9.2) ($10.3) ($474.3)
Cumulative Difference in Cash Flow to Sponsor 397.3 380.1 366.8 355.3 339.2 393.0 382.6 371.6 362.6 446.5 437.3 427.1 (47.3)
Source: VTTI management, Public filings
1. Analysis excludes any impact from intercompany loan from Sponsor to MLP
Evercore 2 vtti energy partners
Preliminary Draft – Confidential
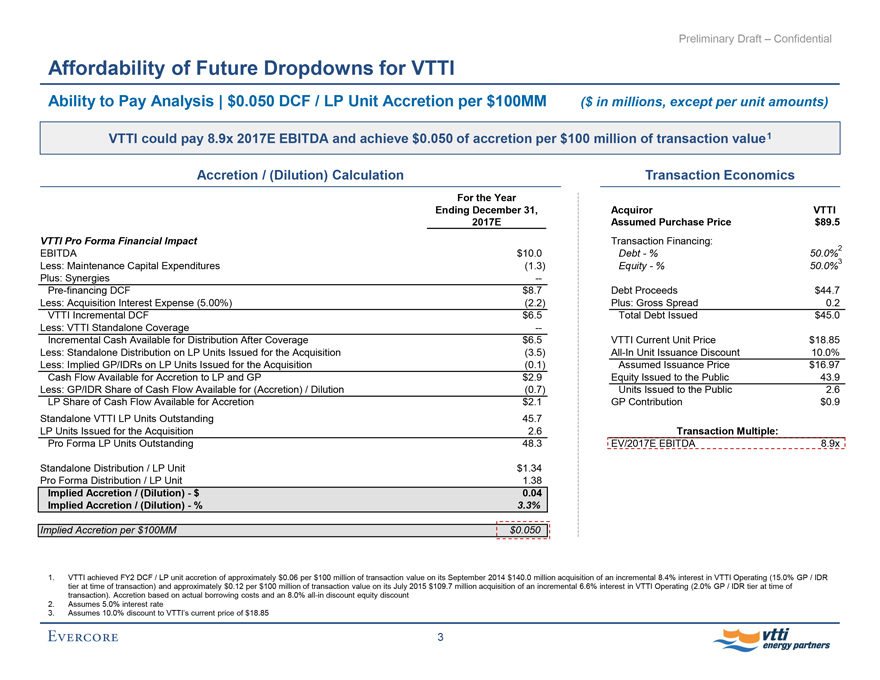
Affordability of Future Dropdowns for VTTI
Ability to Pay Analysis | $0.050 DCF / LP Unit Accretion per $100MM ($ in millions, except per unit amounts)
VTTI could pay 8.9x 2017E EBITDA and achieve $0.050 of accretion per $100 million of transaction value1
Accretion / (Dilution) Calculation
For the Year Ending December 31, 2017E
VTTI Pro Forma Financial Impact
EBITDA $10.0
Less: Maintenance Capital Expenditures (1.3)
Plus: Synergies —
Pre-financing DCF $8.7
Less: Acquisition Interest Expense (5.00%) (2.2)
VTTI Incremental DCF $6.5
Less: VTTI Standalone Coverage —
Incremental Cash Available for Distribution After Coverage $6.5
Less: Standalone Distribution on LP Units Issued for the Acquisition (3.5)
Less: Implied GP/IDRs on LP Units Issued for the Acquisition (0.1)
Cash Flow Available for Accretion to LP and GP $2.9
Less: GP/IDR Share of Cash Flow Available for (Accretion) / Dilution (0.7)
LP Share of Cash Flow Available for Accretion $2.1
Standalone VTTI LP Units Outstanding 45.7
LP Units Issued for the Acquisition 2.6
Pro Forma LP Units Outstanding 48.3
Standalone Distribution / LP Unit $1.34
Pro Forma Distribution / LP Unit 1.38
Implied Accretion / (Dilution) - $ 0.04
Implied Accretion / (Dilution) - % 3.3%
Implied Accretion per $100MM $0.050
Transaction Economics
Acquiror VTTI Assumed Purchase Price $89.5 Transaction Financing: Debt - % 50.0%2 Equity - % 50.0%3
Debt Proceeds $44.7 Plus: Gross Spread 0.2 Total Debt Issued $45.0
VTTI Current Unit Price $18.85All-In Unit Issuance Discount 10.0% Assumed Issuance Price $16.97
Equity Issued to the Public 43.9 Units Issued to the Public 2.6 GP Contribution $0.9
Transaction Multiple: EV/2017E EBITDA 8.9x
1. VTTI achieved FY2 DCF / LP unit accretion of approximately $0.06 per $100 million of transaction value on its September 2014 $140.0 million acquisition of an incremental 8.4% interest in VTTI Operating (15.0% GP / IDR tier at time of transaction) and approximately $0.12 per $100 million of transaction value on its July 2015 $109.7 million acquisition of an incremental 6.6% interest in VTTI Operating (2.0% GP / IDR tier at time of transaction). Accretion based on actual borrowing costs and an 8.0% all-in discount equity discount
2. Assumes 5.0% interest rate
3. Assumes 10.0% discount to VTTI’s current price of $18.85
Evercore 3 vtti energy partners
Preliminary Draft – Confidential
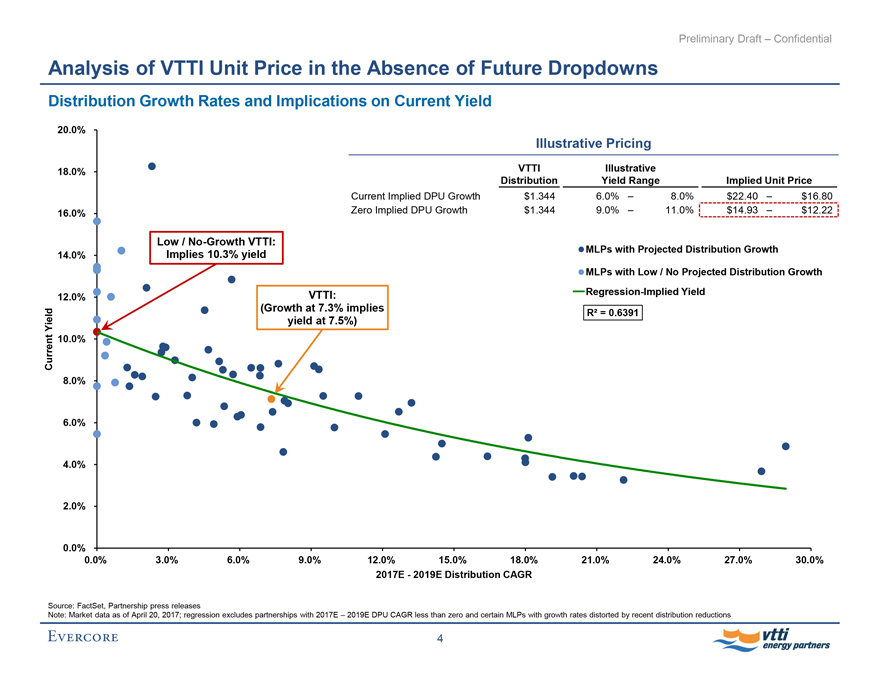
Analysis of VTTI Unit Price in the Absence of Future Dropdowns
Distribution Growth Rates and Implications on Current Yield
Illustrative Pricing
VTTI Illustrative Distribution Yield Range Implied Unit Price
Current Implied DPU Growth $1.344 6.0% – 8.0% $22.40 – $16.80
Zero Implied DPU Growth $1.344 9.0% – 11.0% $14.93 – $12.22
MLPs with Projected Distribution Growth
MLPs with Low / No Projected Distribution Growth Regression-Implied Yield R2 = 0.6391
Low /No-Growth VTTI: Implies 10.3% yield
VTTI:
(Growth at 7.3% implies yield at 7.5%)
Current Yield
20.0%
18.0%
16.0%
14.0%
12.0%
10.0%
8.0%
6.0%
4.0%
2.0%
0.0%
0.0% 3.0% 6.0% 9.0% 12.0% 15.0% 18.0% 21.0% 24.0% 27.0% 30.0% 2017E - 2019E Distribution CAGR
Source: FactSet, Partnership press releases
Note: Market data as of April 20, 2017; regression excludes partnerships with 2017E – 2019E DPU CAGR less than zero and certain MLPs with growth rates distorted by recent distribution reductions
Evercore 4 vtti energy partners
Preliminary Draft – Confidential
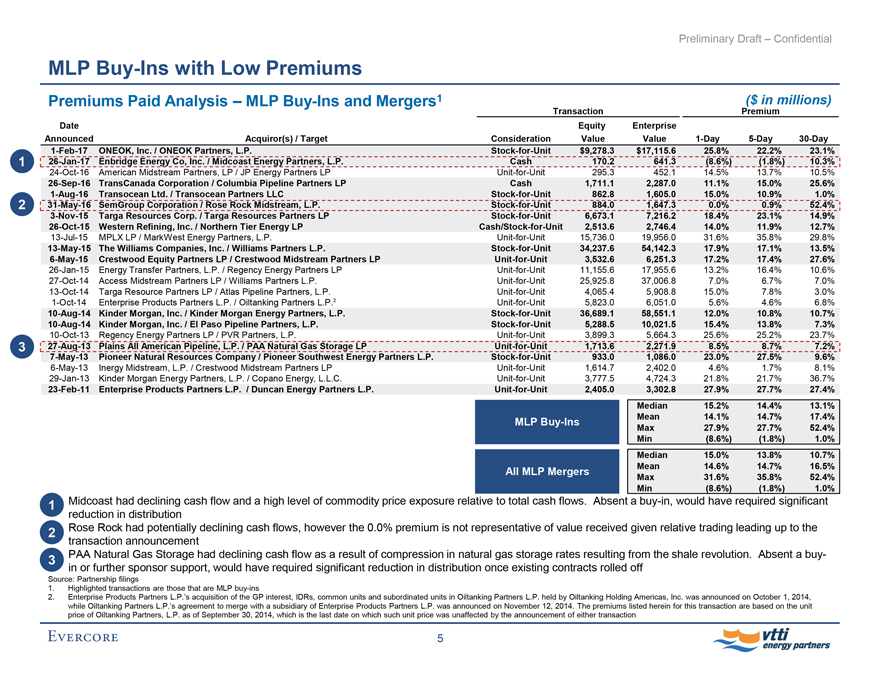
MLPBuy-Ins with Low Premiums
Premiums Paid Analysis – MLPBuy-Ins and Mergers1
($ in millions) Transaction Premium
Date Announced Acquiror(s) / Target Consideration Equity Value Enterprise Value1-Day5-Day30-Day
1-Feb-17 ONEOK, Inc. / ONEOK Partners, L.P.Stock-for-Unit $9,278.3 $17,115.6 25.8% 22.2% 23.1%
126-Jan-17 Enbridge Energy Co, Inc. / Midcoast Energy Partners, L.P. Cash 170.2 641.3 (8.6%) (1.8%) 10.3%
24-Oct-16 American Midstream Partners, LP / JP Energy Partners LPUnit-for-Unit 295.3 452.1 14.5% 13.7% 10.5%
26-Sep-16 TransCanada Corporation / Columbia Pipeline Partners LP Cash 1,711.1 2,287.0 11.1% 15.0% 25.6%
1-Aug-16 Transocean Ltd. / Transocean Partners LLCStock-for-Unit 862.8 1,605.0 15.0% 10.9% 1.0%
231-May-16 SemGroup Corporation / Rose Rock Midstream, L.P.Stock-for-Unit 884.0 1,647.3 0.0% 0.9% 52.4%
3-Nov-15 Targa Resources Corp. / Targa Resources Partners LPStock-for-Unit 6,673.1 7,216.2 18.4% 23.1% 14.9%
26-Oct-15 Western Refining, Inc. / Northern Tier Energy LPCash/Stock-for-Unit 2,513.6 2,746.4 14.0% 11.9% 12.7%
13-Jul-15 MPLX LP / MarkWest Energy Partners, L.P.Unit-for-Unit 15,736.0 19,956.0 31.6% 35.8% 29.8%
13-May-15 The Williams Companies, Inc. / Williams Partners L.P.Stock-for-Unit 34,237.6 54,142.3 17.9% 17.1% 13.5%
6-May-15 Crestwood Equity Partners LP / Crestwood Midstream Partners LPUnit-for-Unit 3,532.6 6,251.3 17.2% 17.4% 27.6%
26-Jan-15 Energy Transfer Partners, L.P. / Regency Energy Partners LPUnit-for-Unit 11,155.6 17,955.6 13.2% 16.4% 10.6%
27-Oct-14 Access Midstream Partners LP / Williams Partners L.P.Unit-for-Unit 25,925.8 37,006.8 7.0% 6.7% 7.0%
13-Oct-14 Targa Resource Partners LP / Atlas Pipeline Partners, L.P.Unit-for-Unit 4,065.4 5,908.8 15.0% 7.8% 3.0%
1-Oct-14 Enterprise Products Partners L.P. / Oiltanking Partners L.P.2Unit-for-Unit 5,823.0 6,051.0 5.6% 4.6% 6.8%
10-Aug-14 Kinder Morgan, Inc. / Kinder Morgan Energy Partners, L.P.Stock-for-Unit 36,689.1 58,551.1 12.0% 10.8% 10.7%
10-Aug-14 Kinder Morgan, Inc. / El Paso Pipeline Partners, L.P.Stock-for-Unit 5,288.5 10,021.5 15.4% 13.8% 7.3%
10-Oct-13 Regency Energy Partners LP / PVR Partners, L.P.Unit-for-Unit 3,899.3 5,664.3 25.6% 25.2% 23.7%
327-Aug-13 Plains All American Pipeline, L.P. / PAA Natural Gas Storage LPUnit-for-Unit 1,713.6 2,271.9 8.5% 8.7% 7.2%
7-May-13 Pioneer Natural Resources Company / Pioneer Southwest Energy Partners L.P.Stock-for-Unit 933.0 1,086.0 23.0% 27.5% 9.6%
6-May-13 Inergy Midstream, L.P. / Crestwood Midstream Partners LPUnit-for-Unit 1,614.7 2,402.0 4.6% 1.7% 8.1%
29-Jan-13 Kinder Morgan Energy Partners, L.P. / Copano Energy, L.L.C.Unit-for-Unit 3,777.5 4,724.3 21.8% 21.7% 36.7%
23-Feb-11 Enterprise Products Partners L.P. / Duncan Energy Partners L.P.Unit-for-Unit 2,405.0 3,302.8 27.9% 27.7% 27.4%
MLPBuy-Ins Median 15.2% 14.4% 13.1% Mean 14.1% 14.7%17.4% Max 27.9% 27.7% 52.4% Min (8.6%) (1.8%) 1.0%
All MLP Mergers Median 15.0% 13.8% 10.7% Mean 14.6% 14.7% 16.5% Max 31.6% 35.8% 52.4% Min (8.6%) (1.8%) 1.0%
1 Midcoast had declining cash flow and a high level of commodity price exposure relative to total cash flows. Absent abuy-in, would have required significant reduction in distribution
2 Rose Rock had potentially declining cash flows, however the 0.0% premium is not representative of value received given relative trading leading up to the transaction announcement
3 PAA Natural Gas Storage had declining cash flow as a result of compression in natural gas storage rates resulting from the shale revolution. Absent a buy-in or further sponsor support, would have required significant reduction in distribution once existing contracts rolled off
Source: Partnership filings
1. Highlighted transactions are those that are MLPbuy-ins
2. Enterprise Products Partners L.P.’s acquisition of the GP interest, IDRs, common units and subordinated units in Oiltanking Partners L.P. held by Oiltanking Holding Americas, Inc. was announced on October 1, 2014, while Oiltanking Partners L.P.’s agreement to merge with a subsidiary of Enterprise Products Partners L.P. was announced on November 12, 2014. The premiums listed herein for this transaction are based on the unit price of Oiltanking Partners, L.P. as of September 30, 2014, which is the last date on which such unit price was unaffected by the announcement of either transaction
Evercore 5 vtti energy partners