UNITED STATES
SECURITIES AND EXCHANGE COMMISSION
Washington, D.C. 20549
FORM N-CSR
CERTIFIED SHAREHOLDER REPORT OF REGISTERED
MANAGEMENT INVESTMENT COMPANIES
Investment Company Act file number: 811-23002
LATTICE STRATEGIES TRUST
(Exact name of registrant as specified in charter)
101 Montgomery Street, 27th Floor, San Francisco, California 94104
(Address of Principal Executive Offices) (Zip Code)
Corporation Service Company
251 Little Falls Drive
Wilmington, DE 19808
(Name and Address of Agent for Service)
Copy to:
John V. O’Hanlon, Esq.
Dechert LLP
One International Place, 40th Floor
100 Oliver Street
Boston, MA 02110-2605
Registrant’s telephone number, including area code: (415) 508-3400
Date of fiscal year end: September 30
Date of reporting period: March 31, 2018
Form N-CSR is to be used by management investment companies to file reports with the Commission not later than 10 days after the transmission to stockholders of any report that is required to be transmitted to stockholders under Rule 30e-1 under the Investment Company Act of 1940 (17 CFR 270.30e-1). The Commission may use the information provided on Form N-CSR in its regulatory, disclosure review, inspection, and policymaking roles.
A registrant is required to disclose the information specified by Form N-CSR, and the Commission will make this information public. A registrant is not required to respond to the collection of information contained in Form N-CSR unless the Form displays a currently valid Office of Management and Budget (“OMB”) control number. Please direct comments concerning the accuracy of the information collection burden estimate and any suggestions for reducing the burden to Secretary, Securities and Exchange Commission, 100 F Street, NE, Washington, DC 20549. The OMB has reviewed this collection of information under the clearance requirements of 44 U.S.C. § 3507.
| Item 1. | Reports to Stockholders. |
A MESSAGE FROM THE PRESIDENT
Dear Fellow Shareholders:
Thank you for investing in Hartford Multifactor Exchange-Traded Funds (“ETFs”). The following is the Funds’ Semi-Annual Report, covering the period from October 1, 2017 through March 31, 2018.
Market Review
While U.S. stocks, as measured by the S&P 500 Index (the “Index”),1 saw a 21.8% return as of 2017 year end, 2018 has so far seen increased volatility. Year to date as of March 31, 2018, U.S. equities (as measured by the Index) have experienced negative returns of -0.8%.
The Index has experienced 23 days with swings of 1% or more this year, compared to eight days for all of 2017. Rising interest rates, inflation anxiety, and concerns surrounding U.S. tariffs and trade policies have contributed to the return of volatility.
In the six-month period that ended March 31, 2018, the U.S. Federal Reserve (Fed) continued the cycle of interest-rate increases that it began in December 2015 by raising rates twice, each time by 0.25%. As of the end of March, short-term rates range from 1.5% to 1.75%. At the time of this writing, expectations were for a continued gradual increase throughout 2018, which should help markets anticipate and digest such changes. Central banks overseas are also expected to begin removing accommodative policies by raising interest rates, which may impact global markets.
Going forward, politics both at home and abroad are likely to continue playing a key role in driving market movements. In December, the first significant overhaul of the U.S. tax code in more than 30 years was signed into law. Geopolitical tensions continue to persist around U.S. engagement with Syria and North Korea, heightening market uncertainty. In Europe, uncertainty remains with respect to Britain’s “Brexit” undertaking to leave the European Union, which could influence markets or cause an uptick in volatility.
We encourage you to maintain a strong relationship with your financial advisor, who can help guide you through shifting markets confidently. He or she can help you proactively build a portfolio that takes market uncertainty into account, along with your unique investment goals and risk tolerances. Your advisor can help you find a fit within our family of funds as you work toward those goals.
Thank you again for investing in Hartford Multifactor ETFs. For the most up-to-date information on our ETF suite, please take advantage of all the resources available at hartfordfunds.com.

James Davey
President
Hartford Funds
| 1 | S&P 500 Index is a market capitalization-weighted price index composed of 500 widely held common stocks. The index is unmanaged and not available for direct investment. Past performance is not indicative of future results. |
Hartford Multifactor ETFs
Table of Contents
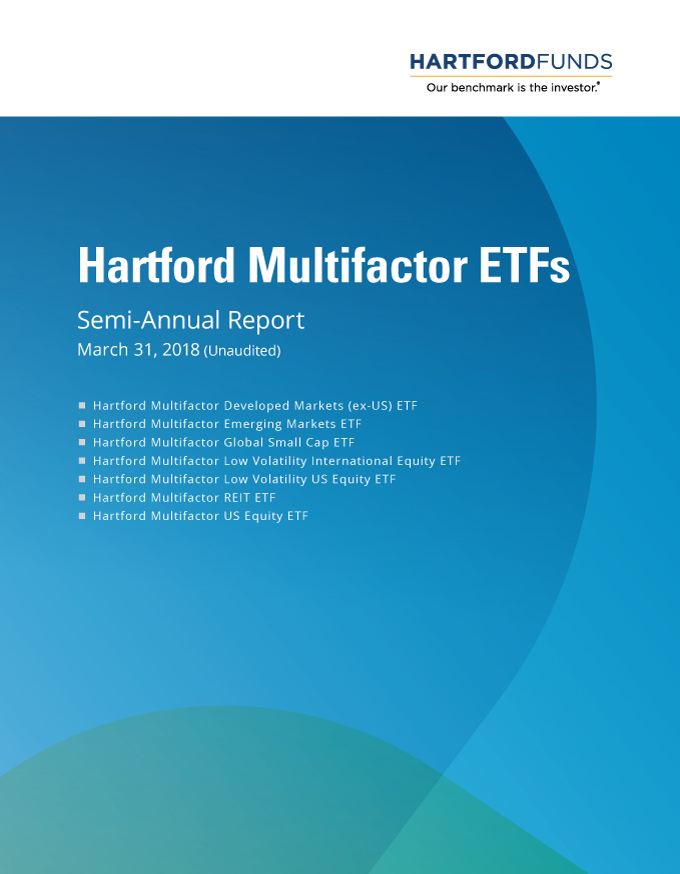
Hartford Multifactor Developed Markets (ex-US) ETF inception 02/25/2015
| | |
| (sub-advised by BNY Mellon Asset Management North America Corporation) | | Investment objective – The Fund seeks to provide investment results that, before fees and expenses, correspond to the total return performance of an index that tracks the performance of companies located in major developed markets of Europe, Canada and the Pacific Region. |
The chart above represents the hypothetical growth of a $10,000 investment in the Fund. The difference in returns between the Fund and the Index was primarily the result of the Fund’s operating expenses, including transaction costs, that are not reflected in the Index’s results.
Average Annual Total Returns (as of 3/31/18)
| | | | | | | | | | | | |
| | | 6 Months1 | | | 1 Year | | | Since
Inception2 | |
Multifactor Developed Markets (ex-US) ETF (NAV Return) | | | 3.65% | | | | 16.86% | | | | 7.62% | |
Multifactor Developed Markets (ex-US) ETF (Market Price Return) | | | 4.09% | | | | 17.46% | | | | 7.96% | |
Hartford Risk-Optimized Multifactor Developed Markets (ex-US) Index | | | 3.81% | | | | 17.07% | | | | 7.89% | |
Information regarding how often shares of the Fund traded on NYSE Arca at a price above (i.e., at a premium) or below (i.e., at a discount) the NAV of the Fund can be found at hartfordfunds.com.
PERFORMANCE DATA QUOTED REPRESENTS PAST PERFORMANCE AND DOES NOT GUARANTEE FUTURE RESULTS. The investment return and principal value of the investment will fluctuate so that investors’ shares, when redeemed, may be worth more or less than their original cost. Current performance may be lower or higher than the performance data quoted. To obtain performance data current to the most recent month-end, please visit our website www.hartfordfunds.com.
Total returns are calculated using the daily 4:00 pm net asset value (NAV). Market price returns reflect the midpoint of the bid/ask spread as of the close of trading on the exchange where Fund shares are listed. Market price returns do not represent the returns you would receive if you traded shares at other times.
The Fund’s Shares are bought and sold at market price (not NAV) and are not individually redeemed from the Fund. Owners of the Shares may acquire those Shares
from the Fund and tender those shares for redemption to the Fund in Creation Unit aggregations only, typically consisting of 50,000 Shares.
Hartford Risk-Optimized Multifactor Developed Markets (ex-US) Index is calculated by Solactive AG and represents the performance of companies located in major developed markets of Europe, Canada and the Pacific Region.
The index is unmanaged and its results include reinvested dividends and/or distributions, but do not reflect the effect of sales charges, commissions, expenses or taxes.
You cannot invest directly in an index.
The chart and table do not reflect the deductions of taxes that a shareholder would pay on Fund distributions or the sale of Fund shares.
The total annual fund operating expense ratio as shown in the Fund’s most recent prospectus, as supplemented, was 0.29%. Actual expenses may be higher or lower. Please see the accompanying Financial Highlights for expense ratios for the period ended March 31, 2018.
Important Risks
Investing involves risk, including the possible loss of principal. There is no guarantee a fund will achieve its stated objective. Security prices fluctuate in value depending on general market and economic conditions and the prospects of individual companies. •Foreign investments may be more volatile and less liquid than U.S. investments and are subject to the risk of currency fluctuations and adverse political and economic developments. •Diversification does not eliminate the risk of experiencing investment losses. •Due to its investment strategy, the fund may make higher capital gain distributions than other ETFs.
|
| Hartford Multifactor Developed Markets (ex-US) ETF |
Fund Summary
March 31, 2018 (Unaudited)
Composition by Country(1)
as of March 31, 2018
| | | | |
| Country | | Percentage of
Net Assets | |
Australia | | | 6.3 | % |
Austria | | | 0.4 | |
Belgium | | | 1.0 | |
Bermuda | | | 0.5 | |
Canada | | | 10.8 | |
China | | | 0.2 | |
Denmark | | | 2.6 | |
Finland | | | 0.6 | |
France | | | 6.3 | |
Germany | | | 7.0 | |
Hong Kong | | | 5.2 | |
Hungary | | | 0.1 | |
Ireland | | | 1.2 | |
Isle of Man | | | 0.2 | |
Israel | | | 2.3 | |
Italy | | | 1.5 | |
Japan | | | 20.6 | |
Jersey | | | 0.0 | * |
Luxembourg | | | 0.9 | |
Malta | | | 0.2 | |
Netherlands | | | 3.5 | |
New Zealand | | | 2.0 | |
Norway | | | 0.2 | |
Portugal | | | 0.1 | |
Russia | | | 0.1 | |
Singapore | | | 3.1 | |
South Africa | | | 0.1 | |
Spain | | | 2.4 | |
Sweden | | | 1.9 | |
Switzerland | | | 7.4 | |
United Kingdom | | | 10.1 | |
United States | | | 0.8 | |
Short-Term Investments | | | 4.9 | |
Other Assets & Liabilities | | | (4.5 | ) |
| | | | |
Total | | | 100.0 | % |
| | | | |
| * | Percentage rounds to zero. |
| (1) | For Fund compliance purposes, the Fund may not use the same classification system shown in this report as these classifications are used for financial reporting purposes. |
Composition by Sector(1)
as of March 31, 2018
| | | | |
| Sector | | Percentage of
Net Assets | |
Equity Securities | | | | |
Consumer Discretionary | | | 10.3 | % |
Consumer Staples | | | 9.1 | |
Energy | | | 4.2 | |
Financials | | | 20.4 | |
Health Care | | | 11.4 | |
Industrials | | | 16.1 | |
Information Technology | | | 6.3 | |
Materials | | | 6.4 | |
Real Estate | | | 5.4 | |
Telecommunication Services | | | 4.8 | |
Utilities | | | 5.2 | |
| | | | |
Total | | | 99.6 | % |
| | | | |
Short-Term Investments | | | 4.9 | |
Other Assets & Liabilities | | | (4.5 | ) |
| | | | |
Total | | | 100.0 | % |
| | | | |
| (1) | For Fund compliance purposes, the Fund may not use the same classification system shown in this report as these classifications are used for financial reporting purposes. |
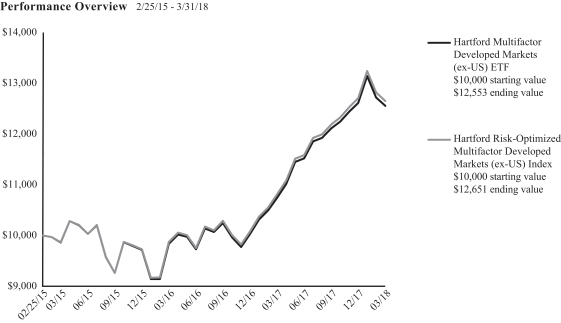
Hartford Multifactor Emerging Markets ETF inception 02/25/2015
| | |
| (sub-advised by BNY Mellon Asset Management North America Corporation) | | Investment objective – The Fund seeks to provide investment results that, before fees and expenses, correspond to the total return performance of an index based upon the emerging markets of the world. |
The chart above represents the hypothetical growth of a $10,000 investment in the Fund. The difference in returns between the Fund and the Index was primarily the result of the Fund’s operating expenses, including transaction costs, that are not reflected in the Index’s results.
Average Annual Total Returns (as of 3/31/18)
| | | | | | | | | | | | |
| | | 6 Months1 | | | 1 Year | | | Since
Inception2 | |
Multifactor Emerging Markets ETF (NAV Return) | | | 6.79% | | | | 16.82% | | | | 2.86% | |
Multifactor Emerging Markets ETF (Market Price Return) | | | 7.81% | | | | 17.95% | | | | 3.45% | |
Hartford Risk-Optimized Multifactor Emerging Markets Index | | | 6.92% | | | | 17.30% | | | | 3.54% | |
Information regarding how often shares of the Fund traded on NYSE Arca at a price above (i.e., at a premium) or below (i.e., at a discount) the NAV of the Fund can be found at hartfordfunds.com.
PERFORMANCE DATA QUOTED REPRESENTS PAST PERFORMANCE AND DOES NOT GUARANTEE FUTURE RESULTS. The investment return and principal value of the investment will fluctuate so that investors’ shares, when redeemed, may be worth more or less than their original cost. Current performance may be lower or higher than the performance data quoted. To obtain performance data current to the most recent month-end, please visit our website www.hartfordfunds.com.
Total returns are calculated using the daily 4:00 pm net asset value (NAV). Market price returns reflect the midpoint of the bid/ask spread as of the close of trading on the exchange where Fund shares are listed. Market price returns do not represent the returns you would receive if you traded shares at other times.
The Fund’s Shares are bought and sold at market price (not NAV) and are not individually redeemed from the Fund. Owners of the Shares may acquire those Shares
from the Fund and tender those shares for redemption to the Fund in Creation Unit aggregations only, typically consisting of 100,000 Shares.
Hartford Risk-Optimized Multifactor Emerging Markets Index is calculated by Solactive AG and is designed to balance risks and opportunities within equity markets of emerging economies while emphasizing constituents exhibiting a favorable combination of factor characteristics.
The index is unmanaged, and its results include reinvested dividends and/or distributions, but do not reflect the effect of sales charges, commissions, expenses or taxes.
You cannot invest directly in an index.
The chart and table do not reflect the deductions of taxes that a shareholder would pay on Fund distributions or the sale of Fund shares.
The total annual fund operating expense ratio as shown in the Fund’s most recent prospectus, as supplemented, was 0.49%. Actual expenses may be higher or lower. Please see the accompanying Financial Highlights for expense ratios for the period ended March 31, 2018.
Important Risks
Investing involves risk, including the possible loss of principal. There is no guarantee a fund will achieve its stated objective. Security prices fluctuate in value depending on general market and economic conditions and the prospects of individual companies. •Foreign investments may be more volatile and less liquid than U.S. investments and are subject to the risk of currency fluctuations and adverse political and economic developments. These risks may be greater for investments in emerging markets. •Diversification does not eliminate the risk of experiencing investment losses. •Due to its investment strategy, the fund may make higher capital gain distributions than other ETFs.
|
| Hartford Multifactor Emerging Markets ETF |
Fund Summary
March 31, 2018 (Unaudited)
Composition by Country(1)
as of March 31, 2018
| | | | |
| Country | | Percentage of
Net Assets | |
Brazil | | | 4.5 | % |
Chile | | | 4.6 | |
China | | | 8.0 | |
Colombia | | | 3.0 | |
Hong Kong | | | 0.8 | |
India | | | 6.2 | |
Indonesia | | | 6.7 | |
Malaysia | | | 7.4 | |
Mexico | | | 3.9 | |
Philippines | | | 5.4 | |
Poland | | | 5.6 | |
Russia | | | 3.0 | |
South Africa | | | 5.9 | |
South Korea | | | 9.9 | |
Taiwan | | | 10.1 | |
Thailand | | | 8.6 | |
Turkey | | | 5.3 | |
United States | | | 0.5 | |
Short-Term Investments | | | 1.8 | |
Other Assets & Liabilities | | | (1.2 | ) |
| | | | |
Total | | | 100.0 | % |
| | | | |
| (1) | For Fund compliance purposes, the Fund may not use the same classification system shown in this report as these classifications are used for financial reporting purposes. |
Composition by Sector(1)
as of March 31, 2018
| | | | |
| Sector | | Percentage of
Net Assets | |
Equity Securities | | | | |
Consumer Discretionary | | | 6.7 | % |
Consumer Staples | | | 9.8 | |
Energy | | | 8.9 | |
Financials | | | 32.5 | |
Health Care | | | 3.0 | |
Industrials | | | 5.5 | |
Information Technology | | | 11.2 | |
Materials | | | 7.1 | |
Real Estate | | | 3.4 | |
Telecommunication Services | | | 6.6 | |
Utilities | | | 4.7 | |
| | | | |
Total | | | 99.4 | % |
| | | | |
Short-Term Investments | | | 1.8 | |
Other Assets & Liabilities | | | (1.2 | ) |
| | | | |
Total | | | 100.0 | % |
| | | | |
| (1) | For Fund compliance purposes, the Fund may not use the same classification system shown in this report as these classifications are used for financial reporting purposes. |
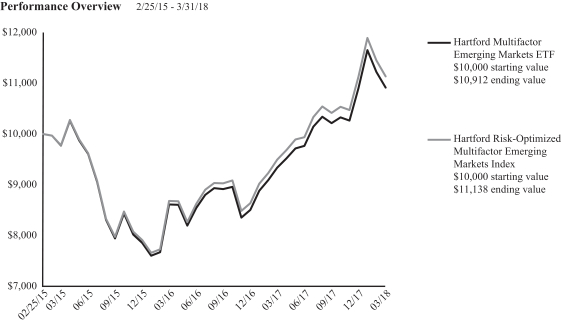
Hartford Multifactor Global Small Cap ETF inception 03/23/2015
| | |
| (sub-advised by BNY Mellon Asset Management North America Corporation) | | Investment objective – The Fund seeks to provide investment results that, before fees and expenses, correspond to the total return performance of an index that tracks the performance of small capitalization exchange traded equity securities. |
The chart above represents the hypothetical growth of a $10,000 investment in the Fund. The difference in returns between the Fund and the Index was primarily the result of the Fund’s operating expenses, including transaction costs, that are not reflected in the Index’s results.
Average Annual Total Returns (as of 3/31/18)
| | | | | | | | | | | | |
| | | 6 Months1 | | | 1 Year | | | Since
Inception2 | |
Multifactor Global Small Cap ETF (NAV Return) | | | 5.55% | | | | 16.92% | | | | 10.39% | |
Multifactor Global Small Cap ETF (Market Price Return) | | | 5.86% | | | | 17.31% | | | | 10.63% | |
Hartford Risk-Optimized Multifactor Global Small Cap Index | | | 5.81% | | | | 17.61% | | | | 11.03% | |
Information regarding how often shares of the Fund traded on NYSE Arca at a price above (i.e., at a premium) or below (i.e., at a discount) the NAV of the Fund can be found at hartfordfunds.com.
PERFORMANCE DATA QUOTED REPRESENTS PAST PERFORMANCE AND DOES NOT GUARANTEE FUTURE RESULTS. The investment return and principal value of the investment will fluctuate so that investors’ shares, when redeemed, may be worth more or less than their original cost. Current performance may be lower or higher than the performance data quoted. To obtain performance data current to the most recent month-end, please visit our website www.hartfordfunds.com.
Total returns are calculated using the daily 4:00 pm net asset value (NAV). Market price returns reflect the midpoint of the bid/ask spread as of the close of trading on the exchange where Fund shares are listed. Market price returns do not represent the returns you would receive if you traded shares at other times.
The Fund’s Shares are bought and sold at market price (not NAV) and are not individually redeemed from the Fund. Owners of the Shares may acquire those Shares
from the Fund and tender those shares for redemption to the Fund in Creation Unit aggregations only, typically consisting of 100,000 Shares.
Hartford Risk-Optimized Multifactor Global Small Cap Index is calculated by Solactive AG and designed to address risks and opportunities within the global small cap universe by selecting equity securities of companies exhibiting a favorable combination of factor characteristics, including valuation, momentum, and quality.
The index is unmanaged, and its results include reinvested dividends and/or distributions, but do not reflect the effect of sales charges, commissions, expenses or taxes.
You cannot invest directly in an index.
The chart and table do not reflect the deductions of taxes that a shareholder would pay on Fund distributions or the sale of Fund shares.
The total annual fund operating expense ratio as shown in the Fund’s most recent prospectus, as supplemented, was 0.39%. Actual expenses may be higher or lower. Please see the accompanying Financial Highlights for expense ratios for the period ended March 31, 2018.
Important Risks
Investing involves risk, including the possible loss of principal. There is no guarantee a fund will achieve its stated objective. Security prices fluctuate in value depending on general market and economic conditions and the prospects of individual companies. •Foreign investments may be more volatile and less liquid than U.S. investments and are subject to the risk of currency fluctuations and adverse political and economic developments. These risks may be greater for investments in emerging markets. •Small cap securities can have greater risk and volatility than large-cap securities. •Diversification does not eliminate the risk of experiencing investment losses. •Due to its investment strategy, the fund may make higher capital gain distributions than other ETFs.
|
| Hartford Multifactor Global Small Cap ETF |
Fund Summary
March 31, 2018 (Unaudited)
Composition by Country(1)
as of March 31, 2018
| | | | |
| Country | | Percentage of
Net Assets | |
Australia | | | 4.9 | % |
Belgium | | | 0.4 | |
Bermuda | | | 0.6 | |
Brazil | | | 1.7 | |
Canada | | | 5.0 | |
China | | | 9.8 | |
Denmark | | | 0.8 | |
Finland | | | 0.1 | |
France | | | 0.7 | |
Georgia | | | 0.5 | |
Germany | | | 1.1 | |
Hong Kong | | | 1.2 | |
Ireland | | | 0.1 | |
Israel | | | 1.7 | |
Italy | | | 1.3 | |
Japan | | | 13.4 | |
Luxembourg | | | 0.2 | |
Netherlands | | | 0.8 | |
New Zealand | | | 0.4 | |
Portugal | | | 0.0 | * |
Puerto Rico | | | 0.5 | |
Singapore | | | 0.8 | |
South Africa | | | 1.0 | |
South Korea | | | 6.2 | |
Spain | | | 0.4 | |
Sweden | | | 0.8 | |
Switzerland | | | 1.5 | |
Taiwan | | | 3.6 | |
Thailand | | | 0.3 | |
United Kingdom | | | 3.9 | |
United States | | | 35.9 | |
Short-Term Investments | | | 4.1 | |
Other Assets & Liabilities | | | (3.7 | ) |
| | | | |
Total | | | 100.0 | % |
| | | | |
| * | Percentage rounds to zero. |
| (1) | For Fund compliance purposes, the Fund may not use the same classification system shown in this report as these classifications are used for financial reporting purposes. |
Composition by Sector(1)
as of March 31, 2018
| | | | |
| Sector | | Percentage of
Net Assets | |
Equity Securities | | | | |
Consumer Discretionary | | | 14.8 | % |
Consumer Staples | | | 5.3 | |
Energy | | | 4.9 | |
Financials | | | 11.6 | |
Health Care | | | 11.8 | |
Industrials | | | 16.0 | |
Information Technology | | | 15.3 | |
Materials | | | 8.2 | |
Real Estate | | | 10.0 | |
Telecommunication Services | | | 1.0 | |
Utilities | | | 0.7 | |
| | | | |
Total | | | 99.6 | % |
| | | | |
Short-Term Investments | | | 4.1 | |
Other Assets & Liabilities | | | (3.7 | ) |
| | | | |
Total | | | 100.0 | % |
| | | | |
| (1) | For Fund compliance purposes, the Fund may not use the same classification system shown in this report as these classifications are used for financial reporting purposes. |
Hartford Multifactor Low Volatility International Equity ETF inception 05/10/2017
| | |
| (sub-advised by BNY Mellon Asset Management North America Corporation) | | Investment objective – The Fund seeks to provide investment results that, before fees and expenses, correspond to the total return performance of an index that tracks the performance of companies located in both developed and emerging markets. |
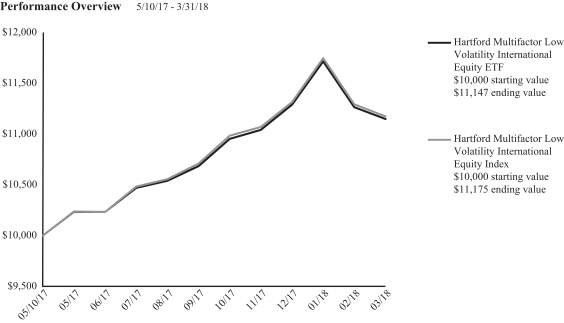
The chart above represents the hypothetical growth of a $10,000 investment in the Fund. The difference in returns between the Fund and the Index was primarily the result of the Fund’s operating expenses, including transaction costs, that are not reflected in the Index’s results.
Cumulative Total Returns (as of 3/31/18)
| | | | | | | | |
| | | 6 Month1 | | | Since
Inception2 | |
Multifactor Low Volatility International Equity ETF (NAV Return) | | | 4.33% | | | | 11.47% | |
Multifactor Low Volatility International Equity ETF (Market Price Return) | | | 4.25% | | | | 12.64% | |
Hartford Multifactor Low Volatility International Equity Index | | | 4.34% | | | | 11.75% | |
Information regarding how often shares of the Fund traded on Cboe BZX at a price above (i.e., at a premium) or below (i.e., at a discount) the NAV of the Fund can be found at hartfordfunds.com.
PERFORMANCE DATA QUOTED REPRESENTS PAST PERFORMANCE AND DOES NOT GUARANTEE FUTURE RESULTS. The investment return and principal value of the investment will fluctuate so that investors’ shares, when redeemed, may be worth more or less than their original cost. Current performance may be lower or higher than the performance data quoted. To obtain performance data current to the most recent month-end, please visit our website www.hartfordfunds.com.
Total returns are calculated using the daily 4:00 pm net asset value (NAV). Market price returns reflect the midpoint of the bid/ask spread as of the close of trading on the exchange where Fund shares are listed. Market price returns do not represent the returns you would receive if you traded shares at other times.
The Fund’s Shares are bought and sold at market price (not NAV) and are not individually redeemed from the Fund. Owners of the Shares may acquire those Shares
from the Fund and tender those shares for redemption to the Fund in Creation Unit aggregations only, typically consisting of 100,000 Shares.
Hartford Multifactor Low Volatility International Equity Index is calculated by Solactive AG and is designed to outperform a capitalization-weighted universe of developed and emerging markets located outside the U.S. with up to one quarter less volatility over a complete market cycle.
The index is unmanaged, and its results include reinvested dividends and/or distributions, but do not reflect the effect of sales charges, commissions, expenses or taxes.
You cannot invest directly in an index.
The chart and table do not reflect the deductions of taxes that a shareholder would pay on Fund distributions or the sale of Fund shares.
The total annual fund operating expense ratio as shown in the Fund’s most recent prospectus, as supplemented, was 0.29%. Actual expenses may be higher or lower. Please see the accompanying Financial Highlights for expense ratios for the period ended March 31, 2018.
Important Risks
The fund is new and has a limited operating history. Investing involves risk, including the possible loss of principal. There is no guarantee a fund will achieve its stated objective. Security prices fluctuate in value depending on general market and economic conditions and the prospects of individual companies. •The fund may experience more than a minimum level of volatility as there is no guarantee that the underlying index’s strategy of seeking to lower volatility will be successful. •Foreign investments may be more volatile and less liquid than U.S. investments and are subject to the risk of currency fluctuations and adverse political and economic developments. These risks may be greater for investments in emerging markets. •Diversification does not eliminate the risk of experiencing investment losses. •Due to its investment strategy, the fund may make higher capital gain distributions than other ETFs.
|
| Hartford Multifactor Low Volatility International Equity ETF |
Fund Summary
March 31, 2018 (Unaudited)
Composition by Country(1)
as of March 31, 2018
| | | | |
| Country | | Percentage of
Net Assets | |
Australia | | | 5.4 | % |
Austria | | | 0.1 | |
Belgium | | | 0.1 | |
Brazil | | | 1.1 | |
Canada | | | 8.7 | |
Chile | | | 0.2 | |
China | | | 5.3 | |
Denmark | | | 2.0 | |
Finland | | | 0.1 | |
France | | | 3.6 | |
Germany | | | 3.2 | |
Hong Kong | | | 5.8 | |
India | | | 2.0 | |
Indonesia | | | 2.5 | |
Ireland | | | 1.1 | |
Israel | | | 1.3 | |
Italy | | | 1.2 | |
Japan | | | 16.1 | |
Malaysia | | | 0.8 | |
Malta | | | 0.3 | |
Mexico | | | 0.2 | |
Netherlands | | | 0.7 | |
Norway | | | 1.0 | |
Philippines | | | 1.1 | |
Poland | | | 0.1 | |
Portugal | | | 0.1 | |
Russia | | | 0.1 | |
Singapore | | | 2.3 | |
South Africa | | | 0.4 | |
South Korea | | | 6.2 | |
Spain | | | 0.5 | |
Sweden | | | 2.0 | |
Switzerland | | | 3.9 | |
Taiwan | | | 3.4 | |
Thailand | | | 3.0 | |
Turkey | | | 2.3 | |
United Kingdom | | | 10.5 | |
United States | | | 0.8 | |
Short-Term Investments | | | 2.2 | |
Other Assets & Liabilities | | | (1.7 | ) |
| | | | |
Total | | | 100.0 | % |
| | | | |
| (1) | For Fund compliance purposes, the Fund may not use the same classification system shown in this report as these classifications are used for financial reporting purposes. |
Composition by Sector(1)
as of March 31, 2018
| | | | |
| Sector | | Percentage of
Net Assets | |
Equity Securities | | | | |
Consumer Discretionary | | | 14.9 | % |
Consumer Staples | �� | | 7.9 | |
Energy | | | 6.1 | |
Financials | | | 9.0 | |
Health Care | | | 9.4 | |
Industrials | | | 17.4 | |
Information Technology | | | 11.2 | |
Materials | | | 9.2 | |
Real Estate | | | 4.8 | |
Telecommunication Services | | | 5.8 | |
Utilities | | | 3.8 | |
| | | | |
Total | | | 99.5 | % |
| | | | |
Short-Term Investments | | | 2.2 | |
Other Assets & Liabilities | | | (1.7 | ) |
| | | | |
Total | | | 100.0 | % |
| | | | |
| (1) | For Fund compliance purposes, the Fund may not use the same classification system shown in this report as these classifications are used for financial reporting purposes. |
Hartford Multifactor Low Volatility US Equity ETF inception 05/10/2017
| | |
| (sub-advised by BNY Mellon Asset Management North America Corporation) | | Investment objective – The Fund seeks to provide investment results that, before fees and expenses, correspond to the total return performance of an index that tracks the performance of exchange traded U.S. equity securities. |
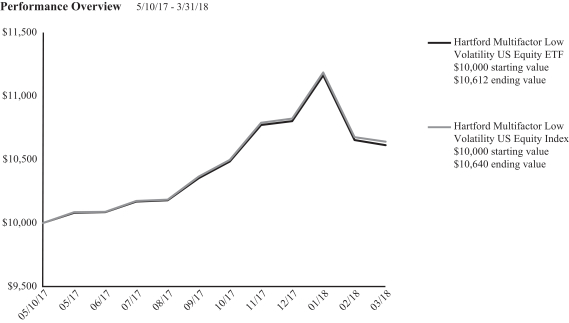
The chart above represents the hypothetical growth of a $10,000 investment in the Fund. The difference in returns between the Fund and the Index was primarily the result of the Fund’s operating expenses, including transaction costs, that are not reflected in the Index’s results.
Cumulative Total Returns (as of 3/31/18)
| | | | | | | | |
| | | 6 Month1 | | | Since
Inception2 | |
Multifactor Low Volatility US Equity ETF (NAV Return) | | | 2.50% | | | | 6.12% | |
Multifactor Low Volatility US Equity ETF (Market Price Return) | | | 3.36% | | | | 7.05% | |
Hartford Multifactor Low Volatility US Equity Index | | | 2.65% | | | | 6.40% | |
Information regarding how often shares of the Fund traded on Cboe BZX at a price above (i.e., at a premium) or below (i.e., at a discount) the NAV of the Fund can be found at hartfordfunds.com.
PERFORMANCE DATA QUOTED REPRESENTS PAST PERFORMANCE AND DOES NOT GUARANTEE FUTURE RESULTS. The investment return and principal value of the investment will fluctuate so that investors’ shares, when redeemed, may be worth more or less than their original cost. Current performance may be lower or higher than the performance data quoted. To obtain performance data current to the most recent month-end, please visit our website www.hartfordfunds.com.
Total returns are calculated using the daily 4:00 pm net asset value (NAV). Market price returns reflect the midpoint of the bid/ask spread as of the close of trading on the exchange where Fund shares are listed. Market price returns do not represent the returns you would receive if you traded shares at other times.
The Fund’s Shares are bought and sold at market price (not NAV) and are not individually redeemed from the Fund. Owners of the Shares may acquire those Shares from the Fund and tender those shares for redemption to the Fund in Creation Unit aggregations only, typically consisting of 50,000 Shares.
Hartford Multifactor Low Volatility US Equity Index is calculated by Solactive AG and is designed to outperform a U.S. capitalization-weighted universe with up to one quarter less volatility over a complete market cycle.
The index is unmanaged, and its results include reinvested dividends and/or distributions, but do not reflect the effect of sales charges, commissions, expenses or taxes.
You cannot invest directly in an index.
The chart and table do not reflect the deductions of taxes that a shareholder would pay on Fund distributions or the sale of Fund shares.
The total annual fund operating expense ratio as shown in the Fund’s most recent prospectus, as supplemented, was 0.22%. Actual expenses may be higher or lower. Expenses shown include acquired fund fees and expenses incurred by investing in the securities of other investment companies. Please see the accompanying Financial Highlights for expense ratios for the period ended March 31, 2018.
Important Risks
The fund is new and has a limited operating history. Investing involves risk, including the possible loss of principal. There is no guarantee a fund will achieve its stated objective. Security prices fluctuate in value depending on general market and economic conditions and the prospects of individual companies. •The fund may experience more than a minimum level of volatility as there is no guarantee that the underlying index’s strategy of seeking to lower volatility will be successful. •Diversification does not eliminate the risk of experiencing investment losses. •Due to its investment strategy, the fund may make higher capital gain distributions than other ETFs.
|
| Hartford Multifactor Low Volatility US Equity ETF |
Fund Summary
March 31, 2018 (Unaudited)
Composition by Sector(1)
as of March 31, 2018
| | | | |
| Sector | | Percentage of
Net Assets | |
Equity Securities | | | | |
Consumer Discretionary | | | 16.9 | % |
Consumer Staples | | | 7.0 | |
Energy | | | 5.4 | |
Financials | | | 5.7 | |
Health Care | | | 10.5 | |
Industrials | | | 18.5 | |
Information Technology | | | 11.6 | |
Materials | | | 9.2 | |
Real Estate | | | 4.7 | |
Telecommunication Services | | | 5.3 | |
Utilities | | | 5.0 | |
| | | | |
Total | | | 99.8 | % |
| | | | |
Short-Term Investments | | | 0.9 | |
Other Assets & Liabilities | | | (0.7 | ) |
| | | | |
Total | | | 100.0 | % |
| | | | |
| (1) | For Fund compliance purposes, the Fund may not use the same classification system shown in this report as these classifications are used for financial reporting purposes. |
Hartford Multifactor REIT ETF inception 10/03/2016
| | |
| (sub-advised by BNY Mellon Asset Management North America Corporation) | | Investment objective – The Fund seeks to provide investment results that, before fees and expenses, correspond to the total return performance of an index that tracks the performance of publicly traded real estate investment trusts. |
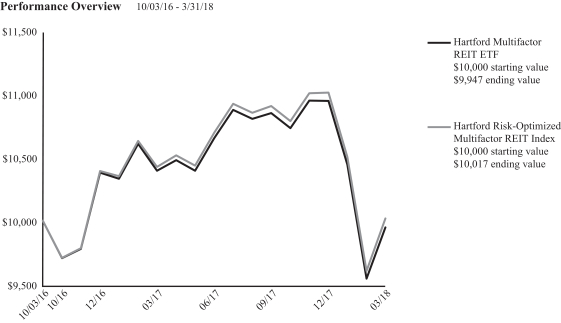
The chart above represents the hypothetical growth of a $10,000 investment in the Fund. The difference in returns between the Fund and the Index was primarily the result of the Fund’s operating expenses, including transaction costs, that are not reflected in the Index’s results.
Average Annual Total Returns (as of 3/31/18)
| | | | | | | | | | | | |
| | | 6 Month1 | | | 1 Year | | | Since
Inception2 | |
Multifactor REIT ETF (NAV Return) | | | -8.30% | | | | -4.29% | | | | -0.36% | |
Multifactor REIT ETF (Market Price Return) | | | -8.30% | | | | -4.30% | | | | -0.36% | |
Hartford Risk-Optimized Multifactor REIT Index | | | -8.11% | | | | -3.90% | | | | 0.11% | |
Information regarding how often shares of the Fund traded on NYSE Arca at a price above (i.e., at a premium) or below (i.e., at a discount) the NAV of the Fund can be found at hartfordfunds.com.
PERFORMANCE DATA QUOTED REPRESENTS PAST PERFORMANCE AND DOES NOT GUARANTEE FUTURE RESULTS. The investment return and principal value of the investment will fluctuate so that investors’ shares, when redeemed, may be worth more or less than their original cost. Current performance may be lower or higher than the performance data quoted. To obtain performance data current to the most recent month-end, please visit our website www.hartfordfunds.com.
Total returns are calculated using the daily 4:00 pm net asset value (NAV). Market price returns reflect the midpoint of the bid/ask spread as of the close of trading on the exchange where Fund shares are listed. Market price returns do not represent the returns you would receive if you traded shares at other times.
The Fund’s Shares are bought and sold at market price (not NAV) and are not individually redeemed from the Fund. Owners of the Shares may acquire those Shares from the Fund and tender those shares for redemption to the Fund in Creation Unit aggregations only, typically consisting of 100,000 Shares.
Hartford Risk-Optimized Multifactor REIT Index is calculated by Solactive AG and designed to capture the income and growth potential of investing within the U.S. REIT universe.
The index is unmanaged, and its results include reinvested dividends and/or distributions, but do not reflect the effect of sales charges, commissions, expenses or taxes.
You cannot invest directly in an index.
The chart and table do not reflect the deductions of taxes that a shareholder would pay on Fund distributions or the sale of Fund shares.
The total annual fund operating expense ratio as shown in the Fund’s most recent prospectus, as supplemented, was 0.45%. Actual expenses may be higher or lower. Please see the accompanying Financial Highlights for expense ratios for the period ended March 31, 2018.
Important Risks
Investing involves risk, including the possible loss of principal. There is no guarantee a fund will achieve its stated objective. Security prices fluctuate in value depending on general market and economic conditions and the prospects of individual companies. •A concentration in real estate securities, such as REITs, may subject a fund to risks associated with the direct ownership of real estate as well as the risks related to the way real estate companies are organized and operated. Real estate is sensitive to changes in interest rates and general and local economic conditions and developments. •The fund may invest in a smaller number of issuers, so it may be more exposed to risks and volatility than a more broadly diversified fund. •Due to its investment strategy, the fund may make higher capital gain distributions than other ETFs.
|
| Hartford Multifactor REIT ETF |
Fund Summary
March 31, 2018 (Unaudited)
Composition by Sector(1)
as of March 31, 2018
| | | | |
| Sector | | Percentage of
Net Assets | |
Equity Securities | | | | |
Real Estate | | | 99.5 | % |
Short-Term Investments | | | 4.3 | |
Other Assets & Liabilities | | | (3.8 | ) |
| | | | |
Total | | | 100.0 | % |
| | | | |
| (1) | For Fund compliance purposes, the Fund may not use the same classification system shown in this report as these classifications are used for financial reporting purposes. |
Hartford Multifactor US Equity ETF inception 02/25/2015
| | |
| (sub-advised by BNY Mellon Asset Management North America Corporation) | | Investment objective – The Fund seeks to provide investment results that, before fees and expenses, correspond to the total return performance of an index that tracks the performance of exchange traded U.S. equity securities. |
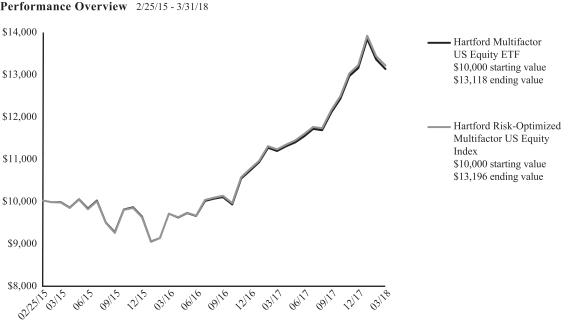
The chart above represents the hypothetical growth of a $10,000 investment in the Fund. The difference in returns between the Fund and the Index was primarily the result of the Fund’s operating expenses, including transaction costs, that are not reflected in the Index’s results.
Average Annual Total Returns (as of 3/31/18)
| | | | | | | | | | | | |
| | | 6 Months1 | | | 1 Year | | | Since
Inception2 | |
Multifactor US Equity ETF (NAV Return) | | | 8.50% | | | | 17.39% | | | | 9.16% | |
Multifactor US Equity ETF (Market Price Return) | | | 8.62% | | | | 17.43% | | | | 9.17% | |
Hartford Risk-Optimized Multifactor US Equity Index | | | 8.66% | | | | 17.67% | | | | 9.37% | |
Information regarding how often shares of the Fund traded on NYSE Arca at a price above (i.e., at a premium) or below (i.e., at a discount) the NAV of the Fund can be found at hartfordfunds.com.
PERFORMANCE DATA QUOTED REPRESENTS PAST PERFORMANCE AND DOES NOT GUARANTEE FUTURE RESULTS. The investment return and principal value of the investment will fluctuate so that investors’ shares, when redeemed, may be worth more or less than their original cost. Current performance may be lower or higher than the performance data quoted. To obtain performance data current to the most recent month-end, please visit our website www.hartfordfunds.com.
Total returns are calculated using the daily 4:00 pm net asset value (NAV). Market price returns reflect the midpoint of the bid/ask spread as of the close of trading on the exchange where Fund shares are listed. Market price returns do not represent the returns you would receive if you traded shares at other times.
The Fund’s Shares are bought and sold at market price (not NAV) and are not individually redeemed from the Fund. Owners of the Shares may acquire those Shares from the Fund and tender those shares for redemption to the Fund in Creation Unit aggregations only, typically consisting of 50,000 Shares.
Hartford Risk-Optimized Multifactor US Equity Index is calculated by Solactive AG and seeks to improve returns through a market cycle relative to traditional cap-weighted U.S. equity market indices and active U.S. equity market strategies.
The index is unmanaged, and its results include reinvested dividends and/or distributions, but do not reflect the effect of sales charges, commissions, expenses or taxes.
You cannot invest directly in an index.
The chart and table do not reflect the deductions of taxes that a shareholder would pay on Fund distributions or the sale of Fund shares.
The total annual fund operating expense ratio as shown in the Fund’s most recent prospectus, as supplemented, was 0.19%. Actual expenses may be higher or lower. Please see the accompanying Financial Highlights for expense ratios for the period ended March 31, 2018.
Important Risks
Investing involves risk, including the possible loss of principal. There is no guarantee a fund will achieve its stated objective. Security prices fluctuate in value depending on general market and economic conditions and the prospects of individual companies. •Small cap securities can have greater risk and volatility than large-cap securities. •Diversification does not eliminate the risk of experiencing investment losses. •Due to its investment strategy, the fund may make higher capital gain distributions than other ETFs.
|
| Hartford Multifactor US Equity ETF |
Fund Summary
March 31, 2018 (Unaudited)
Composition by Sector(1)
as of March 31, 2018
| | | | |
| Sector | | Percentage of
Net Assets | |
Equity Securities | | | | |
Consumer Discretionary | | | 10.8 | % |
Consumer Staples | | | 6.8 | |
Energy | | | 6.1 | |
Financials | | | 17.5 | |
Health Care | | | 14.9 | |
Industrials | | | 10.2 | |
Information Technology | | | 21.3 | |
Materials | | | 5.0 | |
Real Estate | | | 3.6 | |
Telecommunication Services | | | 1.4 | |
Utilities | | | 2.3 | |
| | | | |
Total | | | 99.9 | % |
| | | | |
Short-Term Investments | | | 0.8 | |
Other Assets & Liabilities | | | (0.7 | ) |
| | | | |
Total | | | 100.0 | % |
| | | | |
| (1) | For Fund compliance purposes, the Fund may not use the same classification system shown in this report as these classifications are used for financial reporting purposes. |
|
| Hartford Multifactor ETFs |
Expense Examples (Unaudited)
Your Fund’s Expenses
As a shareholder of a Fund, you incur two types of costs: (1) transaction costs, including brokerage commissions paid on purchases and sales of Fund shares and (2) ongoing costs, including investment management fees and certain other fund expenses. This example is intended to help you understand your ongoing costs (in dollars) of investing in a Fund and to compare these costs with the ongoing costs of investing in other exchange-traded funds. The example is based on an investment of $1,000 invested at the beginning of the period and held for the entire period of October 1, 2017 through March 31, 2018. To the extent a Fund was subject to acquired fund fees and expenses during the period, acquired fund fees and expenses are not included in the annualized expense ratio below.
Actual Expenses
The first set of columns of the table below provides information about actual account values and actual expenses. You may use this information, together with the amount you invested, to estimate the expenses that you paid over the period. Simply divide your account value by $1,000 (for example, an $8,600 account value divided by $1,000 = 8.6), then multiply the result by the number in the line under the heading entitled “Expenses Paid During Period” to estimate the expenses you paid on your account during this period.
Hypothetical Example for Comparison Purposes
The second set of columns of the table below provides information about hypothetical account values and hypothetical expenses based on a Fund’s actual expense ratio and an assumed rate of return of 5% per year before expenses, which is not the Fund’s actual return. The hypothetical account values and expenses may not be used to estimate the actual ending account balance or expenses you paid for the period. You may use this information to compare the ongoing costs of investing in a Fund and other funds. To do so, compare this 5% hypothetical example with the 5% hypothetical examples that appear in the shareholder reports of the other funds.
Please note that the expenses shown in the table are meant to highlight your ongoing costs only and do not reflect any transactional costs, such as brokerage commissions paid on purchases and sales of shares of the Funds. Therefore, the second set of columns of the table is useful in comparing ongoing costs only, and will not help you determine the relative total costs of owning different exchange-traded funds. In addition, if these transactional costs were included, your costs would be higher. Expense ratios may vary period to period because of various factors, such as an increase in expenses not covered by the management fee (including extraordinary expenses and interest expense). Expenses are equal to a Fund’s annualized expense ratio multiplied by average account value over the period, multiplied by 182/365 (to reflect the one-half year period).
Hartford Multifactor Developed Markets (ex-US) ETF
| | | | | | | | | | | | | | | | | | | | | | | | | | | | | | | | | | |
| Actual Return | | | Hypothetical (5% return before expenses) | | | | | | | | | | |
Beginning
Account
Value
October 1,
2017 | | | Ending
Account
Value
March 31,
2018 | | | Expenses paid
during the period
October 1, 2017
through
March 31,
2018 | | | Beginning
Account
Value
October 1,
2017 | | | Ending
Account
Value
March 31,
2018 | | | Expenses paid
during the period
October 1, 2017
through
March 31,
2018 | | | Annualized
expense
ratio(1) | | | Days in
the
current
1/2 year | | | Days in
the full
year | |
| $ | 1,000.00 | | | $ | 1,036.50 | | | $ | 1.78 | | | $ | 1,000.00 | | | $ | 1,023.19 | | | $ | 1.77 | | | | 0.35 | % | | | 182 | | | | 365 | |
| (1) | Effective February 15, 2018, Lattice Strategies LLC lowered its contractual management fee rate set forth in the investment advisory agreement for the Hartford Multifactor Developed Markets (ex-US) ETF. If this new management fee rate were in effect during the period, the annualized expense ratio would have been 0.29%, and the expenses paid in the actual and hypothetical examples would have been $1.47 and $1.46, respectively. |
|
| Hartford Multifactor ETFs |
Expense Examples (Unaudited) – (continued)
Hartford Multifactor Emerging Markets ETF
| | | | | | | | | | | | | | | | | | | | | | | | | | | | | | | | | | |
| Actual Return | | | Hypothetical (5% return before expenses) | | | | | | | | | | |
Beginning
Account
Value
October 1,
2017 | | | Ending
Account
Value
March 31,
2018 | | | Expenses paid
during the period
October 1, 2017
through
March 31,
2018 | | | Beginning
Account
Value
October 1,
2017 | | | Ending
Account
Value
March 31,
2018 | | | Expenses paid
during the period
October 1, 2017
through
March 31,
2018 | | | Annualized
expense
ratio(1) | | | Days in
the
current
1/2 year | | | Days in
the full
year | |
| $ | 1,000.00 | | | $ | 1,067.90 | | | $ | 2.89 | | | $ | 1,000.00 | | | $ | 1,022.14 | | | $ | 2.82 | | | | 0.56 | % | | | 182 | | | | 365 | |
| (1) | Effective February 15, 2018, Lattice Strategies LLC lowered its contractual management fee rate set forth in the investment advisory agreement for the Hartford Multifactor Emerging Markets ETF. If this new management fee rate were in effect during the period, the annualized expense ratio would have been 0.49%, and the expenses paid in the actual and hypothetical examples would have been $2.52 and $2.46, respectively. |
Hartford Multifactor Global Small Cap ETF
| | | | | | | | | | | | | | | | | | | | | | | | | | | | | | | | | | |
| Actual Return | | | Hypothetical (5% return before expenses) | | | | | | | | | | |
Beginning
Account
Value
October 1,
2017 | | | Ending
Account
Value
March 31,
2018 | | | Expenses paid
during the period
October 1, 2017
through
March 31,
2018 | | | Beginning
Account
Value
October 1,
2017 | | | Ending
Account
Value
March 31,
2018 | | | Expenses paid
during the period
October 1, 2017
through
March 31,
2018 | | | Annualized
expense
ratio(1) | | | Days in
the
current
1/2 year | | | Days in
the full
year | |
| $ | 1,000.00 | | | $ | 1,055.50 | | | $ | 2.61 | | | $ | 1,000.00 | | | $ | 1,022.39 | | | $ | 2.57 | | | | 0.51 | % | | | 182 | | | | 365 | |
| (1) | Effective February 15, 2018, Lattice Strategies LLC lowered its contractual management fee rate set forth in the investment advisory agreement for the Hartford Multifactor Global Small Cap ETF. If this new management fee rate were in effect during the period, the annualized expense ratio would have been 0.39%, and the expenses paid in the actual and hypothetical examples would have been $1.99 and $1.96, respectively. |
Hartford Multifactor Low Volatility International Equity ETF
| | | | | | | | | | | | | | | | | | | | | | | | | | | | | | | | | | |
| Actual Return | | | Hypothetical (5% return before expenses) | | | | | | | | | | |
Beginning
Account
Value
October 1,
2017 | | | Ending
Account
Value
March 31,
2018 | | | Expenses paid
during the period
October 1, 2017
through
March 31,
2018 | | | Beginning
Account
Value
October 1,
2017 | | | Ending
Account
Value
March 31,
2018 | | | Expenses paid
during the period
October 1, 2017
through
March 31,
2018 | | | Annualized
expense
ratio(1) | | | Days in
the
current
1/2 year | | | Days in
the full
year | |
| $ | 1,000.00 | | | $ | 1,043.30 | | | $ | 1.88 | | | $ | 1,000.00 | | | $ | 1,023.09 | | | $ | 1.87 | | | | 0.37 | % | | | 182 | | | | 365 | |
| (1) | Effective February 15, 2018, Lattice Strategies LLC lowered its contractual management fee rate set forth in the investment advisory agreement for the Hartford Multifactor Low Volatility International Equity ETF. If this new management fee rate were in effect during the period, the annualized expense ratio would have been 0.29%, and the expenses paid in the actual and hypothetical examples would have been $1.47 and $1.46, respectively. |
|
| Hartford Multifactor ETFs |
Expense Examples (Unaudited) – (continued)
Hartford Multifactor Low Volatility US Equity ETF
| | | | | | | | | | | | | | | | | | | | | | | | | | | | | | | | | | |
| Actual Return | | | Hypothetical (5% return before expenses) | | | | | | | | | | |
Beginning
Account
Value
October 1,
2017 | | | Ending
Account
Value
March 31,
2018 | | | Expenses paid
during the period
October 1, 2017
through
March 31,
2018 | | | Beginning
Account
Value
October 1,
2017 | | | Ending
Account
Value
March 31,
2018 | | | Expenses paid
during the period
October 1, 2017
through
March 31,
2018 | | | Annualized
expense
ratio(1) | | | Days in
the
current
1/2 year | | | Days in
the full
year | |
| $ | 1,000.00 | | | $ | 1,025.00 | | | $ | 1.31 | | | $ | 1,000.00 | | | $ | 1,023.64 | | | $ | 1.31 | | | | 0.26 | % | | | 182 | | | | 365 | |
| (1) | Effective February 15, 2018, Lattice Strategies LLC lowered its contractual management fee rate set forth in the investment advisory agreement for the Hartford Multifactor Low Volatility US Equity ETF. If this new management fee rate were in effect during the period, the annualized expense ratio would have been 0.19%, and the expenses paid in the actual and hypothetical examples would have been $0.96 and $0.96, respectively. |
Hartford Multifactor REIT ETF
| | | | | | | | | | | | | | | | | | | | | | | | | | | | | | | | | | |
| Actual Return | | | Hypothetical (5% return before expenses) | | | | | | | | | | |
Beginning
Account
Value
October 1,
2017 | | | Ending
Account
Value
March 31,
2018 | | | Expenses paid
during the period
October 1, 2017
through
March 31,
2018 | | | Beginning
Account
Value
October 1,
2017 | | | Ending
Account
Value
March 31,
2018 | | | Expenses paid
during the period
October 1, 2017
through
March 31,
2018 | | | Annualized
expense
ratio | | | Days in
the
current
1/2 year | | | Days in
the full
year | |
| $ | 1,000.00 | | | $ | 917.00 | | | $ | 2.15 | | | $ | 1,000.00 | | | $ | 1,022.69 | | | $ | 2.27 | | | | 0.45 | % | | | 182 | | | | 365 | |
Hartford Multifactor US Equity ETF
| | | | | | | | | | | | | | | | | | | | | | | | | | | | | | | | | | |
| Actual Return | | | Hypothetical (5% return before expenses) | | | | | | | | | | |
Beginning
Account
Value
October 1,
2017 | | | Ending
Account
Value
March 31,
2018 | | | Expenses paid
during the period
October 1, 2017
through
March 31,
2018 | | | Beginning
Account
Value
October 1,
2017 | | | Ending
Account
Value
March 31,
2018 | | | Expenses paid
during the period
October 1, 2017
through
March 31,
2018 | | | Annualized
expense
ratio(1) | | | Days in
the
current
1/2 year | | | Days in
the full
year | |
| $ | 1,000.00 | | | $ | 1,085.00 | | | $ | 1.35 | | | $ | 1,000.00 | | | $ | 1,023.64 | | | $ | 1.31 | | | | 0.26 | % | | | 182 | | | | 365 | |
| (1) | Effective February 15, 2018, Lattice Strategies LLC lowered its contractual management fee rate set forth in the investment advisory agreement for the Hartford Multifactor US Equity ETF. If this new management fee rate were in effect during the period, the annualized expense ratio would have been 0.19%, and the expenses paid in the actual and hypothetical examples would have been $0.98 and $0.96, respectively. |
|
| Hartford Multifactor Developed Markets (ex-US) ETF |
Schedule of Investments
March 31, 2018 (Unaudited)
| | | | | | | | |
| Shares or Principal Amount | | Market Value† | |
| COMMON STOCKS - 99.6% | | | |
| | | | Australia - 6.3% | | | |
| | 62,924 | | | Adelaide Brighton Ltd.(1) | | $ | 300,214 | |
| | 40,562 | | | AGL Energy Ltd. | | | 674,532 | |
| | 58,510 | | | Amcor Ltd. | | | 635,951 | |
| | 25,397 | | | Ansell Ltd. | | | 492,084 | |
| | 73,546 | | | AusNet Services | | | 94,493 | |
| | 7,131 | | | Australia & New Zealand Banking Group Ltd. | | | 146,920 | |
| | 63,867 | | | BlueScope Steel Ltd. | | | 739,247 | |
| | 72,677 | | | Caltex Australia Ltd. | | | 1,750,452 | |
| | 44,760 | | | CIMIC Group Ltd. | | | 1,526,795 | |
| | 57,153 | | | Coca-Cola Amatil Ltd. | | | 380,086 | |
| | 7,198 | | | Cochlear Ltd. | | | 1,002,765 | |
| | 3,166 | | | Commonwealth Bank of Australia | | | 175,603 | |
| | 6,919 | | | CSL Ltd. | | | 825,060 | |
| | 302,944 | | | Evolution Mining Ltd.(1) | | | 704,091 | |
| | 3,020 | | | Flight Centre Travel Group Ltd.(1) | | | 132,017 | |
| | 108,994 | | | GPT Group REIT | | | 396,282 | |
| | 73,534 | | | Insurance Australia Group Ltd. | | | 421,904 | |
| | 5,258 | | | Macquarie Group Ltd. | | | 415,011 | |
| | 353,225 | | | Mirvac Group REIT | | | 582,524 | |
| | 160,320 | | | Orora Ltd. | | | 405,812 | |
| | 365,750 | | | Qantas Airways Ltd. | | | 1,635,598 | |
| | 25,638 | | | QBE Insurance Group Ltd. | | | 189,380 | |
| | 168,842 | | | Scentre Group REIT | | | 496,024 | |
| | 41,990 | | | Sonic Healthcare Ltd. | | | 736,929 | |
| | 87,838 | | | South32 Ltd. | | | 216,951 | |
| | 86,093 | | | Stockland REIT | | | 266,132 | |
| | 20,740 | | | Suncorp Group Ltd. | | | 212,221 | |
| | 373,909 | | | Telstra Corp. Ltd. | | | 900,574 | |
| | 139,456 | | | Vicinity Centres REIT | | | 257,797 | |
| | 31,257 | | | Washington H Soul Pattinson & Co., Ltd.(1) | | | 446,187 | |
| | 28,655 | | | Wesfarmers Ltd. | | | 913,481 | |
| | 43,079 | | | Westfield Corp. REIT(1) | | | 281,533 | |
| | 75,733 | | | Whitehaven Coal Ltd. | | | 258,505 | |
| | 122,035 | | | WiseTech Global Ltd.(1) | | | 881,777 | |
| | 52,507 | | | Woolworths Ltd.(1) | | | 1,058,843 | |
| | | | | | | | |
| | | | | | | 20,553,775 | |
| | | | | | | | |
| | | | Austria - 0.4% | | | |
| | 1,537 | | | Lenzing AG | | | 189,595 | |
| | 4,273 | | | Oesterreichische Post AG | | | 212,203 | |
| | 72,545 | | | Telekom Austria AG | | | 690,559 | |
| | 9,288 | | | UNIQA Insurance Group AG | | | 107,775 | |
| | | | | | | | |
| | | | | | | 1,200,132 | |
| | | | | | | | |
| | | | Belgium - 1.0% | | | |
| | 1,712 | | | Ackermans & van Haaren N.V. | | | 299,403 | |
| | 20,656 | | | bpost S.A. | | | 466,414 | |
| | 1,593 | | | Cie d’Entreprises CFE | | | 216,682 | |
| | 12,486 | | | Colruyt S.A. | | | 689,787 | |
| | 1,116 | | | Elia System Operator S.A. | | | 69,724 | |
| | 5,688 | | | KBC Group N.V. | | | 494,714 | |
| | 15,966 | | | Proximus SADP | | | 495,411 | |
| | 2,014 | | | Sofina S.A. | | | 341,319 | |
| | 1,117 | | | UCB S.A. | | | 90,914 | |
| | | | | | | | |
| | | | | | | 3,164,368 | |
| | | | | | | | |
| | | | Bermuda - 0.5% | | | |
| | 79,194 | | | Hiscox Ltd. | | | 1,617,519 | |
| | | | | | | | |
| | | | Canada - 10.8% | | | |
| | 4,243 | | | Agnico Eagle Mines Ltd. | | | 178,375 | |
| | 48,572 | | | Air Canada* | | | 1,008,549 | |
| | | | | | | | |
| Shares or Principal Amount | | Market Value† | |
| COMMON STOCKS - 99.6% - (continued) | | | |
| | | | Canada - 10.8% - (continued) | | | |
| | 17,929 | | | Alimentation Couche-Tard, Inc. Class B(1) | | $ | 801,990 | |
| | 2,961 | | | AltaGas Ltd.(1) | | | 54,753 | |
| | 125,351 | | | Aurora Cannabis, Inc.*(1) | | | 904,219 | |
| | 28,324 | | | Bank of Montreal | | | 2,138,058 | |
| | 17,868 | | | Bank of Nova Scotia | | | 1,099,868 | |
| | 22,718 | | | Barrick Gold Corp. | | | 282,819 | |
| | 24,988 | | | BCE, Inc. | | | 1,074,528 | |
| | 19,064 | | | Canadian Apartment Properties REIT | | | 549,333 | |
| | 12,275 | | | Canadian Imperial Bank of Commerce(1) | | | 1,082,733 | |
| | 4,355 | | | Canadian Tire Corp. Ltd. Class A(1) | | | 572,222 | |
| | 16,748 | | | CCL Industries, Inc. Class B | | | 844,902 | |
| | 23,119 | | | CGI Group, Inc. Class A* | | | 1,332,357 | |
| | 4,460 | | | Emera, Inc.(1) | | | 141,004 | |
| | 57,944 | | | Empire Co., Ltd. | | | 1,162,251 | |
| | 3,268 | | | Fairfax Financial Holdings Ltd. | | | 1,655,406 | |
| | 2,393 | | | Fortis, Inc. | | | 80,723 | |
| | 2,491 | | | Franco-Nevada Corp.(1) | | | 169,834 | |
| | 11,506 | | | Genworth MI Canada, Inc.(1) | | | 365,907 | |
| | 11,626 | | | George Weston Ltd.(1) | | | 935,310 | |
| | 46,275 | | | Great-West Lifeco, Inc.(1) | | | 1,180,161 | |
| | 23,744 | | | Husky Energy, Inc.(1) | | | 339,608 | |
| | 71,061 | | | Hydro One Ltd.(2) | | | 1,153,070 | |
| | 13,891 | | | Imperial Oil Ltd.(1) | | | 367,625 | |
| | 14,850 | | | Industrial Alliance Insurance & Financial Services, Inc. | | | 610,471 | |
| | 6,958 | | | Intact Financial Corp. | | | 522,477 | |
| | 76,102 | | | Kinross Gold Corp.* | | | 300,453 | |
| | 13,240 | | | Loblaw Cos. Ltd. | | | 668,444 | |
| | 16,170 | | | Magna International, Inc. | | | 910,186 | |
| | 59,821 | | | Manulife Financial Corp. | | | 1,109,884 | |
| | 8,549 | | | Metro, Inc. | | | 272,534 | |
| | 6,984 | | | National Bank of Canada(1) | | | 328,493 | |
| | 16,030 | | | Norbord, Inc.(1) | | | 580,773 | |
| | 2,659 | | | Open Text Corp. | | | 92,439 | |
| | 43,678 | | | Power Corp. of Canada | | | 996,031 | |
| | 42,657 | | | Power Financial Corp. | | | 1,067,376 | |
| | 1,318 | | | RioCan REIT | | | 24,167 | |
| | 20,042 | | | Rogers Communications, Inc. Class B | | | 894,486 | |
| | 24,443 | | | Royal Bank of Canada | | | 1,886,808 | |
| | 11,405 | | | Saputo, Inc. | | | 365,792 | |
| | 12,650 | | | Shaw Communications, Inc. Class B | | | 243,532 | |
| | 38,965 | | | Sun Life Financial, Inc.(1) | | | 1,599,099 | |
| | 18,242 | | | Suncor Energy, Inc. | | | 629,503 | |
| | 26,544 | | | TELUS Corp. | | | 931,433 | |
| | 7,235 | | | Thomson Reuters Corp. | | | 279,599 | |
| | 6,246 | | | Toromont Industries Ltd. | | | 270,963 | |
| | 15,893 | | | Toronto-Dominion Bank | | | 901,251 | |
| | 5,074 | | | West Fraser Timber Co., Ltd. | | | 336,929 | |
| | | | | | | | |
| | | | | | | 35,298,728 | |
| | | | | | | | |
| | | | China - 0.2% | | | |
| | 545,258 | | | Yangzijiang Shipbuilding Holdings Ltd. | | | 503,136 | |
| | | | | | | | |
| | | | Denmark - 2.6% | | | |
| | 5,080 | | | Coloplast A/S B Shares | | | 427,964 | |
| | 31,825 | | | DONG Energy AS(2) | | | 2,058,341 | |
| | 4,012 | | | GN Store Nord AS | | | 141,260 | |
| | 5,460 | | | H. Lundbeck A/S(1) | | | 304,309 | |
| | 23,182 | | | ISS A/S | | | 855,235 | |
| | 35,942 | | | Novo Nordisk A/S Class B | | | 1,764,218 | |
| | 1,638 | | | Rockwool International A/S B Shares | | | 485,111 | |
| | 29,777 | | | Topdanmark A/S* | | | 1,398,230 | |
The accompanying notes are an integral part of these financial statements.
|
| Hartford Multifactor Developed Markets (ex-US) ETF |
Schedule of Investments – (continued)
March 31, 2018 (Unaudited)
| | | | | | | | |
| Shares or Principal Amount | | Market Value† | |
| COMMON STOCKS - 99.6% - (continued) | | | |
| | | | Denmark - 2.6% - (continued) | | | |
| | 26,623 | | | William Demant Holding A/S* | | $ | 984,817 | |
| | | | | | | | |
| | | | | | | 8,419,485 | |
| | | | | | | | |
| | | | Finland - 0.6% | | | |
| | 24,673 | | | Neste Oyj(1) | | | 1,717,476 | |
| | 10,253 | | | Orion Oyj Class B(1) | | | 313,602 | |
| | | | | | | | |
| | | | | | | 2,031,078 | |
| | | | | | | | |
| | | | France - 6.3% | | | |
| | 683 | | | Aeroports de Paris | | | 148,678 | |
| | 24,904 | | | Air France-KLM* | | | 275,960 | |
| | 1,734 | | | Air Liquide S.A. | | | 212,147 | |
| | 109,805 | | | ALD S.A.*(1)(2) | | | 1,783,928 | |
| | 9,023 | | | Amundi S.A.(2) | | | 724,186 | |
| | 3,270 | | | Atos SE | | | 446,801 | |
| | 12,070 | | | AXA S.A. | | | 320,637 | |
| | 18,988 | | | BioMerieux | | | 1,564,611 | |
| | 43,685 | | | Bouygues S.A. | | | 2,187,186 | |
| | 12,603 | | | Cie Generale des Etablissements Michelin SCA | | | 1,858,427 | |
| | 72,949 | | | CNP Assurances | | | 1,839,185 | |
| | 295 | | | Eiffage S.A. | | | 33,552 | |
| | 16,581 | | | Elior Group S.A.(1)(2) | | | 360,125 | |
| | 3,494 | | | Eurazeo S.A. | | | 321,208 | |
| | 2,300 | | | Fonciere Des Regions REIT | | | 253,589 | |
| | 5,811 | | | Gecina S.A. REIT | | | 1,008,394 | |
| | 6,329 | | | Ipsen S.A. | | | 981,917 | |
| | 3,357 | | | Klepierre REIT | | | 135,212 | |
| | 15,520 | | | Lagardere SCA | | | 442,825 | |
| | 2,764 | | | Metropole Television S.A. | | | 71,113 | |
| | 14,637 | | | Peugeot S.A. | | | 351,926 | |
| | 11,455 | | | Rubis SCA | | | 826,258 | |
| | 2,370 | | | Safran S.A. | | | 250,610 | |
| | 10,794 | | | SCOR SE | | | 441,527 | |
| | 2,785 | | | Societe BIC S.A. | | | 276,922 | |
| | 5,179 | | | Sodexo S.A. | | | 521,653 | |
| | 9,030 | | | Suez | | | 130,712 | |
| | 5,393 | | | Thales S.A. | | | 656,228 | |
| | 14,740 | | | TOTAL S.A.(1) | | | 836,244 | |
| | 322 | | | Unibail-Rodamco SE REIT | | | 73,520 | |
| | 23,645 | | | Worldline S.A.*(2) | | | 1,199,833 | |
| | | | | | | | |
| | | | | | | 20,535,114 | |
| | | | | | | | |
| | | | Germany - 7.0% | | | |
| | 6,077 | | | Allianz SE | | | 1,370,695 | |
| | 9,609 | | | Aurubis AG | | | 806,908 | |
| | 2,689 | | | BASF SE | | | 272,734 | |
| | 8,581 | | | Carl Zeiss Meditec AG | | | 547,191 | |
| | 3,282 | | | CECONOMY AG | | | 37,740 | |
| | 19,478 | | | Covestro AG(2) | | | 1,913,048 | |
| | 9,020 | | | Delivery Hero AG*(2) | | | 435,965 | |
| | 33,660 | | | Deutsche Lufthansa AG | | | 1,073,832 | |
| | 4,128 | | | Deutsche Post AG | | | 180,329 | |
| | 8,206 | | | Deutsche Wohnen SE | | | 382,493 | |
| | 3,726 | | | DMG Mori AG | | | 213,541 | |
| | 20,804 | | | Evonik Industries AG | | | 732,778 | |
| | 682 | | | Fielmann AG | | | 55,106 | |
| | 4,769 | | | Fresenius Medical Care AG & Co. KGaA | | | 486,691 | |
| | 8,441 | | | Hannover Rueck SE | | | 1,151,271 | |
| | 1,285 | | | HOCHTIEF AG | | | 239,740 | |
| | 49,777 | | | Innogy SE(2) | | | 2,355,067 | |
| | 1,566 | | | Krones AG | | | 210,698 | |
| | 8,451 | | | LEG Immobilien AG | | | 949,339 | |
| | | | | | | | |
| Shares or Principal Amount | | Market Value† | |
| COMMON STOCKS - 99.6% - (continued) | | | |
| | | | Germany - 7.0% - (continued) | | | |
| | 2,034 | | | MAN SE | | $ | 237,019 | |
| | 9,835 | | | Merck KGaA | | | 942,246 | |
| | 7,123 | | | Muenchener Rueckversicherungs-Gesellschaft AG in Muenchen | | | 1,654,368 | |
| | 29,694 | | | Suedzucker AG | | | 503,599 | |
| | 37,499 | | | Talanx AG* | | | 1,629,816 | |
| | 117,701 | | | Telefonica Deutschland Holding AG | | | 552,384 | |
| | 33,750 | | | TUI AG | | | 722,437 | |
| | 78,273 | | | Uniper SE | | | 2,382,536 | |
| | 19,025 | | | Vonovia SE | | | 941,766 | |
| | | | | | | | |
| | | | | | | 22,981,337 | |
| | | | | | | | |
| | | | Hong Kong - 5.2% | | | |
| | 1,153,688 | | | Champion REIT | | | 821,721 | |
| | 976,500 | | | Chinese Estates Holdings Ltd. | | | 1,463,201 | |
| | 152,720 | | | Chow Tai Fook Jewellery Group Ltd. | | | 173,963 | |
| | 24,480 | | | CLP Holdings Ltd. | | | 249,220 | |
| | 187,233 | | | Dairy Farm International Holdings Ltd.(1) | | | 1,488,502 | |
| | 24,710 | | | Hang Seng Bank Ltd. | | | 571,759 | |
| | 290,609 | | | HK Electric Investments & HK Electric Investments Ltd.(2) | | | 281,415 | |
| | 124,884 | | | Hongkong Land Holdings Ltd. | | | 860,451 | |
| | 264,000 | | | Hopewell Holdings Ltd. | | | 1,007,454 | |
| | 4,826 | | | Jardine Matheson Holdings Ltd. | | | 297,378 | |
| | 10,185 | | | Jardine Strategic Holdings Ltd. | | | 390,493 | |
| | 219,500 | | | Johnson Electric Holdings Ltd. | | | 823,653 | |
| | 197,000 | | | Kerry Properties Ltd. | | | 887,319 | |
| | 1,080,000 | | | Li & Fung Ltd. | | | 528,420 | |
| | 162,188 | | | Link REIT | | | 1,384,580 | |
| | 1,612,575 | | | PCCW Ltd. | | | 932,825 | |
| | 34,000 | | | Sun Hung Kai Properties Ltd. | | | 537,186 | |
| | 14,000 | | | Techtronic Industries Co., Ltd. | | | 81,610 | |
| | 115,435 | | | VTech Holdings Ltd. | | | 1,457,591 | |
| | 1,232,292 | | | WH Group Ltd.(2) | | | 1,312,636 | |
| | 158,000 | | | Wharf Holdings Ltd. | | | 542,551 | |
| | 16,761 | | | Wheelock & Co., Ltd. | | | 122,478 | |
| | 201,611 | | | Yue Yuen Industrial Holdings Ltd. | | | 800,197 | |
| | | | | | | | |
| | | | | | | 17,016,603 | |
| | | | | | | | |
| | | | Hungary - 0.1% | | | |
| | 8,366 | | | Wizz Air Holdings plc*(2) | | | 381,884 | |
| | | | | | | | |
| | | | Ireland - 1.2% | | | |
| | 77,484 | | | AIB Group plc | | | 466,177 | |
| | 1,770 | | | DCC plc | | | 162,882 | |
| | 20,547 | | | ICON plc* | | | 2,427,423 | |
| | 6,918 | | | Kerry Group plc Class A | | | 701,068 | |
| | 4,762 | | | Smurfit Kappa Group plc | | | 192,797 | |
| | | | | | | | |
| | | | | | | 3,950,347 | |
| | | | | | | | |
| | | | Isle of Man - 0.2% | | | |
| | 56,764 | | | Playtech plc | | | 583,518 | |
| | | | | | | | |
| | | | Israel - 2.3% | | | |
| | 53,907 | | | Bank Hapoalim BM | | | 369,120 | |
| | 176,545 | | | Bank Leumi Le-Israel BM | | | 1,061,528 | |
| | 1,219,167 | | | Bezeq The Israeli Telecommunication Corp. Ltd. | | | 1,555,711 | |
| | 4,687 | | | Elbit Systems Ltd. | | | 562,037 | |
| | 380,317 | | | Israel Discount Bank Ltd. Class A* | | | 1,089,761 | |
| | 85,931 | | | Mizrahi Tefahot Bank Ltd. | | | 1,640,616 | |
| | 11,387 | | | Taro Pharmaceutical Industries Ltd.* | | | 1,124,352 | |
| | | | | | | | |
| | | | | | | 7,403,125 | |
| | | | | | | | |
The accompanying notes are an integral part of these financial statements.
|
| Hartford Multifactor Developed Markets (ex-US) ETF |
Schedule of Investments – (continued)
March 31, 2018 (Unaudited)
| | | | | | | | |
| Shares or Principal Amount | | Market Value† | |
| COMMON STOCKS - 99.6% - (continued) | | | |
| | | | Italy - 1.5% | | | |
| | 9,219 | | | ACEA S.p.A. | | $ | 156,237 | |
| | 6,652 | | | Assicurazioni Generali S.p.A. | | | 127,828 | |
| | 6,827 | | | DiaSorin S.p.A. | | | 613,761 | |
| | 15,227 | | | Enel S.p.A. | | | 93,073 | |
| | 186,731 | | | Hera S.p.A. | | | 682,983 | |
| | 25,430 | | | Italgas S.p.A. | | | 151,872 | |
| | 86,571 | | | Poste Italiane S.p.A.(1)(2) | | | 790,003 | |
| | 254,263 | | | PRADA S.p.A. | | | 1,174,399 | |
| | 23,542 | | | Recordati S.p.A. | | | 868,015 | |
| | 54,980 | | | UnipolSai Assicurazioni S.p.A.(1) | | | 130,704 | |
| | | | | | | | |
| | | | | | | 4,788,875 | |
| | | | | | | | |
| | | | Japan - 20.6% | | | |
| | 2,005 | | | ABC-Mart, Inc. | | | 131,216 | |
| | 76,259 | | | Aeon Co., Ltd.(1) | | | 1,347,708 | |
| | 4,837 | | | Aisin Seiki Co., Ltd. | | | 261,066 | |
| | 21,982 | | | Alfresa Holdings Corp.(1) | | | 489,660 | |
| | 20,741 | | | ANA Holdings, Inc. | | | 796,291 | |
| | 5,058 | | | Aoyama Trading Co., Ltd. | | | 197,849 | |
| | 22,988 | | | Aozora Bank Ltd. | | | 914,332 | |
| | 1,000 | | | Asahi Group Holdings Ltd. | | | 53,503 | |
| | 124,494 | | | Asahi Kasei Corp. | | | 1,637,093 | |
| | 65,565 | | | Astellas Pharma, Inc. | | | 996,267 | |
| | 9,000 | | | Azbil Corp. | | | 419,323 | |
| | 19,659 | | | Bandai Namco Holdings, Inc. | | | 628,496 | |
| | 12,287 | | | Benesse Holdings, Inc. | | | 441,338 | |
| | 32,397 | | | Bic Camera, Inc. | | | 509,335 | |
| | 23,493 | | | Bridgestone Corp. | | | 1,022,338 | |
| | 8,885 | | | Brother Industries Ltd. | | | 202,763 | |
| | 38,097 | | | Canon Marketing Japan, Inc. | | | 1,022,010 | |
| | 41,503 | | | Canon, Inc. | | | 1,502,459 | |
| | 149,964 | | | Citizen Watch Co., Ltd.(1) | | | 1,044,883 | |
| | 3,260 | | | COMSYS Holdings Corp. | | | 85,493 | |
| | 28,800 | | | Cosmo Energy Holdings Co., Ltd. | | | 913,963 | |
| | 17,037 | | | Dai-ichi Life Holdings, Inc. | | | 311,584 | |
| | 2,636 | | | Daiichi Sankyo Co., Ltd. | | | 87,619 | |
| | 3,700 | | | Daiichikosho Co., Ltd. | | | 193,089 | |
| | 5,216 | | | Daito Trust Construction Co., Ltd.(1) | | | 883,311 | |
| | 70,817 | | | Daiwa Securities Group, Inc.(1) | | | 450,339 | |
| | 3,300 | | | Denka Co., Ltd. | | | 110,000 | |
| | 8,200 | | | FamilyMart UNY Holdings Co., Ltd.(1) | | | 679,285 | |
| | 17,120 | | | FUJIFILM Holdings Corp. | | | 675,463 | |
| | 140,489 | | | Fujitsu Ltd. | | | 844,123 | |
| | 3,800 | | | Furukawa Electric Co., Ltd.(1) | | | 200,809 | |
| | 270,608 | | | GungHo Online Entertainment, Inc.(1) | | | 885,487 | |
| | 3,993 | | | Hikari Tsushin, Inc. | | | 637,153 | |
| | 1,500 | | | Hisamitsu Pharmaceutical Co., Inc. | | | 114,810 | |
| | 12,207 | | | Hitachi High-Technologies Corp. | | | 569,316 | |
| | 106,368 | | | Hitachi Ltd. | | | 763,229 | |
| | 5,934 | | | Hitachi Transport System Ltd.(1) | | | 164,712 | |
| | 5,200 | | | Honda Motor Co., Ltd. | | | 178,027 | |
| | 18,349 | | | House Foods Group, Inc.(1) | | | 602,144 | |
| | 5,021 | | | Hoya Corp. | | | 250,649 | |
| | 19,819 | | | Idemitsu Kosan Co., Ltd. | | | 745,425 | |
| | 15,836 | | | Ito En Ltd.(1) | | | 615,720 | |
| | 26,771 | | | ITOCHU Corp.(1) | | | 516,415 | |
| | 77,502 | | | Itochu Techno-Solutions Corp. | | | 1,582,105 | |
| | 46,693 | | | Japan Airlines Co., Ltd. | | | 1,883,087 | |
| | 16,681 | | | Japan Post Holdings Co., Ltd. | | | 201,552 | |
| | 22,619 | | | Japan Post Insurance Co., Ltd.(1) | | | 531,924 | |
| | 173,838 | | | JXTG Holdings, Inc. | | | 1,042,211 | |
| | | | | | | | |
| Shares or Principal Amount | | Market Value† | |
| COMMON STOCKS - 99.6% - (continued) | | | |
| | | | Japan - 20.6% - (continued) | | | |
| | 89,948 | | | K’s Holdings Corp.(1) | | $ | 1,236,521 | |
| | 2,000 | | | Kagome Co., Ltd. | | | 69,770 | |
| | 38,000 | | | Kajima Corp. | | | 352,666 | |
| | 1,449 | | | Kaken Pharmaceutical Co., Ltd. | | | 85,019 | |
| | 24,882 | | | Kaneka Corp. | | | 245,428 | |
| | 3,681 | | | Kao Corp. | | | 274,543 | |
| | 26,951 | | | KDDI Corp.(1) | | | 685,622 | |
| | 25,700 | | | Kinden Corp. | | | 425,071 | |
| | 2,257 | | | Kirin Holdings Co., Ltd. | | | 59,709 | |
| | 82,988 | | | Konica Minolta, Inc.(1) | | | 696,834 | |
| | 14,493 | | | Kuraray Co., Ltd. | | | 248,023 | |
| | 2,300 | | | Kurita Water Industries Ltd. | | | 73,206 | |
| | 57,200 | | | Kyushu Railway Co.(1) | | | 1,774,894 | |
| | 8,522 | | | Lawson, Inc.(1) | | | 580,153 | |
| | 5,100 | | | Marubeni Corp. | | | 36,767 | |
| | 4,500 | | | Matsumotokiyoshi Holdings Co., Ltd. | | | 188,716 | |
| | 184,900 | | | Mebuki Financial Group, Inc. | | | 709,348 | |
| | 43,850 | | | Medipal Holdings Corp. | | | 906,275 | |
| | 816 | | | MEIJI Holdings Co., Ltd. | | | 62,380 | |
| | 31,800 | | | Mitsubishi Chemical Holdings Corp. | | | 304,993 | |
| | 7,292 | | | Mitsubishi Gas Chemical Co., Inc. | | | 172,855 | |
| | 45,227 | | | Mitsubishi Tanabe Pharma Corp. | | | 908,367 | |
| | 18,960 | | | Mixi, Inc. | | | 702,420 | |
| | 10,317 | | | NEC Corp.(1) | | | 287,149 | |
| | 5,869 | | | NH Foods Ltd.(1) | | | 239,782 | |
| | 9,594 | | | Nichirei Corp. | | | 258,366 | |
| | 10,075 | | | Nihon Kohden Corp. | | | 285,150 | |
| | 34,681 | | | Nippo Corp. | | | 774,167 | |
| | 26,768 | | | Nippon Kayaku Co., Ltd.(1) | | | 328,717 | |
| | 25,353 | | | Nippon Telegraph & Telephone Corp. | | | 1,168,598 | |
| | 35,000 | | | Nipro Corp.(1) | | | 509,121 | |
| | 23,770 | | | Nissan Motor Co., Ltd.(1) | | | 244,629 | |
| | 15,760 | | | NTT Data Corp. | | | 163,453 | |
| | 38,524 | | | NTT DOCOMO, Inc.(1) | | | 974,239 | |
| | 35,600 | | | Obayashi Corp. | | | 386,964 | |
| | 31,000 | | | Oji Holdings Corp. | | | 197,630 | |
| | 32,051 | | | Osaka Gas Co., Ltd.(1) | | | 631,979 | |
| | 14,338 | | | Otsuka Corp. | | | 722,630 | |
| | 2,404 | | | Otsuka Holdings Co., Ltd. | | | 119,646 | |
| | 12,967 | | | Park24 Co., Ltd.(1) | | | 351,395 | |
| | 59,100 | | | Recruit Holdings Co., Ltd. | | | 1,458,189 | |
| | 38,866 | | | Resona Holdings, Inc. | | | 206,445 | |
| | 20,969 | | | Ricoh Co., Ltd.(1) | | | 204,465 | |
| | 23,628 | | | Rohto Pharmaceutical Co., Ltd. | | | 656,963 | |
| | 12,968 | | | Sawai Pharmaceutical Co., Ltd.(1) | | | 567,617 | |
| | 15,008 | | | Sega Sammy Holdings, Inc. | | | 240,608 | |
| | 6,374 | | | Seiko Epson Corp. | | | 109,200 | |
| | 20,565 | | | Sekisui Chemical Co., Ltd. | | | 355,803 | |
| | 16,648 | | | Sekisui House Ltd. | | | 302,435 | |
| | 5,989 | | | Seven & I Holdings Co., Ltd. | | | 255,215 | |
| | 8,340 | | | Shimamura Co., Ltd. | | | 1,033,580 | |
| | 58,000 | | | Showa Shell Sekiyu KK | | | 780,423 | |
| | 79,758 | | | Skylark Co., Ltd. | | | 1,142,186 | |
| | 12,200 | | | Square Enix Holdings Co., Ltd. | | | 544,325 | |
| | 2,493 | | | Subaru Corp. | | | 81,787 | |
| | 8,617 | | | Sugi Holdings Co., Ltd. | | | 481,288 | |
| | 35,000 | | | Sumitomo Chemical Co., Ltd. | | | 200,094 | |
| | 52,501 | | | Sumitomo Dainippon Pharma Co., Ltd.(1) | | | 867,859 | |
| | 29,129 | | | Sumitomo Forestry Co., Ltd. | | | 463,708 | |
| | 17,489 | | | Sumitomo Rubber Industries Ltd. | | | 318,371 | |
| | 2,107 | | | Suntory Beverage & Food Ltd. | | | 102,032 | |
The accompanying notes are an integral part of these financial statements.
|
| Hartford Multifactor Developed Markets (ex-US) ETF |
Schedule of Investments – (continued)
March 31, 2018 (Unaudited)
| | | | | | | | |
| Shares or Principal Amount | | Market Value† | |
| COMMON STOCKS - 99.6% - (continued) | | | |
| | | | Japan - 20.6% - (continued) | | | |
| | 17,982 | | | Suzuken Co., Ltd. | | $ | 749,039 | |
| | 8,900 | | | Taisei Corp. | | | 450,230 | |
| | 12,144 | | | Takeda Pharmaceutical Co., Ltd. | | | 584,648 | |
| | 5,900 | | | Teijin Ltd.(1) | | | 110,954 | |
| | 2,611 | | | Toho Gas Co., Ltd.(1) | | | 80,896 | |
| | 4,614 | | | Tokyo Electron Ltd.(1) | | | 833,644 | |
| | 34,996 | | | Tokyo Gas Co., Ltd. | | | 927,304 | |
| | 4,219 | | | Toyo Suisan Kaisha Ltd. | | | 165,824 | |
| | 6,300 | | | TS Tech Co., Ltd. | | | 248,209 | |
| | 23,047 | | | Tsumura & Co. | | | 796,405 | |
| | 879 | | | Tsuruha Holdings, Inc. | | | 125,548 | |
| | 7,489 | | | TV Asahi Holdings Corp. | | | 163,864 | |
| | 31,372 | | | Ube Industries Ltd.(1) | | | 911,514 | |
| | 3,591 | | | Welcia Holdings Co., Ltd.(1) | | | 160,557 | |
| | 5,949 | | | West Japan Railway Co. | | | 418,136 | |
| | 45,657 | | | Yamada Denki Co., Ltd.(1) | | | 275,187 | |
| | 29,380 | | | Yamazaki Baking Co., Ltd. | | | 611,911 | |
| | 2,835 | | | Yokohama Rubber Co., Ltd. | | | 64,884 | |
| | 16,053 | | | Zensho Holdings Co., Ltd.(1) | | | 364,230 | |
| | | | | | | | |
| | | | | | | 67,195,746 | |
| | | | | | | | |
| | | | Jersey - 0.0% | | | |
| | 743 | | | Randgold Resources Ltd. | | | 61,307 | |
| | | | | | | | |
| | | | Luxembourg - 0.9% | | | |
| | 55,313 | | | Grand City Properties S.A. | | | 1,321,079 | |
| | 877,951 | | | L’Occitane International S.A. | | | 1,622,044 | |
| | | | | | | | |
| | | | | | | 2,943,123 | |
| | | | | | | | |
| | | | Malta - 0.2% | | | |
| | 38,793 | | | Kindred Group plc SDR | | | 528,755 | |
| | | | | | | | |
| | | | Netherlands - 3.5% | | | |
| | 38,954 | | | Aegon N.V. | | | 262,342 | |
| | 5,978 | | | Akzo Nobel N.V. | | | 564,196 | |
| | 55,954 | | | ASR Nederland N.V. | | | 2,389,258 | |
| | 12,946 | | | GrandVision N.V.(2) | | | 294,869 | |
| | 2,220 | | | ING Groep N.V. | | | 37,405 | |
| | 46,735 | | | Koninklijke Ahold Delhaize N.V. | | | 1,105,973 | |
| | 7,256 | | | Koninklijke DSM N.V. | | | 719,615 | |
| | 45,100 | | | NN Group N.V. | | | 1,999,004 | |
| | 63,512 | | | Philips Lighting N.V.(2) | | | 2,382,363 | |
| | 36,314 | | | Royal Dutch Shell plc Class A | | | 1,137,773 | |
| | 8,910 | | | Wolters Kluwer N.V. | | | 473,275 | |
| | | | | | | | |
| | | | | | | 11,366,073 | |
| | | | | | | | |
| | | | New Zealand - 2.0% | | | |
| | 821,257 | | | Air New Zealand Ltd. | | | 1,913,628 | |
| | 87,532 | | | Fisher & Paykel Healthcare Corp. Ltd. | | | 833,522 | |
| | 40,621 | | | Fletcher Building Ltd. | | | 176,703 | |
| | 222,142 | | | Fonterra Co-operative Group Ltd. UNIT | | | 947,096 | |
| | 43,331 | | | Meridian Energy Ltd. | | | 89,245 | |
| | 423,590 | | | Spark New Zealand Ltd. | | | 1,023,481 | |
| | 308,044 | | | Z Energy Ltd.(1) | | | 1,555,560 | |
| | | | | | | | |
| | | | | | | 6,539,235 | |
| | | | | | | | |
| | | | Norway - 0.2% | | | |
| | 37,840 | | | Entra ASA(2) | | | 514,755 | |
| | 41,112 | | | Leroy Seafood Group ASA | | | 253,973 | |
| | | | | | | | |
| | | | | | | 768,728 | |
| | | | | | | | |
| | | | Portugal - 0.1% | | | |
| | 12,534 | | | Jeronimo Martins SGPS S.A. | | | 228,218 | |
| | | | | | | | |
| | | | | | | | |
| Shares or Principal Amount | | Market Value† | |
| COMMON STOCKS - 99.6% - (continued) | | | |
| | | | Russia - 0.1% | | | |
| | 34,759 | | | Polymetal International plc | | $ | 357,898 | |
| | | | | | | | |
| | | | Singapore - 3.1% | | | |
| | 185,004 | | | BOC Aviation Ltd.(2) | | | 1,099,657 | |
| | 189,798 | | | ComfortDelGro Corp. Ltd. | | | 296,717 | |
| | 44,904 | | | DBS Group Holdings Ltd. | | | 941,707 | |
| | 737,834 | | | Mapletree Greater China Commercial Trust REIT | | | 647,075 | |
| | 289,133 | | | Mapletree Industrial Trust REIT | | | 447,601 | |
| | 142,282 | | | Oversea-Chinese Banking Corp. Ltd. | | | 1,391,028 | |
| | 147,011 | | | SATS Ltd. | | | 575,129 | |
| | 149,288 | | | Singapore Airlines Ltd. | | | 1,234,105 | |
| | 663,837 | | | StarHub Ltd.(1) | | | 1,164,360 | |
| | 59,053 | | | United Overseas Bank Ltd. | | | 1,238,433 | |
| | 51,000 | | | Venture Corp. Ltd. | | | 1,093,274 | |
| | | | | | | | |
| | | | | | | 10,129,086 | |
| | | | | | | | |
| | | | South Africa - 0.1% | | | |
| | 15,533 | | | Mondi plc | | | 417,273 | |
| | | | | | | | |
| | | | Spain - 2.4% | | | |
| | 6,950 | | | Bolsas y Mercados Espanoles SHMSF S.A.(1) | | | 235,055 | |
| | 24,284 | | | Cia de Distribucion Integral Logista Holdings S.A. | | | 513,690 | |
| | 9,753 | | | Distribuidora Internacional de Alimentacion S.A.(1) | | | 41,346 | |
| | 26,313 | | | Ebro Foods S.A.(1) | | | 668,579 | |
| | 45,645 | | | Endesa S.A. | | | 1,004,002 | |
| | 302,424 | | | Gestamp Automocion S.A.*(1)(2) | | | 2,462,218 | |
| | 650 | | | Grupo Catalana Occidente S.A. | | | 28,299 | |
| | 771,945 | | | Prosegur Cash S.A.(2) | | | 2,321,227 | |
| | 9,827 | | | Red Electrica Corp. S.A. | | | 202,194 | |
| | 3,821 | | | Viscofan S.A.(1) | | | 263,628 | |
| | | | | | | | |
| | | | | | | 7,740,238 | |
| | | | | | | | |
| | | | Sweden - 1.9% | | | |
| | 97,861 | | | Ahlsell AB(2) | | | 614,056 | |
| | 59,898 | | | Axfood AB(1) | | | 1,020,972 | |
| | 61,423 | | | Dometic Group AB(2) | | | 559,238 | |
| | 49,678 | | | Essity AB Class B* | | | 1,367,883 | |
| | 3,109 | | | Fabege AB | | | 67,119 | |
| | 6,963 | | | Hennes & Mauritz AB B Shares(1) | | | 104,078 | |
| | 11,213 | | | ICA Gruppen AB(1) | | | 395,510 | |
| | 2,290 | | | Industrivarden AB Class A | | | 55,454 | |
| | 3,431 | | | Investor AB B Shares | | | 151,254 | |
| | 4,433 | | | L E Lundbergforetagen AB B Shares | | | 316,537 | |
| | 15,025 | | | Loomis AB Class B | | | 538,939 | |
| | 5,986 | | | Nordea Bank AB | | | 63,685 | |
| | 28,706 | | | Swedbank AB Class A | | | 640,973 | |
| | 4,490 | | | Swedish Match AB | | | 202,390 | |
| | | | | | | | |
| | | | | | | 6,098,088 | |
| | | | | | | | |
| | | | Switzerland - 7.4% | | | |
| | 12,593 | | | ABB Ltd. | | | 298,781 | |
| | 83 | | | Adecco Group AG | | | 5,894 | |
| | 2,273 | | | Allreal Holding AG | | | 373,374 | |
| | 12,168 | | | Baloise Holding AG | | | 1,856,459 | |
| | 1,423 | | | Banque Cantonale Vaudoise | | | 1,148,683 | |
| | 20,004 | | | BKW AG | | | 1,328,586 | |
| | 1 | | | Chocoladefabriken Lindt & Spruengli AG | | | 72,577 | |
| | 736 | | | Emmi AG | | | 602,189 | |
| | 475 | | | EMS-Chemie Holding AG | | | 299,107 | |
| | 6,440 | | | Ferguson plc | | | 483,682 | |
| | 95 | | | Georg Fischer AG | | | 126,786 | |
| | 216 | | | Givaudan S.A. | | | 490,827 | |
| | 1,598 | | | Helvetia Holding AG | | | 950,356 | |
The accompanying notes are an integral part of these financial statements.
|
| Hartford Multifactor Developed Markets (ex-US) ETF |
Schedule of Investments – (continued)
March 31, 2018 (Unaudited)
| | | | | | | | |
| Shares or Principal Amount | | Market Value† | |
| COMMON STOCKS - 99.6% - (continued) | | | |
| | | | Switzerland - 7.4% - (continued) | | | |
| | 24,638 | | | Idorsia Ltd.* | | $ | 589,707 | |
| | 8,490 | | | Kuehne + Nagel International AG | | | 1,332,547 | |
| | 8,813 | | | Nestle S.A. | | | 695,947 | |
| | 3,825 | | | Novartis AG | | | 308,604 | |
| | 3,421 | | | Panalpina Welttransport Holding AG(1) | | | 430,840 | |
| | 11,763 | | | Pargesa Holding S.A. | | | 1,040,441 | |
| | 6,576 | | | Roche Holding AG | | | 1,504,597 | |
| | 5,857 | | | SFS Group AG | | | 687,476 | |
| | 208 | | | SGS S.A. | | | 510,008 | |
| | 177 | | | Sika AG | | | 1,383,506 | |
| | 1,738 | | | Sonova Holding AG | | | 275,510 | |
| | 5,621 | | | STMicroelectronics N.V. | | | 124,330 | |
| | 516 | | | Straumann Holding AG(1) | | | 324,386 | |
| | 14,442 | | | Sunrise Communications Group AG(2) | | | 1,207,270 | |
| | 6,564 | | | Swiss Life Holding AG | | | 2,332,633 | |
| | 10,481 | | | Swiss Re AG | | | 1,064,737 | |
| | 56,311 | | | UBS Group AG | | | 987,618 | |
| | 868 | | | VAT Group AG(2) | | | 145,392 | |
| | 2,392 | | | Vontobel Holding AG | | | 147,876 | |
| | 3,285 | | | Zurich Insurance Group AG | | | 1,075,103 | |
| | | | | | | | |
| | | | | | | 24,205,829 | |
| | | | | | | | |
| | | | United Kingdom - 10.1% | | | |
| | 21,266 | | | Ashtead Group plc | | | 578,740 | |
| | 23,990 | | | AstraZeneca plc | | | 1,647,491 | |
| | 18,439 | | | Atlassian Corp. plc Class A*(1) | | | 994,231 | |
| | 37,421 | | | BAE Systems plc | | | 305,201 | |
| | 172,297 | | | Beazley plc | | | 1,384,931 | |
| | 174,183 | | | BP plc | | | 1,171,018 | |
| | 60,598 | | | Britvic plc | | | 580,172 | |
| | 107,780 | | | BT Group plc | | | 343,966 | |
| | 62,081 | | | BTG plc* | | | 588,710 | |
| | 122,972 | | | Centrica plc | | | 245,302 | |
| | 12,409 | | | Close Brothers Group plc | | | 249,795 | |
| | 35,080 | | | Coca-Cola European Partners plc | | | 1,459,102 | |
| | 56,311 | | | Compass Group plc | | | 1,149,744 | |
| | 567,761 | | | ConvaTec Group plc(2) | | | 1,585,742 | |
| | 2,417 | | | Croda International plc | | | 154,881 | |
| | 86,185 | | | CYBG plc | | | 355,931 | |
| | 1,735 | | | Diageo plc | | | 58,705 | |
| | 164,414 | | | Direct Line Insurance Group plc | | | 879,430 | |
| | 10,583 | | | easyJet plc | | | 238,201 | |
| | 29,472 | | | Fiat Chrysler Automobiles N.V. | | | 598,134 | |
| | 48,780 | | | GlaxoSmithKline plc | | | 953,895 | |
| | 78,900 | | | HSBC Holdings plc | | | 736,471 | |
| | 51,199 | | | IG Group Holdings plc | | | 572,780 | |
| | 197,019 | | | Kingfisher plc | | | 808,406 | |
| | 154,509 | | | Legal & General Group plc | | | 558,769 | |
| | 83,469 | | | Marks & Spencer Group plc(1) | | | 316,378 | |
| | 10,971 | | | Metro Bank plc*(1) | | | 540,809 | |
| | 48,194 | | | National Grid plc | | | 542,340 | |
| | 9,630 | | | Next plc | | | 642,892 | |
| | 12,359 | | | Pennon Group plc | | | 111,548 | |
| | 292 | | | Reckitt Benckiser Group plc | | | 24,716 | |
| | 55,228 | | | RELX N.V. | | | 1,143,130 | |
| | 71,854 | | | RELX plc | | | 1,476,673 | |
| | 370,047 | | | Rentokil Initial plc | | | 1,410,400 | |
| | 12,979 | | | Rio Tinto Ltd. | | | 723,768 | |
| | 278,318 | | | Royal Mail plc | | | 2,111,416 | |
| | 19,764 | | | Segro plc REIT | | | 166,682 | |
| | 62,239 | | | Smith & Nephew plc | | | 1,162,081 | |
| | | | | | | | |
| Shares or Principal Amount | | Market Value† | |
| COMMON STOCKS - 99.6% - (continued) | | | |
| | | | United Kingdom - 10.1% - (continued) | | | |
| | 33,168 | | | SSE plc | | $ | 593,698 | |
| | 12,600 | | | SSP Group plc | | | 108,084 | |
| | 87,019 | | | Tate & Lyle plc | | | 664,795 | |
| | 1,702 | | | Unilever N.V. | | | 96,015 | |
| | 20,974 | | | Unilever plc | | | 1,163,800 | |
| | 100,507 | | | Vodafone Group plc | | | 273,833 | |
| | 26,157 | | | WH Smith plc | | | 714,780 | |
| | 156,419 | | | William Hill plc | | | 724,759 | |
| | | | | | | | |
| | | | | | | 32,912,345 | |
| | | | | | | | |
| | | | United States - 0.8% | | | |
| | 10,300 | | | Carnival plc | | | 661,757 | |
| | 49,645 | | | International Game Technology plc | | | 1,327,011 | |
| | 42,620 | | | Valeant Pharmaceuticals International, Inc.* | | | 678,019 | |
| | | | | | | | |
| | | | | | | 2,666,787 | |
| | | | | | | | |
| | |
| | | | Total Common Stocks
(cost $314,027,944) | | $ | 324,587,753 | |
| | | | | | | | |
| | |
| | | | Total Long-Term Investments
(cost $314,027,944) | | $ | 324,587,753 | |
| | | | | | | | |
| |
| SHORT-TERM INVESTMENTS - 4.9% | | | |
| | | | Securities Lending Collateral - 4.9% | | | |
| | 16,032,646 | | | State Street Navigator Securities Lending Government Money Market Portfolio,
1.72%(3) | | $ | 16,032,646 | |
| | | | | | | | |
| | |
| | | | Total Short-Term Investments
(cost $16,032,646) | | $ | 16,032,646 | |
| | | | | | | | |
| | | | | | | | | | | | |
| | | |
| | | | Total Investments
(cost $330,060,590) | | | 104.5 | % | | $ | 340,620,399 | |
| | | | Other Assets and Liabilities | | | (4.5 | )% | | | (14,814,814 | ) |
| | | | | | | | | | | | |
| | | | Total Net Assets | | | 100.0 | % | | $ | 325,805,585 | |
| | | | | | | | | | | | |
The accompanying notes are an integral part of these financial statements.
|
| Hartford Multifactor Developed Markets (ex-US) ETF |
Schedule of Investments – (continued)
March 31, 2018 (Unaudited)
| Note: | Percentage of investments as shown is the ratio of the total market value to total net assets. |
| | The Fund may refer to any one or more of the industry classifications used by one or more widely recognized market indices, ratings group and/or as defined by Fund management. Industry classifications may not be identical across all security types. |
| | For Fund compliance purposes, the Fund may not use the same classification system shown in this report as these classifications are used for financial reporting purposes. |
| (1) | Represents entire or partial securities on loan. See Note 7 in the accompanying Notes to Financial Statements for securities lending information. |
| (2) | Securities issued within terms of a private placement memorandum and exempt from registration under Rule 144A under the Securities Act of 1933, as amended, and may be sold to qualified institutional buyers. Unless otherwise indicated, these holdings are determined to be liquid. At March 31, 2018, the aggregate value of these securities was $27,936,288, which represented 8.6% of total net assets. |
| (3) | Current yield as of period end. |
| † | See Significant Accounting Policies of accompanying Notes to Financial Statements regarding valuation of investments. |
| | |
| GLOSSARY: (abbreviations used in preceding Schedule of Investments) |
|
| Other Abbreviations: |
REIT | | Real Estate Investment Trust |
The accompanying notes are an integral part of these financial statements.
|
| Hartford Multifactor Developed Markets (ex-US) ETF |
Schedule of Investments – (continued)
March 31, 2018 (Unaudited)
Fair Valuation Summary
The following is a summary of the fair valuations according to the inputs used as of March 31, 2018 in valuing the Fund’s investments.
| | | | | | | | | | | | | | | | |
| | | Total | | | Level 1(1) | | | Level 2(1) | | | Level 3(1) | |
Assets | |
Common Stocks | |
Australia | | $ | 20,553,775 | | | $ | 20,553,775 | | | $ | — | | | $ | — | |
Austria | | | 1,200,132 | | | | 1,200,132 | | | | — | | | | — | |
Belgium | | | 3,164,368 | | | | 3,164,368 | | | | — | | | | — | |
Bermuda | | | 1,617,519 | | | | 1,617,519 | | | | — | | | | — | |
Canada | | | 35,298,728 | | | | 35,298,728 | | | | — | | | | — | |
China | | | 503,136 | | | | 503,136 | | | | — | | | | — | |
Denmark | | | 8,419,485 | | | | 8,419,485 | | | | — | | | | — | |
Finland | | | 2,031,078 | | | | 2,031,078 | | | | — | | | | — | |
France | | | 20,535,114 | | | | 20,535,114 | | | | — | | | | — | |
Germany | | | 22,981,337 | | | | 22,981,337 | | | | — | | | | — | |
Hong Kong | | | 17,016,603 | | | | 17,016,603 | | | | — | | | | — | |
Hungary | | | 381,884 | | | | 381,884 | | | | — | | | | — | |
Ireland | | | 3,950,347 | | | | 3,950,347 | | | | — | | | | — | |
Isle of Man | | | 583,518 | | | | 583,518 | | | | — | | | | — | |
Israel | | | 7,403,125 | | | | 7,403,125 | | | | — | | | | — | |
Italy | | | 4,788,875 | | | | 4,788,875 | | | | — | | | | — | |
Japan | | | 67,195,746 | | | | 67,195,746 | | | | — | | | | — | |
Jersey | | | 61,307 | | | | 61,307 | | | | — | | | | — | |
Luxembourg | | | 2,943,123 | | | | 2,943,123 | | | | — | | | | — | |
Malta | | | 528,755 | | | | 528,755 | | | | — | | | | — | |
Netherlands | | | 11,366,073 | | | | 11,366,073 | | | | — | | | | — | |
New Zealand | | | 6,539,235 | | | | 6,539,235 | | | | — | | | | — | |
Norway | | | 768,728 | | | | 768,728 | | | | — | | | | — | |
Portugal | | | 228,218 | | | | 228,218 | | | | — | | | | — | |
Russia | | | 357,898 | | | | 357,898 | | | | — | | | | — | |
Singapore | | | 10,129,086 | | | | 10,129,086 | | | | — | | | | — | |
South Africa | | | 417,273 | | | | 417,273 | | | | — | | | | — | |
Spain | | | 7,740,238 | | | | 7,740,238 | | | | — | | | | — | |
Sweden | | | 6,098,088 | | | | 6,098,088 | | | | — | | | | — | |
Switzerland | | | 24,205,829 | | | | 24,205,829 | | | | — | | | | — | |
United Kingdom | | | 32,912,345 | | | | 32,912,345 | | | | — | | | | — | |
United States | | | 2,666,787 | | | | 2,666,787 | | | | — | | | | — | |
Short-Term Investments | | | 16,032,646 | | | | 16,032,646 | | | | — | | | | — | |
| | | | | | | | | | | | | | | | |
Total | | $ | 340,620,399 | | | $ | 340,620,399 | | | $ | — | | | $ | — | |
| | | | | | | | | | | | | | | | |
| (1) | For the six-month period ended March 31, 2018, there were no transfers between any levels. |
The accompanying notes are an integral part of these financial statements.
|
| Hartford Multifactor Emerging Markets ETF |
Schedule of Investments
March 31, 2018 (Unaudited)
| | | | | | | | |
| Shares or Principal Amount | | Market Value† | |
| COMMON STOCKS - 96.2% | | | |
| | | | Brazil - 2.3% | | | |
| | 29,576 | | | Ambev S.A. | | $ | 214,194 | |
| | 9,979 | | | B3 S.A. - Brasil Bolsa Balcao | | | 80,136 | |
| | 37,560 | | | Banco do Brasil S.A. | | | 463,680 | |
| | 2,996 | | | BB Seguridade Participacoes S.A. | | | 26,385 | |
| | 6,885 | | | CCR S.A. | | | 25,894 | |
| | 19,221 | | | Cielo S.A. | | | 119,654 | |
| | 33,039 | | | Embraer S.A. | | | 214,223 | |
| | 23,673 | | | Kroton Educacional S.A. | | | 96,869 | |
| | 5,605 | | | Lojas Renner S.A. | | | 57,929 | |
| | 6,550 | | | Ultrapar Participacoes S.A. | | | 139,766 | |
| | 9,714 | | | Vale S.A. | | | 123,368 | |
| | | | | | | | |
| | | | | | | 1,562,098 | |
| | | | | | | | |
| | | | Chile - 4.5% | | | |
| | 587,797 | | | Aguas Andinas S.A. Class A | | | 382,567 | |
| | 778,415 | | | Banco de Chile | | | 130,865 | |
| | 6,907 | | | Banco de Credito e Inversiones | | | 512,665 | |
| | 1,103,336 | | | Banco Santander Chile | | | 93,010 | |
| | 108,621 | | | Cencosud S.A. | | | 332,577 | |
| | 8,989 | | | Cia Cervecerias Unidas S.A. | | | 132,327 | |
| | 111,260 | | | Colbun S.A. | | | 26,676 | |
| | 4,548 | | | Empresa Nacional de Telecomunicaciones S.A. | | | 52,205 | |
| | 15,763 | | | Empresas COPEC S.A. | | | 247,589 | |
| | 1,179,707 | | | Enersis Americas S.A. | | | 275,555 | |
| | 3,429,750 | | | Enersis Chile S.A. | | | 444,541 | |
| | 7,290 | | | Latam Airlines Group S.A. | | | 113,351 | |
| | 26,004 | | | SACI Falabella | | | 250,891 | |
| | | | | | | | |
| | | | | | | 2,994,819 | |
| | | | | | | | |
| | | | China - 8.0% | | | |
| | 31,500 | | | Anhui Conch Cement Co., Ltd. Class H | | | 171,582 | |
| | 3,635 | | | Autohome, Inc. ADR | | | 312,392 | |
| | 301 | | | Baidu, Inc. ADR* | | | 67,180 | |
| | 979,000 | | | Bank of China Ltd. Class H | | | 526,405 | |
| | 381,000 | | | China Construction Bank Corp. Class H | | | 391,277 | |
| | 154,000 | | | China Everbright Bank Co., Ltd. Class H | | | 73,975 | |
| | 58,000 | | | China Evergrande Group* | | | 182,536 | |
| | 1,741 | | | China Lodging Group Ltd. ADR | | | 229,307 | |
| | 59,500 | | | China Merchants Bank Co., Ltd. Class H | | | 243,738 | |
| | 946,000 | | | China Telecom Corp. Ltd. Class H | | | 417,053 | |
| | 14,000 | | | China Vanke Co., Ltd. H Shares | | | 63,861 | |
| | 100,000 | | | CNOOC Ltd. | | | 147,293 | |
| | 82,000 | | | CSPC Pharmaceutical Group Ltd. | | | 217,843 | |
| | 149,500 | | | Dali Foods Group Co. Ltd.(1) | | | 123,055 | |
| | 7,000 | | | Geely Automobile Holdings Ltd. | | | 20,157 | |
| | 506,000 | | | Lenovo Group Ltd. | | | 258,535 | |
| | 166,000 | | | Logan Property Holdings Co., Ltd. | | | 252,544 | |
| | 3,713 | | | Momo, Inc. ADR* | | | 138,792 | |
| | 538 | | | NetEase, Inc. ADR | | | 150,850 | |
| | 168,000 | | | PICC Property & Casualty Co., Ltd. Class H | | | 294,117 | |
| | 40,500 | | | Ping An Insurance Group Co. of China Ltd. Class H | | | 411,796 | |
| | 96,248 | | | Semiconductor Manufacturing International Corp.* | | | 125,824 | |
| | 394 | | | SINA Corp.* | | | 41,082 | |
| | 85,600 | | | Sinopharm Group Co., Ltd. Class H | | | 428,638 | |
| | 1,200 | | | Tencent Holdings Ltd. | | | 62,628 | |
| | | | | | | | |
| | | | | | | 5,352,460 | |
| | | | | | | | |
| | | | Colombia - 2.1% | | | |
| | 81,769 | | | Almacenes Exito S.A. | | | 482,458 | |
| | 2,234 | | | Corp. Financiera Colombiana S.A. | | | 19,036 | |
| | 17,032 | | | Grupo Argos S.A. | | | 114,762 | |
| | 7,447 | | | Grupo de Inversiones Suramericana S.A. | | | 99,397 | |
| | | | | | | | |
| Shares or Principal Amount | | Market Value† | |
| COMMON STOCKS - 96.2% - (continued) | | | |
| | | | Colombia - 2.1% - (continued) | | | |
| | 25,613 | | | Grupo Nutresa S.A. | | $ | 238,239 | |
| | 100,759 | | | Interconexion Electrica S.A. ESP | | | 480,509 | |
| | | | | | | | |
| | | | | | | 1,434,401 | |
| | | | | | | | |
| | | | Hong Kong - 0.8% | | | |
| | 48,000 | | | China Resources Land Ltd. | | | 174,611 | |
| | 174,000 | | | Sino Biopharmaceutical Ltd. | | | 341,424 | |
| | | | | | | | |
| | | | | | | 516,035 | |
| | | | | | | | |
| | | | India - 6.2% | | | |
| | 11,120 | | | Axis Bank Ltd. GDR | | | 441,464 | |
| | 15,650 | | | Dr. Reddy’s Laboratories Ltd. ADR(2) | | | 511,599 | |
| | 4,690 | | | HDFC Bank Ltd. ADR | | | 463,231 | |
| | 73,154 | | | ICICI Bank Ltd. ADR(2) | | | 647,413 | |
| | 38,633 | | | Infosys Ltd. ADR(2) | | | 689,599 | |
| | 19,272 | | | Reliance Industries Ltd. GDR(1) | | | 522,271 | |
| | 9,707 | | | State Bank of India GDR | | | 374,690 | |
| | 19,058 | | | Tata Motors Ltd. ADR*(2) | | | 489,791 | |
| | | | | | | | |
| | | | | | | 4,140,058 | |
| | | | | | | | |
| | | | Indonesia - 6.7% | | | |
| | 1,213,400 | | | Adaro Energy Tbk PT | | | 187,728 | |
| | 478,400 | | | Astra International Tbk PT | | | 253,664 | |
| | 163,400 | | | Bank Central Asia Tbk PT | | | 276,537 | |
| | 828,300 | | | Bank Mandiri Persero Tbk PT | | | 461,754 | |
| | 841,500 | | | Bank Negara Indonesia Persero Tbk PT | | | 530,235 | |
| | 1,890,700 | | | Bank Rakyat Indonesia Persero Tbk PT | | | 494,390 | |
| | 1,364,300 | | | Barito Pacific Tbk PT* | | | 228,911 | |
| | 515,500 | | | Bumi Serpong Damai Tbk PT | | | 66,649 | |
| | 155,000 | | | Chandra Asri Petrochemical Tbk PT | | | 70,083 | |
| | 16,000 | | | Gudang Garam Tbk PT | | | 84,227 | |
| | 69,000 | | | Indah Kiat Pulp & Paper Corp. Tbk PT | | | 55,130 | |
| | 170,100 | | | Indocement Tunggal Prakarsa Tbk PT | | | 197,683 | |
| | 220,600 | | | Indofood Sukses Makmur Tbk PT | | | 115,367 | |
| | 921,400 | | | Kalbe Farma Tbk PT | | | 100,389 | |
| | 73,800 | | | Matahari Department Store Tbk PT | | | 58,697 | |
| | 1,353,600 | | | Perusahaan Gas Negara Persero Tbk | | | 226,133 | |
| | 349,000 | | | Semen Indonesia Persero Tbk PT | | | 262,368 | |
| | 380,400 | | | Surya Citra Media Tbk PT | | | 74,878 | |
| | 1,494,500 | | | Telekomunikasi Indonesia Persero Tbk PT | | | 390,790 | |
| | 155,200 | | | United Tractors Tbk PT | | | 360,734 | |
| | | | | | | | |
| | | | | | | 4,496,347 | |
| | | | | | | | |
| | | | Malaysia - 7.4% | | | |
| | 169,400 | | | AirAsia Bhd | | | 173,429 | |
| | 240,700 | | | AMMB Holdings Bhd | | | 241,447 | |
| | 172,400 | | | Axiata Group Bhd | | | 243,357 | |
| | 16,400 | | | British American Tobacco Malaysia Bhd | | | 111,510 | |
| | 249,600 | | | CIMB Group Holdings Bhd | | | 462,031 | |
| | 183,300 | | | DiGi.Com Bhd | | | 219,410 | |
| | 20,500 | | | Fraser & Neave Holdings Bhd | | | 176,275 | |
| | 10,200 | | | Genting Bhd | | | 22,942 | |
| | 153,000 | | | Genting Malaysia Bhd | | | 191,843 | |
| | 30,288 | | | Hong Leong Bank Bhd | | | 146,429 | |
| | 240,400 | | | IJM Corp. Bhd | | | 167,186 | |
| | 18,900 | | | Inari Amertron Bhd | | | 13,681 | |
| | 100,800 | | | IOI Corp. Bhd | | | 124,567 | |
| | 7,400 | | | Kuala Lumpur Kepong Bhd | | | 48,938 | |
| | 243,400 | | | Malayan Banking Bhd | | | 661,988 | |
| | 117,200 | | | Maxis Bhd | | | 172,103 | |
| | 74,000 | | | MISC Bhd | | | 134,876 | |
| | 172,600 | | | Petronas Chemicals Group Bhd | | | 363,674 | |
The accompanying notes are an integral part of these financial statements.
|
| Hartford Multifactor Emerging Markets ETF |
Schedule of Investments – (continued)
March 31, 2018 (Unaudited)
| | | | | | | | |
| Shares or Principal Amount | | Market Value† | |
| COMMON STOCKS - 96.2% - (continued) | | | |
| | | | Malaysia - 7.4% - (continued) | | | |
| | 76,600 | | | Public Bank Bhd | | $ | 475,284 | |
| | 242,700 | | | SP Setia Bhd Group | | | 187,609 | |
| | 69,700 | | | Telekom Malaysia Bhd | | | 93,882 | |
| | 113,000 | | | Tenaga Nasional Bhd | | | 472,099 | |
| | 205,658 | | | YTL Corp. Bhd | | | 71,247 | |
| | | | | | | | |
| | | | | | | 4,975,807 | |
| | | | | | | | |
| | | | Mexico - 3.9% | | | |
| | 94,243 | | | Alfa S.A.B. de C.V. Class A(2) | | | 120,298 | |
| | 520,248 | | | America Movil S.A.B. de C.V. Series L | | | 491,647 | |
| | 83,533 | | | Coca-Cola Femsa S.A.B. de C.V. Series L | | | 549,153 | |
| | 19,244 | | | Fomento Economico Mexicano S.A.B. de C.V. | | | 175,440 | |
| | 57,892 | | | Grupo Bimbo S.A.B. de C.V. Series A(2) | | | 126,894 | |
| | 1,108 | | | Grupo Elektra S.A.B. de C.V.(2) | | | 30,958 | |
| | 39,135 | | | Grupo Financiero Banorte S.A.B. de C.V. Series O | | | 236,395 | |
| | 41,226 | | | Grupo Mexico S.A.B. de C.V. Series B | | | 137,002 | |
| | 84,486 | | | Kimberly-Clark de Mexico S.A.B. de C.V. Class A | | | 157,831 | |
| | 20,094 | | | Mexichem S.A.B. de C.V. | | | 61,371 | |
| | 25,902 | | | Organizacion Soriana S.A.B. de C.V. Class B* | | | 51,652 | |
| | 186,285 | | | Wal-Mart de Mexico S.A.B. de C.V. | | | 469,450 | |
| | | | | | | | |
| | | | | | | 2,608,091 | |
| | | | | | | | |
| | | | Philippines - 5.4% | | | |
| | 252,030 | | | Aboitiz Equity Ventures, Inc. | | | 326,041 | |
| | 13,445 | | | Ayala Corp. | | | 244,279 | |
| | 178,500 | | | Ayala Land, Inc. | | | 140,604 | |
| | 195,270 | | | BDO Unibank, Inc. | | | 520,196 | |
| | 1,896,500 | | | Energy Development Corp. | | | 203,180 | |
| | 8,085 | | | GT Capital Holdings, Inc. | | | 181,139 | |
| | 151,940 | | | JG Summit Holdings, Inc. | | | 182,581 | |
| | 33,660 | | | Jollibee Foods Corp. | | | 192,887 | |
| | 1,967,200 | | | Metro Pacific Investments Corp. | | | 197,559 | |
| | 6,215 | | | PLDT, Inc. | | | 175,096 | |
| | 283,160 | | | Puregold Price Club, Inc. | | | 284,639 | |
| | 213,900 | | | Robinsons Retail Holdings, Inc. | | | 366,082 | |
| | 562,000 | | | Semirara Mining & Power Corp. | | | 326,359 | |
| | 166,600 | | | SM Prime Holdings, Inc. | | | 107,602 | |
| | 49,680 | | | Universal Robina Corp. | | | 144,724 | |
| | | | | | | | |
| | | | | | | 3,592,968 | |
| | | | | | | | |
| | | | Poland - 5.6% | | | |
| | 10,395 | | | Alior Bank S.A.* | | | 223,207 | |
| | 18,650 | | | Asseco Poland S.A. | | | 245,015 | |
| | 123,644 | | | Bank Millennium S.A.* | | | 296,359 | |
| | 7,876 | | | Bank Pekao S.A. | | | 283,511 | |
| | 1,918 | | | Bank Zachodni WBK S.A. | | | 202,814 | |
| | 6,120 | | | CD Projekt S.A. | | | 195,466 | |
| | 2,514 | | | Cyfrowy Polsat S.A. | | | 18,305 | |
| | 20,810 | | | Grupa Lotos S.A. | | | 320,780 | |
| | 1,594 | | | ING Bank Slaski S.A.* | | | 91,583 | |
| | 17 | | | LPP S.A. | | | 43,179 | |
| | 229 | | | mBank S.A.* | | | 27,999 | |
| | 67,484 | | | Orange Polska S.A.* | | | 114,269 | |
| | 38,912 | | | PGE Polska Grupa Energetyczna S.A.* | | | 112,579 | |
| | 18,408 | | | Polski Koncern Naftowy Orlen S.A. | | | 452,072 | |
| | 137,949 | | | Polskie Gornictwo Naftowe i Gazownictwo S.A. | | | 227,546 | |
| | 29,187 | | | Powszechna Kasa Oszczednosci Bank Polski S.A.* | | | 344,589 | |
| | 29,291 | | | Powszechny Zaklad Ubezpieczen S.A. | | | 357,020 | |
| | 293,234 | | | Tauron Polska Energia S.A.* | | | 208,028 | |
| | | | | | | | |
| | | | | | | 3,764,321 | |
| | | | | | | | |
| | | | | | | | |
| Shares or Principal Amount | | Market Value† | |
| COMMON STOCKS - 96.2% - (continued) | | | |
| | | | Russia - 3.0% | | | |
| | 58,137 | | | Gazprom PJSC ADR | | $ | 282,895 | |
| | 5,637 | | | Lukoil PJSC ADR | | | 388,389 | |
| | 9,732 | | | Magnit PJSC GDR | | | 179,410 | |
| | 13,237 | | | MMC Norilsk Nickel PJSC ADR | | | 245,348 | |
| | 623 | | | Novatek PJSC GDR | | | 85,351 | |
| | 17,207 | | | Sberbank of Russia PJSC ADR | | | 320,566 | |
| | 42,648 | | | Surgutneftegas OJSC ADR | | | 208,549 | |
| | 3,853 | | | Tatneft PJSC ADR | | | 243,201 | |
| | 97,000 | | | United Co. RUSAL plc | | | 58,707 | |
| | | | | | | | |
| | | | | | | 2,012,416 | |
| | | | | | | | |
| | | | South Africa - 5.9% | | | |
| | 2,789 | | | AngloGold Ashanti Ltd. | | | 26,485 | |
| | 2,389 | | | Aspen Pharmacare Holdings Ltd. | | | 52,314 | |
| | 23,470 | | | Barclays Africa Group Ltd. | | | 375,758 | |
| | 15,549 | | | Bidvest Group Ltd. | | | 294,084 | |
| | 52,818 | | | FirstRand Ltd.(2) | | | 298,219 | |
| | 7,377 | | | Mr. Price Group Ltd. | | | 177,440 | |
| | 22,569 | | | MTN Group Ltd.(2) | | | 226,704 | |
| | 14,346 | | | Nedbank Group Ltd.(2) | | | 345,721 | |
| | 200,278 | | | Redefine Properties Ltd. REIT | | | 195,904 | |
| | 19,452 | | | RMB Holdings Ltd. | | | 126,657 | |
| | 33,829 | | | Sanlam Ltd.(2) | | | 243,537 | |
| | 36,808 | | | Sappi Ltd. | | | 236,714 | |
| | 7,294 | | | Sasol Ltd. | | | 248,225 | |
| | 8,849 | | | Shoprite Holdings Ltd. | | | 188,634 | |
| | 23,041 | | | Standard Bank Group Ltd.(2) | | | 425,244 | |
| | 5,270 | | | Tiger Brands Ltd. | | | 165,456 | |
| | 9,717 | | | Vodacom Group Ltd. | | | 125,531 | |
| | 33,187 | | | Woolworths Holdings Ltd. | | | 168,053 | |
| | | | | | | | |
| | | | | | | 3,920,680 | |
| | | | | | | | |
| | | | South Korea - 9.9% | | | |
| | 234 | | | AmorePacific Group | | | 30,076 | |
| | 2,564 | | | BNK Financial Group, Inc. | | | 25,618 | |
| | 438 | | | CJ Corp. | | | 64,720 | |
| | 1,854 | | | Coway Co., Ltd. | | | 152,717 | |
| | 2,906 | | | Dongbu Insurance Co., Ltd. | | | 179,938 | |
| | 100 | | | E-Mart, Inc. | | | 25,378 | |
| | 3,568 | | | Hana Financial Group, Inc. | | | 152,642 | |
| | 2,492 | | | Hankook Tire Co., Ltd. | | | 122,975 | |
| | 3,412 | | | Hyundai Engineering & Construction Co., Ltd. | | | 136,365 | |
| | 642 | | | Hyundai Glovis Co., Ltd. | | | 109,620 | |
| | 673 | | | Hyundai Mobis Co., Ltd. | | | 160,373 | |
| | 990 | | | Hyundai Motor Co. | | | 133,282 | |
| | 9,717 | | | Industrial Bank of Korea | | | 142,213 | |
| | 862 | | | Kangwon Land, Inc. | | | 22,037 | |
| | 1,578 | | | KB Financial Group, Inc. | | | 91,195 | |
| | 9,764 | | | Kia Motors Corp. | | | 291,757 | |
| | 3,085 | | | Korea Electric Power Corp. | | | 95,221 | |
| | 209 | | | Korea Zinc Co., Ltd. | | | 94,510 | |
| | 1,943 | | | KT&G Corp. | | | 182,287 | |
| | 893 | | | LG Chem Ltd. | | | 323,387 | |
| | 1,885 | | | LG Corp. | | | 153,679 | |
| | 8,481 | | | LG Display Co., Ltd. | | | 205,680 | |
| | 4,003 | | | LG Electronics, Inc. | | | 409,351 | |
| | 118 | | | LG Household & Health Care Ltd. | | | 131,960 | |
| | 29,639 | | | LG Uplus Corp. | | | 342,021 | |
| | 304 | | | Lotte Chemical Corp. | | | 123,494 | |
| | 81 | | | NAVER Corp. | | | 59,730 | |
| | 143 | | | NCSoft Corp. | | | 55,005 | |
The accompanying notes are an integral part of these financial statements.
|
| Hartford Multifactor Emerging Markets ETF |
Schedule of Investments – (continued)
March 31, 2018 (Unaudited)
| | | | | | | | |
| Shares or Principal Amount | | Market Value† | |
| COMMON STOCKS - 96.2% - (continued) | | | |
| | | | South Korea - 9.9% - (continued) | | | |
| | 573 | | | POSCO | | $ | 181,162 | |
| | 152 | | | S-Oil Corp. | | | 17,041 | |
| | 266 | | | Samsung Electronics Co., Ltd. | | | 611,907 | |
| | 527 | | | Samsung Fire & Marine Insurance Co., Ltd. | | | 132,504 | |
| | 1,492 | | | Samsung Life Insurance Co., Ltd. | | | 161,672 | |
| | 3,098 | | | Shinhan Financial Group Co., Ltd. | | | 131,227 | |
| | 1,802 | | | SK Holdings Co., Ltd. | | | 504,641 | |
| | 4,911 | | | SK Hynix, Inc. | | | 369,972 | |
| | 695 | | | SK Innovation Co., Ltd. | | | 136,926 | |
| | 852 | | | SK Telecom Co., Ltd. | | | 183,845 | |
| | 14,636 | | | Woori Bank | | | 197,728 | |
| | | | | | | | |
| | | | | | | 6,645,856 | |
| | | | | | | | |
| | | | Taiwan - 10.1% | | | |
| | 23,000 | | | Asustek Computer, Inc. | | | 214,168 | |
| | 419,000 | | | AU Optronics Corp. | | | 194,001 | |
| | 8,000 | | | Catcher Technology Co., Ltd. | | | 99,187 | |
| | 106,000 | | | Cathay Financial Holding Co., Ltd. | | | 188,318 | |
| | 8,080 | | | Chailease Holding Co., Ltd. | | | 27,712 | |
| | 111,004 | | | Chang Hwa Commercial Bank Ltd. | | | 64,150 | |
| | 30,000 | | | Cheng Shin Rubber Industry Co., Ltd. | | | 48,719 | |
| | 38,230 | | | Chicony Electronics Co., Ltd. | | | 97,158 | |
| | 188,000 | | | China Development Financial Holding Corp. | | | 66,413 | |
| | 235,636 | | | China Life Insurance Co., Ltd. | | | 244,469 | |
| | 34,000 | | | China Steel Corp. | | | 27,054 | |
| | 32,000 | | | Chunghwa Telecom Co., Ltd. | | | 122,372 | |
| | 176,000 | | | Compal Electronics, Inc. | | | 119,820 | |
| | 200,628 | | | CTBC Financial Holding Co., Ltd. | | | 143,812 | |
| | 11,105 | | | Delta Electronics, Inc. | | | 49,513 | |
| | 91,418 | | | E.Sun Financial Holding Co., Ltd. | | | 61,453 | |
| | 67,540 | | | Far Eastern New Century Corp. | | | 60,806 | |
| | 63,000 | | | Far EasTone Telecommunications Co., Ltd.* | | | 166,375 | |
| | 296,091 | | | First Financial Holding Co., Ltd. | | | 205,640 | |
| | 35,301 | | | Foxconn Technology Co., Ltd. | | | 94,557 | |
| | 71,000 | | | Fubon Financial Holding Co., Ltd. | | | 121,998 | |
| | 6,000 | | | Giant Manufacturing Co., Ltd. | | | 31,485 | |
| | 118,030 | | | Hon Hai Precision Industry Co., Ltd. | | | 364,328 | |
| | 3,000 | | | Hotai Motor Co., Ltd. | | | 29,890 | |
| | 231,452 | | | Hua Nan Financial Holdings Co., Ltd. | | | 138,917 | |
| | 754,000 | | | Innolux Corp. | | | 329,715 | |
| | 213,000 | | | Inventec Corp. | | | 168,752 | |
| | 123,245 | | | Lite-On Technology Corp. | | | 172,037 | |
| | 10,000 | | | MediaTek, Inc. | | | 113,523 | |
| | 117,273 | | | Mega Financial Holding Co., Ltd. | | | 100,754 | |
| | 15,000 | | | Nan Ya Plastics Corp. | | | 42,083 | |
| | 27,000 | | | Novatek Microelectronics Corp. | | | 122,235 | |
| | 70,000 | | | Pegatron Corp. | | | 174,298 | |
| | 145,000 | | | Pou Chen Corp. | | | 192,458 | |
| | 15,000 | | | President Chain Store Corp. | | | 150,736 | |
| | 20,000 | | | Quanta Computer, Inc. | | | 40,333 | |
| | 143,000 | | | Radiant Opto-Electronics Corp. | | | 350,671 | |
| | 90,500 | | | Shanghai Commercial & Savings Bank Ltd. | | | 106,991 | |
| | 836,489 | | | Shin Kong Financial Holding Co., Ltd. | | | 317,015 | |
| | 173,091 | | | SinoPac Financial Holdings Co., Ltd. | | | 61,146 | |
| | 36,600 | | | Synnex Technology International Corp. | | | 54,604 | |
| | 27,000 | | | Taiwan Cement Corp. | | | 33,846 | |
| | 91,151 | | | Taiwan Cooperative Financial Holding Co., Ltd. | | | 53,615 | |
| | 34,000 | | | Taiwan Mobile Co., Ltd. | | | 127,105 | |
| | 49,000 | | | Taiwan Semiconductor Manufacturing Co., Ltd. | | | 410,056 | |
| | 93,000 | | | Teco Electric and Machinery Co., Ltd. | | | 76,711 | |
| | 49,800 | | | Uni-President Enterprises Corp. | | | 116,656 | |
| | | | | | | | |
| Shares or Principal Amount | | Market Value† | |
| COMMON STOCKS - 96.2% - (continued) | | | |
| | | | Taiwan - 10.1% - (continued) | | | |
| | 242,000 | | | United Microelectronics Corp. | | $ | 126,988 | |
| | 49,000 | | | Vanguard International Semiconductor Corp. | | | 106,715 | |
| | 89,871 | | | Wistron Corp. | | | 76,904 | |
| | 48,000 | | | WPG Holdings Ltd. | | | 62,064 | |
| | 212,757 | | | Yuanta Financial Holding Co., Ltd. | | | 97,414 | |
| | | | | | | | |
| | | | | | | 6,767,740 | |
| | | | | | | | |
| | | | Thailand - 8.6% | | | |
| | 53,066 | | | Advanced Info Service PCL NVDR | | | 349,587 | |
| | 197,000 | | | Bangkok Dusit Medical Services PCL NVDR | | | 148,049 | |
| | 3,100 | | | Bangkok Life Assurance PCL NVDR | | | 3,148 | |
| | 68,667 | | | Banpu PCL NVDR | | | 43,480 | |
| | 29,500 | | | Bumrungrad Hospital PCL NVDR | | | 195,283 | |
| | 12,300 | | | Central Pattana PCL NVDR | | | 30,878 | |
| | 193,800 | | | Charoen Pokphand Foods PCL NVDR | | | 156,490 | |
| | 37,100 | | | CP ALL PCL NVDR | | | 103,517 | |
| | 65,700 | | | Delta Electronics Thailand PCL NVDR | | | 139,195 | |
| | 7,300 | | | Glow Energy PCL NVDR | | | 19,843 | |
| | 59,200 | | | Indorama Ventures PCL NVDR | | | 107,438 | |
| | 659,900 | | | IRPC PCL NVDR | | | 152,999 | |
| | 67,900 | | | Kasikornbank PCL NVDR | | | 460,339 | |
| | 720,800 | | | Krung Thai Bank PCL NVDR | | | 437,966 | |
| | 563,500 | | | Land & Houses PCL NVDR | | | 191,017 | |
| | 35,960 | | | Minor International PCL NVDR | | | 43,699 | |
| | 6,400 | | | MK Restaurants Group PCL NVDR | | | 15,146 | |
| | 289,600 | | | Pruksa Holding PCL NVDR | | | 200,970 | |
| | 62,500 | | | PTT Exploration & Production PCL NVDR | | | 228,854 | |
| | 146,700 | | | PTT Global Chemical PCL NVDR | | | 444,510 | |
| | 30,900 | | | PTT PCL NVDR | | | 541,516 | |
| | 104,300 | | | Ratchaburi Electricity Generating Holding PCL NVDR | | | 171,776 | |
| | 88,700 | | | Siam Commercial Bank PCL NVDR | | | 407,050 | |
| | 371,200 | | | Thai Beverage PCL | | | 220,801 | |
| | 95,200 | | | Thai Oil PCL NVDR | | | 276,284 | |
| | 234,800 | | | Thai Union Group PCL NVDR | | | 140,414 | |
| | 3,441,600 | | | TMB Bank PCL NVDR | | | 277,353 | |
| | 156,600 | | | Total Access Communication PCL NVDR | | | 225,360 | |
| | | | | | | | |
| | | | | | | 5,732,962 | |
| | | | | | | | |
| | | | Turkey - 5.3% | | | |
| | 60,482 | | | Akbank TAS | | | 145,961 | |
| | 23,814 | | | Arcelik AS | | | 107,486 | |
| | 8,990 | | | BIM Birlesik Magazalar AS | | | 161,922 | |
| | 612,336 | | | Emlak Konut Gayrimenkul Yatirim Ortakligi AS REIT* | | | 391,076 | |
| | 112,704 | | | Enka Insaat ve Sanayi AS | | | 153,917 | |
| | 129,293 | | | Eregli Demir ve Celik Fabrikalari T.A.S. | | | 339,437 | |
| | 33,062 | | | Haci Omer Sabanci Holding AS | | | 87,467 | |
| | 50,516 | | | KOC Holding AS | | | 207,604 | |
| | 125,952 | | | Petkim Petrokimya Holding AS | | | 257,538 | |
| | 6,882 | | | Tofas Turk Otomobil Fabrikasi AS | | | 46,038 | |
| | 8,518 | | | Tupras Turkiye Petrol Rafinerileri AS | | | 236,313 | |
| | 74,036 | | | Turk Hava Yollari AO* | | | 362,760 | |
| | 59,661 | | | Turkcell Iletisim Hizmetleri AS | | | 226,812 | |
| | 70,194 | | | Turkiye Garanti Bankasi AS | | | 193,142 | |
| | 55,437 | | | Turkiye Halk Bankasi AS | | | 126,648 | |
| | 87,727 | | | Turkiye Is Bankasi AS | | | 157,897 | |
| | 60,549 | | | Turkiye Sise ve Cam Fabrikalari AS | | | 79,022 | |
| | 176,873 | | | Turkiye Vakiflar Bankasi TAO | | | 290,219 | |
| | | | | | | | |
| | | | | | | 3,571,259 | |
| | | | | | | | |
The accompanying notes are an integral part of these financial statements.
|
| Hartford Multifactor Emerging Markets ETF |
Schedule of Investments – (continued)
March 31, 2018 (Unaudited)
| | | | | | | | |
| Shares or Principal Amount | | Market Value† | |
| COMMON STOCKS - 96.2% - (continued) | | | |
| | | | United States - 0.5% | | | |
| | 7,222 | | | Yum China Holdings, Inc. | | $ | 299,713 | |
| | | | | | | | |
| | |
| | | | Total Common Stocks
(cost $56,946,963) | | $ | 64,388,031 | |
| | | | | | | | |
| PREFERRED STOCKS - 3.2% | | | |
| | | | Brazil - 2.2% | | | |
| | 27,143 | | | Banco Bradesco S.A. | | $ | 322,586 | |
| | 37,132 | | | Itau Unibanco Holding S.A. | | | 573,247 | |
| | 55,829 | | | Itausa - Investimentos Itau S.A. | | | 231,641 | |
| | 41,304 | | | Petroleo Brasileiro S.A.* | | | 266,073 | |
| | 4,282 | | | Telefonica Brasil S.A. | | | 64,933 | |
| | | | | | | | |
| | | | | | | 1,458,480 | |
| | | | | | | | |
| | | | Chile - 0.1% | | | |
| | 9,856 | | | Embotelladora Andina S.A. Class B | | | 48,395 | |
| | 275 | | | Sociedad Quimica y Minera de Chile S.A. Class B | | | 13,394 | |
| | | | | | | | |
| | | | | | | 61,789 | |
| | | | | | | | |
| | | | Colombia - 0.9% | | | |
| | 41,783 | | | Banco Davivienda S.A., 3.17% | | | 450,576 | |
| | 15,074 | | | Bancolombia S.A., 3.18% | | | 158,020 | |
| | | | | | | | |
| | | | | | | 608,596 | |
| | | | | | | | |
| | |
| | | | Total Preferred Stocks
(cost $1,586,052) | | $ | 2,128,865 | |
| | | | | | | | |
| | |
| | | | Total Long-Term Investments
(cost $58,533,015) | | $ | 66,516,896 | |
| | | | | | | | |
| SHORT-TERM INVESTMENTS - 1.8% | | | |
| | | | Securities Lending Collateral - 1.8% | | | |
| | 1,247,147 | | | State Street Navigator Securities Lending Government Money Market Portfolio,
1.72%(3) | | $ | 1,247,147 | |
| | | | | | | | |
| | |
| | | | Total Short-Term Investments
(cost $1,247,147) | | $ | 1,247,147 | |
| | | | | | | | |
| | | | | | | | | | | | |
| | | |
| | | | Total Investments
(cost $59,780,162) | | | 101.2 | % | | $ | 67,764,043 | |
| | | | Other Assets and Liabilities | | | (1.2 | )% | | | (833,412 | ) |
| | | | | | | | | | | | |
| | | | Total Net Assets | | | 100.0 | % | | $ | 66,930,631 | |
| | | | | | | | | | | | |
The accompanying notes are an integral part of these financial statements.
|
| Hartford Multifactor Emerging Markets ETF |
Schedule of Investments – (continued)
March 31, 2018 (Unaudited)
| Note: | Percentage of investments as shown is the ratio of the total market value to total net assets. |
| | The Fund may refer to any one or more of the industry classifications used by one or more widely recognized market indices, ratings group and/or as defined by Fund management. Industry classifications may not be identical across all security types. |
| | For Fund compliance purposes, the Fund may not use the same classification system shown in this report as these classifications are used for financial reporting purposes. |
| (1) | Securities issued within terms of a private placement memorandum and exempt from registration under Rule 144A under the Securities Act of 1933, as amended, and may be sold to qualified institutional buyers. Unless otherwise indicated, these holdings are determined to be liquid. At March 31, 2018, the aggregate value of these securities was $645,326, which represented 1.0% of total net assets. |
| (2) | Represents entire or partial securities on loan. See Note 7 in the accompanying Notes to Financial Statements for securities lending information. |
| (3) | Current yield as of period end. |
| † | See Significant Accounting Policies of accompanying Notes to Financial Statements regarding valuation of investments. |
| | |
| GLOSSARY: (abbreviations used in preceding Schedule of Investments) |
|
| Other Abbreviations: |
ADR | | American Depositary Receipt |
GDR | | Global Depositary Receipt |
NVDR | | Non-Voting Depositary Receipt |
OJSC | | Open Joint Stock Company |
PJSC | | Private Joint Stock Company |
REIT | | Real Estate Investment Trust |
The accompanying notes are an integral part of these financial statements.
|
| Hartford Multifactor Emerging Markets ETF |
Schedule of Investments – (continued)
March 31, 2018 (Unaudited)
Fair Valuation Summary
The following is a summary of the fair valuations according to the inputs used as of March 31, 2018 in valuing the Fund’s investments.
| | | | | | | | | | | | | | | | |
| | | Total | | | Level 1(1) | | | Level 2(1) | | | Level 3(1) | |
Assets | |
Common Stocks | |
Brazil | | $ | 1,562,098 | | | $ | 1,562,098 | | | $ | — | | | $ | — | |
Chile | | | 2,994,819 | | | | 2,994,819 | | | | — | | | | — | |
China | | | 5,352,460 | | | | 5,352,460 | | | | — | | | | — | |
Colombia | | | 1,434,401 | | | | 1,434,401 | | | | — | | | | — | |
Hong Kong | | | 516,035 | | | | 516,035 | | | | — | | | | — | |
India | | | 4,140,058 | | | | 4,140,058 | | | | — | | | | — | |
Indonesia | | | 4,496,347 | | | | 4,496,347 | | | | — | | | | — | |
Malaysia | | | 4,975,807 | | | | 4,975,807 | | | | — | | | | — | |
Mexico | | | 2,608,091 | | | | 2,608,091 | | | | — | | | | — | |
Philippines | | | 3,592,968 | | | | 3,592,968 | | | | — | | | | — | |
Poland | | | 3,764,321 | | | | 3,764,321 | | | | — | | | | — | |
Russia | | | 2,012,416 | | | | 2,012,416 | | | | — | | | | — | |
South Africa | | | 3,920,680 | | | | 3,920,680 | | | | — | | | | — | |
South Korea | | | 6,645,856 | | | | 6,645,856 | | | | — | | | | — | |
Taiwan | | | 6,767,740 | | | | 6,767,740 | | | | — | | | | — | |
Thailand | | | 5,732,962 | | | | 5,732,962 | | | | — | | | | — | |
Turkey | | | 3,571,259 | | | | 3,571,259 | | | | — | | | | — | |
United States | | | 299,713 | | | | 299,713 | | | | — | | | | — | |
Preferred Stocks | | | 2,128,865 | | | | 2,128,865 | | | | — | | | | — | |
Short-Term Investments | | | 1,247,147 | | | | 1,247,147 | | | | — | | | | — | |
| | | | | | | | | | | | | | | | |
Total | | $ | 67,764,043 | | | $ | 67,764,043 | | | $ | — | | | $ | — | |
| | | | | | | | | | | | | | | | |
| (1) | For the six-month period ended March 31, 2018, there were no transfers between any levels. |
The accompanying notes are an integral part of these financial statements.
|
| Hartford Multifactor Global Small Cap ETF |
Schedule of Investments
March 31, 2018 (Unaudited)
| | | | | | | | |
| Shares or Principal Amount | | Market Value† | |
| COMMON STOCKS - 98.4% | | | |
| | | | Australia - 4.9% | | | |
| | 36,731 | | | Abacus Property Group(1) | | $ | 97,765 | |
| | 63,906 | | | Australian Pharmaceutical Industries Ltd. | | | 73,529 | |
| | 10,810 | | | Automotive Holdings Group Ltd.(1) | | | 29,104 | |
| | 4,553 | | | BWP Trust REIT(1) | | | 10,547 | |
| | 10,092 | | | Charter Hall Retail REIT(1) | | | 29,803 | |
| | 62,085 | | | Cromwell Property Group REIT(1) | | | 50,718 | |
| | 27,937 | | | CSR Ltd.(1) | | | 111,003 | |
| | 14,940 | | | Downer EDI Ltd. | | | 73,457 | |
| | 11,053 | | | Elders Ltd. | | | 63,247 | |
| | 25,531 | | | Genworth Mortgage Insurance Australia Ltd.(1) | | | 45,238 | |
| | 14,900 | | | Investa Office Fund | | | 49,259 | |
| | 3,094 | | | JB Hi-Fi Ltd.(1) | | | 61,254 | |
| | 18,636 | | | Metcash Ltd.(1) | | | 44,742 | |
| | 8,204 | | | Mineral Resources Ltd. | | | 106,916 | |
| | 1,411 | | | Monadelphous Group Ltd. | | | 16,451 | |
| | 8,762 | | | New Hope Corp. Ltd. | | | 14,114 | |
| | 3,617 | | | Northern Star Resources Ltd. | | | 17,423 | |
| | 17,352 | | | Regis Resources Ltd.(1) | | | 60,294 | |
| | 1,882 | | | Sandfire Resources NL(1) | | | 10,567 | |
| | 4,682 | | | Shopping Centres Australasia Property Group REIT(1) | | | 8,368 | |
| | 36,711 | | | St. Barbara Ltd.(1) | | | 112,355 | |
| | | | | | | | |
| | | | | | | 1,086,154 | |
| | | | | | | | |
| | | | Belgium - 0.4% | | | |
| | 21,365 | | | AGFA-Gevaert N.V.* | | | 82,664 | |
| | 210 | | | Tessenderlo Chemie N.V.* | | | 8,794 | |
| | | | | | | | |
| | | | | | | 91,458 | |
| | | | | | | | |
| | | | Bermuda - 0.6% | | | |
| | 961 | | | Argo Group International Holdings Ltd. | | | 55,182 | |
| | 1,586 | | | DHT Holdings, Inc.(1) | | | 5,392 | |
| | 349 | | | Enstar Group Ltd.* | | | 73,377 | |
| | | | | | | | |
| | | | | | | 133,951 | |
| | | | | | | | |
| | | | Brazil - 1.4% | | | |
| | 3,800 | | | Cia de Gas de Sao Paulo - COMGAS Class A, (Preference Shares) | | | 66,977 | |
| | 3,000 | | | Cia de Transmissao de Energia Eletrica Paulista (Preference Shares) | | | 60,025 | |
| | 1,800 | | | Cia Ferro Ligas da Bahia - FERBASA (Preference Shares) | | | 11,487 | |
| | 1,538 | | | Cia Hering | | | 9,551 | |
| | 8,133 | | | EDP - Energias do Brasil S.A. | | | 32,570 | |
| | 84 | | | Grendene S.A. | | | 692 | |
| | 21,365 | | | MRV Engenharia e Participacoes S.A. | | | 104,459 | |
| | 4,084 | | | Odontoprev S.A. | | | 18,346 | |
| | | | | | | | |
| | | | | | | 304,107 | |
| | | | | | | | |
| | | | Canada - 5.0% | | | |
| | 2,121 | | | Aecon Group, Inc. | | | 30,205 | |
| | 2,928 | | | BRP, Inc. | | | 112,373 | |
| | 2,156 | | | Canfor Corp.* | | | 49,082 | |
| | 7,142 | | | Cascades, Inc. | | | 73,844 | |
| | 1,475 | | | Celestica, Inc.* | | | 15,251 | |
| | 1,740 | | | Colliers International Group, Inc. | | | 120,710 | |
| | 1,354 | | | Domtar Corp. | | | 57,599 | |
| | 478 | | | FirstService Corp. | | | 35,003 | |
| | 6,319 | | | Intertape Polymer Group, Inc.(1) | | | 101,506 | |
| | 2,469 | | | Just Energy Group, Inc. | | | 10,897 | |
| | 2,846 | | | Killam Apartment Real Estate Investment Trust REIT | | | 30,640 | |
| | | | | | | | |
| Shares or Principal Amount | | Market Value† | |
| COMMON STOCKS - 98.4% - (continued) | | | |
| | | | Canada - 5.0% - (continued) | | | |
| | 6,239 | | | Mercer International, Inc. | | $ | 77,676 | |
| | 2,395 | | | New Flyer Industries, Inc. | | | 108,785 | |
| | 2,439 | | | North West Co., Inc.(1) | | | 51,135 | |
| | 666 | | | Parkland Fuel Corp.(1) | | | 14,976 | |
| | 2,443 | | | Spin Master Corp.*(2) | | | 100,505 | |
| | 5,044 | | | Transcontinental, Inc. Class A | | | 99,569 | |
| | 357 | | | Uni-Select, Inc.(1) | | | 5,538 | |
| | 8,203 | | | Western Forest Products, Inc. | | | 16,479 | |
| | | | | | | | |
| | | | | | | 1,111,773 | |
| | | | | | | | |
| | | | China - 9.8% | | | |
| | 42,522 | | | BAIC Motor Corp. Ltd. Class H(2) | | | 52,121 | |
| | 138,435 | | | Chaowei Power Holdings Ltd. | | | 74,789 | |
| | 26,753 | | | China BlueChemical Ltd. Class H | | | 7,499 | |
| | 8,000 | | | China Eastern Airlines Corp. Ltd. Class H | | | 5,810 | |
| | 15,531 | | | China Lesso Group Holdings Ltd. | | | 11,814 | |
| | 19,025 | | | China Oriental Group Co., Ltd. | | | 12,945 | |
| | 87,000 | | | China SCE Property Holdings Ltd. | | | 45,006 | |
| | 91,622 | | | CSC Financial Co., Ltd. Class H(2) | | | 76,232 | |
| | 44,356 | | | Dongfeng Motor Group Co., Ltd. Class H | | | 51,487 | |
| | 43,000 | | | Dongyue Group Ltd. | | | 41,475 | |
| | 83,242 | | | Great Wall Motor Co., Ltd. Class H | | | 83,472 | |
| | 72,459 | | | Guangshen Railway Co., Ltd. H Shares | | | 42,839 | |
| | 47,566 | | | Guangzhou R&F Properties Co., Ltd. Class H | | | 118,668 | |
| | 97,000 | | | Hisense Kelon Electrical Holdings Co., Ltd. Class H | | | 110,616 | |
| | 56,400 | | | JNBY Design Ltd. | | | 114,549 | |
| | 3,000 | | | KWG Property Holding Ltd. | | | 4,090 | |
| | 31,300 | | | Legend Holdings Corp. Class H(2) | | | 103,492 | |
| | 139,646 | | | Metallurgical Corp. of China Ltd. Class H | | | 39,857 | |
| | 28,000 | | | Powerlong Real Estate Holdings Ltd. | | | 14,734 | |
| | 100,814 | | | Red Star Macalline Group Corp. Ltd. Class H(2) | | | 118,049 | |
| | 120,000 | | | Shandong Weigao Group Medical Polymer Co., Ltd. Class H | | | 79,966 | |
| | 85,082 | | | Shenzhen Expressway Co., Ltd. Class H | | | 86,618 | |
| | 51,215 | | | Sinotrans Ltd. Class H | | | 28,125 | |
| | 118,219 | | | Tianneng Power International Ltd. | | | 139,935 | |
| | 89,303 | | | Times China Holdings, Ltd. | | | 136,544 | |
| | 35,402 | | | TravelSky Technology Ltd. Class H | | | 102,620 | |
| | 106,706 | | | Weichai Power Co., Ltd. Class H | | | 119,645 | |
| | 4,885 | | | Xingda International Holdings Ltd. | | | 1,650 | |
| | 150,314 | | | Xtep International Holdings Ltd. | | | 83,505 | |
| | 66,000 | | | Yadea Group Holdings Ltd.(2) | | | 22,453 | |
| | 28,137 | | | Yangtze Optical Fibre and Cable Joint Stock Ltd. Co. Class H(2) | | | 130,140 | |
| | 155,705 | | | Yuzhou Properties Co., Ltd. | | | 106,140 | |
| | | | | | | | |
| | | | | | | 2,166,885 | |
| | | | | | | | |
| | | | Denmark - 0.8% | | | |
| | 1,387 | | | Bakkafrost P/F(1) | | | 75,790 | |
| | 224 | | | Dfds A/S | | | 12,499 | |
| | 7,471 | | | Spar Nord Bank A/S | | | 88,628 | |
| | | | | | | | |
| | | | | | | 176,917 | |
| | | | | | | | |
| | | | Finland - 0.1% | | | |
| | 1,269 | | | Finnair Oyj | | | 17,636 | |
| | | | | | | | |
| | | | France - 0.7% | | | |
| | 1,682 | | | Gaztransport Et Technigaz S.A. | | | 105,292 | |
| | 186 | | | Groupe Fnac S.A.* | | | 19,913 | |
| | 1,015 | | | Neopost S.A. | | | 26,714 | |
| | | | | | | | |
| | | | | | | 151,919 | |
| | | | | | | | |
The accompanying notes are an integral part of these financial statements.
|
| Hartford Multifactor Global Small Cap ETF |
Schedule of Investments – (continued)
March 31, 2018 (Unaudited)
| | | | | | | | |
| Shares or Principal Amount | | Market Value† | |
| COMMON STOCKS - 98.4% - (continued) | | | |
| | | | Georgia - 0.5% | | | |
| | 2,097 | | | BGEO Group plc | | $ | 104,606 | |
| | | | | | | | |
| | | | Germany - 0.2% | | | |
| | 269 | | | Cewe Stiftung & Co. KGAA | | | 26,433 | |
| | 6,451 | | | Heidelberger Druckmaschinen AG* | | | 24,151 | |
| | | | | | | | |
| | | | | | | 50,584 | |
| | | | | | | | |
| | | | Hong Kong - 1.2% | | | |
| | 180,000 | | | Get Nice Financial Group Ltd. | | | 31,650 | |
| | 792,000 | | | Global Brands Group Holding Ltd.* | | | 44,402 | |
| | 28,000 | | | Huabao International Holdings Ltd. | | | 18,552 | |
| | 11,000 | | | K Wah International Holdings Ltd. | | | 7,302 | |
| | 36,000 | | | Road King Infrastructure Ltd. | | | 71,190 | |
| | 41,120 | | | Shenzhen Investment Ltd. | | | 17,447 | |
| | 33,000 | | | SmarTone Telecommunications Holdings Ltd. | | | 35,109 | |
| | 1,681 | | | Tongda Hong Tai Holdings Ltd.* | | | 334 | |
| | 53,515 | | | Yuexiu Real Estate Investment Trust | | | 37,094 | |
| | | | | | | | |
| | | | | | | 263,080 | |
| | | | | | | | |
| | | | Ireland - 0.1% | | | |
| | 11,821 | | | Green REIT plc REIT | | | 22,011 | |
| | | | | | | | |
| | | | Israel - 1.7% | | | |
| | 5,900 | | | ADO Group Ltd.* | | | 113,300 | |
| | 76,140 | | | Oil Refineries Ltd. | | | 35,177 | |
| | 512 | | | Paz Oil Co., Ltd. | | | 75,177 | |
| | 6,362 | | | Phoenix Holdings Ltd.* | | | 34,901 | |
| | 3,674 | | | Plus500 Ltd. | | | 58,754 | |
| | 2,094 | | | Tower Semiconductor Ltd.* | | | 56,363 | |
| | | | | | | | |
| | | | | | | 373,672 | |
| | | | | | | | |
| | | | Italy - 1.3% | | | |
| | 11,320 | | | Banca Farmafactoring S.p.A.*(2) | | | 82,696 | |
| | 242 | | | Banca IFIS S.p.A | | | 9,310 | |
| | 683 | | | El.En. S.p.A. | | | 27,216 | |
| | 3,315 | | | Enav S.p.A.(2) | | | 17,669 | |
| | 61,519 | | | Juventus Football Club S.p.A.*(1) | | | 48,838 | |
| | 44,931 | | | Saras S.p.A | | | 98,526 | |
| | | | | | | | |
| | | | | | | 284,255 | |
| | | | | | | | |
| | | | Japan - 13.4% | | | |
| | 115 | | | Adastria Co., Ltd. | | | 2,346 | |
| | 367 | | | Alpine Electronics, Inc.(1) | | | 6,850 | |
| | 2,381 | | | Amano Corp. | | | 63,046 | |
| | 1,932 | | | AOKI Holdings, Inc. | | | 29,302 | |
| | 2,605 | | | Arcs Co., Ltd. | | | 63,025 | |
| | 500 | | | Canon Electronics, Inc. | | | 10,954 | |
| | 2,976 | | | CKD Corp. | | | 63,522 | |
| | 257 | | | cocokara fine, Inc. | | | 17,737 | |
| | 256 | | | Daishi Bank Ltd. | | | 11,350 | |
| | 1,000 | | | Daiwabo Holdings Co., Ltd. | | | 42,783 | |
| | 3,149 | | | Doutor Nichires Holdings Co., Ltd. | | | 74,321 | |
| | 1,800 | | | DTS Corp. | | | 62,116 | |
| | 1,758 | | | Dydo Group Holdings, Inc. | | | 110,423 | |
| | 1,057 | | | Foster Electric Co., Ltd. | | | 25,652 | |
| | 3,667 | | | Fuji Machine Manufacturing Co., Ltd. | | | 71,513 | |
| | 400 | | | Fujitsu General Ltd. | | | 7,112 | |
| | 6,221 | | | Geo Holdings Corp.(1) | | | 98,039 | |
| | 1,967 | | | Heiwado Co., Ltd. | | | 47,441 | |
| | 3,868 | | | Hitachi Maxell Ltd. | | | 73,214 | |
| | 2,147 | | | Inaba Denki Sangyo Co., Ltd. | | | 93,975 | |
| | 5,800 | | | Itochu Enex Co., Ltd. | | | 54,373 | |
| | 400 | | | JCU Corp. | | | 9,346 | |
| | | | | | | | |
| Shares or Principal Amount | | Market Value† | |
| COMMON STOCKS - 98.4% - (continued) | | | |
| | | | Japan - 13.4% - (continued) | | | |
| | 4,600 | | | Kaga Electronics Co., Ltd. | | $ | 116,914 | |
| | 821 | | | Kanematsu Corp. | | | 10,939 | |
| | 2,100 | | | KH Neochem Co., Ltd. | | | 60,423 | |
| | 2,068 | | | Kokuyo Co., Ltd. | | | 39,863 | |
| | 2,481 | | | KYORIN Holdings, Inc. | | | 46,634 | |
| | 1,569 | | | Kyowa Exeo Corp. | | | 41,383 | |
| | 1,537 | | | Kyudenko Corp. | | | 74,574 | |
| | 4,300 | | | Leopalace21 Corp. | | | 35,015 | |
| | 2,478 | | | Maeda Road Construction Co., Ltd. | | | 49,187 | |
| | 6,200 | | | Marvelous, Inc.(1) | | | 53,051 | |
| | 3,991 | | | MCJ Co., Ltd.(1) | | | 51,299 | |
| | 899 | | | Megmilk Snow Brand Co., Ltd. | | | 24,311 | |
| | 5,360 | | | Ministop Co., Ltd. | | | 109,619 | |
| | 3,423 | | | Mirait Holdings Corp.(1) | | | 54,330 | |
| | 341 | | | Mochida Pharmaceutical Co., Ltd. | | | 24,112 | |
| | 2,669 | | | NEC Networks & System Integration Corp. | | | 68,689 | |
| | 8,329 | | | NET One Systems Co., Ltd. | | | 120,921 | |
| | 1,845 | | | Nichiha Corp.(1) | | | 69,047 | |
| | 973 | | | Nihon Unisys Ltd. | | | 20,805 | |
| | 361 | | | Nojima Corp. | | | 8,625 | |
| | 2,160 | | | Noritz Corp. | | | 38,935 | |
| | 2,500 | | | Oki Electric Industry Co., Ltd.(1) | | | 32,722 | |
| | 869 | | | PAL GROUP Holdings Co., Ltd. | | | 23,582 | |
| | 1,361 | | | Paramount Bed Holdings Co., Ltd.(1) | | | 68,594 | |
| | 4,278 | | | Plenus Co., Ltd.(1) | | | 82,825 | |
| | 200 | | | Shindengen Electric Manufacturing Co., Ltd. | | | 12,844 | |
| | 600 | | | Solasto Corp. | | | 16,102 | |
| | 639 | | | St Marc Holdings Co., Ltd. | | | 18,536 | |
| | 3,169 | | | Sumitomo Bakelite Co., Ltd. | | | 27,682 | |
| | 4,219 | | | T-Gaia Corp. | | | 117,624 | |
| | 474 | | | Taikisha Ltd. | | | 15,354 | |
| | 3,008 | | | Takuma Co., Ltd. | | | 32,668 | |
| | 913 | | | Toho Holdings Co., Ltd.(1) | | | 21,522 | |
| | 718 | | | Token Corp.(1) | | | 71,091 | |
| | 200 | | | Tokyo Seimitsu Co., Ltd. | | | 7,964 | |
| | 3,730 | | | Toppan Forms Co., Ltd. | | | 40,860 | |
| | 100 | | | Towa Pharmaceutical Co., Ltd. | | | 6,319 | |
| | 11,000 | | | Toyo Construction Co., Ltd. | | | 49,751 | |
| | 196 | | | Unipres Corp. | | | 4,383 | |
| | 1,728 | | | Valor Holdings Co., Ltd. | | | 46,844 | |
| | 1,200 | | | Wakita & Co., Ltd. | | | 13,224 | |
| | 4,500 | | | Yamazen Corp. | | | 46,206 | |
| | 1,400 | | | Yuasa Trading Co., Ltd. | | | 45,416 | |
| | | | | | | | |
| | | | | | | 2,959,229 | |
| | | | | | | | |
| | | | Luxembourg - 0.2% | | | |
| | 1,201 | | | Altisource Portfolio Solutions S.A.* | | | 31,898 | |
| | | | | | | | |
| | | | Netherlands - 0.8% | | | |
| | 537 | | | BE Semiconductor Industries N.V. | | | 54,849 | |
| | 178 | | | Cimpress N.V.* | | | 27,536 | |
| | 2,656 | | | ForFarmers N.V. | | | 37,042 | |
| | 5,339 | | | PostNL N.V. | | | 19,974 | |
| | 627 | | | TKH Group N.V. | | | 40,098 | |
| | | | | | | | |
| | | | | | | 179,499 | |
| | | | | | | | |
| | | | New Zealand - 0.4% | | | |
| | 27,523 | | | Chorus Ltd. | | | 79,420 | |
| | 13,062 | | | Kiwi Property Group Ltd. | | | 12,627 | |
| | | | | | | | |
| | | | | | | 92,047 | |
| | | | | | | | |
The accompanying notes are an integral part of these financial statements.
|
| Hartford Multifactor Global Small Cap ETF |
Schedule of Investments – (continued)
March 31, 2018 (Unaudited)
| | | | | | | | |
| Shares or Principal Amount | | Market Value† | |
| COMMON STOCKS - 98.4% - (continued) | | | |
| | | | Portugal - 0.0% | | | |
| | 409 | | | REN - Redes Energeticas Nacionais SGPS S.A. | | $ | 1,261 | |
| | | | | | | | |
| | | | Puerto Rico - 0.5% | | | |
| | 4,300 | | | Triple-S Management Corp. Class B* | | | 112,402 | |
| | | | | | | | |
| | | | Singapore - 0.8% | | | |
| | 1,144 | | | China Yuchai International Ltd. | | | 24,218 | |
| | 10,017 | | | Frasers Centrepoint Trust | | | 16,729 | |
| | 2,889 | | | Kulicke & Soffa Industries, Inc.* | | | 72,254 | |
| | 4,600 | | | M1 Ltd.(1) | | | 6,104 | |
| | 41,900 | | | Yanlord Land Group Ltd. | | | 54,001 | |
| | | | | | | | |
| | | | | | | 173,306 | |
| | | | | | | | |
| | | | South Africa - 1.0% | | | |
| | 4,849 | | | Barloworld Ltd. | | | 67,959 | |
| | 2,868 | | | Mondi Ltd. | | | 77,996 | |
| | 12,776 | | | Reunert Ltd. | | | 80,308 | |
| | | | | | | | |
| | | | | | | 226,263 | |
| | | | | | | | |
| | | | South Korea - 6.2% | | | |
| | 3,298 | | | Aekyung Petrochemical Co., Ltd. | | | 45,483 | |
| | 398 | | | AK Holdings, Inc. | | | 26,847 | |
| | 4,179 | | | Cheil Worldwide, Inc. | | | 71,356 | |
| | 147 | | | CJ O Shopping Co., Ltd. | | | 30,823 | |
| | 261 | | | Com2uSCorp | | | 45,692 | |
| | 667 | | | Daesang Corp. | | | 16,176 | |
| | 3,657 | | | DGB Financial Group, Inc. | | | 39,970 | |
| | 1,460 | | | Dongbu HiTek Co., Ltd. | | | 19,861 | |
| | 626 | | | GS Home Shopping, Inc. | | | 110,353 | |
| | 548 | | | GS Retail Co., Ltd. | | | 15,783 | |
| | 331 | | | Hanwha Corp. | | | 12,220 | |
| | 3,038 | | | Hyundai Marine & Fire Insurance Co., Ltd. | | | 111,869 | |
| | 4,421 | | | JB Financial Group Co., Ltd. | | | 25,218 | |
| | 179 | | | Korea Petrochemical Ind Co., Ltd. | | | 49,037 | |
| | 7,651 | | | Korean Reinsurance Co. | | | 81,829 | |
| | 3,991 | | | LF Corp. | | | 99,410 | |
| | 928 | | | LG Hausys Ltd. | | | 67,212 | |
| | 1,310 | | | LS Industrial Systems Co., Ltd. | | | 75,338 | |
| | 173 | | | Mando Corp. | | | 37,411 | |
| | 5,322 | | | Meritz Fire & Marine Insurance Co., Ltd. | | | 105,601 | |
| | 81 | | | NongShim Co., Ltd. | | | 22,798 | |
| | 4,921 | | | Orion Holdings Corp. | | | 123,960 | |
| | 255 | | | S&T Motiv Co., Ltd. | | | 9,402 | |
| | 331 | | | S-1 Corp. | | | 29,811 | |
| | 156 | | | Samsung Card Co., Ltd. | | | 5,247 | |
| | 1,377 | | | Silicon Works Co., Ltd. | | | 49,156 | |
| | 554 | | | Soulbrain Co., Ltd. | | | 30,353 | |
| | | | | | | | |
| | | | | | | 1,358,216 | |
| | | | | | | | |
| | | | Spain - 0.4% | | | |
| | 1,228 | | | Lar Espana Real Estate Socimi S.A. REIT | | | 14,725 | |
| | 2,282 | | | Tecnicas Reunidas S.A.(1) | | | 67,328 | |
| | | | | | | | |
| | | | | | | 82,053 | |
| | | | | | | | |
| | | | Sweden - 0.8% | | | |
| | 5,827 | | | Bilia AB Class A | | | 51,488 | |
| | 7,164 | | | Nobina AB(2) | | | 46,064 | |
| | 33,727 | | | SAS AB* | | | 79,739 | |
| | | | | | | | |
| | | | | | | 177,291 | |
| | | | | | | | |
| | | | Switzerland - 1.5% | | | |
| | 186 | | | Autoneum Holding AG | | | 50,501 | |
| | 572 | | | Implenia AG | | | 45,248 | |
| | 25 | | | Schweiter Technologies AG | | | 29,658 | |
| | | | | | | | |
| Shares or Principal Amount | | Market Value† | |
| COMMON STOCKS - 98.4% - (continued) | | | |
| | | | Switzerland - 1.5% - (continued) | | | |
| | 18 | | | Schweizerische Nationalbank | | $ | 141,729 | |
| | 136 | | | Valiant Holding AG | | | 16,077 | |
| | 155 | | | Valora Holding AG | | | 52,929 | |
| | | | | | | | |
| | | | | | | 336,142 | |
| | | | | | | | |
| | | | Taiwan - 3.6% | | | |
| | 12,211 | | | Accton Technology Corp. | | | 39,786 | |
| | 13,000 | | | Chicony Power Technology Co., Ltd. | | | 26,440 | |
| | 21,000 | | | Coretronic Corp. | | | 31,186 | |
| | 17,496 | | | Elite Material Co., Ltd. | | | 57,426 | |
| | 11,199 | | | Everlight Electronics Co., Ltd. | | | 17,208 | |
| | 208 | | | FLEXium Interconnect, Inc. | | | 713 | |
| | 49,563 | | | Gigabyte Technology Co., Ltd. | | | 115,421 | |
| | 137,000 | | | HannStar Display Corp. | | | 47,222 | |
| | 35,000 | | | Micro-Star International Co., Ltd. | | | 117,279 | |
| | 15,469 | | | Powertech Technology, Inc. | | | 48,226 | |
| | 36,637 | | | Primax Electronics Ltd. | | | 80,921 | |
| | 19,548 | | | Realtek Semiconductor Corp. | | | 84,140 | |
| | 12,871 | | | Tripod Technology Corp. | | | 43,305 | |
| | 60,400 | | | Wan Hai Lines Ltd. | | | 37,081 | |
| | 3,434 | | | Wistron NeWeb Corp. | | | 8,998 | |
| | 16,083 | | | WT Microelectronics Co., Ltd. | | | 25,980 | |
| | | | | | | | |
| | | | | | | 781,332 | |
| | | | | | | | |
| | | | Thailand - 0.3% | | | |
| | 2,006 | | | Fabrinet*(1) | | | 62,948 | |
| | | | | | | | |
| | | | United Kingdom - 3.9% | | | |
| | 1,050 | | | Big Yellow Group plc REIT | | | 12,564 | |
| | 36,095 | | | Coats Group plc | | | 38,786 | |
| | 9,747 | | | Dart Group plc | | | 113,828 | |
| | 11,334 | | | Debenhams plc(1) | | | 3,320 | |
| | 1,592 | | | Electrocomponents plc | | | 13,404 | |
| | 48,883 | | | Firstgroup plc* | | | 56,298 | |
| | 1,848 | | | Go-Ahead Group plc | | | 45,470 | |
| | 5,582 | | | Greggs plc | | | 96,236 | |
| | 902 | | | Halfords Group plc | | | 4,125 | |
| | 36,959 | | | Hansteen Holdings plc REIT | | | 66,156 | |
| | 31,975 | | | JRP Group plc | | | 61,092 | |
| | 8,233 | | | Moneysupermarket.com Group plc | | | 33,123 | |
| | 16,665 | | | OneSavings Bank plc | | | 87,199 | |
| | 12,338 | | | Safestore Holdings plc REIT | | | 84,981 | |
| | 6,929 | | | Sports Direct International plc* | | | 35,731 | |
| | 10,247 | | | UNITE Group plc | | | 113,774 | |
| | | | | | | | |
| | | | | | | 866,087 | |
| | | | | | | | |
| | | | United States - 35.9% | | | |
| | 1,978 | | | Aaron’s, Inc. | | | 92,175 | |
| | 1,785 | | | Abercrombie & Fitch Co. Class A | | | 43,215 | |
| | 820 | | | ACCO Brands Corp. | | | 10,291 | |
| | 427 | | | Almost Family, Inc.* | | | 23,912 | |
| | 1,053 | | | Amedisys, Inc.* | | | 63,538 | |
| | 3,182 | | | American Eagle Outfitters, Inc. | | | 63,417 | |
| | 824 | | | American National Insurance Co. | | | 96,375 | |
| | 75 | | | American Outdoor Brands Corp.* | | | 774 | |
| | 160 | | | American Woodmark Corp.*(1) | | | 15,752 | |
| | 4,050 | | | Amkor Technology, Inc.* | | | 41,026 | |
| | 2,044 | | | AMN Healthcare Services, Inc.*(1) | | | 115,997 | |
| | 1,786 | | �� | Anika Therapeutics, Inc.* | | | 88,800 | |
| | 1,119 | | | Arch Coal, Inc. Class A | | | 102,814 | |
| | 1,184 | | | Argan, Inc. | | | 50,853 | |
| | 46 | | | Atrion Corp. | | | 29,040 | |
The accompanying notes are an integral part of these financial statements.
|
| Hartford Multifactor Global Small Cap ETF |
Schedule of Investments – (continued)
March 31, 2018 (Unaudited)
| | | | | | | | |
| Shares or Principal Amount | | Market Value† | |
| COMMON STOCKS - 98.4% - (continued) | | | |
| | | | United States - 35.9% - (continued) | | | |
| | 1,216 | | | AVX Corp. | | $ | 20,125 | |
| | 2,338 | | | Banc of California, Inc.(1) | | | 45,123 | |
| | 2,184 | | | Benchmark Electronics, Inc. | | | 65,192 | |
| | 1,051 | | | Big Lots, Inc.(1) | | | 45,750 | |
| | 2,733 | | | BioTelemetry, Inc.*(1) | | | 84,860 | |
| | 450 | | | Blackstone Mortgage Trust, Inc. Class A REIT(1) | | | 14,139 | |
| | 1,692 | | | Boise Cascade Co. | | | 65,311 | |
| | 176 | | | Boston Beer Co., Inc. Class A* | | | 33,273 | |
| | 223 | | | Briggs & Stratton Corp. | | | 4,774 | |
| | 2,828 | | | Buckle, Inc.(1) | | | 62,640 | |
| | 2,346 | | | Byline Bancorp, Inc.*(1) | | | 53,794 | |
| | 327 | | | CACI International, Inc. Class A* | | | 49,491 | |
| | 674 | | | Cambrex Corp.* | | | 35,250 | |
| | 98 | | | Capella Education Co. | | | 8,560 | |
| | 430 | | | Chemed Corp.(1) | | | 117,330 | |
| | 18 | | | Chesapeake Utilities Corp. | | | 1,266 | |
| | 395 | | | Chico’s FAS, Inc. | | | 3,571 | |
| | 779 | | | Children’s Place, Inc.(1) | | | 105,360 | |
| | 725 | | | Cincinnati Bell, Inc.*(1) | | | 10,041 | |
| | 122 | | | Coca-Cola Bottling Co. Consolidated(1) | | | 21,066 | |
| | 255 | | | Compass Minerals International, Inc.(1) | | | 15,376 | |
| | 511 | | | CONMED Corp. | | | 32,362 | |
| | 1,480 | | | Convergys Corp. | | | 33,478 | |
| | 496 | | | Cooper Tire & Rubber Co.(1) | | | 14,533 | |
| | 985 | | | Cooper-Standard Holdings, Inc.* | | | 120,968 | |
| | 2,319 | | | Corvel Corp.* | | | 117,225 | |
| | 980 | | | CSG Systems International, Inc. | | | 44,384 | |
| | 2,551 | | | CVR Energy, Inc.(1) | | | 77,091 | |
| | 1,356 | | | Dean Foods Co.(1) | | | 11,689 | |
| | 1,381 | | | Delek U.S. Holdings, Inc. | | | 56,207 | |
| | 819 | | | Dolby Laboratories, Inc. Class A | | | 52,056 | |
| | 385 | | | Douglas Dynamics, Inc. | | | 16,690 | |
| | 812 | | | DSW, Inc. Class A | | | 18,237 | |
| | 1,989 | | | Eagle Pharmaceuticals, Inc.*(1) | | | 104,800 | |
| | 792 | | | EchoStar Corp. Class A* | | | 41,794 | |
| | 2,117 | | | Emergent Biosolutions, Inc.* | | | 111,460 | |
| | 1,258 | | | Employers Holdings, Inc. | | | 50,886 | |
| | 2,118 | | | Ensign Group, Inc. | | | 55,703 | |
| | 1,217 | | | ePlus, Inc.* | | | 94,561 | |
| | 1,218 | | | Express, Inc.* | | | 8,721 | |
| | 47 | | | Farmer Brothers Co.* | | | 1,419 | |
| | 1,225 | | | FB Financial Corp.* | | | 49,723 | |
| | 1,037 | | | FBL Financial Group, Inc. Class A | | | 71,916 | |
| | 2,520 | | | First Interstate BancSystem, Inc. Class A | | | 99,666 | |
| | 4,431 | | | Forestar Group, Inc.*(1) | | | 93,716 | |
| | 1,539 | | | Genesco, Inc.* | | | 62,483 | |
| | 2,489 | | | Geo Group, Inc. REIT | | | 50,950 | |
| | 1,013 | | | Getty Realty Corp. REIT | | | 25,548 | |
| | 2,352 | | | Globus Medical, Inc. Class A Class A* | | | 117,177 | |
| | 413 | | | GMS, Inc.* | | | 12,621 | |
| | 423 | | | Greenbrier Cos., Inc.(1) | | | 21,256 | |
| | 739 | | | Greif, Inc. Class A | | | 38,613 | |
| | 360 | | | Guess?, Inc.(1) | | | 7,466 | |
| | 2,682 | | | H&E Equipment Services, Inc. | | | 103,230 | |
| | 1,906 | | | Hawaiian Holdings, Inc. | | | 73,762 | |
| | 2,454 | | | Heritage Financial Corp. | | | 75,092 | |
| | 726 | | | HFF, Inc. Class A, REIT | | | 36,082 | |
| | 1,199 | | | Horace Mann Educators Corp. | | | 51,257 | |
| | 149 | | | Hub Group, Inc. Class A* | | | 6,236 | |
| | 44 | | | ICF International, Inc. | | | 2,572 | |
| | 541 | | | Ichor Holdings Ltd.*(1) | | | 13,098 | |
| | | | | | | | |
| Shares or Principal Amount | | Market Value† | |
| COMMON STOCKS - 98.4% - (continued) | | | |
| | | | United States - 35.9% - (continued) | | | |
| | 904 | | | II-VI, Inc.*(1) | | $ | 36,974 | |
| | 230 | | | Infinity Property & Casualty Corp. | | | 27,232 | |
| | 1,292 | | | Ingles Markets, Inc. Class A | | | 43,734 | |
| | 1,398 | | | Innospec, Inc. | | | 95,903 | |
| | 4,338 | | | Inovalon Holdings, Inc. Class A* | | | 45,983 | |
| | 2,107 | | | Insight Enterprises, Inc.* | | | 73,597 | |
| | 1,721 | | | Insperity, Inc. | | | 119,696 | |
| | 176 | | | John B Sanfilippo & Son, Inc. | | | 10,185 | |
| | 566 | | | Kaman Corp. | | | 35,160 | |
| | 332 | | | Kelly Services, Inc. Class A | | | 9,641 | |
| | 2,029 | | | KEMET Corp.* | | | 36,786 | |
| | 980 | | | Kraton Corp.* | | | 46,756 | |
| | 3,002 | | | Lantheus Holdings, Inc.* | | | 47,732 | |
| | 1,663 | | | LHC Group, Inc.* | | | 102,374 | |
| | 1,354 | | | LifePoint Health, Inc.* | | | 63,638 | |
| | 1,170 | | | LSC Communications, Inc. | | | 20,416 | |
| | 4,459 | | | Luminex Corp. | | | 93,951 | |
| | 1,115 | | | Magellan Health, Inc.* | | | 119,416 | |
| | 736 | | | ManTech International Corp. Class A | | | 40,826 | |
| | 3,663 | | | Marcus & Millichap, Inc. REIT* | | | 132,088 | |
| | 2,503 | | | Match Group, Inc.*(1) | | | 111,233 | |
| | 9,017 | | | McDermott International, Inc.*(1) | | | 54,914 | |
| | 87 | | | Meredith Corp.(1) | | | 4,681 | |
| | 2,083 | | | Meridian Bioscience, Inc. | | | 29,579 | |
| | 2,353 | | | Meritor, Inc.* | | | 48,378 | |
| | 1,163 | | | MFA Financial, Inc. REIT | | | 8,757 | |
| | 58 | | | MicroStrategy, Inc. Class A* | | | 7,481 | |
| | 553 | | | MoneyGram International, Inc.* | | | 4,767 | |
| | 381 | | | MSG Networks, Inc. Class A* | | | 8,611 | |
| | 3,002 | | | Myriad Genetics, Inc.* | | | 88,709 | |
| | 834 | | | National Presto Industries, Inc.(1) | | | 78,187 | |
| | 318 | | | National Western Life Group, Inc. Class A | | | 96,952 | |
| | 178 | | | Neenah, Inc. | | | 13,955 | |
| | 116 | | | NETGEAR, Inc.* | | | 6,635 | |
| | 7 | | | Northwest Natural Gas Co. | | | 404 | |
| | 184 | | | NuVasive, Inc.* | | | 9,607 | |
| | 8,087 | | | Office Depot, Inc. | | | 17,387 | |
| | 1,288 | | | Oritani Financial Corp. | | | 19,771 | |
| | 2,068 | | | Owens & Minor, Inc.(1) | | | 32,157 | |
| | 3,428 | | | Par Pacific Holdings, Inc.* | | | 58,859 | |
| | 2,878 | | | PBF Energy, Inc. Class A | | | 97,564 | |
| | 1,443 | | | PennyMac Financial Services, Inc. Class A* | | | 32,684 | |
| | 1,879 | | | Philbro Animal Health Corp. Class A | | | 74,596 | |
| | 2,252 | | | Photronics, Inc.* | | | 18,579 | |
| | 314 | | | Plexus Corp.* | | | 18,755 | |
| | 4,308 | | | Quality Systems, Inc.* | | | 58,804 | |
| | 1,247 | | | REX American Resources Corp.* | | | 90,782 | |
| | 1,708 | | | RMR Group, Inc. REIT | | | 119,475 | |
| | 5,903 | | | RPX Corp. | | | 63,103 | |
| | 196 | | | Safety Insurance Group, Inc. | | | 15,063 | |
| | 631 | | | Sanderson Farms, Inc.(1) | | | 75,102 | |
| | 2,160 | | | Sanmina Corp.* | | | 56,484 | |
| | 1,665 | | | Schneider National, Inc. Class B(1) | | | 43,390 | |
| | 30 | | | Scholastic Corp. | | | 1,165 | |
| | 1,755 | | | Schweitzer-Mauduit International, Inc. | | | 68,708 | |
| | 523 | | | Select Income REIT | | | 10,188 | |
| | 600 | | | Select Medical Holdings Corp.* | | | 10,350 | |
| | 1,631 | | | Selective Insurance Group, Inc. | | | 99,002 | |
| | 1,685 | | | Sleep Number Corp.* | | | 59,228 | |
| | 829 | | | SMART Global Holdings, Inc.*(1) | | | 41,317 | |
| | 3,150 | | | Steelcase, Inc. Class A | | | 42,840 | |
The accompanying notes are an integral part of these financial statements.
|
| Hartford Multifactor Global Small Cap ETF |
Schedule of Investments – (continued)
March 31, 2018 (Unaudited)
| | | | | | | | |
| Shares or Principal Amount | | Market Value† | |
| COMMON STOCKS - 98.4% - (continued) | | | |
| | | | United States - 35.9% - (continued) | | | |
| | 903 | | | Stepan Co. | | $ | 75,112 | |
| | 187 | | | Sturm Ruger & Co., Inc. | | | 9,817 | |
| | 2,294 | | | Summit Hotel Properties, Inc. REIT | | | 31,221 | |
| | 2,955 | | | Sunstone Hotel Investors, Inc. REIT(1) | | | 44,975 | |
| | 506 | | | Supernus Pharmaceuticals, Inc.* | | | 23,175 | |
| | 2,939 | | | Sykes Enterprises, Inc.* | | | 85,055 | |
| | 2,430 | | | Syntel, Inc.* | | | 62,038 | |
| | 2,124 | | | TriCo Bancshares | | | 79,055 | |
| | 513 | | | Trinseo S.A. | | | 37,988 | |
| | 10,400 | | | TrustCo Bank Corp. | | | 87,880 | |
| | 1,025 | | | TTEC Holdings, Inc. | | | 31,467 | |
| | 403 | | | TTM Technologies, Inc.* | | | 6,162 | |
| | 426 | | | U.S. Physical Therapy, Inc. | | | 34,634 | |
| | 1,534 | | | Ultra Clean Holdings, Inc.* | | | 29,529 | |
| | 3 | | | UniFirst Corp. | | | 485 | |
| | 2,066 | | | United States Cellular Corp.* | | | 83,033 | |
| | 710 | | | Universal Corp.(1) | | | 34,435 | |
| | 119 | | | Usana Health Sciences, Inc.* | | | 10,222 | |
| | 2,887 | | | Varex Imaging Corp.* | | | 103,297 | |
| | 1,363 | | | Verso Corp. Class A* | | | 22,953 | |
| | 265 | | | Viad Corp. | | | 13,899 | |
| | 2,583 | | | Vonage Holdings Corp.* | | | 27,509 | |
| | 640 | | | Wabash National Corp.(1) | | | 13,318 | |
| | 1,097 | | | Walker & Dunlop, Inc. | | | 65,184 | |
| | 3,510 | | | Warrior Met Coal, Inc.(1) | | | 98,315 | |
| | 666 | | | Weis Markets, Inc.(1) | | | 27,293 | |
| | | | | | | | |
| | | | | | | 7,915,341 | |
| | | | | | | | |
| | |
| | | | Total Common Stocks
(cost $18,721,541) | | $ | 21,694,323 | |
| | | | | | | | |
| PREFERRED STOCKS - 1.2% | |
| | | | Brazil - 0.3% | | | |
| | 2,558 | | | Banco do Estado do Rio Grande do Sul S.A. Class B, 4.34% | | $ | 15,601 | |
| | 6,884 | | | Gol Linhas Aereas Inteligentes S.A.* | | | 44,842 | |
| | | | | | | | |
| | | | | | | 60,443 | |
| | | | | | | | |
| | | | Germany - 0.9% | | | |
| | 2,352 | | | Jungheinrich AG, 1.38% | | | 104,018 | |
| | 6,560 | | | Schaeffler AG, 4.39% | | | 101,130 | |
| | | | | | | | |
| | | | | | | 205,148 | |
| | | | | | | | |
| | |
| | | | Total Preferred Stocks
(cost $226,007) | | $ | 265,591 | |
| | | | | | | | |
| | |
| | | | Total Long-Term Investments
(cost $18,947,548) | | $ | 21,959,914 | |
| | | | | | | | |
| | | | | | | | |
| Shares or Principal Amount | | Market Value† | |
| SHORT-TERM INVESTMENTS - 4.1% | |
| | | | Securities Lending Collateral - 4.1% | | | |
| | 903,887 | | | State Street Navigator Securities Lending Government Money Market Portfolio, 1.72%(3) | | $ | 903,887 | |
| | | | | | | | |
| | |
| | | | Total Short-Term Investments
(cost $903,887) | | $ | 903,887 | |
| | | | | | | | |
| | | | | | | | | | | | |
| | | |
| | | | Total Investments
(cost $19,851,435) | | | 103.7 | % | | $ | 22,863,801 | |
| | | | Other Assets and Liabilities | | | (3.7 | )% | | | (824,943 | ) |
| | | | | | | | | | | | |
| | | | Total Net Assets | | | 100.0 | % | | $ | 22,038,858 | |
| | | | | | | | | | | | |
The accompanying notes are an integral part of these financial statements.
|
| Hartford Multifactor Global Small Cap ETF |
Schedule of Investments – (continued)
March 31, 2018 (Unaudited)
| Note: | Percentage of investments as shown is the ratio of the total market value to total net assets. |
| | The Fund may refer to any one or more of the industry classifications used by one or more widely recognized market indices, ratings group and/or as defined by Fund management. Industry classifications may not be identical across all security types. |
| | For Fund compliance purposes, the Fund may not use the same classification system shown in this report as these classifications are used for financial reporting purposes. |
| (1) | Represents entire or partial securities on loan. See Note 7 in the accompanying Notes to Financial Statements for securities lending information. |
| (2) | Securities issued within terms of a private placement memorandum and exempt from registration under Rule 144A under the Securities Act of 1933, as amended, and may be sold to qualified institutional buyers. Unless otherwise indicated, these holdings are determined to be liquid. At March 31, 2018, the aggregate value of these securities was $749,421, which represented 3.4% of total net assets. |
| (3) | Current yield as of period end. |
| † | See Significant Accounting Policies of accompanying Notes to Financial Statements regarding valuation of investments. |
| | |
| GLOSSARY: (abbreviations used in preceding Schedule of Investments) |
|
| Other Abbreviations: |
REIT | | Real Estate Investment Trust |
The accompanying notes are an integral part of these financial statements.
|
| Hartford Multifactor Global Small Cap ETF |
Schedule of Investments – (continued)
March 31, 2018 (Unaudited)
Fair Valuation Summary
The following is a summary of the fair valuations according to the inputs used as of March 31, 2018 in valuing the Fund’s investments.
| | | | | | | | | | | | | | | | |
| | | Total | | | Level 1(1) | | | Level 2(1) | | | Level 3(1) | |
Assets | |
Common Stocks | |
Australia | | $ | 1,086,154 | | | $ | 1,086,154 | | | $ | — | | | $ | — | |
Belgium | | | 91,458 | | | | 91,458 | | | | — | | | | — | |
Bermuda | | | 133,951 | | | | 133,951 | | | | — | | | | — | |
Brazil | | | 304,107 | | | | 304,107 | | | | — | | | | — | |
Canada | | | 1,111,773 | | | | 1,111,773 | | | | — | | | | — | |
China | | | 2,166,885 | | | | 2,166,885 | | | | — | | | | — | |
Denmark | | | 176,917 | | | | 176,917 | | | | — | | | | — | |
Finland | | | 17,636 | | | | 17,636 | | | | — | | | | — | |
France | | | 151,919 | | | | 151,919 | | | | — | | | | — | |
Georgia | | | 104,606 | | | | 104,606 | | | | — | | | | — | |
Germany | | | 50,584 | | | | 50,584 | | | | — | | | | — | |
Hong Kong | | | 263,080 | | | | 263,080 | | | | — | | | | — | |
Ireland | | | 22,011 | | | | 22,011 | | | | — | | | | — | |
Israel | | | 373,672 | | | | 373,672 | | | | — | | | | — | |
Italy | | | 284,255 | | | | 284,255 | | | | — | | | | — | |
Japan | | | 2,959,229 | | | | 2,959,229 | | | | — | | | | — | |
Luxembourg | | | 31,898 | | | | 31,898 | | | | — | | | | — | |
Netherlands | | | 179,499 | | | | 179,499 | | | | — | | | | — | |
New Zealand | | | 92,047 | | | | 92,047 | | | | — | | | | — | |
Portugal | | | 1,261 | | | | 1,261 | | | | — | | | | — | |
Puerto Rico | | | 112,402 | | | | 112,402 | | | | — | | | | — | |
Singapore | | | 173,306 | | | | 173,306 | | | | — | | | | — | |
South Africa | | | 226,263 | | | | 226,263 | | | | — | | | | — | |
South Korea | | | 1,358,216 | | | | 1,358,216 | | | | — | | | | — | |
Spain | | | 82,053 | | | | 82,053 | | | | — | | | | — | |
Sweden | | | 177,291 | | | | 177,291 | | | | — | | | | — | |
Switzerland | | | 336,142 | | | | 336,142 | | | | — | | | | — | |
Taiwan | | | 781,332 | | | | 781,332 | | | | — | | | | — | |
Thailand | | | 62,948 | | | | 62,948 | | | | — | | | | — | |
United Kingdom | | | 866,087 | | | | 866,087 | | | | — | | | | — | |
United States | | | 7,915,341 | | | | 7,915,341 | | | | — | | | | — | |
Preferred Stocks | | | 265,591 | | | | 265,591 | | | | — | | | | — | |
Short-Term Investments | | | 903,887 | | | | 903,887 | | | | — | | | | — | |
| | | | | | | | | | | | | | | | |
Total | | $ | 22,863,801 | | | $ | 22,863,801 | | | $ | — | | | $ | — | |
| | | | | | | | | | | | | | | | |
| (1) | For the six-month period ended March 31, 2018, there were no transfers between Level 1 and Level 2, and investments valued at $87,562 were transferred from Level 3 to Level 1 due to the expiration of trading restrictions. |
| Note: | For purposes of reporting transfers between different hierarchy levels, both transfers in and out of each level, as applicable, are shown as if they occurred at the beginning of the period. |
The accompanying notes are an integral part of these financial statements.
|
| Hartford Multifactor Low Volatility International Equity ETF |
Schedule of Investments
March 31, 2018 (Unaudited)
| | | | | | | | |
| Shares or Principal Amount | | Market Value† | |
| COMMON STOCKS - 99.3% | | | |
| | | | Australia - 5.4% | | | |
| | 4,606 | | | Adelaide Brighton Ltd.(1) | | $ | 21,975 | |
| | 1,049 | | | AGL Energy Ltd. | | | 17,444 | |
| | 2,185 | | | Amcor Ltd. | | | 23,749 | |
| | 1,572 | | | Aristocrat Leisure Ltd. | | | 29,012 | |
| | 1,005 | | | Australia & New Zealand Banking Group Ltd. | | | 20,706 | |
| | 1,014 | | | Caltex Australia Ltd. | | | 24,423 | |
| | 582 | | | CIMIC Group Ltd. | | | 19,852 | |
| | 76 | | | Cochlear Ltd. | | | 10,588 | |
| | 135 | | | Commonwealth Bank of Australia | | | 7,488 | |
| | 230 | | | CSL Ltd. | | | 27,426 | |
| | 5,067 | | | DuluxGroup Ltd. | | | 28,683 | |
| | 479 | | | GPT Group REIT | | | 1,742 | |
| | 971 | | | National Australia Bank Ltd. | | | 21,220 | |
| | 1,212 | | | Sonic Healthcare Ltd. | | | 21,271 | |
| | 2,023 | | | Stockland REIT | | | 6,254 | |
| | 867 | | | Tabcorp Holdings Ltd. | | | 2,919 | |
| | 154 | | | Wesfarmers Ltd. | | | 4,909 | |
| | 295 | | | Westpac Banking Corp. | | | 6,476 | |
| | | | | | | | |
| | | | | | | 296,137 | |
| | | | | | | | |
| | | | Austria - 0.1% | | | |
| | 74 | | | Voestalpine AG | | | 3,874 | |
| | | | | | | | |
| | | | Belgium - 0.1% | | | |
| | 28 | | | Cofinimmo S.A. REIT | | | 3,629 | |
| | | | | | | | |
| | | | Brazil - 1.1% | | | |
| | 4,109 | | | Ambev S.A. | | | 29,758 | |
| | 1,500 | | | Fibria Celulose S.A. | | | 29,349 | |
| | 200 | | | WEG S.A. | | | 1,361 | |
| | | | | | | | |
| | | | | | | 60,468 | |
| | | | | | | | |
| | | | Canada - 8.7% | | | |
| | 208 | | | Alimentation Couche-Tard, Inc. Class B | | | 9,304 | |
| | 259 | | | Bank of Montreal | | | 19,551 | |
| | 313 | | | Bank of Nova Scotia | | | 19,267 | |
| | 741 | | | BCE, Inc. | | | 31,864 | |
| | 1,510 | | | CAE, Inc. | | | 28,086 | |
| | 190 | | | Canadian Imperial Bank of Commerce | | | 16,759 | |
| | 274 | | | Canadian National Railway Co. | | | 20,012 | |
| | 199 | | | Canadian Tire Corp. Ltd. Class A | | | 26,147 | |
| | 410 | | | CCL Industries, Inc. Class B | | | 20,684 | |
| | 261 | | | Dollarama, Inc. | | | 31,699 | |
| | 380 | | | Enbridge, Inc. | | | 11,943 | |
| | 11 | | | George Weston Ltd. | | | 885 | |
| | 202 | | | Imperial Oil Ltd. | | | 5,346 | |
| | 137 | | | Inter Pipeline(1) | | | 2,376 | |
| | 122 | | | Loblaw Cos. Ltd. | | | 6,159 | |
| | 41 | | | Onex Corp. | | | 2,955 | |
| | 1,129 | | | Parkland Fuel Corp. | | | 25,387 | |
| | 228 | | | Pembina Pipeline Corp. | | | 7,109 | |
| | 682 | | | RioCan REIT | | | 12,505 | |
| | 609 | | | Rogers Communications, Inc. Class B | | | 27,180 | |
| | 230 | | | Royal Bank of Canada | | | 17,754 | |
| | 316 | | | Shaw Communications, Inc. Class B | | | 6,084 | |
| | 874 | | | Suncor Energy, Inc. | | | 30,160 | |
| | 800 | | | TELUS Corp. | | | 28,072 | |
| | 97 | | | Thomson Reuters Corp. | | | 3,749 | |
| | 316 | | | Toronto-Dominion Bank | | | 17,920 | |
| | 601 | | | TransCanada Corp. | | | 24,837 | |
| | 500 | | | WSP Global, Inc. | | | 23,013 | |
| | | | | | | | |
| | | | | | | 476,807 | |
| | | | | | | | |
| | | | | | | | |
| Shares or Principal Amount | | Market Value† | |
| COMMON STOCKS - 99.3% - (continued) | | | |
| | | | Chile - 0.2% | | | |
| | 54,486 | | | Enersis Americas S.A. | | $ | 12,727 | |
| | | | | | | | |
| | | | China - 5.3% | | | |
| | 1,000 | | | AAC Technologies Holdings, Inc. | | | 18,042 | |
| | 36,000 | | | Agricultural Bank of China Ltd. Class H | | | 20,458 | |
| | 14,000 | | | China Construction Bank Corp. Class H | | | 14,377 | |
| | 6,500 | | | China Merchants Bank Co., Ltd. Class H | | | 26,627 | |
| | 15,000 | | | Country Garden Holdings Co., Ltd. | | | 30,885 | |
| | 14,000 | | | CSPC Pharmaceutical Group Ltd. | | | 37,193 | |
| | 7,200 | | | Fuyao Glass Industry Group Co., Ltd. Class H(2) | | | 27,751 | |
| | 18,000 | | | Jiangsu Expressway Co., Ltd. Class H | | | 25,458 | |
| | 3,000 | | | Shenzhou International Group Holdings Ltd. | | | 31,593 | |
| | 600 | | | Tencent Holdings Ltd. | | | 31,314 | |
| | 21,000 | | | Zall Group Ltd.* | | | 29,808 | |
| | | | | | | | |
| | | | | | | 293,506 | |
| | | | | | | | |
| | | | Denmark - 2.0% | | | |
| | 715 | | | Danske Bank A/S | | | 26,590 | |
| | 360 | | | DSV A/S | | | 28,172 | |
| | 743 | | | GN Store Nord AS | | | 26,161 | |
| | 552 | | | Novo Nordisk A/S Class B | | | 27,095 | |
| | | | | | | | |
| | | | | | | 108,018 | |
| | | | | | | | |
| | | | Finland - 0.1% | | | |
| | 138 | | | Kone Oyj Class B | | | 6,879 | |
| | | | | | | | |
| | | | France - 3.6% | | | |
| | 239 | | | Air Liquide S.A. | | | 29,241 | |
| | 26 | | | Cie Generale des Etablissements Michelin SCA | | | 3,834 | |
| | 46 | | | Hermes International | | | 27,240 | |
| | 71 | | | L’Oreal S.A. | | | 16,010 | |
| | 99 | | | LVMH Moet Hennessy Louis Vuitton SE | | | 30,463 | |
| | 259 | | | Safran S.A. | | | 27,387 | |
| | 56 | | | Sanofi | | | 4,499 | |
| | 223 | | | Sodexo S.A. | | | 22,462 | |
| | 39 | | | Thales S.A. | | | 4,746 | |
| | 528 | | | Total S.A. | | | 29,955 | |
| | | | | | | | |
| | | | | | | 195,837 | |
| | | | | | | | |
| | | | Germany - 3.0% | | | |
| | 120 | | | adidas AG | | | 29,022 | |
| | 92 | | | Allianz SE | | | 20,751 | |
| | 291 | | | BASF SE | | | 29,515 | |
| | 1,067 | | | Deutsche Telekom AG | | | 17,387 | |
| | 161 | | | Fresenius Medical Care AG & Co. KGaA | | | 16,430 | |
| | 265 | | | SAP SE | | | 27,693 | |
| | 85 | | | Siemens AG | | | 10,822 | |
| | 202 | | | United Internet AG | | | 12,695 | |
| | | | | | | | |
| | | | | | | 164,315 | |
| | | | | | | | |
| | | | Hong Kong - 5.8% | | | |
| | 1,500 | | | China Mobile Ltd. | | | 13,751 | |
| | 16,000 | | | CITIC Ltd. | | | 22,384 | |
| | 1,500 | | | CK Hutchison Holdings Ltd. | | | 17,947 | |
| | 2,000 | | | CK Infrastructure Holdings Ltd. | | | 16,348 | |
| | 2,500 | | | CLP Holdings Ltd. | | | 25,451 | |
| | 1,100 | | | Dairy Farm International Holdings Ltd.(1) | | | 8,745 | |
| | 8,000 | | | Guangdong Investment Ltd. | | | 12,579 | |
| | 600 | | | Hang Seng Bank Ltd. | | | 13,883 | |
| | 9,600 | | | Hong Kong & China Gas Co., Ltd. | | | 19,718 | |
| | 1,000 | | | Hopewell Holdings Ltd. | | | 3,816 | |
| | 300 | | | Jardine Strategic Holdings Ltd. | | | 11,502 | |
| | 3,500 | | | Link REIT | | | 29,879 | |
The accompanying notes are an integral part of these financial statements.
|
| Hartford Multifactor Low Volatility International Equity ETF |
Schedule of Investments – (continued)
March 31, 2018 (Unaudited)
| | | | | | | | |
| Shares or Principal Amount | | Market Value† | |
| COMMON STOCKS - 99.3% - (continued) | | | |
| | | | Hong Kong - 5.8% - (continued) | | | |
| | 3,500 | | | MTR Corp. Ltd. | | $ | 18,819 | |
| | 3,000 | | | Orient Overseas International Ltd. | | | 27,140 | |
| | 1,000 | | | Power Assets Holdings Ltd. | | | 8,913 | |
| | 2,000 | | | Swire Pacific Ltd. Class A | | | 20,170 | |
| | 800 | | | Swire Properties Ltd. | | | 2,803 | |
| | 1,900 | | | VTech Holdings Ltd. | | | 23,991 | |
| | 24,000 | | | Zhongyu Gas Holdings Ltd.* | | | 23,180 | |
| | | | | | | | |
| | | | | | | 321,019 | |
| | | | | | | | |
| | | | India - 2.0% | | | |
| | 112 | | | HDFC Bank Ltd. ADR | | | 11,062 | |
| | 1,656 | | | Infosys Ltd. ADR(1) | | | 29,560 | |
| | 598 | | | Reliance Industries Ltd. GDR(2) | | | 16,206 | |
| | 4,862 | | | Wipro Ltd. ADR(1) | | | 25,088 | |
| | 629 | | | WNS Holdings Ltd. ADR* | | | 28,512 | |
| | | | | | | | |
| | | | | | | 110,428 | |
| | | | | | | | |
| | | | Indonesia - 2.5% | | | |
| | 48,000 | | | Astra International Tbk PT | | | 25,451 | |
| | 100 | | | Bank Central Asia Tbk PT | | | 169 | |
| | 33,200 | | | Bank Negara Indonesia Persero Tbk PT | | | 20,920 | |
| | 66,485 | | | Chandra Asri Petrochemical Tbk PT | | | 30,061 | |
| | 7,900 | | | Indofood CBP Sukses Makmur Tbk PT | | | 4,748 | |
| | 127,500 | | | Kalbe Farma Tbk PT | | | 13,891 | |
| | 67,100 | | | Telekomunikasi Indonesia Persero Tbk PT | | | 17,546 | |
| | 7,400 | | | Unilever Indonesia Tbk PT | | | 26,620 | |
| | | | | | | | |
| | | | | | | 139,406 | |
| | | | | | | | |
| | | | Ireland - 1.1% | | | |
| | 754 | | | CRH plc | | | 25,566 | |
| | 1,242 | | | Experian plc | | | 26,787 | |
| | 92 | | | Paddy Power Betfair plc | | | 9,442 | |
| | | | | | | | |
| | | | | | | 61,795 | |
| | | | | | | | |
| | | | Israel - 1.3% | | | |
| | 315 | | | Alony Hetz Properties & Investments Ltd. | | | 2,836 | |
| | 102 | | | Azrieli Group Ltd. | | | 4,884 | |
| | 116 | | | Elbit Systems Ltd. | | | 13,910 | |
| | 276 | | | Nice Ltd. | | | 25,605 | |
| | 152 | | | Paz Oil Co., Ltd. | | | 22,318 | |
| | | | | | | | |
| | | | | | | 69,553 | |
| | | | | | | | |
| | | | Italy - 1.2% | | | |
| | 1,797 | | | Eni S.p.A. | | | 31,577 | |
| | 87 | | | Luxottica Group S.p.A. | | | 5,403 | |
| | 777 | | | Recordati S.p.A. | | | 28,649 | |
| | | | | | | | |
| | | | | | | 65,629 | |
| | | | | | | | |
| | | | Japan - 16.1% | | | |
| | 1,200 | | | Alfresa Holdings Corp.(1) | | | 26,731 | |
| | 100 | | | Aoyama Trading Co., Ltd. | | | 3,912 | |
| | 100 | | | Asahi Group Holdings Ltd. | | | 5,350 | |
| | 1,600 | | | Astellas Pharma, Inc. | | | 24,312 | |
| | 600 | | | Azbil Corp. | | | 27,955 | |
| | 600 | | | Bridgestone Corp. | | | 26,110 | |
| | 700 | | | Canon, Inc. | | | 25,341 | |
| | 300 | | | Daikin Industries Ltd. | | | 32,849 | |
| | 75 | | | Daito Trust Construction Co., Ltd. | | | 12,701 | |
| | 600 | | | Daiwa House Industry Co., Ltd. | | | 22,793 | |
| | 500 | | | Denso Corp. | | | 27,184 | |
| | 100 | | | East Japan Railway Co. | | | 9,283 | |
| | 600 | | | FUJIFILM Holdings Corp. | | | 23,673 | |
| | 100 | | | Hankyu Hanshin Holdings, Inc. | | | 3,714 | |
| | | | | | | | |
| Shares or Principal Amount | | Market Value† | |
| COMMON STOCKS - 99.3% - (continued) | | | |
| | | | Japan - 16.1% - (continued) | | | |
| | 200 | | | Hikari Tsushin, Inc. | | $ | 31,914 | |
| | 500 | | | Hoya Corp. | | | 24,960 | |
| | 200 | | | Ito En Ltd. | | | 7,776 | |
| | 1,800 | | | ITOCHU Corp.(1) | | | 34,722 | |
| | 700 | | | Japan Airlines Co., Ltd. | | | 28,230 | |
| | 2 | | | Japan Logistics Fund, Inc. REIT(1) | | | 4,040 | |
| | 1 | | | Japan Retail Fund Investment Corp. REIT | | | 1,937 | |
| | 900 | | | Kagome Co., Ltd. | | | 31,396 | |
| | 50 | | | Keyence Corp. | | | 30,795 | |
| | 100 | | | Kuraray Co., Ltd. | | | 1,711 | |
| | 400 | | | Kyocera Corp. | | | 22,292 | |
| | 500 | | | McDonald’s Holdings Co. Japan Ltd. | | | 23,554 | |
| | 1,600 | | | Mitsubishi Electric Corp. | | | 25,568 | |
| | 100 | | | Mitsubishi Tanabe Pharma Corp. | | | 2,008 | |
| | 600 | | | Mitsui & Co., Ltd. | | | 10,212 | |
| | 6,100 | | | Mizuho Financial Group, Inc.(1) | | | 10,984 | |
| | 200 | | | Nagoya Railroad Co., Ltd. | | | 5,066 | |
| | 200 | | | Nikon Corp. | | | 3,571 | |
| | 1,300 | | | Nippon Kayaku Co., Ltd. | | | 15,964 | |
| | 500 | | | Nippon Telegraph & Telephone Corp. | | | 23,047 | |
| | 300 | | | Nissan Chemical Industries Ltd. | | | 12,299 | |
| | 900 | | | Nissan Motor Co., Ltd.(1) | | | 9,262 | |
| | 2,000 | | | NTT Data Corp. | | | 20,743 | |
| | 200 | | | Oriental Land Co., Ltd. | | | 20,292 | |
| | 400 | | | Osaka Gas Co., Ltd. | | | 7,887 | |
| | 500 | | | Otsuka Holdings Co., Ltd. | | | 24,885 | |
| | 300 | | | Secom Co., Ltd. | | | 22,087 | |
| | 800 | | | Shimadzu Corp. | | | 21,709 | |
| | 100 | | | Shin-Etsu Chemical Co., Ltd. | | | 10,226 | |
| | 1,400 | | | Sumitomo Rubber Industries Ltd. | | | 25,486 | |
| | 100 | | | Taisho Pharmaceutical Holdings Co., Ltd. | | | 9,826 | |
| | 500 | | | Takeda Pharmaceutical Co., Ltd. | | | 24,071 | |
| | 600 | | | Terumo Corp. | | | 30,917 | |
| | 100 | | | Tokio Marine Holdings, Inc. | | | 4,488 | |
| | 400 | | | Toyota Motor Corp. | | | 25,734 | |
| | | | | | | | |
| | | | | | | 881,567 | |
| | | | | | | | |
| | | | Malaysia - 0.8% | | | |
| | 8,000 | | | DiGi.Com Bhd | | | 9,576 | |
| | 3,000 | | | Genting Malaysia Bhd | | | 3,762 | |
| | 5,600 | | | Maxis Bhd | | | 8,223 | |
| | 4,900 | | | Petronas Chemicals Group Bhd | | | 10,324 | |
| | 3,400 | | | Tenaga Nasional Bhd | | | 14,205 | |
| | | | | | | | |
| | | | | | | 46,090 | |
| | | | | | | | |
| | | | Malta - 0.3% | | | |
| | 1,291 | | | Kindred Group plc SDR | | | 17,597 | |
| | | | | | | | |
| | | | Mexico - 0.2% | | | |
| | 1,304 | | | Fomento Economico Mexicano S.A.B. de C.V. | | | 11,888 | |
| | | | | | | | |
| | | | Netherlands - 0.7% | | | |
| | 74 | | | Koninklijke DSM N.V. | | | 7,339 | |
| | 117 | | | Koninklijke Philips N.V. | | | 4,484 | |
| | 913 | | | Royal Dutch Shell plc Class A | | | 28,606 | |
| | | | | | | | |
| | | | | | | 40,429 | |
| | | | | | | | |
| | | | Norway - 1.0% | | | |
| | 1,148 | | | Statoil ASA | | | 27,000 | |
| | 1,183 | | | Telenor ASA | | | 26,671 | |
| | | | | | | | |
| | | | | | | 53,671 | |
| | | | | | | | |
The accompanying notes are an integral part of these financial statements.
|
| Hartford Multifactor Low Volatility International Equity ETF |
Schedule of Investments – (continued)
March 31, 2018 (Unaudited)
| | | | | | | | |
| Shares or Principal Amount | | Market Value† | |
| COMMON STOCKS - 99.3% - (continued) | | | |
| | | | Philippines - 1.1% | | | |
| | 2,790 | | | Aboitiz Equity Ventures, Inc. | | $ | 3,609 | |
| | 8,900 | | | Aboitiz Power Corp. | | | 6,601 | |
| | 340 | | | Ayala Corp. | | | 6,177 | |
| | 7,500 | | | Ayala Land, Inc. | | | 5,908 | |
| | 3,400 | | | Manila Electric Co. | | | 20,722 | |
| | 640 | | | SM Investments Corp. | | | 11,248 | |
| | 9,600 | | | SM Prime Holdings, Inc. | | | 6,200 | |
| | | | | | | | |
| | | | | | | 60,465 | |
| | | | | | | | |
| | | | Poland - 0.1% | | | |
| | 258 | | | Polski Koncern Naftowy Orlen S.A. | | | 6,336 | |
| | | | | | | | |
| | | | Portugal - 0.1% | | | |
| | 385 | | | Galp Energia SGPS S.A. | | | 7,247 | |
| | | | | | | | |
| | | | Russia - 0.1% | | | |
| | 334 | | | MMC Norilsk Nickel PJSC ADR | | | 6,191 | |
| | | | | | | | |
| | | | Singapore - 2.3% | | | |
| | 200 | | | Ascendas REIT | | | 401 | |
| | 1,500 | | | DBS Group Holdings Ltd. | | | 31,457 | |
| | 1,800 | | | Frasers Centrepoint Trust | | | 3,006 | |
| | 2,900 | | | Mapletree Industrial Trust REIT | | | 4,490 | |
| | 1,800 | | | Mapletree Logistics Trust REIT | | | 1,688 | |
| | 200 | | | Oversea-Chinese Banking Corp. Ltd. | | | 1,955 | |
| | 3,400 | | | SATS Ltd. | | | 13,301 | |
| | 4,600 | | | Singapore Telecommunications Ltd. | | | 11,842 | |
| | 100 | | | Suntec REIT | | | 144 | |
| | 900 | | | United Overseas Bank Ltd. | | | 18,875 | |
| | 1,200 | | | UOL Group Ltd. | | | 7,824 | |
| | 1,400 | | | Venture Corp. Ltd. | | | 30,012 | |
| | | | | | | | |
| | | | | | | 124,995 | |
| | | | | | | | |
| | | | South Africa - 0.4% | | | |
| | 238 | | | AVI Ltd. | | | 2,226 | |
| | 950 | | | Bidvest Group Ltd. | | | 17,968 | |
| | | | | | | | |
| | | | | | | 20,194 | |
| | | | | | | | |
| | | | South Korea - 6.2% | | | |
| | 9 | | | CJ O Shopping Co., Ltd. | | | 1,887 | |
| | 223 | | | Fila Korea Ltd. | | | 22,490 | |
| | 69 | | | GS Home Shopping, Inc. | | | 12,164 | |
| | 24 | | | Hyundai Mobis Co., Ltd. | | | 5,719 | |
| | 193 | | | Hyundai Motor Co. | | | 25,983 | |
| | 483 | | | Kangwon Land, Inc. | | | 12,348 | |
| | 174 | | | KB Financial Group, Inc. | | | 10,056 | |
| | 595 | | | Kia Motors Corp. | | | 17,779 | |
| | 1,096 | | | LF Corp. | | | 27,300 | |
| | 3 | | | LG Chem Ltd. | | | 1,086 | |
| | 217 | | | LG Corp. | | | 17,691 | |
| | 57 | | | LG Display Co., Ltd. | | | 1,382 | |
| | 961 | | | LG Uplus Corp. | | | 11,090 | |
| | 297 | | | Loen Entertainment, Inc. | | | 30,789 | |
| | 2 | | | NAVER Corp. | | | 1,474 | |
| | 339 | | | Nexen Tire Corp. | | | 3,960 | |
| | 319 | | | S-1 Corp. | | | 28,731 | |
| | 13 | | | Samsung Electronics Co., Ltd. | | | 29,905 | |
| | 251 | | | Shinhan Financial Group Co., Ltd. | | | 10,632 | |
| | 40 | | | SK Holdings Co., Ltd. | | | 11,202 | |
| | 372 | | | SK Hynix, Inc. | | | 28,025 | |
| | 121 | | | SK Telecom Co., Ltd. | | | 26,109 | |
| | | | | | | | |
| | | | | | | 337,802 | |
| | | | | | | | |
| | | | | | | | |
| Shares or Principal Amount | | Market Value† | |
| COMMON STOCKS - 99.3% - (continued) | | | |
| | | | Spain - 0.5% | | | |
| | 400 | | | Amadeus IT Group S.A. | | $ | 29,507 | |
| | | | | | | | |
| | | | Sweden - 2.0% | | | |
| | 636 | | | Atlas Copco AB Class A | | | 27,430 | |
| | 571 | | | Holmen AB Class B | | | 30,886 | |
| | 2,722 | | | Svenska Cellulosa AB SCA Class B | | | 28,901 | |
| | 965 | | | Swedbank AB Class A | | | 21,548 | |
| | | | | | | | |
| | | | | | | 108,765 | |
| | | | | | | | |
| | | | Switzerland - 3.9% | | | |
| | 1,095 | | | ABB Ltd. | | | 25,980 | |
| | 392 | | | Ferguson plc | | | 29,441 | |
| | 12 | | | Givaudan S.A. | | | 27,268 | |
| | 251 | | | Nestle S.A. | | | 19,821 | |
| | 313 | | | Novartis AG | | | 25,253 | |
| | 87 | | | Roche Holding AG | | | 19,906 | |
| | 3 | | | Sika AG | | | 23,449 | |
| | 277 | | | Swiss Re AG | | | 28,140 | |
| | 54 | | | Zurich Insurance Group AG | | | 17,673 | |
| | | | | | | | |
| | | | | | | 216,931 | |
| | | | | | | | |
| | | | Taiwan - 3.4% | | | |
| | 3,000 | | | Cheng Shin Rubber Industry Co., Ltd. | | | 4,872 | |
| | 11,000 | | | Chong Hong Construction Co., Ltd. | | | 31,879 | |
| | 6,000 | | | Chunghwa Telecom Co., Ltd. | | | 22,945 | |
| | 2,000 | | | Far EasTone Telecommunications Co., Ltd.* | | | 5,282 | |
| | 2,000 | | | Formosa Plastics Corp. | | | 7,065 | |
| | 2,000 | | | Greatek Electronics, Inc. | | | 3,807 | |
| | 4,000 | | | Hon Hai Precision Industry Co., Ltd. | | | 12,347 | |
| | 2,000 | | | Nan Ya Plastics Corp. | | | 5,611 | |
| | 3,000 | | | Powertech Technology, Inc. | | | 9,353 | |
| | 1,000 | | | President Chain Store Corp. | | | 10,049 | |
| | 7,600 | | | Ruentex Development Co., Ltd.* | | | 8,941 | |
| | 2,000 | | | Taiwan Mobile Co., Ltd. | | | 7,477 | |
| | 3,000 | | | Taiwan Semiconductor Manufacturing Co., Ltd. | | | 25,105 | |
| | 13,000 | | | Uni-President Enterprises Corp. | | | 30,452 | |
| | | | | | | | |
| | | | | | | 185,185 | |
| | | | | | | | |
| | | | Thailand - 3.0% | | | |
| | 800 | | | Advanced Info Service PCL NVDR | | | 5,270 | |
| | 15,200 | | | Airports of Thailand PCL NVDR | | | 32,082 | |
| | 7,600 | | | Bangkok Dusit Medical Services PCL NVDR | | | 5,711 | |
| | 1,500 | | | Bumrungrad Hospital PCL NVDR | | | 9,930 | |
| | 900 | | | Central Pattana PCL NVDR | | | 2,259 | |
| | 9,000 | | | CP ALL PCL NVDR | | | 25,112 | |
| | 800 | | | Electricity Generating PCL NVDR | | | 5,859 | |
| | 900 | | | Glow Energy PCL NVDR | | | 2,446 | |
| | 3,400 | | | Ratchaburi Electricity Generating Holding PCL NVDR | | | 5,600 | |
| | 1,504 | | | Siam Cement PCL NVDR | | | 23,760 | |
| | 11,400 | | | Supalai PCL NVDR | | | 7,984 | |
| | 31,000 | | | Thai Beverage PCL | | | 18,440 | |
| | 2,600 | | | Thai Union Group PCL NVDR | | | 1,555 | |
| | 15,300 | | | Thai Vegetable Oil PCL NVDR | | | 16,758 | |
| | | | | | | | |
| | | | | | | 162,766 | |
| | | | | | | | |
| | | | Turkey - 2.3% | | | |
| | 3,465 | | | Aselsan Elektronik Sanayi Ve Ticaret AS | | | 26,853 | |
| | 1,136 | | | BIM Birlesik Magazalar AS | | | 20,461 | |
| | 20,758 | | | Enka Insaat ve Sanayi AS | | | 28,349 | |
| | 1,536 | | | KOC Holding AS | | | 6,312 | |
| | 14,516 | | | Soda Sanayii A.S. | | | 20,044 | |
| | 453 | | | Tupras Turkiye Petrol Rafinerileri AS | | | 12,567 | |
The accompanying notes are an integral part of these financial statements.
|
| Hartford Multifactor Low Volatility International Equity ETF |
Schedule of Investments – (continued)
March 31, 2018 (Unaudited)
| | | | | | | | |
| Shares or Principal Amount | | Market Value† | |
| COMMON STOCKS - 99.3% - (continued) | | | |
| | | | Turkey - 2.3% - (continued) | | | |
| | 132 | | | Turk Traktor ve Ziraat Makineleri AS | | $ | 2,408 | |
| | 2,161 | | | Turkcell Iletisim Hizmetleri AS | | | 8,215 | |
| | | | | | | | |
| | | | | | | 125,209 | |
| | | | | | | | |
| | | | United Kingdom - 10.5% | | | |
| | 925 | | | Ashtead Group plc | | | 25,173 | |
| | 408 | | | AstraZeneca plc | | | 28,019 | |
| | 2,533 | | | BAE Systems plc | | | 20,659 | |
| | 4,553 | | | BP plc | | | 30,609 | |
| | 445 | | | British American Tobacco plc | | | 25,788 | |
| | 1,279 | | | Compass Group plc | | | 26,114 | |
| | 514 | | | Croda International plc | | | 32,937 | |
| | 804 | | | Diageo plc | | | 27,204 | |
| | 1,216 | | | GlaxoSmithKline plc | | | 23,779 | |
| | 1,571 | | | Halma plc | | | 25,983 | |
| | 2,771 | | | HSBC Holdings plc | | | 25,865 | |
| | 474 | | | InterContinental Hotels Group plc | | | 28,379 | |
| | 413 | | | Intertek Group plc | | | 26,998 | |
| | 1,192 | | | National Grid plc | | | 13,414 | |
| | 191 | | | Reckitt Benckiser Group plc | | | 16,167 | |
| | 1,334 | | | RELX N.V. | | | 27,612 | |
| | 1,243 | | | RELX plc | | | 25,545 | |
| | 7,402 | | | Rentokil Initial plc | | | 28,212 | |
| | 1,007 | | | Sage Group plc | | | 9,029 | |
| | 1,415 | | | Smith & Nephew plc | | | 26,420 | |
| | 431 | | | Smiths Group plc | | | 9,151 | |
| | 146 | | | Spectris plc | | | 5,518 | |
| | 398 | | | Unilever N.V. | | | 22,452 | |
| | 450 | | | Unilever plc | | | 24,970 | |
| | 6,776 | | | Vodafone Group plc | | | 18,461 | |
| | | | | | | | |
| | | | | | | 574,458 | |
| | | | | | | | |
| | | | United States - 0.8% | | | |
| | 374 | | | Carnival plc | | | 24,029 | |
| | 4,500 | | | Samsonite International S.A. | | | 20,469 | |
| | | | | | | | |
| | | | | | | 44,498 | |
| | | | | | | | |
| | |
| | | | Total Common Stocks
(cost $5,064,679) | | $ | 5,451,818 | |
| | | | | | | | |
| PREFERRED STOCKS - 0.2% | | | |
| | | | Germany - 0.2% | | | |
| | 155 | | | Fuchs Petrolub SE, 2.01% | | $ | 8,407 | |
| | | | | | | | |
| | |
| | | | Total Preferred Stocks
(cost $8,637) | | $ | 8,407 | |
| | | | | | | | |
| | |
| | | | Total Long-Term Investments
(cost $5,073,316) | | $ | 5,460,225 | |
| | | | | | | | |
| | | | | | | | |
| Shares or Principal Amount | | Market Value† | |
| SHORT-TERM INVESTMENTS - 2.2% | | | |
| | | | Securities Lending Collateral - 2.2% | | | |
| | 121,186 | | | State Street Navigator Securities Lending Government Money Market Portfolio, 1.72%(3) | | $ | 121,186 | |
| | | | | | | | |
| | |
| | | | Total Short-Term Investments
(cost $121,186) | | $ | 121,186 | |
| | | | | | | | |
| | | | | | | | | | | | |
| | | |
| | | | Total Investments
(cost $5,194,502) | | | 101.7 | % | | $ | 5,581,411 | |
| | | | Other Assets and Liabilities | | | (1.7 | )% | | | (91,328 | ) |
| | | | | | | | | | | | |
| | | | Total Net Assets | | | 100.0 | % | | $ | 5,490,083 | |
| | | | | | | | | | | | |
The accompanying notes are an integral part of these financial statements.
|
| Hartford Multifactor Low Volatility International Equity ETF |
Schedule of Investments – (continued)
March 31, 2018 (Unaudited)
| Note: | Percentage of investments as shown is the ratio of the total market value to total net assets. |
| | The Fund may refer to any one or more of the industry classifications used by one or more widely recognized market indices, ratings group and/or as defined by Fund management. Industry classifications may not be identical across all security types. |
| | For Fund compliance purposes, the Fund may not use the same classification system shown in this report as these classifications are used for financial reporting purposes. |
| (1) | Represents entire or partial securities on loan. See Note 7 in the accompanying Notes to Financial Statements for securities lending information. |
| (2) | Securities issued within terms of a private placement memorandum and exempt from registration under Rule 144A under the Securities Act of 1933, as amended, and may be sold to qualified institutional buyers. Unless otherwise indicated, these holdings are determined to be liquid. At March 31, 2018, the aggregate value of these securities was $43,957, which represented 0.8% of total net assets. |
| (3) | Current yield as of period end. |
| † | See Significant Accounting Policies of accompanying Notes to Financial Statements regarding valuation of investments. |
| | |
| GLOSSARY: (abbreviations used in preceding Schedule of Investments) |
|
| Other Abbreviations: |
ADR | | American Depositary Receipt |
GDR | | Global Depositary Receipt |
NVDR | | Non-Voting Depositary Receipt |
PJSC | | Private Joint Stock Company |
REIT | | Real Estate Investment Trust |
The accompanying notes are an integral part of these financial statements.
|
| Hartford Multifactor Low Volatility International Equity ETF |
Schedule of Investments – (continued)
March 31, 2018 (Unaudited)
Fair Valuation Summary
The following is a summary of the fair valuations according to the inputs used as of March 31, 2018 in valuing the Fund’s investments.
| | | | | | | | | | | | | | | | |
| | | Total | | | Level 1(1) | | | Level 2(1) | | | Level 3(1) | |
Assets | |
Common Stocks | | | | | | | | | | | | | | | | |
Australia | | $ | 296,137 | | | $ | 296,137 | | | $ | — | | | $ | — | |
Austria | | | 3,874 | | | | 3,874 | | | | — | | | | — | |
Belgium | | | 3,629 | | | | 3,629 | | | | — | | | | — | |
Brazil | | | 60,468 | | | | 60,468 | | | | — | | | | — | |
Canada | | | 476,807 | | | | 476,807 | | | | — | | | | — | |
Chile | | | 12,727 | | | | 12,727 | | | | — | | | | — | |
China | | | 293,506 | | | | 293,506 | | | | — | | | | — | |
Denmark | | | 108,018 | | | | 108,018 | | | | — | | | | — | |
Finland | | | 6,879 | | | | 6,879 | | | | — | | | | — | |
France | | | 195,837 | | | | 195,837 | | | | — | | | | — | |
Germany | | | 164,315 | | | | 164,315 | | | | — | | | | — | |
Hong Kong | | | 321,019 | | | | 321,019 | | | | — | | | | — | |
India | | | 110,428 | | | | 110,428 | | | | — | | | | — | |
Indonesia | | | 139,406 | | | | 139,406 | | | | — | | | | — | |
Ireland | | | 61,795 | | | | 61,795 | | | | — | | | | — | |
Israel | | | 69,553 | | | | 69,553 | | | | — | | | | — | |
Italy | | | 65,629 | | | | 65,629 | | | | — | | | | — | |
Japan | | | 881,567 | | | | 881,567 | | | | — | | | | — | |
Malaysia | | | 46,090 | | | | 46,090 | | | | — | | | | — | |
Malta | | | 17,597 | | | | 17,597 | | | | — | | | | — | |
Mexico | | | 11,888 | | | | 11,888 | | | | — | | | | — | |
Netherlands | | | 40,429 | | | | 40,429 | | | | — | | | | — | |
Norway | | | 53,671 | | | | 53,671 | | | | — | | | | — | |
Philippines | | | 60,465 | | | | 60,465 | | | | — | | | | — | |
Poland | | | 6,336 | | | | 6,336 | | | | — | | | | — | |
Portugal | | | 7,247 | | | | 7,247 | | | | — | | | | — | |
Russia | | | 6,191 | | | | 6,191 | | | | — | | | | — | |
Singapore | | | 124,995 | | | | 124,995 | | | | — | | | | — | |
South Africa | | | 20,194 | | | | 20,194 | | | | — | | | | — | |
South Korea | | | 337,802 | | | | 337,802 | | | | — | | | | — | |
Spain | | | 29,507 | | | | 29,507 | | | | — | | | | — | |
Sweden | | | 108,765 | | | | 108,765 | | | | — | | | | — | |
Switzerland | | | 216,931 | | | | 216,931 | | | | — | | | | — | |
Taiwan | | | 185,185 | | | | 185,185 | | | | — | | | | — | |
Thailand | | | 162,766 | | | | 162,766 | | | | — | | | | — | |
Turkey | | | 125,209 | | | | 125,209 | | | | — | | | | — | |
United Kingdom | | | 574,458 | | | | 574,458 | | | | — | | | | — | |
United States | | | 44,498 | | | | 44,498 | | | | — | | | | — | |
Preferred Stocks | | | 8,407 | | | | 8,407 | | | | — | | | | — | |
Short-Term Investments | | | 121,186 | | | | 121,186 | | | | — | | | | — | |
| | | | | | | | | | | | | | | | |
Total | | $ | 5,581,411 | | | $ | 5,581,411 | | | $ | — | | | $ | — | |
| | | | | | | | | | | | | | | | |
| (1) | For the six-month period ended March 31, 2018, there were no transfers between any levels. |
The accompanying notes are an integral part of these financial statements.
|
| Hartford Multifactor Low Volatility US Equity ETF |
Schedule of Investments
March 31, 2018 (Unaudited)
| | | | | | | | |
| Shares or Principal Amount | | Market Value† | |
| COMMON STOCKS - 99.8% | |
| | | | Automobiles & Components - 1.1% | |
| | 240 | | | Cooper Tire & Rubber Co.(1) | | $ | 7,032 | |
| | 709 | | | Fox Factory Holding Corp.* | | | 24,744 | |
| | 226 | | | Visteon Corp.* | | | 24,914 | |
| | | | | | | | |
| | | | 56,690 | |
| | | | | | | | |
| | | | Banks - 2.0% | |
| | 1,208 | | | Beneficial Bancorp, Inc. | | | 18,784 | |
| | 331 | | | Capitol Federal Financial, Inc. | | | 4,088 | |
| | 560 | | | CenterState Bank Corp. | | | 14,857 | |
| | 39 | | | Commerce Bancshares, Inc. | | | 2,336 | |
| | 743 | | | Investors Bancorp, Inc.(1) | | | 10,135 | |
| | 71 | | | JP Morgan Chase & Co. | | | 7,808 | |
| | 834 | | | Meridian Bancorp, Inc. | | | 16,805 | |
| | 641 | | | US Bancorp | | | 32,371 | |
| | | | | | | | |
| | | | 107,184 | |
| | | | | | | | |
| | | | Capital Goods - 12.7% | |
| | 247 | | | 3M Co. | | | 54,222 | |
| | 169 | | | Boeing Co. | | | 55,412 | |
| | 427 | | | BWX Technologies, Inc. | | | 27,127 | |
| | 37 | | | ESCO Technologies, Inc. | | | 2,166 | |
| | 115 | | | General Dynamics Corp. | | | 25,404 | |
| | 673 | | | General Electric Co. | | | 9,072 | |
| | 25 | | | Harris Corp. | | | 4,032 | |
| | 482 | | | Honeywell International, Inc. | | | 69,654 | |
| | 212 | | | Hubbell, Inc. | | | 25,817 | |
| | 44 | | | IDEX Corp. | | | 6,270 | |
| | 278 | | | Illinois Tool Works, Inc. | | | 43,552 | |
| | 439 | | | Kaman Corp. | | | 27,271 | |
| | 168 | | | Lincoln Electric Holdings, Inc. | | | 15,112 | |
| | 159 | | | Lockheed Martin Corp. | | | 53,731 | |
| | 256 | | | MSC Industrial Direct Co., Inc. Class A | | | 23,478 | |
| | 159 | | | Northrop Grumman Corp. | | | 55,510 | |
| | 254 | | | Raytheon Co. | | | 54,818 | |
| | 280 | | | Rockwell Collins, Inc. | | | 37,758 | |
| | 12 | | | Roper Technologies, Inc. | | | 3,368 | |
| | 15 | | | Stanley Black & Decker, Inc. | | | 2,298 | |
| | 412 | | | Toro Co. | | | 25,729 | |
| | 327 | | | United Technologies Corp. | | | 41,143 | |
| | | | | | | | |
| | | | 662,944 | |
| | | | | | | | |
| | | | Commercial & Professional Services - 3.1% | |
| | 44 | | | Cintas Corp. | | | 7,505 | |
| | 120 | | | IHS Markit Ltd.* | | | 5,789 | |
| | 56 | | | Matthews International Corp. Class A | | | 2,834 | |
| | 592 | | | Republic Services, Inc. | | | 39,208 | |
| | 503 | | | Rollins, Inc. | | | 25,668 | |
| | 542 | | | Tetra Tech, Inc. | | | 26,531 | |
| | 630 | | | Waste Management, Inc. | | | 52,996 | |
| | | | | | | | |
| | | | 160,531 | |
| | | | | | | | |
| | | | Consumer Durables & Apparel - 0.3% | |
| | 77 | | | Mohawk Industries, Inc.* | | | 17,881 | |
| | | | | | | | |
| | | | Consumer Services - 9.7% | |
| | 610 | | | Aramark | | | 24,131 | |
| | 283 | | | Bright Horizons Family Solutions, Inc.* | | | 28,221 | |
| | 427 | | | Carnival Corp. | | | 28,003 | |
| | 394 | | | Cheesecake Factory, Inc.(1) | | | 18,999 | |
| | 101 | | | Churchill Downs, Inc. | | | 24,649 | |
| | 104 | | | Cracker Barrel Old Country Store, Inc.(1) | | | 16,557 | |
| | 432 | | | Darden Restaurants, Inc. | | | 36,828 | |
| | | | | | | | |
| Shares or Principal Amount | | Market Value† | |
| COMMON STOCKS - 99.8% - (continued) | |
| | | | Consumer Services - 9.7% - (continued) | |
| | 184 | | | Domino’s Pizza, Inc. | | $ | 42,975 | |
| | 459 | | | Dunkin’ Brands Group, Inc.(1) | | | 27,398 | |
| | 47 | | | Graham Holdings Co. Class B | | | 28,306 | |
| | 180 | | | Hilton Worldwide Holdings, Inc. | | | 14,177 | |
| | 36 | | | Jack in the Box, Inc. | | | 3,072 | |
| | 531 | | | McDonald’s Corp. | | | 83,038 | |
| | 264 | | | Papa John’s International, Inc. | | | 15,127 | |
| | 136 | | | Service Corp. International/US | | | 5,132 | |
| | 645 | | | Starbucks Corp. | | | 37,339 | |
| | 33 | | | Vail Resorts, Inc. | | | 7,316 | |
| | 1,457 | | | Wendy’s Co. | | | 25,570 | |
| | 480 | | | Yum! Brands, Inc. | | | 40,862 | |
| | | | | | | | |
| | | | 507,700 | |
| | | | | | | | |
| | | | Diversified Financials - 2.0% | |
| | 83 | | | American Express Co. | | | 7,742 | |
| | 514 | | | Apollo Commercial Real Estate Finance, Inc. REIT(1) | | | 9,242 | |
| | 242 | | | Berkshire Hathaway, Inc. Class B* | | | 48,274 | |
| | 440 | | | Blackstone Mortgage Trust, Inc. Class A REIT(1) | | �� | 13,825 | |
| | 432 | | | Capstead Mortgage Corp. REIT | | | 3,737 | |
| | 20 | | | CBOE Holdings, Inc. | | | 2,282 | |
| | 183 | | | Chimera Investment Corp. REIT | | | 3,186 | |
| | 5 | | | CME Group, Inc. | | | 809 | |
| | 402 | | | MFA Financial, Inc. REIT | | | 3,027 | |
| | 20 | | | Nasdaq, Inc. | | | 1,724 | |
| | 72 | | | SEI Investments Co. | | | 5,393 | |
| | 367 | | | Starwood Property Trust, Inc. REIT | | | 7,689 | |
| | | | | | | | |
| | | | 106,930 | |
| | | | | | | | |
| | | | Energy - 5.4% | |
| | 695 | | | Chevron Corp. | | | 79,258 | |
| | 1,013 | | | Exxon Mobil Corp. | | | 75,580 | |
| | 424 | | | Occidental Petroleum Corp. | | | 27,543 | |
| | 576 | | | Phillips 66 | | | 55,250 | |
| | 558 | | | Schlumberger Ltd. | | | 36,147 | |
| | 77 | | | Valero Energy Corp. | | | 7,143 | |
| | 71 | | | Williams Cos., Inc. | | | 1,765 | |
| | | | | | | | |
| | | | 282,686 | |
| | | | | | | | |
| | | | Food & Staples Retailing - 1.5% | |
| | 123 | | | Costco Wholesale Corp. | | | 23,177 | |
| | 347 | | | Sysco Corp. | | | 20,806 | |
| | 376 | | | Walmart, Inc. | | | 33,453 | |
| | | | | | | | |
| | | | 77,436 | |
| | | | | | | | |
| | | | Food, Beverage & Tobacco - 3.8% | |
| | 838 | | | Altria Group, Inc. | | | 52,224 | |
| | 24 | | | Brown-Forman Corp. Class B | | | 1,306 | |
| | 674 | | | Coca-Cola Co. | | | 29,272 | |
| | 1,049 | | | ConAgra Foods, Inc. | | | 38,687 | |
| | 455 | | | Fresh Del Monte Produce, Inc. | | | 20,584 | |
| | 196 | | | Kellogg Co.(1) | | | 12,742 | |
| | 302 | | | PepsiCo, Inc. | | | 32,963 | |
| | 95 | | | Philip Morris International, Inc. | | | 9,443 | |
| | | | | | | | |
| | | | 197,221 | |
| | | | | | | | |
| | | | Health Care Equipment & Services - 5.7% | |
| | 238 | | | Abbott Laboratories | | | 14,261 | |
| | 578 | | | Baxter International, Inc. | | | 37,593 | |
| | 85 | | | Cooper Cos., Inc. | | | 19,449 | |
| | 278 | | | Danaher Corp. | | | 27,219 | |
| | 200 | | | IDEXX Laboratories, Inc.* | | | 38,278 | |
The accompanying notes are an integral part of these financial statements.
|
| Hartford Multifactor Low Volatility US Equity ETF |
Schedule of Investments – (continued)
March 31, 2018 (Unaudited)
| | | | | | | | |
| Shares or Principal Amount | | Market Value† | |
| COMMON STOCKS - 99.8% - (continued) | |
| | | | Health Care Equipment & Services - 5.7% - (continued) | |
| | 17 | | | Intuitive Surgical, Inc.* | | $ | 7,018 | |
| | 21 | | | Laboratory Corp. of America Holdings* | | | 3,397 | |
| | 72 | | | Masimo Corp.* | | | 6,332 | |
| | 176 | | | Quest Diagnostics, Inc. | | | 17,653 | |
| | 79 | | | STERIS plc | | | 7,375 | |
| | 148 | | | Stryker Corp. | | | 23,816 | |
| | 358 | | | UnitedHealth Group, Inc. | | | 76,612 | |
| | 91 | | | Varian Medical Systems, Inc.* | | | 11,161 | |
| | 31 | | | WellCare Health Plans, Inc.* | | | 6,003 | |
| | | | | | | | |
| | | | 296,167 | |
| | | | | | | | |
| | | | Household & Personal Products - 1.7% | |
| | 240 | | | Church & Dwight Co., Inc. | | | 12,087 | |
| | 164 | | | Clorox Co. | | | 21,830 | |
| | 284 | | | Colgate-Palmolive Co. | | | 20,357 | |
| | 48 | | | Kimberly-Clark Corp. | | | 5,286 | |
| | 262 | | | Procter & Gamble Co. | | | 20,771 | |
| | 76 | | | Spectrum Brands Holdings, Inc.(1) | | | 7,881 | |
| | | | | | | | |
| | | | 88,212 | |
| | | | | | | | |
| | | | Insurance - 1.7% | |
| | 25 | | | American Financial Group, Inc. | | | 2,805 | |
| | 21 | | | Aon plc | | | 2,947 | |
| | 218 | | | Arch Capital Group Ltd.* | | | 18,659 | |
| | 26 | | | Argo Group International Holdings Ltd. | | | 1,467 | |
| | 144 | | | Arthur J Gallagher & Co. | | | 9,897 | |
| | 390 | | | Axis Capital Holdings Ltd. | | | 22,452 | |
| | 184 | | | Brown & Brown, Inc. | | | 4,681 | |
| | 44 | | | Erie Indemnity Co. Class A | | | 5,176 | |
| | 11 | | | Everest Re Group Ltd. | | | 2,825 | |
| | 84 | | | Loews Corp. | | | 4,177 | |
| | 109 | | | Torchmark Corp. | | | 9,175 | |
| | 7 | | | White Mountains Insurance Group Ltd. | | | 5,758 | |
| | | | | | | | |
| | | | 90,019 | |
| | | | | | | | |
| | | | Materials - 9.2% | |
| | 258 | | | Air Products & Chemicals, Inc. | | | 41,030 | |
| | 274 | | | AptarGroup, Inc. | | | 24,613 | |
| | 218 | | | Ashland Global Holdings, Inc. | | | 15,214 | |
| | 203 | | | Balchem Corp. | | | 16,595 | |
| | 290 | | | Ball Corp.(1) | | | 11,516 | |
| | 364 | | | Compass Minerals International, Inc.(1) | | | 21,949 | |
| | 480 | | | Crown Holdings, Inc.* | | | 24,360 | |
| | 383 | | | Ecolab, Inc. | | | 52,498 | |
| | 436 | | | Monsanto Co. | | | 50,877 | |
| | 57 | | | NewMarket Corp.(1) | | | 22,896 | |
| | 352 | | | Praxair, Inc. | | | 50,794 | |
| | 116 | | | Quaker Chemical Corp. | | | 17,183 | |
| | 516 | | | RPM International, Inc. | | | 24,598 | |
| | 282 | | | Scotts Miracle-Gro Co. Class A(1) | | | 24,181 | |
| | 24 | | | Sensient Technologies Corp. | | | 1,694 | |
| | 41 | | | Sherwin-Williams Co. | | | 16,077 | |
| | 902 | | | Silgan Holdings, Inc. | | | 25,121 | |
| | 544 | | | Sonoco Products Co. | | | 26,384 | |
| | 206 | | | WR Grace & Co. | | | 12,613 | |
| | | | | | | | |
| | | | 480,193 | |
| | | | | | | | |
| | | | Media - 3.4% | |
| | 1,512 | | | Comcast Corp. Class A | | | 51,665 | |
| | 181 | | | John Wiley & Sons, Inc. Class A | | | 11,529 | |
| | 131 | | | Omnicom Group, Inc. | | | 9,520 | |
| | 510 | | | Time Warner, Inc. | | | 48,236 | |
| | | | | | | | |
| Shares or Principal Amount | | Market Value† | |
| COMMON STOCKS - 99.8% - (continued) | |
| | | | Media - 3.4% - (continued) | |
| | 657 | | | Tribune Media Co. Class A | | $ | 26,615 | |
| | 279 | | | Walt Disney Co. | | | 28,023 | |
| | | | | | | | |
| | | | 175,588 | |
| | | | | | | | |
| | | | Pharmaceuticals, Biotechnology & Life Sciences - 4.8% | |
| | 27 | | | AbbVie, Inc. | | | 2,555 | |
| | 1,484 | | | Akorn, Inc.* | | | 27,766 | |
| | 20 | | | Amgen, Inc. | | | 3,410 | |
| | 51 | | | Bio-Rad Laboratories, Inc. Class A* | | | 12,754 | |
| | 108 | | | Bio-Techne Corp. | | | 16,312 | |
| | 613 | | | Johnson & Johnson | | | 78,556 | |
| | 530 | | | Merck & Co., Inc. | | | 28,869 | |
| | 280 | | | PerkinElmer, Inc. | | | 21,202 | |
| | 1,226 | | | Pfizer, Inc. | | | 43,511 | |
| | 19 | | | Waters Corp.* | | | 3,774 | |
| | 163 | | | Zoetis, Inc. | | | 13,612 | |
| | | | | | | | |
| | | | 252,321 | |
| | | | | | | | |
| | | | Real Estate - 4.7% | |
| | 336 | | | American Campus Communities, Inc. REIT | | | 12,976 | |
| | 171 | | | American Tower Corp. REIT | | | 24,853 | |
| | 240 | | | Apartment Investment & Management Co. Class A, REIT | | | 9,780 | |
| | 48 | | | AvalonBay Communities, Inc. REIT | | | 7,894 | |
| | 68 | | | Camden Property Trust REIT | | | 5,724 | |
| | 185 | | | Crown Castle International Corp. REIT | | | 20,278 | |
| | 207 | | | Digital Realty Trust, Inc. REIT | | | 21,814 | |
| | 155 | | | Douglas Emmett, Inc. REIT | | | 5,698 | |
| | 12 | | | EastGroup Properties, Inc. REIT | | | 992 | |
| | 68 | | | EPR Properties | | | 3,767 | |
| | 560 | | | Equity Commonwealth REIT* | | | 17,175 | |
| | 242 | | | Equity LifeStyle Properties, Inc. REIT | | | 21,240 | |
| | 20 | | | Essex Property Trust, Inc. REIT | | | 4,814 | |
| | 204 | | | LTC Properties, Inc. REIT | | | 7,752 | |
| | 93 | | | Mid-America Apartment Communities, Inc. REIT | | | 8,485 | |
| | 1,647 | | | Monmouth Real Estate Investment Corp. REIT | | | 24,771 | |
| | 113 | | | PS Business Parks, Inc. REIT | | | 12,774 | |
| | 33 | | | Public Storage REIT | | | 6,613 | |
| | 966 | | | Retail Opportunity Investments Corp. REIT(1) | | | 17,069 | |
| | 212 | | | UDR, Inc. REIT | | | 7,552 | |
| | 40 | | | Ventas, Inc. REIT | | | 1,981 | |
| | 57 | | | Washington Real Estate Investment Trust REIT | | | 1,556 | |
| | | | | | | | |
| | | | 245,558 | |
| | | | | | | | |
| | | | Retailing - 2.4% | |
| | 35 | | | AutoZone, Inc.* | | | 22,704 | |
| | 278 | | | Home Depot, Inc. | | | 49,551 | |
| | 436 | | | LKQ Corp.* | | | 16,546 | |
| | 132 | | | Pool Corp. | | | 19,301 | |
| | 204 | | | TJX Cos., Inc. | | | 16,638 | |
| | | | | | | | |
| | | | 124,740 | |
| | | | | | | | |
| | | | Semiconductors & Semiconductor Equipment - 0.3% | |
| | 340 | | | Intel Corp. | | | 17,707 | |
| | | | | | | | |
| | | | Software & Services - 9.5% | |
| | 16 | | | Adobe Systems, Inc.* | | | 3,457 | |
| | 5 | | | Alphabet, Inc. Class A* | | | 5,186 | |
| | 576 | | | Amdocs Ltd. | | | 38,431 | |
| | 344 | | | Aspen Technology, Inc.* | | | 27,138 | |
| | 278 | | | Automatic Data Processing, Inc. | | | 31,547 | |
| | 1,120 | | | Blucora, Inc.* | | | 27,552 | |
| | 260 | | | Broadridge Financial Solutions, Inc. | | | 28,519 | |
The accompanying notes are an integral part of these financial statements.
|
| Hartford Multifactor Low Volatility US Equity ETF |
Schedule of Investments – (continued)
March 31, 2018 (Unaudited)
| | | | | | | | |
| Shares or Principal Amount | | Market Value† | |
| COMMON STOCKS - 99.8% - (continued) | |
| | | | Software & Services - 9.5% - (continued) | |
| | 17 | | | Cognizant Technology Solutions Corp. Class A | | $ | 1,369 | |
| | 44 | | | ExlService Holdings, Inc.* | | | 2,454 | |
| | 29 | | | Facebook, Inc. Class A* | | | 4,634 | |
| | 268 | | | Fidelity National Information Services, Inc. | | | 25,808 | |
| | 384 | | | Fiserv, Inc.* | | | 27,383 | |
| | 75 | | | Gartner, Inc. Class A* | | | 8,822 | |
| | 420 | | | Genpact Ltd. | | | 13,436 | |
| | 450 | | | International Business Machines Corp. | | | 69,044 | |
| | 251 | | | Jack Henry & Associates, Inc. | | | 30,358 | |
| | 119 | | | Mastercard, Inc. Class A | | | 20,844 | |
| | 387 | | | Microsoft Corp. | | | 35,322 | |
| | 548 | | | Paychex, Inc. | | | 33,751 | |
| | 171 | | | Progress Software Corp. | | | 6,575 | |
| | 129 | | | Synopsys, Inc.* | | | 10,738 | |
| | 192 | | | VeriSign, Inc.*(1) | | | 22,764 | |
| | 183 | | | Visa, Inc. Class A | | | 21,890 | |
| | | | | | | | |
| | | | 497,022 | |
| | | | | | | | |
| | | | Technology Hardware & Equipment - 1.8% | |
| | 347 | | | Amphenol Corp. Class A | | | 29,887 | |
| | 781 | | | Benchmark Electronics, Inc. | | | 23,313 | |
| | 310 | | | Cisco Systems, Inc. | | | 13,296 | |
| | 45 | | | Dolby Laboratories, Inc. Class A | | | 2,860 | |
| | 185 | | | Motorola Solutions, Inc. | | | 19,480 | |
| | 44 | | | TE Connectivity Ltd. | | | 4,396 | |
| | | | | | | | |
| | | | 93,232 | |
| | | | | | | | |
| | | | Telecommunication Services - 5.3% | |
| | 2,091 | | | AT&T, Inc. | | | 74,544 | |
| | 1,603 | | | CenturyLink, Inc. | | | 26,337 | |
| | 588 | | | Cogent Communications Holdings, Inc. | | | 25,519 | |
| | 2,637 | | | Sprint Corp.*(1) | | | 12,869 | |
| | 583 | | | T-Mobile US, Inc.* | | | 35,587 | |
| | 175 | | | Telephone & Data Systems, Inc. | | | 4,905 | |
| | 1,625 | | | Verizon Communications, Inc. | | | 77,708 | |
| | 474 | | | Vonage Holdings Corp.* | | | 5,048 | |
| | 500 | | | Zayo Group Holdings, Inc.* | | | 17,080 | |
| | | | | | | | |
| | | | 279,597 | |
| | | | | | | | |
| | | | Transportation - 2.7% | |
| | 117 | | | CH Robinson Worldwide, Inc. | | | 10,964 | |
| | 61 | | | Expeditors International of Washington, Inc. | | | 3,861 | |
| | 515 | | | Heartland Express, Inc. | | | 9,265 | |
| | 183 | | | J.B. Hunt Transport Services, Inc. | | | 21,439 | |
| | 168 | | | Landstar System, Inc. | | | 18,421 | |
| | 214 | | | Union Pacific Corp. | | | 28,768 | |
| | 440 | | | United Parcel Service, Inc. Class B | | | 46,050 | |
| | | | | | | | |
| | | | 138,768 | |
| | | | | | | | |
| | | | Utilities - 5.0% | |
| | 340 | | | Alliant Energy Corp. | | | 13,892 | |
| | 63 | | | American Electric Power Co., Inc. | | | 4,321 | |
| | 113 | | | American Water Works Co., Inc. | | | 9,281 | |
| | 96 | | | Atmos Energy Corp. | | | 8,087 | |
| | 132 | | | CenterPoint Energy, Inc. | | | 3,617 | |
| | 210 | | | CMS Energy Corp. | | | 9,511 | |
| | 179 | | | Consolidated Edison, Inc. | | | 13,951 | |
| | 416 | | | Dominion Energy, Inc. | | | 28,051 | |
| | 101 | | | DTE Energy Co. | | | 10,544 | |
| | 154 | | | Duke Energy Corp. | | | 11,930 | |
| | 171 | | | El Paso Electric Co. | | | 8,721 | |
| | 69 | | | Entergy Corp. | | | 5,436 | |
| | | | | | | | |
| Shares or Principal Amount | | Market Value† | |
| COMMON STOCKS - 99.8% - (continued) | |
| | | | Utilities - 5.0% - (continued) | |
| | 65 | | | IDACORP, Inc. | | $ | 5,737 | |
| | 1,002 | | | MDU Resources Group, Inc. | | | 28,216 | |
| | 20 | | | MGE Energy, Inc. | | | 1,122 | |
| | 28 | | | NextEra Energy, Inc. | | | 4,573 | |
| | 722 | | | NiSource, Inc. | | | 17,263 | |
| | 31 | | | Portland General Electric Co. | | | 1,256 | |
| | 101 | | | PPL Corp. | | | 2,857 | |
| | 116 | | | Public Service Enterprise Group, Inc. | | | 5,828 | |
| | 250 | | | Southern Co. | | | 11,165 | |
| | 203 | | | Spire, Inc. | | | 14,677 | |
| | 52 | | | UGI Corp. | | | 2,310 | |
| | 117 | | | Vectren Corp. | | | 7,479 | |
| | 248 | | | WEC Energy Group, Inc. | | | 15,550 | |
| | 103 | | | Westar Energy, Inc. | | | 5,417 | |
| | 264 | | | Xcel Energy, Inc. | | | 12,007 | |
| | | | | | | | |
| | | | 262,799 | |
| | | | | | | | |
| | |
| | | | Total Common Stocks
(cost $5,030,628) | | $ | 5,219,126 | |
| | | | | | | | |
| | |
| | | | Total Long-Term Investments
(cost $5,030,628) | | $ | 5,219,126 | |
| | | | | | | | |
| SHORT-TERM INVESTMENTS - 0.9% | |
| | | | Securities Lending Collateral - 0.9% | |
| | 46,042 | | | State Street Navigator Securities Lending Government Money Market Portfolio, 1.72%(2) | | $ | 46,042 | |
| | | | | | | | |
| | |
| | | | Total Short-Term Investments
(cost $46,042) | | $ | 46,042 | |
| | | | | | | | |
| | | | | | | | | | | | |
| | | |
| | | | Total Investments
(cost $5,076,670) | | | 100.7 | % | | $ | 5,265,168 | |
| | | | Other Assets and Liabilities | | | (0.7 | )% | | | (38,562 | ) |
| | | | | | | | | | | | |
| | | | Total Net Assets | | | 100.0 | % | | $ | 5,226,606 | |
| | | | | | | | | | | | |
The accompanying notes are an integral part of these financial statements.
|
| Hartford Multifactor Low Volatility US Equity ETF |
Schedule of Investments – (continued)
March 31, 2018 (Unaudited)
| Note: | Percentage of investments as shown is the ratio of the total market value to total net assets. |
| | Equity industry classifications used in this report are the Global Industry Classification Standard, which was developed by and is the exclusive property and service mark of MSCI, Inc. and Standard & Poor’s. |
| | For Fund compliance purposes, the Fund may not use the same classification system shown in this report as these classifications are used for financial reporting purposes. |
| (1) | Represents entire or partial securities on loan. See Note 7 in the accompanying Notes to Financial Statements for securities lending information. |
| (2) | Current yield as of period end. |
| † | See Significant Accounting Policies of accompanying Notes to Financial Statements regarding valuation of investments. |
| | |
| GLOSSARY: (abbreviations used in preceding Schedule of Investments) |
|
| Other Abbreviations: |
REIT | | Real Estate Investment Trust |
The accompanying notes are an integral part of these financial statements.
|
| Hartford Multifactor Low Volatility US Equity ETF |
Schedule of Investments – (continued)
March 31, 2018 (Unaudited)
Fair Valuation Summary
The following is a summary of the fair valuations according to the inputs used as of March 31, 2018 in valuing the Fund’s investments.
| | | | | | | | | | | | | | | | |
| | | Total | | | Level 1(1) | | | Level 2(1) | | | Level 3(1) | |
Assets | |
Common Stocks | |
Automobiles & Components | | $ | 56,690 | | | $ | 56,690 | | | $ | — | | | $ | — | |
Banks | | | 107,184 | | | | 107,184 | | | | — | | | | — | |
Capital Goods | | | 662,944 | | | | 662,944 | | | | — | | | | — | |
Commercial & Professional Services | | | 160,531 | | | | 160,531 | | | | — | | | | — | |
Consumer Durables & Apparel | | | 17,881 | | | | 17,881 | | | | — | | | | — | |
Consumer Services | | | 507,700 | | | | 507,700 | | | | — | | | | — | |
Diversified Financials | | | 106,930 | | | | 106,930 | | | | — | | | | — | |
Energy | | | 282,686 | | | | 282,686 | | | | — | | | | — | |
Food & Staples Retailing | | | 77,436 | | | | 77,436 | | | | — | | | | — | |
Food, Beverage & Tobacco | | | 197,221 | | | | 197,221 | | | | — | | | | — | |
Health Care Equipment & Services | | | 296,167 | | | | 296,167 | | | | — | | | | — | |
Household & Personal Products | | | 88,212 | | | | 88,212 | | | | — | | | | — | |
Insurance | | | 90,019 | | | | 90,019 | | | | — | | | | — | |
Materials | | | 480,193 | | | | 480,193 | | | | — | | | | — | |
Media | | | 175,588 | | | | 175,588 | | | | — | | | | — | |
Pharmaceuticals, Biotechnology & Life Sciences | | | 252,321 | | | | 252,321 | | | | — | | | | — | |
Real Estate | | | 245,558 | | | | 245,558 | | | | — | | | | — | |
Retailing | | | 124,740 | | | | 124,740 | | | | — | | | | — | |
Semiconductors & Semiconductor Equipment | | | 17,707 | | | | 17,707 | | | | — | | | | — | |
Software & Services | | | 497,022 | | | | 497,022 | | | | — | | | | — | |
Technology Hardware & Equipment | | | 93,232 | | | | 93,232 | | | | — | | | | — | |
Telecommunication Services | | | 279,597 | | | | 279,597 | | | | — | | | | — | |
Transportation | | | 138,768 | | | | 138,768 | | | | — | | | | — | |
Utilities | | | 262,799 | | | | 262,799 | | | | — | | | | — | |
Short-Term Investments | | | 46,042 | | | | 46,042 | | | | — | | | | — | |
| | | | | | | | | | | | | | | | |
Total | | $ | 5,265,168 | | | $ | 5,265,168 | | | $ | — | | | $ | — | |
| | | | | | | | | | | | | | | | |
| (1) | For the six-month period ended March 31, 2018, there were no transfers between any levels. |
The accompanying notes are an integral part of these financial statements.
|
| Hartford Multifactor REIT ETF |
Schedule of Investments
March 31, 2018 (Unaudited)
| | | | | | | | |
| Shares or Principal Amount | | Market Value† | |
| COMMON STOCKS - 99.5% | |
| | | | Diversified REITs - 8.0% | |
| | 15,969 | | | Armada Hoffler Properties, Inc. REIT | | $ | 218,616 | |
| | 12,803 | | | Empire State Realty Trust, Inc. Class A, REIT | | | 214,962 | |
| | 11,796 | | | Select Income REIT | | | 229,786 | |
| | 3,582 | | | WP Carey, Inc. REIT | | | 222,048 | |
| | | | | | | | |
| | | | 885,412 | |
| | | | | | | | |
| | | | Health Care REITs - 7.9% | |
| | 5,700 | | | LTC Properties, Inc. REIT | | | 216,600 | |
| | 16,980 | | | Medical Properties Trust, Inc. REIT | | | 220,740 | |
| | 3,249 | | | National Health Investors, Inc. REIT | | | 218,625 | |
| | 8,040 | | | Omega Healthcare Investors, Inc. REIT(1) | | | 217,402 | |
| | | | | | | | |
| | | | 873,367 | |
| | | | | | | | |
| | | | Hotel & Resort REITs - 10.0% | |
| | 11,648 | | | Host Hotels & Resorts, Inc. REIT | | | 217,119 | |
| | 8,162 | | | MGM Growth Properties LLC Class A, REIT | | | 216,620 | |
| | 3,084 | | | Ryman Hospitality Properties, Inc. REIT | | | 238,856 | |
| | 16,756 | | | Summit Hotel Properties, Inc. REIT | | | 228,049 | |
| | 10,845 | | | Xenia Hotels & Resorts, Inc. REIT | | | 213,863 | |
| | | | | | | | |
| | | | 1,114,507 | |
| | | | | | | | |
| | | | Industrial REITs - 6.0% | |
| | 8,747 | | | Duke Realty Corp. REIT | | | 231,621 | |
| | 2,645 | | | EastGroup Properties, Inc. REIT | | | 218,636 | |
| | 7,485 | | | First Industrial Realty Trust, Inc. REIT(1) | | | 218,786 | |
| | | | | | | | |
| | | | 669,043 | |
| | | | | | | | |
| | | | Office REITs - 7.7% | |
| | 15,556 | | | City Office, Inc. REIT | | | 179,827 | |
| | 8,449 | | | Corporate Office Properties Trust REIT | | | 218,238 | |
| | 25,659 | | | Cousins Properties, Inc. REIT | | | 222,720 | |
| | 5,012 | | | Highwoods Properties, Inc. REIT | | | 219,626 | |
| | 861 | | | Piedmont Office Realty Trust, Inc. Class A, REIT | | | 15,145 | |
| | | | | | | | |
| | | | 855,556 | |
| | | | | | | | |
| | | | Residential REITs - 12.7% | |
| | 5,647 | | | Apartment Investment & Management Co. Class A, REIT | | | 230,115 | |
| | 2,917 | | | BRT Apartments Corp. REIT | | | 34,275 | |
| | 2,743 | | | Camden Property Trust REIT | | | 230,906 | |
| | 2,561 | | | Equity LifeStyle Properties, Inc. REIT | | | 224,779 | |
| | 943 | | | Essex Property Trust, Inc. REIT | | | 226,961 | |
| | 4,008 | | | NexPoint Residential Trust, Inc. REIT | | | 99,559 | |
| | 6,404 | | | UDR, Inc. REIT | | | 228,110 | |
| | 10,035 | | | UMH Properties, Inc. REIT | | | 134,569 | |
| | | | | | | | |
| | | | 1,409,274 | |
| | | | | | | | |
| | | | Retail REITs - 28.0% | |
| | 4,451 | | | Agree Realty Corp. REIT | | | 213,826 | |
| | 455 | | | Alexander’s, Inc. REIT | | | 173,460 | |
| | 13,834 | | | Brixmor Property Group, Inc. REIT | | | 210,968 | |
| | 45,586 | | | CBL & Associates Properties, Inc. REIT(1) | | | 190,094 | |
| | 1,855 | | | Federal Realty Investment Trust REIT | | | 215,384 | |
| | 8,662 | | | Getty Realty Corp. REIT | | | 218,456 | |
| | 18,047 | | | Ramco-Gershenson Properties Trust REIT(1) | | | 223,061 | |
| | 2,603 | | | Saul Centers, Inc. REIT | | | 132,675 | |
| | 6,072 | | | Seritage Growth Properties REIT(1) | | | 215,859 | |
| | 1,376 | | | Simon Property Group, Inc. REIT | | | 212,386 | |
| | 9,511 | | | Tanger Factory Outlet Centers, Inc. REIT(1) | | | 209,242 | |
| | 3,647 | | | Taubman Centers, Inc. REIT | | | 207,551 | |
| | 9,669 | | | Urban Edge Properties REIT | | | 206,433 | |
| | 32,816 | | | Washington Prime Group, Inc. REIT(1) | | | 218,883 | |
| | | | | | | | |
| Shares or Principal Amount | | Market Value† | |
| COMMON STOCKS - 99.5% - (continued) | |
| | | | Retail REITs - 28.0% - (continued) | |
| | 7,802 | | | Weingarten Realty Investors REIT | | $ | 219,080 | |
| | 9,849 | | | Wheeler Real Estate Investment Trust, Inc. REIT(1) | | | 35,259 | |
| | | | | | | | |
| | | | 3,102,617 | |
| | | | | | | | |
| | | | Specialized REITs - 19.2% | |
| | 2,276 | | | Coresite Realty Corp. REIT(1) | | | 228,192 | |
| | 8,058 | | | CubeSmart REIT | | | 227,235 | |
| | 4,435 | | | CyrusOne, Inc. REIT | | | 227,116 | |
| | 2,144 | | | Digital Realty Trust, Inc. REIT | | | 225,935 | |
| | 6,538 | | | Gaming and Leisure Properties, Inc. REIT | | | 218,827 | |
| | 5,192 | | | Geo Group, Inc. REIT | | | 106,280 | |
| | 6,502 | | | Iron Mountain, Inc. REIT | | | 213,656 | |
| | 8,650 | | | National Storage Affiliates Trust REIT | | | 216,942 | |
| | 1,095 | | | Public Storage REIT | | | 219,427 | |
| | 6,668 | | | QTS Realty Trust, Inc. Class A, REIT | | | 241,515 | |
| | | | | | | | |
| | | | 2,125,125 | |
| | | | | | | | |
| | |
| | | | Total Common Stocks
(cost $11,691,401) | | $ | 11,034,901 | |
| | | | | | | | |
| | |
| | | | Total Long-Term Investments
(cost $11,691,401) | | $ | 11,034,901 | |
| | | | | | | | |
| SHORT-TERM INVESTMENTS - 4.3% | |
| | | | Securities Lending Collateral - 4.3% | |
| | 473,309 | | | State Street Navigator Securities Lending Government Money Market Portfolio, 1.72%(2) | | | 473,309 | |
| | | | | | | | |
| | |
| | | | Total Short-Term Investments
(cost $473,309) | | $ | 473,309 | |
| | | | | | | | |
| | | | | | | | | | | | |
| | | |
| | | | Total Investments
(cost $12,164,710) | | | 103.8 | % | | $ | 11,508,210 | |
| | | | Other Assets and Liabilities | | | (3.8 | )% | | | (416,733 | ) |
| | | | | | | | | | | | |
| | | | Total Net Assets | | | 100.0 | % | | $ | 11,091,477 | |
| | | | | | | | | | | | |
The accompanying notes are an integral part of these financial statements.
|
| Hartford Multifactor REIT ETF |
Schedule of Investments – (continued)
March 31, 2018 (Unaudited)
| Note: | Percentage of investments as shown is the ratio of the total market value to total net assets. |
| | Equity industry classifications used in this report are the Global Industry Classification Standard, which was developed by and is the exclusive property and service mark of MSCI, Inc. and Standard & Poor’s. |
| | For Fund compliance purposes, the Fund may not use the same classification system shown in this report as these classifications are used for financial reporting purposes. |
| (1) | Represents entire or partial securities on loan. See Note 7 in the accompanying Notes to Financial Statements for securities lending information. |
| (2) | Current yield as of period end. |
| † | See Significant Accounting Policies of accompanying Notes to Financial Statements regarding valuation of investments. |
| | |
| GLOSSARY: (abbreviations used in preceding Schedule of Investments) |
|
| Other Abbreviations: |
REIT | | Real Estate Investment Trust |
The accompanying notes are an integral part of these financial statements.
|
| Hartford Multifactor REIT ETF |
Schedule of Investments – (continued)
March 31, 2018 (Unaudited)
Fair Valuation Summary
The following is a summary of the fair valuations according to the inputs used as of March 31, 2018 in valuing the Fund’s investments.
| | | | | | | | | | | | | | | | |
| | | Total | | | Level 1(1) | | | Level 2(1) | | | Level 3(1) | |
Assets | |
Common Stocks | |
Diversified REITs | | $ | 885,412 | | | $ | 885,412 | | | $ | — | | | $ | — | |
Health Care REITs | | | 873,367 | | | | 873,367 | | | | — | | | | — | |
Hotel & Resort REITs | | | 1,114,507 | | | | 1,114,507 | | | | — | | | | — | |
Industrial REITs | | | 669,043 | | | | 669,043 | | | | — | | | | — | |
Office REITs | | | 855,556 | | | | 855,556 | | | | — | | | | — | |
Residential REITs | | | 1,409,274 | | | | 1,409,274 | | | | — | | | | — | |
Retail REITs | | | 3,102,617 | | | | 3,102,617 | | | | — | | | | — | |
Specialized REITs | | | 2,125,125 | | | | 2,125,125 | | | | — | | | | — | |
Short-Term Investments | | | 473,309 | | | | 473,309 | | | | — | | | | — | |
| | | | | | | | | | | | | | | | |
Total | | $ | 11,508,210 | | | $ | 11,508,210 | | | $ | — | | | $ | — | |
| | | | | | | | | | | | | | | | |
| (1) | For the six-month period ended March 31, 2018, there were no transfers between any levels. |
The accompanying notes are an integral part of these financial statements.
|
| Hartford Multifactor US Equity ETF |
Schedule of Investments
March 31, 2018 (Unaudited)
| | | | | | | | |
| Shares or Principal Amount | | Market Value† | |
| COMMON STOCKS - 99.9% | |
| | | | Automobiles & Components - 1.2% | |
| | 101 | | | Adient plc(1) | | $ | 6,036 | |
| | 2,250 | | | Dana Holding Corp. | | | 57,960 | |
| | 9,785 | | | Ford Motor Co. | | | 108,418 | |
| | 10,946 | | | General Motors Co. | | | 397,778 | |
| | 659 | | | Thor Industries, Inc. | | | 75,897 | |
| | 410 | | | Visteon Corp.* | | | 45,198 | |
| | | | | | | | |
| | | | 691,287 | |
| | | | | | | | |
| | | | Banks - 6.0% | |
| | 11,460 | | | Bank of America Corp. | | | 343,685 | |
| | 2,812 | | | BB&T Corp. | | | 146,337 | |
| | 4,392 | | | Citigroup, Inc. | | | 296,460 | |
| | 3,361 | | | Citizens Financial Group, Inc. | | | 141,095 | |
| | 720 | | | Cullen/Frost Bankers, Inc. | | | 76,370 | |
| | 438 | | | East West Bancorp, Inc. | | | 27,393 | |
| | 7,832 | | | Fifth Third Bancorp | | | 248,666 | |
| | 240 | | | First Citizens BancShares, Inc. Class A | | | 99,178 | |
| | 4,492 | | | JP Morgan Chase & Co. | | | 493,985 | |
| | 2,462 | | | KeyCorp | | | 48,132 | |
| | 487 | | | M&T Bank Corp. | | | 89,783 | |
| | 5,075 | | | MGIC Investment Corp.* | | | 65,975 | |
| | 1,557 | | | PNC Financial Services Group, Inc. | | | 235,481 | |
| | 823 | | | Popular, Inc. | | | 34,253 | |
| | 15,748 | | | Regions Financial Corp. | | | 292,598 | |
| | 4,176 | | | SunTrust Banks, Inc. | | | 284,135 | |
| | 6,130 | | | TCF Financial Corp. | | | 139,825 | |
| | 413 | | | US Bancorp | | | 20,857 | |
| | 5,279 | | | Wells Fargo & Co. | | | 276,672 | |
| | 1,354 | | | Zions Bancorp | | | 71,396 | |
| | | | | | | | |
| | | | 3,432,276 | |
| | | | | | | | |
| | | | Capital Goods - 5.0% | |
| | 846 | | | 3M Co. | | | 185,714 | |
| | 481 | | | Boeing Co. | | | 157,710 | |
| | 220 | | | Caterpillar, Inc. | | | 32,424 | |
| | 2,362 | | | Cummins, Inc. | | | 382,857 | |
| | 188 | | | Deere & Co. | | | 29,200 | |
| | 977 | | | Dycom Industries, Inc.* | | | 105,155 | |
| | 3,147 | | | Eaton Corp. plc | | | 251,477 | |
| | 1,486 | | | Emerson Electric Co. | | | 101,494 | |
| | 70 | | | General Dynamics Corp. | | | 15,463 | |
| | 539 | | | Honeywell International, Inc. | | | 77,891 | |
| | 1,044 | | | Illinois Tool Works, Inc. | | | 163,553 | |
| | 1,899 | | | Ingersoll-Rand plc | | | 162,383 | |
| | 70 | | | Lockheed Martin Corp. | | | 23,655 | |
| | 3,745 | | | MasTec, Inc.* | | | 176,202 | |
| | 1,546 | | | MSC Industrial Direct Co., Inc. Class A | | | 141,784 | |
| | 418 | | | Northrop Grumman Corp. | | | 145,932 | |
| | 1,325 | | | PACCAR, Inc. | | | 87,675 | |
| | 285 | | | Parker-Hannifin Corp. | | | 48,744 | |
| | 618 | | | Quanta Services, Inc.* | | | 21,228 | |
| | 291 | | | Raytheon Co. | | | 62,804 | |
| | 311 | | | Rockwell Automation, Inc. | | | 54,176 | |
| | 89 | | | Spirit Aerosystems Holdings, Inc. Class A | | | 7,449 | |
| | 855 | | | Stanley Black & Decker, Inc. | | | 130,986 | |
| | 754 | | | United Rentals, Inc.* | | | 130,238 | |
| | 806 | | | United Technologies Corp. | | | 101,411 | |
| | 299 | | | WW Grainger, Inc. | | | 84,399 | |
| | | | | | | | |
| | | | 2,882,004 | |
| | | | | | | | |
| | | | | | | | |
| Shares or Principal Amount | | Market Value† | |
| COMMON STOCKS - 99.9% - (continued) | |
| | | | Commercial & Professional Services - 1.2% | |
| | 893 | | | Deluxe Corp. | | $ | 66,091 | |
| | 2,226 | | | ManpowerGroup, Inc. | | | 256,212 | |
| | 264 | | | Republic Services, Inc. | | | 17,485 | |
| | 4,021 | | | Robert Half International, Inc. | | | 232,776 | |
| | 1,477 | | | Waste Management, Inc. | | | 124,245 | |
| | | | | | | | |
| | | | 696,809 | |
| | | | | | | | |
| | | | Consumer Durables & Apparel - 1.5% | |
| | 99 | | | Carter’s, Inc. | | | 10,306 | |
| | 3,293 | | | D.R. Horton, Inc. | | | 144,365 | |
| | 3,918 | | | Michael Kors Holdings Ltd.* | | | 243,230 | |
| | 159 | | | Mohawk Industries, Inc.* | | | 36,923 | |
| | 1,238 | | | NIKE, Inc. Class B | | | 82,253 | |
| | 65 | | | Ralph Lauren Corp. | | | 7,267 | |
| | 7,807 | | | Skechers USA, Inc. Class A* | | | 303,614 | |
| | 634 | | | VF Corp. | | | 46,992 | |
| | | | | | | | |
| | | | 874,950 | |
| | | | | | | | |
| | | | Consumer Services - 1.1% | |
| | 2,105 | | | Carnival Corp. | | | 138,046 | |
| | 103 | | | Cracker Barrel Old Country Store, Inc.(1) | | | 16,397 | |
| | 860 | | | Darden Restaurants, Inc. | | | 73,315 | |
| | 367 | | | Grand Canyon Education, Inc.* | | | 38,506 | |
| | 6,630 | | | H&R Block, Inc. | | | 168,468 | |
| | 446 | | | Hyatt Hotels Corp. Class A | | | 34,012 | |
| | 768 | | | Las Vegas Sands Corp. | | | 55,219 | |
| | 468 | | | McDonald’s Corp. | | | 73,186 | |
| | 328 | | | Yum! Brands, Inc. | | | 27,923 | |
| | | | | | | | |
| | | | 625,072 | |
| | | | | | | | |
| | | | Diversified Financials - 3.5% | |
| | 1,145 | | | American Express Co. | | | 106,806 | |
| | 2,658 | | | Ameriprise Financial, Inc. | | | 393,224 | |
| | 946 | | | Berkshire Hathaway, Inc. Class B* | | | 188,708 | |
| | 13,740 | | | BGC Partners, Inc. Class A | | | 184,803 | |
| | 139 | | | BlackRock, Inc. | | | 75,299 | |
| | 1,739 | | | Capital One Financial Corp. | | | 166,631 | |
| | 414 | | | Charles Schwab Corp. | | | 21,619 | |
| | 270 | | | CME Group, Inc. | | | 43,670 | |
| | 2,697 | | | Discover Financial Services | | | 193,995 | |
| | 663 | | | E*TRADE Financial Corp.* | | | 36,737 | |
| | 1,442 | | | Franklin Resources, Inc. | | | 50,008 | |
| | 732 | | | Legg Mason, Inc. | | | 29,756 | |
| | 2,960 | | | Morgan Stanley | | | 159,722 | |
| | 2,497 | | | Santander Consumer USA Holdings, Inc. | | | 40,701 | |
| | 5,546 | | | Synchrony Financial | | | 185,957 | |
| | 1,243 | | | T Rowe Price Group, Inc. | | | 134,207 | |
| | | | | | | | |
| | | | 2,011,843 | |
| | | | | | | | |
| | | | Energy - 6.1% | |
| | 3,088 | | | Andeavor | | | 310,529 | |
| | 2,491 | | | Chevron Corp. | | | 284,074 | |
| | 51 | | | Concho Resources, Inc.* | | | 7,667 | |
| | 845 | | | ConocoPhillips | | | 50,100 | |
| | 4,965 | | | Devon Energy Corp. | | | 157,837 | |
| | 3,277 | | | Exxon Mobil Corp. | | | 244,497 | |
| | 8,497 | | | HollyFrontier Corp. | | | 415,163 | |
| | 8,699 | | | Marathon Petroleum Corp. | | | 635,984 | |
| | 1,018 | | | Occidental Petroleum Corp. | | | 66,129 | |
| | 5,323 | | | Peabody Energy Corp. | | | 194,290 | |
| | 3,990 | | | Phillips 66 | | | 382,721 | |
The accompanying notes are an integral part of these financial statements.
|
| Hartford Multifactor US Equity ETF |
Schedule of Investments – (continued)
March 31, 2018 (Unaudited)
| | | | | | | | |
| Shares or Principal Amount | | Market Value† | |
| COMMON STOCKS - 99.9% - (continued) | |
| | | | Energy - 6.1% - (continued) | |
| | 2,207 | | | RPC, Inc.(1) | | $ | 39,792 | |
| | 7,680 | | | Valero Energy Corp. | | | 712,474 | |
| | | | | | | | |
| | | | 3,501,257 | |
| | | | | | | | |
| | | | Food & Staples Retailing - 2.8% | |
| | 161 | | | Casey’s General Stores, Inc.(1) | | | 17,673 | |
| | 554 | | | Costco Wholesale Corp. | | | 104,390 | |
| | 2,049 | | | CVS Health Corp. | | | 127,468 | |
| | 10,850 | | | Kroger Co. | | | 259,749 | |
| | 1,634 | | | Performance Food Group Co.* | | | 48,775 | |
| | 1,542 | | | Sprouts Farmers Market, Inc.* | | | 36,191 | |
| | 4,429 | | | Sysco Corp. | | | 265,563 | |
| | 3,204 | | | US Foods Holding Corp.* | | | 104,995 | |
| | 1,453 | | | Walgreens Boots Alliance, Inc. | | | 95,128 | |
| | 5,822 | | | Walmart, Inc. | | | 517,983 | |
| | | | | | | | |
| | | | 1,577,915 | |
| | | | | | | | |
| | | | Food, Beverage & Tobacco - 2.4% | |
| | 1,799 | | | Altria Group, Inc. | | | 112,114 | |
| | 4,544 | | | Archer-Daniels-Midland Co. | | | 197,073 | |
| | 2,486 | | | Flowers Foods, Inc. | | | 54,344 | |
| | 554 | | | General Mills, Inc.(1) | | | 24,963 | |
| | 231 | | | Hershey Co. | | | 22,860 | |
| | 188 | | | Kellogg Co.(1) | | | 12,222 | |
| | 899 | | | PepsiCo, Inc. | | | 98,126 | |
| | 802 | | | Philip Morris International, Inc. | | | 79,719 | |
| | 19,294 | | | Pilgrim’s Pride Corp.*(1) | | | 474,825 | |
| | 3,949 | | | Tyson Foods, Inc. Class A | | | 289,027 | |
| | | | | | | | |
| | | | 1,365,273 | |
| | | | | | | | |
| | | | Health Care Equipment & Services - 9.8% | |
| | 1,249 | | | Abbott Laboratories | | | 74,840 | |
| | 1,769 | | | Aetna, Inc. | | | 298,961 | |
| | 470 | | | Align Technology, Inc.* | | | 118,031 | |
| | 606 | | | AmerisourceBergen Corp. | | | 52,243 | |
| | 1,441 | | | Anthem, Inc. | | | 316,588 | |
| | 3,399 | | | Baxter International, Inc. | | | 221,071 | |
| | 135 | | | Becton Dickinson and Co. | | | 29,254 | |
| | 1,505 | | | Boston Scientific Corp.* | | | 41,117 | |
| | 3,580 | | | Cardinal Health, Inc. | | | 224,394 | |
| | 6,585 | | | Centene Corp.* | | | 703,739 | |
| | 2,956 | | | Cerner Corp.* | | | 171,448 | |
| | 404 | | | Cigna Corp. | | | 67,767 | |
| | 2,905 | | | DaVita, Inc.* | | | 191,556 | |
| | 453 | | | Edwards Lifesciences Corp.* | | | 63,203 | |
| | 2,030 | | | Encompass Health Corp. | | | 116,055 | |
| | 7,773 | | | Express Scripts Holding Co.* | | | 536,959 | |
| | 3,582 | | | HCA Healthcare, Inc. | | | 347,454 | |
| | 1,098 | | | Henry Schein, Inc.*(1) | | | 73,797 | |
| | 291 | | | Hill-Rom Holdings, Inc. | | | 25,317 | |
| | 1,436 | | | Humana, Inc. | | | 386,040 | |
| | 559 | | | Laboratory Corp. of America Holdings* | | | 90,418 | |
| | 852 | | | Masimo Corp.* | | | 74,933 | |
| | 785 | | | McKesson Corp. | | | 110,583 | |
| | 1,301 | | | MEDNAX, Inc.* | | | 72,375 | |
| | 602 | | | Patterson Cos., Inc.(1) | | | 13,382 | |
| | 968 | | | Quest Diagnostics, Inc. | | | 97,090 | |
| | 1,012 | | | Stryker Corp. | | | 162,851 | |
| | 1,806 | | | UnitedHealth Group, Inc. | | | 386,484 | |
| | 515 | | | Varian Medical Systems, Inc.* | | | 63,165 | |
| | 2,444 | | | WellCare Health Plans, Inc.* | | | 473,232 | |
| | | | | | | | |
| | | | 5,604,347 | |
| | | | | | | | |
| | | | | | | | |
| Shares or Principal Amount | | Market Value† | |
| COMMON STOCKS - 99.9% - (continued) | |
| | | | Household & Personal Products - 1.6% | |
| | 700 | | | Clorox Co. | | $ | 93,177 | |
| | 104 | | | Colgate-Palmolive Co. | | | 7,455 | |
| | 2,342 | | | Estee Lauder Cos., Inc. Class A | | | 350,644 | |
| | 1,912 | | | Herbalife Ltd.* | | | 186,362 | |
| | 928 | | | Kimberly-Clark Corp. | | | 102,201 | |
| | 2,711 | | | Nu Skin Enterprises, Inc. Class A | | | 199,828 | |
| | 14 | | | Procter & Gamble Co. | | | 1,110 | |
| | | | | | | | |
| | | | 940,777 | |
| | | | | | | | |
| | | | Insurance - 8.0% | |
| | 8,524 | | | Aflac, Inc. | | | 373,010 | |
| | 3,489 | | | Allstate Corp. | | | 330,757 | |
| | 2,361 | | | American Financial Group, Inc. | | | 264,952 | |
| | 698 | | | Assurant, Inc. | | | 63,804 | |
| | 6,462 | | | Athene Holding Ltd. Class A* | | | 308,948 | |
| | 818 | | | Chubb Ltd. | | | 111,878 | |
| | 6,899 | | | CNA Financial Corp.(1) | | | 340,466 | |
| | 5,596 | | | CNO Financial Group, Inc. | | | 121,265 | |
| | 1,269 | | | First American Financial Corp. | | | 74,465 | |
| | 3,767 | | | FNF Group | | | 150,755 | |
| | 3,033 | | | Lincoln National Corp. | | | 221,591 | |
| | 3,510 | | | MetLife, Inc. | | | 161,074 | |
| | 5,605 | | | Old Republic International Corp. | | | 120,227 | |
| | 7,957 | | | Principal Financial Group, Inc. | | | 484,661 | |
| | 3,589 | | | Progressive Corp. | | | 218,678 | |
| | 5,114 | | | Prudential Financial, Inc. | | | 529,555 | |
| | 1,369 | | | Reinsurance Group of America, Inc. | | | 210,826 | |
| | 2,566 | | | Travelers Cos., Inc. | | | 356,315 | |
| | 3,484 | | | Unum Group | | | 165,873 | |
| | | | | | | | |
| | | | 4,609,100 | |
| | | | | | | | |
| | | | Materials - 5.0% | |
| | 274 | | | Air Products & Chemicals, Inc. | | | 43,574 | |
| | 3,191 | | | Alcoa Corp.* | | | 143,467 | |
| | 1,061 | | | Avery Dennison Corp. | | | 112,731 | |
| | 330 | | | Bemis Co., Inc.(1) | | | 14,362 | |
| | 595 | | | Cabot Corp. | | | 33,153 | |
| | 436 | | | Eastman Chemical Co. | | | 46,033 | |
| | 2,316 | | | Freeport-McMoRan, Inc.* | | | 40,692 | |
| | 8,022 | | | Huntsman Corp. | | | 234,644 | |
| | 3,656 | | | International Paper Co. | | | 195,340 | |
| | 7,967 | | | Louisiana-Pacific Corp. | | | 229,211 | |
| | 5,102 | | | LyondellBasell Industries N.V. Class A | | | 539,179 | |
| | 525 | | | Monsanto Co. | | | 61,262 | |
| | 3,361 | | | Nucor Corp. | | | 205,324 | |
| | 4,438 | | | Owens-Illinois, Inc.*(1) | | | 96,127 | |
| | 1,545 | | | Packaging Corp. of America | | | 174,122 | |
| | 1,368 | | | PPG Industries, Inc. | | | 152,669 | |
| | 344 | | | Praxair, Inc. | | | 49,639 | |
| | 1,815 | | | Reliance Steel & Aluminum Co. | | | 155,618 | |
| | 212 | | | Sherwin-Williams Co. | | | 83,129 | |
| | 2,410 | | | Sonoco Products Co. | | | 116,885 | |
| | 2,454 | | | Steel Dynamics, Inc. | | | 108,516 | |
| | 230 | | | WestRock Co. | | | 14,759 | |
| | | | | | | | |
| | | | 2,850,436 | |
| | | | | | | | |
| | | | Pharmaceuticals, Biotechnology & Life Sciences - 5.1% | |
| | 3,219 | | | AbbVie, Inc. | | | 304,678 | |
| | 255 | | | Agilent Technologies, Inc. | | | 17,059 | |
| | 1,197 | | | Amgen, Inc. | | | 204,065 | |
| | 1,073 | | | Biogen, Inc.* | | | 293,809 | |
| | 3,577 | | | Bristol-Myers Squibb Co. | | | 226,245 | |
The accompanying notes are an integral part of these financial statements.
|
| Hartford Multifactor US Equity ETF |
Schedule of Investments – (continued)
March 31, 2018 (Unaudited)
| | | | | | | | |
| Shares or Principal Amount | | Market Value† | |
| COMMON STOCKS - 99.9% - (continued) | |
| | | | Pharmaceuticals, Biotechnology & Life Sciences - 5.1% -
(continued) | |
| | 1,138 | | | Charles River Laboratories International, Inc.* | | $ | 121,470 | |
| | 1,580 | | | Eli Lilly & Co. | | | 122,245 | |
| | 3,091 | | | Gilead Sciences, Inc. | | | 233,030 | |
| | 171 | | | Illumina, Inc.* | | | 40,428 | |
| | 190 | | | IQVIA Holdings, Inc.* | | | 18,641 | |
| | 2,560 | | | Johnson & Johnson | | | 328,064 | |
| | 2,816 | | | Merck & Co., Inc. | | | 153,388 | |
| | 5,630 | | | Mylan N.V.* | | | 231,787 | |
| | 7,541 | | | Pfizer, Inc. | | | 267,630 | |
| | 2,229 | | | United Therapeutics Corp.* | | | 250,450 | |
| | 1,358 | | | Zoetis, Inc. | | | 113,407 | |
| | | | | | | | |
| | | | 2,926,396 | |
| | | | | | | | |
| | | | Real Estate - 3.6% | |
| | 561 | | | American Tower Corp. REIT | | | 81,536 | |
| | 11,115 | | | CBRE Group, Inc. Class A, REIT* | | | 524,850 | |
| | 519 | | | Crown Castle International Corp. REIT | | | 56,888 | |
| | 66 | | | Equinix, Inc. REIT | | | 27,597 | |
| | 302 | | | Hospitality Properties Trust REIT | | | 7,653 | |
| | 2,693 | | | Host Hotels & Resorts, Inc. REIT(1) | | | 50,197 | |
| | 2,037 | | | Iron Mountain, Inc. REIT | | | 66,936 | |
| | 1,182 | | | Jones Lang LaSalle, Inc. | | | 206,424 | |
| | 2,616 | | | Lamar Advertising Co. Class A, REIT | | | 166,535 | |
| | 4,055 | | | LaSalle Hotel Properties REIT(1) | | | 117,636 | |
| | 2,410 | | | Park Hotels & Resorts, Inc. REIT | | | 65,118 | |
| | 1,537 | | | Prologis, Inc. REIT | | | 96,816 | |
| | 29 | | | Public Storage REIT | | | 5,811 | |
| | 3,886 | | | Rayonier, Inc. REIT | | | 136,709 | |
| | 4,022 | | | Realogy Holdings Corp.(1) | | | 109,720 | |
| | 1,003 | | | SBA Communications Corp. REIT* | | | 171,433 | |
| | 258 | | | Ventas, Inc. REIT | | | 12,779 | |
| | 732 | | | Welltower, Inc. REIT | | | 39,843 | |
| | 2,453 | | | Weyerhaeuser Co. REIT | | | 85,855 | |
| | | | | | | | |
| | | | 2,030,336 | |
| | | | | | | | |
| | | | Retailing - 7.0% | |
| | 248 | | | AutoZone, Inc.* | | | 160,875 | |
| | 1,707 | | | Bed Bath & Beyond, Inc.(1) | | | 35,830 | |
| | 7,844 | | | Best Buy Co., Inc. | | | 549,002 | |
| | 777 | | | Burlington Stores, Inc.* | | | 103,457 | |
| | 2,338 | | | Dollar General Corp. | | | 218,720 | |
| | 1,413 | | | Dollar Tree, Inc.* | | | 134,094 | |
| | 983 | | | Foot Locker, Inc. | | | 44,766 | |
| | 10,776 | | | Gap, Inc. | | | 336,211 | |
| | 280 | | | Genuine Parts Co. | | | 25,155 | |
| | 954 | | | Home Depot, Inc. | | | 170,041 | |
| | 5,918 | | | Kohl’s Corp.(1) | | | 387,688 | |
| | 4,162 | | | L Brands, Inc. | | | 159,030 | |
| | 2,022 | | | Lowe’s Cos., Inc. | | | 177,430 | |
| | 5,465 | | | Macy’s, Inc.(1) | | | 162,529 | |
| | 1,070 | | | Michaels Cos., Inc.* | | | 21,090 | |
| | 3,470 | | | Nordstrom, Inc. | | | 167,983 | |
| | 107 | | | O’Reilly Automotive, Inc.* | | | 26,470 | |
| | 1,856 | | | Ross Stores, Inc. | | | 144,731 | |
| | 5,391 | | | Target Corp. | | | 374,297 | |
| | 2,169 | | | TJX Cos., Inc. | | | 176,904 | |
| | 6,188 | | | Urban Outfitters, Inc.* | | | 228,708 | |
| | 3,836 | | | Williams-Sonoma, Inc.(1) | | | 202,387 | |
| | | | | | | | |
| | | | 4,007,398 | |
| | | | | | | | |
| | | | | | | | |
| Shares or Principal Amount | | Market Value† | |
| COMMON STOCKS - 99.9% - (continued) | |
| | | | Semiconductors & Semiconductor Equipment - 6.3% | |
| | 923 | | | Analog Devices, Inc. | | $ | 84,113 | |
| | 6,972 | | | Applied Materials, Inc. | | | 387,713 | |
| | 4,125 | | | Cirrus Logic, Inc.* | | | 167,599 | |
| | 10,128 | | | Intel Corp. | | | 527,466 | |
| | 1,159 | | | KLA-Tencor Corp. | | | 126,343 | |
| | 1,848 | | | Lam Research Corp. | | | 375,440 | |
| | 420 | | | Microchip Technology, Inc.(1) | | | 38,371 | |
| | 12,656 | | | Micron Technology, Inc.* | | | 659,884 | |
| | 643 | | | MKS Instruments, Inc. | | | 74,363 | |
| | 567 | | | NVIDIA Corp. | | | 131,311 | |
| | 9,868 | | | ON Semiconductor Corp.* | | | 241,371 | |
| | 4,694 | | | QUALCOMM, Inc. | | | 260,094 | |
| | 696 | | | Skyworks Solutions, Inc. | | | 69,781 | |
| | 1,886 | | | Teradyne, Inc. | | | 86,209 | |
| | 3,484 | | | Texas Instruments, Inc. | | | 361,953 | |
| | 304 | | | Xilinx, Inc. | | | 21,961 | |
| | | | | | | | |
| | | | 3,613,972 | |
| | | | | | | | |
| | | | Software & Services - 5.4% | |
| | 479 | | | Activision Blizzard, Inc. | | | 32,313 | |
| | 61 | | | Alphabet, Inc. Class A* | | | 63,266 | |
| | 155 | | | Automatic Data Processing, Inc. | | | 17,589 | |
| | 3,032 | | | Booz Allen Hamilton Holding Corp. | | | 117,399 | |
| | 2,405 | | | CA, Inc. | | | 81,530 | |
| | 2,182 | | | Cognizant Technology Solutions Corp. Class A | | | 175,651 | |
| | 1,148 | | | DXC Technology Co. | | | 115,409 | |
| | 5,686 | | | eBay, Inc.* | | | 228,805 | |
| | 957 | | | Electronic Arts, Inc.* | | | 116,027 | |
| | 254 | | | Facebook, Inc. Class A* | | | 40,587 | |
| | 7,836 | | | First Data Corp. Class A* | | | 125,376 | |
| | 124 | | | Fiserv, Inc.* | | | 8,842 | |
| | 155 | | | IAC/InterActiveCorp.* | | | 24,239 | |
| | 2,549 | | | International Business Machines Corp. | | | 391,093 | |
| | 698 | | | Intuit, Inc. | | | 120,998 | |
| | 1,248 | | | Leidos Holdings, Inc. | | | 81,619 | |
| | 1,915 | | | MAXIMUS, Inc. | | | 127,807 | |
| | 1,877 | | | Microsoft Corp. | | | 171,314 | |
| | 2,407 | | | Oracle Corp. | | | 110,120 | |
| | 1,581 | | | Paychex, Inc. | | | 97,374 | |
| | 184 | | | Science Applications International Corp. | | | 14,499 | |
| | 68 | | | Stamps.com, Inc.*(1) | | | 13,671 | |
| | 3,408 | | | Teradata Corp.*(1) | | | 135,195 | |
| | 5,683 | | | VMware, Inc. Class A*(1) | | | 689,177 | |
| | | | | | | | |
| | | | 3,099,900 | |
| | | | | | | | |
| | | | Technology Hardware & Equipment - 9.6% | |
| | 183 | | | Amphenol Corp. Class A | | | 15,762 | |
| | 2,405 | | | Apple, Inc. | | | 403,511 | |
| | 371 | | | Arista Networks, Inc.* | | | 94,716 | |
| | 4,177 | | | Arrow Electronics, Inc.* | | | 321,713 | |
| | 401 | | | Avnet, Inc. | | | 16,746 | |
| | 1,778 | | | CDW Corp. | | | 125,011 | |
| | 3,500 | | | Ciena Corp.* | | | 90,650 | |
| | 11,490 | | | Cisco Systems, Inc. | | | 492,806 | |
| | 11,356 | | | Corning, Inc. | | | 316,605 | |
| | 472 | | | F5 Networks, Inc.* | | | 68,256 | |
| | 15,968 | | | Flex Ltd.* | | | 260,757 | |
| | 17,384 | | | Hewlett Packard Enterprise Co. | | | 304,915 | |
| | 29,517 | | | HP, Inc. | | | 647,013 | |
| | 2,030 | | | Jabil, Inc. | | | 58,322 | |
| | 8,454 | | | Juniper Networks, Inc. | | | 205,686 | |
The accompanying notes are an integral part of these financial statements.
|
| Hartford Multifactor US Equity ETF |
Schedule of Investments – (continued)
March 31, 2018 (Unaudited)
| | | | | | | | |
| Shares or Principal Amount | | Market Value† | |
| COMMON STOCKS - 99.9% - (continued) | |
| | | | Technology Hardware & Equipment - 9.6% - (continued) | |
| | 249 | | | Motorola Solutions, Inc. | | $ | 26,220 | |
| | 1,966 | | | NCR Corp.*(1) | | | 61,968 | |
| | 4,625 | | | NetApp, Inc. | | | 285,316 | |
| | 8,632 | | | Seagate Technology plc | | | 505,145 | |
| | 1,206 | | | SYNNEX Corp. | | | 142,790 | |
| | 3,171 | | | TE Connectivity Ltd. | | | 316,783 | |
| | 2,824 | | | Tech Data Corp.* | | | 240,407 | |
| | 528 | | | Ubiquiti Networks, Inc.*(1) | | | 36,326 | |
| | 3,213 | | | Western Digital Corp. | | | 296,464 | |
| | 5,991 | | | Xerox Corp. | | | 172,421 | |
| | | | | | | | |
| | | | 5,506,309 | |
| | | | | | | | |
| | | | Telecommunication Services - 1.4% | |
| | 5,837 | | | AT&T, Inc. | | | 208,089 | |
| | 2,107 | | | CenturyLink, Inc. | | | 34,618 | |
| | 16,719 | | | Sprint Corp.*(1) | | | 81,589 | |
| | 3,044 | | | T-Mobile US, Inc.* | | | 185,806 | |
| | 6,553 | | | Verizon Communications, Inc. | | | 313,364 | |
| | | | | | | | |
| | | | 823,466 | |
| | | | | | | | |
| | | | Transportation - 4.0% | |
| | 157 | | | Alaska Air Group, Inc. | | | 9,728 | |
| | 5,860 | | | American Airlines Group, Inc.(1) | | | 304,486 | |
| | 337 | | | CH Robinson Worldwide, Inc.(1) | | | 31,580 | |
| | 7,340 | | | Delta Air Lines, Inc. | | | 402,305 | |
| | 851 | | | FedEx Corp. | | | 204,334 | |
| | 11,604 | | | JetBlue Airways Corp.* | | | 235,793 | |
| | 369 | | | Norfolk Southern Corp. | | | 50,103 | |
| | 697 | | | Ryder System, Inc. | | | 50,735 | |
| | 6,166 | | | Southwest Airlines Co. | | | 353,188 | |
| | 74 | | | Union Pacific Corp. | | | 9,948 | |
| | 6,936 | | | United Continental Holdings, Inc.* | | | 481,844 | |
| | 1,323 | | | United Parcel Service, Inc. Class B | | | 138,465 | |
| | | | | | | | |
| | | | 2,272,509 | |
| | | | | | | | |
| | | | Utilities - 2.3% | |
| | 1,457 | | | American Electric Power Co., Inc. | | | 99,936 | |
| | 1,852 | | | Consolidated Edison, Inc. | | | 144,345 | |
| | 1,272 | | | DTE Energy Co. | | | 132,797 | |
| | 1,931 | | | Edison International | | | 122,927 | |
| | 330 | | | Eversource Energy | | | 19,444 | |
| | 5,403 | | | Exelon Corp. | | | 210,771 | |
| | 273 | | | NextEra Energy, Inc. | | | 44,589 | |
| | 2,006 | | | PG&E Corp. | | | 88,123 | |
| | 2,840 | | | PPL Corp. | | | 80,344 | |
| | 730 | | | Public Service Enterprise Group, Inc. | | | 36,675 | |
| | 325 | | | Southern Co. | | | 14,514 | |
| | 7,043 | | | Vistra Energy Corp.*(1) | | | 146,706 | |
| | 502 | | | WEC Energy Group, Inc. | | | 31,475 | |
| | 2,745 | | | Xcel Energy, Inc. | | | 124,843 | |
| | | | | | | | |
| | | | 1,297,489 | |
| | | | | | | | |
| | |
| | | | Total Common Stocks
(cost $52,095,880) | | $ | 57,241,121 | |
| | | | | | | | |
| | |
| | | | Total Long-Term Investments
(cost $52,095,880) | | $ | 57,241,121 | |
| | | | | | | | |
| | | | | | | | |
| Shares or Principal Amount | | Market Value† | |
| SHORT-TERM INVESTMENTS - 0.8% | |
| | | | Securities Lending Collateral - 0.8% | |
| | 463,537 | | | State Street Navigator Securities Lending Government Money Market Portfolio, 1.72%(2) | | $ | 463,537 | |
| | | | | | | | |
| | |
| | | | Total Short-Term Investments
(cost $463,537) | | $ | 463,537 | |
| | | | | | | | |
| | | | | | | | | | | | |
| | | |
| | | | Total Investments
(cost $52,559,417) | | | 100.7 | % | | $ | 57,704,658 | |
| | | | Other Assets and Liabilities | | | (0.7 | )% | | | (385,027 | ) |
| | | | | | | | | | | | |
| | | | Total Net Assets | | | 100.0 | % | | $ | 57,319,631 | |
| | | | | | | | | | | | |
The accompanying notes are an integral part of these financial statements.
|
| Hartford Multifactor US Equity ETF |
Schedule of Investments – (continued)
March 31, 2018 (Unaudited)
| Note: | Percentage of investments as shown is the ratio of the total market value to total net assets. |
| | Equity industry classifications used in this report are the Global Industry Classification Standard, which was developed by and is the exclusive property and service mark of MSCI, Inc. and Standard & Poor’s. |
| | For Fund compliance purposes, the Fund may not use the same classification system shown in this report as these classifications are used for financial reporting purposes. |
| (1) | Represents entire or partial securities on loan. See Note 7 in the accompanying Notes to Financial Statements for securities lending information. |
| (2) | Current yield as of period end. |
| † | See Significant Accounting Policies of accompanying Notes to Financial Statements regarding valuation of investments. |
| | |
| GLOSSARY: (abbreviations used in preceding Schedule of Investments) |
|
| Other Abbreviations: |
REIT | | Real Estate Investment Trust |
The accompanying notes are an integral part of these financial statements.
|
| Hartford Multifactor US Equity ETF |
Schedule of Investments – (continued)
March 31, 2018 (Unaudited)
Fair Valuation Summary
The following is a summary of the fair valuations according to the inputs used as of March 31, 2018 in valuing the Fund’s investments.
| | | | | | | | | | | | | | | | |
| | | Total | | | Level 1(1) | | | Level 2(1) | | | Level 3(1) | |
Assets | |
Common Stocks | |
Automobiles & Components | | $ | 691,287 | | | $ | 691,287 | | | $ | — | | | $ | — | |
Banks | | | 3,432,276 | | | | 3,432,276 | | | | — | | | | — | |
Capital Goods | | | 2,882,004 | | | | 2,882,004 | | | | — | | | | — | |
Commercial & Professional Services | | | 696,809 | | | | 696,809 | | | | — | | | | — | |
Consumer Durables & Apparel | | | 874,950 | | | | 874,950 | | | | — | | | | — | |
Consumer Services | | | 625,072 | | | | 625,072 | | | | — | | | | — | |
Diversified Financials | | | 2,011,843 | | | | 2,011,843 | | | | — | | | | — | |
Energy | | | 3,501,257 | | | | 3,501,257 | | | | — | | | | — | |
Food & Staples Retailing | | | 1,577,915 | | | | 1,577,915 | | | | — | | | | — | |
Food, Beverage & Tobacco | | | 1,365,273 | | | | 1,365,273 | | | | — | | | | — | |
Health Care Equipment & Services | | | 5,604,347 | | | | 5,604,347 | | | | — | | | | — | |
Household & Personal Products | | | 940,777 | | | | 940,777 | | | | — | | | | — | |
Insurance | | | 4,609,100 | | | | 4,609,100 | | | | — | | | | — | |
Materials | | | 2,850,436 | | | | 2,850,436 | | | | — | | | | — | |
Pharmaceuticals, Biotechnology & Life Sciences | | | 2,926,396 | | | | 2,926,396 | | | | — | | | | — | |
Real Estate | | | 2,030,336 | | | | 2,030,336 | | | | — | | | | — | |
Retailing | | | 4,007,398 | | | | 4,007,398 | | | | — | | | | — | |
Semiconductors & Semiconductor Equipment | | | 3,613,972 | | | | 3,613,972 | | | | — | | | | — | |
Software & Services | | | 3,099,900 | | | | 3,099,900 | | | | — | | | | — | |
Technology Hardware & Equipment | | | 5,506,309 | | | | 5,506,309 | | | | — | | | | — | |
Telecommunication Services | | | 823,466 | | | | 823,466 | | | | — | | | | — | |
Transportation | | | 2,272,509 | | | | 2,272,509 | | | | — | | | | — | |
Utilities | | | 1,297,489 | | | | 1,297,489 | | | | — | | | | — | |
Short-Term Investments | | | 463,537 | | | | 463,537 | | | | — | | | | — | |
| | | | | | | | | | | | | | | | |
Total | | $ | 57,704,658 | | | $ | 57,704,658 | | | $ | — | | | $ | — | |
| | | | | | | | | | | | | | | | |
| (1) | For the six-month period ended March 31, 2018, there were no transfers between any levels. |
The accompanying notes are an integral part of these financial statements.
|
| Hartford Multifactor ETFs |
Statements of Assets and Liabilities
March 31, 2018 (Unaudited)
| | | | | | | | | | | | |
| | | Hartford
Multifactor
Developed
Markets (ex-US)
ETF | | | Hartford
Multifactor
Emerging
Markets ETF | | | Hartford
Multifactor
Global Small
Cap ETF | |
Assets: | |
Investments in securities, at market value(1) | | $ | 340,620,399 | | | $ | 67,764,043 | | | $ | 22,863,801 | |
Cash | | | 319,983 | | | | 98,566 | | | | 4,095 | |
Foreign currency | | | 701,044 | | | | 43,969 | | | | 13,705 | |
Receivables: | |
Investment securities sold | | | 144 | | | | 221,753 | | | | 55 | |
Fund shares sold | | | 8,682,355 | | | | — | | | | — | |
Dividends and interest | | | 975,844 | | | | 232,596 | | | | 72,733 | |
Securities lending income | | | 18,359 | | | | 870 | | | | 1,579 | |
Tax reclaims | | | 82,218 | | | | 390 | | | | 845 | |
| | | | | | | | | | | | |
Total assets | | | 351,400,346 | | | | 68,362,187 | | | | 22,956,813 | |
| | | | | | | | | | | | |
Liabilities: | |
Obligation to return securities lending collateral | | | 16,032,646 | | | | 1,247,147 | | | | 903,887 | |
Payables: | |
Investment securities purchased | | | 9,488,202 | | | | 157,038 | | | | 6,717 | |
Investment management fees | | | 73,913 | | | | 27,371 | | | | 7,351 | |
| | | | | | | | | | | | |
Total liabilities | | | 25,594,761 | | | | 1,431,556 | | | | 917,955 | |
| | | | | | | | | | | | |
Net assets | | $ | 325,805,585 | | | $ | 66,930,631 | | | $ | 22,038,858 | |
| | | | | | | | | | | | |
Summary of Net Assets: | |
Paid-in-capital | | $ | 316,018,519 | | | $ | 62,575,196 | | | $ | 19,485,120 | |
Undistributed (distributions in excess of) net investment income | | | 1,184,198 | | | | 210,889 | | | | 25,183 | |
Accumulated net realized gain (loss) | | | (1,956,407 | ) | | | (3,840,004 | ) | | | (483,950 | ) |
Unrealized appreciation (depreciation) of investments and the translation of assets and liabilities denominated in foreign currency | | | 10,559,275 | | | | 7,984,550 | | | | 3,012,505 | |
| | | | | | | | | | | | |
Net assets | | $ | 325,805,585 | | | $ | 66,930,631 | | | $ | 22,038,858 | |
| | | | | | | | | | | | |
Net asset value per share | | $ | 28.96 | | | $ | 25.74 | | | $ | 31.48 | |
| | | | | | | | | | | | |
Shares issued and outstanding | | | 11,250,000 | | | | 2,600,000 | | | | 700,000 | |
| | | | | | | | | | | | |
Cost of investments | | $ | 330,060,590 | | | $ | 59,780,162 | | | $ | 19,851,435 | |
Cost of foreign currency | | $ | 702,016 | | | $ | 43,887 | | | $ | 13,719 | |
(1) Includes Investment in securities on loan, at value | | $ | 28,899,505 | | | $ | 3,035,569 | | | $ | 2,191,748 | |
The accompanying notes are an integral part of these financial statements.
|
| Hartford Multifactor ETFs |
Statements of Assets and Liabilities – (continued)
March 31, 2018 (Unaudited)
| | | | | | | | |
| | | Hartford
Multifactor Low
Volatility
International
Equity ETF | | | Hartford
Multifactor Low
Volatility US
Equity ETF | |
Assets: | |
Investments in securities, at market value(1) | | $ | 5,581,411 | | | $ | 5,265,168 | |
Cash | | | 428 | | | | 2,585 | |
Foreign currency | | | 5,610 | | | | — | |
Receivables: | |
Investment securities sold | | | 1 | | | | — | |
Dividends and interest | | | 23,638 | | | | 5,557 | |
Securities lending income | | | 168 | | | | 38 | |
Tax reclaims | | | 1,373 | | | | — | |
| | | | | | | | |
Total assets | | | 5,612,629 | | | | 5,273,348 | |
| | | | | | | | |
Liabilities: | |
Obligation to return securities lending collateral | | | 121,186 | | | | 46,042 | |
Payables: | |
Investment management fees | | | 1,360 | | | | 700 | |
| | | | | | | | |
Total liabilities | | | 122,546 | | | | 46,742 | |
| | | | | | | | |
Net assets | | $ | 5,490,083 | | | $ | 5,226,606 | |
| | | | | | | | |
Summary of Net Assets: | |
Paid-in-capital | | $ | 5,136,738 | | | $ | 5,112,974 | |
Undistributed (distributions in excess of) net investment income | | | 18,677 | | | | 2,650 | |
Accumulated net realized gain (loss) | | | (52,278 | ) | | | (77,516 | ) |
Unrealized appreciation (depreciation) of investments and the translation of assets and liabilities denominated in foreign currency | | | 386,946 | | | | 188,498 | |
| | | | | | | | |
Net assets | | $ | 5,490,083 | | | $ | 5,226,606 | |
| | | | | | | | |
Net asset value per share | | $ | 27.45 | | | $ | 26.13 | |
| | | | | | | | |
Shares issued and outstanding | | | 200,000 | | | | 200,000 | |
| | | | | | | | |
Cost of investments | | $ | 5,194,502 | | | $ | 5,076,670 | |
Cost of foreign currency | | $ | 5,628 | | | $ | — | |
(1) Includes Investment in securities on loan, at value | | $ | 133,424 | | | $ | 185,920 | |
The accompanying notes are an integral part of these financial statements.
|
| Hartford Multifactor ETFs |
Statements of Assets and Liabilities – (continued)
March 31, 2018 (Unaudited)
| | | | | | | | |
| | | Hartford
Multifactor REIT
ETF | | | Hartford
Multifactor US
Equity ETF | |
Assets: | |
Investments in securities, at market value(1) | | $ | 11,508,210 | | | $ | 57,704,658 | |
Cash | | | 18,988 | | | | 31,761 | |
Receivables: | |
Dividends and interest | | | 62,342 | | | | 54,686 | |
Securities lending income | | | 425 | | | | 592 | |
| | | | | | | | |
Total assets | | | 11,589,965 | | | | 57,791,697 | |
| | | | | | | | |
Liabilities: | |
Obligation to return securities lending collateral | | | 473,309 | | | | 463,537 | |
Payables: | |
Investment securities purchased | | | 20,961 | | | | — | |
Investment management fees | | | 4,218 | | | | 8,529 | |
| | | | | | | | |
Total liabilities | | | 498,488 | | | | 472,066 | |
| | | | | | | | |
Net assets | | $ | 11,091,477 | | | $ | 57,319,631 | |
| | | | | | | | |
Summary of Net Assets: | |
Paid-in-capital | | $ | 12,190,232 | | | $ | 53,288,509 | |
Undistributed (distributions in excess of) net investment income | | | (18,589 | ) | | | 24,855 | |
Accumulated net realized gain (loss) | | | (423,666 | ) | | | (1,138,974 | ) |
Unrealized appreciation (depreciation) of investments | | | (656,500 | ) | | | 5,145,241 | |
| | | | | | | | |
Net assets | | $ | 11,091,477 | | | $ | 57,319,631 | |
| | | | | | | | |
Net asset value per share | | $ | 13.86 | | | $ | 30.98 | |
| | | | | | | | |
Shares issued and outstanding | | | 800,000 | | | | 1,850,000 | |
| | | | | | | | |
Cost of investments | | $ | 12,164,710 | | | $ | 52,559,417 | |
(1) Includes Investment in securities on loan, at value | | $ | 1,283,594 | | | $ | 1,877,015 | |
The accompanying notes are an integral part of these financial statements.
|
| Hartford Multifactor ETFs |
Statements of Operations
For the Six-Month Period Ended March 31, 2018 (Unaudited)
| | | | | | | | | | | | |
| | | Hartford
Multifactor
Developed
Markets
(ex-US) ETF | | | Hartford
Multifactor
Emerging
Markets ETF | | | Hartford
Multifactor
Global Small
Cap ETF | |
Investment Income: | |
Dividends | | $ | 2,499,436 | | | $ | 644,253 | | | $ | 214,745 | |
Interest | | | — | | | | 3 | | | | 1 | |
Securities lending | | | 35,690 | | | | 2,494 | | | | 7,703 | |
Less: Foreign tax withheld | | | (236,335 | ) | | | (86,526 | ) | | | (18,434 | ) |
| | | | | | | | | | | | |
Total investment income, net | | | 2,298,791 | | | | 560,224 | | | | 204,015 | |
| | | | | | | | | | | | |
Expenses: | |
Investment management fees | | | 342,525 | | | | 159,746 | | | | 49,686 | |
| | | | | | | | | | | | |
Total expenses (before waivers) | | | 342,525 | | | | 159,746 | | | | 49,686 | |
| | | | | | | | | | | | |
Total expenses, net | | | 342,525 | | | | 159,746 | | | | 49,686 | |
| | | | | | | | | | | | |
Net Investment Income (Loss) | | | 1,956,266 | | | | 400,478 | | | | 154,329 | |
| | | | | | | | | | | | |
Net Realized Gain (Loss) on Investments and Foreign Currency Transactions: | |
Net realized gain (loss) on investments | | | 1,995,376 | (1) | | | 13,562 | | | | 250,809 | |
Net realized gain (loss) on other foreign currency transactions | | | (12,508 | ) | | | (7,673 | ) | | | 849 | |
| | | | | | | | | | | | |
Net Realized Gain (Loss) on Investments and Foreign Currency Transactions | | | 1,982,868 | | | | 5,889 | | | | 251,658 | |
| | | | | | | | | | | | |
Net Changes in Unrealized Appreciation (Depreciation) of Investments and Foreign Currency Transactions: | |
Net unrealized appreciation (depreciation) of investments | | | (1,261,283 | ) | | | 2,613,174 | | | | 602,370 | |
Net unrealized appreciation (depreciation) of translation of other assets and liabilities in foreign currencies | | | 153 | | | | 1,152 | | | | 564 | |
| | | | | | | | | | | | |
Net Changes in Unrealized Appreciation (Depreciation) of Investments and Foreign Currency Transactions | | | (1,261,130 | ) | | | 2,614,326 | | | | 602,934 | |
| | | | | | | | | | | | |
Net Gain (Loss) on Investments and Foreign Currency Transactions | | | 721,738 | | | | 2,620,215 | | | | 854,592 | |
| | | | | | | | | | | | |
Net Increase (Decrease) in Net Assets Resulting from Operations | | $ | 2,678,004 | | | $ | 3,020,693 | | | $ | 1,008,921 | |
| | | | | | | | | | | | |
| (1) | Includes realized gains/(losses) as a result of in-kind redemptions (See Note 9 in Notes to Financial Statements). |
The accompanying notes are an integral part of these financial statements.
|
| Hartford Multifactor ETFs |
Statements of Operations – (continued)
For the Six-Month Period Ended March 31, 2018 (Unaudited)
| | | | | | | | |
| | | Hartford
Multifactor
Low Volatility
International
Equity ETF | | | Hartford
Multifactor
Low Volatility
US Equity ETF | |
Investment Income: | |
Dividends | | $ | 63,843 | | | $ | 46,910 | |
Securities lending | | | 387 | | | | 236 | |
Less: Foreign tax withheld | | | (7,848 | ) | | | — | |
| | | | | | | | |
Total investment income, net | | | 56,382 | | | | 47,146 | |
| | | | | | | | |
Expenses: | |
Investment management fees | | | 10,059 | | | | 5,320 | |
| | | | | | | | |
Total expenses (before waivers) | | | 10,059 | | | | 5,320 | |
| | | | | | | | |
Total expenses, net | | | 10,059 | | | | 5,320 | |
| | | | | | | | |
Net Investment Income (Loss) | | | 46,323 | | | | 41,826 | |
| | | | | | | | |
Net Realized Gain (Loss) on Investments and Foreign Currency Transactions: | |
Net realized gain (loss) on investments | | | 10,092 | | | | (15,475 | ) |
Net realized gain (loss) on other foreign currency transactions | | | 196 | | | | — | |
| | | | | | | | |
Net Realized Gain (Loss) on Investments and Foreign Currency Transactions | | | 10,288 | | | | (15,475 | ) |
| | | | | | | | |
Net Changes in Unrealized Appreciation (Depreciation) of Investments and Foreign Currency Transactions: | |
Net unrealized appreciation (depreciation) of investments | | | 172,816 | | | | 52,348 | |
Net unrealized appreciation (depreciation) of translation of other assets and liabilities in foreign currencies | | | 51 | | | | — | |
| | | | | | | | |
Net Changes in Unrealized Appreciation (Depreciation) of Investments and Foreign Currency Transactions | | | 172,867 | | | | 52,348 | |
| | | | | | | | |
Net Gain (Loss) on Investments and Foreign Currency Transactions | | | 183,155 | | | | 36,873 | |
| | | | | | | | |
Net Increase (Decrease) in Net Assets Resulting from Operations | | $ | 229,478 | | | $ | 78,699 | |
| | | | | | | | |
The accompanying notes are an integral part of these financial statements.
|
| Hartford Multifactor ETFs |
Statements of Operations – (continued)
For the Six-Month Period Ended March 31, 2018 (Unaudited)
| | | | | | | | |
| | | Hartford
Multifactor
REIT ETF | | | Hartford
Multifactor US
Equity ETF | |
Investment Income: | |
Dividends | | $ | 266,045 | | | $ | 414,599 | |
Securities lending | | | 2,811 | | | | 3,640 | |
Less: Foreign tax withheld | | | — | | | | (87 | ) |
| | | | | | | | |
Total investment income, net | | | 268,856 | | | | 418,152 | |
| | | | | | | | |
Expenses: | |
Investment management fees | | | 22,310 | | | | 53,019 | |
| | | | | | | | |
Total expenses (before waivers) | | | 22,310 | | | | 53,019 | |
| | | | | | | | |
Total expenses, net | | | 22,310 | | | | 53,019 | |
| | | | | | | | |
Net Investment Income (Loss) | | | 246,546 | | | | 365,133 | |
| | | | | | | | |
Net Realized Gain (Loss) on Investments: | |
Net realized gain (loss) on investments | | | (218,661 | ) | | | 892,806 | (1) |
| | | | | | | | |
Net Realized Gain (Loss) on Investments | | | (218,661 | ) | | | 892,806 | |
| | | | | | | | |
Net Changes in Unrealized Appreciation (Depreciation) of Investments: | |
Net unrealized appreciation (depreciation) of investments | | | (853,746 | ) | | | 1,206,608 | |
| | | | | | | | |
Net Changes in Unrealized Appreciation (Depreciation) of Investments | | | (853,746 | ) | | | 1,206,608 | |
| | | | | | | | |
Net Gain (Loss) on Investments | | | (1,072,407 | ) | | | 2,099,414 | |
| | | | | | | | |
Net Increase (Decrease) in Net Assets Resulting from Operations | | $ | (825,861 | ) | | $ | 2,464,547 | |
| | | | | | | | |
| (1) | Includes realized gains/(losses) as a result of in-kind redemptions (See Note 9 in Notes to Financial Statements). |
The accompanying notes are an integral part of these financial statements.
|
| Hartford Multifactor ETFs |
Statements of Changes in Net Assets
| | | | | | | | | | | | | | | | |
| | | Hartford Multifactor Developed
Markets (ex-US) ETF | | | Hartford Multifactor Emerging
Markets ETF | |
| | | For the
Six-Month
Period Ended
March 31,
2018
(Unaudited) | | | For the
Year Ended
September 30,
2017
| | | For the
Six-Month
Period Ended
March 31,
2018
(Unaudited) | | | For the
Year Ended
September 30,
2017
| |
Operations: | |
Net investment income (loss) | | $ | 1,956,266 | | | $ | 1,949,086 | | | $ | 400,478 | | | $ | 740,348 | |
Net realized gain (loss) on investments and foreign currency transactions | | | 1,982,868 | | | | 157,190 | | | | 5,889 | | | | (147,090 | ) |
Net changes in unrealized appreciation (depreciation) of investments and foreign currency transactions | | | (1,261,130 | ) | | | 10,204,543 | | | | 2,614,326 | | | | 4,665,940 | |
| | | | | | | | | | | | | | | | |
Net Increase (Decrease) in Net Assets Resulting from Operations | | | 2,678,004 | | | | 12,310,819 | | | | 3,020,693 | | | | 5,259,198 | |
| | | | | | | | | | | | | | | | |
Distributions to Shareholders: | |
From net investment income | | | (1,777,434 | ) | | | (1,474,420 | ) | | | (537,539 | ) | | | (592,581 | ) |
| | | | | | | | | | | | | | | | |
Total distributions | | | (1,777,434 | ) | | | (1,474,420 | ) | | | (537,539 | ) | | | (592,581 | ) |
| | | | | | | | | | | | | | | | |
Fund Share Transactions: | |
Sold | | | 214,227,451 | | | | 94,471,911 | | | | 18,208,072 | | | | 17,786,392 | |
Redeemed | | | (20,649,464 | ) | | | (8,420,992 | ) | | | — | | | | — | |
| | | | | | | | | | | | | | | | |
Net increase from capital share transactions | | | 193,577,987 | | | | 86,050,919 | | | | 18,208,072 | | | | 17,786,392 | |
| | | | | | | | | | | | | | | | |
Net Increase (Decrease) in Net Assets | | | 194,478,557 | | | | 96,887,318 | | | | 20,691,226 | | | | 22,453,009 | |
| | | | | | | | | | | | | | | | |
Net Assets: | |
Beginning of period | | | 131,327,028 | | | | 34,439,710 | | | | 46,239,405 | | | | 23,786,396 | |
| | | | | | | | | | | | | | | | |
End of period | | $ | 325,805,585 | | | $ | 131,327,028 | | | $ | 66,930,631 | | | $ | 46,239,405 | |
| | | | | | | | | | | | | | | | |
Undistributed (distributions in excess of) net investment income | | $ | 1,184,198 | | | $ | 1,005,366 | | | $ | 210,889 | | | $ | 347,950 | |
| | | | | | | | | | | | | | | | |
The accompanying notes are an integral part of these financial statements.
|
| Hartford Multifactor ETFs |
Statements of Changes in Net Assets – (continued)
| | | | | | | | | | | | | | | | |
| | | Hartford Multifactor Global
Small Cap ETF | | | Hartford Multifactor Low
Volatility International Equity
ETF | |
| | | For the
Six-Month
Period Ended
March 31,
2018
(Unaudited) | | | For the
Year Ended
September 30,
2017
| | | For the
Six-Month
Period Ended
March 31,
2018
(Unaudited) | | | For the
Period Ended
September 30,
2017(1) | |
Operations: | |
Net investment income (loss) | | $ | 154,329 | | | $ | 268,553 | | | $ | 46,323 | | | $ | 46,919 | |
Net realized gain (loss) on investments and foreign currency transactions | | | 251,658 | | | | 850,129 | | | | 10,288 | | | | (11,348 | ) |
Net changes in unrealized appreciation (depreciation) of investments and foreign currency transactions | | | 602,934 | | | | 1,525,835 | | | | 172,867 | | | | 214,079 | |
| | | | | | | | | | | | | | | | |
Net Increase (Decrease) in Net Assets Resulting from Operations | | | 1,008,921 | | | | 2,644,517 | | | | 229,478 | | | | 249,650 | |
| | | | | | | | | | | | | | | | |
Distributions to Shareholders: | |
From net investment income | | | (265,720 | ) | | | (251,783 | ) | | | (56,176 | ) | | | (14,211 | ) |
| | | | | | | | | | | | | | | | |
Total distributions | | | (265,720 | ) | | | (251,783 | ) | | | (56,176 | ) | | | (14,211 | ) |
| | | | | | | | | | | | | | | | |
Fund Share Transactions: | |
Sold | | | 3,147,582 | | | | 8,539,305 | | | | — | | | | 7,743,372 | |
Redeemed | | | — | | | | (2,968,571 | ) | | | — | | | | (2,662,030 | ) |
| | | | | | | | | | | | | | | | |
Net increase from capital share transactions | | | 3,147,582 | | | | 5,570,734 | | | | — | | | | 5,081,342 | |
| | | | | | | | | | | | | | | | |
Net Increase (Decrease) in Net Assets | | | 3,890,783 | | | | 7,963,468 | | | | 173,302 | | | | 5,316,781 | |
| | | | | | | | | | | | | | | | |
Net Assets: | |
Beginning of period | | | 18,148,075 | | | | 10,184,607 | | | | 5,316,781 | | | | — | |
| | | | | | | | | | | | | | | | |
End of period | | $ | 22,038,858 | | | $ | 18,148,075 | | | $ | 5,490,083 | | | $ | 5,316,781 | |
| | | | | | | | | | | | | | | | |
Undistributed (distributions in excess of) net investment income | | $ | 25,183 | | | $ | 136,574 | | | $ | 18,677 | | | $ | 28,530 | |
| | | | | | | | | | | | | | | | |
| (1) | Commenced operations on May 10, 2017. |
The accompanying notes are an integral part of these financial statements.
|
| Hartford Multifactor ETFs |
Statements of Changes in Net Assets – (continued)
| | | | | | |
Hartford Multifactor Low Volatility
US Equity ETF | |
For the
Six-Month
Period Ended
March 31,
2018
(Unaudited) | | | For the
Period Ended
September 30,
2017(1)
| |
| | | | | | |
| $ | 41,826 | | | $ | 30,508 | |
| | (15,475 | ) | | | (36,047 | ) |
|
52,348 |
| | | 136,150 | |
| | | | | | |
| | 78,699 | | | | 130,611 | |
| | | | | | |
| | | | | | |
| | (43,218 | ) | | | (25,561 | ) |
| | | | | | |
| | (43,218 | ) | | | (25,561 | ) |
| | | | | | |
| | | | | | |
| | 1,329,697 | | | | 5,033,332 | |
| | — | | | | (1,276,954 | ) |
| | | | | | |
| | 1,329,697 | | | | 3,756,378 | |
| | | | | | |
| | 1,365,178 | | | | 3,861,428 | |
| | | | | | |
| | | | | | |
| | 3,861,428 | | | | — | |
| | | | | | |
| $ | 5,226,606 | | | $ | 3,861,428 | |
| | | | | | |
| $ | 2,650 | | | $ | 4,042 | |
| | | | | | |
| (1) | Commenced operations on May 10, 2017. |
The accompanying notes are an integral part of these financial statements.
|
| Hartford Multifactor ETFs |
Statements of Changes in Net Assets – (continued)
| | | | | | | | | | | | | | | | |
| | | Hartford Multifactor REIT ETF | | | Hartford Multifactor
US Equity ETF | |
| | | For the
Six-Month
Period Ended
March 31,
2018
(Unaudited) | | | For the
Period Ended
September 30,
2017(1)
| | | For the
Six-Month
Period Ended
March 31,
2018
(Unaudited) | | | For the
Year Ended
September 30,
2017
| |
Operations: | |
Net investment income (loss) | | $ | 246,546 | | | $ | 218,318 | | | $ | 365,133 | | | $ | 522,633 | |
Net realized gain (loss) on investments | | | (218,661 | ) | | | 113,713 | | | | 892,806 | | | | 2,469,755 | |
Net changes in unrealized appreciation (depreciation) of investments | | | (853,746 | ) | | | 197,246 | | | | 1,206,608 | | | | 2,146,848 | |
| | | | | | | | | | | | | | | | |
Net Increase (Decrease) in Net Assets Resulting from Operations | | | (825,861 | ) | | | 529,277 | | | | 2,464,547 | | | | 5,139,236 | |
| | | | | | | | | | | | | | | | |
Distributions to Shareholders: | |
From net investment income | | | (293,558 | ) | | | (184,839 | ) | | | (349,259 | ) | | | (500,859 | ) |
| | | | | | | | | | | | | | | | |
From net realized gain on investments | | | — | | | | (5,056 | ) | | | — | | | | — | |
| | | | | | | | | | | | | | | | |
Total distributions | | | (293,558 | ) | | | (189,895 | ) | | | (349,259 | ) | | | (500,859 | ) |
| | | | | | | | | | | | | | | | |
Fund Share Transactions: | |
Sold | | | 2,873,418 | | | | 13,571,282 | | | | 22,265,406 | | | | 15,231,487 | |
Redeemed | | | — | | | | (4,573,186 | ) | | | (1,585,033 | ) | | | (13,456,609 | ) |
| | | | | | | | | | | | | | | | |
Net increase from capital share transactions | | | 2,873,418 | | | | 8,998,096 | | | | 20,680,373 | | | | 1,774,878 | |
| | | | | | | | | | | | | | | | |
Net Increase (Decrease) in Net Assets | | | 1,753,999 | | | | 9,337,478 | | | | 22,795,661 | | | | 6,413,255 | |
| | | | | | | | | | | | | | | | |
Net Assets: | |
Beginning of period | | | 9,337,478 | | | | — | | | | 34,523,970 | | | | 28,110,715 | |
| | | | | | | | | | | | | | | | |
End of period | | $ | 11,091,477 | | | $ | 9,337,478 | | | $ | 57,319,631 | | | $ | 34,523,970 | |
| | | | | | | | | | | | | | | | |
Undistributed (distributions in excess of) net investment income | | $ | (18,589 | ) | | $ | 28,423 | | | $ | 24,855 | | | $ | 8,981 | |
| | | | | | | | | | | | | | | | |
| (1) | Commenced operations on October 3, 2016. |
The accompanying notes are an integral part of these financial statements.
|
| Hartford Multifactor ETFs |
Financial Highlights
| | | | | | | | | | | | | | | | | | | | | | | | | | | | | | | | | | | | | | | | | | | | | | | | | | | | | | | | |
| | | — Selected Per-Share Data(1) — | | | — Ratios and Supplemental Data — | |
| | | Net Asset
Value at
Beginning
of Period | | | Net
Investment
Income
(Loss) | | | Net
Realized
and
Unrealized
Gain (Loss)
on
Investments | | | Total from
Investment
Operations | | | Dividends
from Net
Investment
Income | | | Distributions
from
Capital
Gains | | | Total
Dividends
and
Distributions | | | Net
Asset
Value at
End of
Period | | | Total
Return(2) | | | Net
Assets at
End of
Period
(000s) | | | Ratio of
Expenses
to
Average
Net
Assets
Before
Adjust-
ments(3) | | | Ratio of
Expenses
to
Average
Net
Assets
After
Adjust-
ments | | | Ratio of
Net
Investment
Income
(Loss) to
Average
Net Assets | | | Portfolio
Turnover(4) | |
| Hartford Multifactor Developed Markets (ex-US) ETF | |
For the Six-Month Period Ended March 31, 2018 (Unaudited) | |
| | $ | 28.24 | | | $ | 0.29 | | | $ | 0.74 | | | $ | 1.03 | | | $ | (0.31 | ) | | $ | — | | | $ | (0.31 | ) | | $ | 28.96 | | | | 3.65 | %(5) | | $ | 325,806 | | | | 0.35 | %(6) | | | 0.35 | %(6) | | | 2.02 | %(6) | | | 26 | % |
|
For the Year Ended September 30, 2017 | |
| | $ | 24.60 | | | $ | 0.82 | | | $ | 3.55 | | | $ | 4.37 | | | $ | (0.73 | ) | | $ | — | | | $ | (0.73 | ) | | $ | 28.24 | | | | 18.18 | % | | $ | 131,327 | | | | 0.42 | % | | | 0.40 | % | | | 3.13 | % | | | 46 | % |
|
For the Year Ended September 30, 2016 | |
| | $ | 22.84 | | | $ | 0.70 | | | $ | 1.70 | | | $ | 2.40 | | | $ | (0.64 | ) | | $ | — | | | $ | (0.64 | ) | | $ | 24.60 | | | | 10.62 | % | | $ | 34,440 | | | | 0.58 | % | | | 0.50 | % | | | 2.97 | % | | | 54 | % |
|
For the Period Ended September 30, 2015(7) | |
| | $ | 25.00 | | | $ | 0.55 | | | $ | (2.35 | ) | | $ | (1.80 | ) | | $ | (0.36 | ) | | $ | — | | | $ | (0.36 | ) | | $ | 22.84 | | | | (7.36 | )% | | $ | 27,406 | | | | 0.50 | %(6) | | | 0.50 | %(6) | | | 3.75 | %(6) | | | 42 | % |
|
| Hartford Multifactor Emerging Markets ETF | |
For the Six-Month Period Ended March 31, 2018 (Unaudited) | |
| | $ | 24.34 | | | $ | 0.18 | | | $ | 1.48 | | | $ | 1.66 | | | $ | (0.26 | ) | | $ | — | | | $ | (0.26 | ) | | $ | 25.74 | | | | 6.79 | %(5) | | $ | 66,931 | | | | 0.56 | %(6) | | | 0.56 | %(6) | | | 1.41 | %(6) | | | 12 | % |
|
For the Year Ended September 30, 2017 | |
| | $ | 21.62 | | | $ | 0.49 | | | $ | 2.63 | | | $ | 3.12 | | | $ | (0.40 | ) | | $ | — | | | $ | (0.40 | ) | | $ | 24.34 | | | | 14.63 | % | | $ | 46,239 | | | | 0.62 | % | | | 0.60 | % | | | 2.17 | % | | | 30 | % |
|
For the Year Ended September 30, 2016 | |
| | $ | 19.68 | | | $ | 0.45 | | | $ | 1.91 | | | $ | 2.36 | | | $ | (0.42 | ) | | $ | — | | | $ | (0.42 | ) | | $ | 21.62 | | | | 12.20 | % | | $ | 23,786 | | | | 0.76 | % | | | 0.65 | % | | | 2.22 | % | | | 49 | % |
|
For the Period Ended September 30, 2015(7) | |
| | $ | 25.00 | | | $ | 0.44 | | | $ | (5.55 | ) | | $ | (5.11 | ) | | $ | (0.21 | ) | | $ | — | | | $ | (0.21 | ) | | $ | 19.68 | | | | (20.59 | )% | | $ | 19,685 | | | | 0.65 | %(6) | | | 0.65 | %(6) | | | 3.23 | %(6) | | | 17 | % |
|
| Hartford Multifactor Global Small Cap ETF | |
For the Six-Month Period Ended March 31, 2018 (Unaudited) | |
| | $ | 30.25 | | | $ | 0.25 | | | $ | 1.42 | | | $ | 1.67 | | | $ | (0.44 | ) | | $ | — | | | $ | (0.44 | ) | | $ | 31.48 | | | | 5.55 | %(5) | | $ | 22,039 | | | | 0.51 | %(6) | | | 0.51 | %(6) | | | 1.57 | %(6) | | | 24 | % |
|
For the Year Ended September 30, 2017 | |
| | $ | 25.46 | | | $ | 0.57 | | | $ | 4.79 | | | $ | 5.36 | | | $ | (0.57 | ) | | $ | — | | | $ | (0.57 | ) | | $ | 30.25 | | | | 21.37 | % | | $ | 18,148 | | | | 0.60 | % | | | 0.56 | % | | | 2.08 | % | | | 48 | % |
|
For the Year Ended September 30, 2016 | |
| | $ | 22.69 | | | $ | 0.60 | | | $ | 2.76 | | | $ | 3.36 | | | $ | (0.59 | ) | | $ | — | | | $ | (0.59 | ) | | $ | 25.46 | | | | 15.05 | % | | $ | 10,185 | | | | 0.83 | % | | | 0.60 | % | | | 2.54 | % | | | 62 | % |
|
For the Period Ended September 30, 2015(8) | |
| | $ | 25.00 | | | $ | 0.44 | | | $ | (2.54 | ) | | $ | (2.10 | ) | | $ | (0.21 | ) | | $ | — | | | $ | (0.21 | ) | | $ | 22.69 | | | | (8.50 | )%(5) | | $ | 6,807 | | | | 0.60 | %(6) | | | 0.60 | %(6) | | | 3.44 | %(6) | | | 44 | % |
|
| Hartford Multifactor Low Volatility International Equity ETF | |
For the Six-Month Period Ended March 31, 2018 (Unaudited) | |
| | $ | 26.58 | | | $ | 0.23 | | | $ | 0.92 | | | $ | 1.15 | | | $ | (0.28 | ) | | $ | — | | | $ | (0.28 | ) | | $ | 27.45 | | | | 4.33 | %(5) | | $ | 5,490 | | | | 0.37 | %(6) | | | 0.37 | %(6) | | | 1.68 | %(6) | | | 14 | % |
|
For the Period Ended September 30, 2017(9) | |
| | $ | 25.02 | | | $ | 0.30 | | | $ | 1.40 | | | $ | 1.70 | | | $ | (0.14 | ) | | $ | — | | | $ | (0.14 | ) | | $ | 26.58 | | | | 6.84 | %(5) | | $ | 5,317 | | | | 0.39 | %(6) | | | 0.39 | %(6) | | | 3.01 | %(6) | | | 48 | % |
|
| Hartford Multifactor Low Volatility US Equity ETF | |
For the Six-Month Period Ended March 31, 2018 (Unaudited) | |
| | $ | 25.74 | | | $ | 0.27 | | | $ | 0.38 | | | $ | 0.65 | | | $ | (0.26 | ) | | $ | — | | | $ | (0.26 | ) | | $ | 26.13 | | | | 2.50 | %(5) | | $ | 5,227 | | | | 0.26 | %(6) | | | 0.26 | %(6) | | | 2.08 | %(6) | | | 8 | % |
|
For the Period Ended September 30, 2017(9) | |
| | $ | 25.03 | | | $ | 0.20 | | | $ | 0.68 | | | $ | 0.88 | | | $ | (0.17 | ) | | $ | — | | | $ | (0.17 | ) | | $ | 25.74 | | | | 3.53 | %(5) | | $ | 3,861 | | | | 0.29 | %(6) | | | 0.29 | %(6) | | | 2.05 | %(6) | | | 16 | % |
The accompanying notes are an integral part of these financial statements.
|
| Hartford Multifactor ETFs |
Financial Highlights – (continued)
| | | | | | | | | | | | | | | | | | | | | | | | | | | | | | | | | | | | | | | | | | | | | | | | | | | | | | | | |
| | | — Selected Per-Share Data(1) — | | | — Ratios and Supplemental Data — | |
| | | Net Asset
Value at
Beginning
of Period | | | Net
Investment
Income
(Loss) | | | Net
Realized
and
Unrealized
Gain (Loss)
on
Investments | | | Total from
Investment
Operations | | | Dividends
from Net
Investment
Income | | | Distributions
from
Capital
Gains | | | Total
Dividends
and
Distributions | | | Net
Asset
Value at
End of
Period | | | Total
Return(2) | | | Net
Assets at
End of
Period
(000s) | | | Ratio of
Expenses
to
Average
Net
Assets
Before
Adjust-
ments(3) | | | Ratio of
Expenses
to
Average
Net
Assets
After
Adjust-
ments | | | Ratio of
Net
Investment
Income
(Loss) to
Average
Net Assets | | | Portfolio
Turnover(4) | |
| Hartford Multifactor REIT ETF | |
For the Six-Month Period Ended March 31, 2018 (Unaudited) | |
| | $ | 15.56 | | | $ | 0.37 | | | $ | (1.65 | ) | | $ | (1.28 | ) | | $ | (0.42 | ) | | $ | — | | | $ | (0.42 | ) | | $ | 13.86 | | | | (8.30 | )%(5) | | $ | 11,091 | | | | 0.45 | %(6) | | | 0.45 | %(6) | | | 4.97 | %(6) | | | 19 | % |
|
For the Period Ended September 30, 2017(10) | |
| | $ | 14.79 | | | $ | 0.50 | | | $ | 0.74 | | | $ | 1.24 | | | $ | (0.45 | ) | | $ | (0.02 | ) | | $ | (0.47 | ) | | $ | 15.56 | | | | 8.47 | %(5) | | $ | 9,337 | | | | 0.50 | %(6) | | | 0.45 | %(6) | | | 3.29 | %(6) | | | 43 | % |
| Hartford Multifactor US Equity ETF | |
For the Six-Month Period Ended March 31, 2018 (Unaudited) | |
| | $ | 28.77 | | | $ | 0.28 | | | $ | 2.17 | | | $ | 2.45 | | | $ | (0.24 | ) | | $ | — | | | $ | (0.24 | ) | | $ | 30.98 | | | | 8.50 | %(5) | | $ | 57,320 | | | | 0.26 | %(6) | | | 0.26 | %(6) | | | 1.79 | %(6) | | | 17 | % |
|
For the Year Ended September 30, 2017 | |
| | $ | 24.44 | | | $ | 0.51 | | | $ | 4.30 | | | $ | 4.81 | | | $ | (0.48 | ) | | $ | — | | | $ | (0.48 | ) | | $ | 28.77 | | | | 19.84 | % | | $ | 34,524 | | | | 0.34 | % | | | 0.31 | % | | | 1.92 | % | | | 36 | % |
|
For the Year Ended September 30, 2016 | |
| | $ | 22.90 | | | $ | 0.52 | | | $ | 1.53 | | | $ | 2.05 | | | $ | (0.51 | ) | | $ | — | | | $ | (0.51 | ) | | $ | 24.44 | | | | 9.01 | % | | $ | 28,111 | | | | 0.44 | % | | | 0.35 | % | | | 2.22 | % | | | 51 | % |
|
For the Period Ended September 30, 2015(7) | |
| | $ | 25.00 | | | $ | 0.26 | | | $ | (2.11 | ) | | $ | (1.85 | ) | | $ | (0.25 | ) | | $ | — | | | $ | (0.25 | ) | | $ | 22.90 | | | | (7.46 | )%(5) | | $ | 22,900 | | | | 0.35 | %(6) | | | 0.35 | %(6) | | | 1.82 | %(6) | | | 38 | % |
| (1) | Information presented relates to a share outstanding throughout the indicated period. Net investment income (loss) per share amounts are calculated based on average shares outstanding unless otherwise noted. |
| (2) | Total return is calculated assuming a hypothetical purchase of beneficial shares on the opening of the first day at the net asset value and a sale on the closing of the last day at the net asset value of each period reported. Dividends and distributions, if any, are assumed for purposes of this calculation, to be reinvested at market price at the end of the distribution day. |
| (3) | Adjustments include waivers and reimbursements, if applicable. |
| (4) | Portfolio turnover rate excludes securities received or delivered from in-kind processing of creations or redemptions. |
| (7) | Commenced operations on February 25, 2015. |
| (8) | Commenced operations on March 23, 2015. |
| (9) | Commenced operations on May 10, 2017. |
| (10) | Commenced operations on October 3, 2016. |
The accompanying notes are an integral part of these financial statements.
|
| Hartford Multifactor ETFs |
Notes to Financial Statements
March 31, 2018 (Unaudited)
Lattice Strategies Trust (the “Trust”) is an open-end registered management investment company comprised of seven series as of March 31, 2018. Financial statements for the series of the Trust listed below (each, a “Fund” and collectively, the “Funds”) are included in this report.
Lattice Strategies Trust:
Hartford Multifactor Developed Markets (ex-US) ETF (the “Multifactor Developed Markets (ex-US) ETF”)
Hartford Multifactor Emerging Markets ETF (the “Multifactor Emerging Markets ETF”)
Hartford Multifactor Global Small Cap ETF (the “Multifactor Global Small Cap ETF”)
Hartford Multifactor Low Volatility International Equity ETF (the “Multifactor Low Volatility International Equity ETF”)
Hartford Multifactor Low Volatility US Equity ETF (the “Multifactor Low Volatility US Equity ETF”)
Hartford Multifactor REIT ETF (the “Multifactor REIT ETF”)
Hartford Multifactor US Equity ETF (the “Multifactor US Equity ETF”)
Each Fund is an exchange-traded fund (‘‘ETF’’). ETFs are funds that trade on an exchange like other publicly traded securities. Each Fund is designed to track an index. Shares of Multifactor Developed Markets (ex-US) ETF, Multifactor Emerging Markets ETF, Multifactor Global Small Cap ETF, Multifactor REIT ETF and Multifactor US Equity ETF are listed and traded on NYSE Arca, Inc. (“NYSE Arca”). Shares of Multifactor Low Volatility International Equity ETF and Multifactor Low Volatility US Equity ETF are listed and traded on Cboe BZX Exchange, Inc. (“Cboe BZX”). Each share of a Fund represents a partial ownership in assets and liabilities including securities held by the Fund. Shares of a Fund may be purchased or redeemed directly from the Fund in Creation Units at net asset value (“NAV”) only by certain large institutional investors (‘‘Authorized Participants’’) who have entered into agreements with ALPS Distributors, Inc. (‘‘ALPS’’ or the ‘‘Distributor’’), the Funds’ Distributor.
The assets of each Fund are separate, and a shareholder’s interest is limited to the Fund in which shares are held. The Trust was organized as a Delaware statutory trust on April 15, 2014 and is registered with the Securities and Exchange Commission (the “SEC”) under the Investment Company Act of 1940, as amended (the “1940 Act”). The shares of the Funds are registered under the Securities Act of 1933, as amended (the ‘‘Securities Act’’). Each Fund, except Multifactor REIT ETF, is a diversified open-end management investment company. Multifactor REIT ETF is a non-diversified open-end management investment company. Each Fund applies specialized accounting and reporting standards under Financial Accounting Standards Board (“FASB”) Accounting Standards Codification Topic 946 “Financial Services – Investment Companies.”
Multifactor Low Volatility International Equity ETF and Multifactor Low Volatility US Equity ETF commenced operations on May 10, 2017. Multifactor REIT ETF commenced operations on October 3, 2016. Multifactor Global Small Cap ETF commenced operations on March 23, 2015. Each of the other Funds commenced operations on February 25, 2015.
| 2. | Significant Accounting Policies: |
The following is a summary of significant accounting policies of each Fund used in the preparation of its financial statements, which are in accordance with United States Generally Accepted Accounting Principles (“U.S. GAAP”). The preparation of financial statements in accordance with U.S. GAAP may require management to make estimates and assumptions that affect the reported amounts of assets and liabilities and disclosure of contingent assets and liabilities at the date of the financial statements and the reported amounts of increases and decreases in net assets from operations during the reporting period. Actual results could differ from those estimates.
| | a) | Determination of Net Asset Value – The NAV of each Fund’s shares is computed by dividing the value of the net assets of the Fund (i.e., the value of its total assets less total liabilities) by the total number of shares outstanding. Expenses and fees, including the management fees, are accrued daily and taken into account for purposes of determining net asset value. The net asset value of a Fund is calculated by State Street Bank and Trust Company (“State Street”) and determined as of the close of the regular trading session on the New York Stock Exchange (ordinarily 4:00 p.m. Eastern time) (“the NYSE Close”) on each day that such exchange is open (“Valuation Date”). Fixed-income assets are generally valued as of the announced closing time for trading in fixed-income instruments in a particular market or exchange. Creation/redemption order cut-off times may be earlier on any day that the Securities Industry and Financial Markets Association (or applicable exchange or market on which a Fund’s investments are traded) announces an early closing time. Any assets or liabilities denominated in currencies other than the U.S. dollar are converted into U.S. dollars at market rates on the date of valuation (generally as of 4:00 p.m. London time) as quoted by one or more sources. |
|
| Hartford Multifactor ETFs |
Notes to Financial Statements – (continued)
March 31, 2018 (Unaudited)
| | b) | Investment Valuation and Fair Value Measurements – For purposes of calculating the NAV of each Fund, the Fund’s investments are generally valued using market valuations. A market valuation generally means a valuation (i) obtained from an exchange, a pricing service, or a major market maker (or dealer), (ii) based on a price quotation or other equivalent indication of value supplied by an exchange, a pricing service, or a major market maker (or dealer) or (iii) based on amortized cost. In the case of shares of other funds that are not traded on an exchange, a market valuation means such fund’s published net asset value per share. Lattice Strategies LLC (“Lattice” or the “Adviser”) may use various pricing services, or discontinue the use of any pricing service, as approved by the Trust’s Board of Trustees (the “Board”) from time to time. A price obtained from a pricing service based on such pricing service’s valuation matrix may be considered a market valuation. |
The Board generally reviews and approves the “Procedures for Valuation of Portfolio Investments.” These procedures define how investments are to be valued, including the formation and activities of the Valuation Committee. The Trust’s Valuation Committee is responsible for determining in good faith the fair value of investments when the value cannot be obtained from primary pricing services or alternative sources or if the valuation of an investment as provided by the primary pricing service or alternative source is believed not to reflect the investment’s fair value as of the Valuation Date. The Valuation Committee will consider all relevant factors in determining an investment’s fair value, and may seek the advice of such Fund’s sub-adviser, as applicable, knowledgeable brokers, and legal counsel in making such determination. The Valuation Committee reports to the Audit Committee of the Board. The Audit Committee receives quarterly written reports that include details of all fair-valued investments, including the reason for the fair valuation, and an indication, when possible, of the accuracy of the valuation by disclosing the next available reliable public price quotation or the disposition price of such investments (the “lookback” test). The Board then must consider for ratification all of the fair value determinations made during the previous quarter.
In the event that current market valuations are not readily available or such valuations do not reflect current market value, the Trust’s procedures require the Valuation Committee to determine a security’s fair value. In determining such value, the Valuation Committee may consider, among other things, (i) price comparisons among multiple sources, (ii) a review of corporate actions and news events, and (iii) a review of relevant financial indicators (e.g., movement in interest rates and market indices). In these cases, the Fund’s net asset value may reflect certain portfolio securities’ fair values rather than their market prices. Fair value pricing involves subjective judgments and it is possible that the fair value determination for a security may be materially different from the value that could be realized upon the sale of the security. In addition, fair value pricing could result in a difference between the prices used to calculate a Fund’s net asset value and the prices used by the Fund’s benchmark Index. This may result in a difference between the Fund’s performance and the performance of the applicable Fund’s benchmark Index. With respect to securities that are primarily listed on foreign exchanges, the value of a Fund’s portfolio securities may change on days when you will not be able to purchase or sell your shares.
Fixed income investments (other than short-term obligations), non-exchange traded derivatives and centrally cleared swaps held by a Fund are normally valued on the basis of quotes obtained from brokers and dealers or independent pricing services in accordance with procedures established by the Board. Prices obtained from independent pricing services use information provided by market makers or estimates of market values obtained from yield data relating to investments or securities with similar characteristics. Short-term investments maturing in 60 days or less are generally valued at amortized cost if their original term to maturity was 60 days or less, or by amortizing their value on the 61st day prior to maturity, if the original term exceeded 60 days.
Exchange traded options, futures and options on futures are valued at the settlement price or last trade price determined by the relevant exchange as of the close of such exchange. If a last trade price is not available, the value will be the mean of the bid and ask prices as of the close of such exchange. If a mean of the bid and ask prices cannot be calculated for the day, the value will be the bid price as of the close of such exchange. In the case of options privately negotiated in the OTC market (“OTC options”) and such instruments that do not trade on an exchange, values may be supplied by a pricing service using a formula or other objective method that may take into consideration the style, direction, expiration, strike price, notional value and volatility or other special adjustments.
Investments valued in currencies other than U.S. dollars are converted to U.S. dollars using exchange rates obtained from independent pricing services for calculation of the NAV. As a result, the NAV of a Fund’s shares may be affected by changes in the value of currencies in relation to the U.S. dollar. The value of securities or other instruments traded in markets outside the United States or denominated in currencies other than the U.S. dollar may be affected significantly on a day that the exchange on which a Fund is listed is closed and the market value may change on days when an investor is not able to purchase, redeem or exchange shares of a Fund.
|
| Hartford Multifactor ETFs |
Notes to Financial Statements – (continued)
March 31, 2018 (Unaudited)
Foreign currency contracts represent agreements to exchange currencies on specific future dates at predetermined rates. Foreign currency contracts are valued using foreign currency exchange rates and forward rates as provided by an independent pricing service on the Valuation Date.
Financial instruments for which prices are not available from an independent pricing service may be valued using market quotations obtained from one or more dealers that make markets in the respective financial instrument in accordance with procedures established by the Board.
U.S. GAAP defines fair value as the price that a Fund would receive to sell an asset or pay to transfer a liability in an orderly transaction between market participants. The U.S. GAAP fair value measurement standards require disclosure of a fair value hierarchy for each major category of assets and liabilities. Various inputs are used in determining the fair value of each Fund’s investments. These inputs are summarized into three broad hierarchy levels. This hierarchy is based on whether the valuation inputs are observable or unobservable. These levels are:
| | • | | Level 1 – Quoted prices in active markets for identical investments. Level 1 may include exchange traded instruments, such as domestic equities, some foreign equities, options, futures, mutual funds, exchange traded funds, rights and warrants. |
| | • | | Level 2 – Observable inputs other than Level 1 prices, such as quoted prices for similar investments; quoted prices in markets that are not active; or other inputs that are observable or can be corroborated by observable market data. Level 2 may include debt investments that are traded less frequently than exchange traded instruments and which are valued using independent pricing services; senior floating rate interests, which are valued using an aggregate of dealer bids; short-term investments, which are valued at amortized cost; and swaps, which are valued based upon the terms of each swap contract. |
| | • | | Level 3 – Significant unobservable inputs that are supported by limited or no market activity. Level 3 may include financial instruments whose values are determined using indicative market quotes or require significant management judgment or estimation. These unobservable valuation inputs may include estimates for current yields, maturity/duration, prepayment speed, and indicative market quotes for comparable investments along with other assumptions relating to credit quality, collateral value, complexity of the investment structure, general market conditions and liquidity. This category may include investments where trading has been halted or there are certain restrictions on trading. While these investments are priced using unobservable inputs, the valuation of these investments reflects the best available data and management believes the prices are a reasonable representation of exit price. |
Valuation levels are not necessarily indicative of the risk associated with investing in such investments. Individual investments within any of the above mentioned asset classes may be assigned a different hierarchical level than those presented above, as individual circumstances dictate.
| | c) | Investment Transactions and Investment Income – Investment transactions are recorded as of the trade date (the date the order to buy or sell is executed) for financial reporting purposes. Realized gains and losses are determined on the basis of identified cost. |
Dividend income from domestic securities is accrued on the ex-dividend date. The Multifactor REIT Fund dividend income and capital gain loss amounts include estimates based on prior year REIT allocations. In general, dividend income from foreign securities is recorded on the ex-date; however, dividend notifications in certain foreign jurisdictions may not be available in a timely manner and as a result, a Fund will record the dividend as soon as the relevant details (i.e., rate per share, payment date, shareholders of record, etc.) are publicly available. Interest income, including amortization of premium, accretion of discounts, inflation adjustments and additional principal received in-kind in lieu of cash, is accrued on a daily basis.
| | d) | Taxes – A Fund may be subject to taxes imposed on realized gains on securities of certain foreign countries in which such Fund invests. A Fund may also be subject to taxes withheld on foreign dividends from securities in which the Fund invests. The amount of any foreign taxes withheld and foreign tax expense is included on the accompanying Statements of Operations as a reduction to net investment income or net realized gain on investments in these securities, if applicable. |
| | e) | Foreign Currency Transactions – Assets and liabilities denominated in currencies other than U.S. dollars are translated into U.S. dollars at the exchange rates in effect on the Valuation Date. Purchases and sales of investments, income and expenses are translated into U.S. dollars at the exchange rates on the dates of such transactions. |
A Fund does not isolate that portion of portfolio investment valuation resulting from fluctuations in the foreign currency exchange rates from the fluctuations arising from changes in the market prices of investments held. Exchange rate fluctuations are included with the net realized and unrealized gain or loss on investments in the accompanying financial statements.
|
| Hartford Multifactor ETFs |
Notes to Financial Statements – (continued)
March 31, 2018 (Unaudited)
Net realized foreign exchange gains or losses arise from sales of foreign currencies and the difference between asset and liability amounts initially stated in foreign currencies and the U.S. dollar value of the amounts actually received or paid. Net unrealized foreign exchange gains or losses arise from changes in the value of other assets and liabilities at the end of the reporting period, resulting from changes in the exchange rates.
| | f) | Dividend Distributions to Shareholders – Dividends are declared pursuant to a policy adopted by the Board. Dividends and/or distributions to shareholders are recorded on ex-date. The policy of Multifactor Developed Markets (ex-US) ETF, Multifactor Emerging Markets ETF, Multifactor Global Small Cap ETF and Multifactor Low Volatility International Equity ETF is to pay dividends from net investment income and realized gains, if any, semi-annually. The policy of Multifactor Low Volatility US Equity ETF, Multifactor REIT ETF and Multifactor US Equity ETF is to pay dividends from net investment income, if any, quarterly, but amounts may vary significantly from period to period and realized gains, if any, are paid at least once a year. Dividends may be declared and paid more frequently or at any other times to comply with the distribution requirements of the Internal Revenue Code. |
Income dividends and capital gains distributions are determined in accordance with federal income tax regulations, which may differ from U.S. GAAP with respect to character and timing (see Federal Income Taxes: Distributions and Components of Distributable Earnings and Reclassification of Capital Accounts notes).
| 3. | Securities and Other Investments: |
| | a) | Illiquid and Restricted Investments – Each Fund is permitted to invest up to 15% of its net assets in illiquid investments. Illiquid investments are those that may not be sold or disposed of in the ordinary course of business within seven days, at approximately the price used to determine a Fund’s NAV. A Fund may not be able to sell illiquid investments when its sub-adviser considers it desirable to do so or may have to sell such investments at a price that is lower than the price that could be obtained if the investments were more liquid. A sale of illiquid investments may require more time and may result in higher dealer discounts and other selling expenses than does the sale of those that are liquid. Illiquid investments also may be more difficult to value due to the unavailability of reliable market quotations for such investments, and an investment in them may have an adverse impact on a Fund’s NAV. Each Fund may also purchase certain restricted investments that can only be resold to certain qualified investors and may be determined to be liquid pursuant to policies and guidelines established by the Board. See each Fund’s Schedule of Investments, if applicable, for illiquid or restricted investments as of March 31, 2018. |
A Fund’s investments expose it to various types of risks associated with financial instruments and the markets. A Fund may be exposed to the risks described below. Each Fund’s prospectus provides details of its principal risks.
Investing in the securities of non-U.S. issuers, whether directly or indirectly, involves certain considerations and risks not typically associated with securities of U.S. issuers. Such risks include, but are not limited to: generally less liquid and less efficient securities markets; generally greater price volatility; exchange rate fluctuations; imposition of restrictions on the expatriation of funds or other protectionist measures; less publicly available information about issuers; the imposition of withholding or other taxes; higher transaction and custody costs; settlement delays and risk of loss attendant in settlement procedures; difficulties in enforcing contractual obligations; less regulation of securities markets; different accounting, disclosure and reporting requirements; more substantial governmental involvement in the economy; higher inflation rates; and greater social, economic and political uncertainties. These risks are heightened for investments in issuers from countries with less developed markets.
Securities lending involves the risk that a Fund may lose money because the borrower of the loaned securities fails to return the securities in a timely manner or at all. A Fund could also lose money in the event of a decline in the value of the collateral provided for the loaned securities or a decline in the value of any investments made with cash collateral. These events could also trigger adverse tax consequences for a Fund that lends its holdings.
| | a) | Each Fund intends to continue to qualify as a Regulated Investment Company (“RIC”) under Subchapter M of the Internal Revenue Code (“IRC”) by distributing substantially all of its taxable net investment income and net realized capital gains to its shareholders each year. Each Fund has distributed substantially all of its income and capital gains in prior years, if applicable, and intends to |
|
| Hartford Multifactor ETFs |
Notes to Financial Statements – (continued)
March 31, 2018 (Unaudited)
| | distribute substantially all of its income and capital gains during the calendar year ending December 31, 2018. Accordingly, no provision for federal income or excise taxes has been made in the accompanying financial statements. Distributions from short-term capital gains are treated as ordinary income distributions for federal income tax purposes. |
| | b) | Capital Loss Carryforward – Under the Regulated Investment Company Modernization Act of 2010, funds are permitted to carry forward capital losses for an unlimited period. |
At September 30, 2017 (tax year end), each Fund’s capital loss carryforwards for U.S. federal income tax purposes were as follows:
| | | | | | | | |
Fund | | Unlimited
Short-Term
Capital Loss
Carryforward | | | Unlimited
Long-Term
Capital Loss
Carryforward | |
Multifactor Developed Markets (ex-US) ETF | | $ | 2,762,515 | | | $ | 950,432 | |
Multifactor Emerging Markets ETF | | | 2,768,759 | | | | 837,262 | |
Multifactor Global Small Cap ETF | | | 495,573 | | | | 138,420 | |
Multifactor Low Volatility International Equity ETF | | | 39,166 | | | | — | |
Multifactor Low Volatility US Equity ETF | | | 58,189 | | | | — | |
Multifactor REIT ETF | | | 90,353 | | | | — | |
Multifactor US Equity ETF | | | 1,355,456 | | | | 557,980 | |
During the year ended September 30, 2017, Multifactor Global Small Cap ETF utilized $6,849 of prior year capital loss carryforwards.
| | c) | Tax Basis of Investments – The aggregate cost of investments for federal income tax purposes at March 31, 2018 was substantially the same for book purposes. The net unrealized appreciation/(depreciation) on investments, which consists of gross unrealized appreciation and depreciation, is disclosed below: |
| | | | | | | | | | | | | | | | |
Fund | | Tax Cost | | | Gross
Unrealized
Appreciation | | | Gross
Unrealized
Depreciation | | | Net Unrealized
Appreciation
(Depreciation) | |
Multifactor Developed Markets (ex-US) ETF | | $ | 330,060,590 | | | $ | 15,926,768 | | | $ | (5,366,931 | ) | | $ | 10,559,837 | |
Multifactor Emerging Markets ETF | | | 59,780,162 | | | | 9,404,806 | | | | (1,420,925 | ) | | | 7,983,881 | |
Multifactor Global Small Cap ETF | | | 19,851,435 | | | | 3,506,478 | | | | (494,112 | ) | | | 3,012,366 | |
Multifactor Low Volatility International Equity ETF | | | 5,194,502 | | | | 511,232 | | | | (124,323 | ) | | | 386,909 | |
Multifactor Low Volatility US Equity ETF | | | 5,076,670 | | | | 295,906 | | | | (107,408 | ) | | | 188,498 | |
Multifactor REIT ETF | | | 12,164,710 | | | | 211,002 | | | | (867,502 | ) | | | (656,500 | ) |
Multifactor US Equity ETF | | | 52,559,417 | | | | 6,061,628 | | | | (916,387 | ) | | | 5,145,241 | |
| | a) | Investment Advisory Agreement – Lattice Strategies LLC (“Lattice” or “Adviser”) serves as each Fund’s investment adviser pursuant to an Investment Advisory Agreement with the Trust. Lattice is a wholly owned subsidiary of Hartford Funds Management Company, LLC (“HFMC”), which is an indirect subsidiary of The Hartford Financial Services Group, Inc. (“The Hartford”). Lattice has overall investment supervisory responsibility for each Fund. In addition, Lattice provides administrative personnel, services, equipment, facilities and office space for proper operation of each Fund. Lattice has contracted with BNY Mellon Asset Management North America Corporation (“BNY Mellon AMNA”) under a sub-advisory agreement pursuant to which BNY Mellon AMNA performs the daily investment of the assets of each Fund in accordance with the Fund’s investment objective and policies. Each Fund pays a fee to Lattice, a portion of which may be used to compensate BNY Mellon AMNA. |
|
| Hartford Multifactor ETFs |
Notes to Financial Statements – (continued)
March 31, 2018 (Unaudited)
The schedule below reflects the rates of compensation paid to Lattice for investment advisory services rendered as of March 31, 2018; the rates are accrued daily and paid monthly based on each Fund’s average daily net assets, at the following annual rates:
| | |
Fund | | Management Fee Rates |
Multifactor Developed Markets (ex-US) ETF | | 0.29% |
Multifactor Emerging Markets ETF | | 0.49% |
Multifactor Global Small Cap ETF | | 0.39% |
Multifactor Low Volatility International Equity ETF | | 0.29% |
Multifactor Low Volatility US Equity ETF | | 0.19% |
Multifactor REIT ETF | | 0.45% |
Multifactor US Equity ETF | | 0.19% |
Prior to February 15, 2018, the Funds listed below paid the following rates to Lattice for investment advisory services rendered:
| | |
Fund | | Management Fee Rates |
Multifactor Developed Markets (ex-US) ETF | | 0.39% |
Multifactor Emerging Markets ETF | | 0.59% |
Multifactor Global Small Cap ETF | | 0.55% |
Multifactor Low Volatility International Equity ETF | | 0.39% |
Multifactor Low Volatility US Equity ETF | | 0.29% |
Multifactor REIT ETF | | 0.45% |
Multifactor US Equity ETF | | 0.29% |
From time to time, the Adviser may waive all or a portion of its fee. Under the Investment Advisory Agreement, the Adviser agrees to pay all expenses of the Trust, except (i) brokerage expenses and other expenses (such as stamp taxes and acquired fund fees and expenses) connected with the execution of portfolio transactions or in connection with creation and redemption transactions; (ii) legal fees or expenses in connection with any arbitration, litigation or pending or threatened arbitration or litigation, including any settlements in connection therewith; (iii) extraordinary expenses; (iv) distribution fees and expenses paid by the Trust under any distribution plan adopted pursuant to Rule 12b-1 under the 1940 Act; and (v) the advisory fee payable to the Adviser hereunder. The Adviser also does not pay any acquired fund fees and expenses. The payment or assumption by the Adviser of any expense of the Trust that the Adviser is not required by the Investment Advisory Agreement to pay or assume shall not obligate the Adviser to pay or assume the same or any similar expense of the Trust on any subsequent occasion.
| | b) | Distribution Plans – Each Fund has adopted a Rule 12b-1 Distribution and Service Plan in accordance with Rule 12b-1 under the 1940 Act pursuant to which payments of up to 0.25 percent of each Fund’s average daily net assets may be made for the sale and distribution of its shares. The Board has determined that the Funds may not make payments under the Rule 12b-1 Distribution and Service Plan until authorized to do so by affirmative action of the Board. No Rule 12b-1 fees are currently paid by the Funds and there are no plans to impose these fees. However, in the event Rule 12b-1 fees are charged in the future, they will be paid out of the respective Fund’s assets, and over time, these fees increase the cost of your investment and they may cost you more than certain other types of sales charges. |
For the period ended March 31, 2018, the Funds did not pay any Rule 12b-1 fees.
Each Fund may lend Fund securities to certain creditworthy borrowers in U.S. and non-U.S. markets in an amount not to exceed one third (33 1⁄3 percent) of the value of its total assets. The borrowers provide collateral that is marked to market daily, in an amount at least equal to the current market value of the securities loaned. A Fund may terminate a loan at any time and recall the securities loaned. A Fund receives the value of any interest or cash or non-cash distributions paid on the loaned securities. A Fund cannot vote proxies for securities on loan, but may recall loans to vote proxies if a material issue affecting the Fund’s economic interest in the investment is to be voted upon. Interest earned on securities out on loan is not eligible for qualified interest income for federal tax purposes. Should the borrower of the securities fail financially, a Fund may experience delays in recovering the securities or exercising its rights in the collateral. Loans are made only to borrowers that are deemed by the securities lending agent to be of good financial standing. In a loan transaction, a Fund will also
|
| Hartford Multifactor ETFs |
Notes to Financial Statements – (continued)
March 31, 2018 (Unaudited)
bear the risk of any decline in value of securities acquired with cash collateral received by the Fund. Each Fund will seek to minimize this risk by limiting the investment of cash collateral to high quality instruments of short maturity. This strategy is not used to leverage a Fund.
With respect to loans that are collateralized by cash, the borrower will be entitled to receive a fee based on the amount of cash collateral. A Fund is compensated by the difference between the amount earned on the reinvestment of cash collateral and the fee paid to the borrower. In the case of collateral other than cash, a Fund is compensated by a fee paid by the borrower equal to a percentage of the market value of the loaned securities. Any cash collateral may be reinvested in certain short-term instruments either directly on behalf of the lending Fund or through one or more joint accounts or money market funds, which may include those managed by the Adviser. Any non-cash collateral received cannot be sold, re-invested or pledged by the Fund, except in the event of borrower default.
A Fund may pay a portion of the interest or fees earned from securities lending to a borrower as described above, and to one or more securities lending agents approved by the Board who administer the lending program for the Funds in accordance with guidelines approved by the Board. In such capacity, the lending agent causes the delivery of loaned securities from a Fund to borrowers, arranges for the return of loaned securities to the Fund at the termination of a loan, requests deposit of collateral, monitors the daily value of the loaned securities and collateral, requests that borrowers add to the collateral when required by the loan agreements, and provides recordkeeping and accounting services necessary for the operation of the program. State Street has been approved by the Board to serve as securities lending agent for the Funds and the Trust has entered into an agreement with State Street for such services. Among other matters, the Trust has agreed to indemnify State Street for certain liabilities. Any securities lending income earned by a Fund appears on the Statements of Operations net of any fees paid to State Street for serving as the securities lending agent.
Securities lending involves exposure to certain risks, including operational risk (i.e., the risk of losses resulting from problems in the settlement and accounting process – especially so in certain international markets such as Taiwan), ‘‘gap’’ risk (i.e., the risk of a mismatch between the return on cash collateral reinvestments and the fees a Fund has agreed to pay a borrower), risk of loss of collateral, credit, legal, counterparty and market risk. Although State Street has agreed to provide a Fund with indemnification in the event of a borrower default, a Fund is still exposed to the risk of losses in the event a borrower does not return a Fund’s securities as agreed. For example, delays in recovery of lent securities loaned may cause a Fund to lose the opportunity to sell the securities at a desirable price.
At March 31, 2018, the following Funds had securities on loan at value, cash collateral and non-cash collateral as follows:
| | | | | | | | | | | | |
Fund | | Market Value of
Securities on Loan | | | Cash
Collateral | | | Non-Cash
Collateral | |
Multifactor Developed Markets (ex-US) ETF | | $ | 28,899,505 | | | $ | 16,032,646 | | | $ | 14,344,706 | |
Multifactor Emerging Markets ETF | | | 3,035,569 | | | | 1,247,147 | | | | 1,904,358 | |
Multifactor Global Small Cap ETF | | | 2,191,748 | | | | 903,887 | | | | 1,375,523 | |
Multifactor Low Volatility International Equity ETF | | | 133,424 | | | | 121,186 | | | | 18,834 | |
Multifactor Low Volatility US Equity ETF | | | 185,920 | | | | 46,042 | | | | 144,213 | |
Multifactor REIT ETF | | | 1,283,594 | | | | 473,309 | | | | 856,379 | |
Multifactor US Equity ETF | | | 1,877,015 | | | | 463,537 | | | | 1,456,163 | |
|
| Hartford Multifactor ETFs |
Notes to Financial Statements – (continued)
March 31, 2018 (Unaudited)
The following table reflects a breakdown of transactions accounted for as secured borrowings, the gross obligation by the type of collateral pledged, and the remaining contractual maturity of those transactions as of March 31, 2018.
Multifactor Developed Markets (ex-US) ETF
CERTAIN TRANSFERS ACCOUNTED FOR AS SECURED BORROWINGS
Remaining Contractual Maturity of the Agreements
| | | | | | | | | | | | | | | | | | | | |
| | | Overnight and
Continuous | | | <30 days | | | Between
30 & 90 days | | | >90 days | | | Total | |
Securities Lending Transactions(1) | |
Common Stocks | | $ | 16,032,646 | | | $ | — | | | $ | — | | | $ | — | | | $ | 16,032,646 | |
| | | | | | | | | | | | | | | | | | | | |
Total Borrowings | | $ | 16,032,646 | | | $ | — | | | $ | — | | | $ | — | | | $ | 16,032,646 | |
| | | | | | | | | | | | | | | | | | | | |
Gross amount of recognized liabilities for securities lending transactions | | | $ | 16,032,646 | |
| | | | | |
| | (1) | Amount represents the payable for cash collateral received on securities on loan. This will generally be in the “Overnight and Continuous” column as the securities are typically callable on demand. |
Multifactor Emerging Markets ETF
CERTAIN TRANSFERS ACCOUNTED FOR AS SECURED BORROWINGS
Remaining Contractual Maturity of the Agreements
| | | | | | | | | | | | | | | | | | | | |
| | | Overnight and
Continuous | | | <30 days | | | Between
30 & 90 days | | | >90 days | | | Total | |
Securities Lending Transactions(1) | |
Common Stocks | | $ | 1,247,147 | | | $ | — | | | $ | — | | | $ | — | | | $ | 1,247,147 | |
| | | | | | | | | | | | | | | | | | | | |
Total Borrowings | | $ | 1,247,147 | | | $ | — | | | $ | — | | | $ | — | | | $ | 1,247,147 | |
| | | | | | | | | | | | | | | | | | | | |
Gross amount of recognized liabilities for securities lending transactions | | | $ | 1,247,147 | |
| | | | | |
| | (1) | Amount represents the payable for cash collateral received on securities on loan. This will generally be in the “Overnight and Continuous” column as the securities are typically callable on demand. |
Multifactor Global Small Cap ETF
CERTAIN TRANSFERS ACCOUNTED FOR AS SECURED BORROWINGS
Remaining Contractual Maturity of the Agreements
| | | | | | | | | | | | | | | | | | | | |
| | | Overnight and
Continuous | | | <30 days | | | Between
30 & 90 days | | | >90 days | | | Total | |
Securities Lending Transactions(1) | |
Common Stocks | | $ | 903,887 | | | $ | — | | | $ | — | | | $ | — | | | $ | 903,887 | |
| | | | | | | | | | | | | | | | | | | | |
Total Borrowings | | $ | 903,887 | | | $ | — | | | $ | — | | | $ | — | | | $ | 903,887 | |
| | | | | | | | | | | | | | | | | | | | |
Gross amount of recognized liabilities for securities lending transactions | | | $ | 903,887 | |
| | | | | |
| | (1) | Amount represents the payable for cash collateral received on securities on loan. This will generally be in the “Overnight and Continuous” column as the securities are typically callable on demand. |
|
| Hartford Multifactor ETFs |
Notes to Financial Statements – (continued)
March 31, 2018 (Unaudited)
Multifactor Low Volatility International Equity ETF
CERTAIN TRANSFERS ACCOUNTED FOR AS SECURED BORROWINGS
Remaining Contractual Maturity of the Agreements
| | | | | | | | | | | | | | | | | | | | |
| | | Overnight and
Continuous | | | <30 days | | | Between
30 & 90 days | | | >90 days | | | Total | |
Securities Lending Transactions(1) | |
Common Stocks | | $ | 121,186 | | | $ | — | | | $ | — | | | $ | — | | | $ | 121,186 | |
| | | | | | | | | | | | | | | | | | | | |
Total Borrowings | | $ | 121,186 | | | $ | — | | | $ | — | | | $ | — | | | $ | 121,186 | |
| | | | | | | | | | | | | | | | | | | | |
Gross amount of recognized liabilities for securities lending transactions | | | $ | 121,186 | |
| | | | | |
| | (1) | Amount represents the payable for cash collateral received on securities on loan. This will generally be in the “Overnight and Continuous” column as the securities are typically callable on demand. |
Multifactor Low Volatility US Equity ETF
CERTAIN TRANSFERS ACCOUNTED FOR AS SECURED BORROWINGS
Remaining Contractual Maturity of the Agreements
| | | | | | | | | | | | | | | | | | | | |
| | | Overnight and
Continuous | | | <30 days | | | Between
30 & 90 days | | | >90 days | | | Total | |
Securities Lending Transactions(1) | |
Common Stocks | | $ | 46,042 | | | $ | — | | | $ | — | | | $ | — | | | $ | 46,042 | |
| | | | | | | | | | | | | | | | | | | | |
Total Borrowings | | $ | 46,042 | | | $ | — | | | $ | — | | | $ | — | | | $ | 46,042 | |
| | | | | | | | | | | | | | | | | | | | |
Gross amount of recognized liabilities for securities lending transactions | | | $ | 46,042 | |
| | | | | |
| | (1) | Amount represents the payable for cash collateral received on securities on loan. This will generally be in the “Overnight and Continuous” column as the securities are typically callable on demand. |
Multifactor REIT ETF
CERTAIN TRANSFERS ACCOUNTED FOR AS SECURED BORROWINGS
Remaining Contractual Maturity of the Agreements
| | | | | | | | | | | | | | | | | | | | |
| | | Overnight and
Continuous | | | <30 days | | | Between
30 & 90 days | | | >90 days | | | Total | |
Securities Lending Transactions(1) | |
Common Stocks | | $ | 473,309 | | | $ | — | | | $ | — | | | $ | — | | | $ | 473,309 | |
| | | | | | | | | | | | | | | | | | | | |
Total Borrowings | | $ | 473,309 | | | $ | — | | | $ | — | | | $ | — | | | $ | 473,309 | |
| | | | | | | | | | | | | | | | | | | | |
Gross amount of recognized liabilities for securities lending transactions | | | $ | 473,309 | |
| | | | | |
| | (1) | Amount represents the payable for cash collateral received on securities on loan. This will generally be in the “Overnight and Continuous” column as the securities are typically callable on demand. |
|
| Hartford Multifactor ETFs |
Notes to Financial Statements – (continued)
March 31, 2018 (Unaudited)
Multifactor US Equity ETF
CERTAIN TRANSFERS ACCOUNTED FOR AS SECURED BORROWINGS
Remaining Contractual Maturity of the Agreements
| | | | | | | | | | | | | | | | | | | | |
| | | Overnight and
Continuous | | | <30 days | | | Between
30 & 90 days | | | >90 days | | | Total | |
Securities Lending Transactions(1) | |
Common Stocks | | $ | 463,537 | | | $ | — | | | $ | — | | | $ | — | | | $ | 463,537 | |
| | | | | | | | | | | | | | | | | | | | |
Total Borrowings | | $ | 463,537 | | | $ | — | | | $ | — | | | $ | — | | | $ | 463,537 | |
| | | | | | | | | | | | | | | | | | | | |
Gross amount of recognized liabilities for securities lending transactions | | | $ | 463,537 | |
| | | | | |
| | (1) | Amount represents the payable for cash collateral received on securities on loan. This will generally be in the “Overnight and Continuous” column as the securities are typically callable on demand. |
| 8. | Custodian and Transfer Agent: |
State Street serves as Custodian for the Funds pursuant to a custodian agreement (“Custodian Agreement”) dated December 31, 2014, as amended November 21, 2017. As Custodian, State Street holds each Fund’s assets, calculates the net asset value of the shares and calculates net income and realized capital gains or losses. State Street also serves as Transfer Agent of each Fund pursuant to a transfer agency agreement (“Transfer Agency Agreement”) dated February 13, 2018. As Transfer Agent, State Street maintains the records of each Authorized Participant’s ownership of each Fund and processes the purchases and redemptions of Creation Units.
For the services provided under the Custodian Agreement and Transfer Agency Agreement, Lattice, and not the Funds, compensates State Street pursuant to the Funds’ unitary management fee structure.
| 9. | Investment Transactions: |
For the six-month period ended March 31, 2018, the cost of purchases and proceeds from sales of investment securities (excluding short-term investments) were as follows:
| | | | | | | | |
Fund | | Cost of Purchases | | | Sales Proceeds | |
Multifactor Developed Markets (ex-US) ETF | | $ | 59,408,819 | | | $ | 51,941,236 | |
Multifactor Emerging Markets ETF | | | 13,315,605 | | | | 6,823,218 | |
Multifactor Global Small Cap ETF | | | 5,003,744 | | | | 4,738,363 | |
Multifactor Low Volatility International Equity ETF | | | 768,208 | | | | 790,925 | |
Multifactor Low Volatility US Equity ETF | | | 357,637 | | | | 351,860 | |
Multifactor REIT ETF | | | 1,905,177 | | | | 2,145,793 | |
Multifactor US Equity ETF | | | 7,383,189 | | | | 7,476,908 | |
For the six-month period ended March 31, 2018, in-kind transactions, which are not included in the table above, associated with Creation Units were:
| | | | | | | | | | | | |
Fund | | Cost of Purchases | | | Sales Proceeds | | | Realized
Gain/(Loss) | |
Multifactor Developed Markets (ex-US) ETF | | $ | 206,304,016 | | | $ | 20,613,984 | | | $ | 4,466,567 | |
Multifactor Emerging Markets ETF | | | 11,245,916 | | | | — | | | | — | |
Multifactor Global Small Cap ETF | | | 2,748,966 | | | | — | | | | — | |
Multifactor Low Volatility International Equity ETF | | | — | | | | — | | | | — | |
Multifactor Low Volatility US Equity ETF | | | 1,328,878 | | | | — | | | | — | |
Multifactor REIT ETF | | | 2,873,652 | | | | — | | | | — | |
Multifactor US Equity ETF | | | 22,289,593 | | | | 1,588,010 | | | | 485,100 | |
|
| Hartford Multifactor ETFs |
Notes to Financial Statements – (continued)
March 31, 2018 (Unaudited)
Each Fund will issue and redeem shares at NAV only with certain Authorized Participants in large increments known as ‘‘Creation Units.” Purchases of Creation Units are made by tendering a basket of designated securities to the Fund and redemption proceeds are paid with a basket of securities from the Fund with a balancing cash component to equate the market value of the basket securities delivered or redeemed to the NAV per Creation Unit on the transaction date. Cash may be substituted in an amount equivalent to the value of certain securities generally when they are not available in sufficient quantity for delivery. The Fund’s shares are available in smaller increments to individual investors in the secondary market at market prices and may be subject to commissions. Authorized Participants may be required to pay a transaction fee when purchasing and redeeming Creation Units of the Fund. The transaction fee is used to defray the costs associated with the issuance and redemption of Creation Units.
Purchase or redemption of Creation Units is only available to an Authorized Participant. An Authorized Participant is either (1) a ‘‘Participating Party,’’ (i.e., a broker-dealer or other participant in the clearing process of the Continuous Net Settlement System of the NSCC) (‘‘Clearing Process’’), or (2) a participant of DTC (‘‘DTC Participant’’), and, in each case, must have executed an agreement (‘‘Participation Agreement’’) with the Distributor with respect to creations and redemptions of Creation Units.
If a Creation Unit is purchased or redeemed for cash or outside of the Clearing Process, a higher transaction fee will be charged. The following table discloses Creation Unit breakdown for each Fund:
| | | | | | | | | | | | | | | | |
Fund | | Creation Unit
Shares | | | Standard
Creation
Fee | | | Value at
March 31, 2018 | | | Standard
Redemption
Fee | |
Multifactor Developed Markets (ex-US) ETF | | | 50,000 | | | $ | 3,000 | | | $ | 1,448,000 | | | $ | 3,000 | |
Multifactor Emerging Markets ETF | | | 100,000 | | | | 2,000 | | | | 2,574,000 | | | | 2,000 | |
Multifactor Global Small Cap ETF | | | 100,000 | | | | 2,000 | | | | 3,148,000 | | | | 2,000 | |
Multifactor Low Volatility International Equity ETF | | | 100,000 | | | | 2,200 | | | | 2,745,000 | | | | 2,200 | |
Multifactor Low Volatility US Equity ETF | | | 50,000 | | | | 650 | | | | 1,306,500 | | | | 650 | |
Multifactor REIT ETF | | | 100,000 | | | | 250 | | | | 1,386,000 | | | | 250 | |
Multifactor US Equity ETF | | | 50,000 | | | | 800 | | | | 1,549,000 | | | | 800 | |
Shares of Multifactor Developed Markets (ex-US) ETF, Multifactor Emerging Markets ETF, Multifactor Global Small Cap ETF, Multifactor REIT ETF and Multifactor US Equity ETF are listed on the NYSE Arca and shares of Multifactor Low Volatility International Equity ETF and Multifactor Low Volatility US Equity ETF are listed on Cboe BZX. Shares of each Fund are publicly traded. Retail investors may purchase or sell shares in the secondary market (not from the Fund) through a broker or dealer. Investors purchasing or selling shares in the secondary market may pay a commission, market premium or discount or other transaction charge, to a broker or dealer, as well as some or all of the spread between the bid and the offered price for each purchase or sale transaction. Unless imposed by a broker or dealer, there is no minimum dollar amount upon purchase and no minimum number of shares that must be purchased in the secondary market. Because transactions in the secondary market occur at market prices, an investor may pay more than NAV upon purchase of shares and may receive less than a Fund’s NAV upon sale of shares.
Because each Fund is structured as an ETF, individual shares may only be purchased and sold on the listing exchange through a broker-dealer. The price of shares is based on market price, and because ETF shares trade at market prices rather than at NAV, shares may trade at a price greater than NAV (a premium) or less than NAV (a discount). Multifactor Developed Markets (ex-US) ETF, Multifactor Low Volatility US Equity ETF and Multifactor US Equity ETF will only issue or redeem Creation Units of 50,000 shares to Authorized Participants who have entered into agreements with the Distributor. Multifactor Emerging Markets ETF, Multifactor Low Volatility International Equity ETF, Multifactor Global Small Cap ETF and Multifactor REIT ETF will only issue or redeem Creation Units of 100,000 shares to Authorized Participants who have entered into agreements with the Distributor. The Funds generally will issue or redeem Creation Units in return for a designated basket of securities (and an amount of cash) that the Fund specifies each day. The Funds do not impose any restrictions on the frequency of purchases and redemptions; however, the Funds reserve the right to reject or limit purchases at any time.
|
| Hartford Multifactor ETFs |
Notes to Financial Statements – (continued)
March 31, 2018 (Unaudited)
The following information is for the six-month period ended March 31, 2018, and the fiscal year ended September 30, 2017:
| | | | | | | | | | | | | | | | |
| Multifactor Developed Markets (ex-US) ETF | | | | | | | | | | | | |
| | | For the Six-Month
Period Ended
March 31, 2018 | | | For the Year Ended
September 30, 2017 | |
| | | Shares | | | Amount | | | Shares | | | Amount | |
Shares Sold | | | 7,300,000 | | | $ | 214,227,451 | | | | 3,550,000 | | | $ | 94,471,911 | |
Shares Redeemed | | | (700,000 | ) | | | (20,649,464 | ) | | | (300,000 | ) | | | (8,420,992 | ) |
| | | | | | | | | | | | | | | | |
Net Increase (Decrease) | | | 6,600,000 | | | | 193,577,987 | | | | 3,250,000 | | | | 86,050,919 | |
| | | | | | | | | | | | | | | | |
| | | | |
| Multifactor Emerging Markets ETF | | | | | | | | | | | | |
| | | For the Six-Month
Period Ended
March 31, 2018 | | | For the Year Ended
September 30, 2017 | |
| | | Shares | | | Amount | | | Shares | | | Amount | |
Shares Sold | | | 700,000 | | | $ | 18,208,072 | | | | 800,000 | | | $ | 17,786,392 | |
| | | | | | | | | | | | | | | | |
Net Increase (Decrease) | | | 700,000 | | | | 18,208,072 | | | | 800,000 | | | | 17,786,392 | |
| | | | | | | | | | | | | | | | |
| | | | |
| Multifactor Global Small Cap ETF | | | | | | | | | | | | |
| | | For the Six-Month
Period Ended
March 31, 2018 | | | For the Year Ended
September 30, 2017 | |
| | | Shares | | | Amount | | | Shares | | | Amount | |
Shares Sold | | | 100,000 | | | $ | 3,147,582 | | | | 300,000 | | | $ | 8,539,305 | |
Shares Redeemed | | | — | | | | — | | | | (100,000 | ) | | | (2,968,571 | ) |
| | | | | | | | | | | | | | | | |
Net Increase (Decrease) | | | 100,000 | | | | 3,147,582 | | | | 200,000 | | | | 5,570,734 | |
| | | | | | | | | | | | | | | | |
| | | | |
| Multifactor Low Volatility International Equity ETF | | | | | | | | | | | | |
| | | For the Six-Month
Period Ended
March 31, 2018 | | | For the Period Ended
September 30, 2017(1) | |
| | | Shares | | | Amount | | | Shares | | | Amount | |
Shares Sold | | | — | | | $ | — | | | | 300,004 | | | $ | 7,743,372 | |
Shares Redeemed | | | — | | | | — | | | | (100,004 | ) | | | (2,662,030 | ) |
| | | | | | | | | | | | | | | | |
Net Increase (Decrease) | | | — | | | | — | | | | 200,000 | | | | 5,081,342 | |
| | | | | | | | | | | | | | | | |
|
(1) Commenced operations on May 10, 2017. | |
|
| Hartford Multifactor ETFs |
Notes to Financial Statements – (continued)
March 31, 2018 (Unaudited)
| | | | | | | | | | | | | | | | |
| Multifactor Low Volatility US Equity ETF | | | | | | | | | | | | |
| | | For the Six-Month
Period Ended
March 31, 2018 | | | For the Period Ended
September 30, 2017(1) | |
| | | Shares | | | Amount | | | Shares | | | Amount | |
Shares Sold | | | 50,000 | | | $ | 1,329,697 | | | | 200,004 | | | $ | 5,033,332 | |
Shares Redeemed | | | — | | | | — | | | | (50,004 | ) | | | (1,276,954 | ) |
| | | | | | | | | | | | | | | | |
Net Increase (Decrease) | | | 50,000 | | | | 1,329,697 | | | | 150,000 | | | | 3,756,378 | |
| | | | | | | | | | | | | | | | |
|
(1) Commenced operations on May 10, 2017. | |
| | | | |
| Multifactor REIT ETF | | | | | | | | | | | | |
| | | For the Six-Month
Period Ended
March 31, 2018 | | | For the Period Ended
September 30, 2017(1) | |
| | | Shares | | | Amount | | | Shares | | | Amount | |
Shares Sold | | | 200,000 | | | $ | 2,873,418 | | | | 900,000 | | | $ | 13,571,282 | |
Shares Redeemed | | | — | | | | — | | | | (300,000 | ) | | | (4,573,186 | ) |
| | | | | | | | | | | | | | | | |
Net Increase (Decrease) | | | 200,000 | | | | 2,873,418 | | | | 600,000 | | | | 8,998,096 | |
| | | | | | | | | | | | | | | | |
(1) Commenced operations on October 3, 2016. | |
| | | | |
| Multifactor US Equity ETF | | | | | | | | | | | | |
| | | For the Six-Month
Period Ended
March 31, 2018 | | | For the Year Ended
September 30, 2017 | |
| | | Shares | | | Amount | | | Shares | | | Amount | |
Shares Sold | | | 700,000 | | | $ | 22,265,406 | | | | 550,000 | | | $ | 15,231,487 | |
Shares Redeemed | | | (50,000 | ) | | | (1,585,033 | ) | | | (500,000 | ) | | | (13,456,609 | ) |
| | | | | | | | | | | | | | | | |
Net Increase (Decrease) | | | 650,000 | | | | 20,680,373 | | | | 50,000 | | | | 1,774,878 | |
| | | | | | | | | | | | | | | | |
Under the Trust’s organizational documents, the Trust shall indemnify its officers and trustees to the full extent required or permitted under the applicable laws of the State of Delaware and federal securities laws. In addition, the Trust, on behalf of the Funds, may enter into contracts that contain a variety of indemnifications. The Trust’s maximum exposure under these arrangements is unknown. However, as of the date of these financial statements, the Trust has not had prior claims or losses pursuant to these contracts and expects the risk of loss to be remote.
Management has evaluated all subsequent transactions and events through the date on which this statement was issued and has determined that no additional items require adjustment to or disclosure in these financial statements.
|
| Hartford Multifactor ETFs |
Shareholder Meeting Results
Rule 30e-1 under the Investment Company Act of 1940, as amended, requires registered management companies to report on all subject matters put to the vote of shareholders and provide final results. Shareholders were asked to participate in a special meeting of shareholders on October 3, 2017 (the ‘‘Shareholder Meeting’’) to elect a new Board of Trustees. The final results of the Shareholder Meeting are reported in the following table.
Proposal 1: Approval of Trustees
| | | | | | | | | | |
| | | | | SHARES VOTED | | | % VOTED | |
HILARY E. ACKERMANN | | FOR | | | 6,920,185.19 | | | | 97.59 | % |
| | WITHHELD | | | 171,020.43 | | | | 2.41 | % |
| | | |
ROBIN C. BEERY | | FOR | | | 6,920,185.19 | | | | 97.59 | % |
| | WITHHELD | | | 171,020.43 | | | | 2.41 | % |
| | | |
LYNN S. BIRDSONG | | FOR | | | 6,920,185.19 | | | | 97.59 | % |
| | WITHHELD | | | 171,020.43 | | | | 2.41 | % |
| | | |
JAMES E. DAVEY | | FOR | | | 6,920,185.19 | | | | 97.59 | % |
| | WITHHELD | | | 171,020.43 | | | | 2.41 | % |
| | | |
CHRISTINE DETRICK | | FOR | | | 6,920,185.19 | | | | 97.59 | % |
| | WITHHELD | | | 171,020.43 | | | | 2.41 | % |
| | | |
DUANE E. HILL | | FOR | | | 6,908,322.54 | | | | 97.42 | % |
| | WITHHELD | | | 182,883.09 | | | | 2.58 | % |
| | | |
WILLIAM P. JOHNSTON | | FOR | | | 6,908,322.54 | | | | 97.42 | % |
| | WITHHELD | | | 182,883.09 | | | | 2.58 | % |
| | | |
PHILLIP O. PETERSON | | FOR | | | 6,908,322.54 | | | | 97.42 | % |
| | WITHHELD | | | 182,883.09 | | | | 2.58 | % |
| | | |
LEMMA W. SENBET | | FOR | | | 6,908,322.54 | | | | 97.42 | % |
| | WITHHELD | | | 182,883.09 | | | | 2.58 | % |
| | | |
DAVID SUNG | | FOR | | | 6,920,185.19 | | | | 97.59 | % |
| | WITHHELD | | | 171,020.43 | | | | 2.41 | % |
|
Hartford Multifactor ETFs |
Supplemental Information
March 31, 2018 (Unaudited)
Premium/Discount Information
The tables that follow present information about the differences between the daily market price on secondary markets for shares of a Fund and that Fund’s net asset value. Net asset value, or ‘‘NAV,’’ is the price per share at which each Fund issues and redeems shares. It is calculated in accordance with the standard formula for valuing mutual fund shares. The ‘‘Market Price’’ of each Fund generally is determined using the midpoint between the highest bid and the lowest offer on the primary stock exchange on which the shares of such Fund are listed for trading, as of the time that the Fund’s NAV is calculated. Each Fund’s Market Price may be at, above or below its NAV. The NAV of each Fund will fluctuate with changes in the fair value of its portfolio holdings. The Market Price of each Fund will fluctuate in accordance with changes in its NAV, as well as market supply and demand. Premiums or discounts are the differences (expressed as a percentage) between the NAV and Market Price of a Fund on a given day, generally at the time NAV is calculated. A premium is the amount that a Fund is trading above the reported NAV, expressed as a percentage of the NAV. A discount is the amount that a Fund is trading below the reported NAV, expressed as a percentage of the NAV. The following information shows the frequency distributions of premiums and discounts for each of the Funds included in this report. The information shown for each Fund is for the fund listing date through March 31, 2018. The specific periods covered for each Fund are disclosed in the table for such Fund.
Each line in the table shows the number of trading days in which the Fund traded within the premium/discount range indicated. The number of trading days in each premium/discount range is also shown as a percentage of the total number of trading days in the period covered by each table. All data presented here represents past performance, which cannot be used to predict future results.
Hartford Multifactor Developed Markets (ex-US) ETF
Period Covered: October 1, 2017 through March 31, 2018
| | | | | | | | |
Premium/Discount Range (based on MidQuote-to-NAV) | | Number
of Days | | | Percentage of
Total Days | |
Greater than 2.0% | | | 1 | | | | 0.81 | % |
Greater than 1.5% and Less than 2.0% | | | 0 | | | | 0.00 | % |
Greater than 1.0% and Less than 1.5% | | | 3 | | | | 2.42 | % |
Greater than 0.5% and Less than 1.0% | | | 45 | | | | 36.29 | % |
Between 0.5% and -0.5% | | | 71 | | | | 57.26 | % |
Less than -0.5% and Greater than -1.0% | | | 2 | | | | 1.61 | % |
Less than -1.0% and Greater than -1.5% | | | 1 | | | | 0.81 | % |
Less than -1.5% and Greater than -2.0% | | | 1 | | | | 0.80 | % |
Less than -2.0% | | | 0 | | | | 0.00 | % |
| | | | | | | | |
Total | | | 124 | | | | 100.00 | % |
| | | | | | | | |
Hartford Multifactor Emerging Markets ETF
Period Covered: October 1, 2017 through March 31, 2018
| | | | | | | | |
Premium/Discount Range (based on MidQuote-to-NAV) | | Number
of Days | | | Percentage of
Total Days | |
Greater than 2.0% | | | 1 | | | | 0.81 | % |
Greater than 1.5% and Less than 2.0% | | | 5 | | | | 4.03 | % |
Greater than 1.0% and Less than 1.5% | | | 13 | | | | 10.48 | % |
Greater than 0.5% and Less than 1.0% | | | 41 | �� | | | 33.06 | % |
Between 0.5% and -0.5% | | | 58 | | | | 46.77 | % |
Less than -0.5% and Greater than -1.0% | | | 4 | | | | 3.23 | % |
Less than -1.0% and Greater than -1.5% | | | 0 | | | | 0.00 | % |
Less than -1.5% and Greater than -2.0% | | | 1 | | | | 0.81 | % |
Less than -2.0% | | | 1 | | | | 0.81 | % |
| | | | | | | | |
Total | | | 124 | | | | 100.00 | % |
| | | | | | | | |
|
| Hartford Multifactor ETFs |
Supplemental Information – (continued)
March 31, 2018 (Unaudited)
Hartford Multifactor Global Small Cap ETF
Period Covered: October 1, 2017 through March 31, 2018
| | | | | | | | |
Premium/Discount Range (based on MidQuote-to-NAV) | | Number
of Days | | | Percentage of
Total Days | |
Greater than 2.0% | | | 1 | | | | 0.81 | % |
Greater than 1.5% and Less than 2.0% | | | 0 | | | | 0.00 | % |
Greater than 1.0% and Less than 1.5% | | | 2 | | | | 1.61 | % |
Greater than 0.5% and Less than 1.0% | | | 21 | | | | 16.94 | % |
Between 0.5% and -0.5% | | | 91 | | | | 73.39 | % |
Less than -0.5% and Greater than -1.0% | | | 7 | | | | 5.65 | % |
Less than -1.0% and Greater than -1.5% | | | 1 | | | | 0.80 | % |
Less than -1.5% and Greater than -2.0% | | | 1 | | | | 0.80 | % |
Less than -2.0% | | | 0 | | | | 0.00 | % |
| | | | | | | | |
Total | | | 124 | | | | 100.00 | % |
| | | | | | | | |
Hartford Multifactor Low Volatility International Equity ETF
Period Covered: October 1, 2017 through March 31, 2018
| | | | | | | | |
Premium/Discount Range (based on MidQuote-to-NAV) | | Number
of Days | | | Percentage of
Total Days | |
Greater than 2.0% | | | 0 | | | | 0.00 | % |
Greater than 1.5% and Less than 2.0% | | | 1 | | | | 0.81 | % |
Greater than 1.0% and Less than 1.5% | | | 49 | | | | 39.52 | % |
Greater than 0.5% and Less than 1.0% | | | 41 | | | | 33.06 | % |
Between 0.5% and -0.5% | | | 27 | | | | 21.77 | % |
Less than -0.5% and Greater than -1.0% | | | 4 | | | | 3.23 | % |
Less than -1.0% and Greater than -1.5% | | | 1 | | | | 0.81 | % |
Less than -1.5% and Greater than -2.0% | | | 0 | | | | 0.00 | % |
Less than -2.0% | | | 1 | | | | 0.80 | % |
| | | | | | | | |
Total | | | 124 | | | | 100.00 | % |
| | | | | | | | |
Hartford Multifactor Low Volatility US Equity ETF
Period Covered: October 1, 2017 through March 31, 2018
| | | | | | | | |
Premium/Discount Range (based on MidQuote-to-NAV) | | Number
of Days | | | Percentage of
Total Days | |
Greater than 2.0% | | | 0 | | | | 0.00 | % |
Greater than 1.5% and Less than 2.0% | | | 0 | | | | 0.00 | % |
Greater than 1.0% and Less than 1.5% | | | 0 | | | | 0.00 | % |
Greater than 0.5% and Less than 1.0% | | | 19 | | | | 15.32 | % |
Between 0.5% and -0.5% | | | 105 | | | | 84.68 | % |
Less than -0.5% and Greater than -1.0% | | | 0 | | | | 0.00 | % |
Less than -1.0% and Greater than -1.5% | | | 0 | | | | 0.00 | % |
Less than -1.5% and Greater than -2.0% | | | 0 | | | | 0.00 | % |
Less than -2.0% | | | 0 | | | | 0.00 | % |
| | | | | | | | |
Total | | | 124 | | | | 100.00 | % |
| | | | | | | | |
|
| Hartford Multifactor ETFs |
Supplemental Information – (continued)
March 31, 2018 (Unaudited)
Hartford Multifactor REIT ETF
Period Covered: October 1, 2017 through March 31, 2018
| | | | | | | | |
Premium/Discount Range (based on MidQuote-to-NAV) | | Number
of Days | | | Percentage of
Total Days | |
Greater than 2.0% | | | 0 | | | | 0.00 | % |
Greater than 1.5% and Less than 2.0% | | | 0 | | | | 0.00 | % |
Greater than 1.0% and Less than 1.5% | | | 0 | | | | 0.00 | % |
Greater than 0.5% and Less than 1.0% | | | 0 | | | | 0.00 | % |
Between 0.5% and -0.5% | | | 124 | | | | 100.00 | % |
Less than -0.5% and Greater than -1.0% | | | 0 | | | | 0.00 | % |
Less than -1.0% and Greater than -1.5% | | | 0 | | | | 0.00 | % |
Less than -1.5% and Greater than -2.0% | | | 0 | | | | 0.00 | % |
Less than -2.0% | | | 0 | | | | 0.00 | % |
| | | | | | | | |
Total | | | 124 | | | | 100.00 | % |
| | | | | | | | |
Hartford Multifactor US Equity ETF
Period Covered: October 1, 2017 through March 31, 2018
| | | | | | | | |
Premium/Discount Range (based on MidQuote-to-NAV) | | Number
of Days | | | Percentage of
Total Days | |
Greater than 2.0% | | | 0 | | | | 0.00 | % |
Greater than 1.5% and Less than 2.0% | | | 0 | | | | 0.00 | % |
Greater than 1.0% and Less than 1.5% | | | 0 | | | | 0.00 | % |
Greater than 0.5% and Less than 1.0% | | | 0 | | | | 0.00 | % |
Between 0.5% and -0.5% | | | 124 | | | | 100.00 | % |
Less than -0.5% and Greater than -1.0% | | | 0 | | | | 0.00 | % |
Less than -1.0% and Greater than -1.5% | | | 0 | | | | 0.00 | % |
Less than -1.5% and Greater than -2.0% | | | 0 | | | | 0.00 | % |
Less than -2.0% | | | 0 | | | | 0.00 | % |
| | | | | | | | |
Total | | | 124 | | | | 100.00 | % |
| | | | | | | | |
|
| Hartford Multifactor ETFs |
General Information (Unaudited)
HOW TO OBTAIN A COPY OF EACH FUND’S PROXY VOTING POLICIES AND VOTING RECORDS (UNAUDITED)
A description of the policies and procedures that each Fund uses to determine how to vote proxies relating to portfolio securities and information about how each Fund voted proxies relating to portfolio securities during the most recent twelve-month period ended June 30, are available (1) without charge, upon request, by calling 415-315-6600 and (2) on the SEC’s website at http://www.sec.gov.
QUARTERLY PORTFOLIO HOLDINGS INFORMATION (UNAUDITED)
Each Fund files a complete schedule of portfolio holdings with the SEC for the first and third quarters of each fiscal year on Form N-Q. Each Fund’s Forms N-Q are available (1) without charge, upon request, by calling 415-315-6600 and (2) on the SEC’s website at http://www.sec.gov. The Form N-Q may be reviewed and copied at the SEC’s Public Reference Room in Washington, DC. Information on the operation of the Public Reference Room may be obtained by calling 1-800-SEC-0330.
CUSTOMER PRIVACY NOTICE
The Hartford Financial Services Group, Inc. and Affiliates*
(herein called “we, our, and us”)
This Privacy Policy applies to our United States Operations
We value your trust. We are committed to the responsible:
a) management;
b) use; and
c) protection;
of Personal Information.
This notice describes how we collect, disclose, and protect Personal Information.
We collect Personal Information to:
a) service your Transactions with us; and
b) support our business functions.
We may obtain Personal Information from:
a) You;
b) your Transactions with us; and
c) third parties such as a consumer-reporting agency.
Based on the type of product or service You apply for or get from us, Personal Information such as:
a) your name;
b) your address;
c) your income;
d) your payment; or
e) your credit history;
may be gathered from sources such as applications, Transactions, and consumer reports.
To serve You and service our business, we may share certain Personal Information. We will share Personal Information, only as allowed by law, with affiliates such as:
a) our insurance companies;
b) our employee agents;
c) our brokerage firms; and
d) our administrators.
As allowed by law, we may share Personal Financial Information with our affiliates to:
a) market our products; or
b) market our services;
to You without providing You with an option to prevent these disclosures.
We may also share Personal Information, only as allowed by law, with unaffiliated third parties including:
a) independent agents;
b) brokerage firms;
c) insurance companies;
d) administrators; and
e) service providers;
who help us serve You and service our business.
When allowed by law, we may share certain Personal Financial Information with other unaffiliated third parties who assist us by performing services or functions such as:
a) taking surveys;
b) marketing our products or services; or
c) offering financial products or services under a joint agreement between us and one or more financial institutions.
We, and third parties we partner with, may track some of the pages You visit through the use of:
a) cookies;
b) pixel tagging; or
c) other technologies;
and currently do not process or comply with any web browser’s “do not track” signal or other similar mechanism that indicates a request to disable online tracking of individual users who visit our websites or use our services.
For more information, our Online Privacy Policy, which governs information we collect on our website and our affiliate websites, is available at https://www.thehartford.com/online-privacy-policy.
We will not sell or share your Personal Financial Information with anyone for purposes unrelated to our business functions without offering You the opportunity to:
a) “opt-out;” or
b) “opt-in;”
as required by law.
We only disclose Personal Health Information with:
a) your authorization; or
b) as otherwise allowed or required by law.
Our employees have access to Personal Information in the course of doing their jobs, such as:
a) underwriting policies;
b) paying claims;
c) developing new products; or
d) advising customers of our products and services.
We use manual and electronic security procedures to maintain:
a) the confidentiality; and
b) the integrity of;
Personal Information that we have. We use these procedures to guard against unauthorized access.
Some techniques we use to protect Personal Information include:
a) secured files;
b) user authentication;
c) encryption;
d) firewall technology; and
e) the use of detection software.
We are responsible for and must:
a) identify information to be protected;
b) provide an adequate level of protection for that data;
c) grant access to protected data only to those people who must use it in the performance of their job-related duties.
Employees who violate our privacy policies and procedures may be subject to discipline, which may include termination of their employment with us.
We will continue to follow our Privacy Policy regarding Personal Information even when a business relationship no longer exists between us.
As used in this Privacy Notice:
Application means your request for our product or service.
Personal Financial Information means financial information such as:
a) credit history;
b) income;
c) financial benefits; or
d) policy or claim information.
Personal Financial Information may include Social Security Numbers, Driver’s license numbers, or other government-issued identification numbers, or credit, debit card, or bank account numbers.
Personal Health Information means health information such as:
a) your medical records; or
b) information about your illness, disability or injury.
Personal Information means information that identifies You personally and is not otherwise available to the public. It includes: a) Personal Financial Information; and
b) Personal Health Information.
Transaction means your business dealings with us, such as:
a) your Application;
b) your request for us to pay a claim; and
c) your request for us to take an action on your account.
You means an individual who has given us Personal Information in conjunction with:
a) asking about;
b) applying for; or
c) obtaining;
a financial product or service from us if the product or service is used mainly for personal, family, or household purposes.
If you have any questions or comments about this privacy notice, please feel free to contact us at The Hartford – Law Department, Privacy Law, One Hartford Plaza, Hartford, CT 06155, or at CorporatePrivacyOffice@thehartford.com.
This Customer Privacy Notice is being provided on behalf of The Hartford Financial Services Group, Inc. and its affiliates (including the following as of March 2018), to the extent required by the Gramm-Leach-Bliley Act and implementing regulations.
1stAGChoice, Inc.; Access CoverageCorp, Inc.; Access CoverageCorp Technologies, Inc.; American Maturity Life Insurance Company; Business Management Group, Inc.; Cervus Claim Solutions, LLC; First State Insurance Company; Fountain Investors I LLC; Fountain Investors II LLC; Fountain Investors III LLC; Fountain Investors IV LLC; FP R, LLC; FTC Resolution Company LLC; Hart Re Group L.L.C.; Hartford Accident and Indemnity Company; Hartford Administrative Services Company; Hartford Casualty General Agency, Inc.; Hartford Casualty Insurance Company; Hartford Financial Services, LLC; Hartford Fire General Agency, Inc.; Hartford Fire Insurance Company; Hartford Funds Distributors, LLC; Hartford Funds Management Company, LLC; Hartford Funds Management Group, Inc.; Hartford Group Benefits Holding Company; Hartford Holdings, Inc.; Hartford Insurance Company of Illinois; Hartford Insurance Company of the Midwest; Hartford Insurance Company of the Southeast; Hartford Insurance, Ltd.; Hartford Integrated Technologies, Inc.; Hartford International Life Reassurance Corporation; Hartford Investment Management Company; Hartford Life and Accident Insurance Company; Hartford Life and Annuity Insurance Company; Hartford Life Insurance Company; Hartford Life, Inc.; Hartford Life International Holding Company; Hartford Life, Ltd.; Hartford Lloyd’s Corporation; Hartford Lloyd’s Insurance Company; Hartford Management, Ltd.; Hartford of Texas General Agency, Inc.; Hartford Residual Market, L.C.C.; Hartford Securities Distribution Company, Inc.; Hartford Specialty Insurance Services of Texas, LLC; Hartford Strategic Investments, LLC; Hartford Underwriters General Agency, Inc.; Hartford Underwriters Insurance Company; Hartford-Comprehensive Employee Benefit Service Company; Heritage Holdings, Inc.; Heritage Reinsurance Company, Ltd.; HIMCO Distribution Services Company; HLA LLC; HL Investment Advisors, LLC; Horizon Management Group, LLC; HRA Brokerage Services, Inc.; Lanidex R, LLC; Lattice Strategies LLC; Maxum Casualty Insurance Company; Maxum Indemnity Company; Maxum Specialty Services Corporation; MPC Resolution Company LLC; New England Insurance Company; New England Reinsurance Corporation; New Ocean Insurance Co., Ltd.; Northern Homelands Company; Nutmeg Insurance Agency, Inc.; Nutmeg Insurance Company; Pacific Insurance Company, Limited; Property and Casualty Insurance Company of Hartford; Sentinel Insurance Company, Ltd.; The Hartford International Asset Management Company Limited; Trumbull Flood Management, L.L.C.; Trumbull Insurance Company; Twin City Fire Insurance Company.
Revised March 2018
This report is submitted for the general information of the shareholders of the Funds referenced in this report. It is not authorized for distribution to persons who are not shareholders of one or more Funds referenced in this report unless preceded or accompanied by a current prospectus for the relevant Funds. Nothing herein contained is to be considered an offer of sale or a solicitation of an offer to buy shares of any Fund listed in this report. Such offering is only made by prospectus, which includes details as to the offering price and other material information.
The information cannot be used or relied upon for the purpose of avoiding IRS penalties. These materials are not intended to provide tax, accounting or legal advice. As with all matters of a tax or legal nature, you should consult your own tax or legal counsel for advice.
Investors should carefully consider a fund’s investment objectives, risks, charges and expenses. This and other important information is contained in a fund’s statutory prospectus and summary prospectus, which can be obtained by visiting hartfordfunds.com. Please read it carefully before investing.
Exchange-traded products are distributed by ALPS Distributors, Inc. (ALPS). Advisory services are provided by Hartford Funds Management Company, LLC (HFMC) and its wholly owned subsidiary, Lattice Strategies LLC (Lattice). Hartford Funds refers to Hartford Funds Distributors, LLC (Member FINRA) HFMC, and Lattice, which are not affiliated with ALPS.
ETFSAR-MLT18 05/18 206191 LAT001076 Printed in U.S.A.

| | (a) | The registrant, as of the end of the period covered by this report, has adopted a code of ethics that applies to the registrant’s principal executive officer, principal financial officer, principal accounting officer or controller, or persons performing similar functions, regardless of whether these individuals are employed by the registrant or a third party. |
| | (c) | There have been no amendments to the Registrant’s Code of Ethics during the reporting period for this form N-CSR. |
| | (d) | The registrant has not granted any waivers, including an implicit waiver, from a provision of the code of ethics that applies to the registrant’s principal executive officer, principal financial officer, principal accounting officer or controller, or persons performing similar functions, regardless of whether these individuals are employed by the registrant or a third party, that relates to one or more of the items set forth in paragraph (b) of this item’s instructions. |
| | (f) | A copy of the code of ethics is filed herewith. |
| Item 3. | Audit Committee Financial Expert. |
Not applicable to this semi-annual filing.
| Item 4. | Principal Accountant Fees and Services. |
Not applicable to this semi-annual filing.
| Item 5. | Audit Committee of Listed Registrants. |
Not applicable to this semi-annual filing.
| | (a) | The Schedule of Investments in securities of unaffiliated issuers as of the close of the reporting period is included as part of the semi-annual report filed under Item 1 of this form. |
Item 7. Disclosure of Proxy Voting Policies and Procedures for Closed-End Management Investment Companies.
Not applicable.
Item 8. Portfolio Managers of Closed-End Management Investment Companies.
Not applicable.
Item 9. Purchases of Equity Securities by Closed-End Management Investment Company and Affiliated Purchasers.
Not applicable.
| Item 10. | Submission of Matters to a Vote of Security Holders. |
There have been no material changes to the procedures by which shareholders may recommend nominees to the registrant’s board of trustees during the period covered by this report.
| Item 11. | Controls and Procedures. |
| | (a) | The registrant’s principal executive and principal financial officers, or persons performing similar functions, have concluded that the registrant’s disclosure controls and procedures (as defined in Rule 30a-3(c) under the Investment Company Act of 1940, as amended (the “1940 Act”) (17 CFR 270.30a-3(c))) are generally effective to provide reasonable assurance, as of a date within 90 days of the filing date of the report that includes the disclosure required by this paragraph, based on their evaluation of these controls and procedures required by Rule 30a-3(b) under the 1940 Act (17 CFR 270.30a-3(b)) and Rules 13a-15(b) or 15d-15(b) under the Securities Exchange Act of 1934, as amended (17 CFR 240.13a-15(b) or 240.15d-15(b)). |
| | (b) | There were no changes in the registrant’s internal control over financial reporting (as defined in Rule 30a-3(d) under the 1940 Act (17 CFR 270.30a-3(d)) that occurred during the registrant’s second fiscal quarter of the period covered by this report that have materially affected, or are reasonably likely to materially affect, the registrant’s internal control over financial reporting. |
Item 12. Disclosure of Securities Lending Activities for Closed-End Management Investment Companies.
Not applicable.
Item 13. Exhibits.
| | (a)(1) | Code of Ethics is filed herewith. |
| | (a)(2) | Separate certifications for each principal executive officer and principal financial officer of the registrant as required by Rule 30a-2(a) under the 1940 Act (17 CFR 270.30a-2(a)) and Section 302 of the Sarbanes-Oxley Act of 2002 are attached hereto. |
| | (b) | Certifications pursuant to Rule 30a-2(b) under the 1940 Act and Section 906 of the Sarbanes-Oxley Act of 2002 are attached hereto. |
SIGNATURES
Pursuant to the requirements of the Securities Exchange Act of 1934 and the Investment Company Act of 1940, the registrant has duly caused this report to be signed on its behalf by the undersigned, thereunto duly authorized.
| | | | | | |
| | | | LATTICE STRATEGIES TRUST |
| | | |
| Date: June 8, 2018 | | | | By: | | /s/ James E. Davey |
| | | | | | James E. Davey |
| | | | | | President and Chief Executive Officer |
Pursuant to the requirements of the Securities Exchange Act of 1934 and the Investment Company Act of 1940, this report has been signed below by the following persons on behalf of the registrant and in the capacities and on the dates indicated.
| | | | | | |
| Date: June 8, 2018 | | | | By: | | /s/ James E. Davey |
| | | | | | James E. Davey |
| | | | | | President and Chief Executive Officer |
| | | |
| Date: June 8, 2018 | | | | By: | | /s/ Amy N. Furlong |
| | | | | | Amy N. Furlong |
| | | | | | Treasurer |
| | | | | | (Principal Financial Officer and Principal Accounting Officer) |