Exhibit 99.2
Investor Presentation September 2018

Forward Looking Statements This presentation contains forward - looking statements within the meaning of the Private Securities Litigation Reform Act of 1995 . These forward - looking statements relate to expectations or forecasts for future events, including, without limitation, our earnings, Adjusted EBITDA, revenues, expenses, capital expenditures or other future financial or business performance or strategies, results of operations or financial condition . These statements may be preceded by, followed by or include the words “may,” “might,” “will,” “will likely result,” “should,” “estimate,” “plan,” “project,” “forecast,” “intend,” “expect,” “anticipate,” “believe,” “seek,” “continue,” “target” or similar expressions . These forward - looking statements are based on information available to us as of the date they were made, and involve a number of risks and uncertainties which may cause them to turn out to be wrong . Accordingly, forward - looking statements should not be relied upon as representing our views as of any subsequent date, and we do not undertake any obligation to update forward - looking statements to reflect events or circumstances after the date they were made, whether as a result of new information, future events or otherwise, except as may be required under applicable securities laws . As a result of a number of known and unknown risks and uncertainties, our actual results or performance may be materially different from those expressed or implied by these forward - looking statements . Please refer to our Form 10 - K filed on April 2 , 2018 , which is available on the SEC’s website ( www . sec . gov ), for a full discussion of the risks and other factors that may impact any forward - looking statements in this presentation . 2
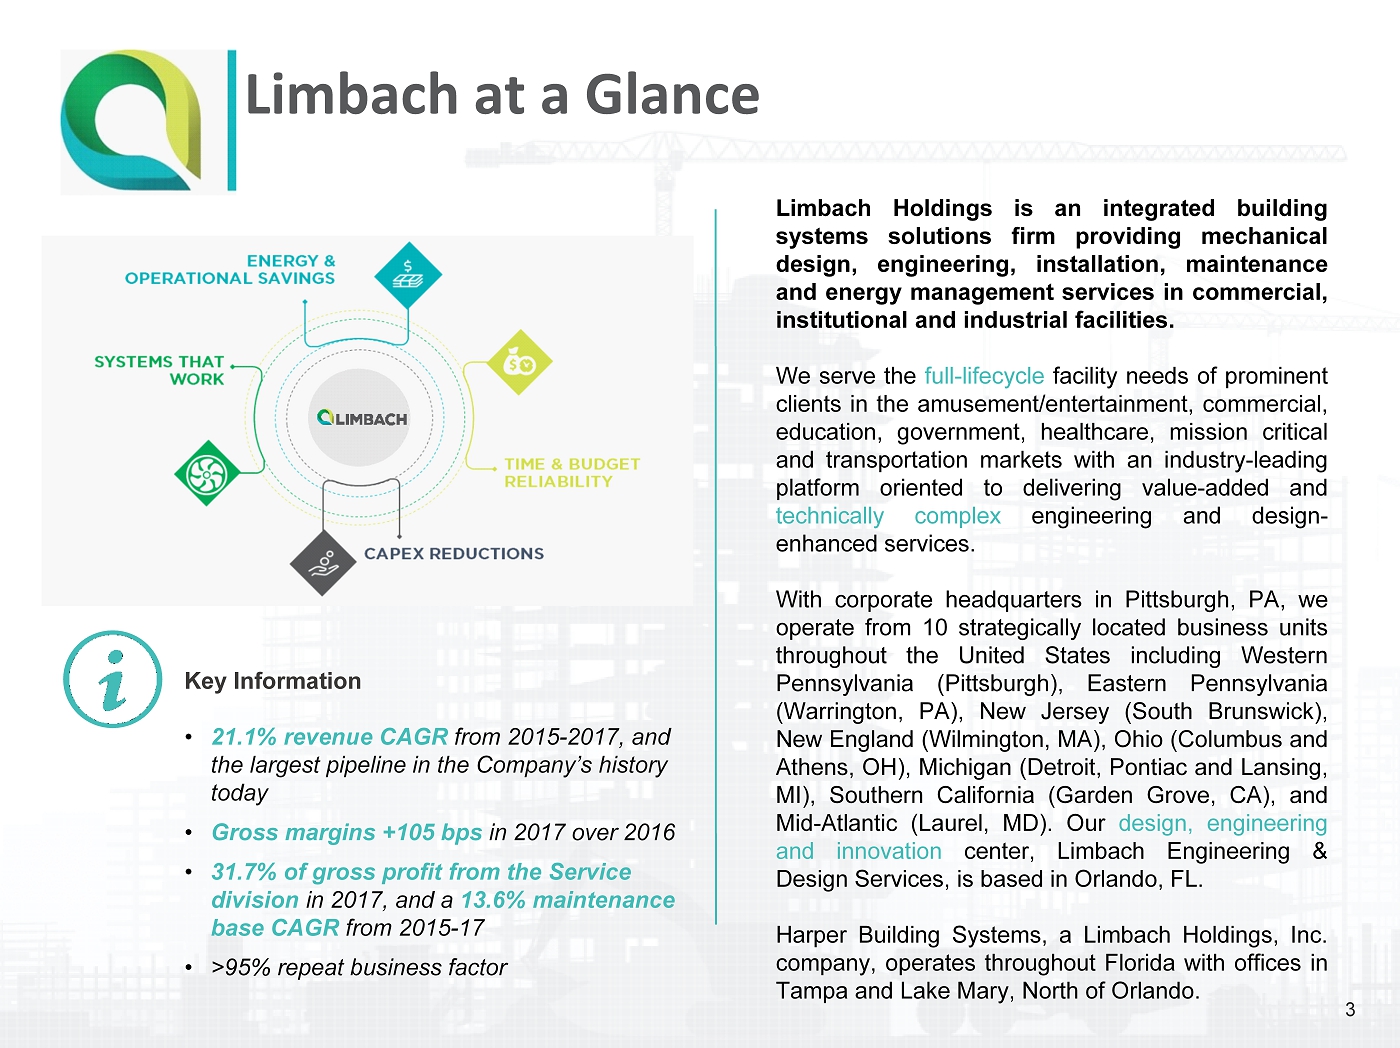
Limbach at a Glance Limbach Holdings is an integrated building systems solutions firm providing mechanical design, engineering, installation, maintenance and energy management services in commercial, institutional and industrial facilities . We serve the full - lifecycle facility needs of prominent clients in the amusement/entertainment, commercial, education, government, healthcare, mission critical and transportation markets with an industry - leading platform oriented to delivering value - added and technically complex engineering and design - enhanced services . With corporate headquarters in Pittsburgh, PA, we operate from 10 strategically located business units throughout the United States including Western Pennsylvania (Pittsburgh), Eastern Pennsylvania (Warrington, PA), New Jersey (South Brunswick), New England (Wilmington, MA), Ohio (Columbus and Athens, OH), Michigan (Detroit, Pontiac and Lansing, MI), Southern California (Garden Grove, CA), and Mid - Atlantic (Laurel, MD) . Our design, engineering and innovation center, Limbach Engineering & Design Services, is based in Orlando, FL . Harper Building Systems, a Limbach Holdings, Inc . company, operates throughout Florida with offices in Tampa and Lake Mary, North of Orlando . Key Information • 21.1% revenue CAGR from 2015 - 2017, and the largest pipeline in the Company’s history today • Gross margins +105 bps in 2017 over 2016 • 31.7% of gross profit from the Service division in 2017, and a 13.6% maintenance base CAGR from 2015 - 17 • >95% repeat business factor 3
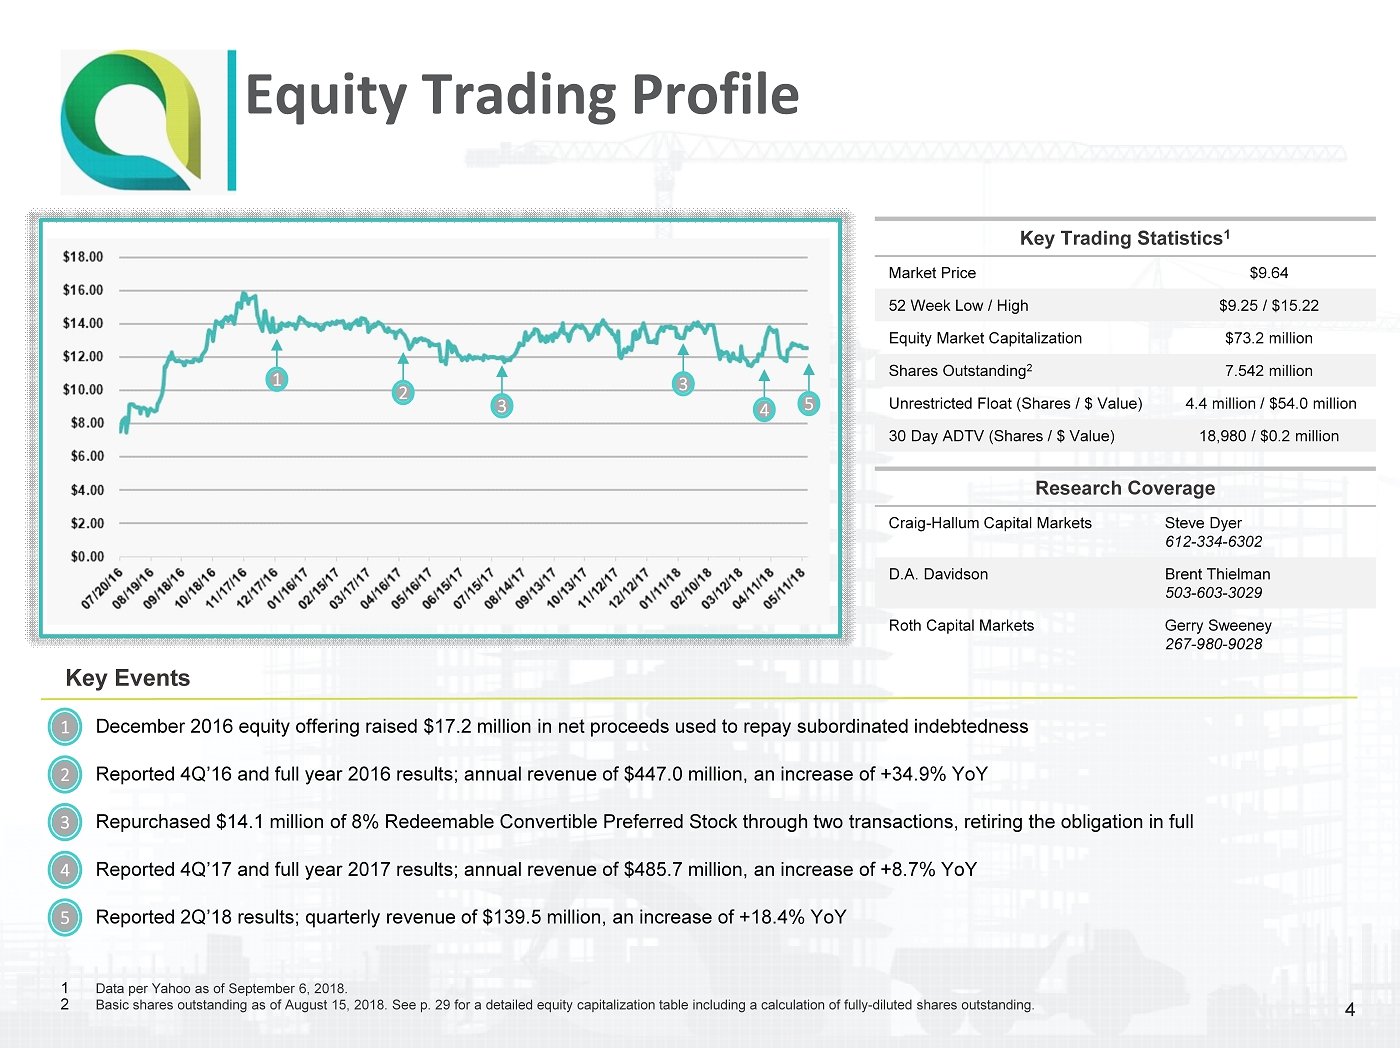
Equity Trading Profile Key Trading Statistics 1 Market Price $9.64 52 Week Low / High $9.25 / $15.22 Equity Market Capitalization $73.2 million Shares Outstanding 2 7.542 million Unrestricted Float (Shares / $ Value) 4.4 million / $54.0 million 30 Day ADTV (Shares / $ Value) 18,980 / $0.2 million Key Events 1 2 December 2016 equity offering raised $17.2 million in net proceeds used to repay subordinated indebtedness 3 Reported 4Q’16 and full year 2016 results; annual revenue of $447.0 million, an increase of +34.9% YoY 4 Repurchased $14.1 million of 8% Redeemable Convertible Preferred Stock through two transactions, retiring the obligation in f ull 5 Reported 4Q’17 and full year 2017 results; annual revenue of $485.7 million, an increase of +8.7% YoY Reported 2Q’18 results; quarterly revenue of $139.5 million, an increase of +18.4% YoY 1 Data per Yahoo as of September 6, 2018. 2 Basic shares outstanding as of August 15, 2018. See p. 29 for a detailed equity capitalization table including a calculation of fully - diluted shares outstanding. Research Coverage Craig - Hallum Capital Markets Steve Dyer 612 - 334 - 6302 D.A. Davidson Brent Thielman 503 - 603 - 3029 Roth Capital Markets Gerry Sweeney 267 - 980 - 9028 1 2 3 3 4 5 4

Compelling Investment Opportunity Institutional investors seeking exposure to the building/facility infrastructure sector are limited in their investment options . Only Limbach provides superior revenue growth with the near - term opportunity of greater operating leverage and improving margins . With numerous organic growth opportunities – from the high - growth Mission Critical end - market to continued expansion of the Service division – and a well - developed M&A strategy, Limbach is poised to accelerate growth in revenue and profitability in coming years . Furthermore, as we continue to improve the efficiency of the balance sheet and further rationalize the equity capital structure, the substantial discount (> 35 % ) to the Peer Group 1 multiple at which Limbach trades should contract, providing investors with even greater upside . ($ in millions) 3 Enterprise Value $107.2 $4,532.5 $2,127.9 Enterprise Value / 2018 EBITDA 5.6x 9.5x 12.8x % Owned by Top 10 Holders 61.6% 41.2% 48.9% 2015 - 2017 Revenue CAGR 21.1% 7.0% 6.4% 2017 - 2018F Revenue Growth 4 11.2% 1.2% 7.3% 2017 Gross Margin 13.5% 14.9% 20.5% 2017 EBITDA Margin 3.1% 6.2% 7.7% 2016 Rank Top 10 Mechanical Firms 2 1 EMCOR Group Inc. $3,503.6 2 Comfort Systems USA $1,340.2 3 ACCO Engineered Systems $806.2 4 Southland Industries $748.3 5 API Group Inc. $730.4 6 McKinstry $496.0 7 Team Industrial Services $480.0 8 TD Industries Inc. $456.0 9 Harris Cos. $448.2 10 Limbach Holdings $447.0 1 2 12 1 Includes Comfort Systems USA, Inc. and EMCOR Group, Inc. 2 ENR Top 600 Specialty Contractors , October 23, 2017 as measured by revenue; $ in millions; bold text denotes publicly - traded firms. 3 Data per Bloomberg as of September 4, 2018. 4 Limbach data calculated from the mid - point of current revenue guidance for 2018 of $530 - $550 million. 5
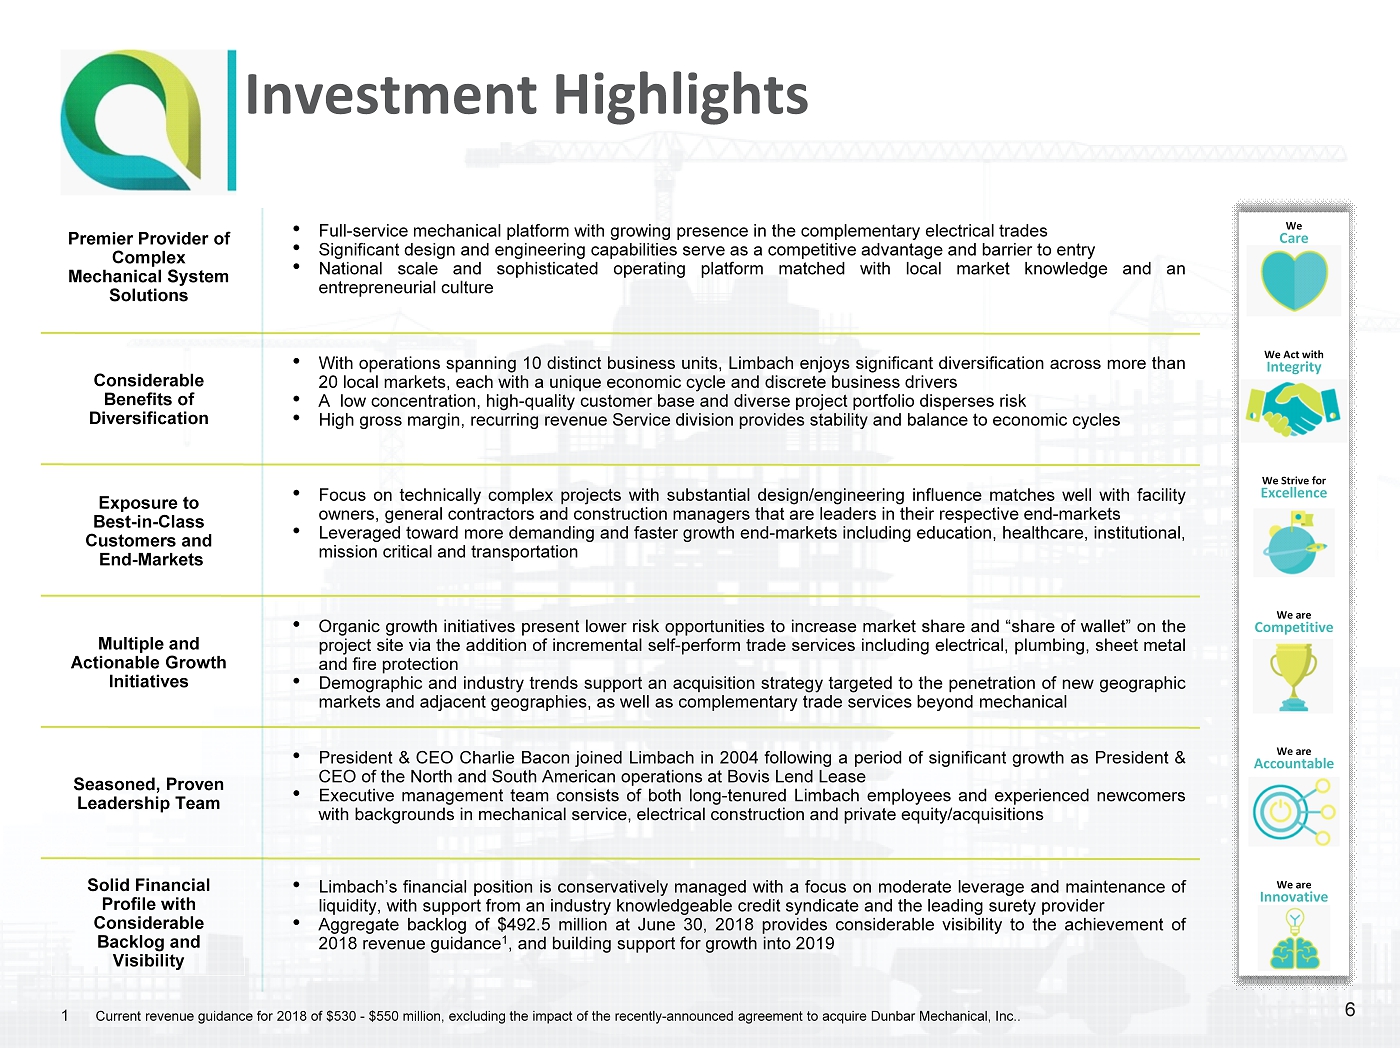
Investment Highlights Premier Provider of Complex Mechanical System Solutions • Full - service mechanical platform with growing presence in the complementary electrical trades • Significant design and engineering capabilities serve as a competitive advantage and barrier to entry • National scale and sophisticated operating platform matched with local market knowledge and an entrepreneurial culture Considerable Benefits of Diversification • With operations spanning 10 distinct business units, Limbach enjoys significant diversification across more than 20 local markets, each with a unique economic cycle and discrete business drivers • A low concentration, high - quality customer base and diverse project portfolio disperses risk • High gross margin, recurring revenue Service division provides stability and balance to economic cycles Exposure to Best - in - Class Customers and End - Markets • Focus on technically complex projects with substantial design/engineering influence matches well with facility owners, general contractors and construction managers that are leaders in their respective end - markets • Leveraged toward more demanding and faster growth end - markets including education, healthcare, institutional, mission critical and transportation Multiple and Actionable Growth Initiatives • Organic growth initiatives present lower risk opportunities to increase market share and “share of wallet” on the project site via the addition of incremental self - perform trade services including electrical, plumbing, sheet metal and fire protection • Demographic and industry trends support an acquisition strategy targeted to the penetration of new geographic markets and adjacent geographies, as well as complementary trade services beyond mechanical Seasoned, Proven Leadership Team • President & CEO Charlie Bacon joined Limbach in 2004 following a period of significant growth as President & CEO of the North and South American operations at Bovis Lend Lease • Executive management team consists of both long - tenured Limbach employees and experienced newcomers with backgrounds in mechanical service, electrical construction and private equity/acquisitions Solid Financial Profile with Considerable Backlog and Visibility • Limbach’s financial position is conservatively managed with a focus on moderate leverage and maintenance of liquidity, with support from an industry knowledgeable credit syndicate and the leading surety provider • Aggregate backlog of $ 492 . 5 million at June 30 , 2018 provides considerable visibility to the achievement of 2018 revenue guidance 1 , and building support for growth into 2019 We Care We Act with Integrity We Strive for Excellence We are Competitive We are Accountable We are Innovative 1 Current revenue guidance for 2018 of $530 - $550 million, excluding the impact of the recently - announced agreement to acquire Du nbar Mechanical, Inc.. 6
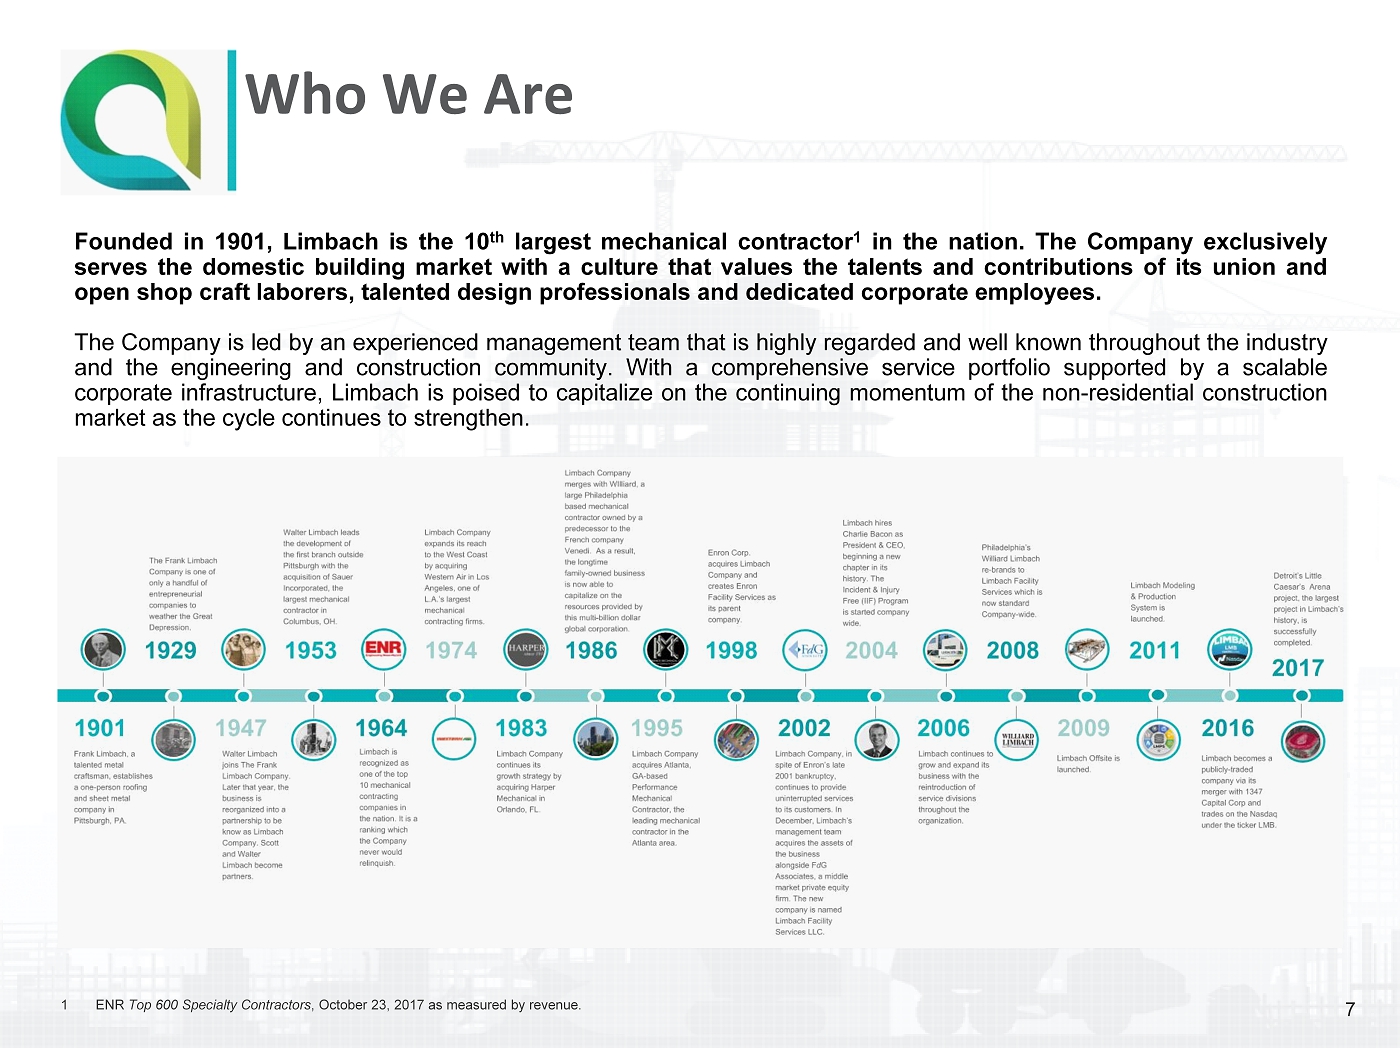
Who We Are Founded in 1901 , Limbach is the 10 th largest mechanical contractor 1 in the nation . The Company exclusively serves the domestic building market with a culture that values the talents and contributions of its union and open shop craft laborers, talented design professionals and dedicated corporate employees . The Company is led by an experienced management team that is highly regarded and well known throughout the industry and the engineering and construction community . With a comprehensive service portfolio supported by a scalable corporate infrastructure, Limbach is poised to capitalize on the continuing momentum of the non - residential construction market as the cycle continues to strengthen . 1 ENR Top 600 Specialty Contractors , October 23, 2017 as measured by revenue. 7
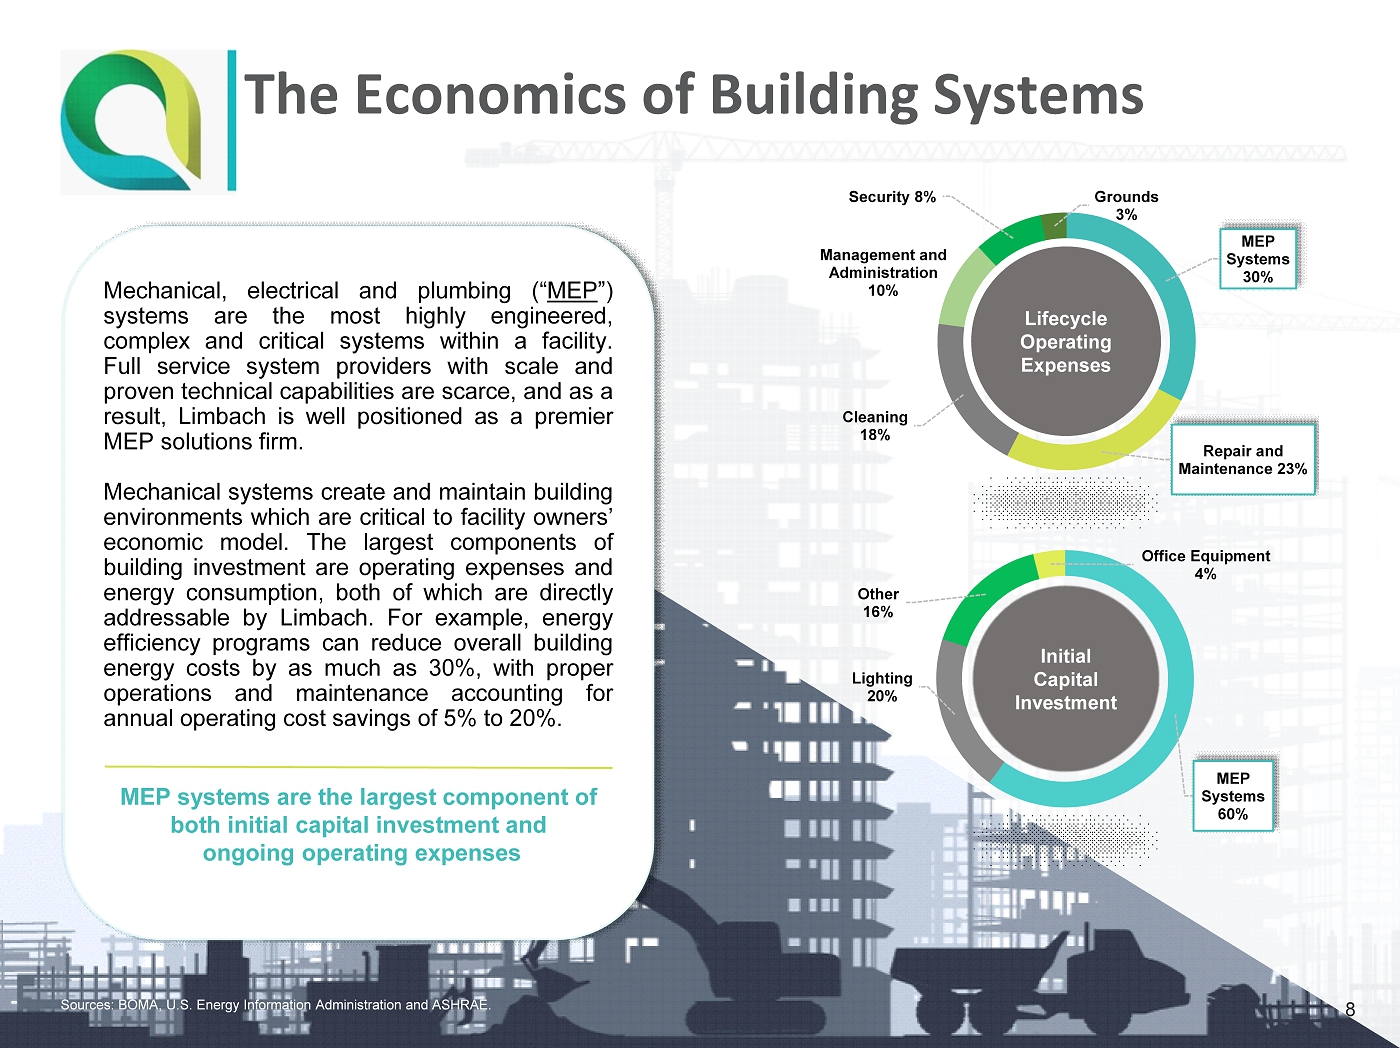
MEP Systems 30% Repair and Maintenance 23% Cleaning 18% Management and Administration 10% Security 8% Grounds 3% The Economics of Building Systems MEP Systems 60% Lighting 20% Other 16% Office Equipment 4% Lifecycle Operating Expenses Sources: BOMA, U.S. Energy Information Administration and ASHRAE. Mechanical, electrical and plumbing (“ MEP ”) systems are the most highly engineered, complex and critical systems within a facility . Full service system providers with scale and proven technical capabilities are scarce, and as a result, Limbach is well positioned as a premier MEP solutions firm . Mechanical systems create and maintain building environments which are critical to facility owners’ economic model . The largest components of building investment are operating expenses and energy consumption, both of which are directly addressable by Limbach . For example, energy efficiency programs can reduce overall building energy costs by as much as 30 % , with proper operations and maintenance accounting for annual operating cost savings of 5 % to 20 % . MEP systems are the largest component of both initial capital investment and ongoing operating expenses Initial Capital Investment 8

Complete Portfolio of MEP Services Limbach is a preeminent national provider of technically - oriented mechanical design, engineering, installation, and maintenance services to sophisticated customers and facility owners who demand exceptional design creativity and construction quality . Offering a single - source, innovative and sophisticated full - lifecycle solution for the design, installation, service, maintenance, repair, retrofit and energy efficiency optimization of MEP systems across multiple high - growth end - markets . Off - Site Pre - fabrication 24/7 Service Construction and Installation Operations and Maintenance Commissioning Engineering System Estimating Planning/ Coordination 9
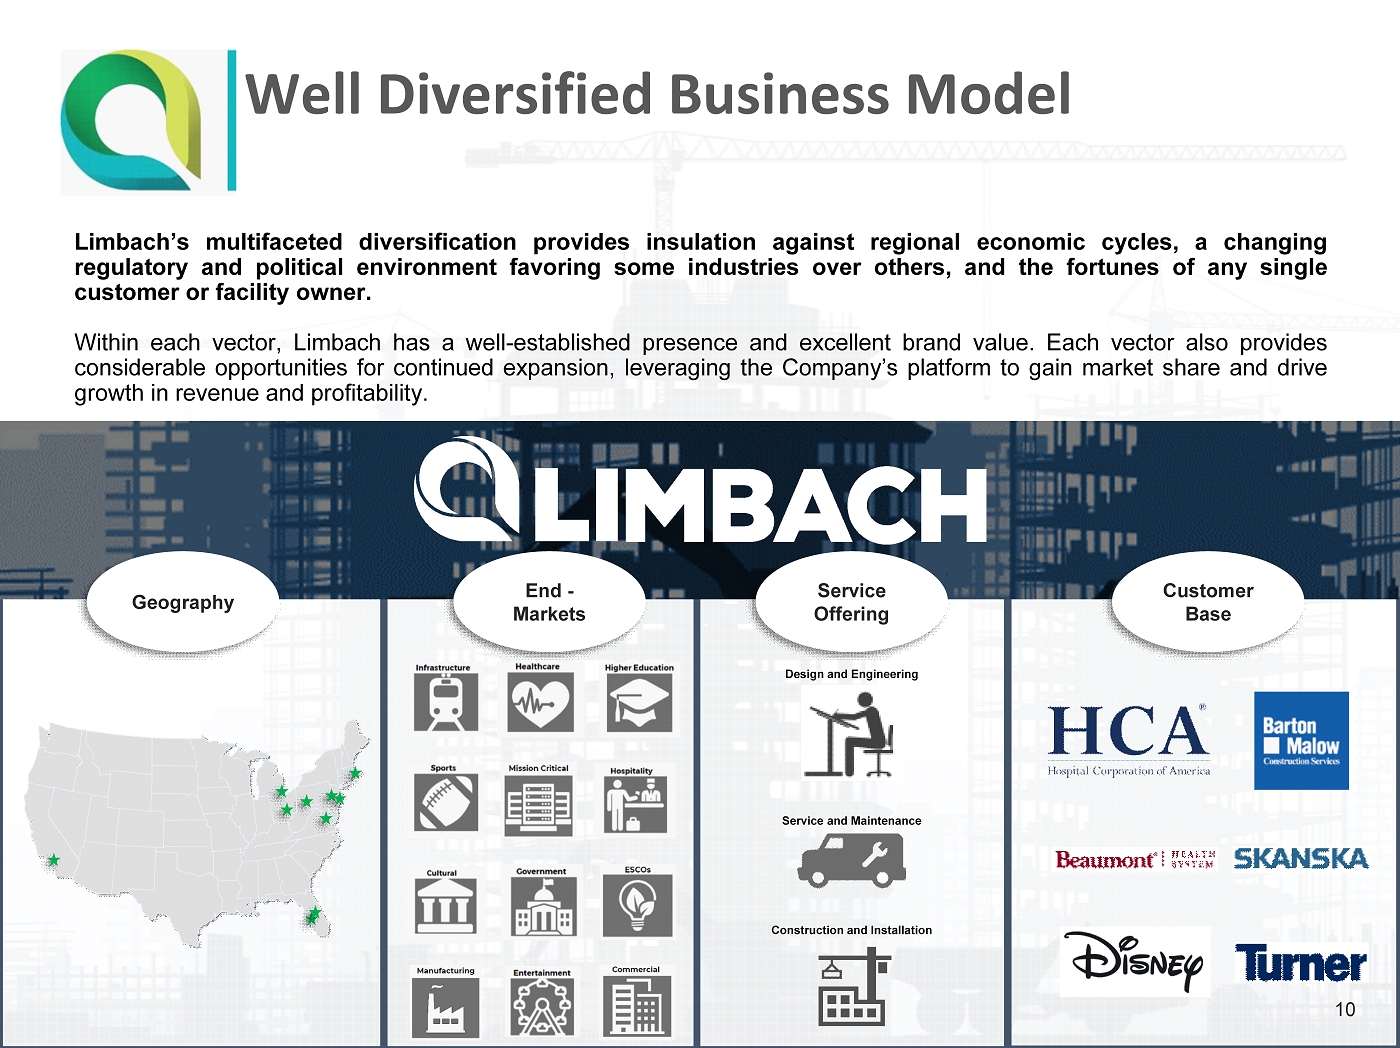
Well Diversified Business Model Limbach’s multifaceted diversification provides insulation against regional economic cycles, a changing regulatory and political environment favoring some industries over others, and the fortunes of any single customer or facility owner . Within each vector, Limbach has a well - established presence and excellent brand value . Each vector also provides considerable opportunities for continued expansion, leveraging the Company’s platform to gain market share and drive growth in revenue and profitability . Geography End - Markets Service Offering Customer Base Design and Engineering Service and Maintenance Construction and Installation 10
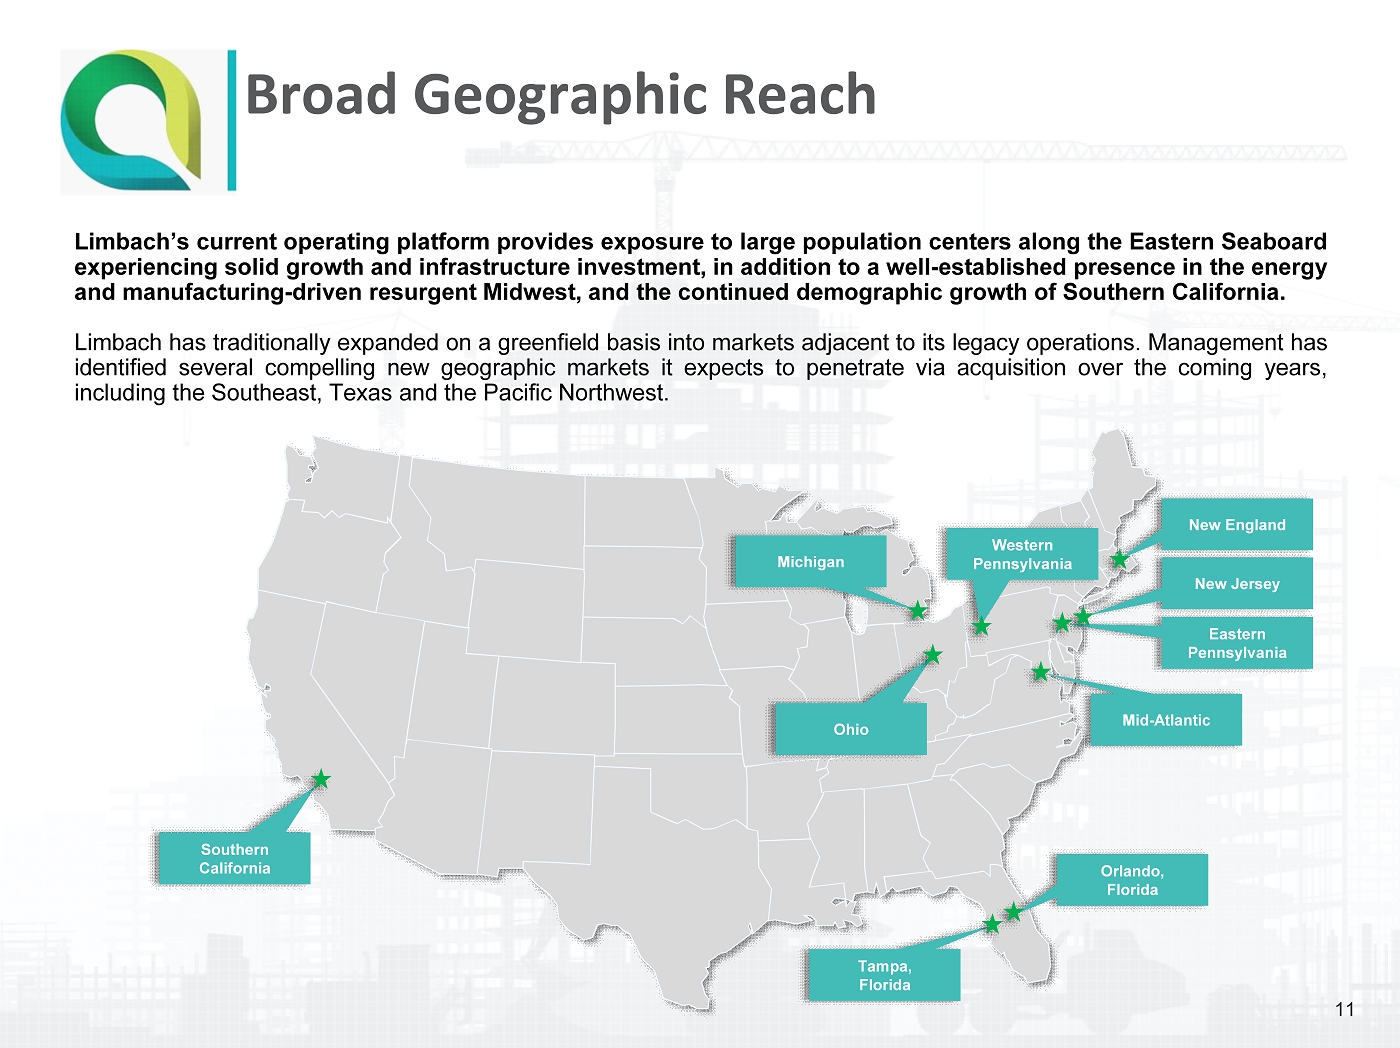
Broad Geographic Reach Limbach’s current operating platform provides exposure to large population centers along the Eastern Seaboard experiencing solid growth and infrastructure investment, in addition to a well - established presence in the energy and manufacturing - driven resurgent Midwest, and the continued demographic growth of Southern California . Limbach has traditionally expanded on a greenfield basis into markets adjacent to its legacy operations . Management has identified several compelling new geographic markets it expects to penetrate via acquisition over the coming years, including the Southeast, Texas and the Pacific Northwest . Southern California Michigan Tampa, Florida Orlando, Florida Ohio Mid - Atlantic Eastern Pennsylvania Western Pennsylvania New England New Jersey 11
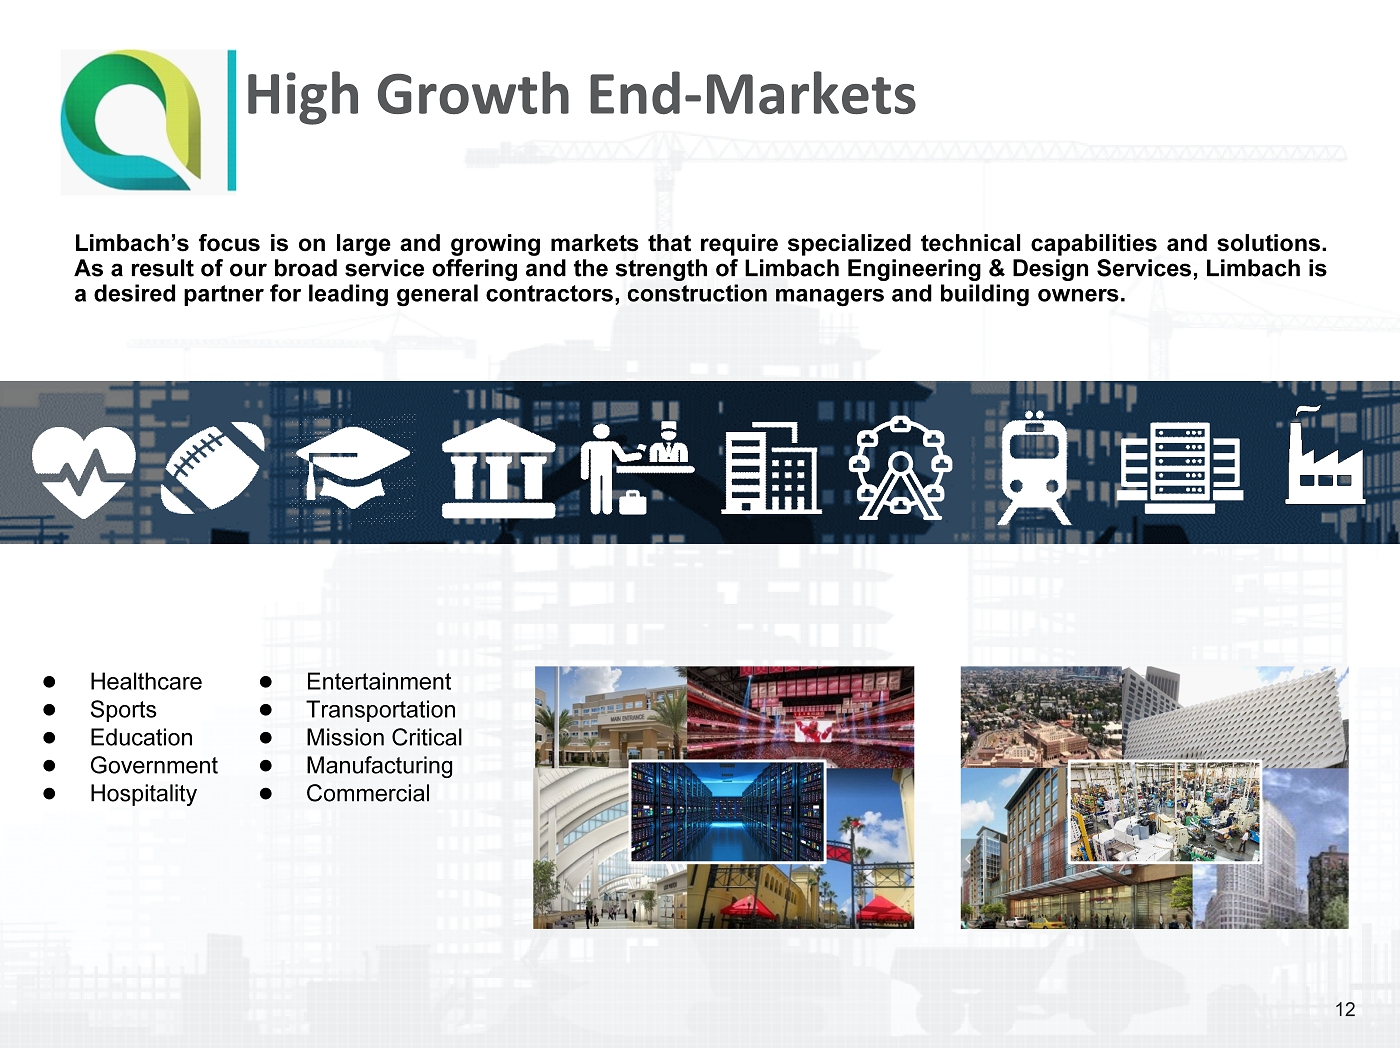
High Growth End - Markets ● Healthcare ● Sports ● Education ● Government ● Hospitality ● Entertainment ● Transportation ● Mission Critical ● Manufacturing ● Commercial Limbach’s focus is on large and growing markets that require specialized technical capabilities and solutions . As a result of our broad service offering and the strength of Limbach Engineering & Design Services, Limbach is a desired partner for leading general contractors, construction managers and building owners . 12
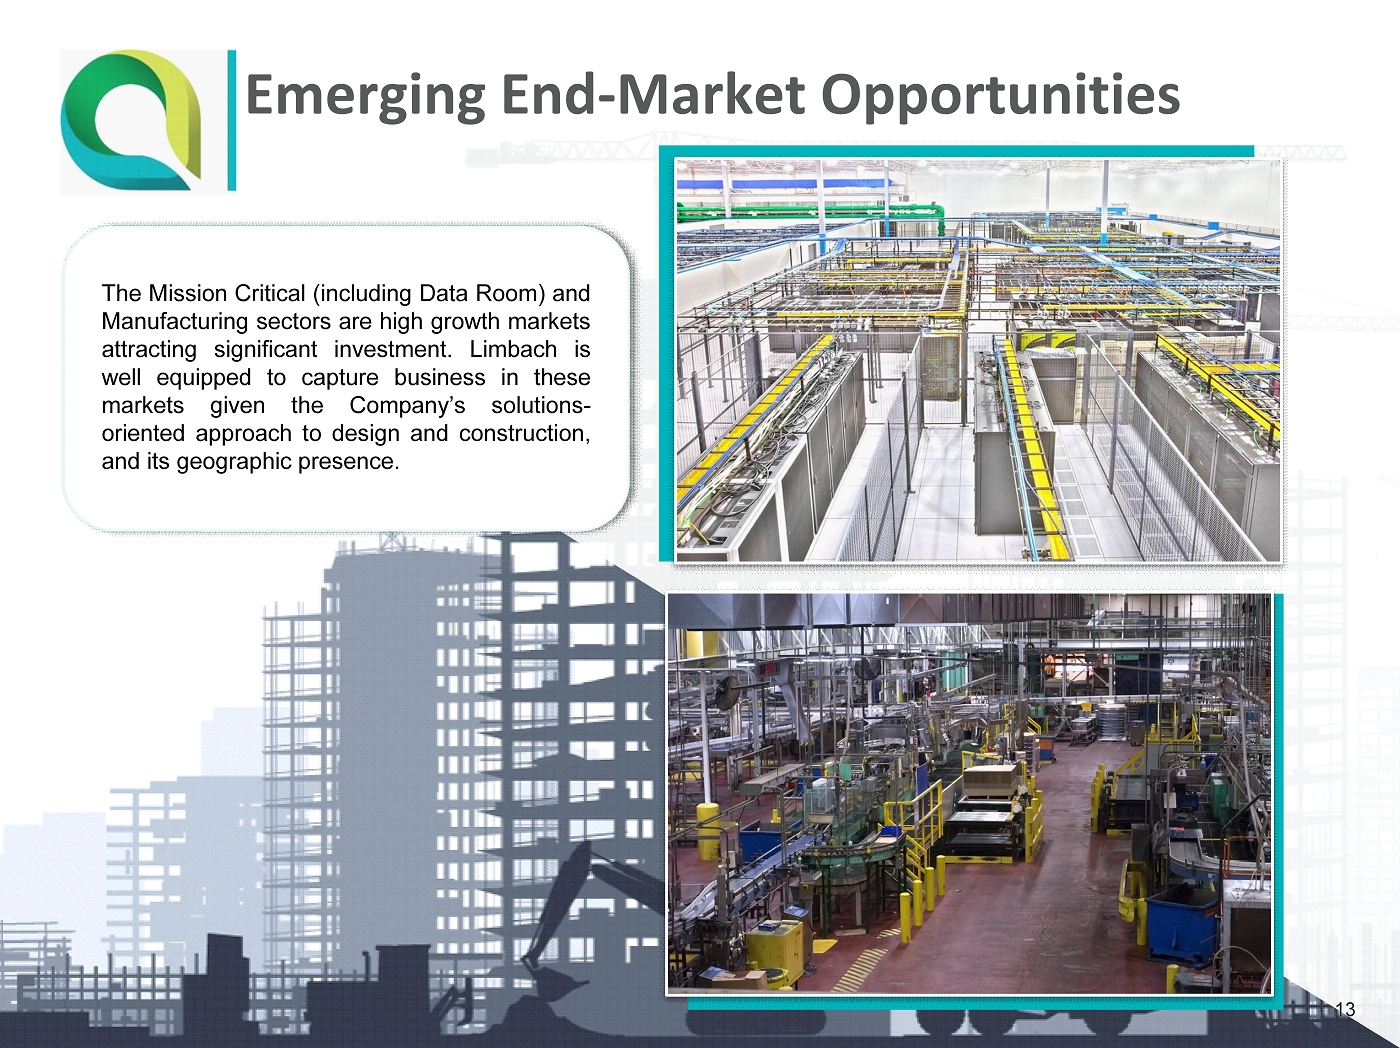
Emerging End - Market Opportunities 1 [__]. The Mission Critical (including Data Room) and Manufacturing sectors are high growth markets attracting significant investment . Limbach is well equipped to capture business in these markets given the Company’s solutions - oriented approach to design and construction, and its geographic presence . 13
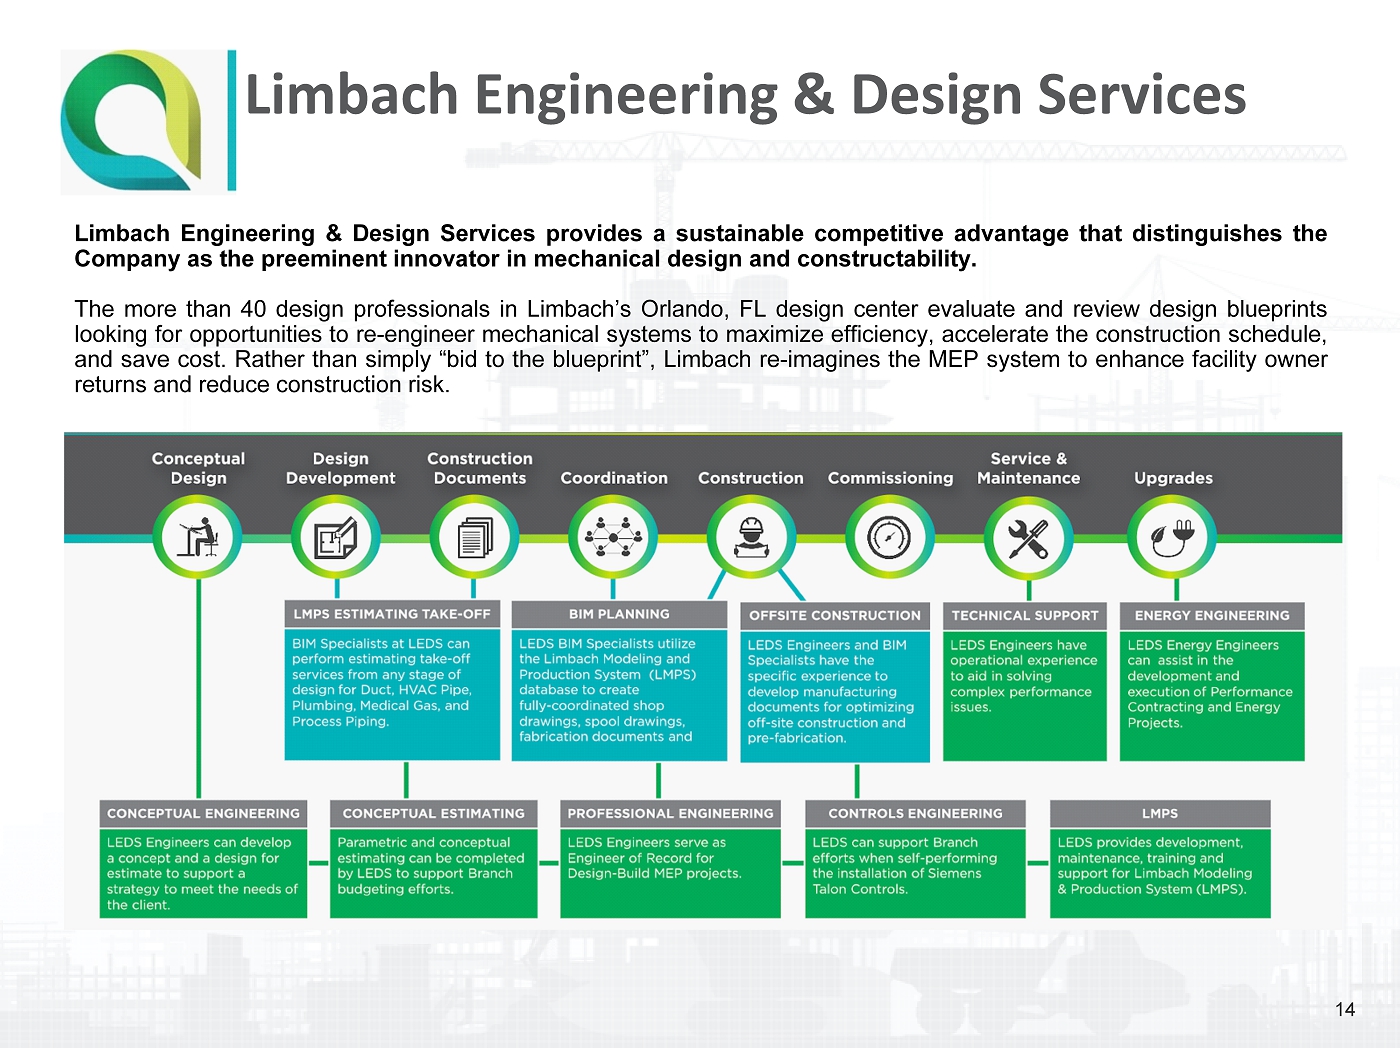
Limbach Engineering & Design Services Limbach Engineering & Design Services provides a sustainable competitive advantage that distinguishes the Company as the preeminent innovator in mechanical design and constructability . The more than 40 design professionals in Limbach’s Orlando, FL design center evaluate and review design blueprints looking for opportunities to re - engineer mechanical systems to maximize efficiency, accelerate the construction schedule, and save cost . Rather than simply “bid to the blueprint”, Limbach re - imagines the MEP system to enhance facility owner returns and reduce construction risk . 14
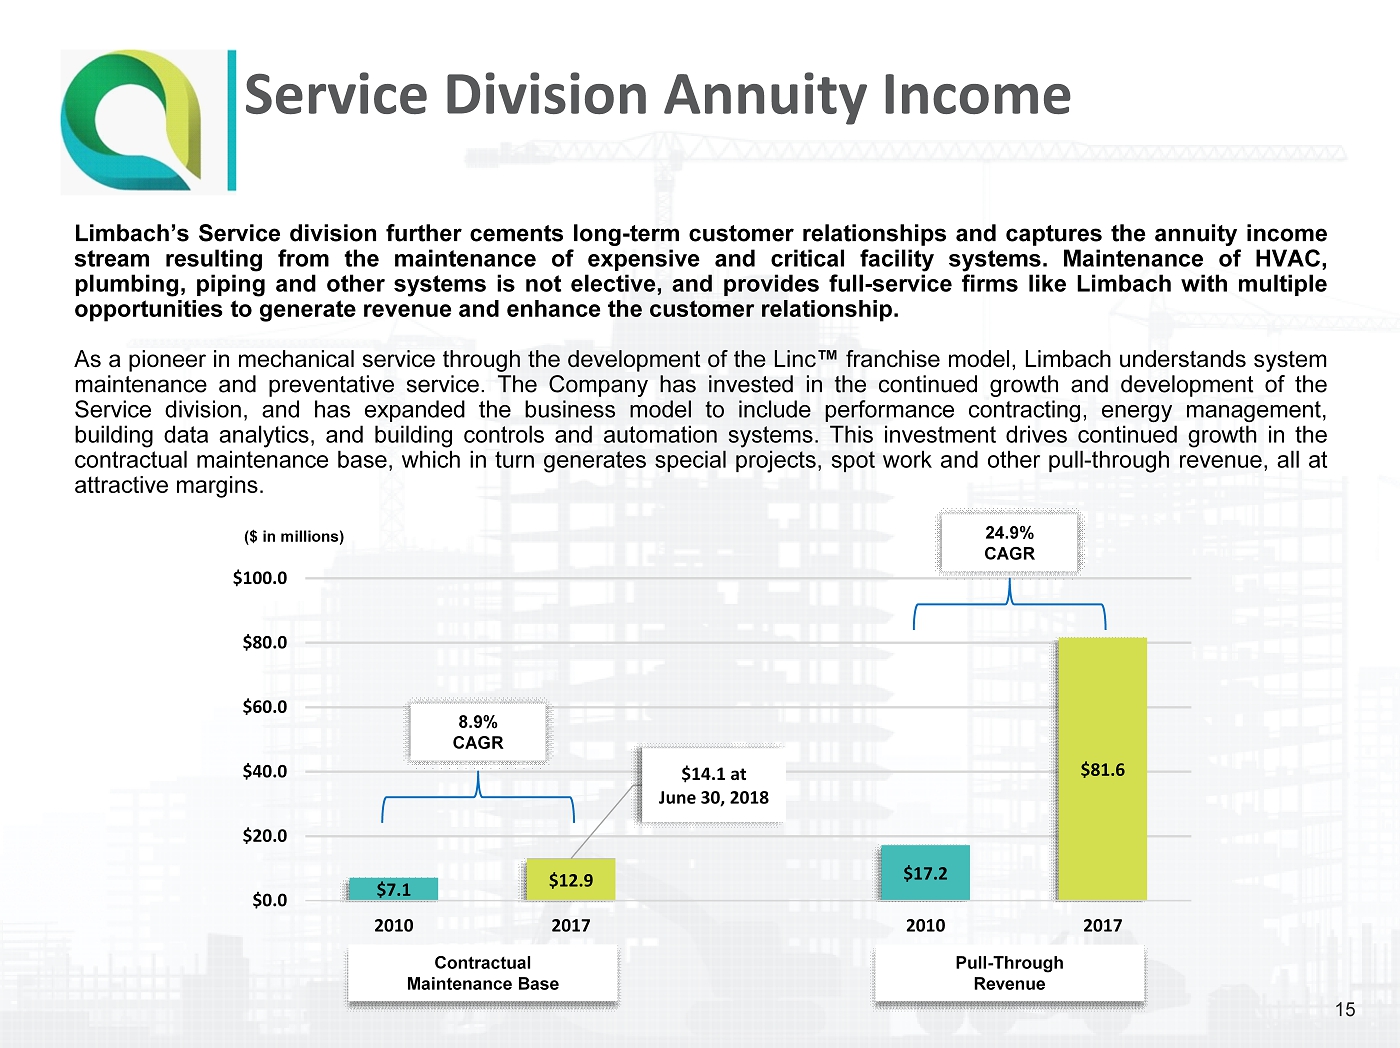
Service Division Annuity Income Limbach’s Service division further cements long - term customer relationships and captures the annuity income stream resulting from the maintenance of expensive and critical facility systems . Maintenance of HVAC, plumbing, piping and other systems is not elective, and provides full - service firms like Limbach with multiple opportunities to generate revenue and enhance the customer relationship . As a pioneer in mechanical service through the development of the Linc ™ franchise model, Limbach understands system maintenance and preventative service . The Company has invested in the continued growth and development of the Service division, and has expanded the business model to include performance contracting, energy management, building data analytics, and building controls and automation systems . This investment drives continued growth in the contractual maintenance base, which in turn generates special projects, spot work and other pull - through revenue, all at attractive margins . $7.1 $12.9 $17.2 $81.6 $14.1 at June 30, 2018 $0.0 $20.0 $40.0 $60.0 $80.0 $100.0 2010 2017 2010 2017 8.9% CAGR Contractual Maintenance Base Pull - Through Revenue 24.9% CAGR ($ in millions) 15
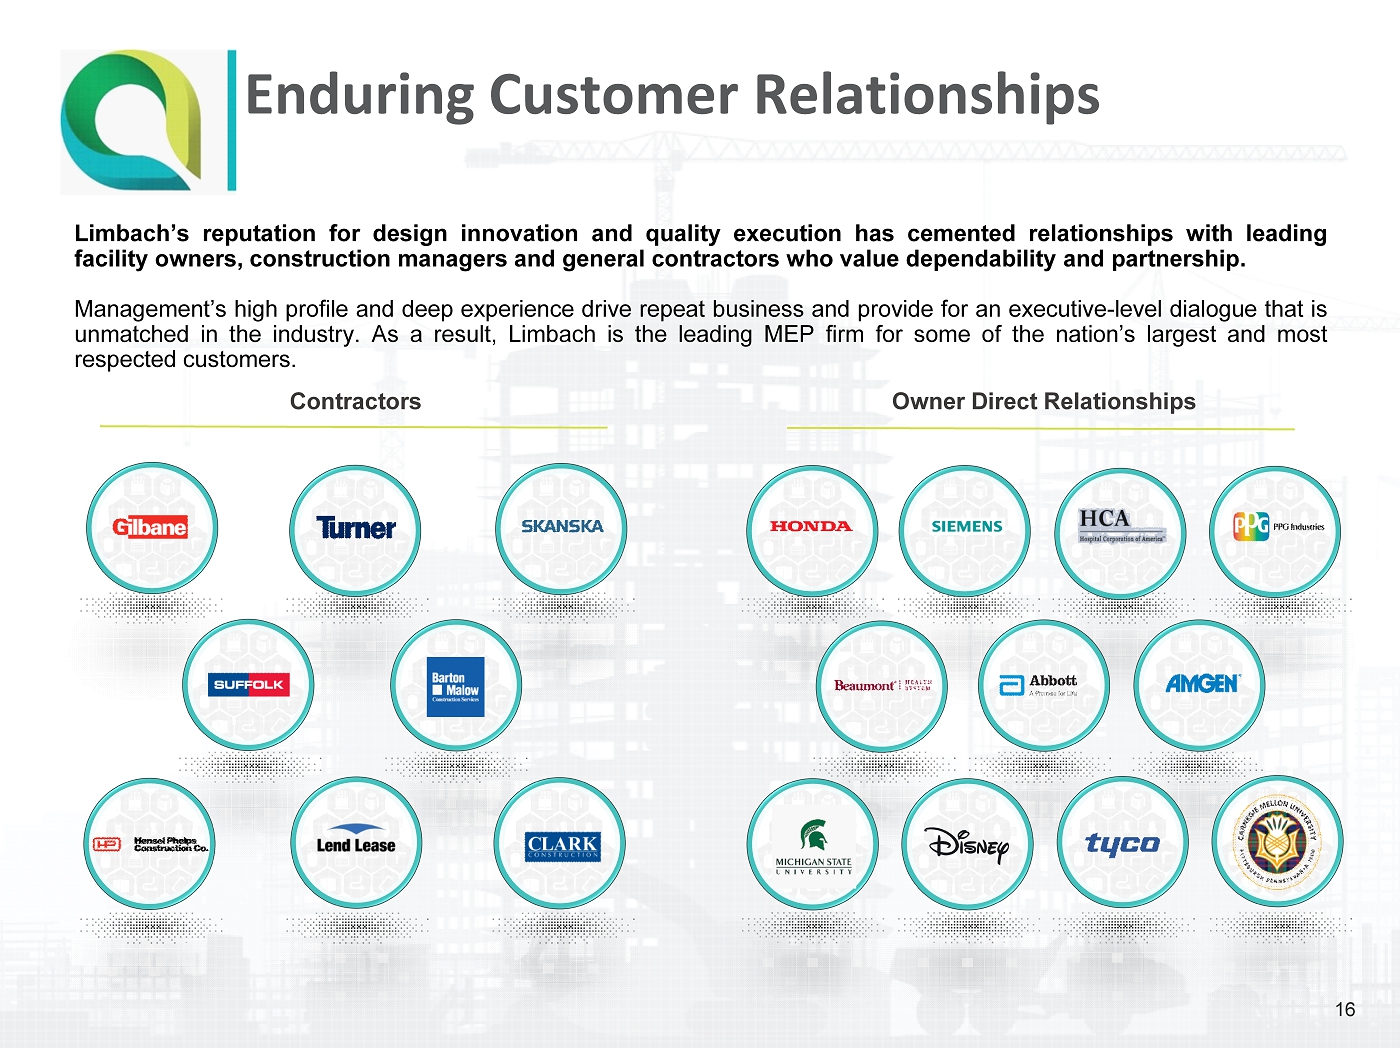
Enduring Customer Relationships Owner Direct Relationships Contractors Limbach’s reputation for design innovation and quality execution has cemented relationships with leading facility owners, construction managers and general contractors who value dependability and partnership . Management’s high profile and deep experience drive repeat business and provide for an executive - level dialogue that is unmatched in the industry . As a result, Limbach is the leading MEP firm for some of the nation’s largest and most respected customers . 16
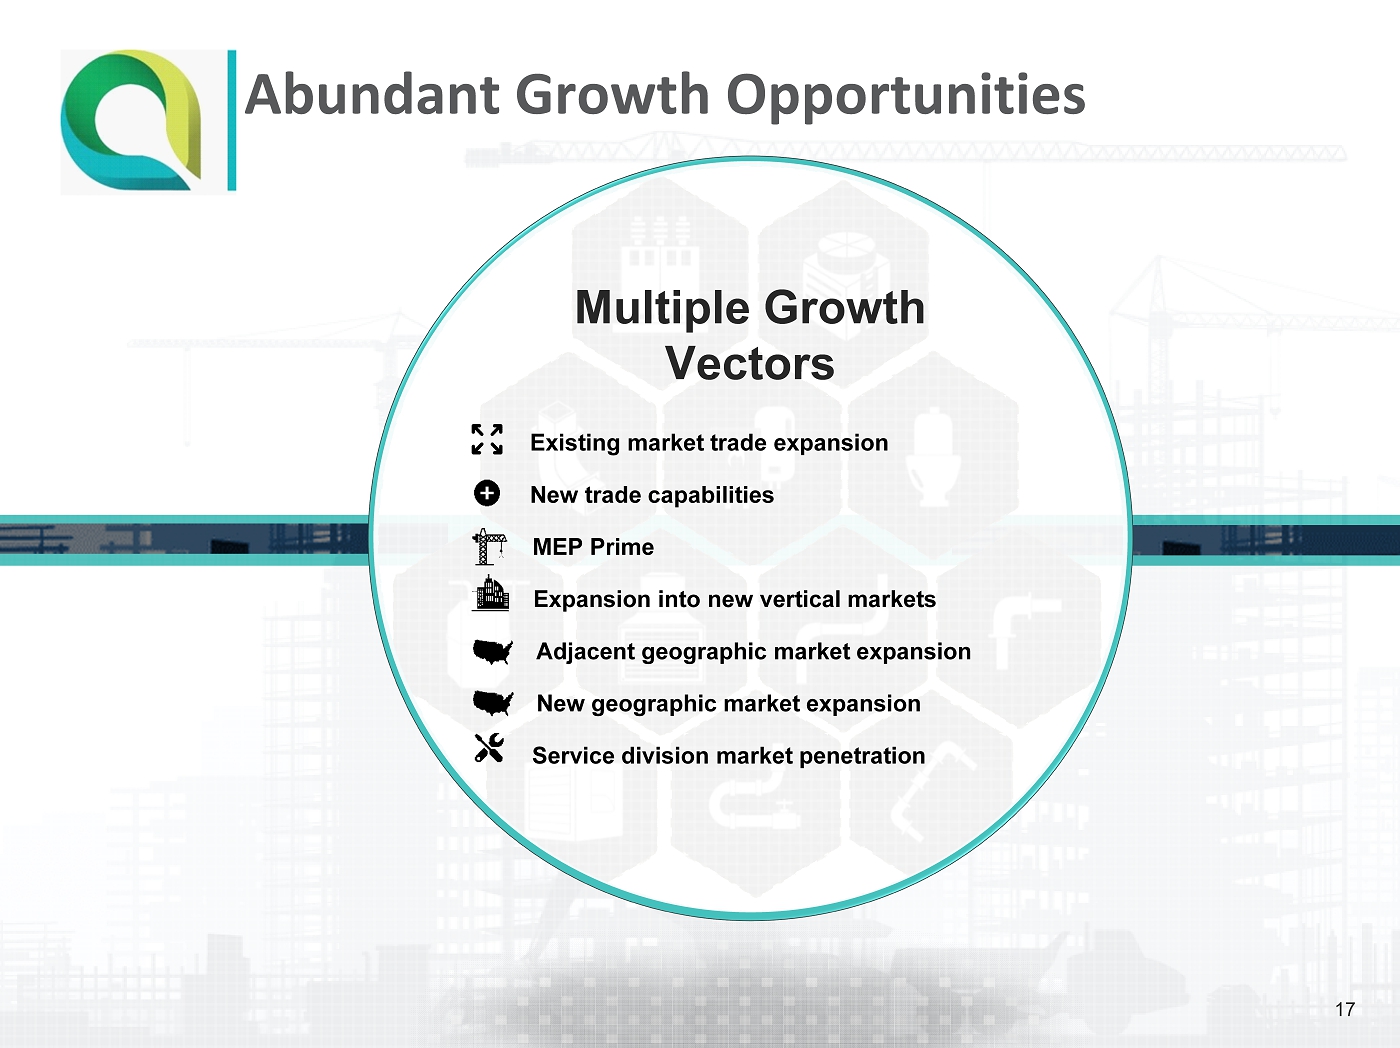
Abundant Growth Opportunities Multiple Growth Vectors Existing market trade expansion New trade capabilities MEP Prime Expansion into new vertical markets Adjacent geographic market expansion New geographic market expansion Service division market penetration 17
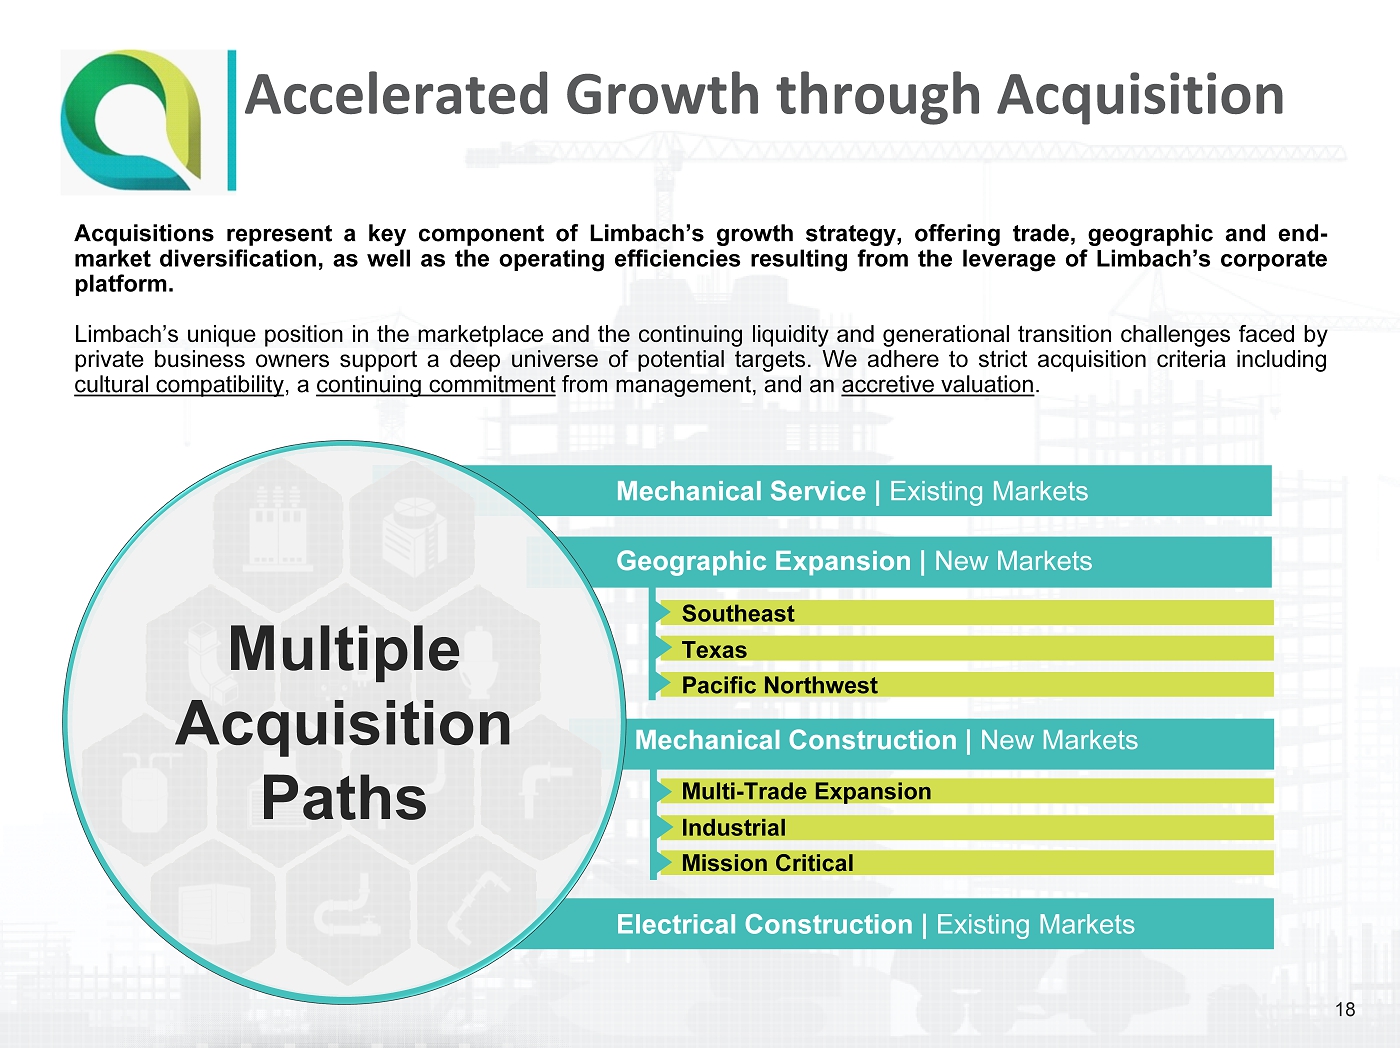
Accelerated Growth through Acquisition Acquisitions represent a key component of Limbach’s growth strategy, offering trade, geographic and end - market diversification, as well as the operating efficiencies resulting from the leverage of Limbach’s corporate platform . Limbach’s unique position in the marketplace and the continuing liquidity and generational transition challenges faced by private business owners support a deep universe of potential targets . We adhere to strict acquisition criteria including cultural compatibility , a continuing commitment from management, and an accretive valuation . Multiple Acquisition Paths Southeast Texas Pacific Northwest Mechanical Service | Existing Markets Geographic Expansion | New Markets Multi - Trade Expansion Industrial Mission Critical Mechanical Construction | New Markets Electrical Construction | Existing Markets 18
Acquisition of Dunbar Mechanical 19 Announced on September 19 that Limbach has signed a definitive agreement to acquire Toledo, OH - based Dunbar Mechanical x Purchase price of $20.2 million • $4.0 million of LMB stock • $3.6 million subordinated seller note • $12.6 million of cash x Privately - owned provider of mechanical construction services in Toledo, Ohio and the surrounding region • Primarily focused on industrial and also maintains a presence in higher education, healthcare and general institutional customers • Limbach and Dunbar have side - by - side experience working together since 2016, most notably as joint venture partners on the successful ProMedica Toledo Hospital Project for Turner Construction x Current revenue run rate of ~ $75 million • Significant owner - direct industrial maintenance and capital projects activity • Dunbar maintains an active mechanical service division with a contractual maintenance base which drives small projects and spot work opportunities x Dunbar management and leadership expected to remain with the Company • Family business currently operated by third generation family member Erik Dunbar • Acquisition expected to close within 60 days • Dunbar will be operated as a separate unit after the acquisition closing
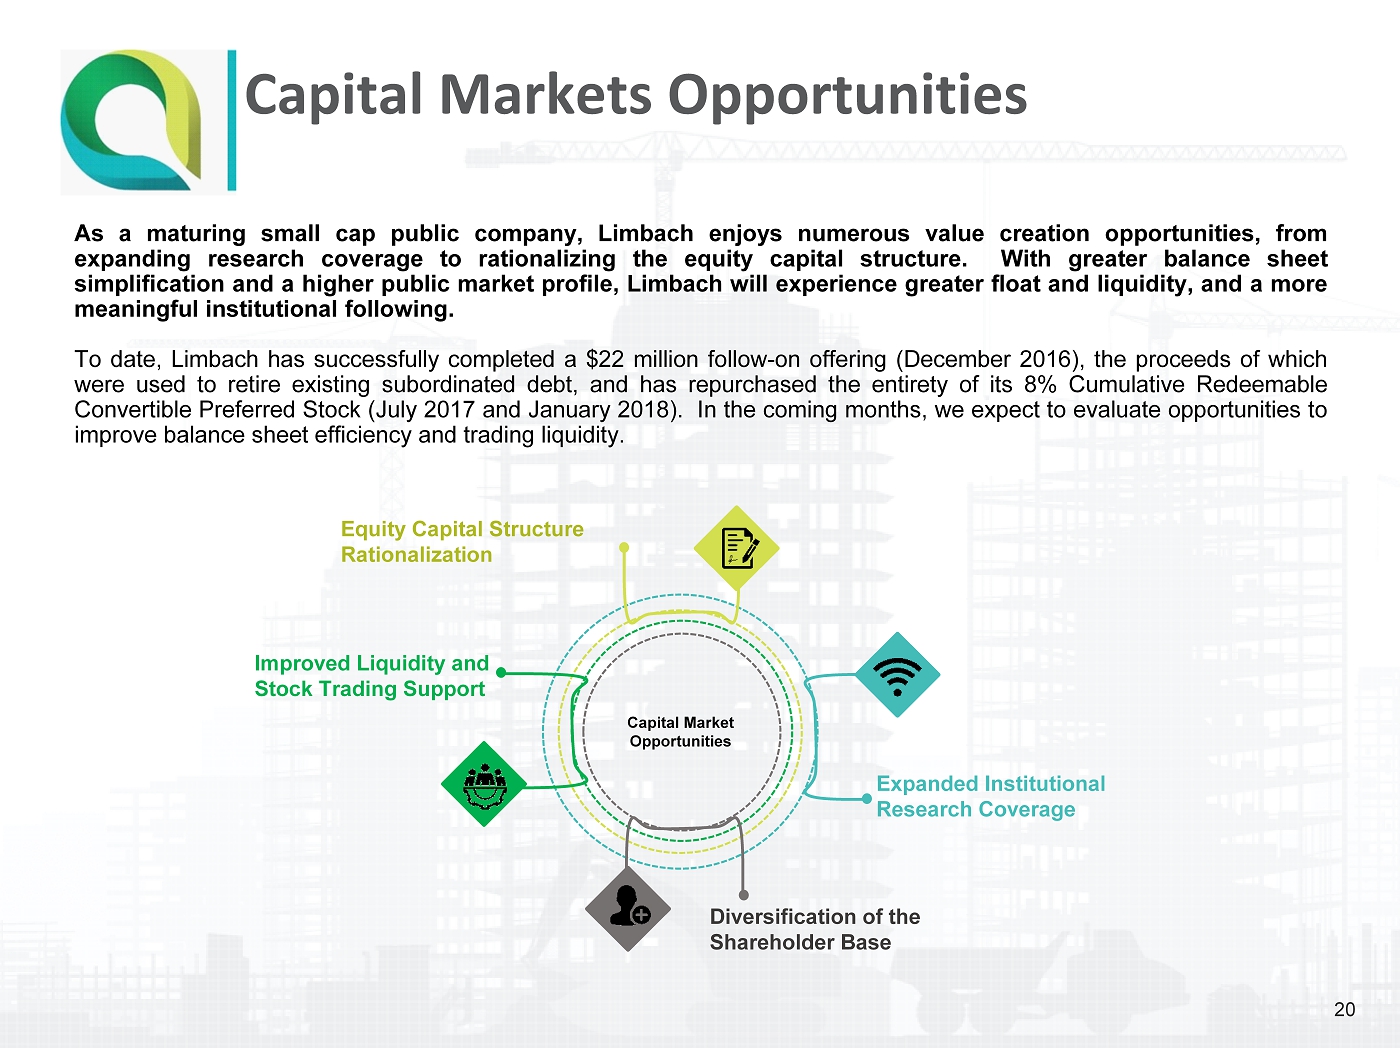
Capital Markets Opportunities As a maturing small cap public company, Limbach enjoys numerous value creation opportunities, from expanding research coverage to rationalizing the equity capital structure . With greater balance sheet simplification and a higher public market profile, Limbach will experience greater float and liquidity, and a more meaningful institutional following . To date, Limbach has successfully completed a $ 22 million follow - on offering (December 2016 ), the proceeds of which were used to retire existing subordinated debt, and has repurchased the entirety of its 8 % Cumulative Redeemable Convertible Preferred Stock (July 2017 and January 2018 ) . In the coming months, we expect to evaluate opportunities to improve balance sheet efficiency and trading liquidity . Equity Capital Structure Rationalization Expanded Institutional Research Coverage Diversification of the Shareholder Base Improved Liquidity and Stock Trading Support Capital Market Opportunities 20

Limbach’s considerable backlog of construction work, together with a robust pipeline of qualified opportunities, provide support for the achievability of the current year revenue forecast, and as support for growth in 2019 . Limbach considers backlog in the Construction segment to include work - in - progress, as well as project awards for which there is executed documentation . Additionally, the Company tabulates and tracks promised but not yet booked opportunities in which it has a high degree of confidence . However, those opportunities are not formally included in the backlog calculation until documentation has been executed . Initial revenue guidance for 2018 was $ 510 - $ 530 million but has since been increased to $ 530 - $ 550 million, with Adjusted EBITDA guidance of $ 18 - $ 20 million . Financial guidance also excludes the impact of the recently - announced agreement to acquire Dunbar Mechanical, Inc . Backlog/Pipeline Offer Strong Visibility $3.0 $3.3 $3.2 $3.1 $0.0 $1.0 $2.0 $3.0 $4.0 $5.0 2016 2017 2Q'17 2Q'18 ($ in billions) Pipeline Construction Backlog 21 $355.4 $390.2 $426.7 $413.9 $445.3 $300.0 $400.0 $500.0 $600.0 $700.0 $800.0 $900.0 4Q'15 4Q'16 4Q'17 1Q'18 2Q'18 ($ in millions) $381 million promised/committed but not booked $826 Growth +48.1%
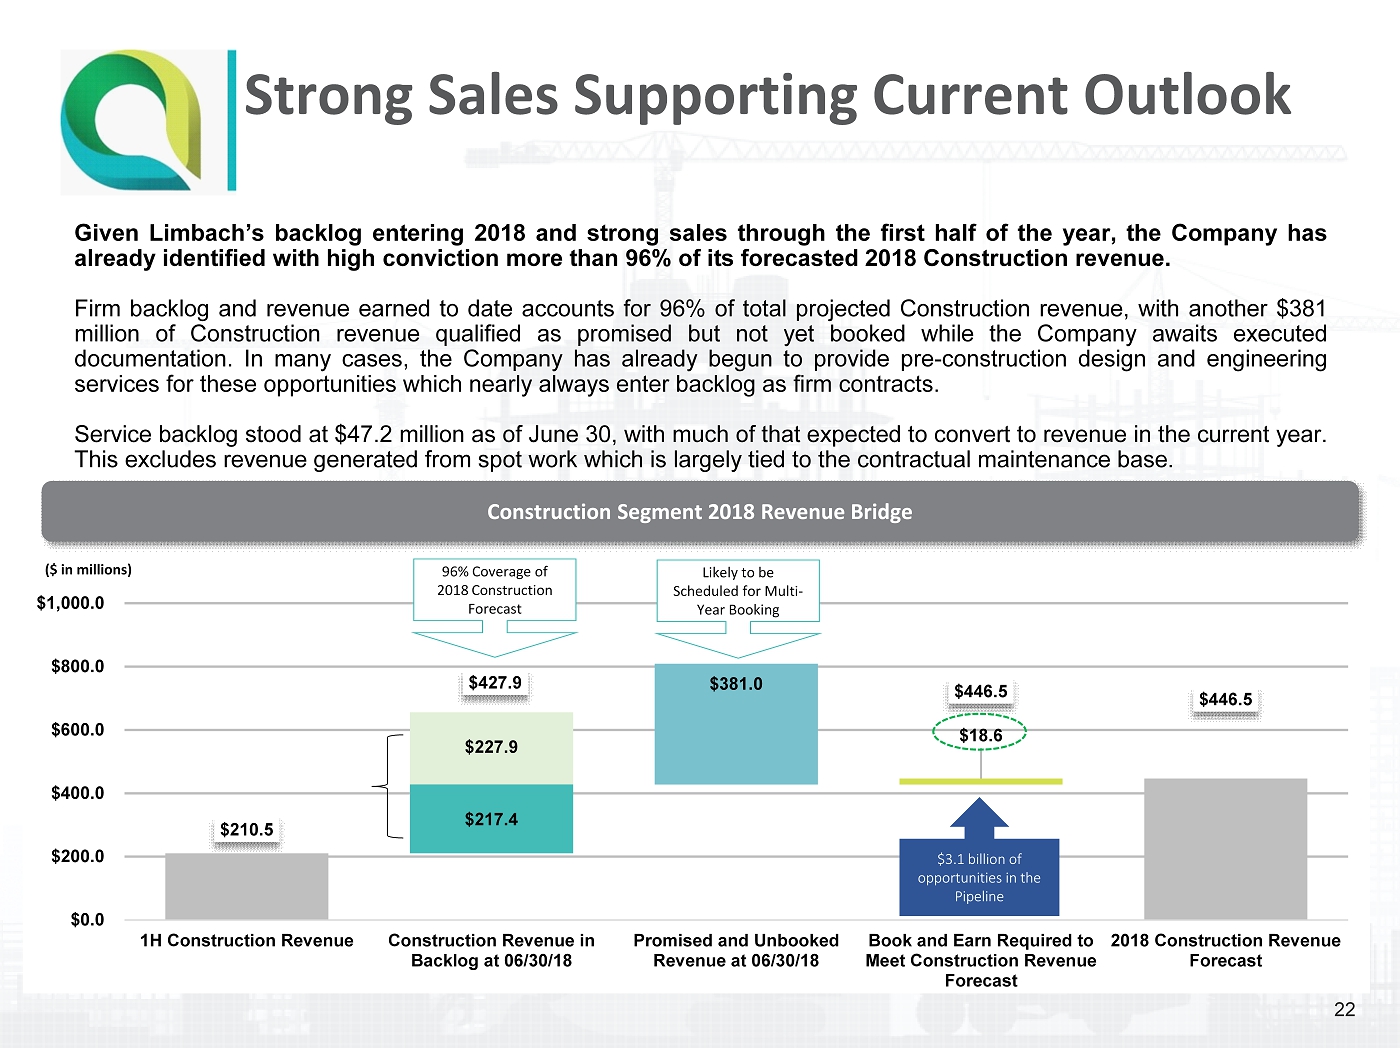
Given Limbach’s backlog entering 2018 and strong sales through the first half of the year, the Company has already identified with high conviction more than 96 % of its forecasted 2018 Construction revenue . Firm backlog and revenue earned to date accounts for 96 % of total projected Construction revenue, with another $ 381 million of Construction revenue qualified as promised but not yet booked while the Company awaits executed documentation . In many cases, the Company has already begun to provide pre - construction design and engineering services for these opportunities which nearly always enter backlog as firm contracts . Service backlog stood at $ 47 . 2 million as of June 30 , with much of that expected to convert to revenue in the current year . This excludes revenue generated from spot work which is largely tied to the contractual maintenance base . Strong Sales Supporting Current Outlook 22 $210.5 $427.9 $446.5 $446.5 $217.4 $18.6 $227.9 $381.0 $0.0 $200.0 $400.0 $600.0 $800.0 $1,000.0 1H Construction Revenue Construction Revenue in Backlog at 06/30/18 Promised and Unbooked Revenue at 06/30/18 Book and Earn Required to Meet Construction Revenue Forecast 2018 Construction Revenue Forecast 96% Coverage of 2018 Construction Forecast Likely to be Scheduled for Multi - Year Booking ($ in millions) $3.1 billion of opportunities in the Pipeline Construction Segment 2018 Revenue Bridge

Appendix
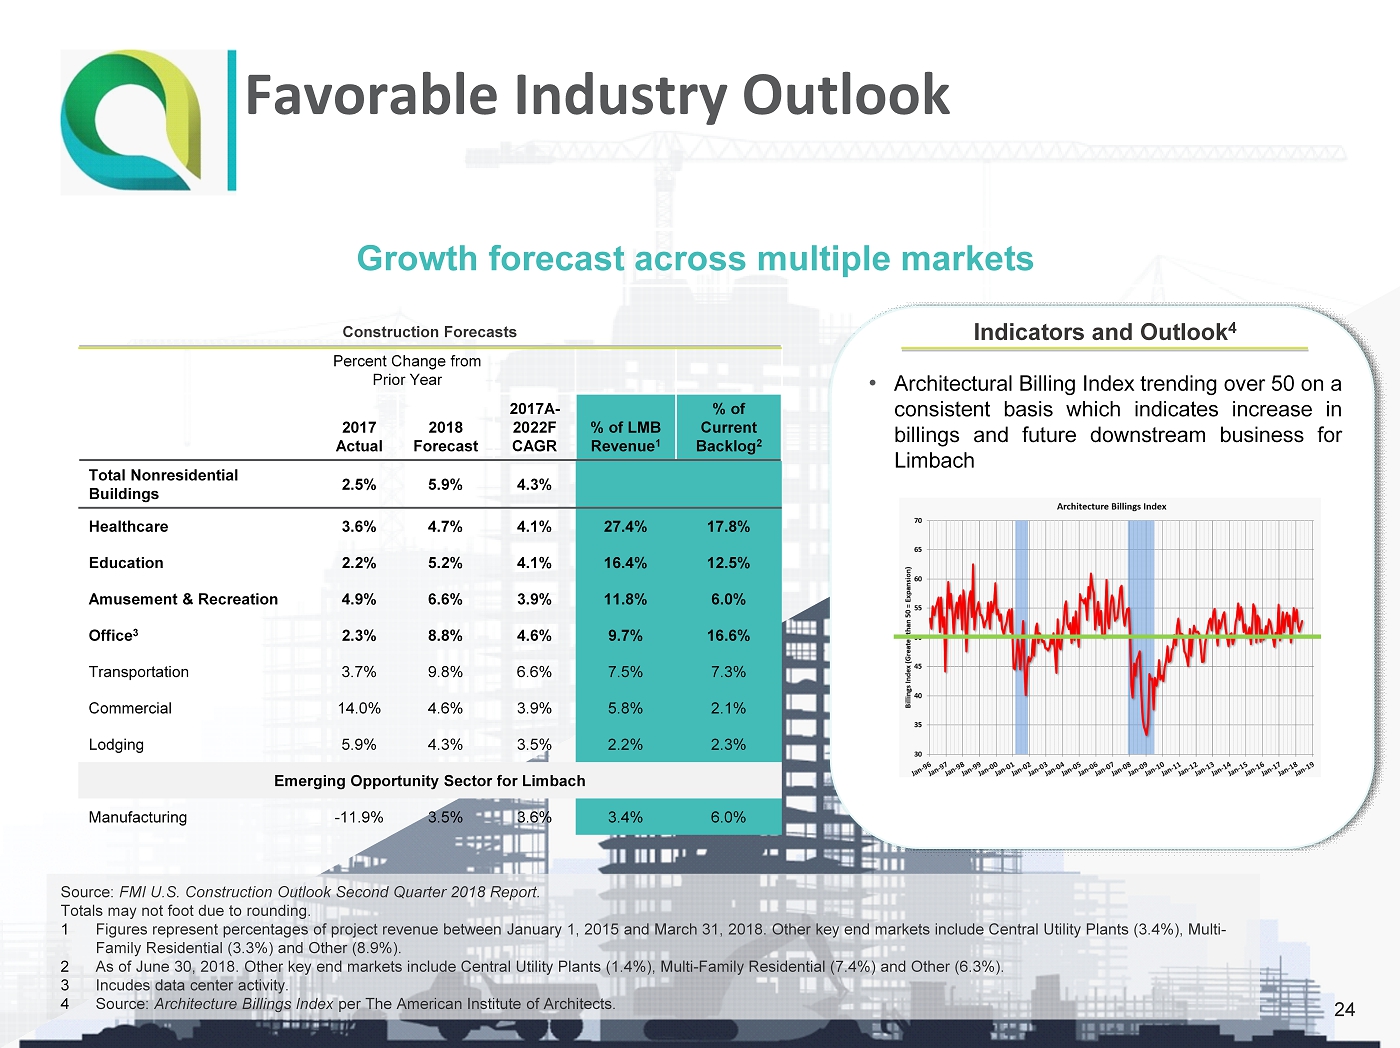
Favorable Industry Outlook Source: FMI U.S. Construction Outlook Second Quarter 2018 Report. Totals may not foot due to rounding. 1 Figures represent percentages of project revenue between January 1, 2015 and March 31, 2018. Other key end markets include Ce ntr al Utility Plants (3.4%), Multi - Family Residential (3.3%) and Other (8.9%). 2 As of June 30, 2018. Other key end markets include Central Utility Plants (1.4%), Multi - Family Residential (7.4%) and Other (6.3 %). 3 Incudes data center activity. 4 Source: Architecture Billings Index per The American Institute of Architects. Growth forecast across multiple markets Construction Forecasts Percent Change from Prior Year 2017 Actual 2018 Forecast 2017A - 2022F CAGR % of LMB Revenue 1 % of Current Backlog 2 Total Nonresidential Buildings 2.5% 5.9% 4.3% Healthcare 3.6% 4.7% 4.1% 27.4% 17.8% Education 2.2% 5.2% 4.1% 16.4% 12.5% Amusement & Recreation 4.9% 6.6% 3.9% 11.8% 6.0% Office 3 2.3% 8.8% 4.6% 9.7% 16.6% Transportation 3.7% 9.8% 6.6% 7.5% 7.3% Commercial 14.0% 4.6% 3.9% 5.8% 2.1% Lodging 5.9% 4.3% 3.5% 2.2% 2.3% Emerging Opportunity Sector for Limbach Manufacturing - 11.9% 3.5% 3.6% 3.4% 6.0% • Architectural Billing Index trending over 50 on a consistent basis which indicates increase in billings and future downstream business for Limbach Indicators and Outlook 4 24
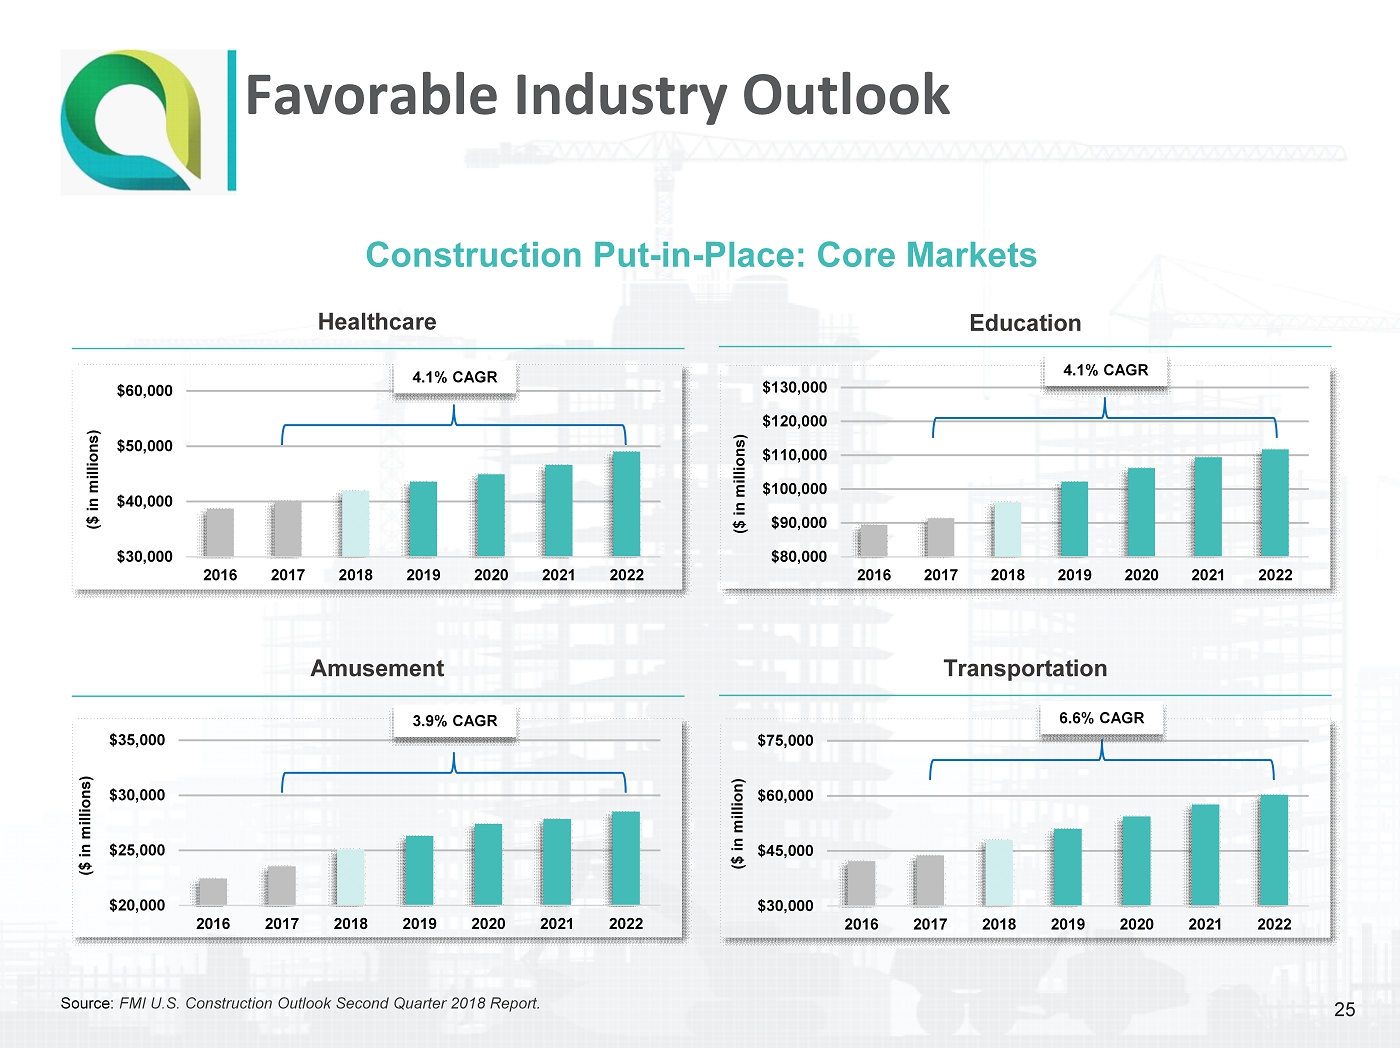
Source: FMI U.S. Construction Outlook Second Quarter 2018 Report . Construction Put - in - Place: Core Markets Healthcare Amusement Transportation Education $30,000 $40,000 $50,000 $60,000 2016 2017 2018 2019 2020 2021 2022 ($ in millions) $80,000 $90,000 $100,000 $110,000 $120,000 $130,000 2016 2017 2018 2019 2020 2021 2022 ($ in millions) $20,000 $25,000 $30,000 $35,000 2016 2017 2018 2019 2020 2021 2022 ($ in millions) $30,000 $45,000 $60,000 $75,000 2016 2017 2018 2019 2020 2021 2022 ($ in million) Favorable Industry Outlook 25 3.9% CAGR 4.1% CAGR 4.1% CAGR 6.6% CAGR
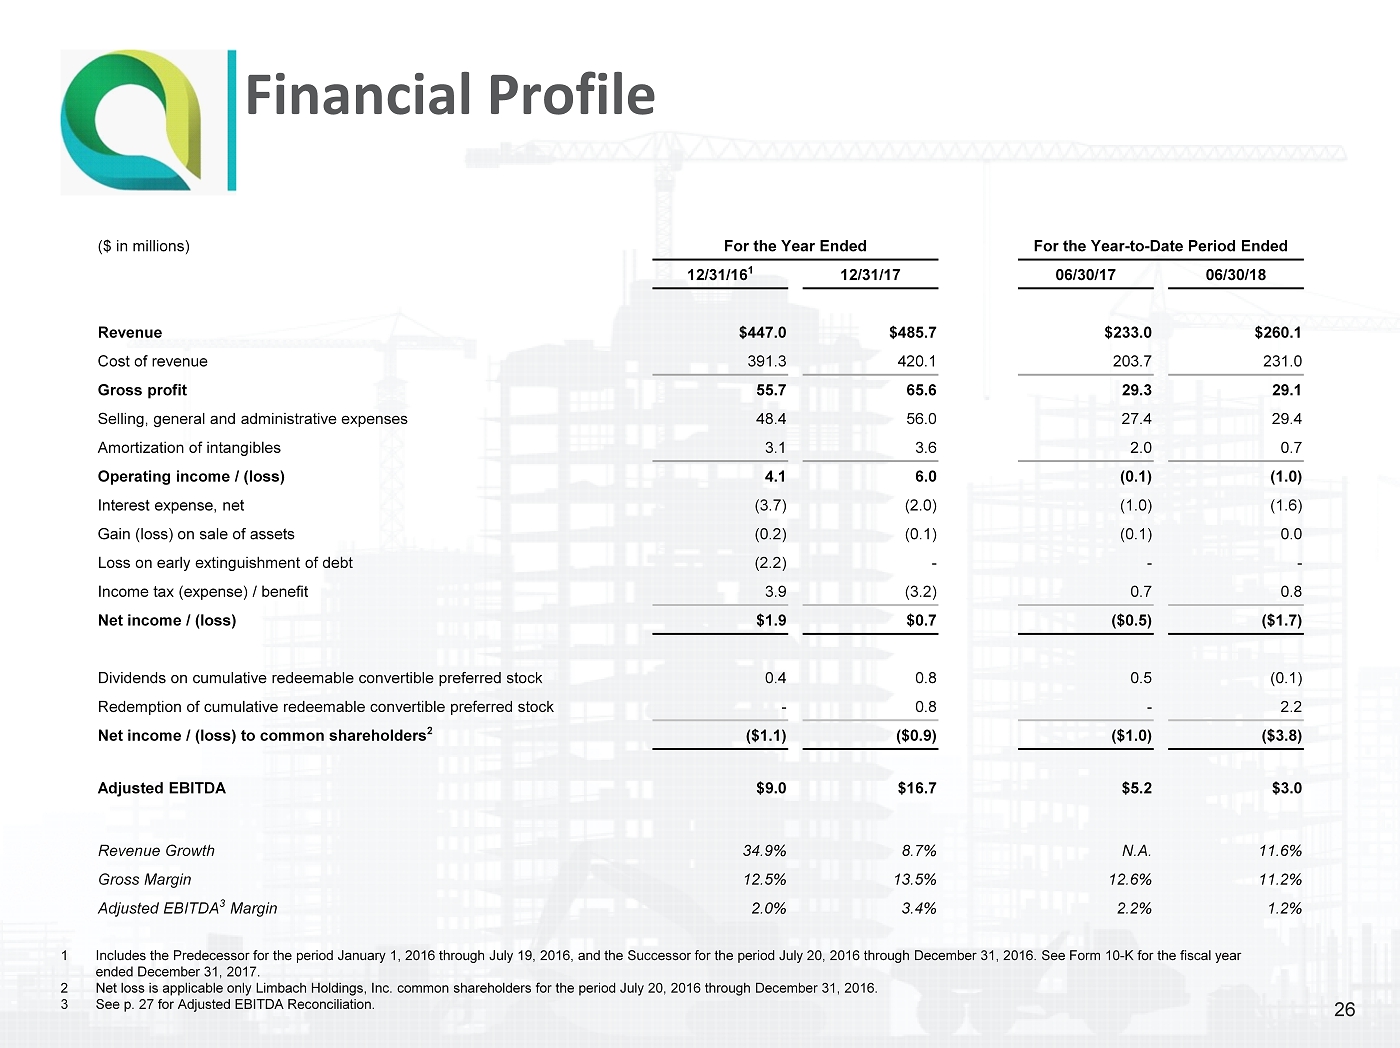
Financial Profile 1 Includes the Predecessor for the period January 1, 2016 through July 19, 2016, and the Successor for the period July 20, 2016 th rough December 31, 2016. See Form 10 - K for the fiscal year ended December 31, 2017. 2 Net loss is applicable only Limbach Holdings, Inc. common shareholders for the period July 20, 2016 through December 31, 2016. 3 See p. 27 for Adjusted EBITDA Reconciliation. 26 ($ in millions) For the Year Ended For the Year - to - Date Period Ended 12/31/16 1 12/31/17 06/30/17 06/30/18 Revenue $447.0 $485.7 $233.0 $260.1 Cost of revenue 391.3 420.1 203.7 231.0 Gross profit 55.7 65.6 29.3 29.1 Selling, general and administrative expenses 48.4 56.0 27.4 29.4 Amortization of intangibles 3.1 3.6 2.0 0.7 Operating income / (loss) 4.1 6.0 (0.1) (1.0) Interest expense, net (3.7) (2.0) (1.0) (1.6) Gain (loss) on sale of assets (0.2) (0.1) (0.1) 0.0 Loss on early extinguishment of debt (2.2) - - - Income tax (expense) / benefit 3.9 (3.2) 0.7 0.8 Net income / (loss) $1.9 $0.7 ($0.5) ($1.7) Dividends on cumulative redeemable convertible preferred stock 0.4 0.8 0.5 (0.1) Redemption of cumulative redeemable convertible preferred stock - 0.8 - 2.2 Net income / (loss) to common shareholders 2 ($1.1) ($0.9) ($1.0) ($3.8) Adjusted EBITDA $9.0 $16.7 $5.2 $3.0 Revenue Growth 34.9% 8.7% N.A. 11.6% Gross Margin 12.5% 13.5% 12.6% 11.2% Adjusted EBITDA 3 Margin 2.0% 3.4% 2.2% 1.2%
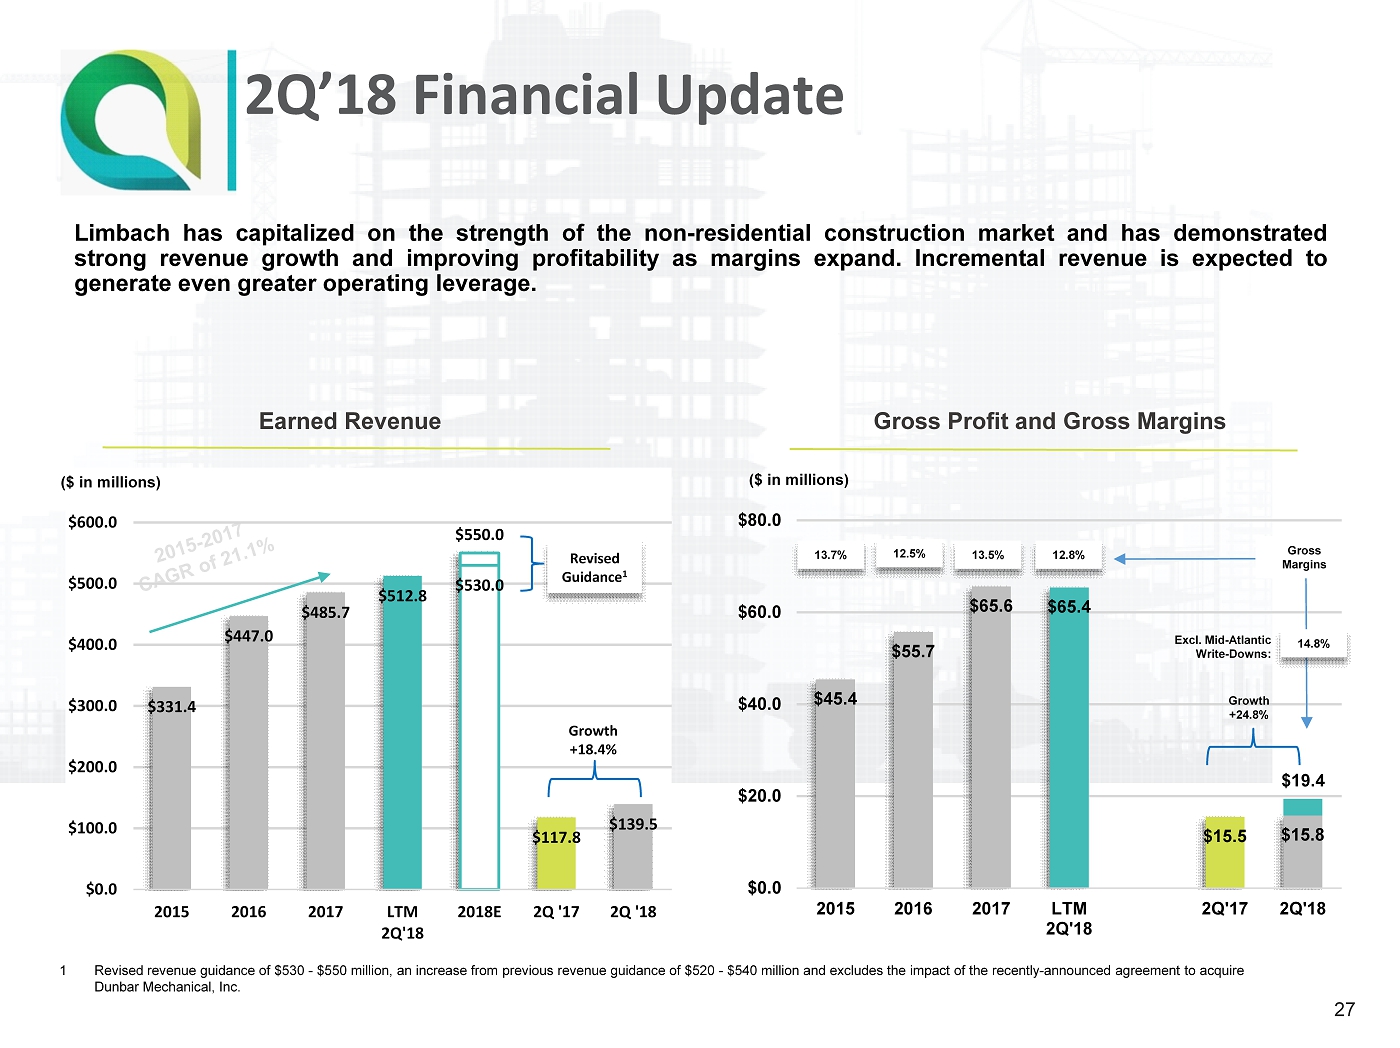
1 Revised revenue guidance of $530 - $550 million, an increase from previous revenue guidance of $520 - $540 million and exclude s the impact of the recently - announced agreement to acquire Dunbar Mechanical, Inc. Earned Revenue Gross Profit and Gross Margins Limbach has capitalized on the strength of the non - residential construction market and has demonstrated strong revenue growth and improving profitability as margins expand . Incremental revenue is expected to generate even greater operating leverage . 2Q’18 Financial Update 27 $331.4 $447.0 $485.7 $512.8 $530.0 $117.8 $139.5 $550.0 $0.0 $100.0 $200.0 $300.0 $400.0 $500.0 $600.0 2015 2016 2017 LTM 2Q'18 2018E 2Q '17 2Q '18 Growth +18.4% Revised Guidance 1 $45.4 $55.7 $65.6 $65.4 $15.5 $15.8 $0.0 $20.0 $40.0 $60.0 $80.0 2015 2016 2017 LTM 2Q'18 2Q'17 2Q'18 ($ in millions) $19.4 ($ in millions) 13.5% 12.8% 12.5% 13.7% Excl. Mid - Atlantic Write - Downs: 14.8% Gross Margins Growth +24.8%
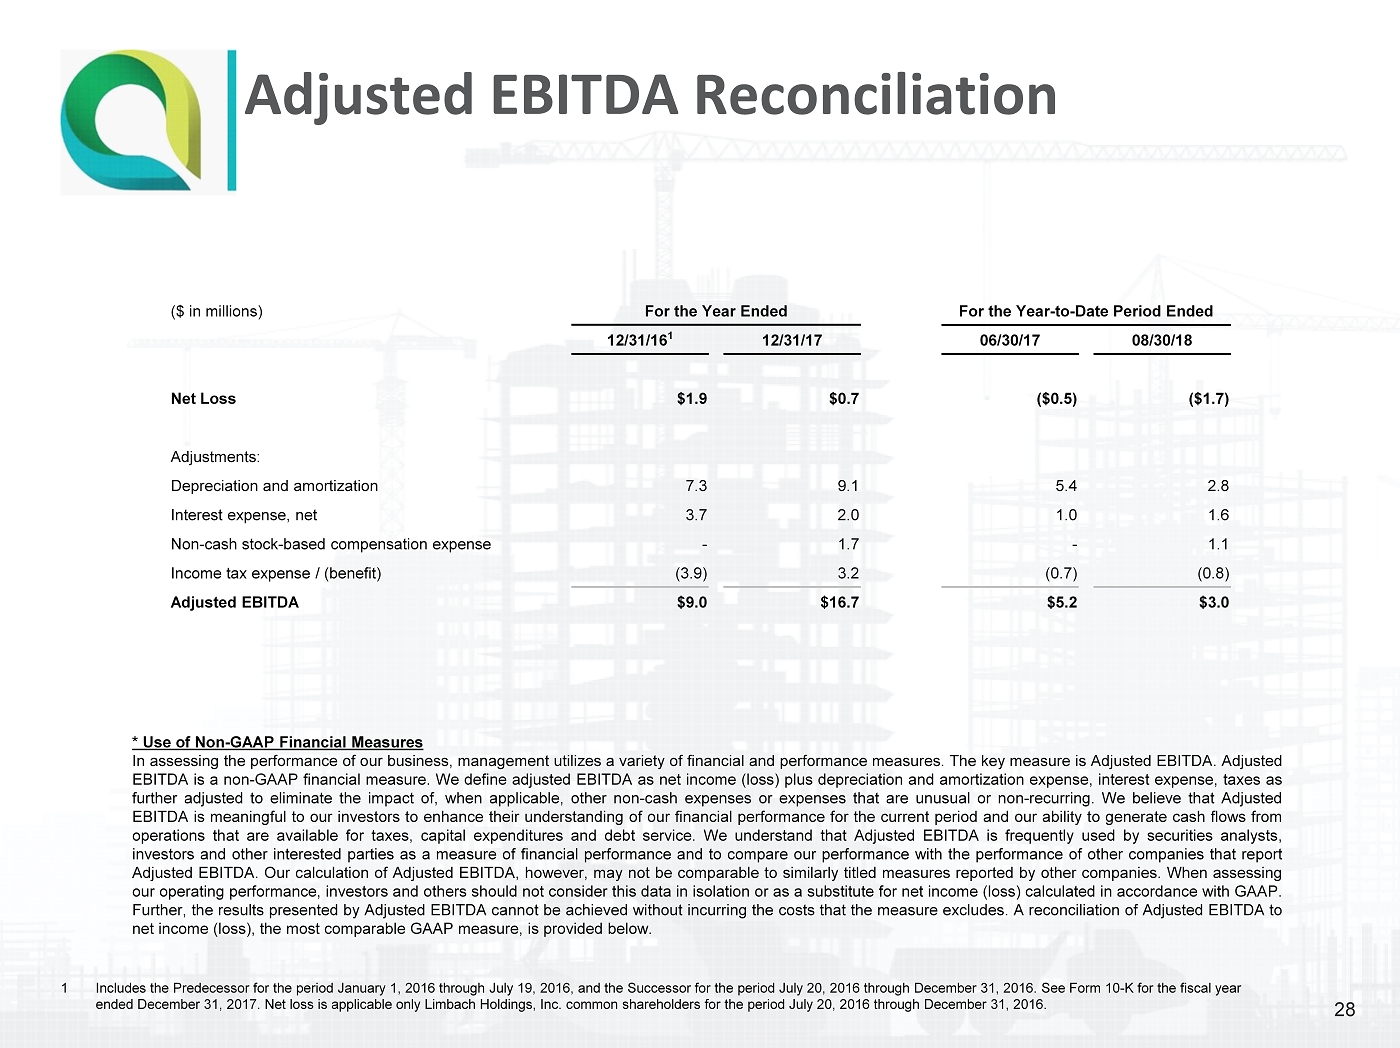
Adjusted EBITDA Reconciliation * Use of Non - GAAP Financial Measures In assessing the performance of our business, management utilizes a variety of financial and performance measures . The key measure is Adjusted EBITDA . Adjusted EBITDA is a non - GAAP financial measure . We define adjusted EBITDA as net income (loss) plus depreciation and amortization expense, interest expense, taxes as further adjusted to eliminate the impact of, when applicable, other non - cash expenses or expenses that are unusual or non - recurring . We believe that Adjusted EBITDA is meaningful to our investors to enhance their understanding of our financial performance for the current period and our ability to generate cash flows from operations that are available for taxes, capital expenditures and debt service . We understand that Adjusted EBITDA is frequently used by securities analysts, investors and other interested parties as a measure of financial performance and to compare our performance with the performance of other companies that report Adjusted EBITDA . Our calculation of Adjusted EBITDA, however, may not be comparable to similarly titled measures reported by other companies . When assessing our operating performance, investors and others should not consider this data in isolation or as a substitute for net income (loss) calculated in accordance with GAAP . Further, the results presented by Adjusted EBITDA cannot be achieved without incurring the costs that the measure excludes . A reconciliation of Adjusted EBITDA to net income (loss), the most comparable GAAP measure, is provided below . 28 1 Includes the Predecessor for the period January 1, 2016 through July 19, 2016, and the Successor for the period July 20, 2016 th rough December 31, 2016. See Form 10 - K for the fiscal year ended December 31, 2017. Net loss is applicable only Limbach Holdings, Inc. common shareholders for the period July 20, 2016 thr ough December 31, 2016. ($ in millions) For the Year Ended For the Year - to - Date Period Ended 12/31/16 1 12/31/17 06/30/17 08/30/18 Net Loss $1.9 $0.7 ($0.5) ($1.7) Adjustments: Depreciation and amortization 7.3 9.1 5.4 2.8 Interest expense, net 3.7 2.0 1.0 1.6 Non - cash stock - based compensation expense - 1.7 - 1.1 Income tax expense / (benefit) (3.9) 3.2 (0.7) (0.8) Adjusted EBITDA $9.0 $16.7 $5.2 $3.0
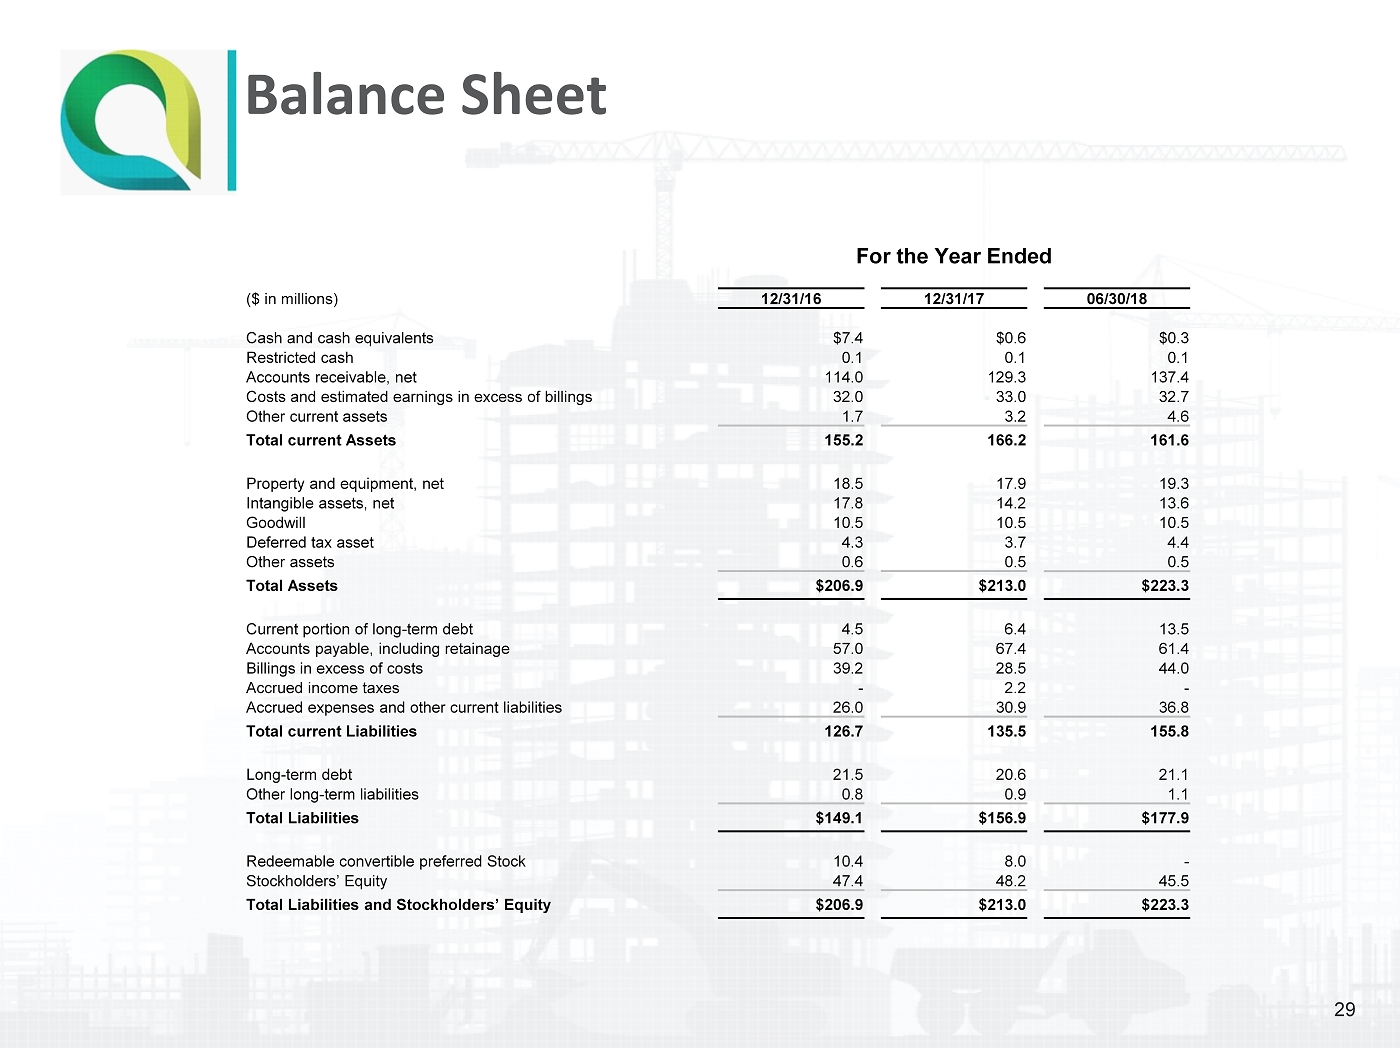
Balance Sheet 29 For the Year Ended ($ in millions) 12/31/16 12/31/17 06/30/18 Cash and cash equivalents $7.4 $0.6 $0.3 Restricted cash 0.1 0.1 0.1 Accounts receivable, net 114.0 129.3 137.4 Costs and estimated earnings in excess of billings 32.0 33.0 32.7 Other current assets 1.7 3.2 4.6 Total current Assets 155.2 166.2 161.6 Property and equipment, net 18.5 17.9 19.3 Intangible assets, net 17.8 14.2 13.6 Goodwill 10.5 10.5 10.5 Deferred tax asset 4.3 3.7 4.4 Other assets 0.6 0.5 0.5 Total Assets $206.9 $213.0 $223.3 Current portion of long - term debt 4.5 6.4 13.5 Accounts payable, including retainage 57.0 67.4 61.4 Billings in excess of costs 39.2 28.5 44.0 Accrued income taxes - 2.2 - Accrued expenses and other current liabilities 26.0 30.9 36.8 Total current Liabilities 126.7 135.5 155.8 Long - term debt 21.5 20.6 21.1 Other long - term liabilities 0.8 0.9 1.1 Total Liabilities $149.1 $156.9 $177.9 Redeemable convertible preferred Stock 10.4 8.0 - Stockholders’ Equity 47.4 48.2 45.5 Total Liabilities and Stockholders’ Equity $206.9 $213.0 $223.3

Limbach’s equity capital structure includes approximately 7 . 59 million common shares and several tranches of warrant securities, each with slightly different terms and economics . Addressing the warrant structure through an exchange offer or other capital markets transaction will provide greater transparency and simplification, and is a key priority of management . Equity Capitalization 30 Units Conversion Share Exercise Shares Outstanding Factor Equivalent Price Outstanding Common Stock 1 7,590,778 1.00 7,590,778 N.A. 7,590,778 Public Warrants 2 4,600,000 2.00 2,300,000 $11.50 - Sponsor Warrants 2 198,000 2.00 99,000 $11.50 - $15 Warrants 2 600,000 1.00 600,000 $15.00 - Merger Warrants 2 664,188 1.00 664,188 $12.50 - Additional Merger Warrants 2 996,284 1.00 996,284 $11.50 - Unit Purchase Option 3 Full Share 17,100 1.00 17,100 $10.00 - Unit Purchase Option 3 Fractional Share 17,100 10.00 1,710 $10.00 - Unit Purchase Option 3 Warrant 17,100 2.00 8,550 $11.50 - Total 14,700,550 12,277,610 7,590,778 Notes: 1 Per cover of Form 10 - Q for the fiscal quarter ended June 30, 2018 [as of filing date of August 13] 2 Per Note 11 of the 2017 10 - K 3 Per Note 11 of the 2017 10 - K and p. 101 of the Form 424(b)(4) dated July 15, 2014.