Exhibit 99.1
Investor Presentation March 2019

Forward Looking Statements This presentation contains forward - looking statements within the meaning of the Private Securities Litigation Reform Act of 1995 . These forward - looking statements relate to expectations or forecasts for future events, including, without limitation, our earnings, Adjusted EBITDA, revenues, expenses, capital expenditures or other future financial or business performance or strategies, results of operations or financial condition . These statements may be preceded by, followed by or include the words “may,” “might,” “will,” “will likely result,” “should,” “estimate,” “plan,” “project,” “forecast,” “intend,” “expect,” “anticipate,” “believe,” “seek,” “continue,” “target” or similar expressions . These forward - looking statements are based on information available to us as of the date they were made, and involve a number of risks and uncertainties which may cause them to turn out to be wrong . Accordingly, forward - looking statements should not be relied upon as representing our views as of any subsequent date, and we do not undertake any obligation to update forward - looking statements to reflect events or circumstances after the date they were made, whether as a result of new information, future events or otherwise, except as may be required under applicable securities laws . As a result of a number of known and unknown risks and uncertainties, our actual results or performance may be materially different from those expressed or implied by these forward - looking statements . Please refer to our Form 10 - K filed on April 2 , 2018 , which is available on the SEC’s website ( www . sec . gov ), for a full discussion of the risks and other factors that may impact any forward - looking statements in this presentation . 2

Who We Are Founded in 1901 , Limbach is the ninth largest mechanical contractor in the nation 1 . The Company exclusively serves the domestic building market with a culture that values the talents and contributions of its union and open shop craft laborers, talented design professionals and dedicated corporate employees . The Company is led by an experienced management team that is highly regarded and well known throughout the industry and the engineering and construction community . With a comprehensive service portfolio supported by a scalable corporate infrastructure, Limbach is poised to capitalize on the continuing momentum of the non - residential construction market as the cycle continues to strengthen . 1 ENR Top 600 Specialty Contractors , October 22, 2018 as measured by revenue. 3
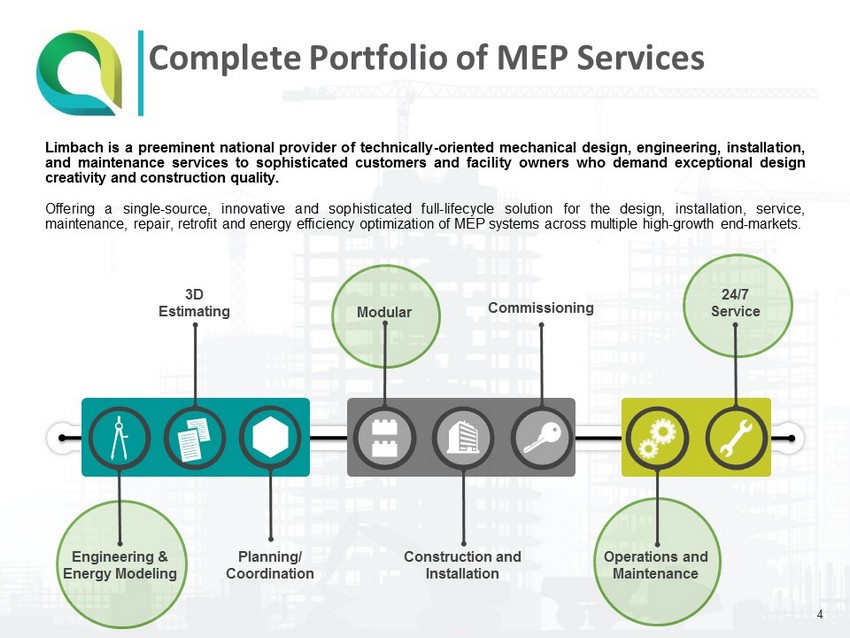
Complete Portfolio of MEP Services Limbach is a preeminent national provider of technically - oriented mechanical design, engineering, installation, and maintenance services to sophisticated customers and facility owners who demand exceptional design creativity and construction quality . Offering a single - source, innovative and sophisticated full - lifecycle solution for the design, installation, service, maintenance, repair, retrofit and energy efficiency optimization of MEP systems across multiple high - growth end - markets . Modular 24/7 Service Construction and Installation Operations and Maintenance Commissioning Engineering & Energy Modeling 3D Estimating Planning/ Coordination 4
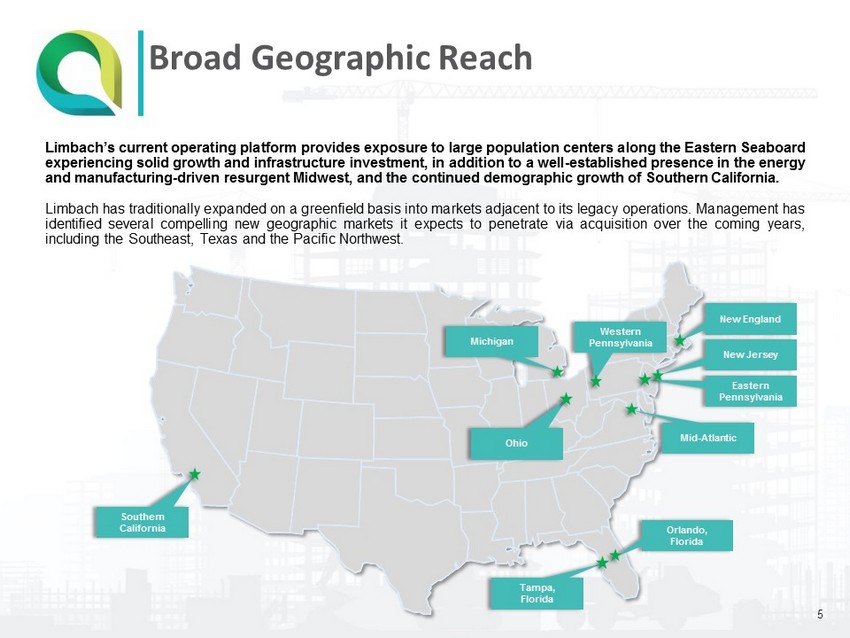
Broad Geographic Reach Limbach’s current operating platform provides exposure to large population centers along the Eastern Seaboard experiencing solid growth and infrastructure investment, in addition to a well - established presence in the energy and manufacturing - driven resurgent Midwest, and the continued demographic growth of Southern California . Limbach has traditionally expanded on a greenfield basis into markets adjacent to its legacy operations . Management has identified several compelling new geographic markets it expects to penetrate via acquisition over the coming years, including the Southeast, Texas and the Pacific Northwest . Southern California Michigan Tampa, Florida Orlando, Florida Ohio Mid - Atlantic Eastern Pennsylvania Western Pennsylvania New England New Jersey 5
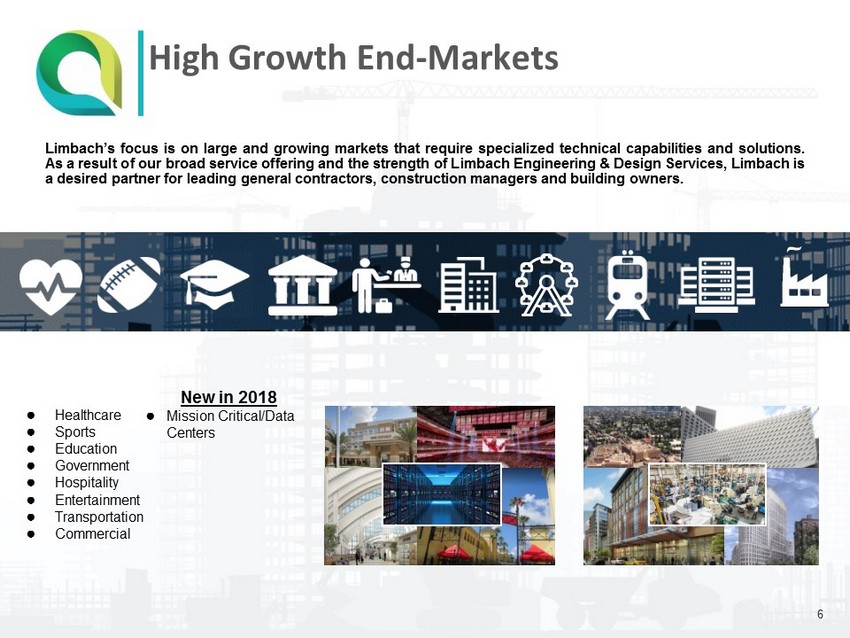
High Growth End - Markets ● Healthcare ● Sports ● Education ● Government ● Hospitality ● Entertainment ● Transportation ● Commercial New in 2018 ● Mission Critical/Data Centers Limbach’s focus is on large and growing markets that require specialized technical capabilities and solutions . As a result of our broad service offering and the strength of Limbach Engineering & Design Services, Limbach is a desired partner for leading general contractors, construction managers and building owners . 6

Source: FMI U.S. Construction Outlook Fourth Quarter 2018 Report . Construction Put - in - Place: Core Markets Healthcare Manufacturing Transportation Education $30,000 $40,000 $50,000 $60,000 2016 2017 2018 2019 2020 2021 2022 ($ in millions) $80,000 $90,000 $100,000 $110,000 $120,000 $130,000 2016 2017 2018 2019 2020 2021 2022 ($ in millions) $60,000 $65,000 $70,000 $75,000 $80,000 $85,000 2016 2017 2018 2019 2020 2021 2022 ($ in millions) $30,000 $45,000 $60,000 $75,000 $90,000 2016 2017 2018 2019 2020 2021 2022 ($ in million) Favorable Industry Outlook 7 0.9% CAGR 2.6% CAGR 4.4% CAGR 7.7% CAGR
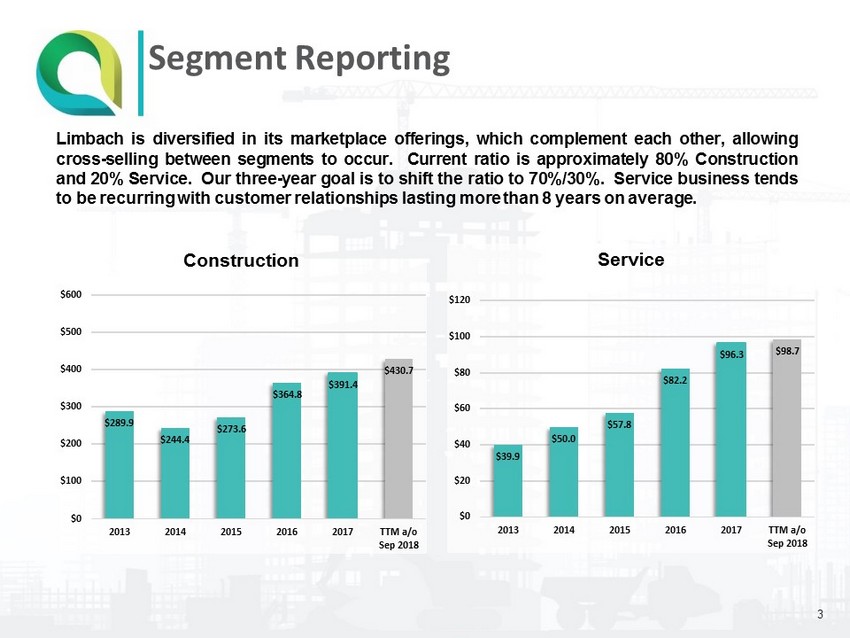
Segment Reporting Limbach is diversified in its marketplace offerings, which complement each other, allowing cross - selling between segments to occur . Current ratio is approximately 80 % Construction and 20 % Service . Our three - year goal is to shift the ratio to 70 % / 30 % . Service business tends to be recurring with customer relationships lasting more than 8 years on average . 3 $289.9 $244.4 $273.6 $364.8 $391.4 $430.7 $0 $100 $200 $300 $400 $500 $600 2013 2014 2015 2016 2017 TTM a/o Sep 2018 Construction $39.9 $50.0 $57.8 $82.2 $96.3 $98.7 $0 $20 $40 $60 $80 $100 $120 2013 2014 2015 2016 2017 TTM a/o Sep 2018 Service
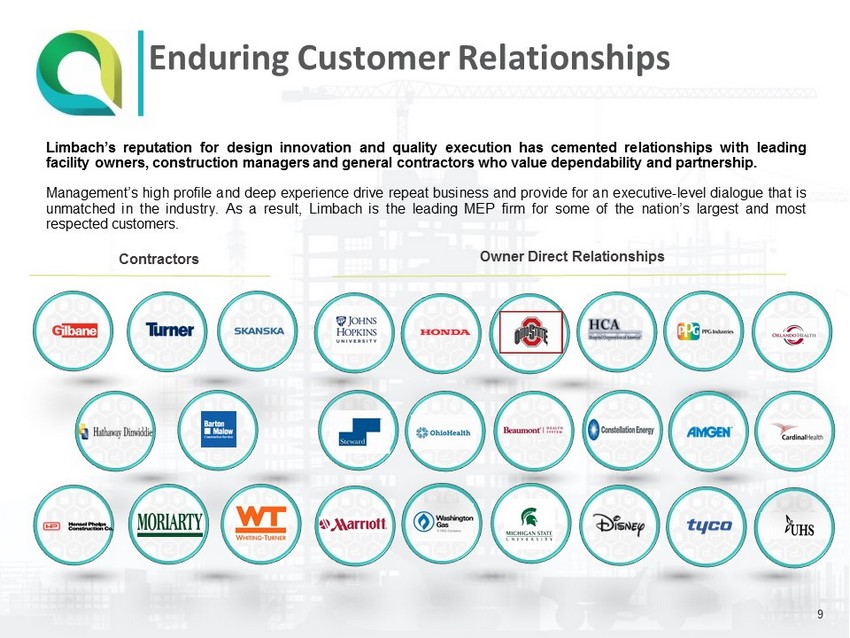
Enduring Customer Relationships Owner Direct Relationships Contractors Limbach’s reputation for design innovation and quality execution has cemented relationships with leading facility owners, construction managers and general contractors who value dependability and partnership . Management’s high profile and deep experience drive repeat business and provide for an executive - level dialogue that is unmatched in the industry . As a result, Limbach is the leading MEP firm for some of the nation’s largest and most respected customers . 9
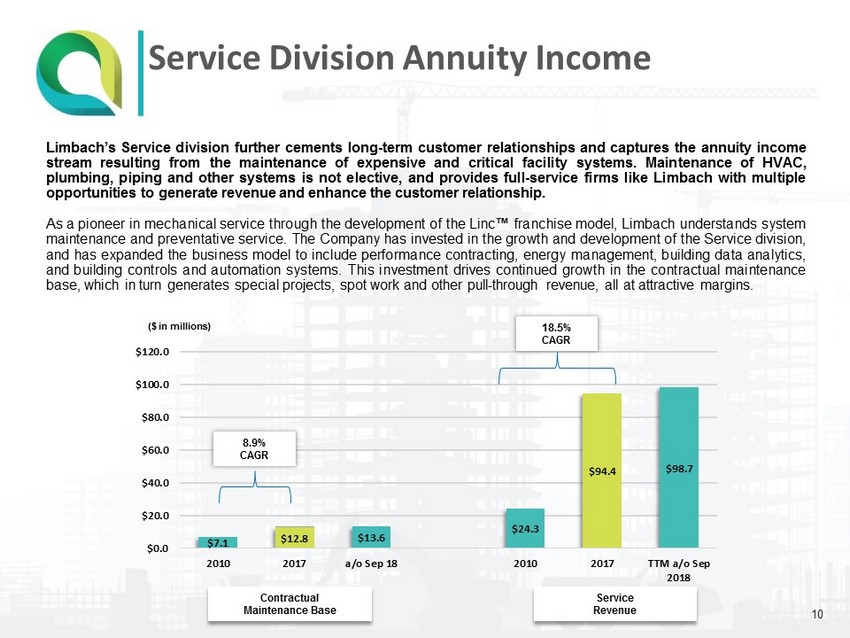
Service Division Annuity Income Limbach’s Service division further cements long - term customer relationships and captures the annuity income stream resulting from the maintenance of expensive and critical facility systems . Maintenance of HVAC, plumbing, piping and other systems is not elective, and provides full - service firms like Limbach with multiple opportunities to generate revenue and enhance the customer relationship . As a pioneer in mechanical service through the development of the Linc ™ franchise model, Limbach understands system maintenance and preventative service . The Company has invested in the growth and development of the Service division, and has expanded the business model to include performance contracting, energy management, building data analytics, and building controls and automation systems . This investment drives continued growth in the contractual maintenance base, which in turn generates special projects, spot work and other pull - through revenue, all at attractive margins . $7.1 $12.8 $13.6 $24.3 $94.4 $98.7 $0.0 $20.0 $40.0 $60.0 $80.0 $100.0 $120.0 2010 2017 a/o Sep 18 2010 2017 TTM a/o Sep 2018 8.9% CAGR Contractual Maintenance Base Service Revenue 18.5% CAGR ($ in millions) 10
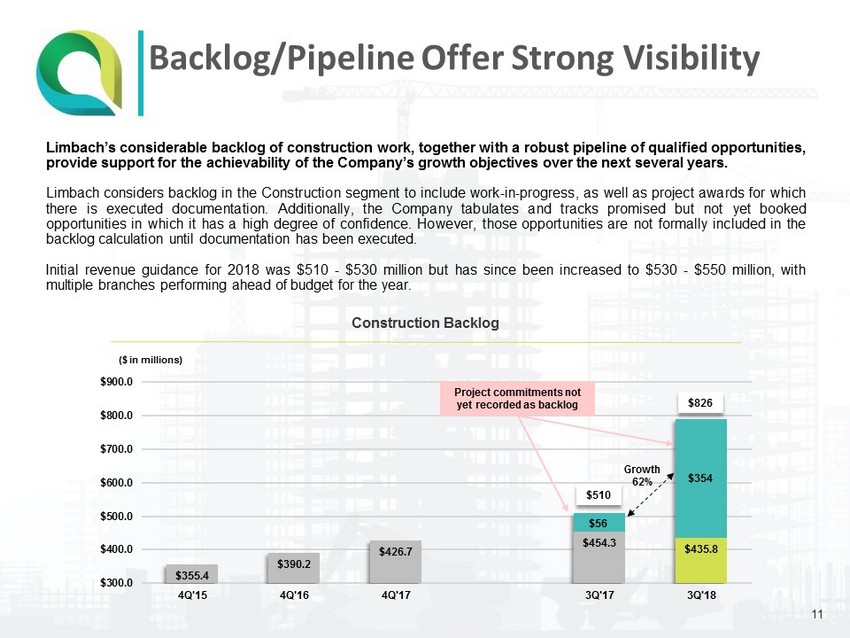
Limbach’s considerable backlog of construction work, together with a robust pipeline of qualified opportunities, provide support for the achievability of the Company’s growth objectives over the next several years . Limbach considers backlog in the Construction segment to include work - in - progress, as well as project awards for which there is executed documentation . Additionally, the Company tabulates and tracks promised but not yet booked opportunities in which it has a high degree of confidence . However, those opportunities are not formally included in the backlog calculation until documentation has been executed . Initial revenue guidance for 2018 was $ 510 - $ 530 million but has since been increased to $ 530 - $ 550 million, with multiple branches performing ahead of budget for the year . Backlog/Pipeline Offer Strong Visibility Construction Backlog 11 $355.4 $390.2 $426.7 $454.3 $435.8 $300.0 $400.0 $500.0 $600.0 $700.0 $800.0 $900.0 4Q'15 4Q'16 4Q'17 3Q'17 3Q'18 ($ in millions) Project commitments not yet recorded as backlog $826 Growth 62% $510 $354 $56
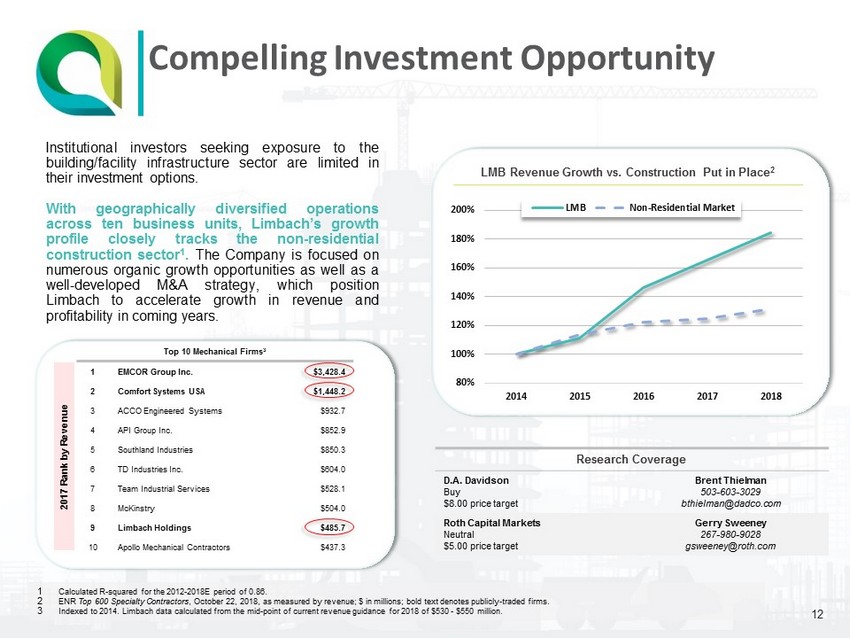
Compelling Investment Opportunity Institutional investors seeking exposure to the building/facility infrastructure sector are limited in their investment options . With geographically diversified operations across ten business units, Limbach’s growth profile closely tracks the non - residential construction sector 1 . The Company is focused on numerous organic growth opportunities as well as a well - developed M&A strategy, which position Limbach to accelerate growth in revenue and profitability in coming years . 2017 Rank by Revenue Top 10 Mechanical Firms 3 1 EMCOR Group Inc. $3,428.4 2 Comfort Systems USA $1,448.2 3 ACCO Engineered Systems $932.7 4 API Group Inc. $852.9 5 Southland Industries $850.3 6 TD Industries Inc. $604.0 7 Team Industrial Services $528.1 8 McKinstry $504.0 9 Limbach Holdings $485.7 10 Apollo Mechanical Contractors $437.3 1 Calculated R - squared for the 2012 - 2018E period of 0.86. 2 ENR Top 600 Specialty Contractors , October 22, 2018, as measured by revenue; $ in millions; bold text denotes publicly - traded firms. 3 Indexed to 2014. Limbach data calculated from the mid - point of current revenue guidance for 2018 of $530 - $550 million. 12 Research Coverage D.A. Davidson Buy $8.00 price target Brent Thielman 503 - 603 - 3029 bthielman@dadco.com Roth Capital Markets Neutral $5.00 price target Gerry Sweeney 267 - 980 - 9028 gsweeney@roth.com 80% 100% 120% 140% 160% 180% 200% 2014 2015 2016 2017 2018 LMB Non-Residential Market LMB Revenue Growth vs. Construction Put in Place 2

Mid - Atlantic Turnaround What Happened 1. Oversold Capacity 2. Extremely Tight Labor Market 3. Overtime Expense 4. Compounding Project Delays 5. Rework Status 1. New Leadership Team 2. “Guardrails” on Sales 3. 12 - Month Labor Look - Ahead 4. Reduce branch revenue expectations to proper level 13
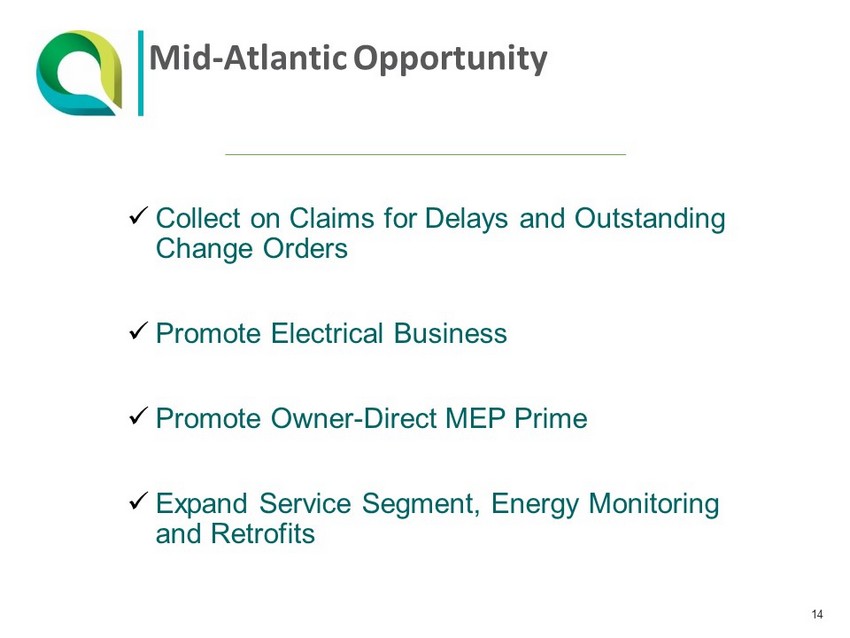
Mid - Atlantic Opportunity x Collect on Claims for Delays and Outstanding Change Orders x Promote Electrical Business x Promote Owner - Direct MEP Prime x Expand Service Segment, Energy Monitoring and Retrofits 14

2018 Issues – 2019 Going Forward 15 Construction Service
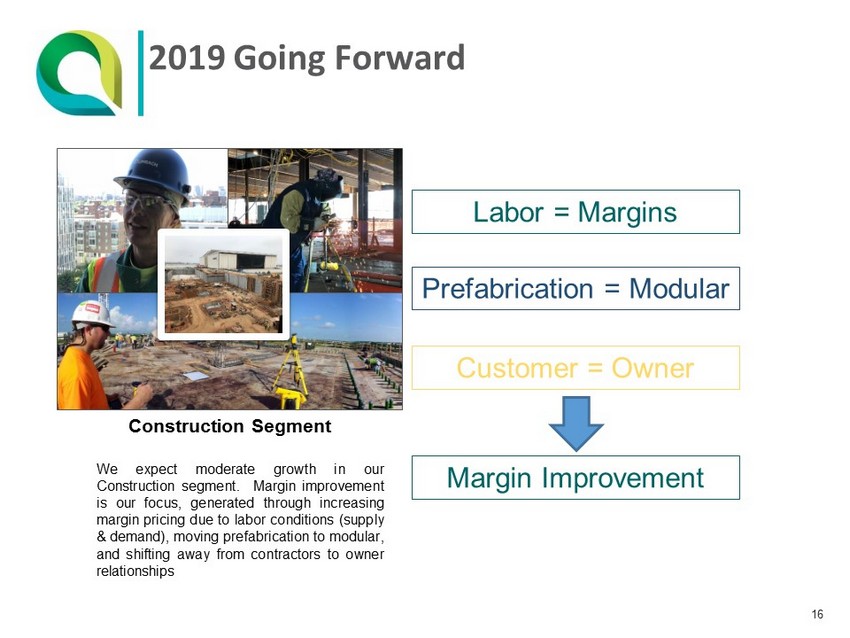
2019 Going Forward 16 Construction Segment Labor = Margins Customer = Owner Prefabrication = Modular Margin Improvement We expect moderate growth in our Construction segment . Margin improvement is our focus, generated through increasing margin pricing due to labor conditions (supply & demand), moving prefabrication to modular, and shifting away from contractors to owner relationships
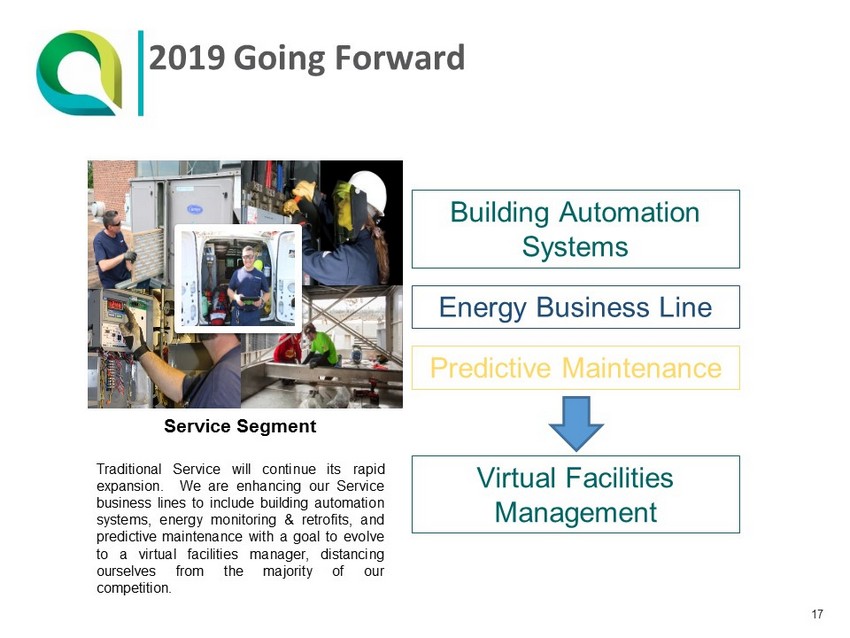
2019 Going Forward 17 Service Segment Building Automation Systems Predictive Maintenance Energy Business Line Virtual Facilities Management Traditional Service will continue its rapid expansion . We are enhancing our Service business lines to include building automation systems, energy monitoring & retrofits, and predictive maintenance with a goal to evolve to a virtual facilities manager, distancing ourselves from the majority of our competition .

Well Diversified Business Model Limbach’s multifaceted diversification provides insulation against regional economic cycles, a changing regulatory and political environment favoring some industries over others, and the fortunes of any single customer or facility owner . Within each vector, Limbach has a well - established presence and excellent brand value . Each vector also provides considerable opportunities for continued expansion, leveraging the Company’s platform to gain market share and drive growth in revenue and profitability . Geography End - Markets Service Offering Customer Base Design and Engineering Service and Maintenance Construction and Installation 18

Accelerated Growth through Acquisition Acquisitions represent a key component of Limbach’s growth strategy, offering trade, geographic and end - market diversification, as well as the operating efficiencies resulting from the leverage of Limbach’s corporate platform . Limbach’s unique position in the marketplace and the continuing liquidity and generational transition challenges faced by private business owners support a deep universe of potential targets . We adhere to strict acquisition criteria including cultural compatibility , a continuing commitment from management, and an accretive valuation . Multiple Acquisition Paths Southeast Texas Pacific Northwest Mechanical Service | Existing Markets Geographic Expansion | New Markets Multi - Trade Expansion Industrial Mission Critical Mechanical Construction | New Markets Electrical Construction | Existing Markets 19
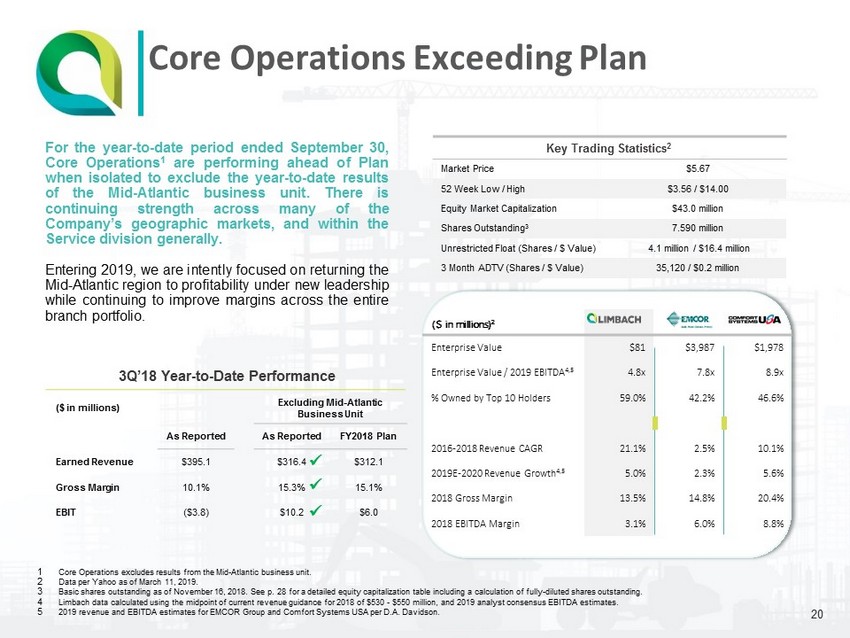
Core Operations Exceeding Plan ($ in millions) 2 Enterprise Value $81 $3,987 $1,978 Enterprise Value / 2019 EBITDA 4,5 4.8x 7.8x 8.9x % Owned by Top 10 Holders 59.0% 42.2% 46.6% 2016 - 2018 Revenue CAGR 21.1% 2.5% 10.1% 2019E - 2020 Revenue Growth 4,5 5.0% 2.3% 5.6% 2018 Gross Margin 13.5% 14.8% 20.4% 2018 EBITDA Margin 3.1% 6.0% 8.8% 1 Core Operations excludes results from the Mid - Atlantic business unit. 2 Data per Yahoo as of March 11, 2019. 3 Basic shares outstanding as of November 16, 2018. See p. 28 for a detailed equity capitalization table including a calculatio n o f fully - diluted shares outstanding. 4 Limbach data calculated using the midpoint of current revenue guidance for 2018 of $530 - $550 million, and 2019 analyst consensus EBITDA estimates. 5 2019 revenue and EBITDA estimates for EMCOR Group and Comfort Systems USA per D.A. Davidson. 20 ($ in millions) Excluding Mid - Atlantic Business Unit As Reported As Reported FY2018 Plan Earned Revenue $395.1 $316.4 $312.1 Gross Margin 10.1% 15.3% 15.1% EBIT ($3.8) $10.2 $6.0 x x x For the year - to - date period ended September 30 , Core Operations 1 are performing ahead of Plan when isolated to exclude the year - to - date results of the Mid - Atlantic business unit . There is continuing strength across many of the Company’s geographic markets, and within the Service division generally . Entering 2019 , we are intently focused on returning the Mid - Atlantic region to profitability under new leadership while continuing to improve margins across the entire branch portfolio . Key Trading Statistics 2 Market Price $5.67 52 Week Low / High $3.56 / $14.00 Equity Market Capitalization $43.0 million Shares Outstanding 3 7.590 million Unrestricted Float (Shares / $ Value) 4.1 million / $16.4 million 3 Month ADTV (Shares / $ Value) 35,120 / $0.2 million 3Q’18 Year - to - Date Performance

$331.4 $447.0 $485.7 $526.5 $530.0 $121.3 $135.1 $550.0 $0 $100 $200 $300 $400 $500 $600 2015 2016 2017 LTM 3Q '18 2018 3Q '17 3Q '18 Comparable Quarter Growth: 11.3% Maintaining Revenue Guidance Earned Revenue Gross Profit and Gross Margins Limbach has capitalized on the strength of the non - residential construction market and has demonstrated strong revenue growth with expanding margins in its Core Operations 1 . Incremental revenue is expected to generate even greater operating leverage . 3Q’18 Financial Update 21 ($ in millions) $45.4 $55.7 $65.6 $60.7 $44.7 $39.8 $8.7 $0 $10 $20 $30 $40 $50 $60 $70 $80 2015 2016 2017 LTM 3Q '18 YTD '17 YTD '18 ($ in millions) 13.7% 12.5% 13.5% 11.5% Pro Forma Growth: 8.5% 15.3% Excl. Mid - Atlantic Write - Downs: Gross Margins 1 Core Operations excludes results from the Mid - Atlantic business unit.

Adjusted EBITDA Reconciliation * Use of Non - GAAP Financial Measures In assessing the performance of our business, management utilizes a variety of financial and performance measures . The key measure is Adjusted EBITDA . Adjusted EBITDA is a non - GAAP financial measure . We define Adjusted EBITDA as net income (loss) plus depreciation and amortization expense, interest expense, and taxes, as further adjusted to eliminate the impact of, when applicable, other non - cash items or expenses that are unusual or non - recurring that we believe do not reflect our core operating results . We believe that Adjusted EBITDA is meaningful to our investors to enhance their understanding of our financial performance for the current period and our ability to generate cash flows from operations that are available for taxes, capital expenditures and debt service . We understand that Adjusted EBITDA is frequently used by securities analysts, investors and other interested parties as a measure of financial performance and to compare our performance with the performance of other companies that report Adjusted EBITDA . Our calculation of Adjusted EBITDA, however, may not be comparable to similarly titled measures reported by other companies . When assessing our operating performance, investors and others should not consider this data in isolation or as a substitute for net income (loss) calculated in accordance with GAAP . Further, the results presented by Adjusted EBITDA cannot be achieved without incurring the costs that the measure excludes . A reconciliation of Adjusted EBITDA to net income (loss), the most comparable GAAP measure, is provided below . 22 1 Includes the Predecessor for the period January 1, 2016 through July 19, 2016, and the Successor for the period July 20, 2016 th rough December 31, 2016. See Form 10 - K for the fiscal year ended December 31, 2017. Net loss is applicable only to Limbach Holdings, Inc. common shareholders for the period July 20, 20 16 through December 31, 2016. ($ in millions) For the Year Ended For the Year - to - Date Period Ended 12/31/16 1 12/31/17 09/30/17 09/30/18 Net Income (Loss) $1.9 $0.7 ($0.4) ($5.2) Adjustments: Depreciation and amortization 7.3 9.1 7.4 4.2 Interest expense, net 3.7 2.0 1.6 2.4 Non - cash stock - based compensation expense - 1.7 0.9 1.7 Income tax expense / (benefit) (3.9) 3.2 (0.4) (0.9) Adjusted EBITDA $9.0 $16.7 $9.1 $2.1
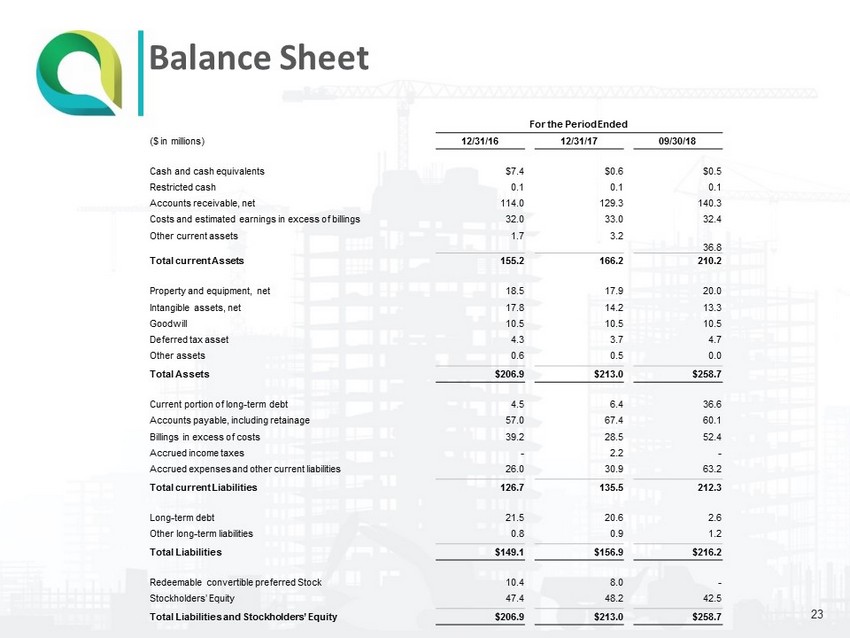
Balance Sheet 23 For the Period Ended ($ in millions) 12/31/16 12/31/17 09/30/18 Cash and cash equivalents $7.4 $0.6 $0.5 Restricted cash 0.1 0.1 0.1 Accounts receivable, net 114.0 129.3 140.3 Costs and estimated earnings in excess of billings 32.0 33.0 32.4 Other current assets 1.7 3.2 36.8 Total current Assets 155.2 166.2 210.2 Property and equipment, net 18.5 17.9 20.0 Intangible assets, net 17.8 14.2 13.3 Goodwill 10.5 10.5 10.5 Deferred tax asset 4.3 3.7 4.7 Other assets 0.6 0.5 0.0 Total Assets $206.9 $213.0 $258.7 Current portion of long - term debt 4.5 6.4 36.6 Accounts payable, including retainage 57.0 67.4 60.1 Billings in excess of costs 39.2 28.5 52.4 Accrued income taxes - 2.2 - Accrued expenses and other current liabilities 26.0 30.9 63.2 Total current Liabilities 126.7 135.5 212.3 Long - term debt 21.5 20.6 2.6 Other long - term liabilities 0.8 0.9 1.2 Total Liabilities $149.1 $156.9 $216.2 Redeemable convertible preferred Stock 10.4 8.0 - Stockholders’ Equity 47.4 48.2 42.5 Total Liabilities and Stockholders’ Equity $206.9 $213.0 $258.7

Limbach’s equity capital structure includes approximately 7 . 59 million common shares and several tranches of warrant securities, each with slightly different terms and economics . Addressing the warrant structure through an exchange offer or other capital markets transaction will provide greater transparency and simplification, and is a key priority of management . Equity Capitalization 28 Units Conversion Share Exercise Shares Outstanding Factor Equivalent Price Outstanding Common Stock 1 7,590,778 1.00 7,590,778 N.A. 7,590,778 Public Warrants 2 4,600,000 2.00 2,300,000 $11.50 - Sponsor Warrants 2 198,000 2.00 99,000 $11.50 - $15 Warrants 2 600,000 1.00 600,000 $15.00 - Merger Warrants 2 664,188 1.00 664,188 $12.50 - Additional Merger Warrants 2 996,284 1.00 996,284 $11.50 - Unit Purchase Option 3 Full Share 17,100 1.00 17,100 $10.00 - Unit Purchase Option 3 Fractional Share 17,100 10.00 1,710 $10.00 - Unit Purchase Option 3 Warrant 17,100 2.00 8,550 $11.50 - Total 14,700,550 12,277,610 7,590,778 1 Per cover of Form 10 - Q for the fiscal quarter ended September 30, 2018 as of filing date of November 16, 2018. 2 Per Note 11 of the 2017 10 - K. 3 Per Note 11 of the 2017 10 - K and p. 101 of the Form 424(b)(4) dated July 15, 2014.

Leadership Team In 2019 Michael McCann was promoted to Co - Chief Operating Officer to support the continued growth of the business Charlie Bacon , Chief Executive Officer John Jordan , EVP, Chief Financial Officer Kris Thorne , Co - Chief Operating Officer Mike McCann , Co - Chief Operating Officer David Leathers , EVP, Maintenance & Service Matt Katz , EVP, Mergers & Acquisitions