Exhibit 99.2
2015 YEAR IN REVIEW
2016 LOOK AHEAD
IMPORTANT PRESENTATION INFORMATION 2
Notice to We use market data and industry forecasts and projections throughout this presentation, including data from publicly available information and industry publications.
These sources generally state that the information they provide has been obtained from sources believed to be reliable, but that the accuracy and completeness of the
Investors information are not guaranteed. The forecasts and projections are based on industry surveys and the preparers’ experience in the industry, and there can be no
assurance that any of the forecasts or projections will be achieved. We believe that the surveys and market research others have performed are reliable, but we have
not independently investigated or veri?ed this information. Forecasts and other forward-looking information obtained from these sources are subject to the same
quali?cations and uncertainties as the other forward-looking statements contained in this presentation.
Forward-Looking Some of the statements made in this presentation constitute forward-looking statements within the meaning of federal securities laws. Forward-looking statements
re?ect our current views with respect to future events and performance. In some cases you can identify forward-looking statements by terminology such as “may,”
Statements “might, “will,” “should,” “could” or the negative thereof. Generally, the words “anticipate,” “believe,” “continues,” “expect,” “intend,” “estimate,” “project,” “plan” and similar
expressions identify forward-looking statements. In particular, statements about our pipeline, industry growth opportunities, disclosure of key performance indicators,
business growth strategy and pro forma financial results in this presentation are forward-looking statements.
We have based these forward-looking statements on our current expectations, assumptions, estimates and projections. While we believe these expectations,
assumptions, estimates and projections are reasonable, such forward-looking statements are only predictions and involve known and unknown risks, uncertainties and
other factors, many of which are outside of our control, which could cause our actual results, performance or achievements to di?er materially from any results,
performance or achievements expressed or implied by such forward-looking statements. For additional discussion of risks, uncertainties and other factors, see the
section titled “Risk Factors” in our Annual Report on Form 10-K and other ?lings with the SEC.
Risks, uncertainties and other factors include, without limitation: (i) our inability to operate our facilities; (ii) our reliance on our sales and marketing program to
continuously attract and enroll clients; (iii) a reduction in reimbursement rates by certain third-party payors for inpatient and outpatient services and point of care and
de?nitive lab testing; (iv) our failure to successfully achieve growth through acquisitions and de novo expansions; (v) uncertainties regarding the timing of the closing of
pending acquisitions; (vi) our failure to achieve anticipated ?nancial results from prior or pending acquisitions; (vii) the possibility that a governmental entity may
prohibit, delay or refuse to grant approval for the consummation of the acquisitions; (viii) a disruption in our ability to perform diagnostic drug testing services; (ix)
maintaining compliance with applicable regulatory authorities, licensure and permits to operate our facilities and lab; (x) a disruption in our business related to the
recent indictment of certain of our subsidiaries and current and former employees; (xi) our inability to agree on conversion and other terms for the balance of
convertible debt; (xii) our inability to meet our covenants in the loan documents; (xiii) our inability to obtain senior lender consent to exceed the current $50 million limit
in unsecured subordinated debt; (xiv) our inability to integrate newly acquired facilities; (xv) a disruption to our business and reputational and potential economic risks
associated with the civil securities claims brought by shareholders; and (xvi) general economic conditions, as well as other risks discussed in the “Risk Factors” section of
the Company’s Annual Report on Form 10-K and other ?lings with the Securities and Exchange Commission.
Given these risks and uncertainties, you are cautioned not to place undue reliance on such forward-looking statements. These risks and uncertainties may cause our
actual future results to be materially di?erent than those expressed in our forward-looking statements. These forward-looking statements are made only as of the date
of this presentation. We do not undertake and speci?cally decline any obligation to update any such statements or to publicly announce the results of any revisions to
any such statements to re?ect future events or developments.
PRESENTERS
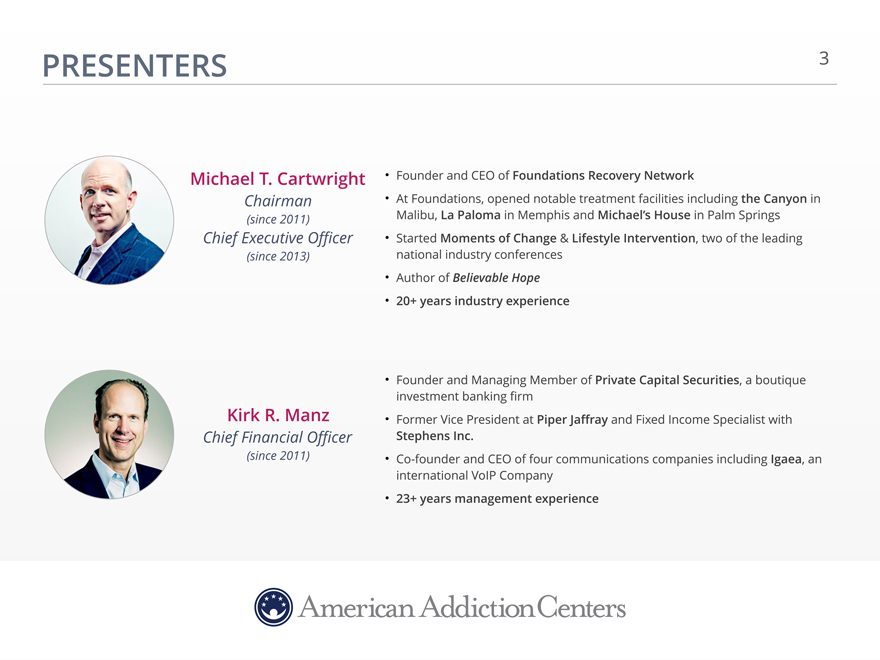
Michael T. Cartwright
Chairman
(since 2011)
Chief Executive Officer
(since 2013)
Founder and CEO of Foundations Recovery Network
At Foundations, opened notable treatment facilities including the Canyon in Malibu, La Paloma in Memphis and Michael’s House in Palm Springs
Started Moments of Change & Lifestyle Intervention, two of the leading national industry conferences Author of Believable Hope
20+ years industry experience
Kirk R. Manz
Chief Financial Officer
(since 2011)
Founder and Managing Member of Private Capital Securities, a boutique investment banking firm Former Vice President at Piper Jaffray and Fixed Income Specialist with
Stephens Inc.
Co-founder and CEO of four communications companies including Igaea, an international VoIP Company
23+ years management experience
3
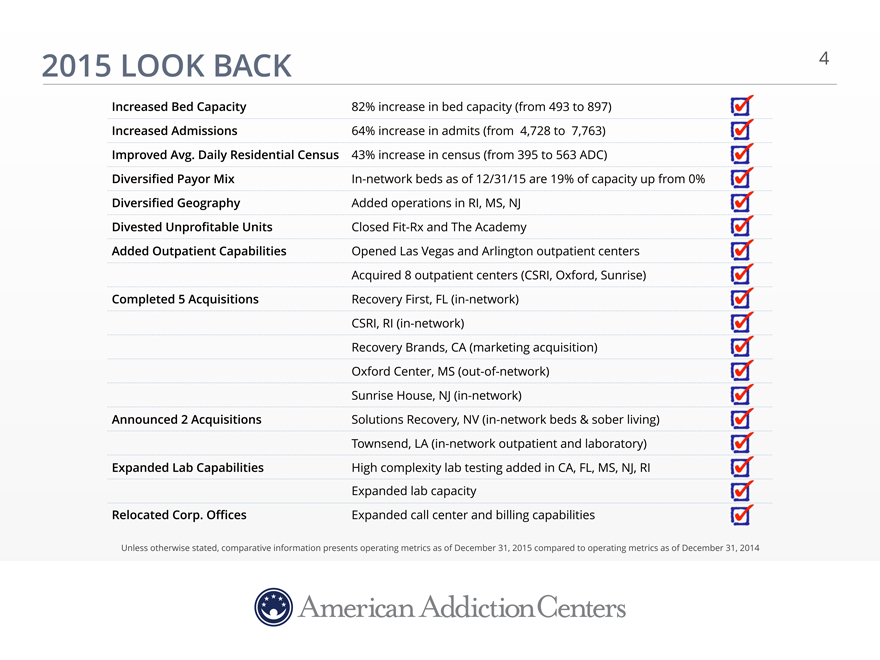
2015 LOOK BACK
Increased Bed Capacity 82% increase in bed capacity (from 493 to 897)
Increased Admissions 64% increase in admits (from 4,728 to 7,763)
Improved Avg. Daily Residential Census 43% increase in census (from 395 to 563 ADC)
Diversi?ed Payor Mix In-network beds as of 12/31/15 are 19% of capacity up from 0%
Diversi?ed Geography Added operations in RI, MS, NJ
Divested Unpro?table Units Closed Fit-Rx and The Academy
Added Outpatient Capabilities Opened Las Vegas and Arlington outpatient centers
Acquired 8 outpatient centers (CSRI, Oxford, Sunrise)
Completed 5 Acquisitions Recovery First, FL (in-network)
CSRI, RI (in-network)
Recovery Brands, CA (marketing acquisition)
Oxford Center, MS (out-of-network)
Sunrise House, NJ (in-network)
Announced 2 Acquisitions Solutions Recovery, NV (in-network beds & sober living)
Townsend, LA (in-network outpatient and laboratory)
Expanded Lab Capabilities High complexity lab testing added in CA, FL, MS, NJ, RI
Expanded lab capacity
Relocated Corp. O?ces Expanded call center and billing capabilities
Unless otherwise stated, comparative information presents operating metrics as of December 31, 2015 compared to operating metrics as of December 31, 2014
4
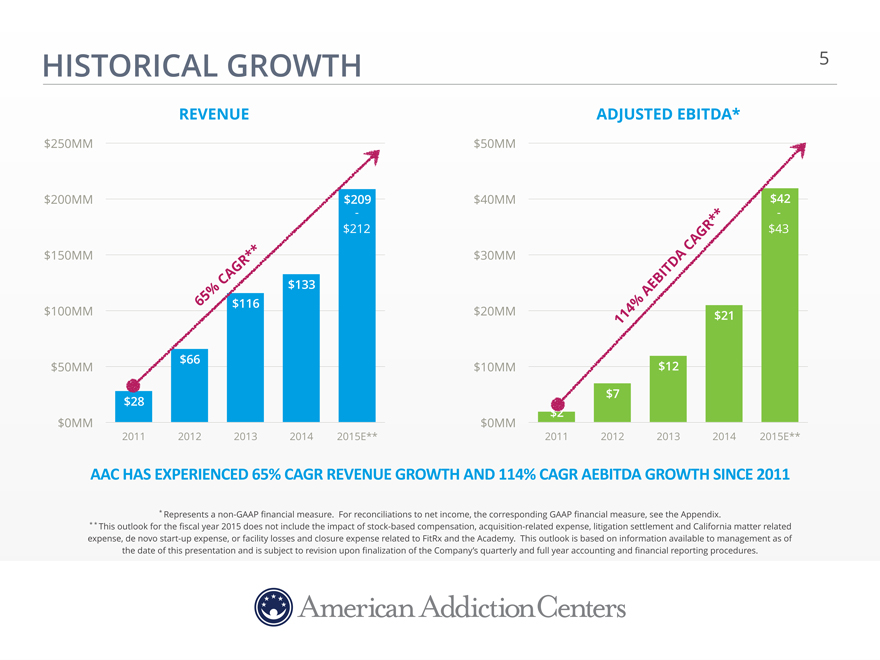
HISTORICAL GROWTH
REVENUE
$250MM
$200MM $209
-
$212
$150MM GR**
CA $133
$100MM 65% $116
$50MM $66
$28
$0MM
2011 2012 2013 2014 2015E**
ADJUSTED EBITDA*
$50MM
$40MM $42
-
GR** $43
$30MM A CA
AEBITD
$20MM 114% $21
$10MM $12
$7
$2
$0MM
2011 2012 2013 2014 2015E**
AAC HAS EXPERIENCED 65% CAGR REVENUE GROWTH AND 114% CAGR AEBITDA GROWTH SINCE 2011
* Represents a non-GAAP financial measure. For reconciliations to net income, the corresponding GAAP financial measure, see the Appendix.
* * This outlook for the fiscal year 2015 does not include the impact of stock-based compensation, acquisition-related expense, litigation settlement and California matter related expense, de novo start-up expense, or facility losses and closure expense related to FitRx and the Academy. This outlook is based on information available to management as of the date of this presentation and is subject to revision upon finalization of the Company’s quarterly and full year accounting and financial reporting procedures.
5
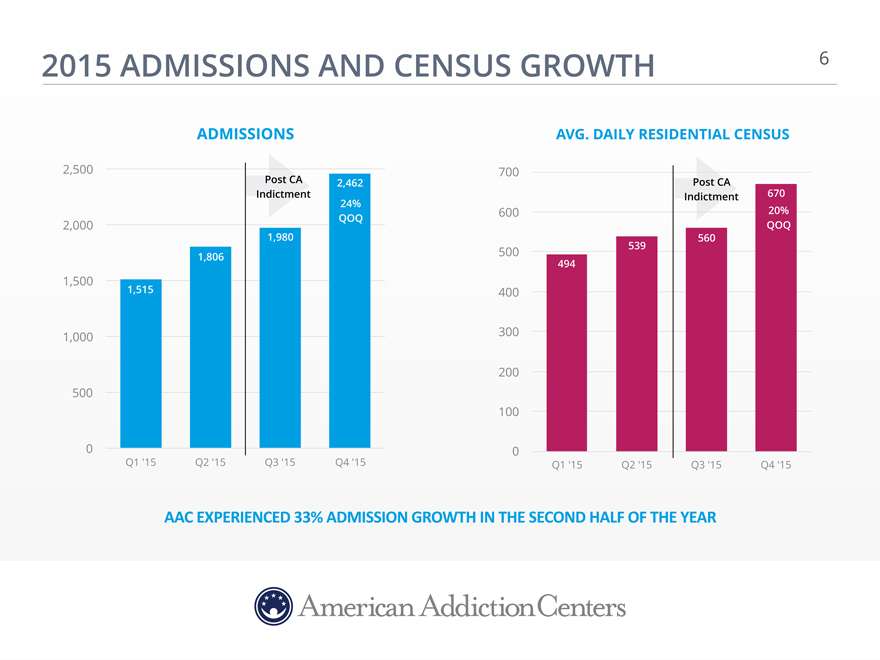
2015 ADMISSIONS AND CENSUS GROWTH
ADMISSIONS
2,500
Post CA 2,462
Indictment
24%
2,000 QOQ
1,980
1,806
1,500 1,515
1,000
500
0
Q1 ‘15 Q2 ‘15 Q3 ‘15 Q4 ‘15
AVG. DAILY RESIDENTIAL CENSUS
700
Post CA
Indictment 670
600 20%
QOQ
560
500 539
494
400
300
200
100
0
Q1 ‘15 Q2 ‘15 Q3 ‘15 Q4 ‘15
AAC EXPERIENCED 33% ADMISSION GROWTH IN THE SECOND HALF OF THE YEAR
6
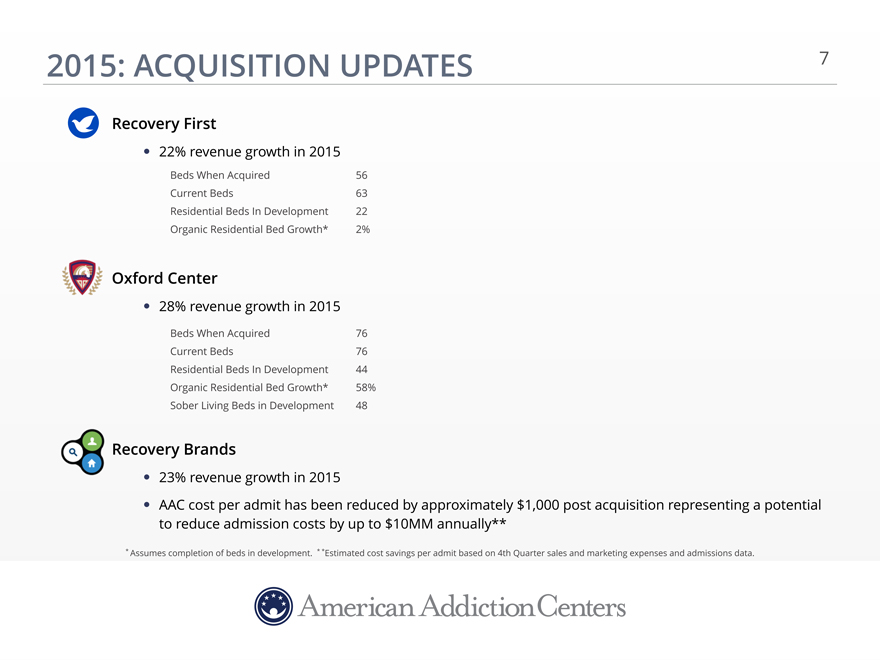
2015: ACQUISITION UPDATES
Recovery First
22% revenue growth in 2015
Beds When Acquired 56 Current Beds 63 Residential Beds In Development 22 Organic Residential Bed Growth* 2%
Oxford Center
28% revenue growth in 2015
Beds When Acquired 76
Current Beds 76
Residential Beds In Development 44
Organic Residential Bed Growth* 58%
Sober Living Beds in Development 48
Recovery Brands
23% revenue growth in 2015
AAC cost per admit has been reduced by approximately $1,000 post acquisition representing a potential
to reduce admission costs by up to $10MM annually**
* Assumes completion of beds in development. * *Estimated cost savings per admit based on 4th Quarter sales and marketing expenses and admissions data.
7
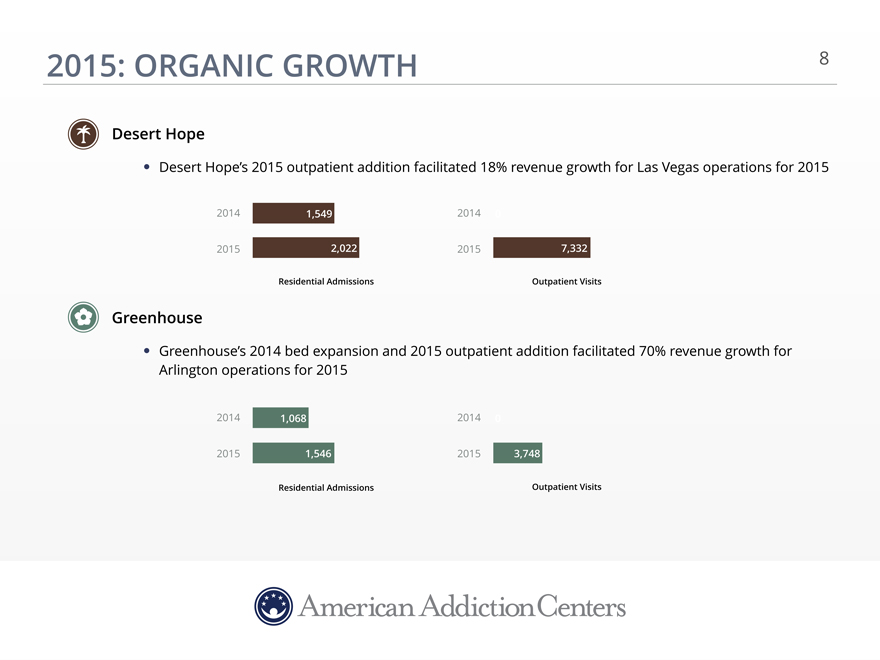
2015: ORGANIC GROWTH
Desert Hope
Desert Hope’s 2015 outpatient addition facilitated 18% revenue growth for Las Vegas operations for 2015
2014 1,549 2014 0
2015 2,022 2015 7,332
Residential Admissions Outpatient Visits
Greenhouse
Greenhouse’s 2014 bed expansion and 2015 outpatient addition facilitated 70% revenue growth for Arlington operations for 2015
2014 1,068 2014 0
2015 1,546 2015 3,748
Residential Admissions Outpatient Visits
8
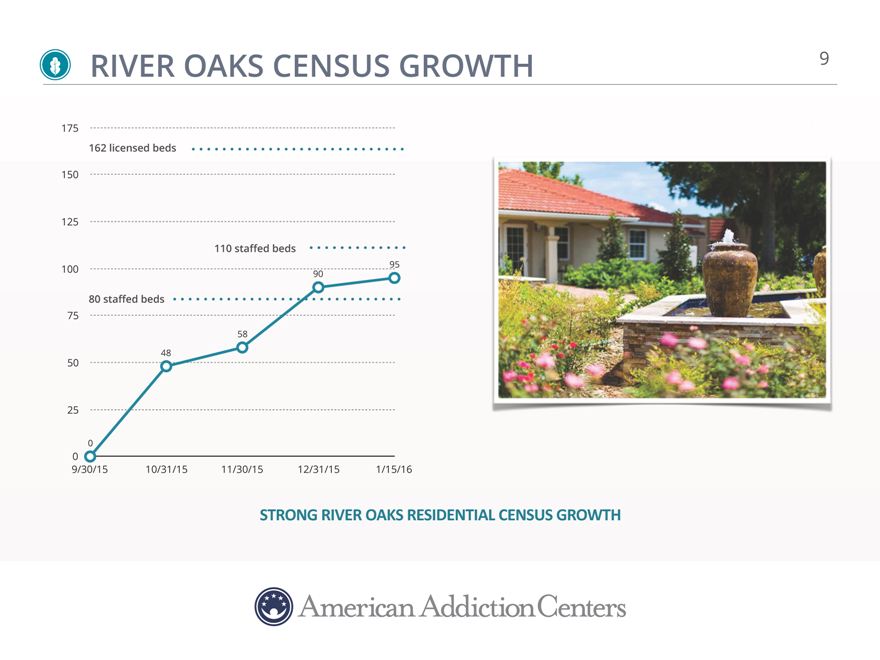
RIVER OAKS CENSUS GROWTH
175
162 licensed beds
150
125
110 staffed beds
100 95
90
80 staffed beds
75
58
48
50
25
0
0
9/30/15 10/31/15 11/30/15 12/31/15 1/15/16
STRONG#RIVER#OAKS#RESIDENTIAL#CENSUS#GROWTH
9
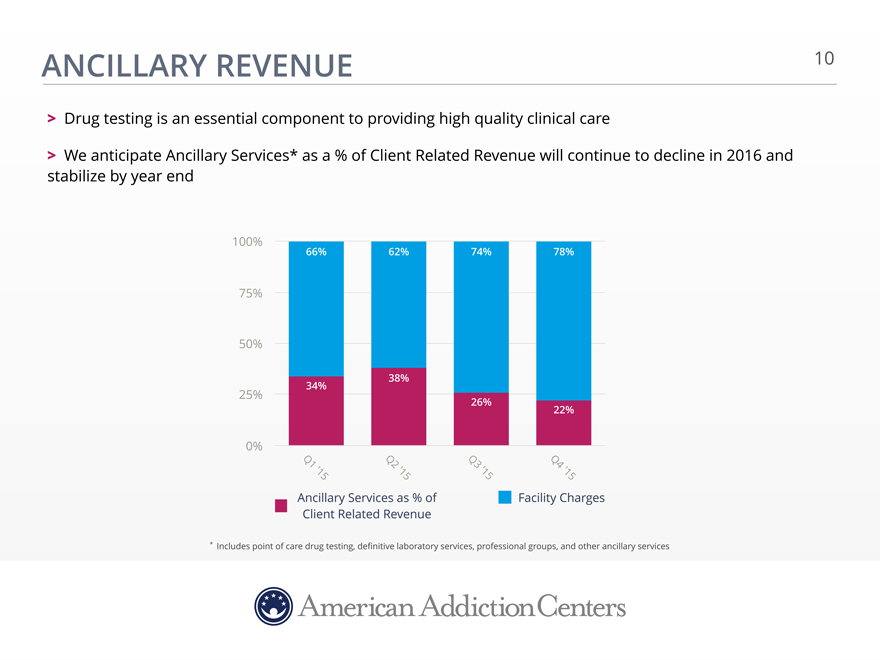
ANCILLARY REVENUE
> Drug testing is an essential component to providing high quality clinical care
> We anticipate Ancillary Services* as a % of Client Related Revenue will continue to decline in 2016 and stabilize by year end
100%
66% 62% 74% 78%
75%
50%
38%
25% 34% 26%
22%
0%
Q1 Q2 Q3 Q4
‘15 ‘15 ’15 ‘15
Ancillary Services as % of Facility Charges
Client Related Revenue
* Includes point of care drug testing, definitive laboratory services, professional groups, and other ancillary services
10
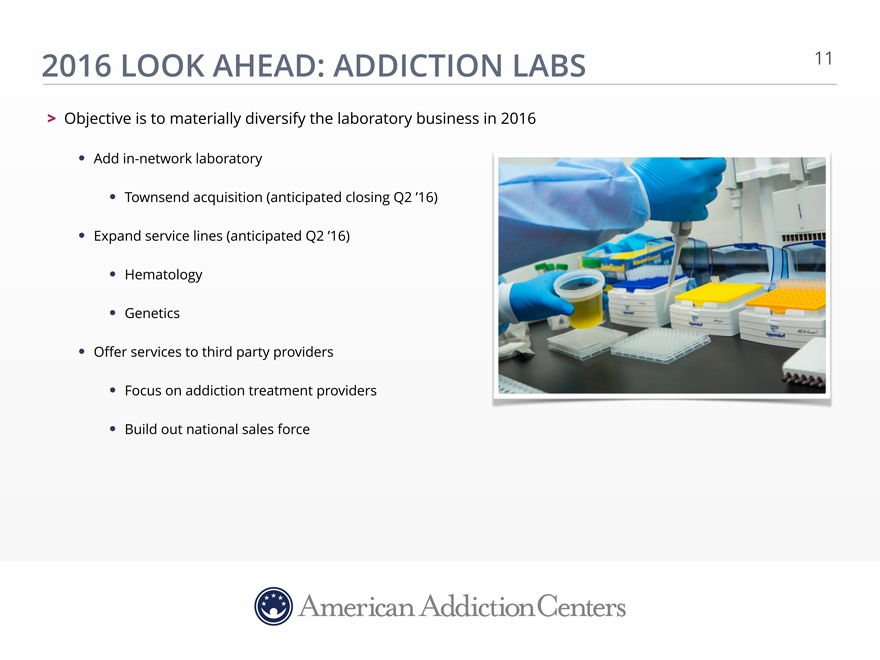
2016 LOOK AHEAD: ADDICTION LABS
Objective is to materially diversify the laboratory business in 2016
Add in-network laboratory
Townsend acquisition (anticipated closing Q2 ’16)
Expand service lines (anticipated Q2 ’16)
Hematology
Genetics
Offer services to third party providers
Focus on addiction treatment providers
Build out national sales force
11
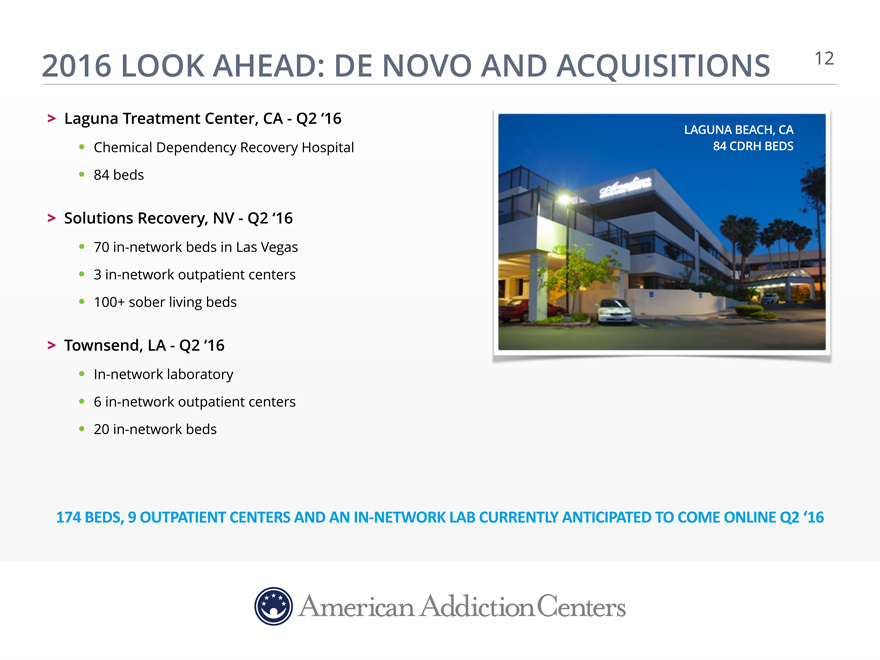
2016 LOOK AHEAD: DE NOVO AND ACQUISITIONS
Laguna Treatment Center, CA—Q2 ‘16
Chemical Dependency Recovery Hospital
84 beds
Solutions Recovery, NV—Q2 ‘16
70 in-network beds in Las Vegas
3 in-network outpatient centers
100+ sober living beds
Townsend, LA—Q2 ‘16
In-network laboratory
6 in-network outpatient centers
20 in-network beds
174 BEDS, 9 OUTPATIENT CENTERS AND AN IN-NETWORK LAB CURRENTLY ANTICIPATED TO COME ONLINE Q2 ‘16
LAGUNA BEACH, CA
84 CDRH BEDS
12
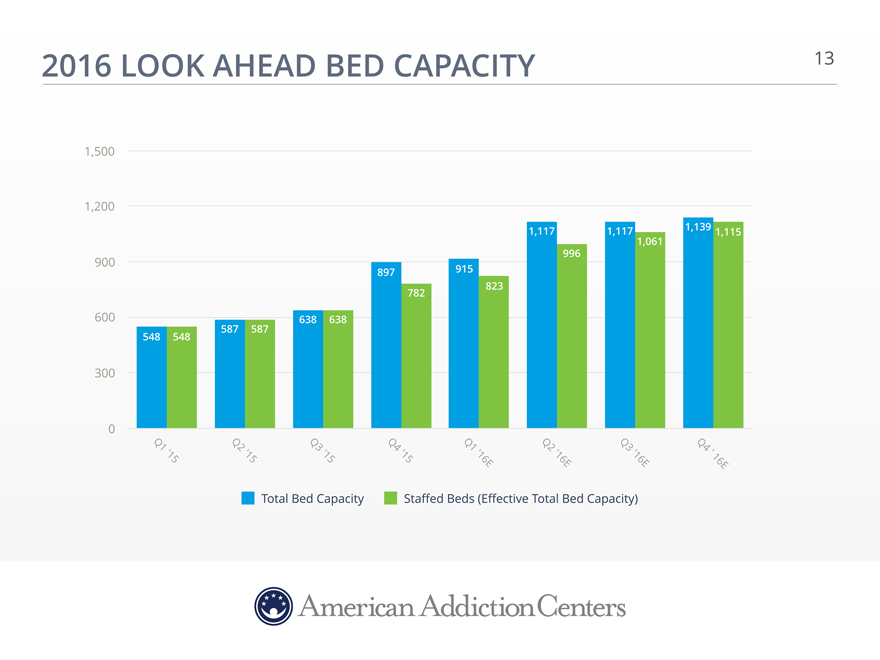
2016 LOOK AHEAD BED CAPACITY
1,500
1,200
1,117 1,117 1,139 1,115
1,061
996
900 897 915
782 823
600 638 638
548 548 587 587
300
0
Q1 Q2 Q3 Q4 Q1 Q2 Q3 Q4 ‘
‘15 ‘15 ‘15 ‘15 ‘16E ‘16E ‘16E 16E
Total Bed Capacity Sta?ed Beds (E?ective Total Bed Capacity)
13
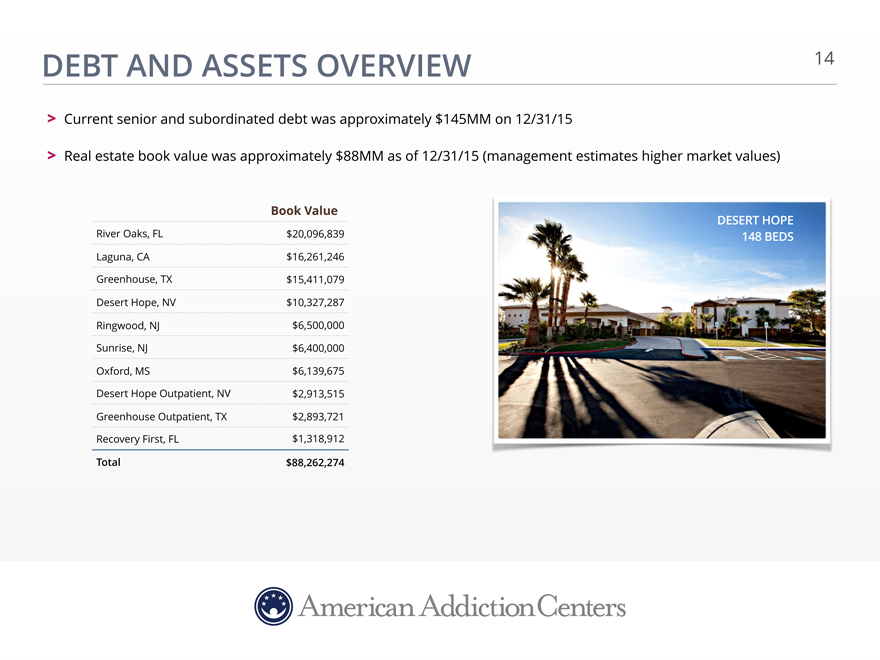
DEBT AND ASSETS OVERVIEW
Current senior and subordinated debt was approximately $145MM on 12/31/15
Real estate book value was approximately $88MM as of 12/31/15 (management estimates higher market values)
Book Value
River Oaks, FL $20,096,839
Laguna, CA $16,261,246
Greenhouse, TX $15,411,079
Desert Hope, NV $10,327,287
Ringwood, NJ $6,500,000
Sunrise, NJ $6,400,000
Oxford, MS $6,139,675
Desert Hope Outpatient, NV $2,913,515
Greenhouse Outpatient, TX $2,893,721
Recovery First, FL $1,318,912
Total $88,262,274
DESERT HOPE
148 BEDS
14
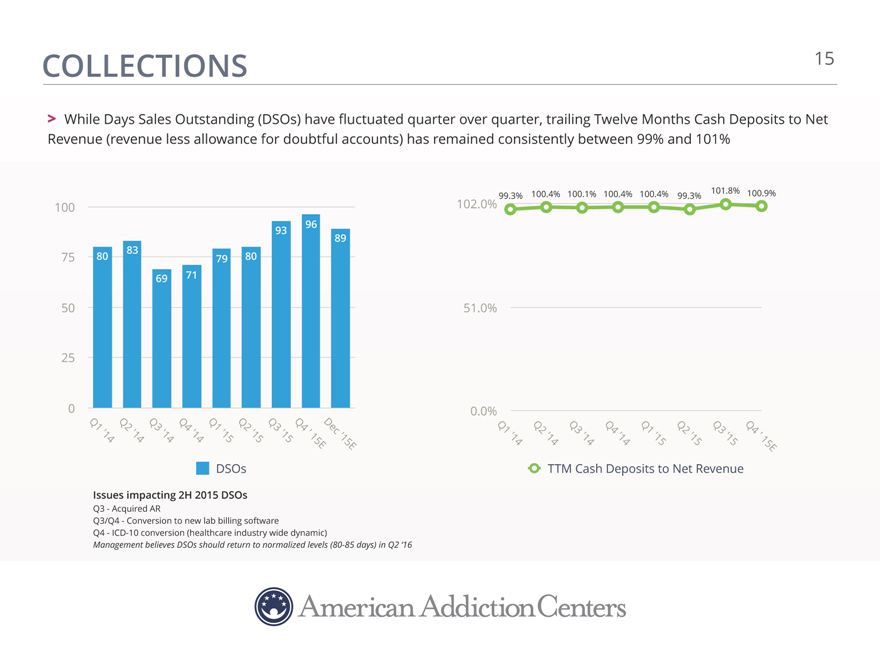
COLLECTIONS
> While Days Sales Outstanding (DSOs) have fluctuated quarter over quarter, trailing Twelve Months Cash Deposits to Net Revenue (revenue less allowance for doubtful accounts) has remained consistently between 99% and 101%
100
93 96
89
83
75 80 79 80
69 71
50
25
0
Q1 Q2 Q3 Q4 Q1 Q2 Q3 Q4 Dec ‘
‘14 ‘14 ‘14 ‘14 ‘15 ‘15 ‘15 ‘15E 15 E
DSOs
99.3% 100.4% 100.1% 100.4% 100.4% 99.3% 101.8% 100.9%
102.0%
51.0%
0.0%
Q1 Q2 Q3 Q4 Q1 Q2 Q3 Q4
‘14 ‘14 ‘14 ‘14 ‘15 ‘15 ‘15 ‘ 15E
TTM Cash Deposits to Net Revenue
Issues impacting 2H 2015 DSOs
Q3—Acquired AR
Q3/Q4—Conversion to new lab billing software
Q4—ICD-10 conversion (healthcare industry wide dynamic)
Management believes DSOs should return to normalized levels (80-85 days) in Q2 ‘16
15
CASE UPDATE: 995 MOTION 16
> 995 motions were filed on January 22, 2016. Key arguments presented by Company and other Defendants to dismiss the case include:
Failing to call the coroner and instead calling a paid consultant to the plaintiff in the civil case and misrepresenting to the Grand Jury the coroner’s findings and the contents of his records to make it appear that the client’s death was a homicide
Repeated violations of the prosecutor’s duty to present exculpatory evidence
Repeatedly presenting inadmissible evidence to the Grand Jury including hearsay and opinion testimony
Presenting no evidence of probable cause that any of the Defendants had the requisite malice required for a second degree murder case
Incorrectly advising the Grand Jury that it could interpret licensing statutes to find the client was a dependent adult
Failing to instruct on essential elements of some offenses and affirmatively mis-instructing on the law for other offenses
THE FULL 995 MOTION CAN BE DOWNLOADED AT AACTHETRUTH.COM
16
CASE UPDATE: CORONER DECLARATION
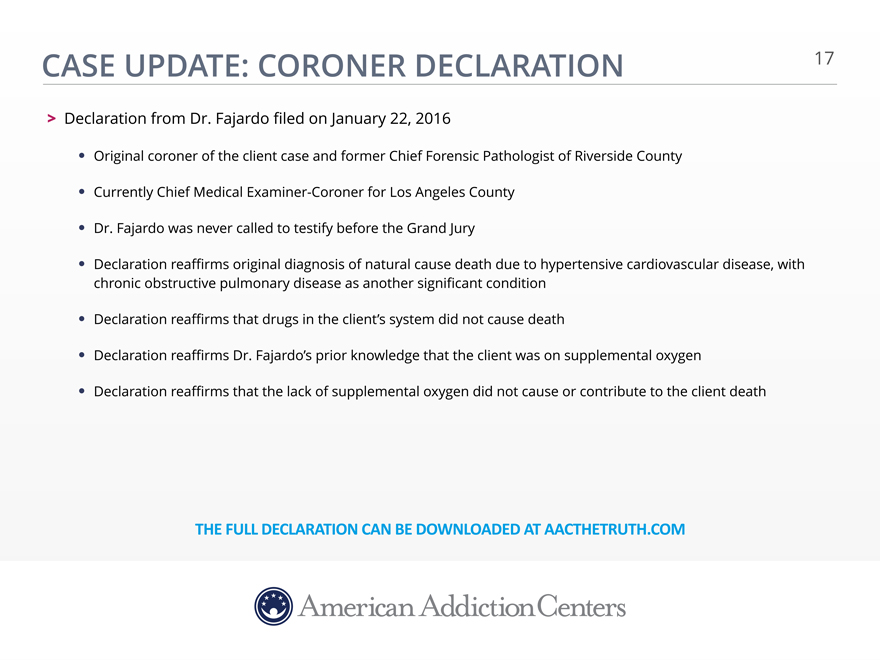
> Declaration from Dr. Fajardo filed on January 22, 2016
Original coroner of the client case and former Chief Forensic Pathologist of Riverside County
Currently Chief Medical Examiner-Coroner for Los Angeles County
Dr. Fajardo was never called to testify before the Grand Jury
Declaration reaffirms original diagnosis of natural cause death due to hypertensive cardiovascular disease, with chronic obstructive pulmonary disease as another significant condition
Declaration reaffirms that drugs in the client’s system did not cause death
Declaration reaffirms Dr. Fajardo’s prior knowledge that the client was on supplemental oxygen
Declaration reaffirms that the lack of supplemental oxygen did not cause or contribute to the client death
THE FULL DECLARATION CAN BE DOWNLOADED AT AACTHETRUTH.COM
17
2016 BUSINESS OBJECTIVES
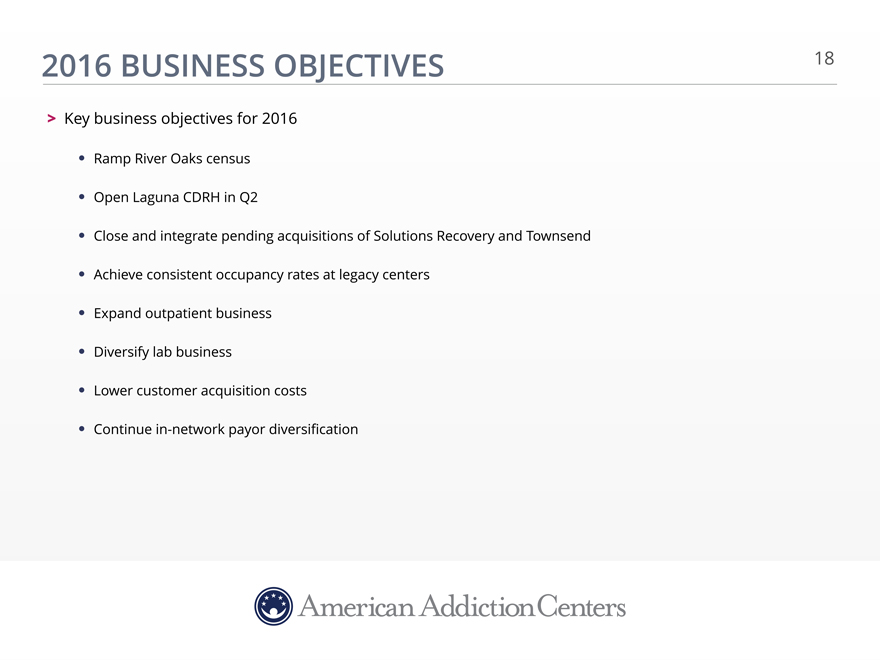
> Key business objectives for 2016
Ramp River Oaks census
Open Laguna CDRH in Q2
Close and integrate pending acquisitions of Solutions Recovery and Townsend
Achieve consistent occupancy rates at legacy centers
Expand outpatient business
Diversify lab business
Lower customer acquisition costs
Continue in-network payor diversification
18
APPENDIX: NON-GAAP FINANCIAL MEASURES
Adjusted EBITDA and Adjusted Earnings Per Share (EPS) are non-GAAP financial measures” as defined under the rules and regulations promulgated by the U.S. Securities and Exchange Commission. Management defines Adjusted EBITDA as net income adjusted for interest expense, depreciation and amortization expense, income tax expense, stock-based compensation and related tax reimbursements, litigation settlement, restructuring charges, reorganization expense (which includes certain reorganization transactions in April 2014 and expenses associated with the amendment and restatement of our then-existing credit facility in April 2014), acquisition-related expense, and de novo startup expense. Where applicable, these include professional services for accounting, legal, valuation services and licensing expenses. Adjusted EBITDA and Adjusted EPS are considered supplemental measures of the Company’s performance and are not required by, or presented in accordance with, generally accepted accounting principles, or GAAR Adjusted EBITDA and Adjusted EPS are not measures of the Company’s financial performance under GAAP and should not be considered as alternatives to net income or any other performance measures derived in accordance with GAAR Management has included information concerning Adjusted EBITDA and Adjusted EPS because they believe that such information is used by certain investors as a measure of a company’s historical performance.
Management believes these measures are frequently used by securities analysts, investors and other interested parties in the evaluation of issuers of equity securities, many of which present
EBITDA, Adjusted EBITDA and Adjusted EPS when reporting their results. Because Adjusted EBITDA and Adjusted EPS are not determined in accordance with GAAP, they are subject to varying
calculations and may not be comparable to the Adjusted EBITDA and Adjusted EPS (or similarly titled measures) of other companies. Management’s presentation of Adjusted EBITDA and
Adjusted EPS should not be construed as an inference that our future results will be unaffected by unusual or nonrecurring items.
19
RECONCILIATION OF NON-GAAP DISCLOSURES
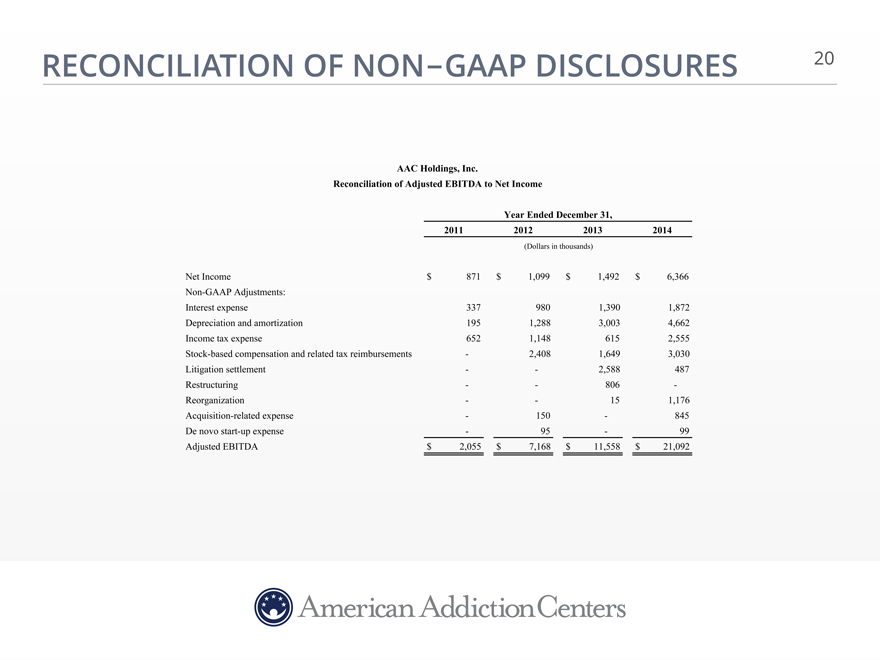
AAC Holdings, Inc.
Reconciliation of Adjusted EBITDA to Net Income
Year Ended December 31,
2011 2012 2013 2014
(Dollars in thousands)
Net Income $ 871 $ 1,099 $ 1,492 $ 6,366
Non-GAAP Adjustments:
Interest expense 337 980 1,390 1,872
Depreciation and amortization 195 1,288 3,003 4,662
Income tax expense 652 1,148 615 2,555
Stock-based compensation and related tax reimbursements — 2,408 1,649 3,030
Litigation settlement — — 2,588 487
Restructuring — — 806 -
Reorganization — — 15 1,176
Acquisition-related expense — 150 — 845
De novo start-up expense — 95 — 99
Adjusted EBITDA $ 2,055 $ 7,168 $ 11,558 $ 21,092
20