f
UNITED STATES
SECURITIES AND EXCHANGE COMMISSION
Washington, D.C. 20549
FORM 10-K
(Mark One)
x | ANNUAL REPORT PURSUANT TO SECTION 13 OR 15(d) OF THE SECURITIES EXCHANGE ACT OF 1934 |
For the fiscal year ended December 31, 2014
or
¨ | TRANSITION REPORT PURSUANT TO SECTION 13 OR 15(d) OF THE SECURITIES EXCHANGE ACT OF 1934 |
For the transition period from to
Commission File Number: 001-36643
AAC HOLDINGS, INC.
(Exact Name of Registrant as Specified in Its Charter)
Nevada | | 35-2496142 |
(State or other jurisdiction of
incorporation or organization) | | (I.R.S. Employer
Identification No.) |
115 East Park Drive, Second Floor
Brentwood, Tennessee 37027
(Address, including zip code, of registrant’s principal executive offices)
(615) 732-1231
(Registrant’s telephone number, including area code)
Securities registered pursuant to Section 12(b) of the Act:
Title of each Class | | Name of exchange on which registered |
Common Stock, $0.001 par value | | New York Stock Exchange |
Securities registered pursuant to Section 12(g) of the Act: None
Indicate by check mark if the registrant is a well-known seasoned issuer, as defined in Rule 405 of the Securities Act. Yes ¨ No x
Indicate by check mark if the registrant is not required to file reports pursuant to Section 13 or Section 15(d) of the Act. Yes ¨ No x
Indicate by check mark whether the registrant (1) has filed all reports required to be filed by Section 13 or 15(d) of the Securities Exchange Act of 1934 during the preceding 12 months (or for such shorter period that the registrant was required to file such reports), and (2) has been subject to such filing requirements for the past 90 days. Yes x No ¨
Indicate by check mark whether the registrant has submitted electronically and posted on its corporate Web site, if any, every Interactive Data File required to be submitted and posted pursuant to Rule 405 of Regulation S-T (§232.405 of this chapter) during the preceding 12 months (or for such shorter period that the registrant was required to submit and post such files). Yes x No ¨
Indicate by check mark if disclosure of delinquent filers pursuant to Item 405 of Regulation S-K (§229.405 of this chapter) is not contained herein, and will not be contained, to the best of registrant’s knowledge, in definitive proxy or information statements incorporated by reference in Part III of this Form 10-K or any amendment to this Form 10-K. x
Indicate by check mark whether the registrant is a large accelerated filer, an accelerated filer, a non-accelerated filer, or a smaller reporting company. See the definitions of “large accelerated filer,” “accelerated filer” and “smaller reporting company” in Rule 12b-2 of the Exchange Act.
Large accelerated filer | | ¨ | | Accelerated filer | | ¨ |
| | | |
Non-accelerated filer | | x (Do not check if a smaller reporting company) | | Smaller reporting company | | ¨ |
Indicate by check mark whether the registrant is a shell company (as defined in Rule 12b-2 of the Exchange Act). Yes ¨ No x
As of June 30, 2014, the last business day of the registrant’s most recently completed second fiscal quarter, there was no established public market for the registrant’s common stock and, therefore, the registrant cannot calculate the aggregate market value of its common stock held by non-affiliates as of such date. The aggregate market value of the registrant’s common stock held by non-affiliates of the registrant on December 31, 2014 (based on the closing price of $30.92 on that date), was approximately $235,100,000. Common stock held by each officer and director and by each person known to the registrant who owned 5% or more of the outstanding common stock have been excluded in that such persons may be deemed affiliates. This determination of affiliate status is not necessarily a conclusive determination for other purposes.
As of March 5, 2015, there were 21,786,874 shares of the registrant’s common stock outstanding.
DOCUMENTS INCORPORATED BY REFERENCE
Portions of the Registrant’s definitive proxy materials for its 2015 Annual Meeting of Stockholders are incorporated by reference into Part III hereof.
AAC HOLDINGS, INC.
ANNUAL REPORT ON FORM 10-K
TABLE OF CONTENTS
2
PART I
Unless we indicate otherwise or the context requires, “we,” “our,” “us” and the “company” refer, prior to the Reorganization Transactions discussed below, to American Addiction Centers, Inc. and, after the Reorganization Transactions, to AAC Holdings, Inc., in each case together with its consolidated subsidiaries. The term “Holdings” refers to AAC Holdings, Inc. and the term “AAC” refers to American Addiction Centers, Inc.
Item 1. Business.
Company Overview
AAC Holdings, Inc. is a leading provider of inpatient substance abuse treatment services for individuals with drug and alcohol addiction. As of March 1, 2015, we operated seven residential substance abuse treatment facilities and one outpatient substance abuse treatment facility. Our substance abuse treatment facilities are located throughout the United States, focused on delivering effective clinical care and treatment solutions across our 560 beds, which includes 378 licensed detoxification beds. In addition, at March 1, 2015, we had two facilities under development, a recently acquired property and a property under contract that we plan to develop into new facilities, and an outpatient treatment facility under contract. The majority of our approximately 900 employees as of March 1, 2015, are highly trained clinical staff who deploy research-based treatment programs with structured curricula for detoxification, residential treatment, partial hospitalization and intensive outpatient care. By applying a tailored treatment program based on the individual needs of each client, many of whom require treatment for a co-occurring mental health disorder, such as depression, bipolar disorder and schizophrenia, we believe we offer the level of quality care and service necessary for our clients to achieve and maintain sobriety.
We have made substantial investments in our treatment facilities with a specific focus on providing aesthetically pleasing properties and grounds, numerous amenities, healthy food and a courteous and attentive staff to distinguish us from our competitors. Our commitment to clinical excellence, premium facilities and customer service has allowed us to form relationships across a broad set of key referral sources, including hospitals, other treatment facilities, employers, alumni and employee assistance programs. Our platform is supported by a centralized infrastructure that includes a multi-faceted sales and marketing program, call center operations, a laboratory facility, billing and collection services and other support functions. This infrastructure, in conjunction with our premium service offerings, has enabled us to develop a strong national brand. The substantial investments we have made at a corporate level contribute to our operational efficiencies and provide us flexibility to place clients at a variety of our facilities in order to optimize care that best fits both the clients’ clinical needs and their insurance benefits.
We have demonstrated the ability to grow our business organically and generate attractive returns on investments with our de novo development capabilities. Our two de novo developments, Greenhouse and Desert Hope, added 218 total beds on a combined basis, and each achieved profitability within the first year of its respective opening. Our net revenues have increased to $133.0 million in 2014 from $115.7 million in 2013, representing a growth rate of 15.0%. In addition, for the years ended December 31, 2014 and December 31, 2013, we had $21.1 million and $11.6 million in Adjusted EBITDA and $6.4 million and $1.5 million in net income, respectively. For 2014 and 2013, approximately 90% of our revenues were reimbursable by commercial payors, including amounts paid by such payors to clients, and the remaining portion was payable directly by our clients. We currently do not receive any revenues from government healthcare payment programs such as Medicare and Medicaid. See “Selected Financial Data” for a discussion of Adjusted EBITDA and a reconciliation of Adjusted EBITDA to net income, the most directly comparable GAAP measure.
AAC Holdings, Inc. was incorporated as a Nevada corporation on February 12, 2014 for the purpose of acquiring all of the common stock of American Addiction Centers, Inc. and to engage in certain reorganization transactions, as described below. On October 7, 2014 we completed our initial public offering (“IPO”) of 5,750,000 shares of our common stock, which included the exercise in full of the underwriters’ option to purchase an additional 250,000 shares from the Company and 500,000 shares from certain stockholders. Net proceeds to the Company from the IPO were approximately $68.8 million, after deducting underwriting discounts and offering costs. Our common stock is listed for trading on the New York Stock Exchange (NYSE) under the symbol “AAC.”
Our principal executive offices are located at 115 East Park Drive, Second Floor, Brentwood, Tennessee 37027, and our telephone number is (615) 732-1231. Our website address is www.americanaddictioncenters.com. The information contained on, or that can be accessed through, our website is not a part of this report. Investors should not rely on any such information in deciding whether to purchase our common stock. We have included our website address in this report solely as an inactive textual reference.
Our History
In 2004, Jerrod Menz, our President, established a residential drug and alcohol treatment company. In 2008, it was acquired by Forterus, Inc. In 2011, Forterus acquired Performance Revolution (d.b.a. FitRx), which was owned by Michael Cartwright, our Chief
3
Executive Officer and Chairman. Utilizing Mr. Cartwright’s and Mr. Menz’s skills and prior experiences developing de novo facilities, Forterus began identifying properties to develop into residential treatment centers. In 2011, we purchased Greenhouse, which opened in March 2012, and Desert Hope, which opened in January 2013. In 2012, we acquired the outpatient treatment operations of Singer Island, The Academy and Leading Edge and a national sales and marketing program, and we changed our name to American Addiction Centers, Inc.
As described above, AAC Holdings, Inc. was incorporated as a Nevada corporation on February 12, 2014 for the purpose of acquiring all of the common stock of American Addiction Centers, Inc. and to engage in certain reorganization transactions in preparation for our IPO. In April 2014, Holdings completed the following reorganization transactions (collectively, the “Reorganization Transactions”):
· | a voluntary private share exchange with certain stockholders of AAC, whereby holders representing 93.6% of the then outstanding shares of common stock of AAC exchanged their shares on a one-for-one basis for shares of Holdings common stock, which we refer to as the Private Share Exchange; |
· | the acquisition of all of the outstanding common membership interests of Behavioral Healthcare Realty, LLC, or BHR, an entity controlled by related parties, which owns all the outstanding equity interests of Concorde Real Estate, LLC, Greenhouse Real Estate, LLC and The Academy Real Estate, LLC, which entities own the Desert Hope, Greenhouse and Riverview, Florida properties, respectively, in exchange for $3.0 million in cash, the assumption of a $1.8 million term loan and 820,124 shares of Holdings common stock, representing 5.2% of our outstanding common stock as of June 30, 2014, which we refer to as the BHR Acquisition; and |
· | the acquisition of all of the outstanding membership interests of Clinical Revenue Management Services, LLC, or CRMS, an entity controlled by related parties, which provides client billing and collection services for AAC, in exchange for $0.5 million in cash and 234,324 shares of Holdings common stock, representing 1.5% of our outstanding common stock as of June 30, 2014, which we refer to as the CRMS Acquisition. |
After the Reorganization Transactions, Holdings owned (i) 93.6% of the then outstanding common stock of AAC, (ii) 100% of the outstanding common membership interests in BHR, which represents 100% of the voting rights in BHR, and (iii) 100% of the outstanding membership interests in CRMS. For additional information related to the Reorganization Transactions, see “Management’s Discussion and Analysis of Financial Condition and Results of Operations” and Note 3 to our consolidated financial statements.
On November 10, 2014, the Company completed a subsidiary short-form merger with AAC and a wholly-owned merger subsidiary whereby the legacy holders of AAC common stock who did not participate in the Private Share Exchange received 1.571119 shares of Holdings common stock for each share of AAC common stock owned at the effective time of the merger (for an aggregate of approximately 293,040 shares of Holdings common stock). As a result of the short-form merger, AAC is a wholly-owned subsidiary of Holdings.
Business Strategy
We have developed our company and the American Addiction Centers national brand through substantial investment in our facilities, our clinical expertise, our professional staff and our national sales and marketing program. We anticipate a number of factors will accelerate demand for our services, including increased awareness and de-stigmatization of substance abuse treatment and recent healthcare reform improving access to care, particularly for young adults now able to access their parents’ insurance. We seek to extend our position as a leading provider of treatment for drug and alcohol addiction by executing the following growth strategies:
· | Improve census at existing facilities. We seek to improve census and client demand by increasing our client leads through our multi-faceted sales and marketing program, consisting of our national sales team, recommendations from alumni and healthcare professionals, internet, television and print advertising and potential client inquiries. By utilizing multiple sales and marketing channels, we generate significant inbound call volume from potential clients and the people close to them, and our consultative call center approach enables us to effectively identify and enroll qualified clients. |
· | Expand capacity at existing residential facilities. As our client demand increases, we seek opportunities to expand capacity at our existing facilities. When market conditions indicate, we anticipate selectively increasing our number of residential beds, expanding our clinical facility space and hiring additional clinical staff to enable us to provide services to additional clients. Construction of the expansion of our Greenhouse location from 70 beds to 130 beds was completed in June 2014, and we received licensure for the additional beds in July 2014. In addition, in January 2015 we expanded capacity at our Forterus facility in Temecula, California with the addition of 31 beds, including 24 detox beds. |
· | Pursue de novo development of residential facilities. As of March 1, 2015, we operated seven residential substance abuse treatment facilities located throughout the United States, had one additional residential facility under development, and a recently acquired property that we expect to begin renovation and construction on in the second quarter of 2015. De novo development plays an important role in the growth of our facility base. Our de novo facility development consists of either |
4
| building a new facility from the ground up or acquiring an existing facility with an alternative use and repurposing it as a substance abuse treatment facility. During 2012 and 2013, we developed two full-service residential treatment facilities: Greenhouse, a former luxury spa in Dallas, Texas, and Desert Hope, a former assisted living facility in Las Vegas, Nevada. We believe the success of our Greenhouse and Desert Hope facilities provides us with the experience to develop additional premium facilities across the United States with comparable scale, capabilities and quality. |
We are currently developing a new premium facility located in Riverview, Florida that will provide us with an additional 164 beds. We expect this new residential treatment facility to open in the fourth quarter of 2015. In addition, on February 24, 2015, we completed the purchase of a property in Ringwood, New Jersey for an aggregate of $6.5 million in cash that we expect to develop into an inpatient facility with approximately 150 beds. We expect to invest approximately $16 million for renovations and construction. Renovations and construction is expected to begin in the second quarter of 2015 with a targeted opening late in the second half of 2016.
We have also entered into a definitive agreement to acquire an 84-bed hospital in Aliso Viejo, California, which we currently anticipate closing during the second quarter of 2015. We expect to begin renovation and rehabilitation of the facility in the second quarter of 2015 and expect to apply for a license to operate the facility as a Chemical Dependency Recovery Hospital. After renovations and construction, which will add up to an additional 40 beds, we expect this facility will provide us with a total of up to 124 beds. We anticipate that we will invest approximately $5 million for renovations and construction and have a targeted completion date for the first half of 2016.
· | Opportunistically pursue treatment facility acquisitions. We selectively seek opportunities to expand and diversify our geographic presence and service offerings through facility acquisitions. IBISWorld estimates that there were more than 16,700 mental health and substance abuse treatment facilities in operation in 2013, most of which are small, regional operations. We believe this high level of fragmentation presents us with the opportunity to acquire facilities or small providers and upgrade their treatment programs and facilities to improve client care and as a result improve our operating metrics. We believe that our brand recognition, marketing platform and referral network will enable us to improve census at acquired facilities. For example, on February 20, 2015, we completed the acquisition of the assets of Recovery First, Inc. (“Recovery First”), a Florida-based provider of substance abuse treatment and rehabilitation services, including a 56-bed inpatient substance abuse treatment facility in the greater Fort Lauderdale, Florida area, for cash consideration of $13 million. |
· | Expand outpatient operations. We actively pursue opportunities to add outpatient centers to complement our broader network of residential treatment facilities. In March 2014, we acquired a 20,000 square foot property in Arlington, Texas, which we expect to receive licensure and begin seeing clients in the second quarter of 2015; and in May 2014, we acquired a 20,000 square foot property in Las Vegas, Nevada, which received licensure in January 2015 and immediately began seeing clients. We developed these properties as outpatient treatment facilities providing additional programming space for our nearby residential facilities. We believe expanding our reach by acquiring or developing premium outpatient facilities of a quality consistent with our inpatient services will further enhance our brand and our ability to provide a more comprehensive suite of services across the spectrum of care. Outpatient centers are expected to be an increasingly important source of leads for our residential programs as we believe a portion of clients receiving outpatient treatment will ultimately need a higher level of care. Moreover, we believe this will position us to better serve those clients whose payors require outpatient treatment as a prerequisite to any inpatient treatment. For example, on January 23, 2015, we signed a definitive agreement to acquire Clinical Services of Rhode Island, Inc. (“CSRI”), a provider of intensive outpatient substance abuse treatment services in Greenville, Portsmouth and South Kingstown, Rhode Island, for $665,000 in cash and approximately $1.3 million in restricted shares of common stock. We currently anticipate that this acquisition will close in the second quarter of 2015. |
· | Target complementary growth opportunities. There are additional growth opportunities that we may selectively pursue that are complementary to our current business. These may include, without limitation, providing pharmacy and laboratory services, expanding licensure of existing facilities, treating other mental health and wellness disorders and expanding other ancillary services. We are also aggressively pursuing acquisitions of technology and other assets to enhance our marketing efforts and allow us to improve our referral base. Our laboratory, located in Brentwood, Tennessee, currently provides high complexity testing services for our clients receiving treatment in Florida, Nevada and Texas. We have applied for a license to provide laboratory services for our clients receiving treatment in California and Rhode Island which we anticipate receiving in the second quarter of 2015. |
Competitive Strengths
We believe the following strengths differentiate us from our competitors and will allow us to successfully operate and grow our business:
· | Leading substance abuse treatment platform. We believe we are a leading provider of substance abuse treatment services based on the scale and nationwide reach of our platform, quality of our facilities and breadth of our treatment capabilities. With 560 total beds across seven residential substance abuse treatment facilities and one outpatient substance abuse treatment facility, we believe we offer one of the largest for-profit fully licensed programs to treat drug and alcohol addiction |
5
| regardless of stage or severity. Our premium facilities offer clients aesthetically pleasing properties and grounds, a comfortable environment, high quality and healthy food, numerous amenities and a courteous and attentive staff. We believe our commitment to quality and customer service, as well as our dedication to clinical excellence, results in improved client retention, an important factor in ensuring clients receive the care they need. The combination of these attributes has allowed us to form relationships with key referral sources in the industry, including hospitals, other treatment facilities, employers, alumni and employee assistance programs, further strengthening our competitive position and national brand. |
· | Comprehensive addiction treatment programs with co-occurring mental health disorder treatment capabilities. Our clinical staff is trained to deploy a research-based treatment program with a structured curriculum, particularly focused on identifying and addressing the needs of clients with co-occurring mental health disorders. We address a broad set of client needs through our comprehensive clinical programs that include detoxification, residential treatment, partial hospitalization and intensive outpatient care. Given that up to 65% of adults with substance abuse addiction are estimated to also have at least one co-occurring mental health disorder, we believe our medical and clinical staff’s ability to identify and treat both disorders is critical in helping clients achieve sobriety. Due to the complexity of their cases, clients with co-occurring mental health disorders often require more intensive treatment. We believe our ability to address these complex conditions enhances our reputation with clients, their families and other referral sources. |
· | Proven ability to develop de novo treatment facilities. We have a successful track record of identifying suitable de novo sites, securing properties, overseeing the licensing and development of facilities and integrating de novo centers into our broader platform. We have successfully transformed acquired properties, such as a luxury spa and an assisted living facility, into substance abuse treatment facilities. We believe our skill and experience in executing our de novo development strategy provides us with a competitive advantage in quickly and cost-effectively developing substance abuse treatment facilities and enrolling clients. Our two de novo facilities, Greenhouse and Desert Hope, opened within 12 months of initially acquiring each respective property, and both were profitable within their first year of operation. We believe this is particularly noteworthy given the relative size of the facilities developed. With 148 beds, we believe Desert Hope is one of the largest premium residential substance abuse treatment facilities in the United States today. By focusing on larger facilities, we have the scale to offer a level of treatment services and amenities that otherwise would be cost prohibitive, namely our ability to house an onsite pharmacy and facilitate comprehensive medical services via onsite nurses, nurse practitioners and physicians. |
· | Multi-faceted sales and marketing program. Our national sales and marketing program provides a competitive advantage compared to treatment facilities that primarily target local geographic areas and use fewer marketing channels to attract clients. Our national team of over 40 professional sales representatives develops and maintains relationships with key referral sources such as hospitals, other treatment facilities, employers, alumni and employee assistance programs. In addition, our team of over 75 centralized, trained call center treatment consultants provides coverage and support 24 hours a day, seven days a week. Our coordinated approach to leveraging our sales team, relationships in the industry, internet, television and print advertising and potential client inquiries and our ability to serve clients from our varied facilities across the United States allows us to reach a broad audience of potential clients and build a nationally recognized brand. Given our multi-faceted sales and marketing program, we have been able to attract clients from a diverse set of channels. This nationally branded, multi-channel approach has led to an increase in our number of admitted clients from 2,934 in 2012 to 4,728 in 2014, a 61.1% growth rate. Our investment in a dedicated call center and supporting technology allows us to evaluate the effectiveness of our various marketing channels. Analyzing this information enables us to adjust sales and marketing efforts to address near-term census levels across our facilities and optimize our spending on sales and marketing. |
· | Attractive payor mix and diversified client base. We have generated revenues solely from commercial payors and our clients with no reimbursement from the Medicare and Medicaid programs, which are typically subject to lower reimbursement rates. The relationships we have developed with our referral sources enhance our interactions with payors and help us achieve our attractive reimbursement profile. For the years ended December 31, 2013 and 2014, approximately 90% of our revenues were reimbursable by commercial payors, including amounts paid by such payors to clients, with the remaining portion of our revenues payable directly by our clients. |
· | Strong financial performance and attractive returns on invested capital. We have achieved strong financial performance in terms of recent growth and profitability. Our revenues for the year ended December 31, 2014 were $133.0 million, representing a 15.0% increase over $115.7 million in 2013. We believe the profitability and modest capital needs of our established substance abuse treatment facilities position us to generate strong cash flows. We have demonstrated the ability to generate attractive returns on investment with our de novo development strategy. Each of our two de novo developments, Greenhouse and Desert Hope, which added 218 total beds on a combined basis, was profitable within its first year of operation. |
· | Experienced management team with track record of success. Our senior management team, with an average of over 15 years of experience in the healthcare industry, has significant experience developing, operating and growing a variety of behavioral health treatment facilities. During our Chief Executive Officer’s nearly 20 year career in the substance abuse treatment industry, he developed two not-for-profit treatment companies before founding and developing a for-profit substance abuse treatment company with multiple operations in California and Tennessee. Our President has spent almost 18 years in the behavioral health industry, also focused on developing de novo substance abuse treatment facilities, including |
6
| one of our predecessor companies. In addition, our Chief Operating Officer brings 22 years of experience in various senior roles at a leading provider of treatment and educational programs for adults and youth struggling with behavioral issues. We believe the combination of our management team’s skills and experiences provides us with an advantage in developing high quality de novo treatment facilities and quickly integrating them into our broader platform. Our senior management team is committed to utilizing its extensive experience in the execution of our long-term strategic plan. |
Our Services and Solutions
We provide quality, comprehensive and compassionate care to adults and adolescents struggling with alcohol and/or drug abuse and dependence as well as co-occurring mental health issues. We maintain a research-based, disciplined treatment plan for all clients with schedules designed to engage the client in an enriched recovery experience. Our purpose and passion is to empower the individual, their families and the broader community through the promotion of optimal wellness of the mind, body and spirit.
Our curriculum, which is peer reviewed and research-based, has been recognized as one of our program strengths by the Commission on Accreditation of Rehabilitation Facilities, or CARF, a leader in the promotion and accreditation of quality, value and optimal outcomes of service. In particular, research studies show that certain aspects of our treatment programs, such as offering longer treatment stays, are effective for producing long-term recovery. In addition, we offer a variety of forms of therapy types and settings and related services that the National Institute on Drug Abuse has recognized as effective. We offer the following types of therapy: motivational interviewing, cognitive behavioral therapy, rational emotive behavior therapy, dialectical behavioral therapy, solution-focused therapy, seeking safety, eye movement desensitization and reprocessing, and systematic family intervention. Our variety of therapy settings includes individual, group, family, recovery-oriented challenge, expressive (with a focus on music and art) and equine and trauma therapies.
We offer a full spectrum of treatment services to clients, based upon individual needs as assessed through comprehensive evaluations at admission and throughout participation in the program. The assignment to, and frequency of, services corresponds to individualized treatment plans within the context of the level of care and treatment intensity level.
· | Detoxification: Detoxification is usually conducted at an inpatient facility for clients with physical or psychological dependence. Detoxification services are designed to clear toxins out of the body so that the body can safely adjust and heal itself after being dependent upon a substance. Clients undergo routine urinalysis screenings and are medically monitored 24 hours per day, seven days per week by experienced medical professionals who work to alleviate withdrawal symptoms through medication, as appropriate. We provide detoxification services for several substances including alcohol, sedatives and opiates. |
· | Residential Treatment: Residential care is a structured treatment approach designed to prepare clients to return to the general community with a sober lifestyle, increased functionality and improved overall wellness. Treatment is provided on a 24 hours per day, seven days per week basis, and services generally include a minimum of two individual therapy sessions per week, regular group therapy, family therapy, didactic and psycho-educational groups, exercise (if cleared by medical staff), case management, routine urinalysis screenings and recreational activities. Medical and psychiatric care is available to all clients, as needed, through our contracted professional physician groups. |
· | Partial Hospitalization: Partial hospitalization is a structured program providing care at least five days a week for no fewer than six hours a day. This program is designed for clients who are stable enough physically and psychologically to participate in everyday activities, but who still require a degree of medical monitoring. Services include a minimum of weekly individual therapy, regular group therapy, family education and therapy, didactic and psycho-educational groups, exercise (if cleared by medical staff), case management, routine urinalysis screenings and off-site recovery meetings and activities. Medical and psychiatric care is available to all clients, as needed, through our contracted professional physician groups. |
· | Intensive Outpatient Services: Less intensive than the aforementioned levels of care, intensive outpatient services is a structured program providing care three days a week for three hours per day at a minimum. Designed as a “step down” from partial hospitalization, this program reinforces progress and assists in the attainment of sobriety, reduction of detrimental behaviors and improved overall wellness of clients while they integrate and interact in the community. Services include weekly individual therapy, group therapy, family education and therapy, didactic and psycho-educational groups, case management, frequent urinalysis screenings, off-site recovery meetings and activities, and intensive transitional and aftercare planning. |
We do not have a fixed number of beds within each of the four levels of care described above. Depending on the specific needs of our client census at any given time, we are able to repurpose beds within a treatment facility to provide varying levels of care, subject to licensure requirements. As a result, rather than tracking the number of beds within a given level of care at any one time, management records and evaluates the number of billed days for each level of care over a given period of time. For instance, detoxification and residential treatment levels of care feature higher per day gross client charges than partial hospitalization and intensive outpatient levels of care but also require greater levels of more highly trained medical staff. For the year ended December 31, 2014, detoxification and residential treatment services accounted for 27% of total billed days, and partial hospitalization
7
and intensive outpatient services accounted for the remaining 73% of total billed days. For the fiscal year ended December 31, 2013, detoxification and residential treatment services accounted for 23% of total billed days, and partial hospitalization and intensive outpatient services accounted for the remaining 77% of total billed days.
Considering the high level of co-occurring substance abuse, mental health and medical conditions, we offer clients a spectrum of psychiatric, medical and wellness-focused services based upon his or her individual needs as assessed through comprehensive evaluations at admission and throughout his or her participation in the program. To maximize the likelihood of long-term recovery, all program levels provide clients access to the following services: assessment of individual substance abuse, mental health and medical history and physical within 24 to 72 hours of admission; psychiatric evaluations; psychological evaluations and services based on client needs; follow-up appointments with physicians and psychiatrists; medication monitoring; educational classes regarding health risks, nutrition, smoking cessation, HIV awareness, life skills, healthy nutritional programs and dietary plans; access to fitness facilities; interactive wellness activities such as swimming, basketball and yoga; and structured daily schedules designed for restorative sleep patterns.
In addition, we believe drug testing of clients is an important component of substance abuse treatment. Clients are tested for substances at our facilities (“point-of-care drug testing”) upon admission, on a random basis, and as otherwise determined to be medically necessary. Point-of-care drug tests are sent to an off-site laboratory for confirmation or quantitative analysis. Currently, we process quantitative analysis and confirmation testing for our Nevada, Texas, and Florida facilities at our laboratory using time of flight mass spectrometry technology located in Brentwood, Tennessee. Quantitative analysis and confirmation testing for our clients in other states is performed by third parties. We are in the process of obtaining licensure to expand our quantitative laboratory testing services to our California facilities. We believe we utilize industry standard practices for drug testing and laboratory services.
We emphasize clinical treatment, as well as the therapeutic value of overall physical and nutritional wellness. We are committed to providing fresh and nutritious meals throughout a client’s stay in order to promote healthy routines beginning with diet and exercise. Some of our facilities offer comprehensive work-out facilities, and many locations offer various exercise classes and other amenities. We support long-term recovery for clients through research-based methodologies and individualized treatment planning while utilizing 12 step programs, which are a set of guiding principles outlining a course of action for recovery.
We believe we have a differentiated ability to manage dual diagnosis cases and coordinate treatment of individuals suffering from the common combination of mental illness and substance abuse simultaneously. These clients participate in education and discussion-oriented groups designed to provide information regarding the psychiatric disorders that co-occur with chemical dependency.
We place a strong emphasis on tracking client satisfaction scores in order to measure our client and staff interaction and overall outcome and reputation. In addition to client satisfaction surveys that we receive after a client’s discharge, we also solicit feedback during a client’s stay at our residential facilities. This allows us to further tailor an individual’s treatment plan to emphasize the programs that have been more impactful and helpful to a particular client.
We believe in tracking clinical outcomes. We have entered into a partnership with Centerstone Research Institute to conduct independent three-year longitudinal outcome studies on the effectiveness of our clinical approach.
8
Facilities
We currently operate seven residential substance abuse treatment facilities and one outpatient substance abuse treatment facility. Our substance abuse treatment facilities are located throughout the United States staffed by seasoned professionals and experts in the fields of addiction and behavioral health who are committed to providing the care, support, education and hope needed to treat addiction. We also operate an obesity treatment center, FitRx. The following table presents information, as of March 1, 2015, about our network of substance abuse treatment facilities, including current facilities, a recently acquired property, facilities under development, and a facility and property under contract:
| | | | | | | | | | Real Property |
| | | | Capacity | | First Clients | | Treatment | | Leased / |
Facility Name(1) | | Location | | (beds) | | Served | | Certifications(2) | | Owned |
Desert Hope | | Las Vegas, NV | | 148 | | 2013 | | DTX, RTC, PHP, IOP | | Owned |
Greenhouse | | Grand Prairie, TX (Dallas area) | | 130(3) | | 2012 | | DTX, RTC, PHP, IOP | | Owned |
Forterus | | Temecula, CA | | 107(4) | | 2004 | | DTX, RTC, PHP, IOP | | Leased |
Singer Island | | West Palm Beach, FL | | 65 | | 2012 | | PHP, IOP | | Leased |
San Diego Addiction Treatment Center | | San Diego, CA | | 36 | | 2010 | | DTX, RTC, PHP, IOP | | Leased |
The Academy | | West Palm Beach, FL | | 18(5) | | 2012 | | PHP, IOP | | Leased |
Desert Hope Outpatient Center | | Las Vegas, NV | | n/a(6) | | 2015(6) | | PHP, IOP | | Owned |
Recovery First | | Fort Lauderdale, FL | | 56(7) | | 2015(7) | | DTX, RTC, PHP, IOP | | Leased/Owned |
Greenhouse Outpatient Center | | Arlington, TX (Dallas area) | | n/a(8) | | Under Development(8) | | PHP, IOP(8) | | Owned |
TBD | | Riverview, FL (Tampa area) | | 164(9) | | Under Development(9) | | DTX, RTC, PHP, IOP(9) | | Owned |
TBD | | Ringwood, NJ (New York City area) | | 150(10) | | Acquired(10) | | DTX, RTC, PHP, IOP(10) | | Owned |
TBD | | Greenville, Portsmouth and South Kingstown, Rhode Island | | n/a(11) | | Under Contract(11) | | IOP(11) | | Leased |
TBD | | Aliso Viejo, California | | Up to 124(12) | | Under Contract(12) | | TBD(12) | | Owned |
(1) | Excluded from this table is our non-substance abuse treatment facility, FitRx, which is a 20-bed leased facility located in Brentwood, Tennessee that provides outpatient treatment services for men and women who struggle with obesity-related behavioral disorders. |
(2) | DTX: Detoxification; RTC: Residential Treatment; PHP: Partial Hospitalization; IOP: Intensive Outpatient. |
(3) | This figure includes 60 additional beds as a result of the Greenhouse expansion completed in July 2014 with respect to which we received licensure in July 2014. |
(4) | In January 2015, we increased our capacity at Forterus to 107 beds with the addition of 31 beds, 24 of which are licensed for detoxification. |
(5) | This figure includes 6 additional beds as a result of The Academy expansion completed in September 2014. |
(6) | In May 2014, we acquired an approximately 20,000 square foot property in Las Vegas, Nevada. We began construction of an outpatient treatment facility at this location in July 2014, received licensure in January 2015 and immediately began serving clients. The facility provides outpatient treatment services and additional programming space for our Desert Hope facility. As this is an outpatient treatment facility, bed count is not applicable (n/a). |
(7) | On February 20, 2015, we completed the acquisition of Recovery First, a Florida-based provider of substance abuse treatment and rehabilitation services, for cash consideration of $13 million. Recovery First operates a 56-bed in-network, inpatient substance abuse treatment facility in the greater Fort Lauderdale, Florida area which includes 20 licensed detoxification beds. |
(8) | In March 2014, we acquired an approximately 20,000 square foot property in Arlington, Texas. We began construction of an outpatient treatment facility at this location in July 2014, and we are targeting opening this facility in the second quarter of 2015. The facility will provide outpatient treatment services and additional programming space for our Greenhouse facility. Treatment certifications reflect our expectations. As this is an outpatient treatment facility, bed count is not applicable (n/a). |
9
(9) | Reflects our current expectations with respect to this facility, on which we began construction in May 2014 and target opening in the fourth quarter of 2015. |
(10) | We had previously entered into a purchase agreement to acquire a 96 acre property located fewer than 50 miles from New York City. On February 24, 2015, we acquired the property and we anticipate beginning renovations and construction at this location in the second quarter of 2015. We are targeting opening this facility late in the second half of 2016 with approximately 150 beds. Treatment certifications reflect our expectations. |
(11) | On January 23, 2015, we entered into a definitive agreement to acquire CSRI, a provider of intensive outpatient substance abuse treatment services in Greenville, Portsmouth and South Kingstown, Rhode Island. We currently anticipate closing the acquisition in the second quarter of 2015. As this is an outpatient treatment facility, bed count is not applicable (n/a). |
(12) | On January 28, 2015, we entered into a definitive agreement to acquire an 84-bed hospital in Aliso Viejo, California which we currently anticipate closing during the second quarter of 2015. We expect to begin renovation and rehabilitation of the facility in the second quarter of 2015 and currently have a targeted completion date for the first half of 2016. With renovations and construction we expect that this facility will provide us with up to 124 beds and expect to apply for a license to operate this facility as a Chemical Dependency Recovery Hospital (“CDRH”). |
In addition, we currently lease approximately 21,800 square feet of office space in Brentwood, Tennessee for our corporate headquarters under a lease expiring in March 2017. Monthly rent under this lease is approximately $37,500 plus our proportionate share of certain taxes and the costs of operating and maintaining the premises. On January 6, 2015, we entered into an agreement to lease approximately 102,000 square feet of office space located in Brentwood, Tennessee for our corporate headquarters. The initial term of the lease will be for ten years from the date the premises are delivered to the Company with one option to extend the lease for five years. Monthly rent under this lease is expected to be approximately $195,473 per month plus our proportionate share of certain taxes and the costs of operating and maintaining the premises. We also lease approximately 11,000 square feet of laboratory space in Brentwood, Tennessee to perform quantitative drug testing and other laboratory services that support our treatment facilities.
Current Facilities
Each of our CARF accredited facilities provides a multidisciplinary approach to facilitate recovery from addiction by providing individuals with temporary homes for a long-term comprehensive program. We maintain premium facilities offering clients aesthetically pleasing properties and grounds, a comfortable environment, high quality and healthy food, numerous amenities and a courteous and attentive staff. We are committed to physical and nutritional wellness, and as part of this effort, we maintain advanced fitness facilities with instructors in several of our facilities and nutritious foods with menus approved by registered dietitians and nutritionists. A brief description of each of our facilities is provided below.
· | Desert Hope. Located in Las Vegas, Nevada, this facility has a bed capacity of 148, all of which are licensed for detoxification, and provides all levels of care to adults struggling with substance abuse and behavioral health issues. Desert Hope also offers a spirituality program developed by C.C. Nuckols, Eye Movement Desensitization and Reprocessing Therapy, art therapy, personal training, yoga sessions, a 12 step walk and other amenities in a luxurious setting. |
· | Desert Hope Outpatient Center. We acquired an approximately 20,000 square foot property in Las Vegas, Nevada in May 2014. We began construction of an outpatient treatment facility at this location in July 2014, received licensure in January 2015 and immediately began serving clients. The facility provides treatment services and additional programming space for our Desert Hope facility. |
· | Greenhouse. A former luxury spa in Dallas, Texas, this facility currently has a bed capacity of 130, all of which are licensed for detoxification. In July 2014, we completed the construction of an expansion to this facility, which added 60 beds and increased total bed count to 130 beds. Greenhouse provides all levels of care to adults struggling with substance abuse and behavioral health issues and also offers personal training, yoga sessions, massage therapy and other amenities. |
· | Forterus. Located in Temecula, California, this center has a 76 bed capacity, 24 of which are licensed for detoxification and provides services to adults at all levels of care. Forterus is our original treatment facility and has been operating since 2004. A core component of its clinical model is community integration. In January 2015, we increased the capacity to 107 beds with the addition of 31 beds, 24 of which are licensed for detoxification. |
· | Singer Island. Located in West Palm Beach, Florida, this facility has a 65 bed capacity and provides partial hospitalization and intensive outpatient services to adults struggling with substance abuse and behavioral health issues. Additional services include psychological testing, ongoing college and career services and an extended care program. |
· | San Diego Addiction Treatment Center. Located in San Diego, California, this facility has a 36 bed capacity, all of which are licensed for detoxification, for adult males requiring all levels of care. This facility also offers an individualized grief and loss track to clients. |
· | The Academy. Located in West Palm Beach, Florida, this facility has an 18 bed capacity and provides partial hospitalization and intensive outpatient services to adolescents (ages 13–17) struggling with substance abuse and behavioral health issues. |
10
| Additional services include equine therapy and a specialized curriculum focusing on peer relationships, family and academics. |
· | FitRx. Located in Brentwood, Tennessee, FitRx is a 20-bed program offering partial hospitalization and intensive outpatient services to adults who struggle with behavioral health disorders associated with obesity. FitRx’s programs emphasize behavioral, nutritional and physical wellness. |
· | Recovery First (greater Fort Lauderdale area). On February 20, 2015, we completed the acquisition of the assets of Recovery First, a Florida-based provider of substance abuse treatment and rehabilitation services, including a 56-bed inpatient substance abuse treatment facility in the greater Fort Lauderdale, Florida area, for cash consideration of $13 million. |
In addition to substance abuse, we believe several other addiction-related diseases represent large underserved markets. Additionally, the treatment model used at our residential facilities to treat substance abuse can also be applied to treat other compulsive behaviors.
New Property Developments and Acquisitions
A brief description of our facilities under development and a facility and property under contract is provided below.
· | Riverview, Florida (Tampa area). We acquired a former boarding school for youths and intend to develop the property into a facility that will provide all levels of care to clients struggling with substance abuse and behavioral health issues. We began construction of a residential treatment facility at this location in May 2014, and we are targeting opening this facility in the fourth quarter of 2015 with 164 licensed beds. |
· | Greenhouse Outpatient Center (Dallas area). In March 2014, we acquired an approximately 20,000 square foot property in Arlington, Texas. We began construction of an outpatient treatment facility at this location in July 2014, and we are targeting opening this facility in the second quarter of 2015. The facility will provide treatment services and additional programming space for our Greenhouse facility. |
· | Ringwood, New Jersey (New York City area). We had previously entered into a purchase agreement to acquire a former convent on 96 acres located fewer than 50 miles from New York City, with convenient access to LaGuardia and Newark airports. On February 24, 2015, we acquired the property and we anticipate beginning construction and renovations at this location in the second quarter of 2015. We are targeting opening this facility late in the second half of 2016 with approximately 150 beds. |
· | Aliso Viejo, California. On January 28, 2015, we entered into a definitive agreement to acquire an 84-bed hospital in Aliso Viejo, California which we currently anticipate closing during the second quarter of 2015. We expect to begin renovation and rehabilitation of the facility in the second quarter of 2015 and currently have a targeted completion date for the first half of 2016. With renovations and construction we expect that this facility will provide us with up to an additional 124 beds and expect to apply for a license to operate this facility as a Chemical Dependency Recovery Hospital (“CDRH”). |
· | Clinical Services of Rhode Island. On January 23, 2015, we entered into a definitive agreement to acquire CSRI, a provider of intensive outpatient substance abuse treatment services in Greenville, Portsmouth and South Kingstown, Rhode Island. We currently anticipate closing the acquisition in the second quarter of 2015. |
Sales and Marketing
Sales and marketing supports the development of our brand and advances our comprehensive lead-generation platform. Total sales and marketing spend was $29.0 million in 2014, compared to $24.3 million in 2013, driven by our program’s multi-faceted sales and marketing engine. The primary sources of our new clients include:
· | National Sales Force. We deploy and manage a sales force of over 40 representatives nationwide that focuses primarily on marketing to hospitals, other treatment facilities, employers, unions, alumni and employee assistance programs. In addition, our varied facilities located across the United States allow us to reach a broad audience of potential clients and their families and build a nationally recognized brand. This nationally branded, multi-channel approach has led to an increase in our number of admitted clients from 2,934 in 2012 to 4,728 in 2014, an increase of 61.1%. |
· | Recommendations by Alumni. We often receive new clients who were directly referred to our facilities by our alumni as well as their friends and families. As our national brand continues to grow and our business continues to increase, we believe our alumni will become an increasingly important source of business for us. |
· | Internet/TV/Print Advertising. Advertising through various media represents another important opportunity to obtain new clients as well as to develop our national brand. In September 2012, Mr. Cartwright released a motivational book titled Believable Hope: Five Essential Elements to Beat Any Addiction that chronicles his own personal journey overcoming addiction. Believable Hope represents a valuable marketing tool and serves as a key component to our clinical programming. |
11
| We maintain and run a series of television commercials that promote our facilities and overall capabilities. We also maintain a strong presence on the internet. We have made further advertising efforts in radio spots, newspaper articles, medical journals and other print media with the intent to build our integrated, national brand. |
· | Paid Calls and Clicks. We also pay to have potential clients directed to us via telephone or online in order to increase the size of our client and prospect database. Additionally, we are actively focused on obtaining website domain names to enhance our ability to reach additional potential clients based on user defined search terms. |
Call Center Operations
We maintain a 24 hours per day, seven days per week call center currently staffed by over 75 employees. Our centralized call center is situated at our corporate headquarters in Brentwood, Tennessee, and focuses on enrolling clients identified by our sales and marketing activities into new client admissions. As part of its role, the call center team conducts benefits verification and handles all communication with insurance companies, completes client assessments, begins the pre-certification process for treatment authorization, chooses the proper treatment facility for the client’s clinical and financial needs, and assists clients with arrangements and logistics.
Professional Groups
We are affiliated with a Professional Group in each of the five states in which we currently operate. These Professional Groups engage physicians and mid-level service providers and provide professional services to our clients through professional services agreements with each treatment facility. Under the professional services agreements, the Professional Groups also provide a physician to serve as medical director for the applicable facility. The Professional Groups either bill the payor for their services directly or are compensated by the treatment facility based on fair market value hourly rates. Each of the professional services agreements has a term of five years and will automatically renew for additional one year periods.
We provided the initial working capital funding in connection with the formation of the Professional Groups and recorded a receivable. We make additional advances to the Professional Groups during periods in which there is a shortfall between revenues collected by the Professional Group from the treatment facilities and payors, on the one hand, and the Professional Group’s contracting expenses and payroll requirements, on the other hand, thereby increasing the balance of the receivable. Excess cash flow of the Professional Groups is repaid to us, resulting in a decrease in the receivable. The Professional Groups are obligated to repay these funds and are charged commercially reasonable interest. Any receivables due to us from the Professional Groups are eliminated in the consolidation of the Professional Groups as variable interest entities.
AAC has entered into written management services agreements with each of the Professional Groups, under which AAC provides management and other administrative services to the Professional Groups. These services include billing, collection of accounts receivable, accounting, management and human resource functions and setting policies and procedures. Pursuant to the management services agreements, the Professional Groups’ monthly revenues will first be applied to the payment of operating expenses consisting of refunds or rebates owed to clients or payors, compensation expenses of the physicians and other service providers, lease payments, professional and liability insurance premiums and any other costs or expenses incurred by AAC for the benefit of the Professional Groups and, thereafter, to the payment to AAC of a management fee equal to 20% of the Professional Groups’ gross collected monthly revenues. As described above, AAC will also provide financial support to each Professional Group on an as-needed basis to cover any shortfall between revenues collected by the Professional Group from the treatment facilities and payors and the Professional Group’s contracting expenses and payroll requirements. Through these arrangements, we are directing the activities that most significantly impact the financial results of the respective Professional Groups; however, treatment decisions are made solely by licensed healthcare professionals employed or engaged by the Professional Groups as required by various state laws. Based on our ability to direct the activities that most significantly impact the financial results of the Professional Groups, provide necessary funding and the obligation and likelihood of absorbing all expected gains and losses, we have determined that we are the primary beneficiary and, therefore, consolidate the five Professional Groups as variable interest entities.
Competition
We believe we are one of the largest for-profit companies focused on substance abuse treatment in the United States. According to IBISWorld, approximately 77% of all substance abuse treatment clinics in the United States have a single location, and approximately 44% of all substance abuse treatment facilities have fewer than 20 employees. Many of the largest for-profit addiction treatment providers operate in the broader behavioral healthcare sector without focusing primarily on substance abuse. We believe our size and core focus on substance abuse treatment provide us with an advantage over competitors in terms of building our brand and marketing our platform to potential clients.
The market for mental health and substance abuse treatment facilities is highly fragmented with approximately 16,700 different facilities providing services to the adult and adolescent population, of which only 33% are operated by for-profit organizations. Our
12
residential treatment facilities compete with several national competitors and many regional and local competitors. Some of our competitors are government entities and supported by tax revenues, and others are non-profit entities that are primarily supported by endowments and charitable contributions. We do not receive financial support from these sources. Some larger companies in our industry, including Acadia Healthcare Company, Inc. and its subsidiary CRC Health Corp., compete with us on a national scale and offer substance abuse treatment services among other behavioral healthcare services. To a lesser extent, we also compete with other providers of substance abuse treatment services, including other inpatient behavioral healthcare facilities and general acute care hospitals.
We believe the primary competitive factors affecting our business include:
· | quality of clinical programs and services; |
· | reputation and brand recognition; |
· | overall aesthetics of the facilities; |
· | amenities offered to clients; and |
· | relationships with payors and referral sources. |
Sources of Revenue
Our revenues primarily consist of service charges related to providing addiction and behavioral health treatment and other ancillary services associated with serving our clients, such as the collection and laboratory testing of urine for controlled substances. For the year ended December 31, 2013 and 2014, approximately 90% of our revenues were reimbursable by commercial payors, including amounts paid by such payors to clients, with the remaining portion payable directly by our clients.
For the year ended December 31, 2014, approximately 18.1% of our revenue reimbursements came from Anthem Blue Cross Blue Shield of Colorado, 13.3% came from Blue Cross Blue Shield of Texas, 12.9% came from Aetna, 10.5% came from Blue Cross Blue Shield of California, and 10.5% came from United Behavioral Health. No other payor accounted for more than 10% of our revenue reimbursements for the year ended December 31, 2014. For the year ended December 31, 2013, approximately 12.3% of our revenue reimbursements came from Blue Cross Blue Shield of California, 12.1% came from Aetna and 10.3% came from United Behavioral Health. No other payor accounted for more than 10% of our revenue reimbursements for the year ended December 31, 2013.
Regulatory Matters
Overview
Substance abuse treatment providers are regulated extensively at the federal, state and local levels. In order to operate our business and obtain reimbursement from third-party payors, we must obtain and maintain a variety of licenses, permits, certifications and accreditations. We must also comply with numerous other laws and regulations applicable to the conduct of business by substance abuse treatment providers. Our facilities are also subject to periodic on-site inspections by the agencies that regulate and accredit them in order to determine our compliance with applicable requirements.
The laws and regulations that affect substance abuse treatment providers are complex, change frequently and require that we regularly review our organization and operations and make changes as necessary to comply with changes in the law or new interpretations of laws or regulations. Significant public attention has focused in recent years on the healthcare industry, directing attention not only to the conduct of industry participants but also to the cost of healthcare services. In recent years, there have been heightened coordinated civil and criminal enforcement efforts relating to the healthcare industry by both federal and state government agencies. The ongoing investigations relate to, among other things, various referral practices, cost reporting, billing practices, credit balances, physician ownership and joint ventures involving hospitals and other healthcare providers. We expect that healthcare costs and other factors will continue to encourage both the development of new laws and regulations and increased enforcement activity.
We believe we are in substantial compliance with all applicable laws and regulations and are not aware of any material pending or threatened investigations involving allegations of wrongdoing. While no such regulatory inquiries have been made, compliance with such laws and regulations can be subject to future government review and interpretation, as well as significant regulatory action including fines, penalties and exclusion from government health programs.
Licensure, Accreditation and Certification
All of our substance abuse treatment facilities are licensed under applicable state laws where licensure is required. Licensing requirements typically vary significantly depending upon the state in which a facility is located and the types of services provided. The types of licensed services that our facilities provide include intensive outpatient, community housing, adult residential, outpatient
13
treatment, partial hospitalization and medical detoxification. In addition, our employed case managers, therapists and medical technicians may be subject to individual state license requirements.
Our Desert Hope facility is, and any future facilities that store and dispense controlled substances will be, required to register with the U.S. Drug Enforcement Administration, or DEA, and abide by DEA regulations regarding controlled substances. Finally, each of our treatment facilities has a certificate under the Clinical Laboratory Improvement Amendments of 1988, or CLIA, to conduct urinalysis screening for its clients.
Each of our substance abuse treatment facilities has obtained accreditation from CARF, which is the primary accreditation body in the substance abuse treatment industry. CARF accredits behavioral health organizations providing mental health and alcohol and drug use and addiction treatment services, as well as opiate treatment programs, and many other types of programs. This type of accreditation program is intended to improve the quality, safety, outcomes and value of healthcare services provided by accredited facilities. CARF requires an initial application and completion of on-site surveys demonstrating compliance with accreditation requirements. Accreditation is granted for a specified period, typically ranging from one to three years, and renewals of accreditation require completion of a renewal application and an on-site renewal survey.
We believe that all of our facilities and programs are in substantial compliance with current applicable state and local licensure, certification and accreditation requirements. In addition, we believe all of our facilities are in substantial compliance with the standards of CARF. Periodically, state and local regulatory agencies as well as accreditation entities conduct surveys of our facilities and may find from time to time that a facility is not in full compliance with all of the accreditation standards. Upon receipt of any such finding, the facility timely submits a plan of correction and corrects any cited deficiencies.
Fraud, Abuse and Self-Referral Laws
We do not currently bill or accept payments from Medicare or Medicaid. Therefore, we are generally not impacted by the anti-kickback provisions of the Social Security Act, and our operations are not subject to the federal prohibition on physician self-referrals, commonly referred to as the Stark Law. However, many states have passed anti-kickback statutes and physician self-referral prohibitions similar to the federal statutes and regulations. These state laws are often drafted broadly to cover all payors (i.e., not restricted to Medicare and other federal healthcare programs) and often lack interpretative guidance. A violation of these laws could result in a prohibition on billing payors for such services, result in civil or criminal penalties and could adversely affect the state license of any program or facility found to be in violation.
Federal prosecutors have broad authority to prosecute healthcare fraud even when federal healthcare programs are not involved. For example, federal law criminalizes the knowing and willful execution or attempted execution of a scheme or artifice to defraud any healthcare benefit program as well as obtaining by false pretenses any money or property owned by any healthcare benefit program. Federal law also prohibits embezzlement of healthcare funds, false statements relating to healthcare and obstruction of the investigation of criminal offenses. All of these federal criminal offenses are enforceable regardless of whether an entity or individual participates in the Medicare program or any other federal healthcare program.
False Claims
We are subject to state and federal laws that govern the submission of claims for reimbursement. These laws generally prohibit an individual or entity from knowingly and willfully presenting a claim (or causing a claim to be presented) for payment from Medicare, Medicaid or other third-party payors that is false or fraudulent. The standard for “knowing and willful” often includes conduct that amounts to a reckless disregard for whether accurate information is presented by claims processors. Penalties under these statutes include substantial civil and criminal fines, exclusion from the Medicare program and imprisonment.
One of the most prominent of these laws is the federal False Claims Act, or FCA, which may be enforced by the federal government directly or by a qui tam plaintiff (or whistleblower) on the government’s behalf. When a private plaintiff brings a qui tam action under the FCA, the defendant often will not be made aware of the lawsuit until the government commences its own investigation or determines whether it will intervene. When a defendant is determined by a court of law to be liable under the FCA, the defendant may be required to pay three times the amount of the alleged false claim, plus mandatory civil penalties of between $5,500 and $11,000 for each separate false claim.
Many states have passed false claims acts similar to the FCA. Under these laws, the government may impose a penalty and recover damages, often treble damages, for knowingly submitting or participating in the submission of claims for payment that are false or fraudulent or which contain false or misleading information. These laws may be limited to specific programs (such as state workers’ compensation programs) or may apply to all payors. In many cases, alleged violations of these laws may be brought by a whistleblower who may be an employee, a referring physician, a competitor, a client or other individual or entity, and who may be eligible for a portion of any recovery. Further, like the federal law, state false claims act laws generally protect employed whistleblowers from retribution by their employers.
14
Although we believe that we have procedures in place to ensure the accurate completion of claims forms and requests for payment, the laws, regulations and standards defining proper billing, coding and claim submission are complex and have not been subjected to extensive judicial or agency interpretation. Billing errors can occur despite our best efforts to prevent or correct them, and we cannot assure you that the government or a payor will regard such errors as inadvertent and not in violation of the applicable false claims act laws or related statutes.
Privacy and Security Requirements
There are numerous federal and state regulations that address the privacy and security of client health information. In particular, federal regulations issued under the Drug Abuse Prevention, Treatment and Rehabilitation Act of 1979 strictly restrict the disclosure of client identifiable information related to substance abuse and apply to any of our facilities that receive any federal assistance, which is interpreted broadly to include facilities licensed, certified or registered by a federal agency. Further, the HIPAA privacy and security regulations extensively regulate the use and disclosure of individually identifiable health information (known as “protected health information”) and require covered entities, which include most health providers, to implement and maintain administrative, physical and technical safeguards to protect the security of such information. Additional security requirements apply to electronic protected health information. These regulations also provide clients with substantive rights with respect to their health information.
The HIPAA privacy and security regulations also require our substance abuse treatment programs and facilities to impose compliance obligations by written agreement on certain contractors to whom our programs disclose client information known as “business associates.” Covered entities may be subject to penalties as a result of a business associate violating HIPAA if the business associate is found to be an agent of the covered entity. Business associates are also directly subject to liability under the HIPAA privacy and security regulations. In instances where our programs act as a business associate to a covered entity, there is the potential for additional liability beyond the program’s covered entity status.
Covered entities must report breaches of unsecured protected health information to affected individuals without unreasonable delay but not to exceed 60 days of discovery of the breach by a covered entity or its agents. Notification must also be made to the U.S. Department of Health and Human Services, or HHS, and, in certain situations involving large breaches, to the media. HHS is required to publish on its website a list of all covered entities that report a breach involving more than 500 individuals. All non-permitted uses or disclosures of unsecured protected health information are presumed to be breaches unless the covered entity or business associate establishes that there is a low probability the information has been compromised. Various state laws and regulations may also require us to notify affected individuals in the event of a data breach involving individually identifiable information without regard to whether there is a low probability of the information being compromised.
Violations of the HIPAA privacy and security regulations may result in civil penalties of up to $50,000 per violation for a maximum civil penalty of $1,500,000 in a calendar year for violations of the same requirement. HIPAA also provides for criminal penalties of up to $250,000 and ten years in prison, with the severest penalties for obtaining or disclosing protected health information with the intent to sell, transfer or use such information for commercial advantage, personal gain or malicious harm. In addition, state attorneys general may bring civil actions seeking either injunction or damages in response to violations of the HIPAA privacy and security regulations that threaten the privacy of state residents. HHS is required to impose penalties for violations resulting from willful neglect, is required to perform compliance audits and has announced its intent to perform audits in 2015.
Our programs remain subject to any privacy-related federal or state laws that are more restrictive than the HIPAA privacy and security regulations. These laws vary by state and could impose additional requirements and penalties. For example, some states impose strict restrictions on the use and disclosure of health information pertaining to mental health or substance abuse treatment. The Federal Trade Commission also uses its consumer protection authority to initiate enforcement actions in response to data breaches or other privacy or security lapses.
We enforce a health information privacy and security compliance plan, which we believe complies with the HIPAA privacy and security regulations and other applicable requirements. Compliance with federal and state privacy and security requirements has required and will continue to require us to expend significant resources.
Mental Health Parity Legislation and the Affordable Care Act
The regulatory framework in which we operate is constantly changing. Both the Mental Health Parity and Addiction Equity Act of 2008, or MHPAEA, and the Patient Protection and Affordable Care Act, as amended by the Health Care and Education Reconciliation Act of 2010, or Affordable Care Act, may require that we make operational changes to comply with such laws and regulations. The MHPAEA is a federal parity legislation that requires large group health insurance plans that offer mental health and addiction coverage to provide that coverage on par with financial and treatment coverage offered for other illnesses. Health plans that do not already cover mental health treatments will not be required to do so, and health plans are not required to provide coverage for every mental health condition published in the Diagnostic and Statistical Manual of Mental Disorders by the American Psychiatric Association. The MHPAEA also contains a cost exemption that operates to exempt a group health plan from the MHPAEA’s
15
requirements if compliance with the MHPAEA becomes too costly. HHS issued final rules in November 2013 implementing MHPAEA.
The Affordable Care Act poses both opportunities and risks for us. The Affordable Care Act represents significant change to the healthcare industry, including reforming the health insurance market, adopting a number of payment reform measures, attempting to reduce the overall growth rate of healthcare spending, strengthening fraud and abuse enforcement as well as adopting numerous specific provisions applicable to individual segments of the healthcare industry. The impact of the Affordable Care Act on each of our programs may vary. Further, its overall impact is difficult to determine because of uncertainty around a number of factors, including issues around the timing and manner of implementation of certain provisions not yet in effect, the possibility of amendment, repeal or judicial modification, and our inability to predict how individuals, employers, health plans and providers will react to the requirements of the Affordable Care Act.
We believe that one enduring effect of the Affordable Care Act has been an increase in payment reform efforts by federal and state government payors and commercial payors. These efforts take many forms including the growth of ACOs, pay-for-performance bonus arrangements, partial capitation arrangements and the bundling of services into a single payment. The result of these efforts is that more risk of the overall cost of care is being transferred to providers. As institutional providers and their affiliated physicians assume more risk for the cost of care, we expect more services to be furnished within provider networks formed to accept these types of payment reforms. Our ability to compete and retain our traditional sources of clients may be adversely affected by our exclusion from such networks or our inability to be included in such networks.
Overall, the expansion of health insurance coverage under the Affordable Care Act is expected to be beneficial to the substance abuse treatment industry. Health insurers are prohibited from denying coverage to individuals because of preexisting conditions. Further, all new small group and individual market health plans must cover ten essential health benefit categories, which include mental health and substance abuse disorder services. Likewise, the Affordable Care Act requires small group and individual market plans to comply with the requirements of MHPAEA. According to 2013 HHS estimates, these changes will ensure coverage for mental health and substance abuse disorders for 62.5 million Americans.
It is estimated that only 10.8% of those suffering with substance abuse disorders actually seek treatment. Accordingly, the expansion of commercial insurance for substance abuse treatment services may result in a higher demand for services from all providers. It is also likely to bring new competitors to the market, some of which may be better capitalized and have greater market penetration than we do. Further, we expect increased demand for substance abuse treatment services to also increase the demand for case managers, therapists, medical technicians and others with clinical expertise in substance abuse treatment that may make it both more difficult to adequately staff our substance abuse treatment facilities and could significantly increase our costs in delivering treatment, which may adversely affect both our operations and profitability. This increased demand may be tempered somewhat by another provision of the Affordable Care Act that budgets $25 million in grants and assistance to increase the number of mental health and behavioral health professionals.
CLIA and State Lab Licensure
In addition to the testing performed at our laboratory facility, each of our treatment facilities conducts CLIA waived urine drug testing and possesses a federal certification under CLIA and, where necessary, applicable state and local licenses. Under CLIA, we are required to hold a certificate applicable to the type of clinical laboratory tests that we perform, which require compliance with certain CLIA-imposed standards based upon the relative complexity of the level of testing that we are actually performing. CLIA regulates clinical laboratory testing by requiring that laboratories be certified by the federal government and comply with various operational, personnel, facilities administration, quality and proficiency requirements intended to ensure that laboratory testing services are accurate, reliable and timely. CLIA does not preempt state laws that are more stringent than federal law.
Pursuant to CLIA, a review is required to renew the certificates every two years. Additionally, we are regularly subject to survey and inspection to assess compliance with program standards and may be subject to additional random inspections. Standards for testing under CLIA are based on the level of complexity of the tests performed by the laboratory. Laboratories performing high complexity testing are required to meet more stringent requirements than laboratories performing less complex tests. Our treatment facilities currently are certified for waiver testing because they only furnish urinalysis, a low complexity test. Our laboratory facility currently is certified for complex testing.
In addition to CLIA requirements, we are subject to various state laws. CLIA provides that a state may adopt laboratory regulations that are more stringent than those under federal law, and a number of states, including California and other states in which we operate, have implemented their own laboratory regulatory requirements. State laws may require that laboratory personnel meet certain qualifications, specify certain quality controls or prescribe record maintenance requirements.
Additionally, many state licensure laws require a laboratory that solicits or tests specimens collected from individuals within that state to hold a license from that state, even if the testing occurs in another state. In particular, California, Florida and New Jersey require out-of-state laboratories to hold state licenses.
16
Health Planning and Certificates of Need
The construction of new healthcare facilities, the expansion, transfer or change of ownership of existing facilities and the addition of new beds, services or equipment may be subject to state laws that require prior approval by state regulatory agencies under certificate of need (“CON”) laws. These laws generally require that a state agency determine the public need for construction or acquisition of facilities or the addition of new services. Review of CONs and other healthcare planning initiatives may be lengthy and may require public hearings. Violations of these state laws may result in the imposition of civil sanctions or revocation of a facility’s license. Currently, no states in which we operate have certificate of need requirements for substance abuse treatment centers applicable to our facilities.
Other State Healthcare Laws
Most states have a variety of laws that may potentially impact our operations and business practices. For instance, many states in which our programs operate prohibit corporations (and other legal entities) from practicing medicine by employing physicians and certain non-physician practitioners. These prohibitions on the corporate practice of medicine impact how our programs structure their relationships with physicians and other affected non-physician practitioners. These arrangements, however, have typically not been vetted by either a court or the affected regulatory body.
Similarly, many states prohibit physicians from sharing a portion of their professional fees with any other person or entity. These so-called fee-splitting prohibitions range from prohibiting arrangements resembling a kickback to broadly prohibiting percentage-based compensation and other variable compensation arrangements with physicians.
If our arrangements with physicians were found to violate a corporate practice of medicine prohibition or a state fee-splitting prohibition, our contractual arrangements with physicians in such states could be adversely affected, which, in turn, may adversely affect both our operations and profitability. Further, we could face sanctions for aiding and abetting the violation of the state’s medical practice act.
Local Land Use and Zoning
Municipal and other local governments also may regulate our treatment programs. Many of our facilities must comply with zoning and land use requirements in order to operate and many of our de novo acquisition targets will be contingent upon zoning and land use approvals. For example, local zoning authorities regulate not only the physical properties of a healthcare facility, such as its height and size, but also the location and activities of the facility. In addition, community or political objections to the placement of treatment facilities can result in delays in the land use permit process and may prevent the operation of facilities in certain areas.
Risk Management and Insurance
The healthcare industry in general continues to experience an increase in the frequency and severity of litigation and claims. As is typical in the healthcare industry, we could be subject to claims that our services have resulted in injury to our clients or had other adverse effects. In addition, resident, visitor and employee injuries could also subject us to the risk of litigation. While we believe that quality care is provided to our clients and that we substantially comply with all applicable regulatory requirements, an adverse determination in a legal proceeding or government investigation could have a material adverse effect on our financial condition.
We maintain commercial insurance coverage on an occurrence basis for general and professional liability claims with no deductible, a primary $1 million per claim limit and an annual aggregate primary limit of $3 million with umbrella coverage for an additional $20 million limit.
Compliance Programs
Compliance with government rules and regulations is a significant concern throughout our industry, in part due to evolving interpretations of these rules and regulations. We seek to conduct our business in compliance with all statutes and regulations applicable to our operations. To this end, we have established an informal compliance program that reviews for regulatory compliance procedures, policies and facilities throughout our business. Our executive management team is responsible for the oversight and operation of our compliance program. We provide periodic and comprehensive training programs to our personnel, which are intended to promote the strict observance of our policies designed to ensure compliance with the statutes and regulations applicable to us.
Environmental Matters
We are subject to various federal, state and local environmental laws that: (i) regulate certain activities and operations that may have environmental or health and safety effects, such as the handling, storage, transportation, treatment and disposal of medical and pharmaceutical waste products generated at our facilities, the presence of other hazardous substances in the indoor environment and
17
protection of the environment and natural resources in connection with the development or construction of our facilities; (ii) impose liability for costs of cleaning up, and damages to natural resources from, past spills, waste disposals on and off-site or other releases of hazardous materials or regulated substances; and (iii) regulate workplace safety. Some of our facilities generate infectious or other hazardous medical waste due to the illness or physical condition of our clients. The management of infectious medical waste is subject to regulation under various federal, state and local environmental laws, which establish management requirements for such waste. These requirements include record-keeping, notice and reporting obligations. Management believes that our operations are generally in compliance with environmental and health and safety regulatory requirements or that any non-compliance will not result in a material liability or cost to achieve compliance. Historically, the costs of achieving and maintaining compliance with environmental laws and regulations at our facilities have not been material. However, we cannot assure you that future costs and expenses required for us to comply with any new, or changes in existing, environmental and health and safety laws and regulations or new or discovered environmental conditions will not have a material adverse effect on our business, financial condition or results of operations.
Employees
As of December 31, 2014, we employed approximately 880 people, consisting of approximately 760 full-time employees and 120 part-time employees. None of our employees are represented by a labor union or covered by a collective bargaining agreement. We believe that our employee relations are good.
Available Information
We file certain reports with the Securities and Exchange Commission (the “SEC”), including annual reports on Form 10-K, quarterly reports on Form 10-Q and current reports on Form 8-K. The public may read and copy any materials we file with the SEC at the SEC’s Public Reference Room at 100 F Street, N.E., Washington, DC 20549. The public may obtain information on the operation of the Public Reference Room by calling the SEC at 1-800-SEC-0330. We are an electronic filer, and the SEC maintains an Internet site at http://www.sec.gov that contains the reports, proxy and information statements and other information we file electronically. Our website address is www.americanaddictioncenters.org. We make available free of charge, through our website, our annual report on Form 10-K, quarterly reports on Form 10-Q, current reports on Form 8-K and all amendments to those reports filed or furnished pursuant to Section 13 or 15(d) of the Securities Exchange Act of 1934, as amended, or the Exchange Act, as soon as reasonably practicable after such material is electronically filed with or furnished to the SEC. Our website and the information contained therein or linked thereto are not intended to be incorporated into this Annual Report on Form 10-K.
Item 1A. Risk Factors
Our actual operating results may differ materially from those described in forward-looking statements as a result of various factors, including but not limited to, those described below. You should carefully consider the following risk factors in addition to the other information included in this Annual Report on Form 10-K.
Risks Related to Our Business
Our revenues, profitability and cash flows could be materially adversely affected if we are unable to operate certain key treatment facilities, our corporate office or our laboratory facility.
We derive a significant portion of our revenues from three treatment facilities located in California, Nevada and Texas. These treatment facilities accounted for 79.4% of our total revenues in 2014 and 76.5% in 2013. It is likely that a small number of facilities will continue to contribute a significant portion of our total revenues in any given year for the foreseeable future. Additionally, we have a centralized corporate office that houses our accounting, billing and collections, information technology, marketing and call center departments and a high complexity laboratory facility that conducts quantitative drug testing and other laboratory services. If any event occurs that would result in a complete or partial shutdown of any of these facilities or our centralized corporate office or laboratory, including, without limitation, any material changes in legislative, regulatory, economic, environmental or competitive conditions in these states or natural disasters such as hurricanes, earthquakes, tornadoes or floods or prolonged airline disruptions for any reason, such event could lead to decreased revenues and/or higher operating costs, which could have a material adverse effect on our revenues, profitability and cash flows.
We rely on our multi-faceted sales and marketing program to continuously attract and enroll clients to our network of facilities. Any disruption in our national sales and marketing program would have a material adverse effect on our business, financial condition and results of operations.
We believe our national sales and marketing program provides us with a competitive advantage compared to treatment facilities that primarily target local geographic areas and use fewer marketing channels to attract clients. If any disruption occurs in our national sales and marketing program for any reason or if we are unable to effectively attract and enroll new clients to our network of facilities,
18
our ability to maintain census could be adversely affected, which would have a material adverse effect on our business, financial condition and results of operations.
In addition, our ability to grow or even to maintain our existing level of business depends significantly on our ability to establish and maintain close working and referral relationships with hospitals, other treatment facilities, employers, alumni, employee assistance programs and other referral sources. We have no binding commitments with any of these referral sources. We may not be able to maintain our existing referral relationships or develop and maintain new relationships in existing or new markets. If we lose existing relationships with our referral sources, the number of people to whom we provide services may decline, which may adversely affect our revenues. Also, if we fail to develop new referral relationships, our growth may be restrained.
We derive a significant portion of our revenues from providing services to clients covered by third-party payors who could reduce their reimbursement rates or otherwise restrain our ability to obtain, or provide services to, clients. This risk is heightened because we are generally an “out-of-network” provider.
Managed care organizations and other third-party payors pay for the services that we provide to many of our clients. For 2014 and 2013, approximately 90% of our revenues were reimbursable by third-party payors, including amounts paid by such payors to clients, with the remaining portion payable directly by our clients. If any of these third-party payors reduce their reimbursement rates or elect not to cover some or all of our services, our business, financial condition and results of operations may be materially adversely affected.
In addition to limiting the amounts payors will pay for the services we provide to their members, controls imposed by third-party payors designed to reduce admissions and the length of stay for clients, commonly referred to as “utilization review,” have affected and are expected to continue to affect our facilities. Utilization review entails the review of the admission and course of treatment of a client by third-party payors. Inpatient utilization, average lengths of stay and occupancy rates continue to be negatively affected by payor-required preadmission authorization and utilization review and by payor pressure to maximize outpatient and alternative healthcare delivery services for less acutely ill clients. Efforts to impose more stringent cost controls are expected to continue. Although we are unable to predict the effect these controls and changes will have on our operations, significant limits on the scope of services reimbursed and on reimbursement rates and fees could have a material adverse effect on our business, financial condition and results of operations.
Changes to government healthcare programs, principally Medicare and Medicaid, have resulted in limitations on reimbursement and, in some cases, reduced levels of reimbursement for healthcare services in recent years. In particular, recent governmental measures to regulate clinical laboratory services have resulted in reduced prices, added costs and decreased test utilization. Although we do not currently bill Medicare or Medicaid for our laboratory or other substance abuse treatment services, there is a risk that third-party commercial payors may implement similar changes. If the rates paid or the scope of laboratory or other substance abuse treatment services covered by third-party commercial payors are reduced, our business, financial condition and results of operations could be materially adversely affected.
We are considered an “out-of-network” provider with respect to the vast majority of third-party payors, and, therefore, we bill our full charges for services covered by such third-party payors. Third-party payors will generally attempt to limit use of out-of-network providers by requiring clients to pay higher copayment and/or deductible amounts for out-of-network care. Additionally, third-party payors have become increasingly aggressive in attempting to minimize the use of out-of-network providers by disregarding the assignment of payment from clients to out-of-network providers (i.e., sending payments to clients instead of out-of-network providers), capping out-of-network benefits payable to clients, waiving out-of-pocket payment amounts and initiating litigation against out-of-network providers for interference with contractual relationships, insurance fraud and violation of state licensing and consumer protection laws. If third-party payors impose further restrictions on out-of-network providers, our revenues could be threatened, forcing our facilities to participate with third-party payors and accept lower reimbursement rates compared to our historic reimbursement rates.
Third-party payors also are entering into sole source contracts with some healthcare providers, which could effectively limit our pool of potential clients. Moreover, third-party payors are beginning to carve out specific services, including substance abuse treatment and behavioral health services, and establish small, specialized networks of providers for such services at fixed reimbursement rates. Continued growth in the use of carve-out arrangements could materially adversely affect our business to the extent we are not selected to participate in such smaller specialized networks or if the reimbursement rate is not adequate to cover the cost of providing the service.
An increase in uninsured and underinsured clients or the deterioration in the collectability of the accounts of such clients could have a material adverse effect on our business, financial condition and results of operations.
Collection of receivables from third-party payors and clients is critical to our operating performance. Our primary collection risks are (i) the risk of overestimating our net revenues at the time of billing that may result in us receiving less than the recorded
19
receivable, (ii) the risk of non-payment as a result of commercial insurance companies denying claims, (iii) the risk that clients will fail to remit insurance payments to us when the commercial insurance company pays out-of-network claims directly to the client, (iv) resource and capacity constraints that may prevent us from handling the volume of billing and collection issues in a timely manner and (v) the risk of non-payment from uninsured clients. Additionally, our ability to hire and retain experienced personnel also affects our ability to bill and collect accounts in a timely manner. We establish our provision for doubtful accounts based on the aging of the receivables and taking into consideration historical collection experience by facility, services provided, payor source and historical reimbursement rate, current economic trends and percentages applied to the accounts receivable aging categories. At December 31, 2014 and 2013, our allowance for doubtful accounts represented approximately 22.8% and 35.2%, respectively, of our accounts receivable balance as of such date, with three commercial payors each representing in excess of 10% of the accounts receivable balance as of December 31, 2013 and 2014. We routinely review accounts receivable balances in conjunction with these factors and other economic conditions that might ultimately affect the collectability of the client accounts and make adjustments to our allowances as warranted. Significant changes in business operations, payor mix or economic conditions, including changes resulting from implementation of the Affordable Care Act, could affect our collection of accounts receivable, cash flows and results of operations. In addition, increased client concentration in states that permit commercial insurance companies to pay out-of-network claims directly to the client instead of us, such as California and Nevada, will adversely affect our collection of receivables. If we experience unexpected increases in the growth of uninsured and underinsured clients or in our provision for doubtful accounts or unexpected changes in reimbursement rates by third-party payors, it could have a material adverse effect on our business, financial condition and results of operations.
If we overestimate the reimbursement amounts that payors will pay us for services performed, it would increase our revenue adjustments, which could have a material adverse effect on our revenues, profitability and cash flows and lead to significant shifts in our results of operations from quarter to quarter that may make it difficult to project long-term performance.
We recognize revenues from commercial payors at the time services are provided based on our estimate of the amount that payors will pay us for the services performed. We estimate the net realizable value of revenues by adjusting gross client charges using our expected realization and applying this discount to gross client charges. Through December 31, 2013, our expected realization was determined by management after taking into account historical collections received from the commercial payors since our inception compared to the gross client charges billed. Beginning in January 2014, we enhanced the methodology related to our net realizable value to more quickly react to potential changes in reimbursements by facility, by type of service and by payor. As a result, management adjusted the expected realization discount, on a per facility basis, to reflect a twelve-month historical analysis of reimbursement data by facility in addition to considering the type of services provided, the payors and the gross client charge rates by facility. This adjustment resulted in a decrease in our expected realization for the first half of 2014. A significant or sustained decrease in our collection rates could have a material adverse effect on our operating results. There is no assurance that we will be able to maintain or improve historical collection rates in future reporting periods.
Estimates of net realizable value are subject to significant judgment and approximation by management. It is possible that actual results could differ from the historical estimates management has used to help determine the net realizable value of revenues. If our actual collections either exceed or are less than the net realizable value estimates, we will record a revenue adjustment, either positive or negative, for the difference between our estimate of the receivable and the amount actually collected in the reporting period in which the collection occurred. A significant negative revenue adjustment could have a material adverse effect on our revenues, profitability and cash flows in the reporting period in which such adjustment is recorded. In addition, if we record a significant revenue adjustment, either positive or negative, in any given reporting period, it may lead to significant shifts in our results from operations from quarter to quarter, which may limit our ability to make accurate long-term predictions about our future performance.
Certain third-party payors account for a significant portion of our revenues, and the reduction of reimbursement rates or coverage of services by any such payor could have a material adverse effect on our revenues, profitability and cash flows.
For the year ended December 31, 2014, approximately 18.1% of our revenue reimbursements came from Anthem Blue Cross Blue Shield of Colorado, 13.3% came from Blue Cross Blue Shield of Texas, 12.9% came from Aetna, 10.5% came from Blue Cross Blue Shield of California, and 10.5% came from United Behavioral Health. No other payor accounted for more than 10% of our revenue reimbursements for the year ended December 31, 2014. For the year ended December 31, 2013, approximately 12.3% of our revenue reimbursements came from Blue Cross Blue Shield of California, 12.1% came from Aetna, and 10.3% came from United Behavioral Health. No other payor accounted for more than 10% of our revenue reimbursements for the year ended December 31, 2013. If any of these or other third-party payors reduce their reimbursement rates for the services we provide or otherwise implement measures, such as specialized networks, that reduce the payments we receive, our revenues, profitability and cash flows could be materially adversely affected.
20
Our level of indebtedness could adversely affect our ability to meet our obligations under our indebtedness, react to changes in the economy or our industry and to raise additional capital to fund our operations.
As of December 31, 2014, we had total debt of $28.6 million outstanding. We have historically relied on debt financing to fund our real estate development and our operating cash flow requirements, and we expect such debt financing needs to continue. A summary of the material terms of our indebtedness can be found in “Management’s Discussion and Analysis of Financial Condition and Results of Operations—Liquidity and Capital Resources.” Our level of indebtedness could have important consequences to our stockholders. For example, it could:
· | make it more difficult for us to satisfy our obligations with respect to our indebtedness, resulting in possible defaults on, and acceleration of, such indebtedness; |
· | increase our vulnerability to general adverse economic and industry conditions; |
· | require us to dedicate a substantial portion of our cash flows from operations to payments on indebtedness, thereby reducing the availability of such cash flows to fund working capital, capital expenditures and other general corporate requirements or to carry out other aspects of our business; |
· | limit our ability to obtain additional financing to fund future working capital, capital expenditures and other general corporate requirements or to carry out other aspects of our business; |
· | limit our ability to make material acquisitions or take advantage of business opportunities that may arise; and |
· | place us at a potential competitive disadvantage compared to our competitors that have less debt. |
Our operating flexibility is limited in significant respects by the restrictive covenants in our amended and restated credit facility, and we have breached such covenants in the past and may be unable to comply with such covenants in the future.
Our 2015 Credit Facility (as later defined) imposes restrictions that could impede our ability to enter into certain corporate transactions, as well as increases our vulnerability to adverse economic and industry conditions, by limiting our flexibility in planning for, and reacting to, changes in our business and industry. These restrictions limit our and our subsidiaries’ ability to, among other things:
· | incur or guarantee additional debt; |
· | pay dividends on our capital stock or redeem, repurchase, retire or otherwise acquire any of our capital stock; |
· | make certain capital expenditures; |
· | make certain payments or investments; |
· | create liens on our assets; |
· | make any substantial change in the nature of our business as it is currently conducted; and |
· | merge or consolidate with other companies or transfer all or substantially all of our assets. |
In addition, our 2015 Credit Facility requires us to meet certain financial covenants. The restrictions may prevent us from taking actions that we believe would be in the best interests of our business and may make it difficult for us to successfully execute our business strategy or effectively compete with companies that are not similarly restricted. Our 2015 Credit Facility also contains cross-default provisions that apply to loans made pursuant to the 2015 Credit Facility and to any other material indebtedness we may have. We may also incur future debt obligations that might subject us to additional restrictive covenants that could affect our financial and operational flexibility. Our ability to comply with these covenants in future periods will largely depend on our ability to successfully implement our overall business strategy. In April 2014, in connection with the amendment and restatement of our prior credit facility, we received waivers from previous periods of noncompliance with certain financial covenants and other negative covenants under that prior credit facility. We cannot assure you that we will be granted any waivers or amendments to the 2015 Credit Facility if for any reason we are unable to comply with the terms of the 2015 Credit Facility in the future. The breach of any of these covenants or restrictions could result in a default under the 2015 Credit Facility, which could result in the acceleration of our debt. In the event of an acceleration of debt, we could be forced to apply all available cash flows to repay such debt and could be forced into bankruptcy or liquidation.
21
We will need additional financing to execute our business plan and fund operations, which additional financing may not be available on reasonable terms or at all.
As of December 31, 2014, we had $63.2 million of working capital. Our acquisition and de novo development strategies will require substantial capital. For example:
· | On February 20, 2015, we completed the acquisition of the assets of Recovery First, a Florida-based provider of substance abuse treatment and rehabilitation services, for cash consideration of $13 million. In addition, on January 28, 2015, we signed a definitive agreement for the acquisition of an 84-bed hospital in Aliso Viejo, California for an aggregate purchase price of $13.5 million in cash. |
· | On January 23, 2015, we signed a definitive agreement to acquire CSRI, a provider of intensive outpatient substance abuse treatment services, for $665,000 in cash and approximately $1.3 million in restricted shares of common stock. The acquisition, which is subject to certain closing conditions such as the assignment of certain contracts and the receipt of certain licenses necessary to operate the business, is expected to close during the second quarter of 2015. |
· | On February 24, 2015, we completed the purchase of a property in Ringwood, New Jersey for an aggregate of $6.5 million in cash that we expect to develop into an inpatient facility with approximately 150 beds. We expect to invest approximately $16 million for renovations and construction. |
To fund our acquisition and development strategies, we will consider raising additional funds through various financing sources, including the sale of our equity securities and the procurement of commercial debt financing. However, there can be no assurance that such funds will be available on commercially reasonable terms, if at all. If such financing is not available on satisfactory terms, we may be unable to expand or continue our business as desired and operating results may be adversely affected. Any debt financing will increase expenses and must be repaid regardless of operating results and may involve restrictions limiting our operating flexibility. If we issue equity securities to raise additional funds, the percentage ownership of our existing stockholders will be reduced, and our stockholders may experience additional dilution in net book value per share.
Our ability to obtain needed financing may be impaired by such factors as the capital markets, both generally and specifically in our industry, which could impact the availability or cost of future financings. If the amount of capital we are able to raise from financing activities, together with our revenues from operations, is not sufficient to satisfy our capital needs, we may be required to decrease the pace of, or eliminate, our acquisition strategy and potentially reduce or even cease operations.
Our business may face significant risks with respect to future de novo expansion, including the time and costs of identifying new geographic markets, the ability to obtain necessary licensure and other zoning or regulatory approvals and significant start-up costs including advertising, marketing and the costs of providing equipment, furnishings, supplies and other capital resources.
As part of our growth strategy, we intend to develop new substance abuse treatment facilities in existing and new markets, either by building a new facility or by acquiring an existing facility with an alternative use and repurposing it as a substance abuse treatment facility. Such de novo expansion involves significant risks, including, but not limited to, the following:
· | identifying locations in suitable geographic markets can be a lengthy and costly process and may divert management attention from existing operations; |
· | a change in existing comprehensive zoning plans or zoning regulations that imposes additional restrictions on use or requirements could impact our expansion into otherwise suitable geographic markets; |
· | the de novo facility may require significant advertising and marketing expenditures to attract clients; |
· | we will need to provide each de novo facility with the appropriate equipment, furnishings, materials, supplies and other capital resources; |
· | our ability to obtain licensure and accreditation, establish relationships with healthcare providers in the community and delays or difficulty in installing our operating and information systems; |
· | the time and costs of evaluating new markets, hiring experienced local physicians, management and staff and opening new facilities, and the time lags between these activities and the generation of sufficient revenues to support the costs of the expansion; and |
· | our ability to finance de novo expansion and possible dilution to our existing stockholders if our common stock is used as consideration. |
As a result of these and other risks, there can be no assurance that a de novo treatment facility will become profitable.
22
Our acquisition strategy exposes us to a variety of operational and financial risks, which may have a material adverse effect on our business, financial condition and results of operations.
A principal element of our business strategy is to grow by acquiring other companies and assets in the mental health and substance abuse treatment industry. For example:
· | On February 20, 2015, we completed the acquisition of the assets of Recovery First, a Florida-based provider of substance abuse treatment and rehabilitation services, for cash consideration of $13 million. |
· | On January 23, 2015, we signed a definitive agreement to acquire CSRI, a provider of intensive outpatient substance abuse treatment services, for $665,000 in cash and approximately $1.3 million in restricted shares of common stock. The acquisition, which is subject to certain closing conditions such as the assignment of certain contracts and the receipt of certain licenses necessary to operate the business, is expected to close during the second quarter of 2015. |
We evaluate potential acquisition opportunities consistent with the normal course of our business. Our ability to complete acquisitions is subject to a number of risks and variables, including our ability to negotiate mutually agreeable terms with the counterparties, our ability to finance the purchase price and our ability to obtain any licenses or other approvals required to operate the assets to be acquired. We may not be successful in identifying and consummating suitable acquisitions, which may impede our growth and negatively affect our results of operations and may also require a significant amount of management resources. In addition, growth, especially rapid growth, through acquisitions exposes us to a variety of operational and financial risks. We summarize the most significant of these risks below.
Integration risks. We must integrate our acquisitions with our existing operations. This process includes the integration of the various components of our business and of the businesses we have acquired or may acquire in the future, including the following:
· | physicians and employees who are not familiar with our operations; |
· | clients who may elect to switch to another substance abuse treatment provider; |
· | regulatory compliance programs; and |
· | disparate operating, information and record keeping systems and technology platforms. |
The integration of acquisitions with our operations could be expensive, require significant attention from management, may impose substantial demands on our operations or other projects and may impose challenges on the combined business including, without limitation, consistencies in business standards, procedures, policies, business cultures and internal controls and compliance. In addition, certain acquisitions require a capital outlay, and the return we achieve on such invested capital may be less than the return that we could achieve on other projects or investments.
Benefits may not materialize. When evaluating potential acquisition targets, we identify potential synergies and cost savings that we expect to realize upon the successful completion of the acquisition and the integration of the related operations. We may, however, be unable to achieve or may otherwise never realize the expected benefits. Our ability to realize the expected benefits from potential cost savings and revenue improvement opportunities is subject to significant business, economic and competitive uncertainties and contingencies, many of which are beyond our control, such as changes to government regulation governing or otherwise impacting the substance abuse treatment and behavioral healthcare industries, reductions in reimbursement rates from third-party payors, operating difficulties, client preferences, changes in competition and general economic or industry conditions. If we do not achieve our expected results, it may adversely impact our results of operations.
Assumptions of unknown liabilities. Facilities that we acquire may have unknown or contingent liabilities, including, without limitation, liabilities for failure to comply with healthcare laws and regulations. Although we typically attempt to exclude significant liabilities from our acquisition transactions and seek indemnification from the sellers of such facilities for at least a portion of these matters, we may experience difficulty enforcing those indemnification obligations, or we may incur material liabilities for the past activities of acquired facilities. Such liabilities and related legal or other costs and/or resulting damage to a facility’s reputation could negatively impact our business.
Acquisitions. Suitable acquisitions may not be accomplished due to unfavorable terms. Further, the cost of an acquisition could result in a dilutive effect on our results of operations, depending on various factors, including the amount paid for an acquired facility, the acquired facility’s results of operations, the fair value of assets acquired and liabilities assumed, effects of subsequent legislation and limits on reimbursement rate increases. In addition, we may have to pay cash, incur additional debt or issue equity securities to pay for any such acquisition, which could adversely affect our financial results, result in dilution to our existing stockholders, result in increased fixed obligations or impede our ability to manage our operations.
Managing growth. Some of the facilities we have acquired or may acquire in the future may have had significantly lower operating margins than the facilities we operated prior to the time of our acquisition thereof or had operating losses prior to such
23
acquisition. If we fail to improve the operating margins of the facilities we acquire, operate such facilities profitably or effectively integrate the operations of acquired facilities, our results of operations could be negatively impacted.
Our ability to maintain census and the average length of stay of our clients is dependent on a number of factors outside of our control, and if we are unable to maintain census, or if we experience a significant decrease in average length of stay, our business, results of operations and cash flows could be materially adversely affected.
Our revenues are directly impacted by our ability to maintain census and, to a lesser extent, the average length of stay of our clients. These metrics are dependent on a variety of factors, many of which are outside of our control, including the effectiveness of our sales and marketing efforts, our referral relationships, our staffing levels and facility capacity, the extent to which third-party payors require preadmission authorization or utilization review controls, competition in the industry and the decisions of our clients to seek and commit to treatment. A significant decrease in census or, to a lesser extent, average length of stay could materially adversely affect our revenues, profitability and cash flows due to lower reimbursements received and the additional resources required to collect accounts receivable and to maintain our existing level of business.
Given the client-driven nature of the substance abuse treatment sector, our business is dependent on clients seeking and committing to treatment. Although increased awareness and de-stigmatization of substance abuse treatment in recent years has resulted in more people seeking treatment, the decision of each client to seek treatment is ultimately discretionary. In addition, even after the initial decision to seek treatment is made, our adult clients may decide at any time to discontinue treatment and leave our facilities against the advice of our physicians and other treatment professionals. For this reason, among others, average length of stay can vary among periods without correlating to the overall operating performance of our business, and as a result, management does not view average length of stay as a key metric with respect to our operating performance. However, if clients or potential clients decide not to seek treatment or discontinue treatment early, census and average length of stay could decrease and, as a result, our business, financial condition and results of operations could be adversely affected.
As a provider of treatment services, we are subject to governmental investigations and potential claims and legal actions by clients, employees and others, which may increase our costs and have a material adverse effect on our business, financial condition and results of operations.
Given the addiction and mental health of clients and the services provided, the substance abuse treatment industry is heavily regulated by governmental agencies and involves significant risk of liability. We and others in our industry are exposed to the risk of governmental investigations and lawsuits or other claims against us and our physicians and professionals arising out of our day to day business operations, including, without limitation, client treatment at our facilities and relationships with healthcare providers that may refer clients to us. Addressing any investigations, lawsuits or other claims may distract management and divert resources, even if we ultimately prevail. Fines, restrictions and penalties imposed as a result of an investigation or a successful lawsuit or claim that is not covered by, or is in excess of, our insurance coverage may increase our costs and reduce our profitability. Our insurance premiums have increased year over year, and insurance coverage may not be available at a reasonable cost, especially given the significant increase in insurance premiums generally experienced in the healthcare industry.
We are also subject to potential medical malpractice lawsuits and other legal actions in the ordinary course of business. Some of these actions may involve large claims as well as significant defense costs. We cannot predict the outcome of these lawsuits or the effect that findings in such lawsuits may have on us. All professional and general liability insurance we purchase is subject to policy limitations. We believe that, based on our past experience, our insurance coverage is adequate considering the claims arising from the operation of our facilities. While we continuously monitor our coverage, our ultimate liability for professional and general liability claims could change materially from our current estimates. If such policy limitations should be partially or fully exhausted in the future or if payments of claims exceed our estimates or are not covered by our insurance, it could have a material adverse effect on our financial condition and results of operations.
We operate in a highly competitive industry, and competition may lead to declines in client volumes and an increase in labor costs, which could have a material adverse effect on our business, financial condition and results of operations.
The substance abuse treatment industry is highly competitive, and competition among substance abuse treatment providers (including behavioral healthcare facilities) for clients has intensified in recent years. There are behavioral healthcare facilities that provide substance abuse and other mental health treatment services comparable to at least some of the services offered by our facilities in each of the geographical areas in which we operate. Some of our competitors are owned by tax-supported governmental agencies or by nonprofit corporations and may have certain financial advantages not available to us, including endowments, charitable contributions, tax-exempt financing and exemptions from sales, property and income taxes. If our competitors are better able to attract clients, expand services or obtain favorable participation agreements at their facilities, we may experience a decline in client volume, and it could have a material adverse effect on our business, financial condition and results of operations.
24
Our operations depend on the efforts, abilities and experience of our management team, physicians and medical support personnel, including our nurses, mental health technicians, therapists and counselors. We compete with other healthcare providers in recruiting and retaining qualified management, physicians, nurses and other support personnel responsible for the daily operations of our facilities.
The nationwide shortage of nurses and other medical support personnel has been a significant operating issue facing us and other healthcare providers. This shortage may require us to enhance wages and benefits to recruit and retain nurses and other medical support personnel or require us to hire more expensive temporary or contract personnel. In addition, certain of our facilities are required to maintain specified nurse-staffing levels. To the extent we cannot meet those levels, we may be required to limit the services provided by these facilities, which could have a corresponding adverse effect on our net operating revenues.
Increased labor union activity is another factor that could adversely affect our labor costs. Although we are not aware of any union organizing activity at any of our facilities, we are unable to predict whether any such activity will take place in the future. To the extent that a portion of our employee base unionizes, it is possible that our labor costs could increase materially.
We cannot predict the degree to which we will be affected by the future availability or cost of attracting and retaining talented medical support staff. If our general labor and related expenses increase, we may not be able to raise our rates correspondingly. Our failure to either recruit and retain qualified management, physicians, nurses and other medical support personnel or control our labor costs could have a material adverse effect on our business, financial condition and results of operations.
We depend heavily on key management personnel, and the departure of one or more of our key executives or a significant portion of our local facility management personnel or sales force could have a material adverse effect on our business, financial condition and results of operations.
The expertise and efforts of our key executives, including our chief executive officer, president, chief operating officer, chief financial officer and general counsel, and other key members of our facility management personnel and sales staff are critical to the success of our business. We do not currently have employment agreements or non-competition covenants with any of our key executives. The loss of the services of one or more of our key executives or of a significant portion of our facility management personnel or sales staff could significantly undermine our management expertise and our ability to provide efficient, quality healthcare services at our facilities. Furthermore, if one or more of our key executives were to terminate employment with us and engage in a competing business, we would be subject to increased competition, which could have a material adverse effect on our business, financial condition and results of operations.
Our business depends on our information systems and our inability to effectively integrate, manage and keep secure our information systems could disrupt our operations and have a material adverse effect on our business.
Our business depends on effective and secure information systems that assist us in, among other things, admitting clients to our facilities, monitoring census and utilization, processing and collecting claims, reporting financial results, measuring outcomes and quality of care, managing regulatory compliance controls, and maintaining operational efficiencies. These systems include software developed in-house and systems provided by external contractors and other service providers. To the extent that these external contractors or other service providers become insolvent or fail to support the software or systems, our operations could be negatively affected. Our facilities also depend upon our information systems for electronic medical records, accounting, billing, collections, risk management, payroll and other information. If we experience a reduction in the performance, reliability, or availability of our information systems, our operations and ability to process transactions and produce timely and accurate reports could be adversely affected.
Our information systems and applications require continual maintenance, upgrading, and enhancement to meet our operational needs. Our acquisitions require transitions and integration of various information systems. We regularly upgrade and expand our information systems’ capabilities. If we experience difficulties with the transition and integration of information systems or are unable to implement, maintain, or expand our systems properly, we could suffer from, among other things, operational disruptions, regulatory problems, working capital disruptions and increases in administrative expenses.
In addition, we could be subject to a cyber-attack that bypasses our information technology security systems and other security incidents that result in security breaches, including the theft, loss or misappropriation of individually identifiable health information subject to HIPAA and other privacy and security laws, proprietary business information, or other confidential or personal data. Such an incident could also disrupt our information technology business systems, cause us to incur significant investigation and remediation expenses, and subject us to litigation, government inquiries, penalties and reputational damages. Information security and the continued development, maintenance and enhancement of our safeguards to protect our systems, data, software and networks is a priority for us. As security threats continue to evolve, we may be required to expend significant additional resources to modify and enhance our safeguards and investigate and remediate any information security vulnerabilities. If we are subject to cyber-attacks or security breaches, our business, financial condition, and results of operations could be adversely impacted.
25
Further, our information systems are vulnerable to damage or interruption from fire, flood, natural disaster, power loss, telecommunications failure, break-ins and similar events. A failure to implement our disaster recovery plans or ultimately restore our information systems after the occurrence of any of these events could have a material adverse effect on our business, financial condition and results of operations. Because of the confidential health information we store and transmit, loss of electronically-stored information for any reason could expose us to a risk of regulatory action, litigation, possible liability and loss.
Failure to adequately protect our trademarks and any other proprietary rights could have a material adverse effect on our business, financial condition and results of operations.
We maintain a trademark portfolio that we consider to be of significant importance to our business, and we may acquire additional trademarks or other proprietary rights in acquisitions that we pursue as part of our growth strategy. If the actions we take to establish and protect our trademarks and other proprietary rights are not adequate to prevent imitation of our services by others or to prevent others from seeking to block sales of our services as an alleged violation of their trademarks and proprietary rights, it may be necessary for us to initiate or enter into litigation in the future to enforce our trademark rights or to defend ourselves against claimed infringement of the rights of others. Any legal proceedings could result in an adverse determination that could have a material adverse effect on our business, financial condition and results of operations.
Risks Related to Regulatory Matters
If we fail to comply with the extensive laws and government regulations impacting our industry, we could suffer penalties, be the subject of federal and state investigations or be required to make significant changes to our operations, which may reduce our revenues, increase our costs and have a material adverse effect on our business, financial condition and results of operations.
Healthcare service providers are required to comply with extensive and complex laws and regulations at the federal, state and local government levels relating to, among other things:
· | licensure, certification and accreditation of substance abuse treatment services; |
· | Clinical Laboratory Improvement Amendments (“CLIA”) certification and state licensure of laboratory services; |
· | handling, administration and distribution of controlled substances; |
· | necessity and adequacy of care, quality of services, and qualifications of professional and support personnel; |
· | referrals of clients and permissible relationships with physicians and other referral sources; |
· | billings for reimbursement from commercial payors; |
· | consumer protection issues and billing and collection of client-owed accounts issues; |
· | privacy and security issues associated with health-related information, client personal information and medical records, including their use and disclosure, client notices, adequate security safeguards and the handling of breaches, complaints and accounting for disclosures; |
· | physical plant planning, construction of new facilities and expansion of existing facilities; |
· | activities regarding competitors; |
· | state corporate practice of medicine, fee-splitting, self-referral and kickback prohibitions; and |
· | claim submission and collections, including penalties for the submission of, or causing the submission of, false, fraudulent or misleading claims. |
Failure to comply with these laws and regulations could result in the imposition of significant civil or criminal penalties, loss of license or certification or require us to change our operations, which may have a material adverse effect on our business, financial condition and results of operations. Both federal and state government agencies as well as commercial payors have heightened and coordinated civil and criminal enforcement efforts as part of numerous ongoing investigations of healthcare organizations.
We endeavor to comply with all applicable legal and regulatory requirements, however, there is no guarantee that we will be able to adhere to all of the complex government regulations that apply to our business. In this regard, we seek to structure all of our relationships with physicians to comply with applicable anti-kickback laws, physician self-referral laws, fee-splitting laws and state corporate practice of medicine prohibitions. We monitor these laws and implement changes as necessary. However, the laws and regulations in these areas are complex and often subject to varying interpretations. For example, if an enforcement agency were to challenge the compensation paid under our contracts with professional physician groups, we could be required to change our practices, face criminal or civil penalties, pay substantial fines or otherwise experience a material adverse effect as a result of a challenge to these arrangements.
26
We may be required to spend substantial amounts to comply with legislative and regulatory initiatives relating to privacy and security of client health information.
There are currently numerous legislative and regulatory initiatives at the federal and state levels addressing client privacy and security concerns. In particular, federal regulations issued under the Drug Abuse Prevention, Treatment and Rehabilitation Act of 1979 strictly restrict the disclosure of client identifiable information related to substance abuse and apply to any of our facilities that receive any federal assistance, which is interpreted broadly to include facilities licensed, certified or registered by a federal agency. In addition, the federal privacy and security regulations issued under HIPAA require our facilities to comply with extensive administrative requirements on the use and disclosure of individually identifiable health information (known as “protected health information”) and require covered entities, which include most healthcare providers, to implement and maintain administrative, physical and technical safeguards to protect the security of such information. Additional security requirements apply to electronic protected health information. These regulations also provide clients with substantive rights with respect to their health information and impose substantial administrative obligations on our facilities, including the requirement to enter into written agreements with contractors, known as business associates, to whom our programs disclose protected health information. We may be subject to penalties as a result of a business associate violating HIPAA, if the business associate is found to be our agent. Covered entities must notify individuals, HHS, and, in some cases, the media of breaches involving unsecured protected health information. HHS and state attorneys general are authorized to enforce these regulations. Violations of the HIPAA privacy and security regulations may result in significant civil and criminal penalties, and data breaches and other HIPAA violations may give rise to class action lawsuits by affected clients under state law.
Our programs remain subject to any privacy-related federal or state laws that are more restrictive than the HIPAA privacy and security regulations. These laws vary by state and could impose additional requirements and penalties. For example, some states impose strict restrictions on the use and disclosure of health information pertaining to mental health or substance abuse. Further, most states have enacted laws and regulations that require us to notify affected individuals in the event of a data breach involving individually identifiable information. In addition, the Federal Trade Commission may use its consumer protection authority to initiate enforcement actions in response to data breaches or other privacy or security lapses.
As public attention is drawn to issues related to the privacy and security of medical and other personal information, federal and state authorities may increase enforcement efforts, seek to impose harsher penalties as well as revise and expand laws or enact new laws concerning these topics. Compliance with current as well as any newly established provisions or interpretations of existing requirements will require us to expend significant resources. Increased focus on privacy and security issues by enforcement authorities may increase the overall risk that our substance abuse treatment facilities may be found lacking under federal and state privacy and security laws and regulations.
Our treatment facilities operate in an environment of increasing state and federal enforcement activity and private litigation targeted at healthcare providers.
Both federal and state government agencies have heightened and coordinated their civil and criminal enforcement efforts as part of numerous ongoing investigations of healthcare companies and various segments of the healthcare industry. These investigations relate to a wide variety of topics, including relationships with physicians, billing practices and use of controlled substances. The Affordable Care Act included an additional $350 million of federal funding over 10 years to fight healthcare fraud, waste and abuse, including $30 million for federal fiscal year 2015. From time to time, the HHS Office of Inspector General and the Department of Justice have established national enforcement initiatives that focus on specific billing practices or other suspected areas of abuse. Although we do not currently bill Medicare or Medicaid for substance abuse treatment services, there is a risk that specific investigation initiatives could be expanded to include our treatment facilities. In addition, increased government enforcement activities, even if not directed towards our treatment facilities, also increase the risk that our facilities, physicians and other clinicians furnishing services in our facilities, or our executives and directors, could become named as defendants in private litigation such as state or federal false claims act cases or consumer protection cases, or could become the subject of complaints at the various state and federal agencies that have jurisdiction over our operations. Any governmental investigations, private litigation or other legal proceedings involving any of our facilities, our executives or our directors, even if we ultimately prevail, could result in significant expense and could adversely affect our reputation. In addition, we may be required to make changes in our laboratory or other substance abuse treatment services as a result of an adverse determination in any governmental enforcement action, private litigation or other legal proceeding, which could materially adversely affect our business and results of operations.
Changes to federal, state and local regulations, as well as different or new interpretations of existing regulations, could adversely affect our operations and profitability.
Because our treatment programs and operations are regulated at federal, state and local levels, we could be affected by different regulatory changes in different regional markets. Increases in the costs of regulatory compliance and the risks of noncompliance may increase our operating costs, and we may not be able to recover these increased costs, which may adversely affect our results of operations and profitability.
27
Many of the current laws and regulations are relatively new. Thus, we do not always have the benefit of significant regulatory or judicial interpretation of these laws and regulations. In the future, different interpretations or enforcement of these laws and regulations could subject our current or past practices to allegations of impropriety or illegality or could require us to make changes in our treatment facilities, equipment, personnel, services or capital expenditure programs. A determination that we have violated these laws, or a public announcement that we are being investigated for possible violations of these laws, could adversely affect our business, operating results and overall reputation in the marketplace.
In addition, federal, state and local regulations may be enacted that impose additional requirements on our facilities. Adoption of legislation or the creation of new regulations affecting our facilities could increase our operating costs, restrain our growth, limit us from taking advantage of opportunities presented and could have a material adverse effect on our business, financial condition and results of operations. Adverse changes in existing comprehensive zoning plans or zoning regulations that impose additional restrictions on the use of, or requirements applicable to, our facilities may affect our ability to operate our existing facilities or acquire new facilities, which may adversely affect our results of operations and profitability.
We are subject to uncertainties regarding the impact of the Affordable Care Act and related payment reform efforts, which represent a significant change to the healthcare industry.
The Affordable Care Act provides for increased access to coverage for healthcare and seeks to reduce healthcare-related expenses. Overall, the expansion of health insurance coverage under the Affordable Care Act is expected to be beneficial to the substance abuse treatment industry. Health insurers are prohibited from denying coverage to individuals because of preexisting conditions. Further, all new small group and individual market health plans must cover ten essential health benefit categories, which include substance abuse addiction and mental health disorder services. Likewise, the Affordable Care Act requires small group and individual market plans to comply with the requirements of the MHPAEA, which was previously limited to group health plans and group insurers. According to 2013 HHS estimates, these changes will ensure coverage for substance abuse addiction treatment and mental health disorders treatment for 62.5 million Americans.
The expansion of commercial insurance for substance abuse treatment services under the Affordable Care Act may result in a higher demand for services from all providers. This may bring new competitors to the market, some of which may be better capitalized and have greater market penetration than we do. Further, we expect increased demand for substance abuse treatment services to also increase the demand for case managers, therapists, medical technicians and others with clinical expertise in substance abuse treatment, which may make it more difficult to adequately staff our substance abuse treatment facilities and could significantly increase our costs in delivering treatment, which may adversely affect both our operations and profitability.
One of the many impacts of the Affordable Care Act has been a dramatic increase in payment reform efforts by federal and state government payors as well as commercial payors. These efforts take many forms including the growth of accountable care organizations (“ACOs”), pay-for-performance bonus arrangements, partial capitation arrangements and the bundling of services into a single payment. One result of these efforts is that more risk of the overall cost of care is being transferred to providers. As institutional providers and their affiliated physicians assume more risk for the cost of care, we expect more services to be furnished within provider networks formed to accept these types of payment reform. Our ability to compete and to retain our traditional sources of clients may be adversely affected by our exclusion from such networks or our inability to be included in such networks.
The Affordable Care Act remains subject to court challenges, legislative efforts to repeal or amend the law and regulatory interpretation. We cannot predict the impact the implementation of the Affordable Care Act and related rulemaking and regulations may have on our business, results of operations, cash flow, capital resources and liquidity or whether we will be able to adapt successfully to the changes required by the Affordable Care Act.
Change of ownership or change of control requirements imposed by state and federal licensure and certification agencies as well as third-party payors may limit our ability to timely realize opportunities, adversely affect our licenses and certifications, interrupt our cash flows and adversely affect our profitability.
State licensure laws and many federal healthcare programs (where applicable) impose a number of obligations on healthcare providers undergoing a change of ownership or change of control transaction. These requirements may require new license applications as well as notices given a fixed number of days prior to the closing of affected transactions. These provisions require us to be proactive when considering both internal restructuring and acquisitions of third-party targets. Failure to provide such notices or to submit required paperwork can adversely affect licensure on a going forward basis, can subject the parties to penalties and can adversely affect our ability to operate our facilities.
Many third-party payor agreements, including government payor programs, also have change of ownership or change of control provisions. Such provisions generally include a prior notice provision as well as require the consent of the payor in order to continue the terms of the payor agreement. A failure to abide by the terms of such provisions can result in a breach of the underlying third-party payor agreement. Further, abiding by the terms of such provisions may reopen pricing negotiations with third-party payors where the
28
provider currently has favorable reimbursement terms as compared to the market. Currently, we have very few third-party payor agreements; however, as substance abuse treatment coverage and payment reform initiatives continue to expand, these types of provisions could have a significant impact on our ability to realize opportunities and could adversely affect our cash flows and profitability.
We could face risks associated with, or arising out of, environmental, health and safety laws and regulations.
We are subject to various federal, state and local laws and regulations that:
· | regulate certain activities and operations that may have environmental or health and safety effects, such as the generation, handling and disposal of medical and pharmaceutical wastes; |
· | impose liability for costs of cleaning up, and damages to natural resources from, past spills, waste disposals on and off-site and other releases of hazardous materials or regulated substances; and |
· | regulate workplace safety. |
Compliance with these laws and regulations could increase our costs of operation. Violation of these laws may subject us to significant fines, penalties or disposal costs, which could negatively impact our results of operations, financial position or cash flows. We could be responsible for the investigation and remediation of environmental conditions at currently or formerly operated or leased sites, as well as for associated liabilities, including liabilities for natural resource damages, third-party property damage or personal injury resulting from lawsuits that could be brought by the government or private litigants relating to our operations, the operations of our facilities or the land on which our facilities are located. We may be subject to these liabilities regardless of whether we lease or own the facility, and regardless of whether such environmental conditions were created by us or by a prior owner or tenant, or by a third-party or a neighboring facility whose operations may have affected such facility or land, because liability for contamination under certain environmental laws can be imposed on current or past owners or operators of a site without regard to fault. We cannot assure you that environmental conditions relating to our prior, existing or future sites or those of predecessor companies whose liabilities we may have assumed or acquired will not have a material adverse effect on our business.
State efforts to regulate the construction or expansion of healthcare facilities could impair our ability to operate and expand our facilities.
The construction of new healthcare facilities, the expansion, transfer or change of ownership of existing facilities and the addition of new beds, services or equipment may be subject to state laws that require prior approval by state regulatory agencies under CON laws. These laws generally require that a state agency determine the public need for construction or acquisition of facilities or the addition of new services. Review of CONs and other healthcare planning initiatives may be lengthy and may require public hearings. We currently do not operate facilities in any states where a CON is required to be obtained for capital expenditures exceeding a prescribed amount, changes in capacity or services offered. However, states in which we now or may in the future operate may require CONs under certain circumstances not currently applicable to us or may impose standards and other health planning requirements upon us. Violations of these state laws and our failure to obtain any necessary state approval could:
· | result in our inability to acquire a targeted facility, complete a desired expansion or make a desired replacement; or |
· | result in the revocation of a facility’s license or impose civil or criminal penalties on us, any of which could have a material adverse effect on our business, financial condition and results of operations. |
If we are unable to obtain required regulatory, zoning or other required approvals for renovations and expansions, our growth may be restrained and our operating results may be adversely affected. In the past, we have not experienced any material adverse effects from such requirements, but we cannot predict the future impact of these changes upon our operations.
Risks Related to Our Organization and Structure
We are a holding company with nominal net worth and will depend on dividends and distributions from our subsidiaries to pay dividends, if any.
AAC Holdings, Inc. is a holding company with nominal net worth. We do not conduct any business operations other than our investments in our subsidiaries. Our business operations are conducted primarily out of our direct operating subsidiary, AAC. As a result, our ability to pay dividends, if any, will be dependent upon cash dividends and distributions or other transfers to us from our subsidiaries, including AAC. Payments to us by our subsidiaries will be contingent upon their respective earnings and subject to any limitations on the ability of such entities to make payments or other distributions to us. In addition, our subsidiaries, including our direct operating subsidiary, AAC, are separate and distinct legal entities and have no obligation to make any funds available to us.
29
Our directors, executive officers and principal stockholders and their respective affiliates have substantial control over the company and could delay or prevent a change in corporate control.
Our directors, executive officers and holders of more than 5% of our common stock, together with their affiliates, beneficially own, in the aggregate, approximately 64.4% of our outstanding common stock. In addition, Michael T. Cartwright, our Chairman and Chief Executive Officer, and his affiliates own approximately 26.8% of our common stock, and Jerrod N. Menz, our President, and his affiliates own approximately 24.2% of our common stock. As a result, these stockholders, acting together, have substantial control over the outcome of matters submitted to our stockholders for approval, including the election of directors and any merger, consolidation or sale of all or substantially all of our assets. In addition, these stockholders, acting together, have significant influence over the management and affairs of our company. Accordingly, this concentration of ownership may have the effect of:
· | delaying, deferring or preventing a change in corporate control; |
· | impeding a merger, consolidation, takeover or other business combination involving us; or |
· | discouraging a potential acquirer from making a tender offer or otherwise attempting to obtain control of us. |
Anti-takeover provisions in our articles of incorporation, bylaws and Nevada law could prevent or delay a change in control of our company.
Provisions in our articles of incorporation and amended and restated bylaws, which we refer to as our bylaws, may discourage, delay or prevent a merger, acquisition or change of control. These provisions could also discourage proxy contests and make it more difficult for stockholders to elect directors and take other corporate actions. These provisions:
· | permit our Board of Directors to issue up to 5,000,000 shares of preferred stock, with any rights, preferences and privileges as they may designate, including the right to approve an acquisition or other change in our control; |
· | provide that the authorized number of directors may be changed only by resolution of the Board of Directors; |
· | provide that all vacancies, including newly created directorships, may, except as otherwise required by law, be filled by the affirmative vote of a majority of directors then in office, even if less than a quorum; |
· | provide that stockholders seeking to present proposals before a meeting of stockholders or to nominate candidates for election as directors at a meeting of stockholders must provide notice in writing in a timely manner and also specify requirements as to the form and content of a stockholder’s notice; |
· | provide that our stockholders may not take action by written consent, but may only take action at annual or special meetings of our stockholders; |
· | do not provide for cumulative voting rights (therefore allowing the holders of a majority of the shares of common stock entitled to vote in any election of directors to elect all of the directors standing for election, if they should so choose); and |
· | provide that special meetings of our stockholders may be called only by the chairman of the Board of Directors, our Chief Executive Officer and the Board of Directors pursuant to a resolution adopted by a majority of the total number of authorized directors or the holders of a majority of the outstanding shares of voting stock. |
The lack of public company experience of our management team could adversely impact our ability to comply with the reporting requirements of U.S. securities laws.
Prior to the completion of our IPO in October 2014, our management team lacked public company experience, which could impair our ability to comply with legal and regulatory requirements such as those imposed by the SEC, the NYSE, or Sarbanes-Oxley. In addition, prior to the IPO, we were a private company with limited accounting personnel and other related resources, and hired accounting personnel with SEC reporting experience during 2014. Despite recent reforms made possible by the JOBS Act, compliance with the securities laws and regulations, as well as the requirements of the NYSE, occupy a significant amount of time of our management and significantly increase our legal, accounting and other expenses, particularly after we no longer qualify as an “emerging growth company.” Our senior management may not be able to implement programs and policies in an effective and timely manner that adequately respond to such increased legal, regulatory compliance and reporting requirements, including establishing and maintaining internal controls over financial reporting. Any such deficiencies, weaknesses or lack of compliance could have a material adverse effect on our ability to comply with the reporting requirements of the Exchange Act, which is necessary to maintain our public company status. If we fail to fulfill any of these public company reporting obligations, our ability to continue as a U.S. public company will be in jeopardy.
We are an emerging growth company, and we cannot be certain if the reduced reporting requirements applicable to emerging growth companies will make our common stock less attractive to investors.
We are an “emerging growth company” as defined under the JOBS Act. For as long as we continue to be an emerging growth company, we may take advantage of exemptions from various reporting requirements that are applicable to other public companies
30
that are not emerging growth companies, including not being required to comply with the auditor attestation requirements of Section 404 of Sarbanes-Oxley, reduced disclosure obligations regarding executive compensation in our periodic reports and proxy statements and exemptions from the requirements of holding a nonbinding advisory vote on executive compensation and stockholder approval of any golden parachute payments not previously approved. We could be an emerging growth company for up to five years following the IPO, although we could lose that status sooner if our revenues exceed $1 billion, if we issue more than $1 billion in non-convertible debt in a three year period or if the market value of our common stock held by non-affiliates meets or exceeds $700 million as of any June 30th before that time, in which case we would no longer be an emerging growth company as of the following December 31st.
Under the JOBS Act, emerging growth companies can also delay adopting new or revised accounting standards until such time as those standards apply to private companies. We have irrevocably elected not to avail ourselves of this extended transition period for implementing new or revised accounting standards and, therefore, will comply with new or revised accounting standards on the relevant dates on which adoption of such standards is required for other public companies that are not emerging growth companies.
We incur substantial costs as a result of being a public company.
As a public company, we incur significant legal, accounting, insurance and other expenses, including costs associated with public company reporting requirements. We incur costs associated with complying with the requirements of the Sarbanes-Oxley Act of 2002, or Sarbanes-Oxley, the Dodd-Frank Wall Street Reform and Consumer Protection Act, or the Dodd-Frank Act, and related rules implemented by the SEC and NYSE. Enacted in July 2010, the Dodd-Frank Act contains significant corporate governance and executive compensation-related provisions, some of which the SEC has recently implemented by adopting additional rules and regulations in areas such as executive compensation. The expenses incurred by public companies generally for reporting and corporate governance purposes have been increasing. Management expects these laws and regulations to increase our legal and financial compliance costs and to make some activities more time consuming and costly, although management is currently unable to estimate these costs with any degree of certainty. These laws and regulations could make it more difficult or costly for us to obtain certain types of insurance, including director and officer liability insurance, and we may be forced to accept reduced policy limits and coverage or incur substantially higher costs to obtain the same or similar coverage. These laws and regulations could also make it more difficult for us to attract and retain qualified persons to serve on our board of directors, our board committees or as our executive officers. Furthermore, if we are unable to satisfy our obligations as a public company, we could be subject to delisting of our common stock, fines, sanctions and other regulatory action and potentially civil litigation.
Risks Related to Our Common Stock
Market volatility may cause our stock price to decline.
The market price of our common stock may fluctuate substantially as the market price for our common stock is affected by a number of factors including:
· | changes in policies affecting third-party coverage and reimbursement in the United States; |
· | our ability to achieve market success; |
· | actual or anticipated variations in our results of operations or those of our competitors; |
· | announcements of new services or innovations by us or our competitors; |
· | sales of common stock or other securities by us or our stockholders in the future; |
· | additions or departures of key management personnel; |
· | trading volume or our common stock; |
· | developments in our industry; or |
· | general market conditions and other factors unrelated to our operating performance or the operating performance of our competitors. |
In addition, the stock prices of many companies in the healthcare industry have experienced wide fluctuations that have often been unrelated to the operating performance of these companies. We expect our stock price to be similarly volatile. These broad market fluctuations may continue and could harm our stock price. Following periods of volatility in the market price of a company’s securities, stockholders have often instituted class action securities litigation against those companies. Class action securities litigation, if instituted against us, could result in substantial costs and a diversion of our management resources, which could have a material adverse effect on our business, financial condition and results of operations.
31
Securities analysts may not initiate coverage for our common stock or may issue negative reports, and this may have a negative impact on the market price of our common stock.
Securities analysts may elect not to provide research coverage of our common stock. The lack of research coverage may adversely affect the market price of our common stock. The trading market for our common stock may be affected in part by the research and reports that industry or financial analysts publish about us or our business, and our failure to achieve analyst earnings estimates. It may be difficult for companies such as ours, with smaller market capitalizations, to attract securities analysts that will cover our common stock. If one or more of the analysts who elects to cover us downgrades our stock, our stock price would likely decline rapidly. If one or more of these analysts ceases coverage of our company, we could lose visibility in the market, which in turn could cause our stock price to decline.
Failure to maintain effective internal control over financial reporting in accordance with Section 404 of the Sarbanes-Oxley Act of 2002, or Sarbanes-Oxley, could have a material adverse effect on our business.
We are required to maintain effective internal control over financial reporting in accordance with Section 404 of the Sarbanes-Oxley Act in the course of preparing our consolidated financial statements. If we are unable to maintain effective internal control over financial reporting, we may be unable to report our financial information on a timely basis, may suffer adverse regulatory consequences or violations of NYSE listing rules. There could also be a negative reaction in the financial markets due to a loss of investor confidence in us and the reliability of our financial statements. Confidence in our financial statements is also likely to suffer if we report a material weakness in our internal control over financial reporting. In addition, we have incurred and will continue to incur incremental costs in order to improve our internal control over financial reporting and comply with Section 404 of Sarbanes-Oxley, including increased auditing and legal fees.
We have not paid dividends in the past and do not expect to pay dividends in the future.
AAC Holdings, Inc. has never declared or paid cash dividends on our common stock. We currently intend to retain all available funds and any future earnings to support our operations and finance the growth and development of our business, and therefore, we do not anticipate paying cash dividends in the foreseeable future. Any future determination related to the payment of dividends will be made at the discretion of our Board of Directors and will depend on, among other factors, our results of operations, financial condition, capital requirements, contractual restrictions, business prospects and other factors our Board of Directors may deem relevant.
Item 1B. Unresolved Staff Comments.
None.
Item 2. Properties.
A listing of our owned and leased facilities is included in Item 1 of this report under the heading “Facilities.” Additionally, we lease approximately 21,800 square feet of office space for our corporate headquarters at 115 East Park Drive, Brentwood, Tennessee. On January 6, 2015, we entered into a new lease arrangement for our corporate headquarters for approximately 101,986 square feet of office space located at 200 Powell Place, Brentwood, Tennessee. We also lease approximately 11,000 square feet of laboratory space in Brentwood, Tennessee to perform quantitative drug testing and other laboratory services that support our treatment facilities. We believe that these facilities are in good condition and suitable for our present requirements.
Item 3. Legal Proceedings.
From time to time, we may be engaged in various lawsuits and legal proceedings in the ordinary course of our business. Except as described below, we are currently not aware of any legal proceedings the ultimate outcome of which, in our judgment based on information currently available, would have a material adverse effect on our business, financial condition or results of operations.
Horizon Blue Cross Blue Shield of New Jersey v. Avee Laboratories et al.
On September 4, 2013, Horizon Blue Cross Blue Shield of New Jersey (“Horizon”) filed an amended complaint in the Superior Court of New Jersey against several defendants, including Leading Edge Recovery Center, LLC, one of our subsidiaries. Leading Edge Recovery Center, LLC formerly operated a drug and alcohol treatment facility in New Jersey. Horizon alleges the defendants submitted and caused others to submit unnecessary drug tests in violation of New Jersey law and is seeking recovery for monetary and treble damages. We are vigorously defending these claims and believe them to be without merit. We cannot provide any assurance that we will prevail in this manner, nor can we reasonably estimate our potential liability if there is an adverse outcome.
Item 4. Mine Safety Disclosures
Not applicable.
32
PART II
Item 5. Market for Registrant’s Common Equity, Related Stockholder Matters and Issuer Purchases of Equity Securities. Price Range of Common Stock
Market Information
Our common stock began trading on October 2, 2014 and is listed for trading on the New York Stock Exchange under the symbol “AAC.” Prior to that date, there was no public market for our common stock. The following table sets forth the high and low sales prices per share of our common stock as reported on the New York Stock Exchange for the period in which our stock has been listed:
| | High | | | Low | |
Year ended December 31, 2014: | | | | | | | | |
October 2, 2014 - December 31, 2014 | | $ | 33.32 | | | $ | 17.60 | |
Stock Performance Graph
The following graph compares the cumulative total return on our common stock during the period from October 2, 2014 (the day our common stock began trading on the New York Stock Exchange) through December 31, 2014, with the cumulative total return of the S&P 500 Index and the S&P Health Care Index. The S&P 500 Index includes 500 companies representing all major industries. The S&P Health Care Index is a group of 56 companies involved in a variety of health care related businesses. The graph assumes $100 invested on October 2, 2014 in our common stock and in each index and assumes reinvestment of dividends, if any. Stock price performance shown in the graph is not necessarily indicative of future stock performance.
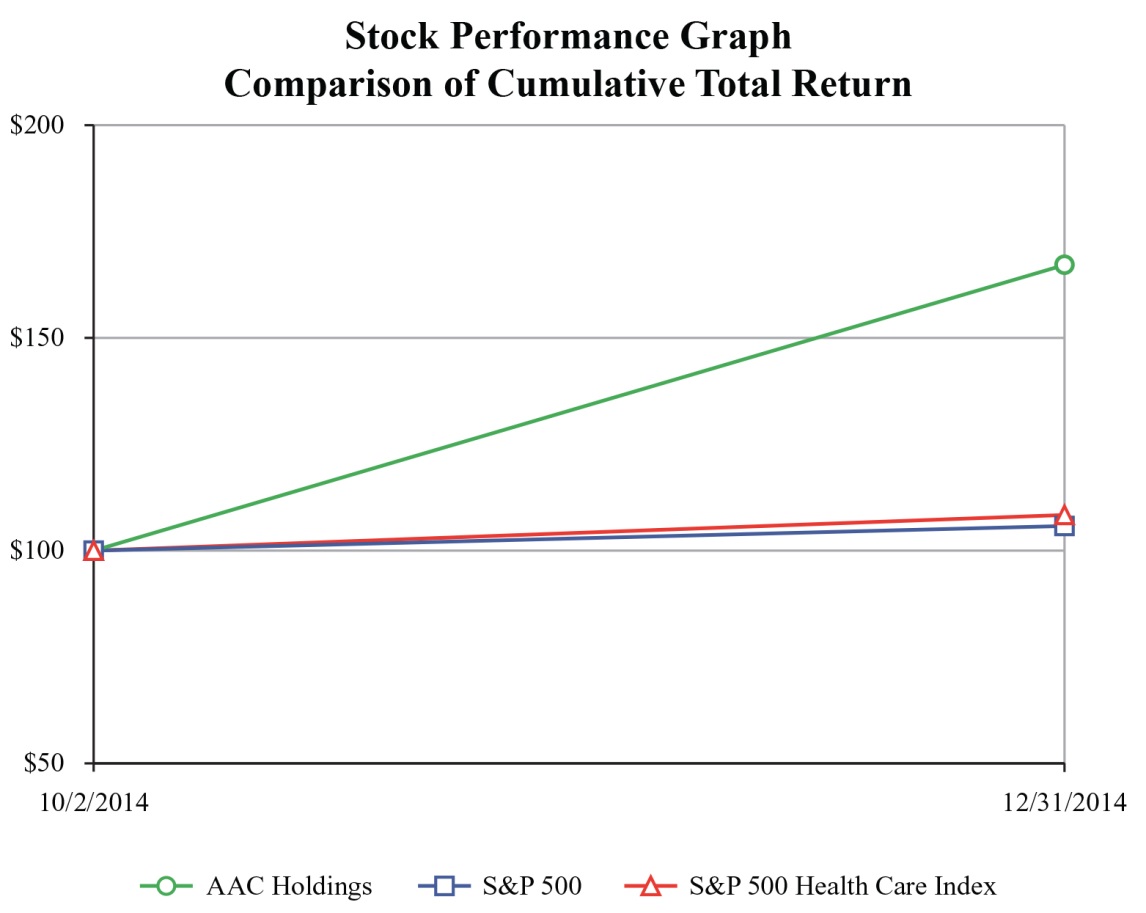
| 10/2/2014 | | | 12/31/2014 | |
AAC Holdings, Inc. | $ | 100.00 | | | $ | 167.14 | |
S&P 500 | $ | 100.00 | | | $ | 105.79 | |
S&P 500 Health Care Index | $ | 100.00 | | | $ | 108.38 | |
33
Holders of Record
On March 5, 2015, the closing price of our common stock on the NYSE was $32.10 per share. As of March 5, 2015, there were approximately 112 holders of record of our common stock. This does not include the number of persons whose stock is in nominee or “street” name accounts through brokers.
Dividend Policy
AAC Holdings, Inc. has never declared or paid cash dividends on our common stock. We currently intend to retain all available funds and any future earnings to support our operations and finance the growth and development of our business, and therefore, we do not anticipate paying cash dividends in the foreseeable future. Any future determination related to the payment of dividends will be made at the discretion of our Board of Directors and will depend on, among other factors, our results of operations, financial condition, capital requirements, contractual restrictions, business prospects and other factors our Board of Directors may deem relevant.
Equity Compensation Plan Information
See Part III, “Item 12—Security Ownership of Certain Beneficial Owners and Management and Related Stockholder Matters” for information regarding securities authorized for issuance under our equity compensation plans.
Unregistered Sale of Equity Securities and Issuer Purchases of Company Stock
In connection with the Reorganization Transactions related to our initial public offering, on April 15, 2014, Holdings issued to certain directors, executive officers, and certain other persons and their affiliates an aggregate of 15,673,334 shares of common stock. Also in connection with the Reorganization Transactions, Holdings assumed the 2007 Plan, which resulted in 111,795 shares of unvested restricted common stock of AAC previously issued to certain of our executive officers being automatically converted into 111,795 shares of unvested restricted common stock of Holdings. Holdings did not purchase any of our equity securities during the three months ended December 31, 2014.
Use of Proceeds from Public Offering of Common Stock
On October 1, 2014 our registration statement on Form S-1 (File No. 333-197383) was declared effective by the Securities and Exchange Commission for our IPO pursuant to which an aggregate of 5,750,000 shares of our common stock were sold at a price to the public of $15.00 per share, which includes the exercise in full of the underwriters' over-allotment option to purchase an additional 250,000 shares from us and 500,000 shares from certain selling stockholders. On October 7, 2014, we closed the sale of such shares, resulting in net proceeds to us of approximately $68.8 million after deducting underwriting discounts and commissions of $5.5 million and other offering expenses of $4.7 million. There has been no material change in the planned use of proceeds from our initial public offering as described in our final prospectus filed with the SEC on October 2, 2014 pursuant to Rule 424(b). As contemplated in our prospectus, dated October 1, 2014, filed pursuant to Rule 424(b) of the Securities Act, we used approximately $14.7 million of the net proceeds from our initial public offering to repay outstanding indebtedness, and $7.3 million in connection with the settlement of certain litigation. Subsequently, in February 2015 we used approximately $13 million of the net proceeds to fund the acquisition of Recovery First and approximately $6.5 million of the net proceeds to fund the purchase of a property in Ringwood, New Jersey.
34
Item 6. Selected Financial Data.
The following table presents our selected historical consolidated financial data as of the dates and for the periods indicated. Holdings was formed as a Nevada corporation on February 12, 2014, and acquired 93.6% of the outstanding shares of common stock of AAC on April 15, 2014 in connection with the Reorganization Transactions related to our initial public offering. As a result of the short-form merger completed in November 2014, AAC is a wholly-owned subsidiary of Holdings. Prior to the completion of the Reorganization Transactions, Holdings had not engaged in any business or other activities except in connection with its formation. Accordingly, all financial data herein relating to periods prior to the completion of the Reorganization Transactions is that of AAC and its consolidated subsidiaries.
The selected financial data presented below for the years ended December 31, 2012, 2013 and 2014 are derived from our audited consolidated financial statements included elsewhere in this Annual Report on Form 10-K. The selected financial data for the year ended December 31, 2011, is derived from our audited consolidated financial statements not included herein. The selected consolidated financial data below should be read in conjunction with the “Management’s Discussion and Analysis of Financial Condition and Results of Operations” and with our consolidated financial statements and notes thereto included elsewhere in this Annual Report on Form 10-K. The selected financial data in this section is not intended to replace our consolidated financial statements and the related notes. Our historical results are not necessarily indicative of results that may be expected in the future.
| | Year Ended December 31, | |
| | 2011 | | | 2012 | | | 2013 | | | 2014 | |
| | (Dollars in thousands, except per share amounts) | |
Income Statement Data: | | | | | | | | | | | | | | | | |
Revenues | | $ | 28,275 | | | $ | 66,035 | | | $ | 115,741 | | | $ | 132,968 | |
Operating expenses: | | | | | | | | | | | | | | | | |
Salaries, wages and benefits | | | 9,171 | | | | 25,680 | | | | 46,856 | | | | 54,707 | |
Advertising and marketing | | | 4,915 | | | | 8,667 | | | | 13,493 | | | | 15,683 | |
Professional fees | | | 1,636 | | | | 5,430 | | | | 10,277 | | | | 8,075 | |
Client related services | | | 5,791 | | | | 8,389 | | | | 7,986 | | | | 10,794 | |
Other operating expenses | | | 2,448 | | | | 6,384 | | | | 11,615 | | | | 13,518 | |
Rentals and leases | | | 1,196 | | | | 3,614 | | | | 4,634 | | | | 2,106 | |
Provision for doubtful accounts | | | 1,063 | | | | 3,344 | | | | 10,950 | | | | 11,391 | |
Litigation settlement(1) | | | — | | | | — | | | | 2,588 | | | | 487 | |
Restructuring(2) | | | — | | | | — | | | | 806 | | | | — | |
Depreciation and amortization | | | 195 | | | | 1,288 | | | | 3,003 | | | | 4,662 | |
Total operating expenses | | | 26,415 | | | | 62,796 | | | | 112,208 | | | | 121,423 | |
Income from operations | | | 1,860 | | | | 3,239 | | | | 3,533 | | | | 11,545 | |
Interest expense, net | | | 337 | | | | 980 | | | | 1,390 | | | | 1,872 | |
Acquisition-related expenses | | | — | | | | — | | | | — | | | | 845 | |
Other (income) expense, net | | | — | | | | 12 | | | | 36 | | | | (93 | ) |
Income before income tax expense | | | 1,523 | | | | 2,247 | | | | 2,107 | | | | 8,921 | |
Income tax expense | | | 652 | | | | 1,148 | | | | 615 | | | | 2,555 | |
Net income | | | 871 | | | | 1,099 | | | | 1,492 | | | | 6,366 | |
Less: net loss (income) attributable to noncontrolling interest(3) | | | — | | | | 405 | | | | (706 | ) | | | 1,182 | |
Net income attributable to AAC Holdings, Inc. stockholders | | | 871 | | | | 1,504 | | | | 786 | | | | 7,548 | |
Deemed contribution—redemption of Series B Preferred Stock | | | — | | | | — | | | | 1,000 | | | | — | |
BHR Series A Preferred Unit dividend | | | — | | | | — | | | | — | | | | (693 | ) |
Net income available to AAC Holdings, Inc. common stockholders | | $ | 871 | | | $ | 1,504 | | | $ | 1,786 | | | $ | 6,855 | |
Earnings per share attributable to common stockholders | | | | | | | | | | | | | | | | |
Basic | | $ | 0.13 | | | $ | 0.12 | | | $ | 0.13 | | | $ | 0.41 | |
Diluted | | $ | 0.13 | | | $ | 0.12 | | | $ | 0.12 | | | $ | 0.41 | |
Weighted-average shares outstanding: | | | | | | | | | | | | | | | | |
Basic | | | 6,735,594 | | | | 12,208,160 | | | | 13,855,797 | | | | 16,557,655 | |
Diluted | | | 6,777,889 | | | | 12,363,164 | | | | 14,291,937 | | | | 16,619,180 | |
Other Financial Information: | | | | | | | | | | | | | | | | |
Adjusted EBITDA(4) | | $ | 2,055 | | | $ | 7,168 | | | $ | 11,558 | | | $ | 21,092 | |
Balance Sheet Data (as of the end of the period): | | | | | | | | | | | | | | | | |
Cash and cash equivalents | | $ | 133 | | | $ | 740 | | | $ | 2,012 | | | $ | 48,540 | |
Working capital (deficit) | | $ | (814 | ) | | $ | 3,190 | | | $ | 1,220 | | | $ | 63,153 | |
Total assets | | $ | 13,043 | | | $ | 53,598 | | | $ | 81,638 | | | $ | 145,952 | |
Total debt, including current portion | | $ | 6,640 | | | $ | 25,222 | | | $ | 43,075 | | | $ | 28,641 | |
Total stockholders' equity (deficit), including noncontrolling interests | | $ | (7,736 | ) | | $ | 4,678 | | | $ | 11,883 | | | $ | 95,141 | |
35
(1) | We recorded a $2.5 million reserve in the second quarter of 2013 in connection with a consolidated wage and hour class action claim. We made a payment of $2.6 million in the second quarter of 2014 to settle the matter. For additional discussion of this litigation settlement, see Note 17 to our audited consolidated financial statements included elsewhere in this Annual Report on Form 10-K. |
(2) | During the first half of 2013, management adopted restructuring plans to centralize our call centers and to close the Leading Edge facility. As a result, aggregate restructuring and exit charges of $0.8 million were recognized in 2013, of which $0.6 million was recognized in the six months ended June 30, 2013. We did not recognize any restructuring expenses during 2012 as expenses related to the corporate relocation were not significant. |
(3) | Represents the net income attributable to the stockholders of AAC that did not exchange their shares for Holdings common stock for the period from April 15, 2014 to November 10, 2014, the net income (loss) attributable to the noncontrolling interest in BHR (for 2012, 2013 and through the acquisition date of April 15, 2014), and the Professional Groups (as defined in “Management’s Discussion and Analysis of Financial Condition and Results of Operations—Consolidation of VIEs” ) (for year ended December 31, 2013 and 2014). |
(4) | Adjusted EBITDA is a “non-GAAP financial measure” as defined under the rules and regulations promulgated by the SEC. We define Adjusted EBITDA as net income adjusted for interest expense, depreciation and amortization expense, income tax expense, stock-based compensation and related tax reimbursements, litigation settlement, restructuring charges, reorganization expense (which includes the April 2014 Reorganization Transactions and expenses associated with the amendment and restatement of our prior credit facility in April 2014), acquisition-related expense, and de novo startup expense. Where applicable, these include professional services for accounting, legal, valuation services and licensing expenses. Adjusted EBITDA, as presented in this annual report on Form 10-K, is considered a supplemental measure of our performance and is not required by, or presented in accordance with, GAAP. Adjusted EBITDA is not a measure of our financial performance under GAAP and should not be considered as an alternative to net income or any other performance measures derived in accordance with GAAP. We have included information concerning Adjusted EBITDA in this annual report on Form 10-K because we believe that such information is used by certain investors as a measure of a company’s historical performance. We believe this measure is frequently used by securities analysts, investors and other interested parties in the evaluation of issuers of equity securities, many of which present EBITDA and Adjusted EBITDA when reporting their results. Because Adjusted EBITDA is not determined in accordance with GAAP, it is subject to varying calculations and may not be comparable to the Adjusted EBITDA (or similarly titled measures) of other companies. Our presentation of Adjusted EBITDA should not be construed as an inference that our future results will be unaffected by unusual or nonrecurring items. The following table presents a reconciliation of Adjusted EBITDA to net income, the most comparable GAAP measure, for each of the periods indicated: |
| | Year Ended December 31, | |
| | 2011 | | | 2012 | | | 2013 | | | 2014 | |
| | (Dollars in thousands) | |
| | | | | | | | | | | | | | | | |
Net Income | | $ | 871 | | | $ | 1,099 | | | $ | 1,492 | | | $ | 6,366 | |
Non-GAAP Adjustments: | | | | | | | | | | | | | | | | |
Interest expense | | | 337 | | | | 980 | | | | 1,390 | | | | 1,872 | |
Depreciation and amortization | | | 195 | | | | 1,288 | | | | 3,003 | | | | 4,662 | |
Income tax expense | | | 652 | | | | 1,148 | | | | 615 | | | | 2,555 | |
Stock-based compensation and related tax reimbursements | | | — | | | | 2,408 | | | | 1,649 | | | | 3,030 | |
Litigation settlement | | | — | | | | — | | | | 2,588 | | | | 487 | |
Restructuring | | | — | | | | — | | | | 806 | | | | — | |
Reorganization | | | — | | | | — | | | | 15 | | | | 1,176 | |
Acquisition-related expense | | | — | | | | 150 | | | | — | | | | 845 | |
De novo start-up expense | | | — | | | | 95 | | | | — | | | | 99 | |
Adjusted EBITDA | | $ | 2,055 | | | $ | 7,168 | | | $ | 11,558 | | | $ | 21,092 | |
36
Item 7. Management’s Discussion and Analysis of Financial Condition and Results of Operations
This Annual Report on Form 10-K, the documents that it incorporates by reference and the documents into which it may be incorporated by reference, may contain, and from time to time the Company and its managements may make certain statements that constitute forward-looking statements within the meaning of the Private Securities Litigation Reform Act of 1995. These statements can be identified by the fact that they do not relate strictly to historical or current facts. In some cases, you can identify forward-looking statements by terms such as “anticipates,” “believes,” “could,” “estimates,” “expects,” “may,” “potential,” “predicts,” “projects,” “should,” “will,” “would,” and similar expressions intended to identify forward-looking statements, although not all forward-looking statements contain these words. Forward-looking statements may include information concerning our possible or assumed future results of operations, including descriptions of our revenues, profitability, outlook and overall business strategy. These statements involve known and unknown risks, uncertainties and other factors that may cause our actual results and performance to be materially different from the information contained in the forward-looking statements. These risks, uncertainties and other factors include, without limitation: (i) our inability to operate our facilities; (ii) our reliance on our sales and marketing program to continuously attract and enroll clients; (iii) a reduction in reimbursement rates by certain third-party payors; (iv) our failure to successfully achieve growth through acquisitions and de novo expansions; and (v) general economic conditions and other similar matters, as well as other risks discussed in the “Risk Factors” section. As a result of these factors, we cannot assure you that the forward-looking statements in this quarterly report will prove to be accurate. Investors should not place undue reliance upon forward looking statements. These forward-looking statements speak only as of the date they are made, and the Company undertakes no obligation to update any forward-looking statement to reflect the impact of circumstances or events that arise after the date the forward-looking statement was made.
Overview
General. We believe we are a leading provider of inpatient substance abuse treatment services for individuals with drug and alcohol addiction. As of December 31, 2014, we operated six substance abuse treatment facilities located throughout the United States, focused on delivering effective clinical care and treatment solutions across our 473 beds, which includes 338 licensed detoxification beds. With the completion of the acquisition of the Recovery First, the opening of our Desert Hope Outpatient Center and the addition of 31 beds at our Forterus facility (all subsequent to December 31, 2014), as of March 1, 2015, we operated seven residential and one outpatient substance treatment facilities across 560 beds, which includes 382 licensed detoxification beds. In addition, as of March 1, 2015 we had two facilities under development, a recently acquired property on which we expect to begin renovations and construction in the second quarter of 2015, an additional property under contract that we plan to develop into a new facility, and an outpatient treatment facility under contract. The majority of our approximately 900 employees, as of March 1, 2015, are highly trained clinical staff who deploy research-based treatment programs with structured curricula for detoxification, residential treatment, partial hospitalization and intensive outpatient care. By applying a tailored treatment program based on the individual needs of each client, many of whom require treatment for a co-occurring mental health disorder, such as depression, bipolar disorder and schizophrenia, we believe we offer the level of quality care and service necessary for our clients to achieve and maintain sobriety.
De Novo Facilities. We have completed two successful de novo development projects. In March 2012, we opened Greenhouse in a suburb of Dallas, Texas, which initially provided us with 70 licensed residential and detoxification beds. In January 2013, we opened Desert Hope in Las Vegas, Nevada, which provided us with 148 licensed residential and detoxification beds. We refer to these two development projects as the “De Novo Facilities.” Both facilities were extensively renovated and remodeled to convert them into high quality inpatient treatment centers, and each achieved profitability in its first year of operation. We believe we were able to quickly increase census at our De Novo Facilities through increased sales and marketing efforts prior to each facility opening. The real property at the De Novo Facilities was leased from BHR until April 2014. As a result of the BHR Acquisition in April 2014, we acquired ownership of the real estate properties on which the De Novo Facilities operate.
TSN Facilities. On August 31, 2012, we acquired the outpatient treatment operations of Singer Island (65 beds in West Palm Beach, Florida), The Academy (12 beds in West Palm Beach, Florida) and Leading Edge (70 beds in Trenton, New Jersey) (collectively, the “TSN Facilities”), for an aggregate purchase price of $14.6 million (collectively, the “TSN Acquisition”). In connection with the TSN Acquisition, we issued 1,396,518 shares of AAC common stock (1,040,791 unrestricted shares and 355,727 restricted shares at a fair value of $3.99 per share), valued collectively at $5.6 million; paid cash of $2.5 million from proceeds received from bank financing; and issued $6.5 million of subordinated notes to the sellers to fund the acquisition. The TSN Acquisition provided us with a professional sales force and a referral network of hospitals, other treatment facilities, employers, alumni, and employee assistance programs, along with established internet sites and toll free numbers. Collectively, these sales channels have contributed to an increase in our average monthly admissions of over 95 clients from September 2012 through December 2014. The Leading Edge facility was closed in the second quarter of 2013 because management determined the amenities and service offerings at the facility were inconsistent with our long-term strategy and brand.
37
Recent Developments and Acquisitions
Existing Facilities and Laboratory Services
On November 20, 2014, we received licensure to conduct high complexity lab tests for AAC facilities in Florida, the first of which were processed beginning on December 1, 2014.
On January 6, 2015, we entered into an Office Space Lease (the “Lease Agreement”) for our new corporate headquarters and call center pursuant to which AAC agreed to lease approximately 102,000 square feet of office space located in Brentwood, Tennessee. The initial term of the Lease Agreement will be for ten years from the date the premises are delivered to AAC (the “Initial Term”), and AAC has one option to extend the Lease Agreement for five years. Base rent under the Lease Agreement is expected to be approximately $195,473 per month in the first year of the Initial Term, subject to certain fixed increases over the course of the Initial Term as set forth in the Lease Agreement.
On January 8, 2015 our 20,000 square foot substance abuse outpatient center in Las Vegas, Nevada, received licensure for intensive outpatient treatment services and has begun treating patients at the facility.
On January 1, 2015 we increased capacity at our Forterus facility in Temecula, California with the addition of 31 beds, including 24 detox beds.
Acquisitions
On February 20, 2015, we completed the acquisition of the assets of Recovery First, a Florida-based provider of substance abuse treatment and rehabilitation services, including a 56-bed inpatient substance abuse treatment facility in the greater Fort Lauderdale, Florida area, for cash consideration of $13 million.
On January 23, 2015, we signed a definitive agreement to acquire CSRI, a provider of intensive outpatient substance abuse treatment services, for $665,000 in cash and approximately $1.3 million in restricted shares of common stock. The acquisition, which is subject to certain closing conditions such as the assignment of certain contracts and the receipt of certain licenses necessary to operate the business, is expected to close during the second quarter of 2015.
On January 28, 2015, we signed a definitive agreement for the acquisition of an 84-bed hospital in Aliso Viejo, California for an aggregate of $13.5 million in cash. The closing is expected to occur during the second quarter of 2015 and is subject to certain closing conditions, including the amendment or removal of certain use restrictions on the property. We expect to begin renovation and rehabilitation of the facility in the second quarter of 2015 and expect to apply for a license to operate it as a Chemical Dependency Recovery Hospital (“CDRH”). We expect to invest approximately $5 million for renovations and construction, which will include up to an additional 40 beds and have targeted a completion date for the first half of 2016. After renovations and construction, we currently anticipate this facility will provide us with up to 124 beds.
On February 24, 2015, we completed the purchase of a property in Ringwood, New Jersey for aggregate cash consideration of $6.5 million, which we expect to develop into an inpatient facility with approximately 150 beds. We expect to invest approximately $16 million for renovations and construction.
Financing
On December 18, 2014, we terminated our Second Amended and Restated Credit Agreement by and among the Company, AAC, the lenders party thereto from time to time and Wells Fargo Bank, National Association, as administrative agent and collateral agent for the lenders, dated as of April 15, 2014, as amended (the “2014 Credit Agreement”), after having repaid the outstanding principal balance of $487,500 plus accrued interest. The 2014 Credit Agreement, as in effect at the time of termination, made available to the Company a $15.0 million revolving line of credit, subject to borrowing base limitations. The 2014 Credit Agreement also included one outstanding term loan in the outstanding principal amount of $0.5 million. The Company did not incur any early termination penalties as a result of the early termination of the 2014 Credit Agreement.
On March 9, 2015, we entered into a five year $125 million Senior Secured Credit Facility by and among the Company and Bank of America, N.A., as administrative agent for the lenders party thereto. For additional discussion related to the 2015 Credit Facility, see “Management’s Discussion and Analysis of Financial Condition and Results of Operations—Financing Relationships.”
38
Components of Results of Operations
Revenues. Our revenues primarily consist of service charges related to providing addiction treatment and related services, including the collection and laboratory testing of urine for controlled substances. We recognize revenues at the estimated net realizable value in the period in which services are provided. For the year ended December 31, 2014, approximately 90% of our revenues were reimbursable by commercial payors, including amounts paid by such payors to clients, with the remaining revenues payable directly by our clients. Given the scale and nationwide reach of our network of substance abuse treatment facilities, we generally have the ability to serve clients located across the country from any of our facilities, which allows us to operate our business and analyze revenue on a system-wide basis rather than focusing on any individual facility. For the years ended December 31, 2014 and 2013, no single payor accounted for more than 18.1% and 12.3% of our revenue reimbursements, respectively. For the years ended December 31, 2014 and 2013, we estimate that revenues derived from partial hospitalization and intensive outpatient treatment services accounted for approximately 45.7% and 45.9%, respectively, of our commercial payor revenues, detoxification and residential treatment services accounted for approximately 28.0% and 31.8% of our commercial payor revenues, respectively, and point-of-care drug testing, quantitative laboratory services, professional groups and other ancillary services accounted for approximately 26.3% and 22.3% of our commercial payor revenues, respectively.
We recognize revenues from commercial payors at the time services are provided based on our estimate of the amount that payors will pay us for the services performed. We estimate the net realizable value of revenues by adjusting gross client charges using our expected realization and applying this discount to gross client charges. Through December 31, 2013, our expected realization was determined by management after taking into account historical collections received from the commercial payors since our inception compared to the gross client charges billed. Beginning in January 2014, we enhanced our methodology related to our net realizable value to more quickly react to potential changes in reimbursements by facility, by type of service and by payor. As a result, management adjusted the expected realization discount, on a per facility basis, to reflect a historical analysis of reimbursement data by facility in addition to considering the type of services provided, the payors and the gross client charge rates by facility.
Our accounts receivable primarily consists of amounts due from commercial payors. The client self-pay portion is usually collected upon admission and in limited circumstances the client will make a deposit and negotiate the remaining payments as part of the services. We do not recognize revenue for any amounts not collected from the client in either of these situations. From time to time, we may provide free care to a limited number of clients, which we refer to as scholarships. We do not recognize revenues for scholarships provided. Included in the aging of accounts receivable are amounts for which the commercial insurance company paid out-of-network claims directly to the client and for which the client has yet to remit the insurance payment to us (which we refer to as “paid to client”). Such amounts paid to clients continue to be reflected in our accounts receivable aging as amounts due from commercial payors. Accordingly, our accounts receivable aging does not provide for the distinct identification of paid to client receivables.
Operating Expenses. Our operating expenses are primarily impacted by eight categories of expenses: salaries, wages and benefits; advertising and marketing; professional fees; client related services; other operating expenses; rentals and leases; provision for doubtful accounts; and depreciation and amortization.
· | Salaries, wages and benefits. We employ a variety of staff related to providing client care, including case managers, therapists, medical technicians, housekeepers, cooks and drivers, among others. Our clinical salaries, wages and benefits expense is largely driven by the total number of beds in our facilities and our average daily census. We also employ a professional sales force and staff a centralized call center. Our corporate staff includes accounting, billing and finance professionals, marketing and human resource personnel, IT staff and senior management. |
· | Advertising and marketing. We promote our treatment facilities through a variety of channels including television advertising, internet search engines and Yellow Page advertising, among others. While we do not compensate our referral sources for client referrals, we do have arrangements with multiple marketing channels that we pay on a performance basis (i.e., pay per click or pay per inbound call). We also host and attend industry conferences. Our advertising and marketing efforts and expense is largely driven by the total number of available beds in our facilities. |
· | Professional fees. Professional fees consist of various professional services used to support primarily corporate related functions. These services include client billings and collections, accounting related fees for financial statement audits and tax preparation and legal fees for, among other matters, employment, compliance and general corporate matters. These fees also include information technology, consulting, payroll fees and national medical director fees. |
· | Client related services. Client related services consist of physician and medical services as well as client meals, pharmacy, travel, and various other expenses associated with client treatment, including the cost of contractual arrangements for the treatment of clients where the demand for services exceed our capacity. Client related services are significantly influenced by our average daily census. |
39
· | Other operating expenses. Other operating expenses consists primarily of utilities, insurance, telecom, travel and repairs and maintenance expenses, and is significantly influenced by the total number of beds in our facilities and our average daily census. |
· | Rentals and leases. Rentals and leases mainly consist of properties under various equipment and operating leases, which includes space required to perform client services and space for administrative facilities. |
· | Provision for doubtful accounts. The provision for doubtful accounts represents the expense associated with management’s best estimate of accounts receivable that could become uncollectible in the future. We establish our provision for doubtful accounts based on the aging of the receivables, historical collection experience by facility, services provided, payor source and historical reimbursement rate, current economic trends and percentages applied to the accounts receivable aging categories. As of December 31, 2014, all accounts receivable aged greater than 360 days were fully reserved in our consolidated financial statements. In assessing the adequacy of the allowance for doubtful accounts, we rely on the results of detailed reviews of historical write-offs and recoveries (the hindsight analysis) as a primary source of information to utilize in estimating the collectability of our accounts receivable. We perform the hindsight analysis on a quarterly basis, utilizing rolling twelve-month accounts receivable collection, write-off and recovery data. We supplement this hindsight analysis with other analytical tools, including, but not limited to, historical trends in cash collections compared to net revenues less bad debt and days sales outstanding. During the second quarter of 2014, management analyzed the past two years of accounts receivable collection and write-off history and the current projected bad debt write-offs for all client accounts covered by insurance. Based on the results of this analysis, including improvements noted in the credit quality of receivables aged 120-180 days, management concluded that the current methodology for establishing the allowance for doubtful accounts resulted in, and would continue to result in, an overstatement of the reserve requirement. As a result, management revised the estimates used to establish the provision for doubtful accounts, effective as of the second quarter of 2014. This change in estimate reduced the reserve percentages applied to various aging classes of accounts receivable aged less than 360 days to more closely reflect actual collection and write-off history that we have experienced and expect to experience in the future. |
· | Depreciation and amortization. Depreciation and amortization represents the ratable use of our capitalized property and equipment, including assets under capital leases, over the estimated useful lives of the assets, and amortizable intangible assets, which mainly consist of trademark-related intangibles and non-compete agreements. |
Key Drivers of Our Results of Operations. Our results of operations and financial condition are affected by numerous factors, including those described under “Risk Factors” and those described below:
· | Average Daily Census. We refer to the average number of clients to whom we are providing services on a daily basis over a specific period as our “average daily census.” Our revenues are directly impacted by our average daily census, which fluctuates based on the effectiveness of our sales and marketing efforts, total number of beds, the number of client admissions and discharges in a period, average length of stay, and the ratio of clinical staff to clients. |
· | Average Daily Revenue and Average Net Daily Revenue. Our average daily revenue is a per census metric equal to our total revenues for a period divided by our average daily census for the same period divided by the number of days in the period. Our average net daily revenue is a per census metric equal to our total revenues less provision for doubtful accounts for a period divided by our average daily census for the same period divided by the number of days in the period. The key drivers of average daily revenue and average net daily revenue include the mix of services and level of care that we provide to our clients during the period and payor mix. We provide a broad continuum of services including detoxification, residential treatment, partial hospitalization and intensive outpatient care, with detoxification resulting in the highest daily charges and intensive outpatient care resulting in the lowest daily charges. We also generate revenues from laboratory and other ancillary services associated with serving our clients. We tend to experience higher margins from our urinalysis testing services, which are conducted both on-site at all of our treatment facilities and at our centralized laboratory facility in Brentwood, Tennessee, than we do from other ancillary services. |
40
· | Billed Days. We refer to billed days as the number of days in a given period for which we charged a commercial payor for the category of services provided. Detoxification and residential treatment levels of care feature higher per day gross client charges than partial hospitalization and intensive outpatient levels of care, but also require greater levels of more highly trained medical staff. For the year ended December 31, 2014, detoxification and residential treatment services accounted for 27% of total billed days, and partial hospitalization and intensive outpatient services accounted for the remaining 73% of total billed days. Average length of stay can vary among periods without correlating to the overall operating performance of our business and, as a result, management does not view average length of stay as a key metric with respect to our operating performance. Rather, management views average billed days for the levels of care as a more meaningful metric to investors because it refers to the number of days in a given period for which we billed for the category of services provided. For example, in any given week, clients receiving partial hospitalization and intensive outpatient services might only qualify for five or three days, respectively, of reimbursable services during a seven day calendar period, which results in fewer billed days (e.g., five or three days, respectively) than the average length of stay (e.g., seven days) for partial hospitalization and intensive outpatient services during the same weekly period. The following table presents, for the year ended December 31, 2014, the average length of stay and average billed days with respect to detoxification and residential treatment services and partial hospitalization and intensive outpatient services of our commercial payor clients: |
| | Average | | | | | |
| | Length of | | | Average | |
| | Stay | | | Billed Days | |
Detoxification and residential treatment services | | | 7 | | | | 7 | |
Partial hospitalization and intensive outpatient services | | | 26 | | | | 16 | |
The average length of stay and average billed days with respect to our private pay clients, which is not separately allocated to any category of service, was 35 days and 23 days, respectively for the year ended December 31, 2014.
· | Expense Management. Our profitability is directly impacted by our ability to manage our expenses, most notably salaries, wages and benefits and advertising and marketing costs, and to adjust accordingly based upon our capacity. |
· | Billing and Collections. Our revenues and cash flow are directly impacted by our ability to properly verify our clients’ insurance benefits, obtain authorization for levels of care, properly submit insurance claims and manage collections. |
41
Results of Operations
The following table presents our consolidated income statements for the periods indicated (dollars in thousands):
| | Year ended December 31, | |
| | 2012 | | | 2013 | | | 2014 | |
| | Amount | | | % | | | Amount | | | % | | | Amount | | | % | |
Revenues | | $ | 66,035 | | | | 100.0 | | | $ | 115,741 | | | | 100.0 | | | $ | 132,968 | | | | 100.0 | |
Operating expenses | | | | | | | | | | | | | | | | | | | | | | | | |
Salaries, wages and benefits | | | 25,680 | | | | 38.9 | | | | 46,856 | | | | 40.5 | | | | 54,707 | | | | 41.1 | |
Advertising and marketing | | | 8,667 | | | | 13.1 | | | | 13,493 | | | | 11.7 | | | | 15,683 | | | | 11.8 | |
Professional fees | | | 5,430 | | | | 8.2 | | | | 10,277 | | | | 8.9 | | | | 8,075 | | | | 6.1 | |
Client related services | | | 8,389 | | | | 12.7 | | | | 7,986 | | | | 6.9 | | | | 10,794 | | | | 8.1 | |
Other operating expenses | | | 6,384 | | | | 9.7 | | | | 11,615 | | | | 10.0 | | | | 13,518 | | | | 10.2 | |
Rentals and leases | | | 3,614 | | | | 5.5 | | | | 4,634 | | | | 4.0 | | | | 2,106 | | | | 1.6 | |
Provision for doubtful accounts | | | 3,344 | | | | 5.1 | | | | 10,950 | | | | 9.5 | | | | 11,391 | | | | 8.6 | |
Litigation settlement | | | — | | | | — | | | | 2,588 | | | | 2.2 | | | | 487 | | | | 0.4 | |
Restructuring | | | — | | | | — | | | | 806 | | | | 0.7 | | | | — | | | | — | |
Depreciation and amortization | | | 1,288 | | | 1.9 | | | | 3,003 | | | | 2.6 | | | | 4,662 | | | | 3.5 | |
Total operating expenses | | | 62,796 | | | | 95.1 | | | | 112,208 | | | | 97.0 | | | | 121,423 | | | | 91.4 | |
Income from operations | | | 3,239 | | | | 4.9 | | | | 3,533 | | | | 3.0 | | | | 11,545 | | | | 8.6 | |
Interest expense, net | | | 980 | | | | 1.5 | | | | 1,390 | | | | 1.2 | | | | 1,872 | | | | 1.4 | |
Acquisition-related expenses | | | — | | | | — | | | | — | | | | — | | | | 845 | | | | 0.6 | |
Other (income) expense, net | | | 12 | | | 0.0 | | | | 36 | | | | — | | | | (93 | ) | | | (0.1 | ) |
Income before income tax expense | | | 2,247 | | | | 3.4 | | | | 2,107 | | | | 1.8 | | | | 8,921 | | | | 6.7 | |
Income tax expense | | | 1,148 | | | | 1.7 | | | | 615 | | | | 0.5 | | | | 2,555 | | | | 1.9 | |
Net income | | | 1,099 | | | | 1.7 | | | | 1,492 | | | | 1.3 | | | | 6,366 | | | | 4.8 | |
Less: net loss (income) attributable to noncontrolling interest | | | 405 | | | | 0.6 | | | | (706 | ) | | | (0.6 | ) | | | 1,182 | | | | 0.9 | |
Net income attributable to AAC Holdings, Inc. stockholders | | | 1,504 | | | | 2.3 | | | | 786 | | | | 0.7 | | | | 7,548 | | | | 5.7 | |
Deemed contribution – redemption of Series B Preferred Stock | | | — | | | | — | | | | 1,000 | | | | 0.8 | | | | — | | | | — | |
BHR Series A Preferred Units dividend | | | — | | | | — | | | | — | | | | — | | | | (693 | ) | | | (0.5 | ) |
Net income available to AAC Holdings, Inc. common stockholders | | $ | 1,504 | | | | 2.3 | | | $ | 1,786 | | | | 1.5 | | | $ | 6,855 | | | | 5.2 | |
Comparison of Year ended December 31, 2014 to Year ended December 31, 2013
Revenues
Revenues increased $17.3 million, or 15.0%, to $133.0 million for the year ended December 31, 2014 from $115.7 million for the year ended December 31, 2013. Revenues were positively impacted by a 16.8% increase in average daily census to 396 for the year ended December 31, 2014 from 339 for the year ended December 31, 2013. The increase in average daily census was driven by the 60 bed expansion of the Greenhouse facility in July 2014 and the continued expansion of both our outside sales force and our national advertising program. While revenues were positively impacted by the increase in average daily census, this increase was partially offset by a 1.6% decrease in average daily revenue to $920 for the year ended December 31, 2014 from $935 for the year ended December 31, 2013. As previously disclosed, through December 31, 2013, our expected realization was determined by management after taking into account historical collections received from the commercial payors since our inception compared to the gross client charges billed. Beginning in January 2014, we enhanced our methodology related to our net realizable value to more quickly react to potential changes in reimbursements by facility, by type of service and by payor. As a result, management adjusted the expected realization to reflect a historical analysis of reimbursement data by facility in addition to considering the type of services provided, the payors and the gross client charge rates. This adjustment resulted in a decrease in our expected realization in 2014.
42
Salaries, Wages and Benefits
Salaries, wages and benefits increased $7.8 million, or 16.6%, to $54.7 million for the year ended December 31, 2014 from $46.9 million for the year ended December 31, 2013. As a percentage of revenues, salaries, wages and benefits were 41.1% of revenues for the year ended December 31, 2014 compared to 40.5% of revenues for the year ended December 31, 2013. The increase was primarily related to the impact of stock compensation expense for the year ended December 31, 2014 compared to the year ended December 31, 2013 relating to the vesting of equity award grants under our 2007 Stock Incentive Plan. Also, our Chief Operating Officer commenced employment in February 2013 and our General Counsel and Secretary commenced employment in December 2013. Accordingly, our salaries, wages and benefits for the year ended December 31, 2014 included their salaries for the entire period of 2014. The increase was also impacted by the addition of staff in connection with the CRMS Acquisition in April 2014.
Advertising and Marketing
Advertising and marketing expenses increased $2.2 million, or 16.3%, to $15.7 million for the year ended December 31, 2014 from $13.5 million for the year ended December 31, 2013. As a percentage of revenues, advertising and marketing expenses were 11.8% of revenues for the year ended December 31, 2014 compared to 11.7% of revenues for the year ended December 31, 2013. The increase was primarily driven by the expansion of our national advertising program, an increased emphasis on internet advertising campaigns and marketing efforts targeted at increasing census for the Greenhouse facility expansion, which was completed in July 2014.
Professional Fees
Professional fees decreased $2.2 million, or 21.4%, to $8.1 million for the year ended December 31, 2014 from $10.3 million for the year ended December 31, 2013. As a percentage of revenues, professional fees were 6.1% of revenues for the year ended December 31, 2014 compared to 8.9% of revenues for the year ended December 31, 2013. The decrease in professional fees is primarily related to the elimination of customer and billing collection fees as a result of the CRMS Acquisition in April 2014.
Client Related Services
Client related service expenses increased $2.8 million, or 35.0%, to $10.8 million for the year ended December 31, 2014 from $8.0 million for the year ended December 31, 2013. As a percentage of revenues, client related services expenses were 8.1% of revenues for the year ended December 31, 2014 compared to 6.9% of revenues for the year ended December 31, 2013. The increase was primarily related to increases in clinician fees paid due to greater census in detoxification and residential beds which require greater numbers of more highly qualified medical staff. Detoxification and residential treatment services accounted for 27% of total billed days for the year ended December 31, 2014 compared to 23% of total billed days for the year ended December 31, 2013. Also contributing to the increase in client related service expenses are increases in clinician fees as a result of the consolidation of the Professional Groups effective October 1, 2013.
Other Operating Expenses
Other operating expenses increased $1.9 million, or 16.4%, to $13.5 million for the year ended December 31, 2014 from $11.6 million for the year ended December 31, 2013. As a percentage of revenues, other operating expenses were 10.2% of revenues for the year ended December 31, 2014 compared to 10.0% of revenues for the year ended December 31, 2013.
Rentals and Leases
Rentals and leases decreased $2.5 million, or 54.3%, to $2.1 million for the year ended December 31, 2014 from $4.6 million for the year ended December 31, 2013. As a percentage of revenues, rentals and leases were 1.6% of revenues for the year ended December 31, 2014 compared to 4.0% of revenues for the year ended December 31, 2013. The decrease was primarily related to a reduction in rent expense resulting from the consolidation of Greenhouse Real Estate, LLC effective October 8, 2013 and the BHR Acquisition in April 2014.
Provision for Doubtful Accounts
The provision for doubtful accounts increased $0.4 million, or 3.6%, to $11.4 million for the year ended December 31, 2014 from $11.0 million for the year ended December 31, 2013. As a percentage of revenues, the provision for doubtful accounts was 8.6% of revenues for the year ended December 31, 2014 compared to 9.5% of revenues for the year ended December 31, 2013.
We establish our provision for doubtful accounts based on the aging of the receivables and taking into consideration historical collection experience by facility, services provided, payor source and historical reimbursement rate, current economic trends and percentages applied to the accounts receivable aging categories. As of December 31, 2014, all accounts receivable aged greater than
43
360 days were fully reserved in our consolidated financial statements. In assessing the adequacy of the allowance for doubtful accounts, we rely on the results of detailed reviews of historical write-offs and recoveries (the hindsight analysis) as a primary source of information to utilize in estimating the collectability of our accounts receivable. We perform the hindsight analysis on a quarterly basis, utilizing rolling twelve-month accounts receivable collection, write-off and recovery data. We supplement this hindsight analysis with other analytical tools, including, but not limited to, historical trends in cash collections compared to net revenues less bad debt and days sales outstanding.
During the second quarter of 2014, management analyzed the past two years of accounts receivable collection and write-off history and the current projected bad debt write-offs for all client accounts covered by insurance. Based on the results of this analysis, including improvements noted in the credit quality of receivables aged 120-180 days, management concluded that the current methodology for establishing the allowance for doubtful accounts resulted in, and would continue to result in, an overstatement of the reserve requirement. As a result, management revised the estimates used to establish the provision for doubtful accounts, effective as of the second quarter of 2014. This change in estimate reduced the reserve percentages applied to various aging classes of accounts receivable aged less than 360 days to more closely reflect actual collection and write-off history that we have experienced and expect to experience in the future. These adjustments resulted in a reserve release of approximately $1.5 million during the second quarter of 2014.
During the third and fourth quarters of 2014, we continued to experience favorable collections of accounts receivable as noted by a decrease in accounts receivable aged greater than 180 days as a percentage of total accounts receivable to 24.1% at December 31, 2014 from 36.3% at December 31, 2013.
The following table presents a summary of our aging of accounts receivable as of December 31, 2013 and 2014:
| | Current | | 31-180 Days | | Over 180 Days | | Total | |
December 31, 2013 | | | 22.8 | % | | 40.9 | % | | 36.3 | % | | 100.0 | % |
December 31, 2014 | | | 28.9 | % | | 47.0 | % | | 24.1 | % | | 100.0 | % |
Our days sales outstanding as of December 31, 2013 and 2014 were 77 and 79 days, respectively. The increase in our days sales outstanding was directly attributable to increases in our revenue that occurred in the second half of 2014, primarily as a result of the 60 bed Greenhouse expansion which occurred in July 2014, but for which a full year of revenues are not yet reflected in our 2014 results. Our quarterly days sales outstanding as of December 31, 2014 was 71 days.
Litigation Settlement
Litigation settlement expense decreased $2.1 million, or 80.8%, to $0.5 million for the year ended December 31, 2014 from $2.6 million for the year ended December 31, 2013. As a percentage of revenues, litigation settlement expense was 0.4% of revenues for the year ended December 31, 2014 compared to 2.2% of revenues for the year ended December 31, 2013. The year ended December 31, 2013 reflects $2.5 million of litigation settlement expense related to State of California wage and hour class action claim.
Restructuring
Restructuring expenses for the year ended December 31, 2013 were $0.8 million. Two call centers were closed in the third quarter of 2013 and were consolidated with the existing call center at our headquarters in Brentwood, Tennessee to create a centralized call center. The call center operations were centralized in order to manage costs more effectively and optimize the call center’s view of client services, thus streamlining the placement of clients to treatment facilities. In addition, the Leading Edge facility, which was acquired in the 2012 TSN Acquisition, was closed in June 2013. Management elected to close the facility because the amenities and the service offerings at the facility were inconsistent with our long-term strategy. During the transition period leading up to closing, clients that would have been candidates for the Leading Edge facility were referred to other treatment facilities, primarily Desert Hope. As a result of the facility closure, we recorded restructuring and exit charges of $0.5 million in the year ended December 31, 2013. These charges consisted of $0.2 million of payroll, severance and employee related costs and facility exit costs related to ongoing lease obligations of approximately $0.3 million. Restructuring expenses related to centralizing the call centers totaled $0.3 million in the year ended December 31, 2013 related to severance and relocation costs.
Depreciation and Amortization
Depreciation and amortization expense increased $1.7 million, or 56.7%, to $4.7 million for the year ended December 31, 2014 from $3.0 million for the year ended December 31, 2013. As a percentage of revenues, depreciation and amortization expense was
44
3.5% of revenues for the year ended December 31, 2014 compared to 2.6% of revenues for the year ended December 31, 2013. The increase was primarily the result of the consolidation of Greenhouse Real Estate, LLC in October 2013 and the acquisition of BHR in April 2014. The increase in depreciation and amortization expense was also attributable to additions of property and equipment.
Acquisition-related Expense
Acquisition-related expense was $0.8 million for the year ended December 31, 2014. As a percentage of revenues, acquisition-related expense was 0.6% of revenues for the year ended December 31, 2014. The acquisition-related expense for the year ended December 31, 2014 was primarily related to professional fees associated with our acquisition activity in the fourth quarter of 2014. For the year ended December 31, 2013, we did not recognize any acquisition-related expense.
Interest Expense
Interest expense was $1.9 million for the year ended December 31, 2014 and $1.4 million for the year ended December 31, 2013. As a percentage of revenues, interest expense was 1.4% of revenues for the year ended December 31, 2014 compared to 1.2% of revenues for the year ended December 31, 2013. The increase in interest expense is related to the consolidation of Greenhouse Real Estate, LLC in October 2013, and the additional interest expense related to increased outstanding debt obligations associated with the Greenhouse expansion, which was completed in July 2014. In July 2014, the Company also entered into two interest rate swap agreements to mitigate its exposure to interest rate risks. The interest rate swap agreements have a combined initial notional amount of $21.6 million which fix the interest rates over the life of the interest rate swap agreement. The Company has not designated the interest rate swaps as hedges and, therefore, changes in the fair value of the interest rate swaps are included in interest expense in the audited consolidated income statements. The change in fair value during year ended December 31, 2014 was approximately $431,000.
Income Tax Expense
For the year ended December 31, 2014, income tax expense was $2.6 million, reflecting an effective tax rate of 28.6%, compared to $0.6 million, reflecting an effective tax rate of 29.2%, for the year ended December 31, 2013.
Net Loss (Income) Attributable to Noncontrolling Interest
For the year ended December 31, 2014, net loss attributable to noncontrolling interest was $1.2 million compared to net income attributable to noncontrolling interest of $0.7 million for the year ended December 31, 2013, representing a $1.9 million change. This change was primarily the result of the consolidation of the Professional Groups effective October 1, 2013.
Comparison of Year ended December 31, 2013 to Year ended December 31, 2012
Revenues
Revenues increased $49.7 million, or 75.3%, to $115.7 million for the year ended December 31, 2013 from $66.0 million for the year ended December 31, 2012. The increase resulted primarily from our average daily census increasing to 339 in 2013 from 238 in 2012, or 42.4%, and average daily revenue increasing to $935 in 2013 from $759 in 2012, or 23.2%. This growth was attributable to opening the De Novo Facilities as well as added capacity from the TSN Facilities.
Revenues generated from our De Novo Facilities were $52.9 million in 2013 compared to $13.8 million in 2012. The substantial increase was the result of the opening dates of the new facilities. The 70-bed Greenhouse facility started accepting clients in March 2012, and the 148-bed Desert Hope facility opened in January 2013. In addition, the TSN Facilities generated revenues of $24.1 million in 2013 compared to $11.0 million in 2012. The year-over-year increase with respect to the TSN Facilities was the result of a full year of revenues recorded during 2013, while 2012 only included a relatively short partial year with respect to these facilities. The additional sales channels provided by the TSN Acquisition also contributed to the revenue increase by improving our average daily census. The increases in revenues were offset by a $3.5 million decrease at other existing facilities.
As previously noted, we closed one of the TSN Facilities (Leading Edge) in the second quarter of 2013; however, our other facilities were able to absorb the majority of the closed facility’s clients, resulting in an insignificant loss of consolidated revenues.
Salaries, Wages and Benefits
Salaries, wages and benefits increased $21.2 million, or 82.5%, to $46.9 million for the year ended December 31, 2013 from $25.7 million for the year ended December 31, 2012. As a percentage of revenues, salaries, wages and benefits were 40.5% of revenues for the year ended December 31, 2013 compared to 38.9% of revenues for the year ended December 31, 2012. The increase was primarily related to (i) the addition of 208 employees in connection with the TSN Acquisition and 97 employees in conjunction
45
with the opening of Desert Hope in January 2013 and (ii) an increase in our corporate staff, including the expansion of our sales force and call center. In addition, our total number of employees grew to 629 at December 31, 2013 from 231 at the beginning of 2012. In addition, salaries, wages and benefits expense for the year ended December 31, 2013 included $3.5 million of discretionary bonuses of cash and stock in December 2013 to our executive officers, of which $2.5 million was paid or granted as of December 31, 2013 and $1.0 million is included in accrued liabilities on the consolidated balance sheet at December 31, 2013.
Advertising and Marketing
Advertising and marketing expenses increased $4.8 million, or 55.7%, to $13.5 million for the year ended December 31, 2013 from $8.7 million for the year ended December 31, 2012. As a percentage of revenues, advertising and marketing expenses were 11.7% of revenues for the year ended December 31, 2013 compared to 13.1% of revenues for the year ended December 31, 2012. The year-over-year increase was primarily driven by the expansion of our national advertising program, particularly targeted television advertising, in connection with the opening of the De Novo Facilities and the TSN Acquisition. A heightened emphasis on internet advertising campaigns also contributed to the increase in advertising expense.
Professional Fees
Professional fees increased $4.8 million, or 89.3%, to $10.3 million for the year ended December 31, 2013 from $5.4 million for the year ended December 31, 2012. As a percentage of revenues, professional fees were 8.9% of revenues for the year ended December 31, 2013 compared to 8.2% of revenues for the year ended December 31, 2012. The increase was primarily due to an increase in service fees for outsourced medical billing and collections. Our demand for these services significantly increased in mid-2012 and again in early 2013 proportional with revenues generated from the opening and ramp-up of the De Novo Facilities and the addition of the TSN Facilities. The increase was also attributable to an increase in legal fees incurred in connection with the wage and hour class action lawsuit and settlement discussed below.
Client Related Services
Client related services expenses decreased $0.4 million, or 4.8%, to $8.0 million for the year ended December 31, 2013 from $8.4 million for the year ended December 31, 2012. As a percentage of revenues, client related services expenses were 6.9% of revenues for the year ended December 31, 2013 compared to 12.7% of revenues for the year ended December 31, 2012. The decrease was primarily related to greater reliance in 2012 on subcontracted services to accommodate clients exceeding the Company’s capacity. The opening of the De Novo Facilities and the addition of the TSN Facilities substantially decreased the need for these subcontracted services, resulting in a decrease of subcontracted services expenses to $0.8 million in 2013 from $5.4 million in 2012. However, the decrease in subcontracted services expenses was partially offset by additional client related expenses attributable to the 70-bed Greenhouse facility that started accepting clients in March 2012, the 148-bed Desert Hope facility that opened in January 2013, a full year of expenses for the TSN Facilities and additional expenses at existing facilities.
Other Operating Expenses
Other operating expenses increased $5.2 million, or 81.9%, to $11.6 million for the year ended December 31, 2013 from $6.4 million for the year ended December 31, 2012. As a percentage of revenues, other operating expenses were 10.0% of revenues for the year ended December 31, 2013 compared to 9.7% of revenues for the year ended December 31, 2012. The increase was the result of additional operating expenses associated with the opening of Greenhouse in March 2012 and Desert Hope in January 2013 and the addition of the TSN Facilities in August 2012. Other operating expenses as a percentage of revenues was relatively unchanged, as these expenses typically correlate with the number of beds in our facilities.
Rentals and Leases
Rentals and leases increased $1.0 million, or 28.2%, to $4.6 million for the year ended December 31, 2013 from $3.6 million for the year ended December 31, 2012. As a percentage of revenues, rentals and leases declined to 4.0% of revenues for the year ended December 31, 2013 compared to 5.5% of revenues for the year ended December 31, 2012. The year-over-year dollar increase was primarily related to the TSN Acquisition, as we did not begin paying rent on the TSN Facilities until September 2012. A full year of rent for the TSN Facilities (excluding rent for the Leading Edge facility after its closure in June 2013) is included in rentals and leases for 2013. All rent transactions with the real estate entities consolidated as variable interest entities are eliminated effective from June 27, 2012 for Concorde Real Estate, LLC and October 8, 2013 for Greenhouse Real Estate, LLC, with minimal year-over-year impact to expense.
46
Provision for Doubtful Accounts
The provision for doubtful accounts increased $7.6 million, or 227.5%, to $11.0 million for the year ended December 31, 2013 from $3.3 million for the year ended December 31, 2012. As a percentage of revenues, the provision for doubtful accounts was 9.5% of revenues for the year ended December 31, 2013 compared to 5.1% of revenues for the year ended December 31, 2012. Our provision for doubtful accounts is directly impacted by the aging of our receivables, and accounts receivable aged over 120 days increased by $8.7 million to $19.0 million as of December 31, 2013 from $10.3 million as of December 31, 2012. The increase of accounts receivable aged at over 120 days was driven by the significant growth in revenues in 2013, which increased receivables as a whole across all aging periods; transition issues encountered when our billing and collection functions were combined from multiple providers to CRMS during 2013; payment delays normally associated with the opening of new facilities, such as Desert Hope in January 2013, due to being an out-of-network provider with a limited operating history; and the increase of total revenues from California and Nevada where two large commercial payors in these markets pay their portion directly to the client instead of us, which requires greater collections efforts, extends payment times and reduces recovery amounts. As a result of the foregoing factors, our provision for doubtful accounts reflects a higher reserve percentage due to uncertainty of collecting these accounts.
The following table presents a summary of our aging of accounts receivable as of December 31, 2012 and 2013:
| | | | | | | | 30-120 | | | | | |
| | | | Current | | | Days | | | Total | |
December 31, 2012 | | | | | 23.5 | % | | | 39.4 | % | | | 62.9 | % |
December 31, 2013 | | | | | 22.8 | % | | | 28.8 | % | | | 51.6 | % |
Our days sales outstanding as of December 31, 2013 and 2012 were 77 and 115, respectively. The improvement in days sales outstanding from 2012 to 2013 was primarily the result of consolidation of our billing and collections processing from three companies to one.
Litigation Settlement
Litigation settlement expenses for the year ended December 31, 2013 were $2.6 million. In September 2012, a wage and hour class-action claim was filed against us in the State of California. In March 2013, an amended complaint alleging additional wage and hour violations was filed against us in the same court, and the two claims were subsequently consolidated into a class action. In June 2013, the parties agreed to settle the substantive claims for $2.6 million during mediation. Once the settlement amount became probable, we recorded a $2.5 million reserve in the second quarter of 2013 for this matter. The reserve is reflected in accrued liabilities as of December 31, 2013. On April 9, 2014 and following court approval, we settled this matter with a payment of $2.6 million. We did not record any litigation settlement expenses for the year ended December 31, 2012.
Restructuring
Restructuring expenses for the year ended December 31, 2013 were $0.8 million. During the first half of 2013, management adopted restructuring plans to centralize our call centers and to close the Leading Edge facility acquired in the TSN Acquisition. As a result, aggregate restructuring and exit charges of $0.8 million were recognized in 2013. We did not recognize any restructuring expenses during 2012 as expenses related to the corporate headquarters relocation were not significant.
The Leading Edge facility was closed in June 2013. Management elected to close the facility because the amenities and the service offerings at the facility were inconsistent with our long-term strategy. During the transition period leading up to closing, clients that would have been candidates for the Leading Edge facility were referred to other treatment facilities, primarily Desert Hope. As a result of the facility closure, we recorded restructuring and exit charges of $0.5 million. These charges consisted of $0.2 million of payroll, severance and employee related costs and facility exit costs related to ongoing lease obligations of $0.3 million.
Two call centers were closed in the third quarter of 2013 and were consolidated with the existing call center at our headquarters in Brentwood, Tennessee to create a centralized call center. The call center operations were centralized in order to manage costs more effectively and optimize the call center’s view of client services, thus streamlining the placement of clients to treatment facilities. Restructuring expenses related to centralizing the call centers totaled $0.3 million in 2013, which included $0.1 million related to payroll, severance and other employee related costs, $0.1 million related to relocation costs and $0.1 million of facility exit costs related to ongoing lease obligations (net of approximately $0.1 million in sublease income).
Depreciation and Amortization
Depreciation and amortization expense increased $1.7 million, or 133.2%, to $3.0 million for the year ended December 31, 2013 from $1.3 million for the year ended December 31, 2012. As a percentage of revenues, depreciation and amortization expense was
47
2.6% of revenues for the year ended December 31, 2013 compared to 1.9% of revenues for the year ended December 31, 2012. The increase was primarily the result of a full year of expense in 2013 related to the TSN Facilities, combined with depreciation expense associated with Desert Hope, which we began recording in January 2013 when that facility was opened, and to a lesser extent, depreciation related to the consolidation of Greenhouse in October 2013. The increase in depreciation and amortization expense was also attributable to additions of property and equipment during 2013 of $14.1 million, including capital lease obligations of $1.2 million. Also contributing to the increase was the addition of depreciable assets associated with the expansion of our call center.
Interest Expense
Interest expense increased $0.4 million, or 41.8%, to $1.4 million for the year ended December 31, 2013 from $1.0 million for the year ended December 31, 2012. As a percentage of revenues, interest expense was 1.2% of revenues for the year ended December 31, 2013 compared to 1.5% of revenues for the year ended December 31, 2012. The year-over-year dollar increase was associated with $17.9 million in net additional borrowings in 2013 to fund growth and acquisitions, including $14.2 million in additional VIE debt and $1.0 million in new capital leases.
Income Tax Expense
For the year ended December 31, 2013, income tax expense was $0.6 million, reflecting an effective tax rate of 29.2%, compared to $1.1 million, reflecting an effective tax rate of 51.1%, for the year ended December 31, 2012. As a percentage of revenue, income tax expense was 0.5% of revenues for the year ended December 31, 2013 compared to 1.7% of revenues for the year ended December 31, 2012. Our effective tax rate on income applicable to AAC was 54.8% in 2013 compared to 44.3% in 2012. The increase in the effective tax rate on income applicable to AAC was primarily due to an increase in non-deductible expenses, an increase in the valuation allowance and the recognition of uncertain tax positions. The reduction in our overall effective tax rate was primarily attributable to additional income that is not taxable to us from various VIEs that we are consolidating in our results of operations, partially offset by increases in non-deductible expenses and an increase in the valuation allowance. Other items affecting our overall tax rate include the release of previously established valuation allowances, a reduction to our apportioned state income tax rate and various adjustments arising from amended tax returns filed during 2013.
Net Loss (Income) Attributable to Noncontrolling Interest
For the year ended December 31, 2013, net income attributable to noncontrolling interest was $0.7 million compared to a net loss attributable to noncontrolling interest of $0.4 million for the year ended December 31, 2012, representing a $1.1 million, or 274.3%, increase. This increase is principally a result of the consolidation of Concorde Real Estate for all twelve months in 2013, compared to the period from June 27, 2012 through December 31, 2012, and the consolidation of Greenhouse Real Estate from October 8, 2013 through December 31, 2013.
Liquidity and Capital Resources
General
Our primary sources of liquidity are net cash generated from operations, proceeds from issuances of our common stock and debt financing. We also have utilized operating lease transactions with respect to commercial properties primarily to perform client services and provide space for administrative facilities.
We expect that our future funding for working capital needs, capital expenditures, long-term debt repayments and other financing activities will continue to be provided from some or all of these sources. Our future liquidity will be impacted by our ability to access capital markets, which may be restricted due to our credit ratings, general market conditions, leverage capacity and by existing or future debt agreements.
We anticipate that our current level of cash on hand, internally generated cash flows and availability under our 2015 Credit Facility will be sufficient to fund our anticipated working capital needs, debt service and repayment obligations and interests, and maintenance capital expenditures for at least the next twelve months.
48
Cash Flow Analysis
Our cash flows are summarized as follows (in thousands):
| | | | | | | | | | | | |
| | Year Ended December 31, | |
| | 2012 | | | 2013 | | | 2014 | |
Provided by operating activities | | $ | 69 | | | $ | 3,443 | | | $ | 8,038 | |
Used in investing activities | | | (7,896 | ) | | | (13,144 | ) | | | (19,521 | ) |
Provided by financing activities | | | 8,434 | | | | 10,973 | | | | 58,011 | |
Net increase in cash and cash equivalents | | | 607 | | | | 1,272 | | | | 46,528 | |
Cash and cash equivalents at end of period | | | 740 | | | | 2,012 | | | | 48,540 | |
Net Cash Provided by Operating Activities
Cash provided by operating activities was $8.0 million for the year ended December 31, 2014, an increase of $4.6 million compared to cash provided by operating activities of $3.4 million for the year ended December 31, 2013. The $4.6 increase in cash provided by operating activities in the year ended December 31, 2014 as compared to the year ended December 31, 2013 primarily related to the benefit from the increase in accrued liabilities and depreciation and amortization expense as partially offset by an increase in prepaid expenses and other assets. Working capital totaled $63.2 million at December 31, 2014 and $1.2 million at December 31, 2013. As previously discussed, we used a portion of the net proceeds from the IPO to repay the balance, in full, of our prior revolving line of $13.1 million, the Behavioral Healthcare Realty, LLC term loan of $1.6 million and the final $7.3 million payment related to the settlement of certain litigation.
Cash provided by operating activities was $3.4 million for the year ended December 31, 2013, an increase of $3.4 million compared to cash provided by operating activities of $69,000 for the year ended December 31, 2012. The increase was primarily attributable to an increase in net income of $0.4 million and an increase in non-cash charges of $7.7 million, principally from an increase in our provision for doubtful accounts and depreciation and amortization related to the TSN Facilities and equity compensation, the consolidation of certain variable interest entities and our investment in corporate infrastructure. These increases were offset by our increase in working capital of $4.7 million resulting from the increase in our accounts receivable and a decrease in accrued liabilities.
Net Cash Used in Investing Activities
Cash used in investing activities was $19.5 million for the year ended December 31, 2014, an increase of $6.4 million compared to cash used in investing activities of $13.1 million for the year ended December 31, 2013. The increase was primarily related to $3.5 million paid in connection with the BHR Acquisition and the CRMS Acquisition, an increase in capital expenditures of $2.6 million, and $0.5 million placed in escrow related to the acquisition of Recovery First. These increases in cash used in investing activities were partially offset by the net receipt of notes and other receivables from related parties of $0.2 million.
Cash used in investing activities was $13.1 million for the year ended December 31, 2013, an increase of $5.2 million compared to cash used in investing activities of $7.9 million for the year ended December 31, 2012. The increase was primarily related to $5.8 million paid in connection with our purchase of land and a building in Riverview, Florida that we are converting to a treatment facility and an additional $0.6 million in related renovations. We also invested $1.0 million related to construction projects at Greenhouse and $4.7 million for other purchases, mainly furniture, equipment and leasehold improvements.
Net Cash Provided by Financing Activities
Cash provided by financing activities was $58.0 million for the year ended December 31, 2014, an increase of $47.0 million compared to cash provided by financing activities of $11.0 million for the year ended December 31, 2013. The increase is primarily related to proceeds of $69.5 million from sale of the common stock in connection with our IPO and proceeds of $8.2 million from the sale of BHR Series A Preferred Units, as partially offset by an increase in payments on long-term debt and capital leases of $4.4 million and a decrease in proceeds from the revolving line of credit and long-term debt of $23.5 million.
Cash provided by financing activities was $11.0 million for the year ended December 31, 2013, an increase of $2.5 million compared to cash provided by financing activities of $8.4 million for the year ended December 31, 2012. Financing activities in fiscal 2013 included $5.9 million in borrowing under our then existing revolving line of credit, the issuance of notes payable totaling $9.2 million, $7.4 million in proceeds from the sale of AAC common stock and $2.0 million in contributions by certain variable interest entities, which were offset in part by our debt principal payments of $4.0 million and distributions to and redemptions of BHR interests totaling $4.4 million.
49
Financing Relationships
Credit Facility
On April 15, 2014, we entered into the Second Amended and Restated Credit Agreement (the “2014 Credit Facility”) with Wells Fargo Bank, National Association. The 2014 Credit Facility made available to us a $15.0 million revolving line of credit, subject to borrowing base limitations, and amended and restated two existing term loans in the outstanding principal amounts of $0.6 million (“Term Loan A”) and $1.5 million (“Term Loan B”). The 2014 Credit Facility, as amended in June 2014, also provided for standby letters of credit in an aggregate undrawn amount not to exceed $3.0 million, and in July 2014 Wells Fargo issued on our behalf an irrevocable standby letter of credit in the amount of $700,000. The proceeds of Term Loan B were used to fund a portion of the consideration paid in connection with the TSN Acquisition. The revolving line of credit matured on April 1, 2015 and the outstanding principal balance of Term Loan A was due and payable in full on May 15, 2017. The revolving line of credit bore interest at the one-month London Interbank Offered Rate (“LIBOR”), plus an applicable margin that is determined by our leverage ratio, as defined by the agreement, at the end of each quarter. A quarter-end leverage ratio of 4.75 to 1.00 or above resulted in an applicable margin of 3.0%, a ratio below 4.75 to 1.00 and equal to or above 4.00 to 1.00 results in an applicable margin of 2.75%, and a ratio below 4.00 to 1.00 results in an applicable margin of 2.5%. Term Loan A bore interest at LIBOR plus 3.15%.
On December 18, 2014, the Company terminated its 2014 Credit Facility, after having repaid the outstanding principal balance of $487,500 plus accrued interest under the 2014 Credit Facility on December 12, 2014. The Company did not incur any early termination penalties as a result of the early termination of the Credit Facility. The Company also maintains operating accounts with Wells Fargo, which were not be affected by the termination of the Credit Facility.
On March 9, 2015 we entered into a five year $125 million Senior Secured Credit Facility (the “2015 Credit Facility”) by and among the Company and Bank of America, N.A., as administrative agent for the lenders party thereto. The 2015 Credit Facility consists of a $50.0 million revolver and a $75.0 million term loan. The 2015 Credit Facility also has an accordion feature that allows the total borrowing capacity to be increased up to $200 million, subject to certain conditions, including obtaining additional commitments from lenders.
The 2015 Credit Facility requires quarterly term loan principal repayments for our outstanding term loan of $0.9 million for September 30, 2015 to December 31, 2016, $1.4 million for March 31, 2017 to December 31, 2017, $2.3 million from March 31, 2018 to December 31, 2018, and $2.8 million from March 31, 2019 to December 31, 2019, with the remaining principal balance of the term loan due on the maturity date of March 9, 2020. Repayment of the revolving loan is due on the maturity date of March 9, 2020. The 2015 Credit Facility generally requires quarterly interest payments.
Borrowings under the 2015 Credit Facility are guaranteed by each of our subsidiaries and are secured by a lien on substantially all of our and our subsidiaries’ assets. Borrowings under the 2015 Credit Facility bear interest at a rate tied to our Consolidated Total Leverage Ratio (defined as Consolidated Funded Indebtedness to Consolidated EBITDA, in each case as defined in the 2015 Credit Facility). Eurodollar Rate Loans with respect to the 2015 Credit Facility bear interest at the Applicable Rate plus the Eurodollar Rate (as defined in the 2015 Credit Facility) (based upon the LIBOR Rate (as defined in the 2015 Credit Facility) prior to commencement of the interest rate period). Base Rate Loans with respect to the 2015 Credit Facility bear interest at the Applicable Rate plus the highest of (i) the federal funds rate plus 0.50%, (ii) the prime rate and (iii) the Eurodollar Rate plus 1.0%. In addition, we are required to pay a commitment fee on undrawn amounts under our revolving credit facility of 0.35% to 0.50% depending on our Consolidated Total Leverage Ratio. The Applicable Rates and the unused commitment fees of the 2015 Credit Facility are based upon the following tiers:
Pricing Tier | | Consolidated Total Leverage Ratio | | Eurodollar Rate Loans | | | Base Rate Loans | | | Commitment Fee | |
1 | | > 3.50:1.00 | | | 3.25 | % | | | 2.25 | % | | | 0.50 | % |
2 | | > 3.00:1.00 but < 3.50:1.00 | | | 3.00 | % | | | 2.00 | % | | | 0.45 | % |
3 | | > 2.50:1.00 but < 3.00:1.00 | | | 2.75 | % | | | 1.75 | % | | | 0.40 | % |
4 | | > 2.00:1.00 but < 2.50:1.00 | | | 2.50 | % | | | 1.50 | % | | | 0.35 | % |
5 | | < 2.00:1.00 | | | 2.25 | % | | | 1.25 | % | | | 0.35 | % |
The 2015 Credit Facility requires us to comply with customary affirmative, negative and financial covenants, including a Consolidated Fixed Charge Coverage Ratio, Consolidated Total Leverage Ratio and a Consolidated Senior Secured Leverage Ratio. We may be required to pay all of our indebtedness immediately if we default on any of the financial or other restrictive covenants contained in the 2015 Credit Agreement. The financial covenants include maintenance of the following:
· | Fixed Charge Coverage Ratio may not be less than 1:50:1.00 as of the end of any fiscal quarter. |
50
· | Consolidated Total Leverage Ratio: may not be greater than the following levels as of the end of each fiscal quarter: |
Measurement Period Ending | | Maximum Consolidated Total Leverage Ratio |
March 31, 2015 | | 4.50:1.00 |
June 30, 2015 | | 4.50:1.00 |
September 30, 2015 | | 4.50:1.00 |
December 31, 2015 | | 4.50:1.00 |
March 31, 2016 | | 4.50:1.00 |
June 30, 2016 | | 4.25:1.00 |
September 30, 2016 | | 4.25:1.00 |
December 31, 2016 | | 4.25:1.00 |
March 31, 2017 and each fiscal quarter thereafter | | 4.00:1.00 |
· | Consolidated Senior Secured Leverage Ratio may not be greater than the following levels as of the end of fiscal quarter: |
Measurement Period Ending | | Maximum Consolidated Senior Secured Leverage Ratio |
March 31, 2015 | | 4.00:1.00 |
June 30, 2015 | | 4.00:1.00 |
September 30, 2015 | | 4.00:1.00 |
December 31, 2015 | | 4.00:1.00 |
March 31, 2016 | | 4.00:1.00 |
June 30, 2016 | | 3.75:1.00 |
September 30, 2016 | | 3.75:1.00 |
December 31, 2016 | | 3.75:1.00 |
March 31, 2017 and each fiscal quarter thereafter | | 3.50:1.00 |
We used approximately $24.9 million of the proceeds from the $75 million term loans to repay in full the outstanding real estate debt (BHR debt as later described), certain equipment loans and certain capital leases. We did not incur any significant early termination fees. Subsequent the closing of the 2015 Credit Facility on March 9, 2015, our total outstanding indebtedness, including capital leases, was approximately $77.4 million.
BHR Debt
In conjunction with the consolidation of our variable interest entities, our December 31, 2013 balance sheet included debt of $21.5 million related to BHR, which owns all of the outstanding equity interests of Concorde Real Estate, LLC, Greenhouse Real Estate, LLC and The Academy Real Estate, LLC, which entities own the Desert Hope, Greenhouse and Riverview, Florida properties, respectively. As a result of the Reorganization Transactions completed in April 2014, we now own 100% of the outstanding common membership interests in BHR. The BHR debt was guaranteed on a joint and several basis by AAC, Mr. Cartwright and Mr. Menz. The floating interest rates on the BHR debt were based upon the one-month LIBOR, as defined by each agreement, plus various percentage points. We used approximately $24.3 million of the proceeds from the $75 million term loans from the 2015 Credit Facility to repay in full all outstanding BHR debt amounts. The terms of each BHR debt agreement are summarized below:
· | Concorde Real Estate, LLC: The debt with respect to Concorde Real Estate, LLC (the “Concorde Loan”) was represented by a $9.6 million promissory note used to refinance the indebtedness related to our Desert Hope facility and to redeem the preferred membership interests in Concorde Real Estate, LLC. The note required monthly principal payments of $53,228 plus monthly interest and a balloon payment of $6.6 million due at maturity. The note was secured by a deed of trust and an assignment of leases and rents. The note contained financial covenants that required us to maintain a fixed charge coverage ratio of not less than 1.25 to 1.00. The note also contained a cross-default provision linking the performance of Concorde Real Estate to the occurrence of a default by its guarantors or affiliates of its guarantors with respect to any other indebtedness. The interest rate at December 31, 2014 was 2.75% and the balance was $8.8 million. The maturity date of the note was May 15, 2018. In July 2014, we executed an interest rate swap agreement with respect to the Concorde Loan to effectively fix the interest rate at 4.16%. The |
51
| interest rate swap has an effective date of July 15, 2014, has an initial notional amount of $8.9 million and is scheduled to mature on May 15, 2018. |
· | Greenhouse Real Estate, LLC: The debt with respect to Greenhouse Real Estate, LLC (the “Greenhouse Loan”) was previously represented by a $13.2 million promissory note used to refinance the indebtedness related to our Greenhouse facility in Grand Prairie, Texas and to fund a 60-bed expansion of the Greenhouse facility. Monthly draws were made against the note based on actual construction costs incurred. Pursuant to the terms of the previous loan agreement, in August 2014 we converted the note into a term loan that extended the maturity date to August 2019 and adjusted the interest rate to a rate of one month LIBOR plus 2.5%. The amended and restated term loan was represented by a new $12.7 million promissory note. The new note required monthly principal payments of $70,778 plus monthly interest and a balloon payment of $8.5 million due at maturity. The new note was secured by a deed of trust and an assignment of leases and rents. We were required to maintain a debt service coverage ratio of not less than 1.25 to 1.00. The new note also contained a cross-default provision. In July 2014, we executed an interest rate swap agreement with respect to the Greenhouse Loan to effectively fix the interest rate at 4.62%. The interest rate swap has an effective date of September 1, 2014, has an initial notional amount of $13.2 million and is scheduled to mature on October 31, 2019. |
· | The Academy Real Estate, LLC: At December 31, 2014, the debt with respect to The Academy Real Estate, LLC (the “Academy Loan”) was represented by a $3.6 million promissory note used to purchase the property in Riverview, Florida. The note was secured by a deed of trust and an assignment of leases and rents. The note contained financial covenants that required us to maintain a fixed charge coverage ratio of not less than 1.25 to 1.00, as well as other restrictive financial covenants. The note also contained a cross-default provision linking the performance of The Academy Real Estate, LLC to the occurrence of a default by its guarantors or affiliates of its guarantors with respect to any other indebtedness. The interest rate at December 31, 2014 was 3.25% and the balance was $3.5 million. In April 2014, we effected an amendment to the Academy Loan to extend the maturity date to July 14, 2019. Under the amended Academy Loan, we made monthly principal payments of $30,000 plus interest commencing in October 2014 and a balloon payment of remaining unpaid principal of $1.9 million at the maturity date. |
· | Behavioral Healthcare Realty, LLC: In October 2013, our CEO, President and CFO, who then owned membership interests in BHR, personally borrowed $1.9 million from a financial institution, and used the proceeds to make a $1.9 million equity contribution to BHR. In connection with the BHR Acquisition, we assumed this term loan. Subsequent to our assumption of this term loan, we refinanced the term loan with Holdings as the borrower, and was guaranteed by our CEO, President, CFO and AAC. The Company used a portion of the net proceeds from the IPO in October 2014 to repay in full the outstanding balance of the term loan of $1.6 million on October 7, 2014. |
At December 31, 2014, we were in compliance with the financial covenants of the BHR debt.
BHR Preferred Equity
In October 2013, BHR amended its limited liability company agreement to permit the issuance of Series A Preferred Units. In the fourth quarter of 2013, BHR received proceeds of $1.4 million from the sale of 28 Series A Preferred Units valued at $50,000 per unit. In January and February 2014, BHR sold 8.5 Series A Preferred Units, valued at $50,000 per unit, with proceeds to BHR of $0.4 million, net of issuance costs of $11,300. After these transactions, 36.5 Series A Preferred Units were outstanding. The unit holders were entitled to receive a 12% per annum preferred return on their initial investment, payable quarterly in arrears, had no equity appreciation ability and limited voting rights that were conditioned upon BHR’s default on the distribution of the 12% preferred return. The Series A Preferred Units contained certain embedded issuer call and holder put provisions, including the option of BHR to call and redeem all or any portion of the Series A Preferred Units for $50,000 per unit plus any accrued and unpaid preferred return at any time after the twelfth month of issuance. The holders of the Series A Preferred Units had a put right during three periods discussed below that, if exercised, required BHR to redeem 100% of the issued and outstanding Series A Preferred Units by making a payment equal to $50,000 per unit plus the accrued but unpaid preferred return. The holder was able to exercise the put right for a period of 30 days following the 36th month, 48th month and 60th month after the date of issuance. In the event of a sale of a property owned by BHR, the holders of the Series A Preferred Units were entitled to the repayment of their initial capital contribution plus any accrued and unpaid preferred return. We classified the Series A Preferred Units as noncontrolling interest as a part of mezzanine equity because the potential redemption is not within the complete control of BHR until the last put option period has expired. On April 15, 2014, BHR redeemed all 36.5 Series A Preferred Units for $1.8 million. As part of this redemption, one of our directors received $250,000 and Milan Investment Group, LLC received $200,000. Milan Investment Group, LLC is an entity controlled by the spouse of one of our directors. These former holders of Series A Preferred Units used the proceeds from the redemption to purchase 224,697 shares of AAC common stock at $8.12 per share as part of an exempt common stock offering.
On April 15, 2014, BHR amended and restated its limited liability company agreement, which among other things, changed the rights and privileges of holders of Series A Preferred Units. In connection with this amendment and restatement, BHR received $7.8 million in net proceeds from the sale to BNY Alcentra Group Holdings, Inc. (“Alcentra”) of 160 new Series A Preferred Units. Alcentra received a 1% fee at closing and was entitled to receive a 12% per annum preferred return on its initial investment, payable
52
quarterly in arrears. In the event of a non-payment, the preferred return compounded on a quarterly basis. In the event of non-payment for three months, the preferred return increased to 15.0%, and further increased to 18.0% if not paid beginning in the fourth month, with each increase compounding on a quarterly basis.
The Series A Preferred Units contained certain embedded call and put provisions. BHR had the option to redeem a minimum of 40 Series A Preferred Units and up to 100% of the outstanding Series A Preferred Units for $50,000 per unit plus (i) any accrued and unpaid preferred return and (ii) a call premium of 3.0% through April 15, 2015, 2.0% from April 16, 2015 through April 15, 2017 and no premium any time after April 15, 2017. If an event of default occurred under the limited liability company agreement, the Series A Preferred Unit holders constituting a majority of such holders had the right to demand BHR to redeem all of the issued and outstanding Series A Preferred Units held by such holders equal to the sum of (i) such Series A Preferred Unit holder’s unrecovered capital contribution plus (ii) any accrued but unpaid preferred return. Alcentra had the right to exercise its put right for a period of 30 days following the 36th month or 48th month after the date of issuance and at any time following the 60th month after the date of issuance. In the event of a sale of a property owned by BHR, Alcentra was entitled to the repayment of its initial capital contribution plus (i) any accrued and unpaid preferred return and (ii) any applicable call premium. As long as Alcentra owned at least 60 Series A Preferred Units less any Series A Preferred Units repurchased by BHR, distributions to affiliates of BHR were limited to $3.0 million annually.
The Series A Preferred Units generally had no voting or approval rights regarding the management of BHR. However, the holders of Series A Preferred Units were entitled to vote with respect to (i) any action that would change the rights or restrictions of the Series A Preferred Units in a way that would adversely affect such holders and (ii) the creation or issuance of any other security convertible into or exercisable for any equity security of BHR having rights, preferences or privileges senior to the common units of BHR. In addition, unanimous approval of all BHR members, including the holders of Series A Preferred Units, was required to approve the sale by BHR of more than 50% of its real property, more than 50% of the voting or economic rights of any BHR subsidiary or the merger, consolidation, sale of all or substantially all of the assets of BHR or sale of a majority of the common units of BHR.
On February 25, 2015, we exercised our call provision and redeemed 100% of the outstanding Series A Preferred units for a total redemption price of approximately $8.6 million, which included $0.2 million for the 3.0% call premium and $0.4 million for unpaid preferred returns.
Related Party Notes Payable
In August 2012, we entered into notes payable with two significant stockholders, resulting from seller financing of the TSN Acquisition. Pursuant to the terms of a settlement agreement in August 2014 among AAC, AJG Solutions, Inc. and James D. Bevell (a holder of one of the notes), the parties agreed to resolve all outstanding disputes among the parties, which included the dismissal of certain litigation against Mr. Bevell in exchange for, among other items, full and final satisfaction of all obligations to Mr. Bevell under the TSN Acquisition purchase agreement, including the cancellation of one of the two significant stockholder notes with an outstanding principal balance of $2.0 million as of the settlement date. At December 31, 2014, the outstanding principal of the remaining TSN Acquisition selling stockholder notes, which mature on August 31, 2015, were $1.8 million and bear interest at a blended rate of 3.85%.
Subordinated Promissory Notes (Related Party and Non-related Party)
In March 2012 through April 2012, we issued $1.0 million of subordinated promissory notes to certain accredited investors, of which $0.2 million was issued to one of our directors. The notes bore interest at 12% per annum. Interest was payable monthly and the principal amount was due, in full, on the applicable maturity date of the note. Notes in the principal amount of $0.2 million matured on March 31, 2015 and the remaining notes, in the principal amount of $0.8 million, matured on March 31, 2017. In connection with the issuance of these notes, we issued detachable warrants to the lenders to purchase 112,658 shares of AAC common stock at $0.64 per share. The warrants were exercisable at any time up to their expiration on March 31, 2022. We recorded a debt discount of $0.1 million related to the warrants which reduced the carrying value of the subordinated notes. As of December 31, 2014, the outstanding balance, net of the unamortized debt discount of $71,000, was $0.9 million, of which $0.2 million was due to one of our directors. In connection with the Reorganization Transactions, warrants representing 106,728 shares were exercised in March 2014 and the remaining warrants representing 5,930 shares were exercised in April 2014. On February 27, 2015, we repaid in full the $1.0 million of the outstanding subordinated promissory notes.
Various Third Party Notes Payable
We have various notes payable with third-party creditors primarily for the purchase of vehicles, furniture and office equipment. The outstanding notes have maturity dates ranging from March 2015 to November 2017 and interest rates ranging from 0.0% to
53
12.3% per annum. Monthly payments range from $200 to $4,600. As of December 31, 2014, the aggregate balance on these notes was $0.1 million.
Capital Lease Obligations
During 2013 and 2014, we entered into capital leases with third party leasing companies for equipment and office furniture. The capital leases bear interest at rates ranging from 4.47% to 6.25% and have maturity dates from December 2015 through March 2019. Total obligations under capital leases at December 31, 2014 were $1.2 million of which $0.5 million was included in the current portion of long-term debt.
Consolidation of VIEs
Based on our guarantees of certain entities’ debt and our ability to direct the activities that most significantly impact the financial results of such entities, we began consolidating Concorde Real Estate, LLC on June 27, 2012 and Greenhouse Real Estate, LLC on October 8, 2013. In addition, we included The Academy Real Estate, LLC, in historical financial results from May 2013 to December 10, 2013, at which time we sold our membership interests in The Academy Real Estate, LLC to BHR and consolidated it as a VIE through April 15, 2014 when BHR was acquired and became a wholly owned subsidiary of the Company.
The Professional Groups engage physicians and mid-level service providers and provide professional services to our clients through professional services agreements with each treatment facility. Under the professional services agreements, the Professional Groups also provide a physician to serve as medical director for the applicable facility. The Professional Groups either bill the payor for their services directly or are compensated by the treatment facility based on fair market value hourly rates. Each of the professional services agreements has a term of five years and will automatically renew for additional one-year periods.
We provided the initial working capital funding in connection with the formation of the Professional Groups and recorded a receivable. We make additional advances to the Professional Groups during periods in which there is a shortfall between revenues collected by the Professional Groups from the treatment facilities and payors, on the one hand, and the Professional Group’s contracting expenses and payroll requirements, on the other hand, thereby increasing the balance of the receivable. Excess cash flow of the Professional Groups is repaid to us, resulting in a decrease in the receivable. The Professional Groups are obligated to repay these funds and are charged commercially reasonable interest. We had a receivable from each of the Professional Groups at December 31, 2014. The receivables due to us from the Professional Groups are eliminated in consolidation as the Professional Groups are VIEs of which we are the primary beneficiary.
AAC has entered into written management services agreements with each of the Professional Groups under which AAC provides management and other administrative services to the Professional Groups. These services include billing, collection of accounts receivable, accounting, management and human resource functions and setting policies and procedures. Pursuant to the management services agreements, the Professional Groups’ monthly revenues will first be applied to the payment of operating expenses consisting of refunds or rebates owed to clients or payors, compensation expenses of the physicians and other service providers, lease payments, professional and liability insurance premiums and any other costs or expenses incurred by AAC for the benefit of the Professional Groups and, thereafter, to the payment to AAC of a management fee equal to 20% of the Professional Groups’ gross collected monthly revenues. As described above, AAC will also provide financial support to each Professional Group on an as-needed basis to cover any shortfall between revenues collected by such Professional Groups from the treatment facilities and payors and the Professional Group’s contracting expenses and payroll requirements. Through these arrangements, we are directing the activities that most significantly impact the financial results of the respective Professional Groups; however, treatment decisions are made solely by licensed healthcare professionals employed or engaged by the Professional Groups as required by various state laws. Based on our ability to direct the activities that most significantly impact the financial results of the Professional Groups, provide necessary funding and the obligation and likelihood of absorbing all expected gains and losses, we have determined that we are the primary beneficiary, and, therefore, consolidate the five Professional Groups as variable interest entities.
Off Balance Sheet Arrangements
We have entered into various non-cancelable operating leases expiring through October 2018. Commercial properties under operating leases primarily include space required to perform client services and space for administrative facilities. Rent expense was $2.1 million and $4.6 million for the year ended December 31, 2014 and 2013, respectively. Included in such amounts were payments made to related parties totaling $1.3 million for the year ended December 31, 2013. With the consolidation of Greenhouse Real Estate, LLC as a variable interest entity in October 2013, we no longer have lease expense to related parties after such date.
54
Critical Accounting Policies
Our consolidated financial statements have been prepared in accordance with GAAP. In preparing our consolidated financial statements, we are required to make certain estimates and assumptions that affect the reported amounts of assets, liabilities, revenues and expenses included in the financial statements. Estimates are based on historical experience and other available information, the results of which form the basis of such estimates. While we believe our estimation processes are reasonable, actual results could differ from our estimates. The following accounting policies are considered critical to our operating performance and involve subjective and complex assumptions and assessments.
Revenue Recognition
We provide services to our clients in both inpatient and outpatient treatment settings. Revenues are recognized when services are performed at the estimated net realizable value amount from clients, third-party payors and others for services provided. We receive the vast majority of payments from commercial payors at out-of-network rates. Client service revenues are recorded at established billing rates less adjustments to estimate net realizable value. Adjustments are recorded to state client service revenues at the amount expected to be collected for the service provided based on historic adjustments for out-of-network services not under contract. Provisions for estimated third party payor reimbursements are provided in the period related services rendered and adjusted in future periods when actual periods are received.
Prior to admission, insurance coverage, as applicable, is verified and the client self-pay amount is determined. The client self-pay portion is generally collected upon admission. In some instances, clients will pay out-of-pocket as services are provided or will make a deposit and negotiate the remaining payments as part of the services. These out-of-pocket payments are included in accrued liabilities in the accompanying consolidated balance sheets and revenues related to these payments are deferred and recognized over the period services are provided. We do not recognize revenue for any amounts not collected from the client. From time to time, we may provide scholarships to a limited number of clients. We do not recognize revenues for scholarships provided.
We recognize revenues from commercial payors at the time services are provided based on our estimate of the amount that payors will pay us for the services performed. We estimate the net realizable value of revenues by adjusting gross client charges using our expected realization and applying this discount to gross client charges. Through December 31, 2013, our expected realization was determined by management after taking into account historical collections received from the commercial payors since our inception compared to the gross client charges billed. Beginning in January 2014, we enhanced the methodology related to our net realizable value to more quickly react to potential changes in reimbursements by facility, by type of service and by payor. As a result, management adjusted the expected realization discount, on a per facility basis, to reflect a historical analysis of reimbursement data by facility in addition to considering the type of services provided, the payors and the gross client charge rates by facility. This change resulted in a decrease in our expected realization in the first six months of 2014.
Estimates of net realizable value are subject to significant judgment and approximation by management. It is possible that actual results could differ from the historical estimates management has used to help determine the net realizable value of revenues. If our actual collections either exceed or are less than the net realizable value estimates, we will record a revenue adjustment, either positive or negative, for the difference between our estimate of the receivable and the amount actually collected in the reporting period in which the collection occurred.
In cases where the demand for our services exceeded our capacity, we historically entered into contractual arrangements with other parties to provide corporate support services. Based on criteria outlined in ASC 605, Revenue Recognition, management determined that we were the principal party to the corporate support services provided. As a result, revenues generated through our contractual arrangements were included in revenues at their expected realizable amount while the subcontracted service payments made to the subcontracted parties were included in client expenses. The need for these contractual arrangements decreased as we increased bed capacity in the second half of 2012 and in the first half of 2013 as a result of the opening of the Desert Hope facility. During 2014, we did not utilize these types of contractual arrangements.
Allowance for Contractual and Other Discounts
We derive the vast majority of our revenue reimbursements from commercial payors at out-of-network rates. Management estimates the allowance for contractual and other discounts based on its historical collections experience. The services authorized and provided and related reimbursement are often subject to interpretation and negotiation that could result in payments that differ from our estimates.
55
Allowance for Doubtful Accounts
Accounts receivable primarily consist of amounts due from third-party commercial payors and clients and we record accounts receivable net of contractual discounts. Our ability to collect outstanding receivables is critical to our results of operations and cash flows. Accounts receivable are reported net of an allowance for doubtful accounts, which is management’s best estimate of accounts receivable that could become uncollectible in the future. Accordingly, the accounts receivable reported in our consolidated financial statements are recorded at the net amount expected to be received. Our primary collection risks are (i) the risk of overestimating our net revenues at the time of billing that may result in us receiving less than the recorded receivable, (ii) the risk of non-payment as a result of commercial insurance companies denying claims, (iii) the risk that clients will fail to remit insurance payments to us when the commercial insurance company pays out-of-network claims directly to the client, (iv) resource and capacity constraints that may prevent us from handling the volume of billing and collection issues in a timely manner and (v) the risk of non-payment from uninsured clients. In evaluating the collectability of accounts receivable and evaluating the adequacy of our allowance for doubtful accounts, management considers a number of factors, including historical experience, the age of the accounts and current economic trends. We continually monitor our accounts receivable balances and utilize retrospective reviews and cash collection data to support our estimates of the allowance for doubtful accounts. In the second quarter of 2014, we analyzed our recent collection experience and made adjustments to the calculation of the net realizable value of our accounts receivable to take into account our collections experience over the past two years and improvements in the credit quality of our aged receivables. Estimates of our allowance for doubtful accounts are determined on a quarterly basis and adjusted monthly thereafter based on actual collections. If actual future collections are less favorable than those projected by management, additional allowances for uncollectible accounts may be required. There can be no guarantee that we will continue to experience the same collection rates that we have experienced in the past. We do not believe that there are any significant concentrations of revenues from any particular payor that would subject us to significant credit risks in the event a payor becomes unwilling or unable to pay claims.
Goodwill and Intangible Assets
Goodwill represents the excess of the purchase price over the fair value of the identifiable net assets acquired. Goodwill and intangible assets with indefinite lives are not amortized, but instead tested for impairment at least annually or whenever events or changes in circumstances indicate the carrying value may not be recoverable. We have no intangible assets with indefinite useful lives other than goodwill. We consider the following to be important factors that could trigger an impairment review: significant underperformance relative to historical or projected future operating results; identification of other impaired assets within a reporting unit; significant adverse changes in business climate or regulations; significant changes in senior management; significant changes in the manner of use of the acquired assets or the strategy for our overall business; and significant negative industry or economic trends.
Goodwill is assessed for impairment using a fair value approach at the reporting unit level. The goodwill impairment test is a two-step process, if necessary. The provisions for the accounting standard of goodwill provide an entity with the option to assess qualitative factors to determine whether the existence of events or circumstances leads to the determination that it is more likely than not that the fair value of a reporting unit is less than its carrying amount. This qualitative assessment is referred to as a “step zero” approach. If, based on the qualitative factors, an entity determines it is not more likely than not that the fair value of a reporting unit is less than its carrying value, the entity may skip the two-step impairment test required by accounting guidance. If an entity determines otherwise or, at the option of the entity, if a step zero is not performed, step one of the two-step impairment test is required. Under step one, the fair value of the reporting unit is compared with its carrying value (including goodwill). If the fair value of the reporting unit is less than its carrying value, an indication of goodwill impairment exists for the reporting unit and the entity must perform step two of the impairment test (measurement). Under step two, an impairment loss is recognized for any excess of the carrying amount of the reporting unit’s goodwill over the implied fair value of that goodwill. The implied fair value of goodwill is determined by allocating the fair value of the reporting unit in a manner similar to a purchase price allocation and the residual fair value after this allocation is the implied fair value of the reporting unit goodwill. Fair value of the reporting unit is determined using a discounted cash flow analysis. If the fair value of the reporting unit exceeds its carrying value, step two does not need to be performed. Impairment shall be recognized to the extent that the carrying amount of goodwill exceeds its implied fair value. In performing step one of the goodwill impairment test, we compare the carrying amount of the reporting unit to the estimated fair value.
In assessing the recoverability of goodwill, we consider historical results, current operating trends and results, and make estimates and assumptions about revenues, margins and discount rates based on our budgets, business plans, economic projections and anticipated future cash flows. Each of these factors contains inherent uncertainties, and management exercises substantial judgment and discretion in evaluating and applying these factors.
The annual goodwill impairment test is performed as of December 31 of each year, utilizing the two-step test. We concluded that the carrying value of the reporting unit as of December 31, 2014 did not exceed its fair value, and thus no indication of impairment was present.
56
Long-Lived Assets and Intangible Assets Subject to Amortization
Long-lived and intangible assets subject to amortization are reviewed for impairment whenever events or changes in circumstances indicate that the carrying amount of an asset may not be recoverable. Recoverability of assets to be held and used is measured by a comparison of the carrying amount of an asset to future net undiscounted cash flows expected to be generated by the asset. Impairment is measured by the amount by which the carrying value of the assets exceeds the fair value of the assets.
Accounting for Income Taxes
We account for income taxes in accordance with ASC 740, Income Taxes. Under the asset and liability method of ASC 740, deferred tax assets and liabilities are recognized for the future tax consequences attributable to differences between the financial statement carrying amounts of existing assets and liabilities and their respective tax bases. Deferred tax assets and liabilities are measured using enacted tax rates expected to apply to taxable income in the years in which those temporary differences are expected to be recovered or settled.
Under ASC 740, the effect on the deferred tax assets and liabilities of a change in tax rates is recognized in income in the period that includes the enactment date. A valuation allowance is provided for significant deferred tax assets when it is more likely than not that such assets will not be recovered.
Our practice is to recognize interest and/or penalties related to uncertain income tax positions in income tax expense.
Stock-Based Compensation Expense
We measure compensation expense for all stock-based awards at fair value on the date of grant and recognize compensation expense over the service period for the awards expected to vest. From December 2012 until our initial public offering, we obtained periodic valuation analyses prepared by independent third-party valuation firms to assist us with the determination of the fair value of our common stock.
These estimations of fair value are not indicative of future performance and will not be necessary to determine the fair value of new awards after the underlying shares trade on a liquid market.
December 2012 Valuation
We determined the fair value of AAC’s common stock to be $5.24 as of December 15, 2012. In determining the fair value of AAC’s common stock, we reviewed an independent third party valuation report, which used a discounted cash flow method applying a discount rate of 17.6%. Other factors considered in our valuation were the TSN Acquisition in August 2012, which provided an indication of a recent value established as a result of negotiation between sophisticated parties with substantial due diligence about both parties, and a market transaction announced in November 2012 involving similar behavioral health companies. Based on the foregoing analysis, the fair value of the December 31, 2012 grants of 267,337 shares of AAC common stock and 133,668 shares of restricted AAC common stock under our 2007 Stock Incentive Plan were determined to be $5.24 per share.
November 2013 Valuation
On November 19, 2013, AAC issued 145,824 shares of restricted AAC common stock to three employees under our 2007 Stock Incentive Plan, or the 2007 Plan, of which 36,455 shares were immediately vested and the remaining 109,369 shares vested ratably over each quarter ending March 31, 2014 through December 31, 2014. The valuation of AAC’s common stock was determined in accordance with the guidelines outlined in the American Institute of Certified Public Accounts Practice Aid, Calculation of Privately-Held Company Equity Securities Issued as Compensation. We engaged a third party valuation firm to construct a probability-weighted expected return model (“PWERM”) and to assist and advise management in determining the appropriate inputs and metrics to the model. Because there was no public market for AAC’s common stock, the board of directors, with input from management, exercised significant judgment and considered numerous objective and subjective factors to determine the fair value of AAC’s common stock as of November 14, 2013, including the following factors:
· | previous third party valuations of AAC’s common stock; |
· | the price of AAC’s common stock sold to third-party investors; |
· | the value of AAC’s common stock issued in the TSN Acquisition in August 2012; |
· | a market transaction announced in November 2012 involving similar behavioral health companies; |
· | the valuation of a comparable public company; |
57
· | AAC’s operating and financial performance; |
· | current business conditions and projections; |
· | AAC’s stage of development; |
· | the likelihood of achieving a liquidity event for the shares of AAC’s common stock; such as an initial public offering or sale of AAC, given prevailing market conditions; and |
· | any adjustment necessary to recognize a lack of marketability for common stock. |
We used PWERM in determining AAC’s equity value for the November 2013 grant. PWERM is an analysis of future values of a company for several likely liquidity scenarios that may include a strategic sale or merger, an initial public offering or the dissolution of a company, as well as a company’s enterprise value assuming the absence of a liquidity event. For each possible future event, the future values of the company are estimated at certain points in time. This future value is then discounted to a present value using an appropriate risk-adjusted discount rate. Then, a probability is estimated for each possible event based on the facts and circumstances as of the valuation date. Using PWERM, we estimated the value of AAC’s common stock based upon an analysis of varying values for AAC’s common stock assuming (i) the completion of an initial public offering, (ii) a merger or acquisition and (iii) the continuation as a private company. We applied a percentage probability weighting to each of these scenarios based on our expectations of the likelihood of each event. Based on the foregoing PWERM analysis, the fair value of the November 19, 2013 grants of 145,824 shares of restricted AAC common stock was determined to be $6.49 per share.
February 2014 Valuation
We determined the fair value of AAC’s common stock to be $8.12 as of February 12, 2014. In determining the fair value of AAC’s common stock, we reviewed a December 2013 independent third party valuation report, which determined AAC’s implied equity value using a discounted cash flow analysis, a comparison to a selection of precedent merger and acquisition transactions and a comparison to publicly-held companies. In addition, we considered the significant growth for EBITDA and revenues in 2013 compared to 2012, as well as the increased likelihood of an initial public offering of our common stock in 2014. We also considered projected results of operations for the first quarter of 2014 and positive revenue trends. Based on the foregoing analysis, the fair value of the shares of common stock issued in the private placement from February through April 2014, compensatory grants to each of our five non-employee directors in March 2014, a compensatory grant made to our recently hired General Counsel and Secretary in April 2014 under the 2007 Plan and a grant in April 2014 to a non-executive employee each were valued at $8.12 per share.
April 2014 Valuation
In April 2014, Holdings issued an aggregate of 1,054,448 shares of common stock as consideration in connection with the BHR Acquisition and the CRMS Acquisition. In connection with these transactions, we determined the fair value of the shares of Holdings common stock issued in connection with the BHR Acquisition and the CRMS Acquisition to be $8.54 per share as of April 15, 2014. In addition to factoring in the prior valuation analyses described above, we also analyzed a new valuation report prepared by an independent third party with respect to the valuation of Holdings taking into account the Private Share Exchange, BHR Acquisition and CRMS Acquisition. In particular, the valuation report analyzed the potential impact of the then-proposed Reorganization Transactions on the valuation of Holdings, such as the increase in 2013 pro forma net income as a result of BHR results of operations being included for all of 2013. The valuation report also noted that the impact of the BHR Acquisition on the enterprise value would be mixed, as the additional EBITDA generated at the Holdings level due to the recapture of rents and cash and non-cash expenses was not sufficient to overcome the negative impact on enterprise value of BHR’s debt outstanding for the entire year. With respect to CRMS, the analysis determined that it would allow the recapture of additional EBITDA (on a pro forma basis for 2013) due to a combination of recaptured revenues (i.e., commissions no longer paid) and the expected cost savings. In determining the fair value of our common stock, we also considered the improved projected results of operations for the remainder of 2014, positive revenue trends, strong investor demand in the 2014 private placement by AAC and the higher probability of an initial public offering in 2014. Based on the foregoing analysis, we determined the fair value of Holdings common stock as of April 15, 2014 to be $8.54 per share.
Item 7A. Quantitative and Qualitative Disclosures About Market Risk.
Our interest expense is sensitive to changes in market interest rates. In July 2014, we entered into two interest rate swap agreements to mitigate our exposure to interest rate risks. The interest rate swap agreements have initial notional amounts of $13.2 million and $8.9 million which fix the interest rates over the life of interest rate swap agreement at 4.62% and 4.16%, respectively. A hypothetical 1% increase in interest rates would decrease our pre-tax income and cash flows by approximately $25,000 on an annual basis based upon our borrowing level at December 31, 2014.
58
Item 8. Financial Statements and Supplementary Data.
Information with respect to this Item is contained in our consolidated financial statements beginning on Page F-1 of this Annual Report on Form 10-K.
Item 9. Changes in and Disagreements with Accountants on Accounting and Financial Disclosure.
Not applicable.
Item 9A. Controls and Procedures.
Evaluation of Disclosure Controls and Procedures
As of the end of the period covered by this report, our management conducted an evaluation, with the participation of our Chief Executive Officer and Chief Financial Officer, of the effectiveness of our disclosure controls and procedures (as defined in Rules 13a-15(e) and 15d-15(e) under the Exchange Act. Based on this evaluation, our Chief Executive Officer and Chief Financial Officer concluded that our disclosure controls and procedures were effective to ensure that information required to be disclosed by us in the reports that we file or submit under the Exchange Act is recorded, processed, summarized and reported within the time periods specified in Securities and Exchange Commission’s rules and forms and that such information is accumulated and communicated to management, including our chief executive officer and chief financial officer, as appropriate to allow timely decisions regarding required disclosure.
Exemption from Management’s Report on Internal Control Over Financial Reporting for the Fiscal Year Ended December 31, 2014
This annual report does not include a report of management’s assessment regarding internal control over financial reporting or an attestation report of the company’s registered public accounting firm due to a transition period established by rules of the Securities and Exchange Commission for newly public companies.
Changes in Internal Control Over Financial Reporting
There have been no changes in our internal control over financial reporting during the fourth quarter ended December 31, 2014, that have materially affected, or are reasonably likely to materially affect our internal control over financial reporting.
Item 9B. Other Information.
As previously described, on March 9, 2015, we entered into a five year $125 million Senior Secured Credit Facility by and among the Company and Bank of America, N.A., as administrative agent for the lenders party thereto. For additional discussion related to the 2015 Credit Facility, see “Management’s Discussion and Analysis of Financial Condition and Results of Operations—Financing Relationships,” which is incorporated herein by reference.
59
PART III
Item 10. Directors, Executive Officers and Corporate Governance.
The information required by this Item is incorporated by reference to information set forth under the captions “Corporate Governance,” “Management” and “Section 16(a) Beneficial Ownership Reporting Compliance” in our definitive proxy statement for our 2015 Annual Meeting of Stockholders scheduled to be held on May 19, 2015, which we intend to file within 120 days after our fiscal year end.
We have adopted a Code of Business Conduct and Ethics that applies to all of our directors, officers and employees and a Code of Ethics for Senior Financial Officers. These documents, as well as the charters of the Nominating and Corporate Governance Committee, Audit Committee and the Compensation Committee, are available on the Investor Relations section of our website at www.americanaddictioncenters.com under the captions “About Us,” “Investor Relations,” “Corporate Profile” and “Governance Documents.” Upon the written request of any person, we will furnish, without charge, a copy of any of these documents. Requests should be directed to AAC Holdings, Inc., 115 East Park Drive, Second Floor, Brentwood, Tennessee 37027, Attention: Kathryn Sevier Phillips, General Counsel and Secretary. We intend to disclose any amendments to our Code of Ethics and any waiver from a provision of our code, as required by the SEC, on our website.
Item 11. Executive Compensation
The information required by this Item is incorporated by reference to information set forth under the captions “Executive Compensation” and “Corporate Governance – Director Compensation” in our definitive proxy statement for our 2015 Annual Meeting of Stockholders scheduled to be held May 19, 2015, which we intend to file within 120 days after our fiscal year end.
Item 12. Security Ownership of Certain Beneficial Owners and Management and Related Stockholder Matters
The information required by this Item is incorporated by reference to information set forth under the captions “Security Ownership of Certain Beneficial Owners and Management” and in Equity Compensation Plan Information” our definitive proxy statement for our 2015 Annual Meeting of Stockholders scheduled to be held May 19, 2015, which we intend to file within 120 days after our fiscal year end.
Item 13. Certain Relationships and Related Transactions, and Director Independence
The information required by this Item is incorporated by reference to information set forth under the captions “Certain Relationships and Related Person Transactions” and “Corporate Governance” in our definitive proxy statement for our 2015 Annual Meeting of Stockholders scheduled to be held May 19, 2015, which we intend to file within 120 days after our fiscal year end.
Item 14. Principal Accounting Fees and Services
The information required by this Item is incorporated by reference to information set forth under the proposal “Ratification of Appointment of Independent Registered Public Accounting Firm” in our definitive proxy statement for our 2015 Annual Meeting of Stockholders scheduled to be held May 19, 2015, which we intend to file within 120 days after our fiscal year end.
60
PART IV
Item 15. Exhibits and Financial Statement Schedules.
(a) The following documents are filed as part of this Annual Report on Form 10-K:
1. | Consolidated Financial Statements: |
The consolidated financial statements required to be included in Part II, Item 8, Financial Statements and Supplementary Data, begin on Page F-1 and are submitted as a separate section of this report.
2. | Financial Statement Schedules: |
All schedules are omitted because they are not applicable or are not required, or because the required information is included in the consolidated financial statements or notes in this report.
The exhibits required by Item 601 of Regulation S-K are listed in the Exhibit Index and incorporated by reference herein.
61
INDEX TO CONSOLIDATED FINANCIAL STATEMENTS
| | PAGE |
Report of Independent Registered Public Accounting Firm | | F-2 |
Consolidated Balance Sheets as of December 31, 2013 and 2014 | | F-3 |
Consolidated Statements of Income for the years ended December 31, 2012, 2013, and 2014 | | F-5 |
Consolidated Statements of Stockholders’ Equity for the years ended December 31, 2012, 2013, and 2014 | | F-6 |
Consolidated Statements of Cash Flows for the years ended December 31, 2012, 2013, and 2014 | | F-8 |
Notes to Consolidated Financial Statements | | F-10 |
F-1
REPORT OF INDEPENDENT REGISTERED PUBLIC ACCOUNTING FIRM
The Board of Directors and Stockholders
AAC Holdings, Inc.
Brentwood, Tennessee
We have audited the accompanying consolidated balance sheets of AAC Holdings, Inc. as of December 31, 2014 and 2013 and the related consolidated statements of income, stockholders’ equity, and cash flows for each of the three years in the period ended December 31, 2014. These financial statements are the responsibility of the Company’s management. Our responsibility is to express an opinion on these financial statements based on our audits.
We conducted our audits in accordance with the standards of the Public Company Accounting Oversight Board (United States). Those standards require that we plan and perform the audit to obtain reasonable assurance about whether the financial statements are free of material misstatement. The Company is not required to have, nor were we engaged to perform, an audit of its internal control over financial reporting. Our audits included consideration of internal control over financial reporting as a basis for designing audit procedures that are appropriate in the circumstances, but not for the purpose of expressing an opinion on the effectiveness of the Company’s internal control over financial reporting. Accordingly, we express no such opinion. An audit also includes examining, on a test basis, evidence supporting the amounts and disclosures in the financial statements, assessing the accounting principles used and significant estimates made by management, as well as evaluating the overall financial statement presentation. We believe that our audits provide a reasonable basis for our opinion.
In our opinion, the consolidated financial statements referred to above present fairly, in all material respects, the financial position of AAC Holdings, Inc. at December 31, 2014 and 2013, and the results of its operations and its cash flows for each of the three years in the period ended December 31, 2014, in conformity with accounting principles generally accepted in the United States of America.
/s/ BDO USA, LLP
Nashville, Tennessee
March 10, 2015
F-2
AAC HOLDINGS, INC. AND SUBSIDIARIES
CONSOLIDATED BALANCE SHEETS
(Dollars in thousands)
| | December 31, | | | December 31, | |
| | 2013 | | | 2014 | |
| | | | | | | | |
Assets | | | | | | | | |
Current assets | | | | | | | | |
Cash and cash equivalents (variable interest entity— 2013: $441; 2014: $166) | | $ | 2,012 | | | $ | 48,540 | |
Accounts receivable, net of allowances – (variable interest entity—2013: $169; 2014: $308) | | | 24,567 | | | | 28,718 | |
Deferred tax assets | | | 676 | | | | 1,214 | |
Prepaid expenses and other current assets (variable interest entity—2013: $173; 2014: $6) | | | 2,274 | | | | 1,450 | |
Total current assets | | | 29,529 | | | | 79,922 | |
Property and equipment, net (variable interest entity—2013: $29,257; 2014: $-) | | | 37,008 | | | | 49,196 | |
Goodwill | | | 10,863 | | | | 12,702 | |
Intangible assets, net | | | 3,496 | | | | 2,935 | |
Note receivable – related party | | | 250 | | | | — | |
Other assets (variable interest entity—2013: $142; 2014: $-) | | | 492 | | | | 1,197 | |
Total assets | | $ | 81,638 | | | $ | 145,952 | |
— The assets denoted as assets of the consolidated variable interest entities (VIEs) can only be used to settle obligations of the consolidated VIEs.
See accompanying notes to consolidated financial statements.
F-3
AAC HOLDINGS, Inc. AND SUBSIDIARIES
Consolidated Balance Sheets
(Dollars in thousands)
| | December 31, | | | December 31, | |
| | 2013 | | | 2014 | |
| | | | | | | | |
Liabilities, Mezzanine Equity and Stockholders’ Equity | | | | | | | | |
Current liabilities | | | | | | | | |
Accounts payable | | $ | 1,895 | | | $ | 2,001 | |
Accrued liabilities (variable interest entity— 2013: $172; 2014: $142) | | | 10,455 | | | | 10,411 | |
Current portion of long-term debt (variable interest entity—2013: $12,932; 2014: $-) | | | 15,164 | | | | 2,570 | |
Current portion of long-term debt – related party | | | 795 | | | | 1,787 | |
Total current liabilities | | | 28,309 | | | | 16,769 | |
Deferred tax liabilities (variable interest entity—2013: $23; 2014: $-) | | | 2,329 | | | | 1,479 | |
Long-term debt, net of current portion (variable interest entity—2013: $8,616; 2014: $-) | | | 23,341 | | | | 24,097 | |
Long-term debt—related party, net of current portion | | | 3,775 | | | | 187 | |
Other long-term liabilities | | | 159 | | | | 431 | |
Total liabilities | | | 57,913 | | | | 42,963 | |
| | | | | | | | |
Commitments and contingencies (Note 17) | | | | | | | | |
Mezzanine equity including noncontrolling interest (see Note 11) | | | | | | | | |
Noncontrolling interest—American Addiction Centers, Inc. common stock | | | 10,442 | | | | — | |
Noncontrolling interest—Series A Preferred Units (variable interest entity in 2013) | | | 1,400 | | | | — | |
Noncontrolling interest—Series A Preferred Units | | | — | | | | 7,848 | |
Total mezzanine equity including noncontrolling interest | | | 11,842 | | | | 7,848 | |
Stockholders’ equity | | | | | | | | |
AAC Holdings, Inc. preferred stock, $0.001 par value: 5,000,000 shares authorized; none issued and outstanding | | | — | | | | — | |
AAC Holdings, Inc. common stock, $0.001 par value: 70,000,000 shares authorized, 21,374,374 shares issued and outstanding at December 31, 2014 | | | — | | | | 21 | |
American Addiction Centers, Inc. common stock, $0.001 par value: 15,000,000 shares authorized; 2,481,114 shares issued and 2,036,680 outstanding at December 31, 2013 | | | 3 | | | | — | |
American Addiction Centers, Inc. common stock subscribed, net of subscription receivable of $58 at December 31, 2013 | | | 42 | | | | — | |
Additional paid-in capital | | | 9,449 | | | | 88,238 | |
Treasury stock, at cost | | | (3,671 | ) | | | — | |
Retained earnings | | | 2,360 | | | | 9,215 | |
Total stockholders’ equity of AAC Holdings, Inc. | | | 8,183 | | | | 97,474 | |
Noncontrolling interest | | | 3,700 | | | | (2,333 | ) |
Total stockholders’ equity including noncontrolling interest | | | 11,883 | | | | 95,141 | |
Total liabilities, mezzanine equity and stockholders’ equity | | $ | 81,638 | | | $ | 145,952 | |
— The denoted VIEs’ liabilities are only claims against the general credit of the Company to the extent that the Company is liable under its guarantee of the VIEs’ notes payable to a financial institution of $21,548 and $0 at December 31, 2013 and 2014, respectively.
See accompanying notes to consolidated financial statements.
F-4
AAC HOLDINGS, Inc. AND SUBSIDIARIES
CONSOLIDATED STATEMENTS OF INCOME
(Dollars in thousands, except per share amounts)
| | Year Ended December 31, | |
| | 2012 | | | 2013 | | | 2014 | |
Revenues | | $ | 66,035 | | | $ | 115,741 | | | $ | 132,968 | |
Operating expenses | | | | | | | | | | | | |
Salaries, wages and benefits | | | 25,680 | | | | 46,856 | | | | 54,707 | |
Advertising and marketing | | | 8,667 | | | | 13,493 | | | | 15,683 | |
Professional fees | | | 5,430 | | | | 10,277 | | | | 8,075 | |
Client related services | | | 8,389 | | | | 7,986 | | | | 10,794 | |
Other operating expenses | | | 6,384 | | | | 11,615 | | | | 13,518 | |
Rentals and leases | | | 3,614 | | | | 4,634 | | | | 2,106 | |
Provision for doubtful accounts | | | 3,344 | | | | 10,950 | | | | 11,391 | |
Litigation settlement | | | — | | | | 2,588 | | | | 487 | |
Restructuring | | | — | | | | 806 | | | | — | |
Depreciation and amortization | | | 1,288 | | | | 3,003 | | | | 4,662 | |
Total operating expenses | | | 62,796 | | | | 112,208 | | | | 121,423 | |
Income from operations | | | 3,239 | | | | 3,533 | | | | 11,545 | |
Interest expense, net | | | 980 | | | | 1,390 | | | | 1,872 | |
Acquisition-related expenses | | | — | | | | — | | | | 845 | |
Other (income) expense, net | | | 12 | | | | 36 | | | | (93 | ) |
Income before income tax expense | | | 2,247 | | | | 2,107 | | | | 8,921 | |
Income tax expense | | | 1,148 | | | | 615 | | | | 2,555 | |
Net income | | | 1,099 | | | | 1,492 | | | | 6,366 | |
Less: net loss (income) attributable to noncontrolling interest | | | 405 | | | | (706 | ) | | | 1,182 | |
Net income attributable to AAC Holdings, Inc. stockholders | | | 1,504 | | | | 786 | | | | 7,548 | |
Deemed contribution-redemption of Series B Preferred Stock | | | — | | | | 1,000 | | | | — | |
BHR Series A Preferred Unit dividend | | | — | | | | — | | | | (693 | ) |
Net income available to AAC Holdings, Inc. common stockholders | | $ | 1,504 | | | $ | 1,786 | | | $ | 6,855 | |
Basic earnings per common share | | $ | 0.12 | | | $ | 0.13 | | | $ | 0.41 | |
Diluted earnings per common share | | $ | 0.12 | | | $ | 0.12 | | | $ | 0.41 | |
Weighted-average shares outstanding: | | | | | | | | | | | | |
Basic | | | 12,208,160 | | | | 13,855,797 | | | | 16,557,655 | |
Diluted | | | 12,363,164 | | | | 14,291,937 | | | | 16,619,180 | |
See accompanying notes to consolidated financial statements
F-5
AAC HOLDINGS, Inc. AND SUBSIDIARIES
Consolidated Statements of Stockholders’ Equity
(In thousands, except share amounts)
| | | | | | | | | | | | | | | | | | | | | | | | | | Additional | | | | | | | | | | | | | | | | | | | | | |
| | | | | | | | | | | | | | | | | | | | | | | | | | Paid-in | | | | | | | | | | | | | | | | | | | | | |
| | | | | | | | | | | | | | | | | | | | | | | | | | Capital/ | | | | | | | | | | | Total | | | | | | | | | |
| | Common Stock – | | | Common Stock – | | | | | | | | | | | (Distributions | | | | | | | | | | | Stockholders’ | | | | | | | | | |
| | American Addiction Centers, Inc. | | | AAC Holdings, Inc. | | | | | | | | | | | in Excess of | | | | | | | | | | | Equity (Deficit) | | | Non- | | | Total | |
| | Shares | | | | | | | Shares | | | | | | | | | | | Subscription | | | Paid-in | | | Treasury | | | Retained | | | of American | | | Controlling | | | Stockholders’ | |
| | Outstanding | | | Amount | | | Outstanding | | | Amount | | | Subscribed | | | Receivable | | | Capital) | | | Stock | | | Earnings | | | AAC Holdings, Inc. | | | Interests | | | Equity (Deficit) | |
Balance at December 31, 2011 | | | 148,855 | | | $ | — | | | | — | | | $ | — | | | $ | — | | | $ | — | | | $ | (7,789 | ) | | $ | (17 | ) | | $ | 70 | | | $ | (7,736 | ) | | $ | — | | | $ | (7,736 | ) |
Warrants issued with subordinated debt | | | — | | | | — | | | | — | | | | — | | | | — | | | | — | | | | 143 | | | | — | | | | — | | | | 143 | | | | — | | | | 143 | |
Common stock issued in connection with business combination (of which 355,727 shares are restricted) | | | 1,396,518 | | | | 1 | | | | — | | | | — | | | | — | | | | — | | | | 5,568 | | | | — | | | | — | | | | 5,569 | | | | — | | | | 5,569 | |
Initial consolidation of VIEs | | | — | | | | — | | | | — | | | | — | | | | — | | | | — | | | | — | | | | — | | | | — | | | | — | | | | 4,284 | | | | 4,284 | |
Distribution to noncontrolling interest holders | | | — | | | | — | | | | — | | | | — | | | | — | | | | — | | | | — | | | | — | | | | — | | | | — | | | | (82 | ) | | | (82 | ) |
Common stock granted under stock incentive plan | | | — | | | | | | | | | | | | | | | | — | | | | — | | | | 1,401 | | | | — | | | | — | | | | 1,401 | | | | — | | | | 1,401 | |
Net income | | | — | | | | — | | | | — | | | | — | | | | — | | | | — | | | | — | | | | — | | | | 1,504 | | | | 1,504 | | | | (405 | ) | | | 1,099 | |
Balance at December 31, 2012 | | | 1,545,373 | | | $ | 1 | | | | — | | | $ | — | | | $ | — | | | $ | — | | | $ | (677 | ) | | $ | (17 | ) | | $ | 1,574 | | | $ | 881 | | | $ | 3,797 | | | $ | 4,678 | |
Common stock issued | | | 1,424,124 | | | | 1 | | | | | | | | | | | | 100 | | | | (58 | ) | | | 7,428 | | | | — | | | | — | | | | 7,471 | | | | — | | | | 7,471 | |
Redemption of mezzanine Series B Preferred Stock | | | — | | | | — | | | | — | | | | — | | | | — | | | | — | | | | 1,000 | | | | — | | | | — | | | | 1,000 | | | | — | | | | 1,000 | |
Redemption of common stock | | | — | | | | | | | | | | | | | | | | — | | | | — | | | | (1,238 | ) | | | — | | | | — | | | | (1,238 | ) | | | — | | | | (1,238 | ) |
Common stock granted and issued under stock incentive plan | | | 546,828 | | | | 1 | | | | — | | | | — | | | | — | | | | — | | | | 936 | | | | — | | | | — | | | | 937 | | | | — | | | | 937 | |
Conversion of debt to equity | | | 381,803 | | | | | | | | | | | | | | | | — | | | | — | | | | 2,000 | | | | — | | | | — | | | | 2,000 | | | | — | | | | 2,000 | |
Redemption of common stock | | | (698,259 | ) | | | — | | | | — | | | | — | | | | — | | | | — | | | | — | | | | (3,654 | ) | | | — | | | | (3,654 | ) | | | — | | | | (3,654 | ) |
Initial consolidation of VIEs | | | — | | | | | | | | | | | | | | | | — | | | | — | | | | — | | | | — | | | | — | | | | — | | | | 3,020 | | | | 3,020 | |
Redemptions of noncontrolling interest of variable interest entities | | | — | | | | — | | | | — | | | | — | | | | — | | | | — | | | | — | | | | — | | | | — | | | | — | | | | (2,990 | ) | | | (2,990 | ) |
Distribution to noncontrolling interest holders, net | | | — | | | | | | | | | | | | | | | | — | | | | — | | | | — | | | | — | | | | — | | | | — | | | | (815 | ) | | | (815 | ) |
Net income | | | — | | | | — | | | | — | | | | — | | | | — | | | | — | | | | — | | | | — | | | | 786 | | | | 786 | | | | 706 | | | | 1,492 | |
Noncontrolling interest - Series A Preferred Dividend accrued | | | — | | | | — | | | | — | | | | — | | | | — | | | | — | | | | — | | | | — | | | | — | | | | — | | | | (18 | ) | | | (18 | ) |
Balance at December 31, 2013 | | | 3,199,869 | | | $ | 3 | | | | — | | | $ | — | | | $ | 100 | | | $ | (58 | ) | | $ | 9,449 | | | $ | (3,671 | ) | | $ | 2,360 | | | $ | 8,183 | | | $ | 3,700 | | | $ | 11,883 | |
Common stock issued | | | 741,322 | | | | 1 | | | | — | | | | — | | | | (100 | ) | | | 58 | | | | 6,117 | | | | — | | | | — | | | | 6,076 | | | | — | | | | 6,076 | |
Exercise of common stock warrants | | | 112,658 | | | | — | | | | — | | | | — | | | | — | | | | — | | | | 72 | | | | — | | | | — | | | | 72 | | | | — | | | | 72 | |
Common stock granted and issued under stock incentive plan | | | 111,676 | | | | — | | | | 158,000 | | | | — | | | | — | | | | — | | | | 1,745 | | | | — | | | | — | | | | 1,745 | | | | — | | | | 1,745 | |
Dividends to mezzanine noncontrolling interests | | | — | | | | — | | | | — | | | | — | | | | — | | | | — | | | | — | | | | — | | | | — | | | | — | | | | (61 | ) | | | (61 | ) |
Distribution to noncontrolling interest holders, net | | | — | | | | — | | | | — | | | | — | | | | — | | | | — | | | | — | | | | — | | | | — | | | | — | | | | (915 | ) | | | (915 | ) |
Redemption of common stock | | | (14,318 | ) | | | — | | | | — | | | | — | | | | — | | | | — | | | | (5,594 | ) | | | (116 | ) | | | — | | | | (5,710 | ) | | | — | | | | (5,710 | ) |
Private share exchange | | | (4,151,207 | ) | | | (4 | ) | | | 14,618,886 | | | | 15 | | | | — | | | | — | | | | 4,892 | | | | 3,787 | | | | — | | | | 8,690 | | | | 1,694 | | | | 10,384 | |
BHR acquisition | | | — | | | | — | | | | 820,124 | | | | 1 | | | | — | | | | — | | | | (1,217 | ) | | | — | | | | — | | | | (1,216 | ) | | | (3,661 | ) | | | (4,877 | ) |
F-6
CRMS acquisition | | | — | | | | — | | | | 234,324 | | | | — | | | | — | | | | — | | | | 2,000 | | | | — | | | | — | | | | 2,000 | | | | — | | | | 2,000 | |
Common stock issued | | | — | | | | — | | | | 5,250,000 | | | | 5 | | | | — | | | | — | | | | 68,866 | | | | — | | | | — | | | | 68,871 | | | | — | | | | 68,871 | |
Short-form merger | | | — | | | | — | | | | 293,040 | | | | — | | | | — | | | | — | | | | 1,908 | | | | — | | | | — | | | | 1,908 | | | | (1,908 | ) | | | — | |
Dividends BHR Series A Preferred Units | | | — | | | | — | | | | — | | | | — | | | | — | | | | — | | | | — | | | | — | | | | (693 | ) | | | (693 | ) | | | — | | | | (693 | ) |
Net income | | | — | | | | — | | | | — | | | | — | | | | — | | | | — | | | | — | | | | — | | | | 7,548 | | | | 7,548 | | | | (1,182 | ) | | | 6,366 | |
Balance at December 31, 2014 | | | — | | | $ | — | | | | 21,374,374 | | | $ | 21 | | | $ | — | | | $ | — | | | $ | 88,238 | | | $ | — | | | $ | 9,215 | | | $ | 97,474 | | | $ | (2,333 | ) | | $ | 95,141 | |
See accompanying notes to consolidated financial statements.
F-7
AAC HOLDINGS, INC. AND SUBSIDIARIES
CONSOLIDATED STATEMENTS OF CASH FLOWS
(Dollars in thousands)
| | Year Ended December 31, | |
| | 2012 | | | 2013 | | | 2014 | |
Cash flows from operating activities: | | | | | | | | | | | | |
Net income | | $ | 1,099 | | | $ | 1,492 | | | $ | 6,366 | |
Adjustments to reconcile net income to net cash provided by operating activities: | | | | | | | | | | | | |
Provision for doubtful accounts | | | 3,344 | | | | 10,950 | | | | 11,391 | |
Depreciation and amortization | | | 1,288 | | | | 3,003 | | | | 4,662 | |
Loss on disposal of property and equipment | | | — | | | | 395 | | | | — | |
Equity compensation | | | 1,401 | | | | 979 | | | | 1,802 | |
Accretion of BHR Series A Preferred Units | | | — | | | | — | | | | 66 | |
Amortization of discount on notes payable | | | 48 | | | | 32 | | | | 32 | |
Deferred income taxes | | | 37 | | | | (1,500 | ) | | | (1,374 | ) |
Decrease in fair value of contingent related-party note payable | | | — | | | | (91 | ) | | | — | |
Changes in operating assets and liabilities (excluding acquisitions): | | | | | | | | | | | | |
Accounts receivable | | | (11,879 | ) | | | (14,810 | ) | | | (15,155 | ) |
Prepaid expenses and other assets | | | (763 | ) | | | (1,287 | ) | | | 190 | |
Accounts payable | | | 995 | | | | 510 | | | | 106 | |
Accrued liabilities | | | 4,499 | | | | 3,611 | | | | (320 | ) |
Other long term liabilities | | | — | | | | 159 | | | | 272 | |
Net cash provided by operating activities | | | 69 | | | | 3,443 | | | | 8,038 | |
Cash flows from investing activities: | | | | | | | | | | | | |
Purchase of property and equipment | | | (6,264 | ) | | | (12,975 | ) | | | (15,584 | ) |
Issuance of notes and other receivables — related parties | | | — | | | | — | | | | (488 | ) |
Acquisition of subsidiaries, net of cash acquired | | | (2,500 | ) | | | — | | | | (3,483 | ) |
Cash acquired in consolidation of variable interest entity | | | — | | | | 210 | | | | — | |
Escrow funds held on acquisition | | | — | | | | — | | | | (500 | ) |
Proceeds on sale of minority interest investment | | | 150 | | | | — | | | | — | |
Funding of notes receivable, related party | | | (50 | ) | | | — | | | | — | |
Collection of notes and other receivables — related parties | | | 268 | | | | 50 | | | | 738 | |
(Purchase) reimbursement of other assets | | | 500 | | | | (429 | ) | | | (204 | ) |
Net cash used in investing activities | | | (7,896 | ) | | | (13,144 | ) | | | (19,521 | ) |
Cash flows from financing activities: | | | | | | | | | | | | |
Proceeds from (repayment on) revolving line of credit, net | | | 2,635 | | | | 5,851 | | | | (12,550 | ) |
Proceeds from long-term debt | | | 6,589 | | | | 9,150 | | | | 4,053 | |
Proceeds from long-term debt — related party | | | 1,500 | | | | — | | | | — | |
Proceeds from sale of subordinated notes payable | | | 990 | | | | — | | | | — | |
Payments on long-term debt and capital leases | | | (863 | ) | | | (2,433 | ) | | | (5,742 | ) |
Repayment of long-term debt — related party | | | (2,295 | ) | | | (1,554 | ) | | | (2,601 | ) |
Repayment of subordinated notes payable | | | (40 | ) | | | — | | | | — | |
Repurchase of common stock | | | — | | | | (5,063 | ) | | | (5,710 | ) |
Proceeds from sale of common stock — initial public offering | | | — | | | | — | | | | 69,518 | |
Proceeds from sale of common stock — private placement | | | — | | | | 7,429 | | | | 6,089 | |
Proceeds from sale of BHR Series A Preferred Units | | | — | | | | — | | | | 8,203 | |
Redemption of BHR Series A Preferred Units | | | — | | | | — | | | | (1,825 | ) |
Dividends paid | | | — | | | | — | | | | (509 | ) |
Contributions from noncontrolling interest | | | — | | | | 1,979 | | | | — | |
Distributions to noncontrolling interest | | | (82 | ) | | | (1,396 | ) | | | (915 | ) |
Redemption of noncontrolling interest | | | — | | | | (2,990 | ) | | | — | |
Net cash provided by financing activities | | | 8,434 | | | | 10,973 | | | | 58,011 | |
Net increase in cash and cash equivalents | | | 607 | | | | 1,272 | | | | 46,528 | |
Cash and cash equivalents, beginning of period | | | 133 | | | | 740 | | | | 2,012 | |
Cash and cash equivalents, end of period | | $ | 740 | | | $ | 2,012 | | | $ | 48,540 | |
See accompanying notes to audited consolidated financial statements.
F-8
AAC HOLDINGS, Inc. AND SUBSIDIARIES
CONSOLIDATED STATEMENTS OF CASH FLOWS
(Dollars in thousands)
| | Year Ended December 31, | |
| | 2012 | | | 2013 | | | 2014 | |
Supplemental disclosures of cash flow information: | | | |
Cash and cash equivalents paid for: | | | | | | | | | | | | |
Interest, net of capitalized interest | | $ | 730 | | | $ | 1,265 | | | $ | 1,743 | |
Income taxes, net of refunds | | $ | 53 | | | $ | 2,870 | | | $ | 4,156 | |
Supplemental information on non-cash investing and financing transactions: | | | | | | | | | | | | |
Acquisitions: | | | | | | | | | | | | |
Purchase Price | | $ | 14,591 | | | $ | — | | | $ | 14,259 | |
Assumption of debt | | | (6,522 | ) | | | — | | | | (1,759 | ) |
Buyer common stock issued | | | (5,569 | ) | | | — | | | | (9,000 | ) |
Cash paid for acquisition | | $ | 2,500 | | | $ | — | | | $ | 3,500 | |
| | | | | | | | | | | | |
Consolidation of variable interest entities: | | | | | | | | | | | | |
Assets of variable interest entities, excluding cash | | $ | (7,760 | ) | | $ | (17,407 | ) | | | — | |
Liabilities of variable interest entities and noncontrolling interest, excluding cash | | | 7,760 | | | | 17,617 | | | | — | |
Cash of variable interest entities | | $ | — | | | $ | 210 | | | $ | — | |
| | | | | | | | | | | | |
Conversion of long-term debt — related party into common stock | | $ | — | | | $ | 2,000 | | | $ | — | |
Acquisition of equipment through capital lease | | $ | — | | | $ | (1,163 | ) | | $ | 614 | |
Sale of property to a variable interest entity | | $ | — | | | $ | 6,708 | | | $ | — | |
Notes payable in connection with the sale of property to a consolidated variable interest entity | | $ | — | | | $ | (6,708 | ) | | $ | — | |
Redemption of Series B Preferred Stock | | $ | — | | | $ | 1,000 | | | $ | — | |
Accrued dividends BHR Series A Preferred units | | $ | — | | | $ | 18 | | | $ | 245 | |
See accompanying notes to audited consolidated financial statements.
F-9
AAC Holdings, Inc.
NOTES TO CONSOLIDATED FINANCIAL STATEMENTS
1. Description of Business
AAC Holdings, Inc., a Nevada corporation (collectively with its subsidiaries, the “Company” or “Holdings”), was incorporated on February 12, 2014 for the purpose of acquiring all the common stock of American Addiction Centers, Inc. (“AAC”) and to engage in certain reorganization transactions as more fully described in Note 3. The Company is headquartered in Brentwood, Tennessee and provides substance abuse treatment services for individuals with drug and alcohol addiction. At December 31, 2014, the Company, through its subsidiaries, operated six substance abuse treatment facilities located in Texas, California, Florida and Nevada, focused on delivering effective clinical care and treatment solutions across 473 beds, including 338 licensed detoxification beds, and one facility in Tennessee that provides treatment services for clients struggling with behavioral health disorders, including disorders associated with obesity.
On October 7, 2014, the Company completed an initial public offering (“IPO”) of 5,750,000 shares of its common stock at a public offering price of $15.00 per share, which included the exercise in full of the underwriters’ option to purchase an additional 250,000 shares from the Company and 500,000 shares from certain stockholders. Net proceeds to the Company from the IPO were approximately $68.8 million, after deducting underwriting discounts and offering costs.
On November 10, 2014, the Company completed a subsidiary short-form merger with AAC and a wholly-owned merger subsidiary whereby the legacy holders of AAC common stock who did not participate in the Private Share Exchange (as defined in Note 3) received 1.571119 shares of Holdings common stock for each share of AAC common stock owned at the effective time of the merger (for an aggregate of approximately 293,040 shares of Holdings common stock). Upon completion of the short-form merger, Holdings owned 100% of the outstanding shares AAC.
On November 20, 2014, the Company received licensure to conduct high complexity lab tests for AAC facilities in Florida, the first of which were processed beginning on December 1, 2014.
On December 15, 2014, the Company entered into an Asset Purchase Agreement with Recovery First, Inc., a Florida corporation (the “Recovery First”) and a certain equity owner of Recovery First, pursuant to which it will acquire substantially all of the assets and assume certain specified liabilities of Recovery First. Recovery First is a Florida-based provider of substance abuse treatment and rehabilitation services, including a 56-bed inpatient substance abuse treatment facility in the greater Fort Lauderdale, Florida area. The aggregate purchase price payable is $13.0 million in cash. The Company completed the closing of this acquisition on February 20, 2015.
On December 18, 2014, the Company terminated the Second Amended and Restated Credit Agreement by and among the Company, American Addiction Centers, Inc., the lenders party thereto from time to time and Wells Fargo Bank, National Association, as administrative agent and collateral agent for the lenders, dated as of April 15, 2014, as amended (the “2014 Credit Agreement”), after having repaid the outstanding principal balance of $487,500 plus accrued interest. The 2014 Credit Agreement, as in effect at the time of termination, made available to the Company a $15.0 million revolving line of credit, subject to borrowing base limitations. The 2014 Credit Agreement also included an outstanding term loan in the outstanding principal amount of $0.5 million which was repaid in full. The Company did not incur early termination penalties as a result of the termination of the 2014 Credit Agreement. See further discussion of the new credit facility entered into on March 9, 2015 in Note 20.
2. Basis of Presentation
Principles of Consolidation
The Company conducts its business through limited liability companies and C-corporations, each of which is a wholly owned subsidiary of the Company. The accompanying consolidated financial statements include the accounts of the Company, its wholly owned subsidiaries and the accounts of variable interest entities (“VIEs”) in which the Company is the primary beneficiary. All intercompany transactions and balances have been eliminated in consolidation.
The Private Share Exchange transaction between the Company and AAC’s stockholders (as discussed in Note 3) was accounted for similar to a common control transaction resulting in the assets, liabilities, and equity of AAC being carried over at their historical bases. At the time of the Private Share Exchange, Holdings was a shell company that had not conducted any business and had no material assets or liabilities. As such, the historical financial statements presented for periods prior to the Private Share Exchange represent the historical results of operations of AAC.
F-10
The Company consolidated one real estate VIE in 2012 and consolidated another two VIEs in 2013. All three of these VIEs were acquired in 2013 by Behavioral Healthcare Realty, LLC (“BHR”), which was also a VIE. During the year ended December 31, 2014, the Company consolidated one real estate VIE, BHR, through April 15, 2014 when BHR was acquired by the Company. BHR leased two treatment facilities to the Company under long-term triple net leases and was renovating and constructing additional treatment facilities that it planned to lease to the Company. The Company was the primary beneficiary as a result of its guarantee of BHR’s debt prior to the BHR Acquisition. The Company also consolidated five professional groups (“Professional Groups”) that constitute VIEs during the year ended December 31, 2013. The Company provides management services to the Professional Groups which provide medical services to the Company’s treatment facilities. The Professional Groups are responsible for the supervision and delivery of medical services to the Company’s clients. Based on the Company’s ability to direct the activities that most significantly impact the economic performance of the Professional Groups, provide necessary funding and the obligation and likelihood of absorbing all expected gains and losses, the Company has determined that it is the primary beneficiary of these Professional Groups. The accompanying consolidated balance sheets as of December 31, 2013 and 2014 include assets of $30.2 million and $0.5 million, respectively, and liabilities of $21.7 million and $3.3 million, respectively, related to the VIEs. The accompanying consolidated income statements include net income (loss) attributable to noncontrolling interest of ($0.4) million, $0.7 million, and ($1.2) million, related to the VIEs for the year ended December 31, 2012, 2013, and 2014, respectively.
The accompanying consolidated financial statements have been prepared in accordance with U.S. generally accepted accounting principles (“GAAP”). The preparation of financial statements in conformity with GAAP requires management to make estimates and assumptions that affect the amounts reported in the consolidated financial statements and accompanying notes. Actual results could differ from those estimates.
3. Reorganization Transactions
On April 15, 2014, the Company completed the following transactions which were all completed substantially concurrently (collectively, the “Reorganization Transactions”):
· | A voluntary private share exchange with certain stockholders of AAC, whereby holders representing over 93.6% of the outstanding shares of common stock of AAC exchanged their shares on a one-for-one basis for shares of the Company’s common stock (the “Private Share Exchange”); |
· | The acquisition of all of the outstanding common membership interests of Behavioral Healthcare Realty, LLC (“BHR”), an entity controlled by related parties, which through its subsidiaries owns properties located in Florida, Nevada and Texas, in exchange for $3.0 million in cash, the assumption of a $1.8 million term loan and 820,124 shares of the Company’s common stock (the “BHR Acquisition”); and |
· | The acquisition of all of the outstanding membership interests of Clinical Revenue Management Services, LLC (“CRMS”), an entity controlled by related parties, which provides client billing and collection services for the Company, in exchange for $0.5 million in cash and 234,324 shares of the Company’s common stock. |
As a result of the foregoing transactions, the Company owned (i) over 93.6% of the outstanding common stock of AAC, (ii) 100% of the outstanding common membership interests in BHR, and (iii) 100% of the outstanding membership interests in CRMS. To help fund or facilitate these transactions, the following additional financing transactions were undertaken in 2014 prior to or in connection with the aforementioned transactions: (i) AAC sold 741,322 shares of its common stock in a private placement to certain accredited investors from February 2014 through April 2014, with net proceeds of $6.0 million, (ii) BHR sold 8.5 Series A Preferred Units in a private placement to certain accredited investors in January and February 2014 with net proceeds of $0.4 million (See Note 11), (iii) BHR redeemed all of its outstanding 36.5 Series A Preferred Units from certain accredited investors in April 2014 (See Note 11) and (iv) BHR sold 160 new Series A Preferred Units in a private placement to an accredited investor in April 2014 with net proceeds of $7.8 million (See Note 11).
Private Share Exchange
Certain common shares of AAC issued in 2008 under the previous Board of Directors exceeded the number of shares duly authorized by AAC’s Articles of Incorporation. These common shares were previously classified as mezzanine equity in the consolidated balance sheets because they did not meet the definition of permanent equity as a result of these legal imperfections. To cure these legal imperfections and in preparation for an initial public offering, in the first quarter of 2014, the Company initiated a voluntary private share exchange with certain of AAC’s stockholders whereby the Company offered to certain of AAC’s stockholders the opportunity to receive one share of the Company’s common stock for (i) each share of AAC’s common stock held by such stockholders and (ii) a release from claims arising from or related to the share imperfections (collectively, the “Private Share Exchange”). The Private Share Exchange was conditioned upon, among other things, holders of AAC’s common stock who participated in the Private Share Exchange validly assigning and transferring to the Company at least 90% of the outstanding shares of AAC prior to the expiration of the Private Share Exchange. The Private Share Exchange expired in April 2014, and at the expiration of
F-11
the Private Share Exchange, holders representing 93.6% of AAC’s common stock had exchanged their shares for shares of common stock of the Company, and AAC became a majority-owned subsidiary of the Company. The Private Share Exchange was accounted for similar to a common control transaction resulting in the assets, liabilities and equity of AAC being carried over at their historical bases. Prior to the completion of the Reorganization Transactions, Holdings had not engaged in any business or other activities except in connection with its formation. Shares of AAC common stock that were not exchanged remained in mezzanine equity or stockholders’ equity until the completion of the short-form merger in November 2014.
Behavioral Healthcare Realty, LLC Acquisition
On April 15, 2014, BHR redeemed 36.5 of its non-controlling Series A Preferred Units for $1.8 million. These former holders of Series A Preferred Units used the proceeds from the redemption to purchase 224,697 shares of AAC’s common stock at $8.12 per share as part of an exempt common stock offering. Included in the aforementioned transaction, nine of the Series A Preferred Units were redeemed from directors and relatives of directors who purchased 55,406 shares of AAC’s common stock valued at approximately $450,000.
Simultaneously, BHR amended and restated its Limited Liability Company Agreement which among other things changed the rights and privileges of the Series A Preferred Units. On April 15, 2014, BHR received $7.8 million in net proceeds from the sale of 160 units ($50,000 per unit) of its non-controlling Series A Preferred Units to BNY Alcentra Group Holdings, Inc. (“Alcentra”). Alcentra received a 1% fee at closing and is entitled to receive a 12% per annum preferred return on its initial investment, payable quarterly in arrears. In the event of a non-payment, the preferred return compounds on a quarterly basis computed on an actual/360 day basis. In the event of non-payment for three months, the preferred return increases to 15.0%, and further increases to 18.0% if not paid beginning in the fourth month, with each increase compounding on a quarterly basis computed on an actual/360 day basis. The Series A Preferred Units contain certain embedded issuer call and holder put provisions. BHR has the option to redeem a minimum of 40 Series A Preferred Units and up to 100% of the outstanding Series A Preferred Units for $50,000 per unit, plus (i) any accrued and unpaid preferred return and (ii) a call premium of (a) 3.0% through April 15, 2015, (b) 2.0% from April 16, 2015 through April 15, 2017 and (c) no premium any time after April 15, 2017. Alcentra has a put right that, if exercised, requires BHR to redeem all of the issued and outstanding Series A Preferred Units by making a payment equal to $50,000 per unit plus the accrued but unpaid preferred return. Alcentra may exercise its put right for a period of 30 days following the 36th month or 48th month after the date of issuance and at any time following the 60th month after the date of issuance. In the event of a sale of a property owned by BHR, Alcentra is entitled to the repayment of its initial capital contribution plus (i) any accrued and unpaid preferred return and (ii) any applicable call premium. As long as any of the Series A Preferred Units are outstanding, distributions to affiliates of BHR are limited to $3.0 million annually.
The Series A Preferred Units generally have no voting or approval rights regarding the management of BHR. However, the holders of Series A Preferred Units are entitled to vote with respect to (i) any action that would change the rights or restrictions of the Series A Preferred Units in a way that would adversely affect such holders and (ii) the creation or issuance of any other security convertible into or exercisable for any equity security of BHR having rights, preferences or privileges senior to the common units of BHR. In addition, unanimous approval of all BHR members, including the holders of Series A Preferred Units, is required to approve the sale by BHR of more than 50% of its real property, more than 50% of the voting or economic rights of any BHR subsidiary or the merger, consolidation, sale of all or substantially all of the assets of BHR or sale of a majority of the common units of BHR.
In addition, so long as Alcentra owns at least 60 Series A Preferred Units, subject to adjustment for certain BHR redemptions, the manager of BHR may not engage in certain transactions without the approval of a majority of the Series A Preferred Unit holders, including, without limitation, the following: (i) liquidate, dissolve or wind up the business of BHR; (ii) authorize the issuance of additional Series A Preferred Units or any class or series of equity securities with rights, preferences or parity with or senior to that of the Series A Preferred Units; (iii) declare or pay any cash distribution or make any other distribution not permitted under the limited liability company agreement; (iv) pay any management or similar fees; (v) pay rebates or reduce payments payable by any primary tenants or (vi) make payments to affiliates of BHR in excess of $3.0 million per year in the aggregate.
F-12
Substantially concurrent with the Private Share Exchange, the Company acquired all of the outstanding common membership interests of BHR by issuing 820,124 shares of Company common stock (at a fair value of $8.54 per share as determined by the Company), paying $3.0 million in cash and assuming of a $1.7 million term loan from a financial institution to our CEO, President and CFO. The original proceeds from this loan were used to repay a loan related to Greenhouse Real Estate, LLC and was accounted for as an additional capital contribution in BHR. The Company refinanced the assumed term loan and is required to make monthly principal payments of $35,855 to a financial institution, plus 5.0% interest and a balloon payment of $1.4 million in April 2015. In the event of an initial public offering prior to April 2015, the Credit Facility required that the Company immediately repay the $1.7 million assumed and refinanced term loan with proceeds from the IPO. Prior to the BHR Acquisition, BHR was controlled by the CEO, President and CFO of the Company. BHR owns the real property associated with treatment facilities, which are leased to the Company, as well as other properties that are currently in development or are being held for future development. The BHR Acquisition was accounted for as a common control transaction as BHR was already being consolidated as a VIE in accordance with FASB ASC 810, Consolidations, and, accordingly, the Company recognized $4.9 million of the $11.8 million in fair value of consideration transferred (consisting of $3.0 million cash consideration, the $1.7 million loan assumed and the net deferred tax liabilities of $0.2 million). The Company eliminated the noncontrolling interest attributable to BHR of $3.7 million with the excess of fair value over the carrying value of noncontrolling interest recorded as a reduction to additional paid-in capital of $1.2 million.
Clinical Revenue Management Services, LLC Acquisition
On April 15, 2014, the Company acquired all the outstanding membership interests of CRMS in exchange for $0.5 million in cash and 234,324 common shares of the Company’s common stock (at a fair value of $8.54 per common share as determined by the Company) for total consideration paid of $2.5 million (collectively, the “CRMS Acquisition”). The purchase price was based upon a third party valuation report of CRMS obtained by the Company. CRMS provides billing and collections services to the Company and has no customers other than the Company. After this acquisition, all billing and collection services for the Company are performed by a wholly owned subsidiary. Prior to its acquisition by the Company, CRMS was owned by the spouses of the Company’s CEO and President. The purchase price resulted in a premium to the fair value of the net assets acquired and, correspondingly, the recognition of goodwill. The amount recorded for goodwill is consistent with the Company’s intentions for the acquisition.
The acquisition was accounted for as a business combination. The Company recorded the transaction based upon the fair value of the consideration paid. This consideration was allocated to the assets acquired and liabilities assumed at the acquisition date based on their fair values as follows (in thousands):
Cash | | $ | 149 | |
Accounts receivable | | | 452 | |
Property and equipment | | | 91 | |
Goodwill | | | 1,810 | |
Total assets acquired | | | 2,502 | |
Accrued liabilities | | | 2 | |
Total liabilities assumed | | | 2 | |
Net assets acquired | | $ | 2,500 | |
Qualitative factors that contributed to the recognition of goodwill include certain intangible assets that are not recognized as a separate identifiable intangible asset apart from goodwill and expected cost reduction synergies of approximately $0.8 million in annual cost savings. Intangible assets not recognized apart from goodwill consist primarily of the assembled workforce. The goodwill recognized is not deductible for income tax purposes. Acquisition related costs total $0.1 million and were expensed in other operating expenses in the audited consolidated statement of income for the year ended December 31, 2014.
The results of operations for CRMS from the acquisition date of April 15, 2014 are included in the consolidated income statements for the year ended December 31, 2014 and include revenue of $4.0 million and income before income taxes of $1.8 million. The following presents the unaudited pro forma revenues and income before income taxes of the combined entity had the CRMS Acquisition occurred on the first day of the period presented (in thousands):
| | | | | | Income before | |
| | Revenues | | | income taxes | |
Combined pro forma from January 1, 2013 – December 31, 2013 | | $ | 115,741 | | | $ | 2,802 | |
Combined pro forma from January 1, 2014 – December 31, 2014 | | $ | 132,968 | | | $ | 8,805 | |
F-13
Fair Value of Shares Issued
The Company determined the fair value of shares of restricted common stock of the Company issued in connection with the BHR Acquisition and the CRMS Acquisition to be $8.54 per share. Management analyzed a valuation report prepared by an independent third party with respect to the valuation of the Company taking into account the Private Share Exchange, the BHR Acquisition and the CRMS Acquisition. In particular, the valuation report analyzed the potential impact of the then-proposed Reorganization Transactions on the valuation of the Company, such as the increase in 2013 pro forma net income as a result of BHR results of operations being included for all of 2013. The valuation report also noted that the impact of the BHR Acquisition on the enterprise value would be mixed, as the additional EBITDA generated at the Company level due to recapture rents and cash and non-cash expenses was not sufficient to overcome the negative impact on enterprise value of BHR’s debt outstanding for the entire year. With respect to CRMS, the analysis determined that it would allow the recapture of additional EBITDA (on a pro forma basis for 2013) due to a combination of recapture revenues (commissions no longer paid) and the expected cost savings. In determining the fair value of the Company’s common stock, management also considered investor demand in the private placement of AAC common stock from February 2014 through April 2014 at $8.12 per share, the improved projected results of operations of the remainder of 2014 and the probability of an initial public offering in 2014. Based on the foregoing analysis, the Company determined the fair value of the Company’s common stock as of April 15, 2014 to be $8.54 per share.
Initial Public Offering and Short-Form Merger
On October 7, 2014, the Company completed an initial public offering (“IPO”) of 5,750,000 shares of our common stock at a public offering price of $15.00 per share, which included the exercise in full of the underwriters’ option to purchase an additional 250,000 shares from the Company and 500,000 shares from certain stockholders. Net proceeds to the Company from the IPO were approximately $68.8 million, after deducting underwriting discounts and offering costs.
On November 10, 2014, the Company completed a subsidiary short-form merger with AAC and a wholly-owned merger subsidiary whereby the legacy holders of AAC common stock who did not participate in the Private Share Exchange received 1.571119 shares of Holdings common stock for each share of AAC common stock owned at the effective time of the merger (for an aggregate of approximately 293,040 shares of Holdings common stock). Upon completion of the short-form merger, Holdings owned 100% of the outstanding shares AAC. The Private Share Exchange was accounted for similar to a common control transaction resulting in the assets, liabilities and equity of AAC being carried over at their historical bases. Shares of AAC common stock that were not exchanged remained in mezzanine equity or stockholders’ equity until the completion of the short-form merger in November 2014. The short-form merger was accounted for as an equity transaction in accordance with ASC 810, Consolidation.
4. Summary of Significant Accounting Policies
Use of Estimates
The preparation of consolidated financial statements in conformity with accounting principles generally accepted in the United States of America (“GAAP”) requires management to make estimates and assumptions that affect the reported amounts of assets, liabilities, revenues and expenses at the date and for the periods that the consolidated financial statements are prepared. On an ongoing basis, the Company evaluates its estimates, including those related to insurance adjustments, provisions for doubtful accounts, intangible assets, long-lived assets, deferred revenues and income taxes. The Company bases its estimates on historical experience and on various other assumptions that are believed to be reasonable under the circumstances. Actual results could materially differ from those estimates.
General and Administrative Costs
The majority of the Company’s expenses are “cost of revenue” items. Costs that could be classified as general and administrative expenses include the Company’s corporate overhead costs, which were $17.3 million, $28.1 million, and $25.3 million for the years ended December 31, 2012, 2013, and 2014, respectively.
Revenues
The Company provides services to its clients in both inpatient and outpatient treatment settings. Revenues are recognized when services are performed at estimated net realizable value from clients, third-party payors and others for services provided. The Company receives the vast majority of payments from commercial payors at out-of-network rates. Client service revenues are recorded at established billing rates less adjustments to estimate net realizable value. Adjustments are recorded to state client service revenues at the amount expected to be collected for the service provided based on historic adjustments for out-of-network services not under contract. Prior to admission, each client’s insurance is verified and the client self-pay amount is determined. The client self-pay portion is generally collected upon admission. In some instances, clients will pay out-of-pocket as services are provided or will make a
F-14
deposit and negotiate the remaining payments as part of the services. These out-of-pocket payments are included in accrued liabilities in the accompanying consolidated balance sheets and revenues related to these payments are deferred and recognized over the period services are provided. From time to time, scholarships may be provided to a limited number of clients. We do not recognize revenues for care provided via scholarships.
For the year ended December 31, 2012, approximately 16.5% of the Company’s revenues were reimbursed by Blue Cross Blue Shield of California and 11.3% were reimbursed by Aetna. No other payor accounted for more than 10% of revenue reimbursements for the year ended December 31, 2012.
For the year ended December 31, 2013, approximately 12.3% of the Company’s revenue reimbursements came from Blue Cross Blue Shield of California, 12.1% came from Aetna, and 10.3% came from United Behavioral Health. No other payor accounted for more than 10% of the Company’s revenue reimbursements for the year ended December 31, 2013.
For the year ended December 31, 2014, approximately 18.1% of the Company’s revenue reimbursements came from Anthem Blue Cross Blue Shield of Colorado, 13.3% came from Blue Cross Blue Shield of Texas, 12.9% came from Aetna, 10.5% came from Blue Cross Blue Shield of California, and 10.5% came from United Behavioral Health. No other payor accounted for more than 10% of the Company’s revenue reimbursements for the year ended December 31, 2014.
In cases where the demand for services exceeded capacity, the Company entered into contractual arrangements with other parties to provide services. Management evaluated and determined the Company was the principal party to the services provided. Revenues generated through the Company’s contractual arrangements are included in revenues at their expected realizable amount while the subcontracted service payments made are included in client related services. The need for these contractual arrangements decreased as the Company increased its bed capacity in the second half of 2012 and further decreased with the increased bed capacity in the first quarter of 2013 as a result of the opening of Desert Hope. None of the contractual arrangements were utilized during 2014.
Allowance for Contractual and Other Discounts
The Company derives the vast majority of its revenues from commercial payors at out-of-network rates. Management estimates the allowance for contractual and other discounts based on its historical collection experience. The services authorized and provided and related reimbursement are often subject to interpretation and negotiation that could result in payments that differ from the Company’s estimates.
Accounts Receivable and Allowance for Doubtful Accounts
Accounts receivable primarily consists of amounts due from third-party payors (non-governmental) and private pay clients and is recorded net of contractual discounts. The Company’s ability to collect outstanding receivables is critical to its results of operations and cash flows. Accounts receivable is reported net of an allowance for doubtful accounts, which is management’s best estimate of accounts receivable that could become uncollectible in the future. Accordingly, accounts receivable reported in the Company’s consolidated financial statements is recorded at the net amount expected to be received. The Company’s primary collection risks are (i) the risk of overestimating net revenues at the time of billing that may result in the Company receiving less than the recorded receivable, (ii) the risk of non-payment as a result of commercial insurance companies denying claims, (iii) the risk that clients will fail to remit insurance payments to the Company when the commercial insurance company pays out-of-network claims directly to the client, (iv) resource and capacity constraints that may prevent the Company from handling the volume of billing and collection issues in a timely manner, (v) the risk that clients do not pay the Company for their self-pay balance (including co-pays, deductibles and any portion of the claim not covered by insurance) and (vi) the risk of non-payment from uninsured clients. The Company’s allowance for doubtful accounts is based on historical experience, but management also takes into consideration the age of accounts, creditworthiness and current economic trends when evaluating the adequacy of the allowance for doubtful accounts. An account is written off only after the Company has pursued collection efforts or otherwise determines an account to be uncollectible.
At December 31, 2013, 19.5% of accounts receivable was from Blue Cross Blue Shield of California, 12.2% was from Anthem Blue Cross Blue Shield of Colorado and 10.9% was from United Behavioral Health. At December 31, 2014, 20.7% of accounts receivable was from Anthem Blue Cross Blue Shield of Colorado, 13.0% was from Blue Cross Blue Shield of California, and 10.6% was from Blue Cross Blue Shield of Texas. No other payor accounted for more than 10% of accounts receivable at December 31, 2013 or 2014.
F-15
A summary of activity in the Company’s allowance for doubtful accounts is as follows (in thousands):
| | | | | | Additions | | | | | | | | | |
| | | | | | charged to | | | | | | | | | |
| | Balance at | | | Provision for | | | Accounts | | | | | |
| | beginning of | | | Doubtful | | | written off, net | | | Balance at | |
Description | | year | | | Accounts | | | of recoveries | | | end of year | |
Allowance for doubtful accounts for the year ended: | | | | | | | | | | | | | | | | |
December 31, 2012 | | | 1,233 | | | | 3,344 | | | | (299 | ) | | | 4,278 | |
December 31, 2013 | | | 4,278 | | | | 10,950 | | | | (1,908 | ) | | | 13,320 | |
December 31, 2014 | | | 13,320 | | | | 11,391 | | | | (16,243 | ) | | | 8,468 | |
Cash and Cash Equivalents
The Company considers all highly liquid investments with maturities of three months or less when purchased to be cash equivalents.
Property and Equipment
Property and equipment are stated at cost or at acquisition date fair value for assets obtained in business combinations, net of accumulated depreciation and amortization. Expenditures for maintenance and repairs are charged to expense as incurred. The Company capitalizes interest on construction projects and such interest is included in the cost of the related asset. Assets held for development are classified as construction in progress and the Company does not depreciate these assets until they are placed in service. Leasehold improvements are amortized over their estimated useful lives or the remaining lease period, whichever is less. Assets under capital leases are amortized over the lease term or in the event of transfer of ownership at the end of the lease over the economic life of the leased asset. Amortization expense related to assets under capital lease is included with depreciation and amortization expense in the consolidated statements of income. Depreciation is calculated using the straight-line method over the estimated economic useful lives of the assets, as follows:
| | Range of Lives |
Computer software and equipment | | 3 years |
Buildings | | 36 years |
Furniture, fixtures and equipment | | 5 years |
Vehicles | | 5 years |
Equipment under capital lease | | 3-5 years |
Leasehold improvements | | Life of the asset or lease, |
| | whichever is less |
Goodwill and Intangible Assets
The Company has only one operating segment, substance abuse/behavioral healthcare treatment services, for segment reporting purposes. The substance abuse/behavioral healthcare treatment services operating segment represents one reporting unit for purposes of the Company’s goodwill impairment test. Goodwill represents the excess of the purchase price over the fair value of the identifiable net assets acquired. Goodwill and intangible assets with indefinite lives are not amortized, but instead tested for impairment at least annually or whenever events or changes in circumstances indicate the carrying value may not be recoverable. If the carrying value of goodwill exceeds its implied fair value, an impairment loss is recorded. The Company’s annual impairment tests of goodwill and other indefinite-lived intangibles in 2013 and 2014 resulted in no impairment charges. The Company has no intangible assets with indefinite useful lives other than goodwill.
The Company’s other intangible assets principally relate to trademarks and marketing intangibles and non-compete agreements. Trademarks and marketing intangibles are amortized over a period of ten years. Non-compete agreements are amortized over the five-year term of the agreements.
F-16
Long-Lived Asset Impairment
Long-lived assets are reviewed for impairment whenever events or changes in circumstances indicate the carrying amount of an asset may not be recoverable. Recoverability of assets to be held and used is measured by a comparison of the carrying amount of an asset to future net undiscounted cash flows expected to be generated by the asset. Impairment is measured by the amount by which the carrying value of the assets exceeds the fair value of the assets. The Company did not identify any indicators of impairment during the years ended December 31, 2013 and 2014.
Accrued Liabilities
The Company’s accrued liabilities, reflected as a current liability in the accompanying consolidated balance sheet, consist of the following (in thousands):
| | Year Ended December 31, | | |
| | 2013 | | | 2014 | | |
Accrued payroll liabilities | | $ | 4,685 | | | $ | 6,536 | | |
Accrued litigation settlement | | | 2,588 | | | | 158 | | |
Accrued legal fees | | | 706 | | | | 317 | | |
Income taxes payable | | | 53 | | | | — | | |
Accrued expenses – related party (a) | | | 33 | | | | — | | |
Other | | | 2,390 | | | | 3,400 | | |
Total accrued liabilities | | $ | 10,455 | | | $ | 10,411 | | |
(a) | Accrued expenses payable to the Company’s Chief Executive Officer. |
Segments
The focus of all Company operations is centered on a single service, substance abuse/behavioral healthcare treatment. As such, the Company has one operating segment. The Company is organized and operates as one reportable segment, comprised of various treatment facilities located in the United States. The treatment facilities operate in the same industry and have similar economic characteristics, services and clients. Management has the ability to direct and serve clients in any of these facilities, which allows management to operate the Company’s business and analyze its revenues on a system-wide basis rather than focusing on any individual facility. The Company’s chief operating decision maker evaluates performance and manages resources based on the results of the consolidated operations as a whole.
Advertising Expenses
Advertising costs are expensed as the related activity occurs.
Stock-Based Compensation
The Company accounts for stock-based compensation to employees and consultants using a fair-value based method for costs related to all share-based payments. Prior to the Company’s stock being traded in an active market, the Company estimated the fair value of employee restricted stock awards on the date of grant based on the appraised fair value. The fair value of the portion of the award that is ultimately expected to vest is recognized as expense on a straight-line basis over the requisite service periods in the Company’s consolidated statements of income.
Earnings Per Share
Basic and diluted earnings per common share are calculated based on the weighted-average number of shares outstanding in each period and dilutive stock options, non-vested shares and warrants, to the extent such securities have a dilutive effect on earnings per share using the treasury stock method. The two-class method determines earnings per share for each class of common stock and participating preferred stock and their respective participation rights in undistributed earnings. Effective with the elimination of the Series B Preferred Stock in the first quarter of 2013, the Company no longer has two classes of stock.
F-17
Income Taxes
The Company accounts for income taxes using the asset and liability method. Under the asset and liability method, deferred tax assets and liabilities are recognized for the future tax consequences attributable to differences between the financial statement carrying amounts of existing assets and liabilities and their respective tax bases. Deferred tax assets and liabilities are measured using enacted tax rates expected to apply to taxable income in the years in which those temporary differences are expected to be recovered or settled.
The effect on the deferred tax assets and liabilities of a change in tax rates is recognized in income in the period that includes the enactment date. A valuation allowance is provided for significant deferred tax assets when it is more likely than not that such assets will not be recovered.
The Company’s practice is to recognize interest and/or penalties related to uncertain income tax positions in income tax expense.
For the years ended December 31, 2012, 2013 and 2014, the Company had no accrued interest or penalties related to income tax matters in income tax expense.
VIEs included in the accompanying consolidated financial statements consist of various corporations and a partnership. As discussed in Note 3, the Company acquired BHR on April 15, 2014, prior to that date, BHR was a partnership for income tax purposes. Partnerships are characterized as flow through entities for federal and certain state income tax purposes, taxes for the VIEs that are considered partnerships are not recorded in the accompanying consolidated financial statements, except for certain state taxes imposed at the entity level. Taxes that are imposed on the owners of these partnerships are not included in the accompanying consolidated financial statements. Taxes attributable to BHR after the acquisition date are included in these consolidated financial statements.
Fair Value Measurements
Fair value, for financial reporting purposes, is defined as an exit price, representing the amount that would be received to sell an asset or paid to transfer a liability in an orderly transaction between market participants.
Disclosure is required about how fair value was determined for assets and liabilities and following a hierarchy for which these assets and liabilities must be grouped, based on significant levels of inputs as follows: Level 1—quoted prices in active markets for identical assets or liabilities; Level 2—quoted prices in active markets for similar assets and liabilities and inputs that are observable for the asset or liability; or Level 3—unobservable inputs for the asset or liability, such as discounted cash flow models or valuations. The determination of where assets and liabilities fall within this hierarchy is based upon the lowest level of input that is significant to the fair value measurement.
Comprehensive Income
As of December 31, 2012, 2013, and 2014, the Company did not have any components of other comprehensive income. As such, comprehensive income equaled net income for each of the periods presented in the accompanying consolidated statements of income.
Recent Pronouncements
In May 2014, the Financial Accounting Standards Board and the International Accounting Standards Board issued a final, converged, principles-based standard on revenue recognition. Companies across all industries will use a new five-step model to recognize revenue from customer contracts. The new standard, which replaces nearly all existing US GAAP and International Financial Reporting Standards revenue recognition guidance, will require significant management judgment in addition to changing the way many companies recognize revenue in their financial statements. The standard is effective for public entities for annual and interim periods beginning after December 15, 2016. Early adoption is not permitted under US GAAP. The Company is currently evaluating the impact that the adoption of this standard will have on its revenue recognition policies and procedures, financial position, result of operations, cash flows, financial disclosures and control framework.
F-18
5. Earnings Per Share
Earnings per share (“EPS”) was calculated using the two-class method required for participating securities in 2012 and 2013. Series B Preferred Stock was entitled to dividends at the rate equal to that of common stock. Undistributed earnings allocated to these participating securities are subtracted from net income in determining net income attributable to common stockholders. Net losses, if any, are not allocated to these participating securities.
Basic EPS is computed by dividing net income attributable to common stockholders by the weighted-average number of shares of common stock outstanding for the period. Common shares outstanding include both the common shares classified as mezzanine equity and those classified as equity.
For the calculation of diluted EPS, net income attributable to common stockholders for basic EPS is adjusted by the effect of dilutive securities, including awards under stock-based payment arrangements. Diluted EPS attributable to common stockholders is computed by dividing net income attributable to common stockholders by the weighted-average number of fully diluted common shares outstanding during the period.
The following tables reconcile the numerator and denominator used in the calculation of basic and diluted EPS for year ended December 31, 2012, 2013 and 2014 (in thousands except share and per share amounts):
| | Year Ended December 31, | |
| | 2012 | | | 2013 | | | 2014 | |
Numerator | | | | | | | | | | | | |
Net income attributable to AAC Holdings, Inc. | | $ | 1,504 | | | $ | 786 | | | $ | 7,548 | |
Plus: redemption of Series B Preferred Stock deemed contribution | | | — | | | | 1,000 | | | | — | |
Less: Series A Preferred Unit dividends | | | — | | | | — | | | | (693 | ) |
Net income available to common shares | | $ | 1,504 | | | $ | 1,786 | | | $ | 6,855 | |
Denominator | | | | | | | | | | | | |
Weighted-average shares outstanding – basic | | | 12,208,160 | | | | 13,855,797 | | | | 16,557,655 | |
Dilutive securities | | | 155,004 | | | | 436,140 | | | | 61,525 | |
Weighted-average shares outstanding – diluted | | | 12,363,164 | | | | 14,291,937 | | | | 16,619,180 | |
| | | | | | | | | | | | |
Basic earnings per share | | $ | 0.12 | | | $ | 0.13 | | | $ | 0.41 | |
Diluted earnings per share | | $ | 0.12 | | | $ | 0.12 | | | $ | 0.41 | |
The Company has included common stock that is classified as mezzanine equity in the denominator for basic and diluted EPS calculations.
6. Acquisitions
Acquisition of AJG Solutions, Inc. and B&B Holdings Intl LLC
On August 31, 2012, the Company acquired certain assets of AJG Solutions, Inc. (d/b/a Treatment Solutions Network) and its subsidiaries (collectively, ���AJG”) and the equity of B&B Holdings Intl LLC (“B&B”, and collectively with the acquisition of the AJG assets, the “TSN Acquisition”). AJG provides referral services for addiction rehabilitation services and centers and B&B provides addiction rehabilitation services through treatment facilities in Florida and a treatment facility in New Jersey (until its closure in June 2013). At the time of the TSN Acquisition, AJG and B&B were jointly owned by two individuals (the “TSN Sellers”), each of whom became employees of the Company following the acquisition. In connection with the TSN Acquisition, the Company issued 1,396,518 shares of common stock (1,040,791 unrestricted shares and 355,727 restricted shares (at a fair value of $3.99 per share as estimated by the Company’s management), valued collectively at $5.6 million; paid cash of $2.5 million from proceeds received from bank financing; and issued $6.5 million of subordinated seller notes to the TSN Sellers. The purchase agreement includes contingent provisions for a subsequent purchase price adjustment at the maturity of the seller debt financing to withhold at settlement up to $1.5 million in cash and the 355,727 restricted shares of common stock (with an aggregate value of $1.4 million at the time the TSN Acquisition closed) if certain operational performance metrics are not achieved during the three-year term of the seller note. The aggregate purchase price, including the fair value of the contingent consideration, was $14.6 million. The Company consummated the TSN Acquisition to expand the scope of the Company’s services geographically and gain synergies in obtaining leads for new clients.
F-19
The purchase price was based upon arms-length negotiations between the Company and the TSN Sellers that resulted in a premium to the fair value of the net assets acquired (including identifiable intangible assets) and, correspondingly, the recognition of goodwill. The amount recorded for goodwill is consistent with the Company’s intentions for the acquisition.
The acquisition was accounted for as a business combination. The Company recorded the transaction based upon the fair value of the consideration paid to the TSN Sellers. This consideration was allocated to the assets acquired and liabilities assumed at the acquisition date based on their fair values as follows (in thousands):
Accounts receivable | | $ | 5,408 | |
Prepaid expenses and other assets | | | 273 | |
Property and equipment | | | 379 | |
Goodwill | | | 8,536 | |
Intangible assets | | | 3,939 | |
Total Assets acquired | | | 18,535 | |
Accrued liabilities | | | 345 | |
Deferred tax liabilities | | | 3,599 | |
Total liabilities assumed | | | 3,944 | |
Net assets acquired | | $ | 14,591 | |
In connection with the TSN Acquisition, the Company entered into a license agreement with AJG. Under the license agreement, AJG granted the Company a royalty-free license to use certain trademarks and certain other intangible assets related to the operations acquired in the TSN Acquisition. The license had a three-year term, at the end of which period the licensed assets were to be assigned to the Company, subject to the satisfaction of certain conditions. In connection with the settlement of the Bevell Settlement, as described in Note 17, all licensed assets were assigned to the Company on August 15, 2014.
The goodwill and identifiable intangible assets recognized are not deductible for income tax purposes. Acquisition related costs total $0.1 million and were expensed in other operating expenses in the consolidated statement of income for the year ended December 31, 2012. There was no adjustment to the purchase price allocation in 2013 as the result of finalizing certain TSN Acquisition tax returns.
The following provides a breakdown of the identifiable intangible assets, valuation method applied in arriving at fair value, their assigned values and expected lives (in thousands, except years):
| | | | Assigned | | | Estimated | |
Intangible Asset | | Valuation Method | | Value | | | Life In Years | |
Non-compete agreements | | With and without method (1) | | $ | 1,257 | | | | 5 | |
Trademarks and marketing intangibles | | Relief from royalty (2) | | | 2,682 | | | | 10 | |
Total identified intangible assets | | | | $ | 3,939 | | | | | |
(1) | The with and without method estimates an intangible asset’s value based on the business value “with” the non-compete in place and “without” the non-compete in place. |
(2) | The relief from royalty method is an earnings approach that assesses the royalty savings the entity realizes as a result of owning the asset and not having to pay a third party a license fee for its use. |
Some of the more significant estimates and assumptions inherent in the estimate of the fair value of the identifiable acquired intangible assets include all those associated with forecasting cash flows and profitability. The primary assumptions used for the determination of the fair value of the purchased intangible assets were generally based upon the present value of anticipated cash flows discounted at rates generally ranging from 16.1% to 19.0%. Estimated years of future cash flows and earnings generally follow the range of estimated remaining useful lives for each intangible asset.
The results of operations for AJG and B&B from the acquisition date of August 31, 2012 are included in the consolidated statement of income for the year ended December 31, 2012, and include revenues of $11.0 million and income before income taxes of $5.8 million. The following presents the unaudited pro forma revenues and income before income taxes of the combined entity had the TSN Acquisition occurred on the first day of the period presented (in thousands):
F-20
| | | | | | Income before | |
| | Revenues | | | income taxes | |
Combined pro forma from January 1, 2012 – December 31, 2012 | | $ | 84,512 | | | $ | 6,288 | |
Consolidation of Concorde Real Estate, LLC
In December 2011, the Company entered into a purchase agreement to acquire a vacant facility located in Las Vegas, Nevada for a purchase price of $4.8 million in order to relocate and expand the Company’s current client service capacity. Pursuant to the purchase agreement, initial total deposits of $0.5 million were paid in 2011, an additional $0.8 million in cash was paid at closing in 2012 and the remaining $3.5 million was funded by seller financing. In January 2012, the Company assigned its rights to the purchase agreement to Concorde Real Estate, LLC (“Concorde Real Estate”). The Company’s CEO, President and CFO at that time collectively owned approximately 51% of the membership interests of Concorde Real Estate, with the remainder of the membership interests represented by holders of preferred membership interests. The Company was repaid the deposits by Concorde Real Estate at the closing in 2012.
On June 27, 2012, Concorde Real Estate refinanced the original seller financing with a note payable to a financial institution. In connection with this financing arrangement, the Company guaranteed the debt of Concorde Real Estate. Based on the Company’s guarantee of Concorde Real Estate’s debt and its ability to direct the activities that most significantly impact the economic performance of Concorde Real Estate, the Company has determined that Concorde Real Estate is a VIE and that the Company is the primary beneficiary. Accordingly, the Company began consolidating Concorde Real Estate as of June 27, 2012.
The Company, through a wholly owned subsidiary, Concorde Treatment Center, LLC (“Concorde Treatment”), entered into a triple net operating lease with Concorde Real Estate. The lease commenced on November 1, 2012 and has a term of six years with three options to renew the lease for five years each. Payments under the lease are $0.2 million per month for the first year and increase annually on January 1 based on the annual change in the Consumer Price Index. Because Concorde Real Estate is a consolidated VIE, the rental payments since June 27, 2012 between the Company and Concorde Real Estate are eliminated in the Company’s consolidated financial statements.
The initial consolidation of Concorde Real Estate was accounted for as a business combination. The Company recorded the amounts that are associated with Concorde Real Estate’s interests in the VIE based upon the fair values of the assets and liabilities as follows as of June 27, 2012 (in thousands):
Property and equipment, net | | $ | 7,720 | |
Other receivables | | | 40 | |
Total assets consolidated | | $ | 7,760 | |
Notes payable | | $ | 3,500 | |
Noncontrolling interest equity | | | 4,260 | |
Total liabilities and noncontrolling interest consolidated | | $ | 7,760 | |
On June 12, 2013, Concorde Real Estate redeemed all of the outstanding preferred membership interests for $3.0 million in cash. Concorde Real Estate made periodic distributions to its members from cash available for distribution.
On April 15, 2014, the Company acquired all of the outstanding common membership interests in Concorde Real Estate in connection with the BHR Acquisition as discussed in Note 3.
Consolidation of Behavioral Healthcare Realty, LLC
On October 8, 2013, the Company’s CEO, President and CFO formed Behavioral Healthcare Realty, LLC (“BHR”) and acquired all the membership interests in Concorde Real Estate (a VIE the Company has consolidated since June 27, 2012), and all the membership interests in Greenhouse Real Estate, LLC (“Greenhouse Real Estate”). Prior to being acquired by BHR, Greenhouse Real Estate was owned by the Company’s CEO, President and CFO.
Greenhouse Real Estate owns the real estate that is leased to one of the Company’s treatment facilities as discussed below. In connection with the formation of BHR, Greenhouse Real Estate obtained a $13.2 million credit facility from a bank that is guaranteed by the Company and its CEO and President. Based on the Company’s guarantee of BHR’s debt and its ability to direct the activities that most significantly impact the economic performance of BHR, the Company has determined that BHR is a VIE and that the Company is the primary beneficiary. Accordingly, the Company began consolidating BHR, which resulted in Greenhouse Real Estate being included in the Company’s consolidated financial statements, as of October 8, 2013.
F-21
In May 2013, the Company, through a wholly owned subsidiary, The Academy Real Estate, LLC (“Academy Real Estate”), acquired a property located in Riverview, Florida (just outside of Tampa, Florida) for a purchase price of $5.8 million. The Company was renovating this property and planned on converting it into a treatment facility. The Company funded the purchase price with $1.6 million from cash on hand and $3.6 million in proceeds from a new bank loan with an existing lender. In addition, a $0.6 million deposit was paid on behalf of the Company by Greenhouse Real Estate in March 2013 and was reimbursed to Greenhouse Real Estate by the Company in the third quarter of 2013. The Company spent $0.6 million on renovations from May 2013 through December 9, 2013 and capitalized $72,000 of interest related to this construction.
On December 10, 2013, the Company sold its membership interest in Academy Real Estate to BHR for $3.1 million plus the assumption of outstanding debt totaling $3.6 million which the Company has guaranteed. The Company received $0.8 million in cash and a promissory note receivable totaling $2.3 million. No gain or loss was recognized as a result of the transaction. Based on the Company’s guarantee of Academy Real Estate’s debt and its ability to direct the activities that most significantly impact the economic performance of Academy Real Estate, the Company has determined that it is a VIE and that the Company is the primary beneficiary. The assets and liabilities of Academy Real Estate and the results of its operations were consolidated on December 10, 2013, and thus the results of Academy Real Estate have been included in the consolidated financial statements since its acquisition in May 2013. The sale of Academy Real Estate to BHR and the consolidation of Academy Real Estate immediately after the sale had no effect on the Company’s cash flows after eliminating intercompany transactions.
BHR made periodic distributions to its members from cash available for distribution during the year ended December 31, 2012, 2013, and 2014 of $0.1 million, $0.8 million, and $0.9 million, respectively.
On April 15, 2014, the Company acquired all of the outstanding common membership interests in Concorde Real Estate in connection with the BHR Acquisition as discussed in Note 3.
Professional Groups
During 2013 and 2014, the Company managed five Professional Groups. These Professional Groups employ physicians that treat the Company’s clients and bill the payor for their services. The Company provides management and administrative services to the Professional Groups in return for a management fee. The Company also provided the initial working capital to each Professional Group and in return recorded a receivable from the Professional Groups and will continue to provide additional funding required for operating purposes. The Professional Groups were formed at various dates in 2012 and 2013. As of December 31, 2014, three of the five Professional Groups are owned by the Company’s CEO. The remaining Professional Groups are 100% owned by a physician who is employed by the Company. Based on the Company’s ability to direct the activities that most significantly impact the economic performance of the Professional Groups, provide necessary funding and the obligation and likelihood of absorbing all expected gains and losses, the Company has determined that each of the Professional Groups is a VIE and the Company is the primary beneficiary. Although the Company was the primary beneficiary of the Professional Groups from their respective dates of formation, the Company did not consolidate the Professional Groups until October 1, 2013 because the results of operations prior to that date were not material.
The initial consolidations of the assets and liabilities of Greenhouse Real Estate and the Professional Groups were accounted for as business combinations. The initial consolidation of Academy Real Estate was accounted for as an asset purchase as Academy Real Estate’s assets are held for development and Academy Real Estate does not have any operations. The Company recorded the amounts that are associated with Greenhouse Real Estate, the Professional Groups and Academy Real Estate interests in the VIEs based upon the fair values of the assets and liabilities on the respective dates of the transactions as follows (in thousands):
| | Greenhouse | | | | | | | | | | | | | |
| | Real Estate | | | Professional | | | Academy Real | | | | | |
| | as of | | | Groups as of | | | Estate as of | | �� | | | |
| | October 8, | | | October 1, | | | December 10, | | | | | |
| | 2013 | | | 2013 | | | 2013 | | | Total | |
Cash | | $ | 71 | | | $ | 139 | | | $ | — | | | $ | 210 | |
Accounts receivable | | | — | | | | 62 | | | | — | | | | 62 | |
Prepaids and other current assets | | | 218 | | | — | | | | — | | | | 218 | |
Property and equipment, net | | | 10,400 | | | — | | | | 6,708 | | | | 17,108 | |
Other assets | | | 19 | | | | — | | | | — | | | | 19 | |
Total assets consolidated | | | 10,708 | | | | 201 | | | | 6,708 | | | | 17,617 | |
Notes payable | | | 7,734 | | | | — | | | | 6,708 | | | | 14,442 | |
Accounts payable | | | 104 | | | | 51 | | | | — | | | | 155 | |
Noncontrolling interest equity | | | 2,870 | | | | 150 | | | | — | | | | 3,020 | |
Total liabilities and noncontrolling interest consolidated | | $ | 10,708 | | | $ | 201 | | | $ | 6,708 | | | $ | 17,617 | |
F-22
The results of operations for Concorde Real Estate from the consolidation date of June 27, 2012 are included in the consolidated statement of income for the year ended December 31, 2012 and include no revenues and loss before income taxes of $0.7 million. The results of operations for Greenhouse Real Estate from the consolidation date of October 8, 2013 are included in the consolidated statement of income for the year ended December 31, 2013 and include no revenues and loss before income taxes of $0.3 million. The results of operations for Academy Real Estate have been included in the consolidated statement of operations since the Company acquired the Riverview, Florida property in May 2013 and include no revenues or income before income taxes. The revenues of Concorde Real Estate and Greenhouse Real Estate consist of rental income from the Company and are eliminated in consolidation. The following table presents the unaudited pro forma revenues and income before income taxes had Concorde Real Estate Greenhouse Real Estate, Academy Real Estate and the Professional Groups been consolidated as of January 1, 2012 (in thousands):
| | | | | | Income before | |
| | Revenues | | | income taxes | |
Combined pro forma from January 1, 2012 – December 31, 2012 | | $ | 66,035 | | | $ | 2,393 | |
Combined pro forma from January 1, 2013 – December 31, 2013 | | | 115,712 | | | | 2,548 | |
7. Notes and Other Receivables – Related Party
The Company had a note receivable from the Company’s President which totaled $250,000 as of December 31, 2013. The note was non-interest bearing and there were no payment terms or a maturity date associated with this note. The outstanding balance was settled in full in April 2014 in connection with the BHR Acquisition. Further, during September 2014, the Company’s CEO and the Company’s President repaid receivables due to the Company’s totaling approximately $98,000 and $390,000, respectively. The Company did not have any notes receivables from related parties outstanding at December 31, 2014.
8. Property and Equipment, net
Property and equipment consisted of the following (in thousands):
| | December 31, | | | December 31, | |
| | 2013 | | | 2014 | |
Computer equipment and software | | $ | 2,267 | | | $ | 4,845 | |
Furniture and fixtures | | | 4,212 | | | | 4,535 | |
Vehicles | | | 835 | | | | 834 | |
Equipment under capital lease | | | 1,163 | | | | 1,777 | |
Leasehold improvements | | | 3,099 | | | | 3,538 | |
Construction in progress | | | 8,718 | | | | 19,410 | |
Building | | | 17,918 | | | | 19,733 | |
Land | | | 2,538 | | | | 2,538 | |
Total property and equipment | | | 40,750 | | | | 57,210 | |
Less accumulated depreciation and amortization | | | (3,742 | ) | | | (8,014 | ) |
| | $ | 37,008 | | | $ | 49,196 | |
Acquired Property
In May 2013, the Company acquired a vacant facility located in Riverview, Florida (just outside of Tampa, Florida) for a purchase price of $5.8 million. The Company funded the purchase price as follows: $1.6 million from cash on hand and $3.6 million proceeds from a new bank loan with an existing lender. In addition, a $0.6 million deposit was previously funded by the Company in March 2013.
9. Goodwill and Intangible Assets
The Company’s goodwill balance was $10.9 million and $12.7 million as of December 31, 2013 and December 31, 2014, respectively. The $1.8 million increase in goodwill relates to the CRMS Acquisition discussed in Note 3.
F-23
Balance at December 31, 2012 | | $ | 10,863 | |
2013 activity | | — | |
Balance at December 31, 2013 | | $ | 10,863 | |
CRMS Acquisition | | | 1,839 | |
Balance at December 31, 2014 | | $ | 12,702 | |
Other identifiable intangible assets and related accumulated amortization consisted of the following as of December 31, 2013 and December 31, 2014 (in thousands):
| | Gross Carrying Value | | | Accumulated Amortization | |
| | December 31, | | | December 31, | | | December 31, | | | December 31, | |
| | 2013 | | | 2014 | | | 2013 | | | 2014 | |
Trademarks and marketing intangibles | | $ | 2,682 | | | $ | 2,682 | | | $ | 358 | | | $ | 626 | |
Non-compete agreements | | | 1,257 | | | | 1,257 | | | | 335 | | | | 587 | |
Other | | | 271 | | | | 271 | | | | 21 | | | | 62 | |
| | $ | 4,210 | | | $ | 4,210 | | | $ | 714 | | | $ | 1,275 | |
Changes to the carrying value of identifiable intangible assets during the year ended December 31, 2014 were as follows (in thousands):
Balance at December 31, 2012 | | $ | 3,817 | |
Amortization expense | | | (541 | ) |
Other additions | | | 220 | |
Balance at December 31, 2013 | | $ | 3,496 | |
Amortization expense | | | (561 | ) |
Balance at December 31, 2014 | | $ | 2,935 | |
The weighted-average amortization periods of the acquired intangible assets are as follows:
| | Weighted - Average Amortization Period (in Years) |
Trademarks and marketing intangibles | | 10 |
Non-compete agreements | | 5 |
Other | | 10 |
At December 31, 2014, all intangible assets are amortized using a straight-line method. Amortization expense expected to be recognized during fiscal years subsequent to December 31, 2014 is as follows (in thousands):
Year ended December 31, | | | | |
2015 | | $ | 547 | |
2016 | | 547 | |
2017 | | 463 | |
2018 | | 295 | |
2019 | | 295 | |
Thereafter | | | 788 | |
Total | | $ | 2,935 | |
10. Notes Payable and Revolving Line of Credit
A summary of the Company’s debt obligations, net of unamortized discounts, is as follows (in thousands):
F-24
| | December 31, | | | December 31, | |
| | 2013 | | | 2014 | |
Non-related party debt: | | | | | | | | |
Revolving line of credit | | $ | 12,550 | | | $ | — | |
Real estate debt | | | 21,548 | | | | 24,590 | |
Acquisition-related debt | | | 1,500 | | | | — | |
Asset purchases | | | 1,203 | | | | 126 | |
Subordinated debt | | | 682 | | | | 708 | |
Capital lease obligations | | | 1,022 | | | | 1,243 | |
Total non-related party debt | | | 38,505 | | | | 26,667 | |
Less current portion | | | (15,164 | ) | | | (2,570 | ) |
Total non-related party debt, long-term | | $ | 23,341 | | | $ | 24,097 | |
Related party debt: | | | | | | | | |
Acquisition-related debt | | $ | 4,389 | | | $ | 1,787 | |
Subordinated debt | | | 181 | | | | 187 | |
Total related party debt | | | 4,570 | | | | 1,974 | |
Less current portion | | | (795 | ) | | | (1,787 | ) |
Total related party debt, long-term | | $ | 3,775 | | | $ | 187 | |
Credit Facility
In August 2011, the Company entered into a revolving line of credit (the “Revolving Line”) with a financial institution expiring on August 15, 2013. During the second quarter of 2013, the Revolving Line was amended to extend the maturity date to April 1, 2015 and to increase the maximum borrowing limit to the lesser of (i) $20 million or (ii) 70% of the Company’s eligible accounts receivable, subject to adjustment if the aggregate of all returns, rebates, discounts, credits and allowances for the immediately preceding three months is less than 15% of the Company’s gross revenues for such period. The amended Revolving Line bore interest at one-month LIBOR, as defined in the agreement, plus 2.5% per annum (2.75% as of December 31, 2013). Interest was payable monthly and is calculated on a 360 day year.
In August 2013, the Company amended the Revolving Line’s borrowing base to permit borrowings up to the lesser of (i) $20 million or (ii) 80% of the Company’s eligible accounts receivable at any time prior to February 1, 2014, and 70% of the Company’s eligible accounts receivable at any time on or after February 1, 2014, subject to adjustment if the aggregate of all returns, rebates, discounts, credits and allowances for the immediately preceding three months is less than 8% of the Company’s gross revenues for such period. The Revolving Line was secured by the Company’s accounts receivable, deposit accounts and other rights to payment, inventory, and equipment, and was guaranteed jointly and severally by all of the Company’s subsidiaries that have significant operations and/or assets and the Company’s CEO and President. The Revolving Line, as amended, required the Company to maintain a tangible net worth ratio not greater than 2.50 to 1.00, a fixed charge coverage ratio not less than 1.25 to 1.00, and net income of at least $1.00, all determined as of each quarter end. The Revolving Line limited capital expenditures to $0.1 million in each fiscal year unless approved by the financial institution, limited additional borrowing to $50,000 during the term of the agreement unless approved by the financial institution, limited operating lease expense to $0.1 million in each fiscal year and prohibited the payment of dividends in cash or stock. The Revolving Line also contained a cross-default clause linking a default under the Revolving Line to the occurrence of a default by the Company under any other debt agreement, material lease commitment, contract, instrument or obligation.
The Company was not in compliance with certain financial covenants contained in the Revolving Line as of December 31, 2013 and March 31, 2014. Additionally, the Company’s expenditures for capital expenditures, total operating leases and the incurring of additional indebtedness exceeded the limits specified in the Revolving Line for the year ended December 31, 2013.
These covenant violations created a cross-default with the Greenhouse Real Estate, Concorde Real Estate and Academy Real Estate debt agreements with the same lender, but for which the Company obtained waivers.
On April 15, 2014, the Revolving Line was amended and restated and included a waiver for the noncompliance of the financial covenants and negative covenants described in the preceding paragraphs.
On April 15, 2014, the Company entered into a Second Amended and Restated Credit Facility (the “2014 Credit Facility”) with Wells Fargo Bank, National Association (the “Agent”). The 2014 Credit Facility made available to the Company a $15.0 million revolving line of credit, subject to borrowing base limitations (the “Amended Revolving Line”), and amended and restated two
F-25
existing term loans in the outstanding principal amounts of $0.6 million (“Term Loan A”) and $1.5 million (“Term Loan B”). In June 2014, the Company repaid in full the $1.5 million outstanding balance of Term Loan B.
The Amended Revolving Line bore interest at one-month LIBOR, plus an applicable margin that was determined by the Company’s leverage ratio, as defined by the agreement, at the end of each quarter. A quarter-end leverage ratio of 4.75 to 1.00 or above resulted in an applicable margin of 3.00%, a ratio below 4.75 to 1.00 and equal to or above 4.00 to 1.00 results in an applicable margin of 2.75%, and a ratio below 4.00 to 1.00 results in an applicable margin of 2.50%. Term Loan A bore interest at LIBOR plus 3.15%. The borrowing base for the Amended Revolving Line was 70% of the Company’s eligible accounts receivable and was established with the understanding that the aggregate of all returns, rebates, discounts, credits and allowances, exclusive of the initial adjustment to record net revenues at the time of billing, for the immediately preceding three months will be less than 20% of gross revenues for such period (up from the previous restriction of 8%).
The amendment and restatement removed the previous covenants which required the Company to maintain a minimum tangible net worth ratio and minimum net income. The 2014 Credit Facility required the Company to achieve minimum net revenues and adjusted EBITDA for each quarter, determined on a rolling four quarters basis, of no less than 85% of net revenues and adjusted EBITDA for the immediately preceding four quarters. The 2014 Credit Facility generally defined adjusted EBITDA as consolidated net income plus (i) interest expense, (ii) depreciation and amortization expense, (iii) tax expense, (iv) non-cash stock compensation, (v) one-time legal and restructuring costs incurred in 2014 in connection with the Company’s private placement, the Reorganization Transactions (see Note 3), the BHR preferred equity transactions (see Note 3), and an IPO of the Company in an amount not to exceed $2.5 million, (vi) one-time legal, accounting and other transaction costs incurred in connection with a permitted acquisition in 2014 or in any subsequent fiscal year in an aggregate amount not to exceed $0.2 million in any fiscal year, (vii) one-time settlement costs paid on or about April 9, 2014, in connection with certain wage and settlement charges in California in an amount not to exceed $2.5 million, (viii) one-time restructuring costs incurred in 2013 in connection with the closing of the Leading Edge operations and the consolidation of call centers in an amount not to exceed $0.8 million, and (ix) to the extent approved by Wells Fargo Bank in writing, other one-time and non-recurring charges.
The 2014 Credit Facility also required the Company to achieve a fixed charge coverage ratio of not less than 1.25 to 1.00 for each quarter, determined on a rolling four quarter basis, and achieve a liquidity covenant (as described by the agreement) of no less than $9.0 million as of July 14, 2014. In connection with the June 2014 prepayment of Term Loan B, the parties to the Credit Facility agreed to permanently waive this liquidity covenant. Finally, the Credit Facility included a maximum leverage ratio covenant, whereby the ratio of funded debt to EBITDA must not be greater than the ratios set forth below on a rolling four quarter basis:
Fiscal Quarter End | | Maximum Leverage Ratio |
December 31, 2014 and thereafter | | 3.75:1.00 |
The 2014 Credit Facility limited aggregate capital expenditures (as defined by the agreement and which excluded, among other items, capital expenditures made by BHR and its subsidiaries that are funded with debt permitted under the agreement or proceeds the IPO and permitted acquisitions under the agreement) to $3.0 million in each fiscal year and limits capital lease debt and other purchase money debt to $2.3 million.
The 2014 Credit Facility also contained customary events of default including, but not limited to, failure to make payments under the Credit Facility, materially incorrect representations, breaches of covenants (subject to a 20 day cure period in the case of certain covenants), cross-default to any other material indebtedness, bankruptcy and insolvency events, change of control, and the failure of guarantees or security to remain in full force and effect.
The 2014 Credit Facility, as amended in June 2014, also provided for standby letters of credit in an aggregate undrawn amount not to exceed $3.0 million, and in July 2014, Wells Fargo issued on the Company’s behalf an irrevocable standby letter of credit in the amount of $700,000.
The outstanding balance under the Revolving Line was $12.6 million as of December 31, 2013. The Company used a portion of the net proceeds from the IPO received in October 2014 to repay in full the outstanding balance of the Revolving Line of $13.1 million on October 7, 2014.
On December 18, 2014, the Company terminated the 2014 Credit Facility, after having repaid the outstanding principal balance of $487,500 plus accrued interest. The 2014 Credit Agreement also included one outstanding term loan in the outstanding principal amount of $0.5 million. The Company did not incur any early termination penalties as a result of the early termination of the 2014 Credit Facility.
See further discussion of the new credit facility entered into on March 9, 2015 in Note 20.
F-26
Interest Rate Swap Agreements
In July 2014, the Company entered into two interest rate swap agreements to mitigate its exposure to fluctuations in interest rates. The interest rate swap agreements have initial notional amounts of $8.9 million and $13.2 million which fix interest rates over the life of the respective interest rate swap agreement at 4.12% and 4.62%, respectively. The notional amounts of the swap agreements represent amounts used to calculate the exchange of cash flows and are not the Company’s assets or liabilities. The interest payments under these agreements are settled on a net basis. The Company has not designated the interest rate swaps as cash flow hedges and, therefore, the changes in the fair value of the interest rate swaps are included within interest expense in the consolidated income statements.
At December 31, 2014, the fair value of the interest rate swaps was a liability of $0.4 million and is reflected in other accrued liabilities on the consolidated balance sheet. Refer to Note 16 for further discussion of fair value of the interest rate swap agreements. The Company’s credit risk related to these agreements is considered low because the swap agreements are with a creditworthy financial institution.
The following table sets forth our interest rate swap agreements (dollars in thousands):
| | Notional | | | Maturity | | Fair | |
| | Amount | | | Date | | Value | |
Pay-fixed interest rate swap | | $ | 8,882 | | | May 2018 | | $ | (105 | ) |
Pay-fixed interest rate swap | | | 13,168 | | | August 2019 | | | (326 | ) |
Total | | $ | 22,050 | | | | | $ | (431 | ) |
Real Estate Debt
In conjunction with the consolidation of Concorde Real Estate in 2012 and the remaining BHR VIEs that were consolidated in 2013, the Company’s real estate debt, totaled $21.6 million at December 31, 2013. As discussed in Note 3, on April 15, 2014, the Company acquired BHR and assumed a $1.8 million term loan, which was subsequently paid off in 2014 with proceeds from the Company’s initial public offering. The Company’s total real estate debt totaled $24.6 million at December 31, 2014. The terms of the debt are discussed below. As further discussed in Note 20, on March 9, 2015 the Company repaid in full all outstanding real estate debt.
Concorde Real Estate
In conjunction with the consolidation of Concorde Real Estate on June 27, 2012, the Company assumed a $3.5 million promissory note which was refinanced in July 2012 and replaced with loans totaling $7.4 million in two tranches to fund the renovation of the Desert Hope facility. The first tranche totaled $4.4 million and bore interest at 3.0% plus one-month LIBOR, with interest payable monthly, and required a lump sum principal payment in July 2013. The second tranche totaled $3.0 million, bore interest at 2.0% plus the lender’s prime rate (3.25% at December 31, 2012), with interest payable monthly, and required a lump sum principal payment in July 2013.
In May 2013, Concorde Real Estate refinanced these two outstanding loans with a $9.6 million note payable that matured on May 15, 2018. The additional debt in 2013 was used to redeem the preferred membership interests in Concorde Real Estate. The note required monthly principal payments of $53,228 plus interest and a balloon payment of $6.6 million due at maturity. Interest was calculated based on a 360 day year and accrued at the Company’s option of either (i) one-month LIBOR (as defined in the agreement) plus 2.5%, with such rate fixed until the next monthly reset date, or (ii) floating at one-month LIBOR (as defined in the agreement) plus 2.5%. In the event that the Company elected the floating option for either two consecutive periods or a total of three periods, the floating rate increased by 0.25%. The interest rate at December 31, 2013 and 2014 was 2.75% and 2.67%, respectively, and the amount outstanding at December 31, 2013 and 2014 was $9.3 million and $8.6 million, respectively.
The note was guaranteed by the Company and its CEO and President and was secured by a deed of trust and the assignment of certain leases and rents. The note contained financial covenants that require the Company to maintain a fixed charge coverage ratio of not less than 1.25 to 1.00. The note also contained a cross-default clause linking a default under the note to the occurrence of a default by any guarantor or an affiliate of a guarantor with respect to any other indebtedness.
F-27
Greenhouse Real Estate
Greenhouse Real Estate, LLC (the “Borrower”) entered into a $13.2 million construction loan facility (the “Construction Facility”) with a financial institution on October 8, 2013 to refinance existing debt related to a 70-bed facility and to fund the construction of an additional 60 beds at this facility located in Grand Prairie, Texas. Monthly draws may be made against the Construction Facility based on actual construction costs incurred.
Interest, which was payable monthly, was calculated based on a 360 day year and accrued at the Company’s option of either (i) one-month LIBOR (as defined in the agreement) plus 3.0%, with such rate fixed until the next monthly reset date, or (ii) floating at one-month LIBOR (as defined in the agreement) plus 3.0%. In the event that the Company elected the floating option for either two consecutive periods or a total of three periods, the floating rate increased by 0.25%. At December 31, 2013, the amount outstanding under the Construction Facility was $8.7 million and the interest rate was 3.25%.
At the Borrower’s option, the Construction Facility was convertible to a permanent term loan with an extended maturity of October 31, 2019 provided (i) there was no default, (ii) the construction was 100% complete, (iii) there was no material adverse change, as determined by the financial institution in its sole discretion, in the financial condition of the Borrower and (iv) other terms and conditions were satisfied. The maximum amount that may be converted was 65% of the appraised value at the time of the conversion. If at the time of the conversion the loan value exceeded the 65% loan-to-value ratio, the Borrower was permitted to make principal payments to reduce the loan-to-value to the 65% threshold. In the event the Borrower did not elect to or was unable to convert the Construction Facility to a permanent term loan, the Borrower was required to pay an exit fee equal to 3.0% of the then outstanding balance. Principal payments at the time of the conversion were to be calculated based on a 15-year amortization schedule, and monthly principal and interest payments are required with a balloon payment at maturity. Because the construction loan contained contingencies other than the completion of the construction, the Company classified the entire $8.7 million outstanding at December 31, 2013 as current.
The Construction Facility was secured by a deed of trust and the assignment of certain leases and rents and was guaranteed by the Company and the CEO and President of the Company. The Borrower was required to maintain a minimum debt service coverage ratio of 1.25 to 1.00. The note also contained a cross-default clause linking a default under the Greenhouse Real Estate loan to the occurrence of a default by any guarantor or an affiliate of a guarantor with respect to any other indebtedness.
In August 2014, the outstanding balance of the construction loan was converted to a $12.7 million permanent loan that matures in August 2019 and has an annual interest rate equal to the one-month libor plus 2.5%. The permanent loan required monthly principal payments of $70,778 plus interest and a balloon payment of $8.5 million at maturity. The outstanding balance at December 31, 2014 was $12.5 million and the interest rate was 2.67%.
Academy Real Estate
In May 2013, the Company, through Academy Real Estate, obtained a $3.6 million note payable from a financial institution to fund a portion of the acquisition of the property located in Riverview, Florida (just outside of Tampa, Florida). The note payable matured on November 10, 2013 and was renewed under identical terms. In connection with the Company’s sale to BHR of its membership interests of Academy Real Estate on December 10, 2013, BHR assumed the $3.6 million note payable. Interest, which was payable monthly, was calculated based on a 360 day year and accrued at the Company’s option of either (i) one-month LIBOR (as defined in the agreement) plus 3.0%, with such rate fixed until the next monthly reset date or (ii) floating at one-month LIBOR (as defined in the agreement) plus 3.0%. In the event that the Company elected the floating option for either two consecutive periods or a total of three periods, the floating rate increases by 0.25%. The interest rate at December 31, 2013 was 3.165%. In April 2014, the Company effected an amendment to the Academy Loan to extend the maturity date to July 14, 2019. Under the amended Academy Loan, the Company made monthly principal payments of $30,000 plus interest commencing in October 2014 and a balloon payment of remaining unpaid principal of $1.9 million at the maturity date. The agreement required the Company to maintain a minimum fixed charge coverage ratio of 1.25 to 1.00 and contains other restrictive financial covenants. The agreement also contained a cross-default clause linking a default under the Academy Real Estate note to the occurrence of a default by any guarantor or an affiliate of a guarantor with respect to any other indebtedness. The outstanding balance at December 31, 2014 was $3.5 million and the interest rate was 3.17%
At December 31, 2013 and 2014, the Company was in compliance with the financial covenants of the BHR debt. The instances of noncompliance under the Revolving Line created a cross-default with the Greenhouse Loan, the Concorde Loan and the Academy Loan. The Company obtained a waiver for the covenant defaults under the Revolving Line for 2012, and the amendment and restatement of our prior credit facility in April 2014 included a waiver for the noncompliance of the financial covenants and negative covenants that occurred under the Revolving Line in 2013 and the quarter ended March 31, 2014. The Company also obtained
F-28
waivers for the cross-defaults under the Construction Facility, the Concorde Real Estate note payable and the Academy Real Estate note payable.
Behavioral Healthcare Realty, LLC
As discussed in Note 3, the Company assumed a $1.7 million term loan in conjunction with the acquisition of BHR. The Company refinanced this loan with a financial institution and the new loan required monthly principal payments of $35,855 plus interest at 5.0% with a balloon payment of $1.4 million due at maturity in April 2015. The Company used a portion of the net proceeds from the IPO received in October 2014 to repay in full the outstanding balance of the term loan of $1.6 million on October 7, 2014.
Acquisition Related Debt
TSN Acquisition – Related Party
The Company financed a portion of the TSN Acquisition consummated on August 31, 2012 with the following sources of debt. The Company entered into a $6.2 million subordinated note payable with the TSN Sellers. Under the terms of the agreement, the note is separated into the following tranches: (i) $2.2 million paid in equal monthly principal installments over 36 months, bearing interest at 5% per annum, (ii) $2.5 million due on August 31, 2015 (the “Balloon Payment”), bearing interest at 3.125% per annum and (iii) a contingent balloon payment of up to $1.5 million due on August 31, 2015 (the “Contingent Payment”), bearing interest at 3.125% per annum. The Contingent Payment is contingent on the achievement of certain performance metrics over the term of the note. Due to the contingent nature of the Contingent Payment, a discount of approximately 13% was applied to the Contingent Payment to reflect the weighted-average probability the Contingent Payment would not be made. In April 2013, $0.5 million outstanding under the Balloon Payment was converted into 95,451 shares of the Company’s common stock at a conversion price of $5.24 per share. The Company estimates the fair value of the Contingent Payment each reporting period through an analysis of the TSN Sellers’ estimated achievement of the performance metrics specified in the agreement. Based upon this analysis, the Company determined a claw back of $0.5 million of the Contingent Payment exists at December 31, 2013 and, accordingly, adjusted the outstanding balance of the Balloon Payment to $3.0 million at that date. In addition to the claw back on the Contingent Payment, the Company has included a reduction of 118,576 shares of common stock in the computation of its earnings per share for the year ended December 31, 2013 to reflect the claw back of those shares based upon this analysis. As of December 31, 2013, the outstanding balance related to the seller subordinated notes payable was $4.3 million. As discussed in Note 17, on August 15, 2014, the Company entered into two settlement agreements with one of the TSN Sellers. Pursuant to the terms of the settlement agreements, the Company agreed to pay $7.6 million in exchange for full and final satisfaction of all obligations to the party. As a result, the Company repaid $0.2 million of the note payable, and $1.5 million of balloon payment. At December 31, 2013, the outstanding balance remaining seller subordinated notes payable was $1.8 million.
The Company also entered into a $0.6 million subordinated promissory note with one of the TSN Sellers that matured on March 1, 2013. At December 31, 2012, the outstanding balance was $0.3 million. The note bore interest at 3.125% per annum and required monthly principal and interest payments of $0.1 million. The note was fully repaid in March 2013.
TSN Acquisition – Non-Related Party
The Company also entered into an agreement with a financial institution to borrow $2.5 million to fund a portion of the TSN Acquisition that matured on July 1, 2014. The note bore interest, which was payable monthly, at 5.0% plus one-month LIBOR (5.25% at December 31, 2013) and required a lump sum payment on July 1, 2014. The agreement contained certain restrictive financial covenants, including a maximum ratio of total liabilities to tangible net worth. The Company prepaid $1.0 million in 2012, and repaid the loan in full on July 1, 2014. As of December 31, 2013 and 2014, the outstanding balance was $1.5 million and $0, respectively.
Other
In connection with an acquisition in 2011, the Company entered into separate notes payable with the former owners. Under the terms of the agreement, the notes bear interest at 12% per annum, with interest payable monthly. The notes mature in March 2015. As of December 31, 2013 and 2014, the outstanding balance was $50,000.
Asset Purchases
The Company has various notes payable with third-party creditors primarily for the purchase of vehicles, furniture, and office equipment. The notes have maturity dates ranging from March 2015 to November 2017, with terms ranging from 36 to 72 months and interest rates ranging from 0.0% to 12.3% per annum. Monthly payments range from $200 to $4,600. As of December 31, 2013 and 2014, aggregate balances on these notes were $0.5 million and $0.1 million, respectively.
F-29
In June 2013 the Company borrowed $0.8 million from an existing lender to fund the purchase of equipment. The note bears interest, which is payable monthly, at one-month LIBOR plus 3.15% (which was 3.4% at December 31, 2013) and requires monthly principal payments of $16,250 commencing June 15, 2013, with final installment of unpaid principal due on May 15, 2017. At December 31, 2013, the outstanding balance was $0.7 million. On December 18, 2014, in connection with termination of the 2014 Credit Facility, as previously discussed, the Company repaid the outstanding balance of this loan of $487,500, plus accrued interest.
Subordinated Debt Issued with Detachable Warrants (Related Party and Non-related Party)
In March and April 2012, the Company issued $1.0 million of subordinated promissory notes, of which $0.2 million was issued to a director of the Company. The notes bore interest at 12% per annum. The notes were scheduled to mature at various dates throughout 2015 and 2017. Interest was payable monthly and the principal amount was due, in full, on the applicable maturity date of the note. In connection with the issuance of these notes, the Company issued detachable warrants to the lenders to purchase a total of 112,658 shares of common stock at $0.64 per share. The warrants were exercisable at any time up to their expiration on March 31, 2022. The Company recorded a debt discount of $0.1 million related to the warrants which reduced the carrying value of the subordinated notes. As of December 31, 2013, the outstanding balance of the notes, net of the unamortized debt discount of $83,000, was $0.9 million, of which $0.2 million was owed to a director of the Company. As of December 31, 2014, the outstanding balance of the notes, net of the unamortized debt discount of $55,000, was $0.9 million, of which $0.2 million was owed to a director of the Company. On February 27, 2015, the Company repaid in full the $1.0 million of the outstanding subordinated promissory notes. The Company did not incur any early termination fees (see Note 20).
The Company calculated the fair value of warrants issued with the subordinated notes using the Black-Scholes valuation method. The following assumptions were used to value the warrants: a stock price of $1.36, an exercise price of $0.64, expected life of 10 years, expected volatility of 20%, risk free interest rates ranging from 2.1% to 4.0% and no expected dividend yield. In March 2014, warrants representing the right to purchase 106,728 shares of common stock were exercised and a total of 106,728 shares of common stock were issued to the exercising warrant holders, including 23,717 shares to a Company director.
Capital Lease
The Company has various capital lease arrangement with third-party vendors primarily for furniture, office equipment, and lab equipment. The leases have maturity dates ranging from December 2015 to March 2019, with terms ranging from 36 to 60 months and interest rates ranging from 4.47% to 6.25% per annum. Monthly payments range from $900 to $38,000. As of December 31, 2013 and 2014, aggregate balances under these capital leases were $1.0 million and $1.2 million, respectively.
A summary of future maturities of long-term debt, as of December 31, 2014, is as follows (in thousands):
Years ending December 31, | | Non-Related Party | | | Related Party | | | Capital Lease Obligations | | | Total | |
2015 | | $ | 2,102 | | | $ | 1,787 | | | $ | 520 | | | $ | 4,409 | |
2016 | | | 1,855 | | | — | | | | 427 | | | | 2,282 | |
2017 | | | 2,459 | | | | 200 | | | | 246 | | | | 2,905 | |
2018 | | | 7,916 | | | — | | | | 131 | | | | 8,047 | |
2019 | | | 11,134 | | | — | | | | 16 | | | | 11,150 | |
Thereafter | | — | | | — | | | — | | | | — | |
Total | | $ | 25,466 | | | $ | 1,987 | | | $ | 1,340 | | | $ | 28,793 | |
Unamortized discount | | | (42 | ) | | | (13 | ) | | — | | | | (55 | ) |
Amounts representing interest | | — | | | — | | | | (97 | ) | | | (97 | ) |
Total, net of unamortized discount and interest | | $ | 25,424 | | | $ | 1,974 | | | $ | 1,243 | | | $ | 28,641 | |
F-30
11. Mezzanine Equity
Share Imperfections
In 2008, preferred shares were issued by the previous board of directors of AAC prior to the timely filing of a Certificate of Designation with the Secretary of State of Nevada. Additionally in 2008, certain common shares were issued by the previous board of directors of AAC which were in excess of the number of shares duly authorized by AAC’s Articles of Incorporation. AAC has classified these preferred and common shares as mezzanine equity at the original purchase price in the audited consolidated balance sheets because they do not meet the definition of permanent equity as a result of these legal imperfections.
To address these issues, in April 2014, the Company conducted the Private Share Exchange with certain stockholders of AAC, whereby holders representing 93.6% of the outstanding shares of common stock of AAC, which were classified in both Mezzanine Equity and Stockholders’ Equity, exchanged their shares on a one-for-one basis for shares of the Company’s common stock. The Private Share Exchange was conditioned upon, among other things, a release by each exchanging stockholder of any and all potential claims arising from corporate actions that were not conducted in compliance with Nevada law.
Statement of Mezzanine Equity
Changes to mezzanine amounts were as follows (dollars in thousands). The Company did not have any activity occurring in the year ended December 31, 2012.
| | Noncontrolling Interest | | | American Addiction Centers, Inc. | |
| | BHR Series A Preferred | | | Series B Preferred | | | Common Shares | |
| | Units | | | Amount | | | Shares | | | Amount | | | Shares | | | Amount | |
Balance at December 31, 2012 | | | — | | | $ | — | | | | 10,000 | | | $ | 1,000 | | | | 11,708,801 | | | $ | 10,613 | |
Stock buy-back | | | | | | | | | | | (10,000 | ) | | | (1,000 | ) | | | (269,039 | ) | | | (171 | ) |
Issuance of preferred stock | | | 28 | | | | 1,400 | | | | — | | | | — | | | | — | | | | — | |
Balance at December 31, 2013 | | | 28 | | | | 1,400 | | | | — | | | | — | | | | 11,439,762 | | | | 10,442 | |
Issuance of BHR Series A Preferred Units | | | 9 | | | | 425 | | | | — | | | | — | | | | — | | | | — | |
Stock redemption | | | (37 | ) | | | (1,825 | ) | | | — | | | | — | | | | — | | | | — | |
Issuance of Series A Preferred Units to Alcentra | | | 160 | | | | 7,782 | | | | — | | | | — | | | | — | | | | — | |
Amortization of issuance costs | | | — | | | | 66 | | | | — | | | | — | | | | — | | | | — | |
Shares acquired by the Company | | | — | | | | — | | | | — | | | | — | | | | (11,439,762 | ) | | | (10,442 | ) |
Balance at December 31, 2014 | | | 160 | | | $ | 7,848 | | | | — | | | $ | — | | | | — | | | $ | — | |
In April 2013, the Company redeemed 269,039 common shares from the Company’s President at $5.24 per share, which the Company’s management estimated to be fair value, for an aggregate purchase price of $1.4 million. The redemption of these shares is reflected as a reduction to mezzanine equity at its carrying value, with the $1.3 million gain on the redemption of the shares reflected as a reduction in additional paid-in capital.
AAC Series B Preferred Stock
The Series B Preferred Stock (“Series B”) had no conversion or annual dividend rights; however, the Series B would participate in dividends in the same manner and amount of any dividend issued to common stockholders. The Series B had voting rights equal to 100 votes per share of Series B and voted together with common stockholders. The Series B had a liquidation value of $100 per share. As of December 31, 2012, the Company had 14,000 authorized shares of Series B. In the first quarter of 2013, the Company’s Board of Directors eliminated the Series B and all outstanding shares were repurchased for a de minimis amount.
BHR Series A Preferred
In October 2013, BHR amended its limited liability company agreement to permit the issuance of Series A Preferred Units. In the fourth quarter of 2013, BHR received proceeds of $1.4 million from the sale of 28 Series A Preferred Units valued at $50,000 per unit. An entity controlled by the spouse of one of the Company’s directors purchased $200,000 of the Series A Preferred Units. The unit holders were entitled to receive a 12% per annum preferred return on their initial investment, payable quarterly in arrears, had no equity appreciation ability and limited voting rights that were conditioned upon BHR’s default on the distribution of the 12% preferred return. The Series A Preferred Units contained certain embedded issuer call and holder put provisions. BHR had the option to call and redeem all or any portion of the Series A Preferred Units for $50,000 per unit plus any accrued and unpaid preferred return at any time after the twelfth month of issuance. The holders of the Series A Preferred Units had a put right during three periods discussed below,
F-31
that, if exercised, required BHR to redeem 100% of the issued and outstanding Series A Preferred Units by making a payment equal to $50,000 per unit plus the accrued but unpaid preferred return. The holder was able to exercise the put right on the 36th month, 48th month and 60th month following the date of issuance for a 30-day period. In the event of a sale of a property owned by BHR, the holders of the Series A Preferred Units were entitled to the repayment of their initial capital contribution plus any accrued and unpaid preferred return. The Company has classified the Series A Preferred Units as noncontrolling interest as a part of mezzanine equity because the potential redemption was not within the complete control of BHR until the last put option period has expired.
In January and February of 2014, BHR sold 8.5 units of Series A Preferred Units, valued at $50,000 per unit, with proceeds to BHR of $0.4 million, net of issuance costs of $11,300. A director of the Company purchased five Series A Preferred Units for $0.3 million at $50,000 per unit. After the sale, 36.5 Series A Preferred Units were outstanding totaling approximately $1.8 million. On April 15, 2014, BHR redeemed all 36.5 outstanding Series A Preferred Units for $1.8 million. These former holders of Series A Preferred Units used the proceeds to purchase 224,697 shares of AAC common stock at $8.12 per share as part of an exempt common stock offering. A director and relative of a director of the Company received approximately $450,000 and purchased 55,406 shares of AAC common stock in connection with the redemption of nine Series A Preferred Units.
On April 15, 2014, BHR sold 160 units of Series A Preferred Units, valued at $50,000 per unit, with proceeds to BHR of $7.8 million, net of issuance costs of $0.2 million. The issuance costs were being amortized over a 36 month period, the first date the holder could put the shares back to the Company. See Note 3 for a complete disclosure of the major components of this transaction and the related outstanding Series A Preferred Units. On February 25, 2015, the Company exercised its call provision and redeemed 100% of the outstanding Series A Preferred units for a total redemption price of approximately $8.6 million which included $0.2 million for the 3.0% call premium and $0.4 million for unpaid preferred returns.
12. Stockholders’ Equity
Common Stock
During 2013, the Company sold 1,424,124 shares of its common stock in an exempt offering at $5.24 per share, which the Company’s management estimated to be fair value. Included in the total shares issued were 715,883 shares sold to directors of the Company and 4,774 shares sold to each of the CFO, Chief Operating Officer (“COO”) and the Vice President of Marketing. The Company issued 1,338,809 of these shares in March 2013 and 85,315 in April 2013. Additionally, 286,353 shares were issued to the Company’s CEO upon conversion of $1.5 million in subordinated debt and 95,451 shares were issued to a Vice President of the Company upon conversion of $0.5 million under the balloon payment issued by the Company.
In connection with the exempt offering described above, a Company employee subscribed for 19,090 shares of common stock at $5.24 per share, which the Company’s management estimated to be fair value. As consideration for the shares, the employee issued to the Company a subscription note receivable in the amount of $0.1 million. The Company is forgiving this subscription note receivable over a 12-month period ending on July 1, 2014. During 2013 the Company recorded $42,000 in compensation expense and additional paid-in capital related to this forgiveness.
In April 2013, the Company redeemed 698,259 shares of common stock from one of the TSN Sellers at $5.24 per share, which the Company’s management estimated to be fair value, for an aggregate purchase price of $3.7 million.
In February and March 2014, AAC received proceeds of $4.2 million, net of $12,500 in issuance costs, from the sale of 516,625 shares of its common stock at $8.12 per share, which the Company’s management determined to be fair value, in an exempt common stock offering. Included within the total shares sold in the Company’s 2014 private placement were 61,563 shares sold to directors of the Company, 12,313 shares sold to the Company’s General Counsel and Secretary, 6,156 shares sold the Company’s COO and 3,078 shares sold to one of the Company’s Vice Presidents. The share price was based, in part, on an independent valuation analysis obtained in December 2013.
On April 11, 2014, AAC granted 77,765 shares of restricted common stock to its General Counsel and Secretary under the Company’s 2007 Stock Incentive Plan (the “Incentive Plan”), of which 38,883 shares vested immediately with the remaining 38,882 shares vesting on April 10, 2015. The fair value on the award date was $8.12 per share, as determined by the Company’s management. As a result of the award, AAC recorded $0.3 million of compensation expense, $0.2 million of additional compensation expense to satisfy the employee’s personal tax obligation related to the vesting of the grant during the second quarter of 2014, and $0.3 million ratably over the one-year vesting period. Additionally, on April 11, 2014, AAC granted 4,744 shares of its common stock to a non-executive employee. AAC recorded $39,000 of compensation expense and $30,000 of additional compensation expense to satisfy the employee’s personal tax obligation related to the stock grant during the second quarter of 2014.
F-32
On April 17, 2014, AAC redeemed a total of 14,318 shares of its common stock at $8.12 per share, which the Company’s management estimates to be fair value, for an aggregate redemption price of $0.1 million.
In connection with the issuance of subordinated notes in 2012, AAC issued detachable warrants to the lenders to purchase a total of 112,658 shares of common stock at $0.64 per share. The warrants were exercisable at any time up to their expiration on March 31, 2022. In March 2014, 106,728 of the outstanding warrants were exercised and a total of 106,728 shares of AAC common stock were issued to the exercising warrant holders, including 23,717 shares to a Company director. In April 2014, the remaining outstanding warrants for the purchase of 5,930 shares of AAC common stock were exercised.
In connection with the 2013 exempt offering of AAC common stock, a Company employee subscribed for 19,090 shares of common stock at $5.24 per share, which the Company’s management estimated to be fair value. As consideration for the shares, the employee issued to the Company a subscription note receivable in the amount of $0.1 million. The Company forgave this subscription note receivable over a 12-month period ending on July 1, 2014. During the year ended December 31, 2014, the Company recorded $58,000, respectively, in compensation expense related to this forgiveness.
Stock Split
On September 18, 2014, a 1.571119-for-1 stock split in the form of a stock dividend was effected. The common share and per share amounts included in the consolidated financial statements have been adjusted to reflect the stock split for all periods presented.
Initial Public Offering and Short-Form Merger
On October 7, 2014, the Company completed an initial public offering (“IPO”) of 5,750,000 shares of our common stock at a public offering price of $15.00 per share, which included the exercise in full of the underwriters’ option to purchase an additional 250,000 shares from the Company and 500,000 shares from certain stockholders. Net proceeds to the Company from the IPO were approximately $68.8 million, after deducting underwriting discounts and offering costs.
On November 10, 2014, the Company completed a subsidiary short-form merger with AAC and a wholly-owned merger subsidiary whereby the legacy holders of AAC common stock who did not participate in the Private Share Exchange received 1.571119 shares of Holdings common stock for each share of AAC common stock owned at the effective time of the merger (for an aggregate of approximately 293,040 shares of Holdings common stock). Upon completion of the short-form merger, Holdings owned 100% of the outstanding shares AAC. The short-form merger was accounted for as an equity transaction in accordance with ASC 810, Consolidation.
13. Stock Based Compensation Plans
The Company adopted the 2007 Stock Incentive Plan (“Incentive Plan”) in 2007. An aggregate of 3,927,798 shares of common stock are reserved for issuance pursuant to the Incentive Plan. The Incentive Plan is administered by the Board of Directors, which determines, subject to the provisions of the Incentive Plan, the employees, directors or consultants to whom incentives are awarded. The Board of Directors may award (i) “incentive stock options” within the meaning of Section 422 of the Internal Revenue Code of 1986, (ii) “non-qualified stock options” (options which do not meet the requirements of Section 422), (iii) shares of “restricted stock”, (iv) stock grants and (v) “stock bonuses.” Subject to the terms of the Incentive Plan, the Board of Directors may also determine the prices, expiration dates and other material features of any incentive award. As of December 31, 2013, no stock options had been granted under the Incentive Plan and no options were outstanding.
In December 2012, the Company awarded 267,337 shares of its common stock, at a fair market value of $5.24 per share, which the Company’s management estimated to be fair value, to the CFO of the Company. The Company issued these shares in March 2013. As a result of the award, the Company recorded $1.4 million of compensation expense and $1.0 million of additional compensation expense to satisfy the employee’s personal tax obligation related to the vesting of the grant during the year ended December 31, 2012. On December 31, 2012, the Company also awarded 133,668 of unvested common stock, at a fair market value of $5.24 per share, which the Company’s management estimated to be fair value, to this same executive. These shares vested ratably at the end of each quarter in 2013. During the year ended December 31, 2013, the Company recorded $0.7 million of compensation expense and $0.5 million of additional compensation expense to satisfy the employee’s tax obligation related to the vesting of the grant. Such expenses are included on the Company’s consolidated statements of income under the caption “salaries, wages and benefits.”
In determining the fair value of the Company’s common stock the Company reviewed an independent third party valuation report, which used a discounted cash flow method applying a discount rate of 17.6%. Other factors considered in the Company’s valuation
F-33
were the TSN Acquisition in August 2012, which provided an indication of a recent value established as a result of negotiation between sophisticated parties with substantial due diligence about both parties and a market transaction announced in November 2012 involving similar behavioral health companies.
In November 2013, the Company issued a total of 145,824 shares of restricted common stock to its COO, Vice President of Business Development and Vice President of Marketing under the Incentive Plan, of which 36,455 shares vested on December 31, 2013, and the remaining 109,369 shares vest ratably at the end of each of the first three quarters in 2014. The fair value on the award date was $6.49 per share, which the Company’s management estimated to be fair value. As a result of the award, the Company recorded $0.2 million and $0.7 million of compensation expense, and $0.1 million and $0.8 million of additional compensation expense to satisfy the employees’ personal tax obligations related to the vesting of the grant during 2013 and 2014, respectively. Such expenses are included on the Company’s consolidated statements of income under the caption “salaries, wages and benefits.”
The valuation of the Company’s common stock for the November 2013 stock awards was determined in accordance with the guidelines outlined in the American Institute of Certified Public Accounts Practice Aid, Calculation of Privately-Held Company Equity Securities Issues as Compensation. The Company engaged a third party valuation firm to construct a probability-weighted expected return model (“PWERM”) and to assist and advise management in determining the appropriate inputs and metrics to the model. Because there was no public market for the Company’s common stock, the board of directors, with input from management, exercised significant judgment and considered numerous objective and subjective factors to determine the fair value of the Company’s common stock as of the November 14, 2013, including the following factors:
| • | | previous third party valuations of the Company’s common stock; |
| • | | the price of the Company’s common stock sold to third-party investors; |
| • | | the value of the Company’s common stock issued in the TSN Acquisition in August 2012; |
| • | | a market transaction announced in November 2012 involving similar behavioral health companies; |
| • | | the valuation of a comparable public company; |
| • | | the Company’s operating and financial performance; |
| • | | current business conditions and projections; |
| • | | the Company’s stage of development; |
| • | | the likelihood of achieving a liquidity event for the shares of the Company’s common stock; such as an initial public offering or sale of the Company, given prevailing market conditions; and |
| • | | any adjustment necessary to recognize a lack of marketability for common stock. |
The Company used PWERM in determining the Company’s equity value for the November 2013 grant. PWERM is an analysis of future values of a company for several likely liquidity scenarios that may include a strategic sale or merger, an initial public offering or the dissolution of a company, as well as a company’s enterprise value assuming the absence of a liquidity event. For each possible future event, the future values of the company are estimated at certain points in time. This future value is then discounted to a present value using an appropriate risk-adjusted discount rate. Then, a probability is estimated for each possible event based on the facts and circumstances as of the valuation date. Using PWERM, the Company estimated the value of the Company’s common stock based upon an analysis of varying values for the Company’s common stock assuming (i) the completion of an initial public offering, (ii) a merger or acquisition and (iii) the continuation as a private company. The Company applied a percentage probability weighting to each of these scenarios based on the Company’s expectations of the likelihood of each event. Based on the foregoing PWERM analysis, the fair value of the November 19, 2013 grants of 145,824 shares of restricted common stock was determined to be $6.49 per share, as estimated by the Company’s management.
In March 2014, AAC granted 5,834 shares of fully vested common stock to each of its five non-employee directors. The Company recognized $0.2 million of compensation expense in the first quarter of 2014 as a result of these grants. The fair value on the award date was $8.12 per share, as estimated by the Company’s management.
On April 11, 2014, AAC granted a total of 82,509 shares of restricted common stock to two employees as discussed in Note 12.
On October 7, 2014, the Company granted a total of 158,000 shares of restricted common stock to employees as part of the Company’s 2014 Equity Incentive Plan.
F-34
The Company recognized $2.4 million, $1.2 million, and $3.1 million in equity-based compensation expense for the year ended December 31, 2012, 2013 and 2014, respectively. As of December 31, 2014, there was $3.2 million of unrecognized compensation expense related to unvested options and restricted stock, which is expected to be recognized over the remaining weighted average vesting period of 3.7 years.
A summary of share activity under the Incentive Plan is set forth below:
| | | | | | Weighted- | |
| | | | | | average Grant | |
| | Shares | | | Date Fair Value | |
Unvested at December 31, 2012 | | | 133,668 | | | $ | 5.24 | |
Granted | | | 145,824 | | | | 6.49 | |
Vested | | | (170,123 | ) | | | 5.51 | |
Unvested at December 31, 2013 | | | 109,369 | | | $ | 6.49 | |
Granted | | | 269,676 | | | | 15.72 | |
Vested | | | (182,163 | ) | | | 7.14 | |
Unvested at December 31, 2014 | | | 196,882 | | | $ | 18.53 | |
14. Restructuring Expenses
During the first half of 2013, the Company implemented restructuring plans to centralize its call centers and to close one of the facilities that was acquired in the TSN Acquisition. Restructuring and exit charges of $0.8 million were expensed in 2013 related to these restructuring activities.
Leading Edge, the New Jersey treatment facility that was acquired in the TSN Acquisition, was closed in June 2013. Management made the decision to exit the facility because the amenities and the service offerings at the facility were inconsistent with the Company’s long-term strategy. As a result of the facility closure, the Company recorded restructuring charges of $0.5 million, including payroll, severance and other employee related costs of $0.2 million and facility exit charges of $0.3 million during the year ended December 31, 2013.
Restructuring expenses related to centralizing the call centers totaled $0.3 million in 2013, which included $0.1 million related to payroll, severance and other employee related costs associated with a headcount reduction of 22 employees, employee relocation costs of $0.1 million and $0.1 million of facility exit costs (net of $0.1 million in sublease income). The facility exit costs relate to an ongoing lease obligation.
The following table summarizes the restructuring liability:
| | Payroll, Severance and Other Employee Related Costs | | | Relocation Costs | | | Facility Costs | | | Total | | |
Restructuring for Call Center and Leading Edge | | | | | | | | | | | | | | | | | |
January 1, 2013 Liability | | $ | — | | | $ | — | | | $ | — | | | $ | — | | |
Costs accrued | | | 274 | | | | 113 | | | | 419 | | | | 806 | | |
Cash payments | | | (274 | ) | | | (113 | ) | | | (140 | ) | | | (527 | ) | |
December 31, 2013 Liability | | | — | | | | — | | | | 279 | | | | 279 | | |
Payments | | | — | | | | — | | | | (266 | ) | | | (266 | ) | |
December 31, 2014 Liability | | $ | — | | | $ | — | | | $ | 13 | | | $ | 13 | | |
The remaining restructuring liability at December 31, 2013 was classified in the consolidated balance sheet as accrued liabilities of $0.1 million and other long-term liabilities of $0.2 million. During the year ended December 31, 2014, the Company made payments of $0.3 million. As a result, the remaining restructuring liability at December 31, 2014 was $13,000 and is classified in the consolidated balance sheet as accrued liabilities.
15. Income Taxes
Income tax expense consisted of the following for the years ended December 31, 2012, 2013 and 2014:
F-35
| | Year Ended December 31, | |
| | 2012 | | | 2013 | | | 2014 | |
Current | | | | | | | | | | | | |
Federal | | $ | 879 | | | $ | 1,587 | | | $ | 3,555 | |
State | | | 232 | | | | 528 | | | | 477 | |
Total current tax expense | | | 1,111 | | | | 2,115 | | | | 4,032 | |
Deferred: | | | | | | | | | | | | |
Federal | | | 5 | | | | (675 | ) | | | (1,214 | ) |
State | | | 32 | | | | (825 | ) | | | (263 | ) |
Total deferred tax expense | | | 37 | | | | (1,500 | ) | | | (1,477 | ) |
Total income taxes, net of federal tax benefit | | $ | 1,148 | | | $ | 615 | | | $ | 2,555 | |
The company’s effective income tax rate for the years ended December 31, 2012, 2013 and 2014 reconciles with the federal statutory rate as follows:
| | Year Ended December 31, | | |
| | 2012 | | | 2013 | | | 2014 | | |
Federal statutory rate | | | 35.0 | | % | | 35.0 | | % | | 35.0 | | % |
State income taxes, net of federal tax benefit | | | 6.7 | | | | 4.4 | | | | 2.2 | | |
Non-deductible expenses | | | 4.2 | | | | 8.1 | | | | 1.9 | | |
Benefit from tax deductible dividends | | | — | | | | — | | | | (2.9 | ) | |
Income taxed directly to flow-through owners of BHR | | | 6.8 | | | | (25.6 | ) | | | (3.2 | ) | |
Change in valuation allowance | | | — | | | | 4.1 | | | | (4.2 | ) | |
Uncertain tax positions | | | — | | | | 2.8 | | | | — | | |
Other differences | | | (1.6 | ) | | | 0.4 | | | | (0.2 | ) | |
Effective income tax rate on income before taxes | | | 51.1 | | % | | 29.2 | | % | | 28.6 | | % |
Deferred income tax assets (liabilities) are comprised of the following at December 31, 2013 and 2014:
| | Year Ended December 31, | |
| | 2013 | | | 2014 | |
Employee compensation | | $ | 540 | | | $ | 613 | |
Operating loss carryforwards | | | 1,211 | | | | 2,476 | |
Accrued litigation | | | 959 | | | | 58 | |
Other | | | 142 | | | | 109 | |
Valuation allowances | | | (989 | ) | | | (656 | ) |
Total deferred tax assets | | $ | 1,863 | | | $ | 2,600 | |
Property, equipment and amortization | | | (2,480 | ) | | | (2,387 | ) |
Accounts receivable | | | (1,036 | ) | | | (478 | ) |
Total deferred tax liabilities | | $ | (3,516 | ) | | $ | (2,865 | ) |
Net deferred tax liabilities | | $ | (1,653 | ) | | $ | (265 | ) |
The balance sheet classification of deferred tax assets (liabilities) at December 31, 2013 and 2014 was as follows:
| | Year Ended December 31, | |
| | 2013 | | | 2014 | |
Current | | $ | 676 | | | $ | 1,214 | |
Long-term | | | (2,329 | ) | | | (1,479 | ) |
Total | | $ | (1,653 | ) | | $ | (265 | ) |
During 2014, the Company’s valuation allowance decreased by $0.3 million to $0.7 million. The decrease is primarily attributable to the VIEs. Management has determined it is more likely than not the forecasted income will be sufficient to utilize the related NOLs before their expiration. The remaining $0.7 million of valuation allowance is related to state NOLs, which are limited due to apportionable income to certain jurisdictions.
F-36
The Company had $0.1 of uncertain tax positions as of December 31, 2013 and 2014. The Company's uncertain tax positions are related to tax years that remain subject to examination by the relevant taxing authorities. The Company may be subject to examination by the Internal Revenue Service ("IRS") for calendar years 2011 through 2014. Additionally, any net operating losses that were generated in prior years and utilized in these years may also be subject to examination by the IRS. Generally, for state purposes, the Company's 2010 through 2014 tax years remain open for examination by tax authorities. The Company has not been notified of any federal or state income tax examinations.
At December 31, 2014, the Company had approximately $2.6 million in federal net operating losses attributable to the VIEs which will expire between 2032 and 2034. In addition, the Company had $18.5 million in state net operating losses which expire between 2027 and 2034.
16. Fair Value of Financial Instruments
The carrying amounts reported at December 31, 2013 and 2014 for cash and cash equivalents, accounts receivable, prepaid expenses and other current assets, accounts payable and accrued liabilities approximate fair value because of the short-term maturity of these instruments and are categorized as Level 1 within the GAAP fair value hierarchy. The fair value of the Company’s revolving line of credit is categorized as Level 2. The carrying amount of the Company’s debt approximates fair value because interest rates approximate the current rates available to the Company.
The Company has debt with variable and fixed interest rates. The fair value of debt with fixed interest rates was determined using the quoted market prices of debt instruments with similar terms and maturities, which are considered Level 2 inputs. The fair value of debt with variable interest rates was also measured using Level 2 inputs, including good faith estimates of the market value for the particular debt instrument, which represent the amount an independent market participant would provide, based upon market observations and other factors relevant under the circumstances. The carrying value of such debt approximated its estimated fair value at December 31, 2013 and 2014.
The Company has entered into interest rate swap agreements to manage exposure to fluctuations in interest rates. Fair value of the interest rate swaps is determined using a pricing model based on published interest rates and other observable market data. The fair value was determined after considering the potential impact of collateralization, adjusted to reflect both our own nonperformance risk and the respective counterparty’s nonperformance risk. The fair value measurement of interest rate swaps utilizes Level 2 inputs. At December 31, 2014, the fair value of the interest rate swaps represented a liability of $0.4 million. Refer to Note 10 for further discussion of the interest rate swap agreements.
Intangible assets are measured at fair value on a nonrecurring basis. These assets are classified in Level 3 of the fair value hierarchy. Goodwill and other indefinite-lived intangibles are tested for impairment at least annually, or more frequently if circumstances indicate that the carrying amount exceeds fair value.
The Company estimates the fair values of goodwill and other indefinite-lived intangibles utilizing multiple measurement techniques. The estimation is primarily determined based on an estimate of future cash flows (income approach) discounted at a market derived weighted-average cost of capital. The income approach has been determined to be the most representative of fair value because the Company’s equity does not have an active trading market. Other unobservable inputs used in these valuations include management’s cash flow projections and estimated terminal growth rates. The valuation of indefinite-lived intangible assets also includes an unobservable input for royalty rate, which is based on rates used by comparable industries.
The useful lives of definite-lived intangible assets (customer relationships) are evaluated whenever events or circumstances warrant a revision to the remaining amortization period. The fair value of definite-lived intangible assets is based on estimated cash flows from the future use of the asset, discounted at a market derived weighted-average cost of capital.
No impairment charges were recorded related to goodwill or other intangible assets for the years ended December 31, 2012, 2013, and 2014.
Long-lived assets are measured at fair value on a nonrecurring basis and are classified in Level 3 of the fair value hierarchy. The fair value is estimated utilizing unobservable inputs, including appraisals on real estate as well as evaluations of the marketability and potential relocation of other assets in similar condition and similar market areas. The Company analyzes long-lived assets on an annual basis for any triggering events that would necessitate an impairment test. No impairment charges were recorded for the years ended December 31, 2012, 2013, and 2014.
F-37
17. Commitments and Contingencies
Operating Leases
The Company has entered into various operating leases expiring through October 2018. Commercial properties under operating leases primarily include space required to perform client services and space for administrative facilities. Rent expense was $3.6 million, $4.6 million and $2.1 million for the years ended December 31, 2012, 2013 and 2014, respectively. Included in such amounts were related party rent expenses totaling $1.2 million and $1.3 million for the years ended December 31, 2012 and 2013, respectively. With the consolidation of Greenhouse Real Estate, LLC as a variable interest entity in October 2013, after such date we no longer have lease expense to related parties.
The future minimum lease payments under non-cancelable operating leases with remaining terms of one or more years as of December 31, 2014 consisted of the following (in thousands):
Years ending December 31, | Annual Payment | |
2015 | $ | 788 | |
2016 | | 603 | |
2017 | | 191 | |
2018 | | 24 | |
2019 | | — | |
Thereafter | | — | |
Total | $ | 1,606 | |
Concorde Real Estate
As discussed in Note 6, the Company, through Concorde Treatment Center, leased property under a triple net operating lease with Concorde Real Estate. Lease payments commenced in August 2012 and these rental payments have been eliminated in consolidation.
Greenhouse Real Estate
The Company leased a treatment facility from Greenhouse Real Estate. Certain of the Company’s common stockholders and the Company’s CEO, President and CFO collectively owned approximately 55% of Greenhouse Real Estate until 2013, at which time the Company’s CEO, President and CFO acquired all the outstanding membership interests of Greenhouse Real Estate. The initial lease was for a period of five years and the Company had an option to extend the lease for an additional five years.
On October 1, 2012, the Company executed an amendment to the lease agreement to provide for an increase in the rent payable by the Company from $90,000 per month to $135,000 per month. The Company further amended the lease on October 1, 2013 to provide for an annual adjustment to the base rent on January 1, based upon the difference in the Consumer Price Index from the prior year. As discussed in Note 6, on October 8, 2012 Greenhouse Real Estate was acquired by BHR, a consolidated VIE of the Company. Rental expense under the lease for 2012 was $1.2 million and was $1.3 million for the period from January 1, 2013 through October 8, 2013. The Greenhouse Real Estate lease transactions have been eliminated in consolidation since October 8, 2013.
The Company recognizes rent expense on a straight line basis with the difference between rent expense and rent paid recorded as deferred rent. Such amount is included in accrued liabilities in the consolidated balance sheets.
Litigation
In April 2013, two wage and hour claims were filed against the Company in the State of California and were subsequently consolidated into a class action. In June 2013, the parties agreed to settle the substantive claims for $2.5 million during mediation. Once the settlement became probable, the Company established a $2.5 million reserve during the second quarter of 2013 for this matter. Subsequently, on April 9, 2014 and following court approval, the Company settled this matter with payment of $2.6 million. The total amount of the litigation settlement of $2.6 million was reflected in accrued liabilities at December 31, 2013.
Bevell Settlement
On February 3, 2014, AAC filed an action against James D. Bevell in the U.S. District Court in the Middle District of Tennessee, alleging breach of contract and tortious interference with business practices arising out of Mr. Bevell’s breach of his non-compete agreements. Mr. Bevell is the former Chief Innovation Officer of AAC. AAC’s complaint sought preliminary and permanent injunctive relief, declaratory judgment, compensatory damages, punitive damages for intentional, fraudulent, reckless or grossly negligent conduct, reasonable attorneys’ fees and costs and other legal, equitable or general relief for breach of contract and associated
F-38
wrongs. On March 5, 2014, the court granted a preliminary injunction enjoining Mr. Bevell and his officers, agents, servants, employees, attorneys and all persons in active concert or participation with him from violating the non-competition and non-solicitation provisions contained in his employment agreement with AAC and in the purchase agreement related to the TSN Acquisition.
On July 16, 2014, Mr. Bevell filed an action, for which an amended complaint was filed on August 15, 2014, in the Chancery Court for the State of Tennessee in Williamson County against Michael Cartwright, Jerrod Menz, AAC Holdings, Inc., Clinical Revenue Management Services, LLC, Tina Cartwright, Victoria Menz, Behavioral Healthcare Realty, LLC and AAC (the “State Litigation”). The amended complaint alleged the defendants breached fiduciary duties owed to Mr. Bevell and breached the Agreement Among Stockholders entered into in connection with the TSN Acquisition. Mr. Bevell’s amended complaint sought rescission of the Reorganization Transactions and compensatory and punitive damages.
On August 15, 2014, AAC, entered into two settlement agreements to resolve all outstanding disputes among the parties, consisting of a State Settlement Agreement (the “State Settlement”) to resolve the State Litigation claims and a Federal Settlement Agreement (the “Federal Settlement”) to resolve the Federal Litigation claims (collectively, the Federal Settlement and the State Settlement are referred to as the “Bevell Settlement”). Pursuant to the terms of the State Settlement, AAC agreed to pay to Mr. Bevell the sum of $7,555,425 in exchange for full and final satisfaction of all obligations to Mr. Bevell under the Bevell Note (as hereinafter defined), his Employment Agreement with AAC, the License Agreement (as hereinafter defined), the Agreement Among Stockholders and the State Litigation claims. Of this sum, AAC paid $255,425 upon execution of the State Settlement Agreement and the balance of $7.3 million was paid upon completion the initial public offering on October 7, 2014. In return for the State Settlement payment, Mr. Bevell agreed to dismiss the State Litigation and releases all claims he may have arising out of or related to the Bevell Note, his Employment Agreement with AAC, the License Agreement, the Agreement Among Stockholders, the State Litigation claims, his ownership of the shares of AAC, his services as an employee, director or officer of AAC, the Private Share Exchange or otherwise. On August 15, 2014, the parties also entered into an Agreement for Conveyance of Marks, Telephone Numbers, and Domain Names pursuant to which AJG Solutions, Inc. agreed to convey all intellectual property covered by the License Agreement to AAC in fee simple. Pursuant to the terms of the Federal Settlement, in exchange for full and final satisfaction of all obligations to Mr. Bevell under the TSN Acquisition purchase agreement, the Agreement Among Stockholders and the Federal Litigation claims, AAC agreed to dismiss the Federal Litigation, except that the permanent injunction sought by AAC against Mr. Bevell relating to breaches of the non-competition and non-solicitation provisions contained in his AAC employment agreement and the TSN Acquisition purchase agreement will remain in effect through August 31, 2015. In addition, pursuant to the terms of the Federal Settlement, Mr. Bevell surrendered all of his 698,259 shares of AAC common stock which were subsequently cancelled. Based on the terms of the settlement, the Company eliminated debt payable to Mr. Bevell of $1.9 million, and cancelled $5.7 million of shares of AAC common stock. There was no impact to consolidated statement of operations as a result of the Bevell settlement.
Horizon Blue Cross Blue Shield of New Jersey v. Avee Laboratories et al.
On September 4, 2013, Horizon Blue Cross Blue Shield of New Jersey (“Horizon”) filed an amended complaint in the Superior Court of New Jersey against several defendants, including Leading Edge Recovery Center, LLC, one of the Company’s subsidiaries. Leading Edge Recovery Center, LLC formerly operated a drug and alcohol treatment facility in New Jersey. Horizon alleges the defendants submitted and caused others to submit unnecessary drug tests in violation of New Jersey law and is seeking recovery for monetary and treble damages. The Company is vigorously defending these claims and believes them to be without merit. The Company cannot provide any assurance that it will prevail in this matter, nor can it reasonably estimate its potential liability if there is an adverse outcome.
Other
The Company is aware of various other legal matters arising in the ordinary course of business. To cover these types of claims, the Company maintains insurance it believes to be sufficient for its operations, although, some claims may potentially exceed the scope of coverage in effect. Plaintiffs in these matters may request punitive or other damages that may not be covered by insurance. After taking into consideration the evaluation of such matters by the Company’s legal counsel, the Company’s management believes the outcome of these matters will not have a material impact on the Company’s consolidated financial position, results of operations and cash flows.
401(k) Plan
The Company has a qualified 401(k) savings plan (the “Plan”) which provides for eligible employees (as defined) to make voluntary contributions to the Plan. The Company makes contributions to the Plan based upon the participants’ level of participation, which is fully vested at the time of contribution. For the year ended December 31, 2013 and 2014, the Company contributions under this Plan were $0.2 million.
F-39
18. Related Parties
In addition to the related party transactions discussed elsewhere in the notes to the consolidated financial statements, the consolidated financial statements include the following related party transactions. The Company has at times received advances from or made advances to current significant stockholders. These amounts have been included in the consolidated balance sheets and notated as “related party accounts” (see Notes 3, 7 and 10).
During 2013, the Company outsourced its medical billing and collection process to Clinical Revenue Management Services, LLC (“CRMS”). The two owners and officers of CRMS at that time were the spouses of the CEO and President of the Company. Pursuant to a written service agreement, CRMS was paid (i) the greater of $0.1 million per month or 5.0% of the monthly collected revenues and (ii) 7.0% of the Professional Groups collected revenues. The service agreement included a one year term with automatic renewals unless one party terminates the agreement with 90 days’ notice. Total amounts paid to CRMS under the service agreement during the years ended December 31, 2012 and 2013 were $0.6 million and $2.8 million, respectively. The Company recognized expense of $0.6 million in 2012 and $3.4 million in 2013 associated with this service agreement. Amounts included in accounts payable at December 31, 2013 were $0.6 million. The Company leased office space and furniture to CRMS under a month to month arrangement in 2013, and total rental income recognized in 2013 was $0.1 million. During 2013, CRMS occupied space in the Company’s building but no rents were charged by the Company. The Company classifies these sublease proceeds as an offset to rentals and leases in the consolidated statements of income. As discussed in Note 3, the Company acquired CRMS on April 15, 2014. Total amounts paid to CRMS from January 1, 2014 to the date of acquisition under the service agreement were $0.1 million. During this period, the Company recognized expense of $0.1 million. The results of operations for CRMS from the acquisition date are included in the consolidated income statements for the year ended December 31, 2014.
The Company is a party to certain placement agreements with Vaco, LLC (“Vaco”). One of the Company’s directors, who is also a stockholder, is an executive officer and an equity owner of Vaco. Vaco provides the Company with accounting professionals and other staff, either on a temporary or permanent basis. Vaco is typically paid 25% of each employee’s first year salary as a placement fee or paid an hourly rate for temporary professional services. Total payments and expense recognized related to this agreement were $0.1 million for each of the years ended December 31, 2012 and 2013, and $0.3 million for the year ended December 31, 2014.
From March 2013 through April 2013, the Company issued 1,423,574 shares of common stock, at a price of $5.24 per share, which the Company’s management estimated to be fair value, to certain accredited investors, for an aggregate offering price of $7.5 million. In addition, as part of the 2013 offerings, an employee of the Company subscribed for 19,090 shares of common stock at $5.24 per share. As consideration for the shares, the employee issued the Company a subscription note receivable in the amount of $0.1 million. The Company forgave this subscription note receivable over a 12-month period.
19. Quarterly Information (Unaudited)
The tables below present summarized unaudited quarterly results of operations for the years ended December 31, 2013 and 2014. Management believes that all necessary adjustments have been included in the amounts stated below for a fair presentation of the results of operations for the periods presented when read in conjunction with the Company’s consolidated financial statements for the years ended December 31, 2013 and 2014. Results of operations for a particular quarter are not necessarily indicative of results of operations for an annual period and are not predictive of future periods.
F-40
| | Quarter Ended | |
| | March 31, | | | June 30, | | | September 30, | | | December 31, | |
| | (In thousands except per share amounts) | |
2013 : | | | | | | | | | | | | | | | | |
Revenue | | $ | 29,004 | | | $ | 30,327 | | | $ | 28,350 | | | $ | 28,060 | |
Net income | | $ | 2,126 | | | $ | (145 | ) | | $ | 1,479 | | | $ | (1,968 | ) |
Net income available to AAC Holdings, Inc. common stockholders | | $ | 3,093 | | | $ | (455 | ) | | $ | 1,093 | | | $ | (1,945 | ) |
Basic net income per share | | $ | 0.23 | | | $ | (0.03 | ) | | $ | 0.08 | | | $ | (0.14 | ) |
Diluted net income per share | | $ | 0.23 | | | $ | (0.03 | ) | | $ | 0.08 | | | $ | (0.14 | ) |
| | | | | | | | | | | | | | | | |
2014: | | | | | | | | | | | | | | | | |
Revenue | | $ | 30,083 | | | $ | 29,120 | | | $ | 36,599 | | | $ | 37,166 | |
Net income | | $ | 841 | | | $ | 227 | | | $ | 2,025 | | | $ | 3,273 | |
Net income available to AAC Holdings, Inc. common stockholders | | $ | 1,019 | | | $ | 514 | | | $ | 2,213 | | | $ | 3,109 | |
Basic net income per share | | $ | 0.07 | | | $ | 0.03 | | | $ | 0.14 | | | $ | 0.15 | |
Diluted net income per share | | $ | 0.07 | | | $ | 0.03 | | | $ | 0.14 | | | $ | 0.15 | |
| | | | | | | | | | | | | | | | |
20. Subsequent Events
On January 6, 2015, the Company entered into an Office Space Lease (the “Lease Agreement”) for a new corporate headquarters and call center of approximately 102,000 square feet of office space located at 200 Powell Place, Brentwood, Tennessee, 37027. The initial term of the Lease Agreement will be for ten years from the date the premises are delivered to the Company, with an option to extend the Lease Agreement for five years. Base rent under the Lease Agreement is expected to be approximately $195,473 per month in the first year, subject to certain fixed increases over the course of the term as set forth in the Lease Agreement.
On January 8, 2015, the Company’s new substance abuse outpatient center in Las Vegas, Nevada, received licensure for intensive outpatient treatment services and has begun treating clients at the facility.
On January 23, 2015, the Company signed a definitive agreement to acquire Clinical Services of Rhode Island, Inc. (“CSRI”), a provider of intensive outpatient substance abuse treatment services, for $665,000 in cash and approximately $1,335,000 in restricted shares of AAC Holdings’ common stock. The acquisition is subject to certain closing conditions such as the assignment of certain contracts and the receipt of certain licenses necessary to operate the business, and the Company currently anticipates closing the acquisition during the second quarter of 2015.
On January 1, 2015, the Company increased capacity at its Forterus Facility in Temecula, California with the addition of 31 beds, including 24 detox beds.
On January 28, 2015, the Company entered into a purchase and sale agreement for the acquisition of an 84-bed hospital in Aliso Viejo, California for an aggregate of $13.5 million in cash. The closing is expected to occur during the second quarter of 2015 and is subject to certain closing conditions, including the amendment or removal of certain use restrictions on the property.
On February 20, 2015, the Company completed the acquisition of the assets of Recovery First, a Florida-based provider of substance abuse treatment and rehabilitation services, including a 56-bed inpatient substance abuse treatment facility in the greater Fort Lauderdale, Florida area, for cash consideration of $13.0 million.
On February 24, 2015, the Company completed the purchase of a property in Ringwood, New Jersey for an aggregate of $6.5 million in cash that it expects to develop into an inpatient facility with approximately 150 beds. The Company expects to invest approximately $16 million for renovations and construction.
On February 25, 2015, the Company exercised its call provision and redeemed 100% of the outstanding Series A Preferred units for a total redemption price of approximately $8.6 million which included $0.2 million for the 3.0% call premium and $0.4 million for unpaid preferred returns.
F-41
On February 27, 2015, the Company repaid in full the $1.0 million of the outstanding subordinated promissory notes. The Company did not incur any early termination fees.
On March 9, 2015, the Company entered into a five year $125 million Senior Secured Credit Facility (the “2015 Credit Facility”) by and among the Company and Bank of America, N.A., as administrative agent for the lenders party thereto. The 2015 Credit Facility consists of a $50.0 million revolver and a $75.0 million term loan. The Company will use the proceeds to re-pay certain existing indebtedness, fund acquisitions and de novo treatment facilities and for general corporate purposes. The 2015 Credit Facility also has an accordion feature that allows the total borrowing capacity to be increased up to $200 million, subject to certain conditions, including obtaining additional commitments from lenders.
The 2015 Credit Facility requires quarterly term loan principal repayments for the outstanding term loan of $0.9 million for September 30, 2015 to December 31, 2016, $1.4 million for March 31, 2017 to December 31, 2017, $2.3 million from March 31, 2018 to December 31, 2018, and $2.8 million from March 31, 2019 to December 31, 2019, with the remaining principal balance of the term loan due on the maturity date of March 9, 2020. Repayment of the revolving loan is due on the maturity date of March 9, 2020. The 2015 Credit Facility generally requires quarterly interest payments.
Borrowings under the 2015 Credit Agreement are guaranteed by the Company and each of its subsidiaries and are secured by a lien on substantially all of the Company’s and its subsidiaries’ assets. Borrowings under the 2015 Credit Agreement bear interest at a rate tied to the Company’s Consolidated Total Leverage Ratio (defined as Consolidated Funded Indebtedness to Consolidated EBITDA, in each case as defined in the 2015 Credit Agreement). Eurodollar Rate Loans with respect to the 2015 Credit Facility bear interest at the Applicable Rate plus the Eurodollar Rate (as defined in the 2015 Credit Agreement) (based upon the LIBOR Rate (as defined in the 2015 Credit Agreement) prior to commencement of the interest rate period). Base Rate Loans with respect to the 2015 Credit Facility bear interest at the Applicable Rate plus the highest of (i) the federal funds rate plus 0.50%, (ii) the prime rate and (iii) the Eurodollar Rate plus 1.0%. In addition, the Company is required to pay a commitment fee on undrawn amounts under the revolving credit facility of 0.35% to 0.50% depending on the Company’s Consolidated Total Leverage Ratio. The Applicable Rates and the unused commitment fees of the 2015 Credit Facility are based upon the following tiers:
Pricing Tier | | Consolidated Total Leverage Ratio | | Eurodollar Rate Loans | | | Base Rate Loans | | | Commitment Fee | |
1 | | > 3.50:1.00 | | | 3.25 | % | | | 2.25 | % | | | 0.50 | % |
2 | | > 3.00:1.00 but < 3.50:1.00 | | | 3.00 | % | | | 2.00 | % | | | 0.45 | % |
3 | | > 2.50:1.00 but < 3.00:1.00 | | | 2.75 | % | | | 1.75 | % | | | 0.40 | % |
4 | | > 2.00:1.00 but < 2.50:1.00 | | | 2.50 | % | | | 1.50 | % | | | 0.35 | % |
5 | | < 2.00:1.00 | | | 2.25 | % | | | 1.25 | % | | | 0.35 | % |
The 2015 Credit Agreement requires the Company to comply with customary affirmative, negative and financial covenants, including a Consolidated Fixed Charge Coverage Ratio, Consolidated Total Leverage Ratio and a Consolidated Senior Secured Leverage Ratio (in each case defined in the 2015 Credit Agreement). We may be required to pay all of our indebtedness immediately if we default on any of the numerous financial or other restrictive covenants contained in the 2015 Credit Agreement. The financial covenants include maintenance of the following:
· | Fixed Charge Coverage Ratio may not be less than 1.50:1.00 as of the end of any fiscal quarter. |
· | Consolidated Total Leverage Ratio: may not be greater than the following levels as of the end of each fiscal quarter: |
Measurement Period Ending | | Maximum Consolidated Total Leverage Ratio |
March 31, 2015 | | 4.50:1.00 |
June 30, 2015 | | 4.50:1.00 |
September 30, 2015 | | 4.50:1.00 |
December 31, 2015 | | 4.50:1.00 |
March 31, 2016 | | 4.50:1.00 |
June 30, 2016 | | 4.25:1.00 |
September 30, 2016 | | 4.25:1.00 |
December 31, 2016 | | 4.25:1.00 |
March 31, 2017 and each fiscal quarter thereafter | | 4.00:1.00 |
· | Consolidated Senior Secured Leverage Ratio may not be greater than the following levels as of the end of fiscal quarter: |
F-42
Measurement Period Ending | | Maximum Consolidated Senior Secured Leverage Ratio |
March 31, 2015 | | 4.00:1.00 |
June 30, 2015 | | 4.00:1.00 |
September 30, 2015 | | 4.00:1.00 |
December 31, 2015 | | 4.00:1.00 |
March 31, 2016 | | 4.00:1.00 |
June 30, 2016 | | 3.75:1.00 |
September 30, 2016 | | 3.75:1.00 |
December 31, 2016 | | 3.75:1.00 |
March 31, 2017 and each fiscal quarter thereafter | | 3.50:1.00 |
The Company used approximately $24.9 million of the proceeds from the $75 million term loans to repay in full the outstanding real estate debt, certain equipment notes and certain capital leases. The Company did not incur any significant early termination fees. Subsequent the closing of the 2015 Credit Facility on March 9, 2015, the Company’s total outstanding indebtedness, including capital leases, was approximately $77.4 million.
F-43
SIGNATURES
Pursuant to the requirements of Section 13 or 15(d) of the Securities Exchange Act of 1934, the Registrant has duly caused this report to be signed on its behalf by the undersigned, thereunto duly authorized.
AAC Holdings, Inc. |
| |
By: | | /s/ Michael T. Cartwright |
| | Michael T. Cartwright |
| | Chief Executive Officer and Chairman |
Dated: March 10, 2015
Pursuant to the requirements of the Securities Exchange Act of 1934, this report has been signed below by the following persons on behalf of the registrant and in the capacities and on the dates indicated.
Signature | | Title | | Date |
| | |
/s/ Michael T. Cartwright | | Chief Executive Officer and Chairman | | March 10, 2015 |
Michael T. Cartwright | | (Principal Executive Officer) | | |
| | |
/s/ Kirk R. Manz | | Chief Financial Officer | | March 10, 2015 |
Kirk R. Manz | | (Principal Financial Officer) | | |
| | |
/s/ Andrew W. McWilliams | | Chief Accounting Officer | | March 10, 2015 |
Andrew W. McWilliams | | (Principal Accounting Officer) | | |
| | |
/s/ Jerrod N. Menz | | President and Director | | March 10, 2015 |
Jerrod N. Menz | | | | |
| | |
/s/ Darrell S. Freeman, Sr. | | Lead Independent Director | | March 10, 2015 |
Darrell S. Freeman, Sr. | | | | |
| | |
/s/ Jerry D. Bostelman | | Director | | March 10, 2015 |
Jerry D. Bostelman | | | | |
| | |
/s/ Lucius E. Burch, III | | Director | | March 10, 2015 |
Lucius E. Burch, III | | | | |
| | |
/s/ David C. Kloeppel | | Director | | March 10, 2015 |
David C. Kloeppel | | | | |
| | |
/s/ Richard E. Ragsdale | | Director | | March 10, 2015 |
Richard E. Ragsdale | | | | |
EXHIBIT INDEX
Exhibit No. | | Description |
2.1† | | Agreement and Plan of Merger by and among AAC Holdings, Inc., American Addiction Centers, Inc. and AAC Merger Sub, Inc., dated as of October 30, 2014 (previously filed as Exhibit 2.1 to the Registration Statement on Form S-4 (Registration No. 333-199749), filed on October 31, 2014 and incorporated herein by reference). |
2.2† | | Contribution Agreement by and among AAC Holdings, Inc., Michael T. Cartwright, Jerrod N. Menz and Kirk R. Manz, dated as of April 15, 2014 (previously filed as Exhibit 2.1 to the Registration Statement on Form S-1 (Registration No. 333-197383), filed on July 11, 2014 and incorporated herein by reference). |
2.3† | | Contribution Agreement by and among Tina Cartwright, Victoria Menz, AAC Holdings, Inc. and, solely for the purposes of Section 4.6, Clinical Revenue Managements Services, LLC, dated as of April 15, 2014 (previously filed as Exhibit 2.2 to the Registration Statement on Form S-1 (Registration No. 333-197383), filed on July 11, 2014 and incorporated herein by reference). |
2.4† | | Asset and Equity Purchase Agreement by and among American Addiction Centers, Inc., AJG Solutions, Inc., Member Assistance Solutions, LLC, James D. Bevell, Jr., and Michael Blackburn, dated as of August 31, 2012 (previously filed as Exhibit 2.3 to the Registration Statement on Form S-1 (Registration No. 333-197383), filed on July 11, 2014 and incorporated herein by reference). |
2.5† | | Purchase and Sale Agreement by and between American Addiction Centers, Inc. and the Sisters of Saint Francis of Philadelphia, dated as of April 17, 2013 (previously filed as Exhibit 2.4 to the Registration Statement on Form S-1 (Registration No. 333-197383), filed on July 11, 2014 and incorporated herein by reference). |
2.6† | | Asset Purchase Agreement by and among American Addiction Centers, Inc., AAC Florida Acquisition Sub, LLC (n/k/a Recovery First of Florida, LLC) and Recovery First, Inc., dated as of December 15, 2014 (previously filed as Exhibit 2.1 to the Current Report on Form 8-K (File No. 001-36643), filed on February 24, 2015 and incorporated herein by reference). |
2.7† | | Amendment to the Asset Purchase Agreement by and among American Addiction Centers, Inc., AAC Florida Acquisition Sub, LLC (n/k/a Recovery First of Florida, LLC), The Academy Real Estate, LLC and Recovery First, Inc., dated February 17, 2015 (previously filed as Exhibit 2.2 to the Current Report on Form 8-K (File No. 001-36643), filed on February 24, 2015 and incorporated herein by reference). |
3.1 | | Articles of Incorporation of AAC Holdings, Inc. (previously filed as Exhibit 3.1 to Amendment No. 2 to Registration Statement on Form S-1 (Registration No. 333-197383), filed on September 10, 2014 and incorporated herein by reference). |
3.2 | | Amended and Restated Bylaws of AAC Holdings, Inc. (previously filed as Exhibit 4.2 to the Registration Statement on Form S-8 (Registration No. 333-199161), filed on October 3, 2014 and incorporated herein by reference). |
4.1 | | Form of Certificate of Common Stock of AAC Holdings, Inc. (previously filed as Exhibit 4.1 to Amendment t No. 1 to the Registration Statement on Form S-1 (Registration No. 333-197383), filed on August 15, 2014 and incorporated herein by reference). |
10.1+ | | AAC Holdings, Inc. 2007 Stock Incentive Plan (previously filed as Exhibit 10.1 to the Registration Statement on Form S-1 (Registration No. 333-197383), filed on July 11, 2014 and incorporated herein by reference). |
10.2+ | | Form of Restricted Share Award under the 2007 Stock Incentive Plan (previously filed as Exhibit 10.2 to the Registration Statement on Form S-1 (Registration No. 333-197383), filed on July 11, 2014 and incorporated herein by reference). |
10.3+ | | AAC Holdings, Inc. 2014 Equity Incentive Plan (previously filed as Exhibit 10.3 to the Registration Statement on Form S-1 (Registration No. 333-197383), filed on July 11, 2014 and incorporated herein by reference). |
10.4+ | | Form of Restricted Share Award under the AAC Holdings, Inc. 2014 Equity Incentive Plan (previously filed as Exhibit 10.4 to Amendment No. 3 to the Registration Statement on Form S-1 (Registration No. 333-197383), filed on September 22, 2014 and incorporated herein by reference). |
Exhibit No. | | Description |
10.5+ | | Form of Restricted Share Award Agreement under the AAC Holdings, Inc. 2014 Equity Incentive Plan (previously filed as Exhibit 10.1 to the Current Report on Form 8-K (File No. 001-36643), filed on January 9, 2015 and incorporated herein by reference). |
10.6+ | | Form of Non-Employee Director Award Agreement under the AAC Holdings, Inc. 2014 Equity Incentive Plan (previously filed as Exhibit 10.2 to the Current Report on Form 8-K (File No. 001-36643), filed on January 9, 2015 and incorporated herein by reference). |
10.7+ | | American Addiction Centers, Inc. 2014 Cash Incentive Plan (previously filed as Exhibit 10.5 to the Registration Statement on Form S-1 (Registration No. 333-197383), filed on July 11, 2014 and incorporated herein by reference). |
10.8+ | | Form of Director Indemnification Agreement (previously filed as Exhibit 10.6 to the Registration Statement on Form S-1 (Registration No. 333-197383), filed on July 11, 2014 and incorporated herein by reference). |
10.9 | | Amended and Restated Limited Liability Company Agreement of Behavioral Healthcare Realty, LLC, dated as of April 15, 2014 (previously filed as Exhibit 10.7 to the Registration Statement on Form S-1 (Registration No. 333-197383), filed on July 11, 2014 and incorporated herein by reference). |
10.10 | | Term Loan Agreement by and between AAC Holdings, Inc., Guarantor and Reliant Bank, dated as of May 2, 2014 (previously filed as Exhibit 10.27 to the Registration Statement on Form S-1 (Registration No. 333-197383), filed on July 11, 2014 and incorporated herein by reference). |
10.11 | | Term Loan Promissory Note by and between AAC Holdings, Inc. and Reliant Bank, dated as of May 2, 2014 (previously filed as Exhibit 10.28 to the Registration Statement on Form S-1 (Registration No. 333-197383), filed on July 11, 2014 and incorporated herein by reference). |
10.12 | | Continuing Guaranty by American Addiction Centers, Inc., in favor of Reliant Bank, dated as of May 2, 2014 (previously filed as Exhibit 10.29 to the Registration Statement on Form S-1 (Registration No. 333-197383), filed on July 11, 2014 and incorporated herein by reference). |
10.13 | | Continuing Guaranty by Michael T. Cartwright in favor of Reliant Bank, dated as of May 2, 2014 (previously filed as Exhibit 10.30 to the Registration Statement on Form S-1 (Registration No. 333-197383), filed on July 11, 2014 and incorporated herein by reference). |
10.14 | | Continuing Guaranty by Jerrod N. Menz in favor of Reliant Bank, dated as of May 2, 2014 (previously filed as Exhibit 10.31 to the Registration Statement on Form S-1 (Registration No. 333-197383), filed on July 11, 2014 and incorporated herein by reference). |
10.15 | | Continuing Guaranty by Kirk R. Manz in favor of Reliant Bank, dated as of May 2, 2014 (previously filed as Exhibit 10.32 to the Registration Statement on Form S-1 (Registration No. 333-197383), filed on July 11, 2014 and incorporated herein by reference). |
10.16 | | Amended and Restated Subordinated Promissory Note in the principal amount of $2,355,331 made by American Addiction Centers, Inc. in favor of Michael Blackburn, dated as of April 2, 2013 (previously filed as Exhibit 10.33 to the Registration Statement on Form S-1 (Registration No. 333-197383), filed on July 11, 2014 and incorporated herein by reference). |
10.17 | | Subordinated Promissory Note in the principal amount of $600,000 made by American Addiction Centers, Inc. in favor of Michael Blackburn, dated as of August 31, 2012 (previously filed as Exhibit 10.35 to the Registration Statement on Form S-1 (Registration No. 333-197383), filed on July 11, 2014 and incorporated herein by reference). |
10.18 | | Form of 12% Secured Subordinated Note by and among American Addiction Centers, Inc. and certain accredited investors (previously filed as Exhibit 10.36 to the Registration Statement on Form S-1 (Registration No. 333-197383), filed on July 11, 2014 and incorporated herein by reference). |
10.19 | | Form of Management Services Agreement by and among American Addiction Centers, Inc. and each professional physician group (previously filed as Exhibit 2.1 to the Registration Statement on Form S-1 (Registration No. 333-197383), filed on July 11, 2014 and incorporated herein by reference). |
Exhibit No. | | Description |
10.20 | | Professional Services Agreement by and among San Diego Addiction Treatment Center, Inc. and San Diego Professional Group, P.C., dated as of August 5, 2014 (previously filed as Exhibit 10.39 to Amendment No. 1 to the Registration Statement on Form S-1 (Registration No. 333-197383), filed on August 15, 2014 and incorporated herein by reference). |
10.21 | | Professional Services Agreement by and among Forterus Health Care Services, Inc. and San Diego Professional Group, P.C., dated as of August 5, 2014 (previously filed as Exhibit 10.40 to Amendment No. 1 to the Registration Statement on Form S-1 (Registration No. 333-197383), filed on August 15, 2014 and incorporated herein by reference). |
10.22 | | Professional Services Agreement by and among Singer Island Recovery Center LLC and Palm Beach Professional Group, Professional Corporation, dated as of August 5, 2014 (previously filed as Exhibit 10.41 to Amendment No. 1 to the Registration Statement on Form S-1 (Registration No. 333-197383), filed on August 15, 2014 and incorporated herein by reference). |
10.23 | | Professional Services Agreement by and among Singer Island Recovery Center LLC d/b/a The Academy and Palm Beach Professional Group, Professional Corporation, dated as of August 5, 2014 (previously filed as Exhibit 10.42 to Amendment No. 1 to the Registration Statement on Form S-1 (Registration No. 333-197383), filed on August 15, 2014 and incorporated herein by reference). |
10.24 | | Professional Services Agreement by and among Concorde Treatment Center, LLC d/b/a Desert Hope Center and Las Vegas Professional Group – Calarco, P.C., dated as of August 5, 2014 (previously filed as Exhibit 10.43 to Amendment No. 1 to the Registration Statement on Form S-1 (Registration No. 333-197383), filed on August 15, 2014 and incorporated herein by reference). |
10.25 | | Professional Services Agreement by and among FitRx, LLC and Brentwood Professional Group, P.C., dated as of August 5, 2014 (previously filed as Exhibit 10.44 to Amendment No. 1 to the Registration Statement on Form S-1 (Registration No. 333-197383), filed on August 15, 2014 and incorporated herein by reference). |
10.26 | | Professional Services Agreement by and among Greenhouse Treatment Center, LLC d/b/a The Greenhouse and Grand Prairie Professional Group, P.A., dated as of August 5, 2014 (previously filed as Exhibit 10.45 to Amendment No. 1 to the Registration Statement on Form S-1 (Registration No. 333-197383), filed on August 15, 2014 and incorporated herein by reference). |
10.27* | | Credit Agreement dated as of March 9, 2015 among AAC Holdings, Inc., certain Subsidiaries of the Borrower party thereto, Bank of America, N.A., as Administrative Agent, Swingline Lender and L/C Lender and SunTrust Bank, as Syndication Agent, Raymond James Bank, N.A. and BMO Harris Bank N.A., as Co-Documentation Agents and the other lenders party thereto. |
21.1* | | List of subsidiaries |
23.1* | | Consent of BDO USA, LLP |
31.1* | | Certification of Chief Executive Officer pursuant to Exchange Act Rules 13a-14(a) and 15d-14(a), as adopted pursuant to Section 302 of the Sarbanes-Oxley Act of 2002. |
31.2* | | Certification of Chief Financial Officer pursuant to Exchange Act Rules 13a-14(a) and 15d-14(a), as adopted pursuant to Section 302 of the Sarbanes-Oxley Act of 2002. |
32.1** | | Certification of Chief Executive Officer pursuant to 18 U.S.C. Section 1350, as adopted pursuant to Section 906 of the Sarbanes-Oxley Act of 2002. |
32.2** | | Certification of Chief Financial Officer pursuant to 18 U.S.C. Section 1350, as adopted pursuant to Section 906 of the Sarbanes-Oxley Act of 2002. |
101.INS* | | XBRL Instance Document. |
101.SCH* | | XBRL Taxonomy Extension Schema Document. |
101.CAL* | | XBRL Taxonomy Calculation Linkbase Document. |
101.LAB* | | XBRL Taxonomy Labels Linkbase Document. |
Exhibit No. | | Description |
101.PRE* | | XBRL Taxonomy Presentation Linkbase Document. |
* Filed herewith.
† Schedules and exhibits have been omitted pursuant to Item 601(b)(2) of Regulation S-K. AAC Holdings, Inc. hereby undertakes to furnish supplementally copies of any of the omitted schedules and exhibits upon request by the Securities and Exchange Commission.
+ Denotes a management contract or compensatory plan or arrangement.
** The certifications attached as Exhibit 32.1 and Exhibit 32.2 that accompany this Annual Report on Form 10-K are deemed furnished and not filed with the Securities and Exchange Commission and are not to be incorporated by reference into any filing of AAC Holdings, Inc. under the Securities Act of 1933, as amended, or the Securities Exchange Act of 1934, as amended, whether made before or after the date of this Annual Report on Form 10-K, irrespective of any general incorporation language contained in such filing.