UNITED STATES
SECURITIES AND EXCHANGE COMMISSION
Washington, D.C. 20549
FORM 1-K
ANNUAL REPORT
ANNUAL REPORT PURSUANT TO REGULATION A OF THE SECURITIES ACT OF 1933
For the fiscal year ended March 31, 2021
VIRTUIX HOLDINGS INC.
(Exact name of registrant as specified in its charter)
Commission File No. 024-11309
| Delaware | 464371395 | |
| (State or other jurisdiction of incorporation or organization) | (I.R.S. Employer Identification No.) | |
1826 Kramer Lane, Suite H, Austin, TX 78758 | 78758 | |
| (Address of principal executive offices) | (Zip Code) |
| 832-260-3337 | ||
| Registrant’s telephone number, including area code |
| Series A-2 Preferred Stock |
| (Title of each class of securities issued pursuant to Regulation A) |
i
TABLE OF CONTENTS
In this Annual Report, the term “Virtuix” or “the company” refers to Virtuix Holdings Inc. and its subsidiaries Virtuix Inc. and Virtuix Manufacturing Ltd., on a consolidated basis.
THIS ANNUAL REPORT MAY CONTAIN FORWARD-LOOKING STATEMENTS AND INFORMATION RELATING TO, AMONG OTHER THINGS, THE COMPANY, ITS BUSINESS PLAN AND STRATEGY, AND ITS INDUSTRY. THESE FORWARD-LOOKING STATEMENTS ARE BASED ON THE BELIEFS OF, ASSUMPTIONS MADE BY, AND INFORMATION CURRENTLY AVAILABLE TO THE COMPANY’S MANAGEMENT. WHEN USED IN THE ANNUAL REPORT, THE WORDS “ESTIMATE,” “PROJECT,” “BELIEVE,” “ANTICIPATE,” “INTEND,” “EXPECT” AND SIMILAR EXPRESSIONS ARE INTENDED TO IDENTIFY FORWARD-LOOKING STATEMENTS, WHICH CONSTITUTE FORWARD LOOKING STATEMENTS. THESE STATEMENTS REFLECT MANAGEMENT’S CURRENT VIEWS WITH RESPECT TO FUTURE EVENTS AND ARE SUBJECT TO RISKS AND UNCERTAINTIES THAT COULD CAUSE THE COMPANY’S ACTUAL RESULTS TO DIFFER MATERIALLY FROM THOSE CONTAINED IN THE FORWARD-LOOKING STATEMENTS. INVESTORS ARE CAUTIONED NOT TO PLACE UNDUE RELIANCE ON THESE FORWARD-LOOKING STATEMENTS, WHICH SPEAK ONLY AS OF THE DATE ON WHICH THEY ARE MADE. THE COMPANY DOES NOT UNDERTAKE ANY OBLIGATION TO REVISE OR UPDATE THESE FORWARD-LOOKING STATEMENTS TO REFLECT EVENTS OR CIRCUMSTANCES AFTER SUCH DATE OR TO REFLECT THE OCCURRENCE OF UNANTICIPATED EVENTS.
ii
Overview
The company was first founded as Virtuix Technologies LLC in April 2013. In November 2013, Virtuix Technologies LLC converted into Virtuix Inc.
In December 2013, Virtuix Holdings Inc. was incorporated in Delaware to act as the holding company for the following entities:
| · | Virtuix Inc. |
| · | Virtuix Manufacturing Ltd. |
| · | Virtuix Manufacturing (Zhuhai) Co., Ltd. |
Virtuix Inc.
Virtuix Inc., a wholly-owned subsidiary, is a Delaware corporation that was formed on April 15, 2013. Virtuix Inc. develops virtual-reality hardware and software, primarily the Omni, the first virtual-reality interface that allows users to move freely and naturally in video games and virtual worlds. In February 2019, Virtuix Inc. released Omniverse VR ARENA, later renamed Omni Arena, a four-player esports attraction that includes four Omni motion platforms.
Virtuix Manufacturing Ltd.
Virtuix Manufacturing Limited (“VML”), a wholly-owned subsidiary, is a Hong Kong corporation that was formed on January 29, 2015. On June 24, 2015, the company acquired 100% of VML’s common stock (10,000 shares). VML conducts manufacturing operations and transacts USD-denominated business with the company’s suppliers.
Virtuix Manufacturing (Zhuhai) Co., Ltd.
Virtuix Manufacturing (Zhuhai) Co., Ltd. (“VML_ZH”), a wholly-owned subsidiary of VML, was formed on July 28, 2016 and is a Wholly Foreign-Owned Enterprise (“WFOE”) registered in Zhuhai, Guangdong, China. VML_ZH sells the company’s products to Asian customers, conducts manufacturing operations, and transacts CNY-denominated business with Chinese suppliers.
Joint Venture
In July 2016, the company formed a joint venture with Hero Entertainment, a Chinese game publisher and esports operator, to develop virtual-reality content and distribute the company’s products in Asian markets. The joint venture, named Heroix VR (Shanghai) Co., Ltd. (the “Joint Venture” or “Heroix”), is a Sino-foreign equity joint venture company established under the laws of the People’s Republic of China and registered in Shanghai. The company invested in Heroix via VML. VML holds an ownership percentage in Heroix of 49%, a non-controlling interest. Heroix began operations in October 2016.
Principal Products and Services
The Omni is the first-of-its-kind motion platform that lets players walk and run in 360 degrees inside video games and other virtual worlds. The Omni's immersive experience takes gaming to the next level.
The company sells three products related to the Omni concept:
| · | Omni Pro platform and accessories |
| · | Omni Arena esports attraction |
| · | Omniverse gameplay credits |
- 1 -
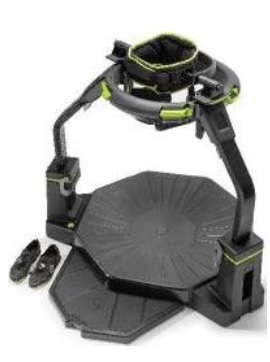
OMNI PRO
Omni Pro is a virtual-reality motion platform that lets players walk and run at full speed in 360 degrees without risk of falling or colliding with other people. Players experience unrestricted gameplay action, including sideways and backwards movement, at their real-time physical speed.
Omni Pro is sold mainly to enterprise customers and smaller entertainment venues (for example, VR arcades). The company distributes Omni Pro through a network of 22 distributors covering 45 countries. Consumers cannot purchase this product directly.
With more than 3,500 Omnis shipped to date, the company considers the Omni platform to be the leading and most popular VR motion platform on the market.
 |  |
Omniverse Game Library & Specialized VR Applications
Players of Omni Pro at commercial entertainment venues have access to the Omniverse library of 24 VR games that are optimized for the Omni experience. These games allow players to walk and run around inside virtual game worlds. They include popular genres such as first-person shooting games, adventure games, kid-friendly experiences, and virtual visits to natural settings like forests and beaches.
Customers outside the entertainment sector use Omni Pro for various non-gaming applications, such as training and simulation. These customers can develop custom VR applications using Virtuix’s software development kit (“SDK”), which allows developers to integrate Omni Pro motion output into applications that serve specialized purposes.
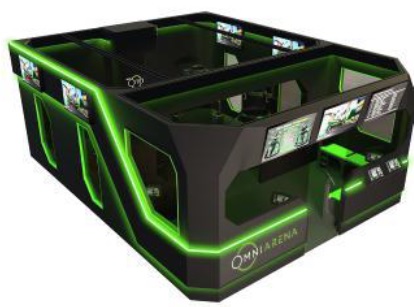
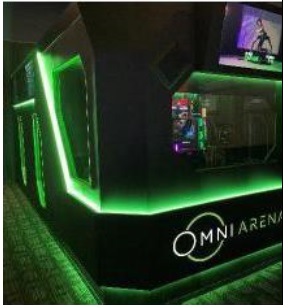
OMNI ARENA
Omni Arena is a virtual reality esports attraction that bundles four Omni Pro platforms into a four-player attraction that can be operated by a single attendant. Omni Arena features ongoing esports contests with a $100,000 prize pool sponsored by Virtuix and HP.
The company believes, based on usage data, that the Omni’s physical engagement combined with Omni Arena’s competitive, multiplayer gaming offers entertainment venues a winning formula for high repeat play. The esports prize pool incentivizes gamers to enter weekly and monthly contests, and serious contestants often come back to compete every week.
- 2 -
 |  |
Curated Gaming Experience
As with Omni Pro, players of Omni Arena can walk or run at full speed inside video games. Omni Arena offers a curated selection of multiplayer VR games from the Omniverse library. These games feature co-operative and player-vs-player shooters, thrilling adventures, frightening horror, and kid-friendly action. Players engage virtually with their teammates and other teams and players, thus facilitating social and community-based experiences.
Benefits for Venues
The company believes that Omni Arena increases revenues at entertainment venues in the following ways:
| · | Omni Arena’s popular game genres attract a wide range of guests and a loyal audience of gamers. |
| · | The built-in esports contests and $100,000 annual prize pool stimulate high repeat play. | |
| · | Regular releases of new games (typically two per year) excite customers and drive repeat visits. | |
| · | The complete guest experience (about 20 minutes from start to finish) allows venues to charge $15 per player, per game. |
The company believes that Omni Arena provides a customer experience that guests consider to be complete and satisfying. Upon finishing the game, guests receive a gameplay video, suitable for sharing on social media, that comes the venue’s logo embedded.
Furthermore, Virtuix has designed Omni Arena to be a highly automated attraction for venues to operate. It includes the following features that help to reduces a venue’s labor costs and boost utilization:
| · | Social sharing stations that entertain customers before and after the VR gameplay. |
| · | Automated staging area that allows for quick player setup and high throughput (20 players per hour). |
| · | Queuing app that notifies guests by text message when their turn comes to play (by eliminating wait lines, guests can enjoy other attractions or food & beverages while awaiting their turn). |
Venues typically sell tickets for Omni Arena’s 20-minute experience for $12 to $15 per player. At top-performing sites, Omni Arena generates monthly revenues of $30,000 or more.
In an ongoing player survey, in which over 25,000 players have participated to date, 98% of players expressed intent to play Omni Arena again, and 44% of players reported they had visited the venue specifically to play Omni Arena.
- 3 -
Driving high revenues, guest traffic, and repeat play are hallmarks of an “anchor attraction,” the class of attraction that is most valuable to entertainment venues. Based on revenue data, usage data, and survey results, the company believes that Omni Arena’s performance meets the criteria for an anchor attraction.
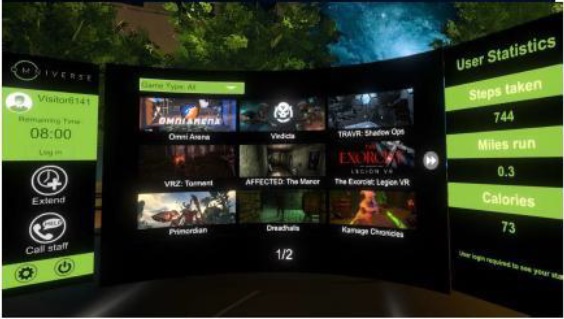
OMNIVERSE
In October 2017, Virtuix launched OmniverseTM, the Omni’s proprietary content distribution and arcade management platform. Omniverse currently offers 24 top VR games that are optimized for the Omni experience and suited for commercial entertainment venues. Of the 24 games, 10 were developed by Virtuix and 14 by third-party studios.
Omniverse transforms the Omni into a complete entertainment solution for amusement venues. Thanks to Omniverse’s extensive catalog of popular games and its leaderboard functionality, customers come back to play again and again.
The company generates revenues from the sale of “Omniverse credits,” which are gameplay credits needed by commercial operators to play games on Omni Pro and Omni Arena. By selling Omniverse credits, Virtuix collects ongoing game licensing fees from entertainment venues that operate Omni Pro and Omni Arena.
 |
 |
- 4 -
Product Safety
The company believes that the Omni platform is safe to use. Players are strapped into a safety harness inside the Omni ring structure. Virtuix believes that players cannot fall out of the safety harness during use. Before and after gameplay, players use a rubber anti-slip mat to safely enter and exit the Omni platform. Virtuix is not aware of any accidents in the four years since the launch of the Omni and has not been subject to any legal proceedings related to safety incidents.
The Company’s Plans for New Products
During 2019, in response to requests from Omni fans, Virtuix began developing an at-home Omni system, “Omni One,” that is optimized for consumer use. Omni One’s mechanical design offers increased freedom of movement compared to Omni Pro’s design.
Virtuix aims to make Omni One the “Peloton for gamers.” The company intends to make Omni One’s
business model similar to Peloton’s. Specifically, it will include a monthly subscription fee in addition to an online store that sells individual games.
Virtuix believes that its install base of thousands of commercial Omnis at out-of-home venues provides an ideal demo and sales channel for Omni One.
Due to delays in development, the company intends to release and begin shipping Omni One as a complete entertainment system by December 31, 2021, instead of during Q2 2021. Omni One will be comprised of the following hardware, software, and content elements:
| · | Hardware: |
| o | Omni motion platform that is optimized for home use, meaning it will be lighter than Omni Pro, easier to store, and offer more freedom of movement (including jumping and crouching). |
| o | Standalone, all-in-one VR headset (no PC needed). |
| · | Software |
| o | Closed content platform (storefront) to sell games and manage monthly subscriptions. |
| o | Mobile app with game notifications and fitness stat tracking, intended to improve engagement and “stickiness.” |
| · | Content |
| o | 30+ game titles available upon launch, available for purchase for $19.99 to $39.99. |
| o | Games content will include Omni-specific games, non-Omni games, top VR titles, and popular genres like battle royale (Fortnite style). |
Virtuix’s long-term vision is to bring full-body VR to mass entertainment markets, both commercial and consumer. Virtuix aims to make the Omni system essential to every VR setup, whether inside or outside the home.
Virtuix foresees wide-ranging commercial applications, including out-of-home amusement (arcades, family entertainment centers, and sports centers), training and simulation, education, virtual tourism, and health care and fitness.
Market
Virtuix intends to sell three distinct products: Omni Pro, Omni Arena, and Omni One. These products will be sold through different channels.
Omni Pro and Omni Arena
Virtuix sells Omni Arena directly to arcades, amusement centers, food & beverage venues, sports centers, and entertainment complexes (such as cinema multiplexes) in the U.S. and Canada. Well-known customers include Dave & Buster’s and Sky Zone trampoline parks.
According to research firm IbisWorld, the U.S. market has 8,300 venues within this sector, representing a $1.2 billion potential market for Omni Arena. The company has determined that this sector is highly fragmented, sustaining thousands of small operators. It is not dominated by major participants that would impose barriers to entry by a new entrant such as Virtuix.
- 5 -
Virtuix sells Omni Pro in container-load quantities to its distributors, who resell the systems in their local markets. End customers of Omni Pro include commercial enterprises, universities, and smaller entertainment venues (such as specialized VR arcades).
Omni One
Virtuix estimates that the serviceable addressable market in the U.S. for Omni One, the Omni’s upcoming at-home version, is approximately 14 million households. The company intends to expand sales of Omni One rapidly into Europe and China.
Based on Virtuix’s primary research and surveys of Omni Arena players, it has identified three key buyer personas for Omni One:
| · | VR enthusiasts | |
| · | Gamers | |
| · | Parents |
Marketing/Distribution Channels
Marketing of Omni Pro and Omni Arena
Virtuix’s methods for marketing Omni Pro and Omni Arena include trade publications and trade shows. The company attends three to four tradeshows each year to demonstrate the Omni experience to potential customers.
Virtuix relies on a network of 22 worldwide distributors to promote and distribute Omni Pro in their local markets. Virtuix does not sell this product directly to end customers.
Virtuix sells Omni Arena directly to customers in the U.S. and Canada. This product is not available outside of the U.S. and Canada.
Marketing of Omni One
The company intends to promote Omni One initially to its existing Omni player community via direct email marketing. The company is in direct contact with fans of its out-of-home experience, a captive audience of registered players that provides a large pool of potential buyers for Omni One.
In a survey Virtuix conducted of 1,000 players, 14% indicated they would be “likely or highly likely” to purchase Omni One for an upfront purchase price of $1,995. Virtuix believes that likely buyers of Omni One are consumers who fall within the following categories:
| · | VR enthusiasts: Early adopters who crave the latest VR innovations. This group preordered 5,000 units of the original 2013 Omni version. |
| · | Gamers: Players of console and PC games who seek the fun of walking and running inside video games, and who value the Omni’s fitness benefits. By offering Omni One as a complete VR gaming system, the company believes it can reach gamers who don’t yet own a VR headset. |
| · | Parents: Players aged 8-20 make up 40% of Omni Arena players. Young people love gaming on the Omni, and Virtuix expects many young people will petition their parents to buy Omni One. Survey data shows that many parents may agree. |
As well as targeting the above groups, the company intends to use digital media advertising and gaming influencers to market Omni One to the wider market.
Competition
The company faces competition mainly from KATVR (China) and Cyberith (Austria).
KATVR currently offers a VR treadmill only, without a headset or computer, for about $1,750. Virtuix believes that Omni One offers customers the following advantages over KATVR’s product:
- 6 -
| · | Omni One is a complete system including all-in-one headset that’s ready to play out-of-the-box, making it suitable for the mass market (not just for VR enthusiasts) | |
| · | Omni One includes an optimized games platform, ensuring a quality consumer experience (no tinkering required) | |
| · | Omni One has a scalable business model including recurring revenues (it’s not just a hardware accessory) | |
| · | Omni One’s underlying Omni technology is mature and proven | |
| · | Virtuix is capitalized and backed by major partners | |
| · | Virtuix has 22 distributors on 5 continents | |
| · | Omni technology is protected by an extensive patent portfolio |
Cyberith, as of March 31, 2020, had failed to develop a home product and failed to ship a product of any kind to its Kickstarter backers. Cyberith offers only a commercial system, the “Virtualizer,” to enterprise customers in low volumes. Virtuix believes that the Virtualizer’s flat-shaped base makes walking difficult.
In addition to the weaknesses listed above, the company believes that KATVR and Cyberith’s products infringe on several of Virtuix’s patents. No legal action has been taken by the company to enforce these patents.
Supply Chain
The company conducts final assembly of Omni Arena at its own facility in Austin, Texas. The company purchases Omni Pro and Omni Arena hardware components from about 50 suppliers in the U.S, China, and Taiwan. To manage this supply chain, Virtuix employs purchasing and quality-control teams at its locations in Austin, Texas and Zhuhai, China.
The company’s top three suppliers are:
| · | Yingliang Health Technology Co., Ltd. (Taiwan company): assembles Omni Pro and accessories |
| · | Xianmei Exhibition Products Ltd. (China company): fabricates Omni Arena’s structural components |
| · | D&H Distributing Co. (U.S. company): supplies Omni Arena’s primary electronic components (including HTC VIVE Pro headsets, Intel computers, NETGEAR networking equipment, and Cyberpower UPS systems) |
Purchases from the above three suppliers account for approximately 54% of Omni Arena’s materials cost.
Although the structural components of Omni Arena are fabricated in China, the company builds the finished Omni Arena product at its facility in Austin, Texas. Final assembly of Omni Arena occurs at the customer site and is performed by the company’s installation team.
The company ships Omni Pro systems in container loads (20’ or 40’) to distributors on EXW China terms (meaning the distributor handles shipping and importing arrangements). The company ships Omni Arena structural components in container loads from China to third-party warehouses in the U.S., and then to customer sites for installation. The company ships other Omni Arena materials, such as electronic components, via LCL trucking services from its Austin, Texas facility to customer sites.
The company intends to produce Omni One hardware using the China, Taiwan, and U.S. suppliers who currently produce Omni Pro, and to manage production using the supply-chain management staff the company currently employs in Austin, Texas and Zhuhai, China.
Research and Development
Since inception, the company has spent approximately $7.6 million on research and development of its products. Most recently, the company spent $764,511 for the year ended March 31, 2021. Part of these funds was allocated to further development of Omni Arena, and part was allocated to research and development of the company’s newest product, Omni One.
Employees
Virtuix has 33 full-time employees: 18 at its Austin, Texas headquarters, 2 remotely in the U.S. (sales reps), and 13 in Zhuhai, China. The company employs 7 part-time hourly workers in Austin for production, installation, and customer support.
Intellectual Property
The company relies on its intellectual property. As of March 31, 2021, the company owns six issued utility patents and nine issued design patents. Six applications are pending.
- 7 -
Patents: Granted
| Patent Number | Title | Type | Date Granted |
| US 9,329,681 | Locomotion System and Apparatus* | Granted | 5/3/2016 |
| US 9,785,230 | Locomotion System and Apparatus | Granted | 10/10/2017 |
| US 10,635,162 | Locomotion System and Apparatus | Granted | 4/28/2020 |
| US D766,239 | Omni-directional Locomotion Platform | Granted | 9/13/2016 |
| US D789,368 | Omni-directional Locomotion Platform | Granted | 6/13/2017 |
| US D787,516 | Omni-directional Locomotion Platform | Granted | 5/23/2017 |
| US 10,286,313 | Method Generating an Input in an Omnidirectional Locomotion System ** | Granted | 5/14/2019 |
| US 10,065,114 | Haptic Glove for use in virtual environment | Granted | 9/14/2018 |
| US D863,737 | Slip-on Shoe*** | Granted | 10/22/2019 |
| US D863,738 | Slip-on Shoe | Granted | 10/22/2019 |
| US D879,417 | Slip-on Shoe | Granted | 3/31/2020 |
| US D878,012 | Slip-on Shoe | Granted | 3/17/2020 |
| US D887,684 | Slip-on Shoe | Granted | 6/23/2020 |
| US 10,751,622 | System and Method of Soft Decoupling an Input**** | Granted | 8/5/2020 |
| US 10,933,320 | Method Generating an Input in an Omnidirectional Locomotion System | Granted | 3/2/2021 |
Patents: Applications
| Application Number | Title | Type | Date Filed |
| 16/813,428 | Locomotion System and Apparatus | Non-provisional Utility Patent Application | 3/9/2020 |
| 16/ 988,496 | System and Method of Soft Decoupling an Input | Non-provisional Utility Patent Application - ALLOWED | 8/7/2020 |
| 63/028,160 | Efficient Capture and Delivery of Walkable and Interactive Virtual Reality or 360 Degree Video | Provisional Utility Patent Application | 5/21/2020 |
| PCT/US19/54164 | Data Management and Performance Tracking System for Walkable or Interactive Virtual Reality | Non-provisional Utility Patent Application | 10/1/2019 |
| 29/692,498 | Arena | Non-provisional Design Patent Application | 5/24/2019 |
| 63/083 716 | OMNIDIRECTIONAL LOCOMOTION SYSTEM WITH FULL RANGE OF MOTION IN MULTIPLE DEGREES OF FREEDOM FOR WALKABLE OR INTERACTIVE VIRTUAL REALITY | Provisional Utility Patent Application | 9/25/2020 |
*The patent titled “Locomotion System and Apparatus” has been filed with international patent regulators in Australia, Brazil, China, Europe, Hong Kong, India, Russia, and South Korea, and has been granted in Australia, China, Europe, Hong Kong, Russia, and South Korea.
** The patent titled “Method Generating an Input in an Omnidirectional Locomotion System” has been filed with international patent regulators in Australia, Brazil, China, Europe, Hong Kong, India, Russia, and South Korea, and has been granted in Russia.
*** The patent titled “Slip-on Shoe” has been filed with international patent regulators and has been granted in China, Europe, Russia, and South Korea.
- 8 -
**** The patent titled “System and Method of Soft Decoupling an Input” has been filed with international patent regulators and has been granted in China and Europe.
Additionally, Virtuix has entered into a License Agreement with CloudNav, Inc. covering the license of CloudNav, Inc.’s Sensor Fusion Library and Virtual Reality Motion Library.
Trademarks
| Trademark Number | Mark | Class | Date Granted |
| 5,930,233 | OMNIVERSE ESPORTS | 41 | 12/20/2019 |
| 5,993,690 | OMNIVERSE VR ARENA | 19/37/41 | 2/25/2020 |
| 5,000,145 | OMNI ARENA | 9 | 7/12/2016 |
| 5,042,878 | OMNI CONNECT | 9 | 9/13/2016 |
| 5,851,790 | OMNI VR | 41 | 5/31/2016 |
| 5,261,822 | OMNI ONLINE | 41 | 8/8/2017 |
| 5,407,949 | OMNIVERSE | 38 | 2/20/2018 |
| 5,681,504 | OMNIVERSE | 41 | 2/19/2019 |
| 1,375,213 | OMNIVERSE (Granted by the World Intellectual Property Organization) | 38 | 9/1/2017 |
| 5,022,930 | TRAVR | 9 | 8/16/2016 |
| 4,951,644 | VIRTUIX | 9 | 5/2/2016 |
| 4,973,454 | VIRTUIX ONMI | 25/28 | 6/7/2016 |
| 5,492,571 | VIRTUIX OMNIVERSE | 9/38/41 | 6/12/2018 |
Regulation
Other than consumer product rules applicable to all companies producing products for consumer use, the company is not aware of any specific regulations that would impact or limit its current or proposed operations.
Litigation
The company is not a party to any litigation.
Item 2.
MANAGEMENT’S DISCUSSION AND ANALYSIS OF FINANCIAL CONDITION AND RESULTS OF OPERATIONS
You should read the following discussion and analysis of the consolidated financial statements and financial condition of Virtuix Holdings Inc. and results of its operations together with its consolidated financial statements and related notes appearing at the end of this Annual Report. This discussion contains forward-looking statements reflecting the company’s current expectations that involve risks and uncertainties. Actual results and the timing of events may differ materially from those contained in these forward-looking statements due to a number of factors, including those discussed in the section entitled “Risk Factors” and elsewhere in this Annual Report.
Overview
The company sells the Omni, an “omni-directional treadmill” that lets players walk or run in 360 degrees inside virtual reality videogames and other virtual reality applications.
Results of Operations
Year Ended March 31, 2021 Compared to Year Ended March 31, 2020
Virtuix and its subsidiaries have generated $2,103,090 in revenues for the year ended March 31, 2021 and $3,855,193 in revenues for the year ended March 31, 2020. The costs of goods sold consist of material costs, logistics and warehousing costs, and other costs related to the production and installation of Omni Pro and Omni Arena systems. Net revenues consist of sales of Omni Pro systems, Omni Arena attractions, Omniverse credits, and replacement parts and accessories. The 45% decrease in revenue from March 31, 2020 to March 31, 2021 was primarily due to COVID-19 related lockdowns that severely impacted the out-of-home entertainment industry, the company’s primary target market. Specifically, for the quarter ended June 30, 2020, Omni Arena sales were $0, as the company did not complete any installations of Omni Arena due to COVID-19 related lockdowns.
- 9 -
The operating expenses currently consist of selling expenses consisting of marketing expenses and salaries of sales representatives; general and administrative expenses consisting primarily of salaries, travel, and office expenses of administrative employees and contractors; and research and development expenses. Operating expenses totaled, $3,771,712 for the year ended March 31, 2021 compared to $3,821,687 for the year ended March 31, 2020, a decrease of 1.31%, primarily due to:
| · | Selling expenses increased from $867,949 for the year ended March 31, 2020 to $1,021,016 a 18% increase, due primarily to the increase in marketing activities for Omni Arena and the hiring of sales representatives to sell Omni Arena. |
| · | Research and development costs decreased to $764,511 for the year ended March 31, 2021 from $805,042 for the year ended March 31, 2020. The 15% decrease was due to the decrease in development costs related to Omni Arena as well as a reduction in the research and development budget and activity related to COVID-19 imposed lockdowns. |
As a result of the foregoing, the company generated a net loss of $3,845,456 for the year ended March 31, 2021 as compared to $3,580,222 for the year ended March 31, 2020. A 7% increase in net loss.
The company has certain royalty commitments associated with the shipment of its products for the use of licensed software and modifications together with the company’s hardware and other software. Royalty expense is generally based on a dollar amount per Omni unit shipped and can range from $1 per unit to $8 per unit. For the years ended March 31, 2021 and 2020, management has recorded royalty expense in the consolidated statements of operations of $2,344 and $2,816, respectively.
Liquidity and Capital Resources
As of March 31, 2021 the company’s cash and cash equivalents was $6,197,295 compared to $152,376 as of March 31, 2020. The significant increase in available cash on hand is due to the company undertaking its offering of securities under Regulation A. A portion of the proceeds of the offering was used to pre-pay note payable, reducing the company’s outstanding liability for those notes from $3,025,554 as of March 31, 2020 to $26,875 as of March 31, 2021. As a result, the company’s current liabilities were reduced from $5,355,890 to $1,741,689 over that period.
The company requires the continued infusion of new capital to continue business operations. The company has recorded losses since inception, and as of March 31, 2021, had a net loss of $3,845,456 and a stockholders’ equity of $$5,993,674. The company plans to continue to try to raise additional capital through crowdfunding offerings, equity issuances, or any other method available to the company. Absent additional capital, the company may be forced to significantly reduce expenses and could become insolvent.
The company’s current burn rate is approximately $300,000 per month. The company estimates that if it does not raise any additional funds, it could continue its current rate of operations through Q3 2023 without raising additional capital.
Plan of Operations
As of March 31, 2021, the company has achieved the following milestones:
| · | Shipped over $10 million worth of product to date (over 3,500 Omni systems to 45 countries). |
| · | Hosted more than two million plays the “Omniverse” content platform. |
| · | Shipped Omnis to over 500 entertainment venues. |
Virtuix has established the following milestones in its plan of operations for the next 12 months:
| · | Continue to sell and install Omni Arena attractions in the U.S. and Canada |
| o | The company aims to install 18 Omni Arena systems in calendar year 2021. |
| · | Complete development of Omni One and bring the product to market by December 31, 2021. |
Trend Information
The COVID-19 pandemic has directly impacted trends in revenue for the company. In February 2020, revenues for Omni Arena sales were approximately $800,000, partly resulting from 5 Omni Arena installations. For the quarter ended June 30, 2020, Omni Arena sales were $0, as the company did not complete any installations of Omni Arena. Fortunately, over the quarter from July 1, 2020 to September 30, 2020, Omni Arena revenues were $561,335 as the company resumed installations of Omni Arena. Despite the COVID-19 pandemic, Omni Pro revenues have stayed relatively stable during Q1 and Q2 of the fiscal year ending March 31, 2021.
- 10 -
However, the company believes that consumer trends are in its favor due to COVID-19 increasing the need for healthy at-home activities. Specifically, the company believes the following consumer trends will contribute to a successful Omni One launch:
| · | Activity at home |
| o | At-home fitness and entertainment have experienced increased growth in recent months. |
| · | Sedentary screen-time habits are increasing at an alarming rate and frustrating parents |
| o | The company believes that parents will more likely purchase an active gaming activity for their children as compared to a sedentary one. Specifically, walking and running inside videogames on Omni One is a unique and appealing feature of Omni One, and more active as compared to sedentary video game playing. Accordingly, the company believes that Omni gameplay is a healthier option and believes that many parents will recognize this benefit. |
| · | Ultrafast wireless (5G) |
| o | The company believes that advances in cloud-based gaming facilitated by 5G will significantly improve VR headset performance |
The global video game market, worth $165 billion annually (2019), has been steadily growing since 2009. In addition, the company has observed that the global COVID-19 pandemic has pushed demand for games and game-related hardware to new highs. According to a report by The NPD Group, a market research firm, March 2020 was the biggest month for the gaming industry in more than 10 years, as sales of game consoles, games, accessories, and game cards reached $1.6 billion. Shares of gaming companies, including Activision Blizzard and Electronic Arts, reached multi-year highs in 2020.
Other forms of at-home activities are benefitting also. For example, sales of Peloton, the developer of the popular Peloton exercise bike, jumped nearly 61% to $420 million in its fiscal third quarter.
Virtuix believes that its upcoming home product, Omni One, positions the company to participate in these upward trends.
Going Concern
The company’s independent auditor, Artesian CPA, LLC audited the company’s consolidated financial statements for the year ended March 31, 2021 assuming that the company will continue as a going concern.
Recent Offerings of Securities and Outstanding Debt
| · | Effective November 1, 2018, the company entered into an agreement to obtain financing with Western Technology Investment (“WTI”). The initial commitment of $500,000 was received on November 13, 2018. Terms of the note are interest-only payments through October 1, 2019, followed by thirty months of principal and interest payments beginning November 1, 2019 in the amount of $19,211, due on April 1, 2022. The note has a fixed interest rate of 12.25% and is secured by all assets of the company. The company used the proceeds from that offering for general operations. This note was paid in full in fiscal year 2021. |
| · | As of May 1, 2018, the company sold $2,999,742 of convertible notes with a valuation cap of $50,000,000 pursuant to Rule 506(c). The company used the proceeds from that offering for general operations. On December 31, 2019, these convertible notes converted into Series A-1 Preferred Stock of the company. |
| · | From May 2019 thru March 2020, the company sold subordinated promissory notes with an interest rate of 18%, in the amount of a $2,584,000, to various investors. The company used the proceeds from that offering for general operations. As of August 31, 2020 the company has converted $1,517,978 of the principal plus accrued interest into convertible notes. |
| · | Starting on April 15, 2020, the company initiated an offering to raise up to $3,000,000 through the issuance of subordinated convertible promissory notes (the “Convertible Notes”) on SeedInvest pursuant to Rule 506(c) of Regulation D under the Securities Act of 1933. The company has also issued Convertible Notes in exchange for the repayment of other outstanding debts incurred by the company. These Convertible Notes are convertible into shares of preferred stock of the company in connection with a qualified or other financing or, in certain circumstances, into shares of the company’s Series A-2 Preferred Stock and in some circumstances into Series A-1 Preferred Stock. The company has set aside, and reserved for the issuance upon the potential conversion of the notes, 1,425,000 shares of Series A-1 Preferred Stock. The company intends to use the proceeds from this offering for general operations.
Effective December 17, 2020, the Company was qualified by the Securities and Exchange Commission (“SEC”) to offer up to 5,006,675 shares of its Preferred Stock (designated as Series A-2Preferred Stock) to accredited and non-accredited investors in a Regulation A Offering. On or about March 15, 2021, the company was authorized to offer up to 726,655 shares of Series A-2 Preferred Stock to accredited investors in a Regulation D Offering. As of March 31, 2021, $11,027,473 of Series A-2 Preferred Stock subscriptions were closed and 3,680,727 shares were issued. The company used the proceeds from that offering for general operations.
On January 28, 2021, the company was granted a second loan (the “Second PPP Loan”) from Bank of Houston, N.A. in the amount of $177,067, pursuant to the PPP under Division A, Title I of the CARES Act. The Second PPP Loan is expected to mature in January 2026 and bears interest at a rate of 1.00% per year. Interest expense on the Second PPP Loan was $314 and $0 for the years ended March 31, 2021 and 2020, respectively. It is classified as a current liability in the Company’s consolidated balance sheets as full loan forgiveness is expected in fiscal year 2022.
On August 29, 2020, the company received a loan from the U.S. Small Business Administration under its Economic Injury Disaster Loan assistance program (the “EIDL Loan”) in light of the impact of the COVID-19 pandemic on the company’s business. The principal amount of the EIDL Loan was $25,000, with proceeds to be used for working capital purposes. The EIDL Loan is expected to mature in August 2050, bears interest at a rate of 3.75% per year, and is payable monthly beginning in August 2021. Interest expense on the Loan was $524 for the year ended March 31, 2021. |
- 11 -
Item 3.
Directors, Executive Officers and Significant Employees
The table below sets forth the officers and directors of the company as of March 31, 2021.
The following table sets out the company’s officers and directors. All work with the company on a full-time basis.
| Name | Position | Age | Term of Office (if indefinite, give date appointed) | Full Time/Part Time |
| Executive Officers: | ||||
| Jan Roger Goetgeluk | CEO | 37 | April 15, 2013 | Full Time |
| David Robert Malcolm Allan | President and COO | 53 | August 12, 2013 | Full Time |
| Directors: | ||||
| Jan Roger Goetgeluk | Director and Chairman of the Board | 32 | April 15, 2013 | |
| David Robert Malcolm Allan | Director | 53 | August 12, 2013 | |
| Michael Bradley McGovern | Director | 38 | December 14, 2016 | |
Jan Goetgeluk, CEO and Chairman of the Board
Jan Goetgeluk is currently Virtuix’s Chief Executive Officer. He has served in that position for seven years, from April 2013 to the present date. Prior to founding Virtuix, he was an Investment Banking Associate at J.P. Morgan from May 2010 to February 2013. He holds Bachelor of Science and Master of Science degrees in Mechanical Engineering from the University of Ghent in Belgium, and an MBA degree from Rice University in Houston.
David Allan, President and COO
David Allan is currently Virtuix’s President and Chief Operating Officer. He has served in that position for seven years, from August 2013 to the present date. Prior to joining Virtuix, David served as vice president of ERP Power, a California hardware startup, from June 2008 to January 2012. In that position he set up Asian manufacturing operations and helped grow the business to $50 million in sales, 700 employees, and the eventual sale to a private-equity acquirer. From January 2006 to May 2008, he served as Regional Materials Manager at Flextronics, a Fortune 500 manufacturer. David handled large-scale manufacturing programs serving top-tier customers like Apple and Dell. David holds a Bachelor of Applied Science in Systems Design Engineering from the University of Waterloo in Canada.
Brad McGovern, Director
Brad McGovern is currently a Director of Virtuix. He has served as the Managing Partner of Seitz, DeMarco & McGovern (“SDM”) since 2012. Prior to joining SDM, Brad worked in the Investment Management Division of Goldman Sachs from 2010 to 2012, and in the Assurance Department of Ernst & Young from 2005 to 2008. He holds a Bachelor of Business Administration in Finance and Accounting from Texas Christian University, a Masters of Accounting from Texas Christian University, and a Masters of Business Administration from Rice University.
COMPENSATION OF DIRECTORS AND EXECUTIVE OFFICERS
For the fiscal year ended March 31, 2021 the company compensated its three highest paid directors and executive officers as follows:
| Name | Capacities in which compensation was received | Cash compensation ($) | Other compensation ($) | Total compensation ($) |
| Jan Goetgeluk | Chief Executive Officer | $160,000 | N/A | $160,000 |
| David Allan | Chief Operating Officer | $235,000 | N/A | $235,000 |
For the fiscal year ended March 31, 2021, Virtuix paid its directors as a group $0. There are three directors in this group.
- 12 -
The compensation package was determined based on market rates.
Item 4.
SECURITY OWNERSHIP OF MANAGEMENT AND CERTAIN SECURITYHOLDERS
The following table displays, as of March 31, 2021, the voting securities beneficially owned by (1) any individual director or officer who beneficially owns more than 10% of any class of the company’s capital stock, (2) all executive officers and directors as a group, and (3) any other holder who beneficially owns more than 10% of any class of the company’s capital stock:
| Beneficial owner | Title of class | Name and address of beneficial owner | Amount ownership | Amount and nature of beneficial ownership acquirable | Percent of class (1) | Percent of voting power |
| Jan Goetgeluk | Common Stock | Jan Goetgeluk
7400 Rockberry | 5,500,000 shares | 0 | 100% | 100% |
| David Malcolm Allan | Common Stock | David Malcolm Allan
5F, #267, Alley Chung Shan N. Taipei, Taiwan | 0 | 1,125,000 optioned shares | 17% | 17% |
| (1) | The column “Percent of Class” includes a calculation of the amount the person owns now, plus the amount that person is entitled to acquire. That amount is then shown as a percentage of the outstanding amount of securities in that class if no other people exercised their rights to acquire those securities. The result is a calculation of the maximum amount that person could ever own based on their current and acquirable ownership, which is why the amounts in this column will not add up to 100%. |
Item 5.
INTEREST OF MANAGEMENT AND OTHERS IN CERTAIN TRANSACTIONS
The company has not entered into any transactions in which the management or related persons have interest in outside of the ordinary course of operations of the company.
Item 6. Other Information
None.
Item 7.
FINANCIAL STATEMENTS
- 13 -
virtuix HOLDINGS, inc. AND sUBSIDIARIES
CONSOLIDATED FINANCIAL STATEMENTS
AS OF MARCH 31, 2021 AND MARCH 31, 2020
AND
FOR THE YEARS ENDED MARCH 31, 2021 AND 2020
WITH
INDEPENDENT AUDITOR’S REPORT
- 14 -
To the Board of Directors of
Virtuix Holdings, Inc.
Austin, Texas
INDEPENDENT AUDITOR’S REPORT
Opinion
We have audited the accompanying consolidated financial statements of Virtuix Holdings, Inc. and subsidiaries (the “Company”) which comprise the consolidated balance sheets as of March 31, 2021 and 2020, and the related consolidated statements of operations, changes in stockholder’s equity/(deficit), and cash flows for the years then ended, and the related notes to the consolidated financial statements.
In our opinion, the consolidated financial statements referred to above present fairly, in all material respects, the consolidated financial position of the Company as of March 31, 2021 and 2020, and the results of its consolidated operations and its cash flows for the years then ended in accordance with accounting principles generally accepted in the United States of America.
Basis for Opinion
We conducted our audit in accordance with auditing standards generally accepted in the United States of America (GAAS). Our responsibilities under those standards are further described in the Auditor’s Responsibilities for the Audit of the Financial Statements section of our report. We are required to be independent of the Company and to meet our other ethical responsibilities in accordance with the relevant ethical requirements relating to our audits. We believe that the audit evidence we have obtained is sufficient and appropriate to provide a basis for our audit opinion.
Responsibilities of Management for the Consolidated Financial Statements
Management is responsible for the preparation and fair presentation of the consolidated financial statements in accordance with accounting principles generally accepted in the United States of America, and for the design, implementation, and maintenance of internal control relevant to the preparation and fair presentation of consolidated financial statements that are free from material misstatement, whether due to fraud or error.
In preparing the consolidated financial statements, management is required to evaluate whether there are conditions or events, considered in the aggregate, that raise substantial doubt about the Company’s ability to continue as a going concern within one year after the date that the consolidated financial statements are available to be issued.
Artesian CPA, LLC
1624 Market Street, Suite 202 | Denver, CO 80202
p: 877.968.3330 f: 720.634.0905
info@ArtesianCPA.com | www.ArtesianCPA.com
- 15 -
Auditor’s Responsibilities for the Audit of the Consolidated Financial Statements
Our objectives are to obtain reasonable assurance about whether the consolidated financial statements as a whole are free from material misstatement, whether due to fraud or error, and to issue an auditor’s report that includes our opinion. Reasonable assurance is a high level of assurance but is not absolute assurance and therefore is not a guarantee that an audit conducted in accordance with generally accepted auditing standards will always detect a material misstatement when it exists. The risk of not detecting a material misstatement resulting from fraud is higher than for one resulting from error, as fraud may involve collusion, forgery, intentional omissions, misrepresentations, or the override of internal control. Misstatements, including omissions, are considered material if there is a substantial likelihood that, individually or in the aggregate, they would influence the judgment made by a reasonable user based on the consolidated financial statements.
In performing an audit in accordance with generally accepted auditing standards, we:
| · | Exercise professional judgment and maintain professional skepticism throughout the audit. |
| · | Identify and assess the risks of material misstatement of the consolidated financial statements, whether due to fraud or error, and design and perform audit procedures responsive to those risks. Such procedures include examining, on a test basis, evidence regarding the amounts and disclosures in the consolidated financial statements. |
| · | Obtain an understanding of internal control relevant to the audit in order to design audit procedures that are appropriate in the circumstances, but not for the purpose of expressing an opinion on the effectiveness of the Company’s internal control. Accordingly, no such opinion is expressed. |
| · | Evaluate the appropriateness of accounting policies used and the reasonableness of significant accounting estimates made by management, as well as evaluate the overall presentation of the consolidated financial statements. |
| · | Conclude whether, in our judgment, there are conditions or events, considered in the aggregate, that raise substantial doubt about the Company’s ability to continue as a going concern for a reasonable period of time. |
We are required to communicate with those charged with governance regarding, among other matters, the planned scope and timing of the audit, significant audit findings, and certain internal control related matters that we identified during the audit.
/s/ Artesian CPA, LLC
Denver, Colorado
July 23, 2021
Artesian CPA, LLC
1624 Market Street, Suite 202 | Denver, CO 80202
p: 877.968.3330 f: 720.634.0905
info@ArtesianCPA.com | www.ArtesianCPA.com
- 16 -
VIRTUIX HOLDINGS, INC. AND SUBSIDIARIES
CONSOLIDATED BALANCE SHEETS
ASSETS
| March 31, | March 31, | |||||||
| 2021 | 2020 | |||||||
| CURRENT ASSETS | ||||||||
| Cash and cash equivalents | $ | 6,197,295 | $ | 152,376 | ||||
| Accounts receivable, trade | 195,861 | 236,741 | ||||||
| Inventory | 514,324 | 803,860 | ||||||
| Other receivables | 5,585 | 2,119 | ||||||
| Prepaids and other current assets | 218,351 | 219,200 | ||||||
| TOTAL CURRENT ASSETS | 7,131,416 | 1,414,296 | ||||||
| NONCURRENT ASSETS | ||||||||
| Property and equipment | 744,211 | 832,078 | ||||||
| Less: accumulated depreciation | (538,242 | ) | (479,134 | ) | ||||
| Net property and equipment | 205,969 | 352,944 | ||||||
| Intangibles | 648,137 | 583,647 | ||||||
| Less: accumulated amortization | (225,490 | ) | (126,172 | ) | ||||
| Net intangibles | 422,647 | 457,475 | ||||||
| Deferred tax asset (net of valuation allowance of $4,243,800 and $3,758,509 at March 31, 2021 and March 31, 2020, respectively) | - | - | ||||||
| TOTAL NONCURRENT ASSETS | 628,616 | 810,419 | ||||||
| TOTAL ASSETS | $ | 7,760,032 | $ | 2,224,715 | ||||
See Independent Auditor’s Report and the accompanying notes to the consolidated financial statements, which are an integral part of these consolidated financial statements.
- 17 -
VIRTUIX HOLDINGS, INC. AND SUBSIDIARIES
CONSOLIDATED BALANCE SHEETS
LIABILITIES AND STOCKHOLDERS' EQUITY (DEFICIT)
| March 31, | March 31, | |||||||
| 2021 | 2020 | |||||||
| CURRENT LIABILITIES | ||||||||
| Accounts payable | $ | 304,583 | $ | 685,748 | ||||
| Accrued expenses | 363,575 | 552,635 | ||||||
| Deferred revenue | 867,444 | 1,085,883 | ||||||
| Due to related party | 1,814 | 6,070 | ||||||
| Current portion of notes payable, net of discount and unamortized deferred loan costs | 26,875 | 3,025,554 | ||||||
| Current portion of EIDL loan | 331 | - | ||||||
| PPP loan | 177,067 | - | ||||||
| TOTAL CURRENT LIABILITIES | 1,741,689 | 5,355,890 | ||||||
| LONG-TERM LIABILITIES | ||||||||
| Notes payable, net of discount and unamortized deferred loan costs | - | 243,213 | ||||||
| EIDL loan, net of current portion | 24,669 | - | ||||||
| TOTAL LONG-TERM LIABILITIES | 24,669 | 243,213 | ||||||
| TOTAL LIABILITIES | 1,766,358 | 5,599,103 | ||||||
| STOCKHOLDERS' EQUITY (DEFICIT) | ||||||||
| Preferred stock, $.001 par value, 22,300,000 shares authorized, 17,005,722 and 11,973,733 shares issued and outstanding at March 31, 2021 and March 31, 2020, respectively, with liquidation preferences of $32,619,620 and $17,560,413, respectively, at March 31, 2021 and March 30, 2020 | 17,006 | 11,974 | ||||||
| Additional paid-in capital - preferred stock | 30,321,994 | 17,129,944 | ||||||
| Additional paid-in capital - preferred stock warrants | 184,428 | 184,428 | ||||||
| Common stock, $.001 par value, 30,000,000 shares authorized, 5,500,000 shares issued and outstanding at both March 31, 2021 and March 31, 2020 | 5,500 | 5,500 | ||||||
| Additional paid-in capital - common stock | 698,455 | 682,019 | ||||||
| Accumulated deficit | (25,233,709 | ) | (21,388,253 | ) | ||||
| TOTAL STOCKHOLDERS' EQUITY (DEFICIT) | 5,993,674 | (3,374,388 | ) | |||||
| TOTAL LIABILITIES AND STOCKHOLDERS' EQUITY (DEFICIT) | $ | 7,760,032 | $ | 2,224,715 | ||||
See Independent Auditor’s Report and the accompanying notes to the consolidated financial statements, which are an integral part of these consolidated financial statements.
- 18 -
VIRTUIX HOLDINGS, INC. AND SUBSIDIARIES
CONSOLIDATED STATEMENTS OF OPERATIONS
FOR THE YEARS ENDED MARCH 31, 2021 AND 2020
| 2021 | 2020 | |||||||
| NET SALES | $ | 2,103,090 | $ | 3,855,193 | ||||
| COST OF GOODS SOLD | 1,527,018 | 2,949,851 | ||||||
| GROSS PROFIT | 576,072 | 905,342 | ||||||
| OPERATING EXPENSES | ||||||||
| Selling expenses | 1,021,016 | 867,949 | ||||||
| General and administrative expenses | 1,986,185 | 2,148,696 | ||||||
| Research and development expenses | 764,511 | 805,042 | ||||||
| TOTAL OPERATING EXPENSES | 3,771,712 | 3,821,687 | ||||||
| LOSS FROM OPERATIONS | (3,195,640 | ) | (2,916,345 | ) | ||||
| OTHER INCOME (EXPENSE) | ||||||||
| Gain on extinguishment of debt | 178,056 | - | ||||||
| Loss on investment in joint venture | - | (44,549 | ) | |||||
| Interest income | 114 | 339 | ||||||
| Interest expense | (550,765 | ) | (610,173 | ) | ||||
| Interest expense – beneficial conversion discount | (248,888 | ) | - | |||||
| TOTAL OTHER INCOME (EXPENSE) | (621,483 | ) | (654,383 | ) | ||||
| PROVISION FOR INCOME TAX | ||||||||
| Enterprise income tax expense | - | 854 | ||||||
| Delaware franchise tax | 28,333 | 8,640 | ||||||
| TOTAL PROVISION FOR INCOME TAX | 28,333 | 9,494 | ||||||
| NET LOSS | $ | (3,845,456 | ) | $ | (3,580,222 | ) | ||
| Weighted average common shares outstanding: | ||||||||
| Basic and Diluted | 5,500,000 | 5,500,000 | ||||||
| Net loss per share: | ||||||||
| Basic and Diluted | $ | (0.70 | ) | $ | (0.65 | ) | ||
See Independent Auditor’s Report and the accompanying notes to the consolidated financial statements, which are an integral part of these consolidated financial statements.
- 19 -
VIRTUIX HOLDINGS, INC. AND SUBSIDIARIES
CONSOLIDATED STATEMENTS OF CHANGES IN STOCKHOLDERS' EQUITY (DEFICIT)
FOR THE YEARS ENDED MARCH 31, 2021 AND 2020
| Preferred Stock | Common Stock | |||||||||||||||||||||||||||||||
| Additional Paid-In | Additional Paid-In | Accumulated | ||||||||||||||||||||||||||||||
| Shares | Amount | Capital | Shares | Amount | Capital | Deficit | Total | |||||||||||||||||||||||||
| Balance at March 31, 2020 | 11,973,733 | $ | 11,974 | $ | 17,314,372 | 5,500,000 | $ | 5,500 | $ | 682,019 | $ | (21,388,253 | ) | $ | (3,374,388 | ) | ||||||||||||||||
| Preferred stock issuance | 3,680,727 | 3,681 | 11,023,791 | - | - | - | - | 11,027,472 | ||||||||||||||||||||||||
| Preferred stock offering costs | - | - | (914,470 | ) | - | - | - | - | (914,470 | ) | ||||||||||||||||||||||
| Conversion of notes payable | 1,326,304 | 1,326 | 2,833,866 | - | - | - | - | 2,835,192 | ||||||||||||||||||||||||
| Beneficial conversion features discounts | - | - | 248,888 | - | - | - | - | 248,888 | ||||||||||||||||||||||||
| Exercise of preferred stock warrant | 24,958 | 25 | (25 | ) | - | - | - | - | - | |||||||||||||||||||||||
| Stock-based compensation | - | - | - | - | - | 16,436 | - | 16,436 | ||||||||||||||||||||||||
| Net loss | - | - | - | - | - | - | (3,845,456 | ) | (3,845,456 | ) | ||||||||||||||||||||||
| Balance at March 31, 2021 | 17,005,722 | $ | 17,006 | $ | 30,506,422 | 5,500,000 | $ | 5,500 | $ | 698,455 | $ | (25,233,709 | ) | $ | 5,993,674 | |||||||||||||||||
| Preferred Stock | Common Stock | |||||||||||||||||||||||||||||||
| Additional Paid-In | Additional Paid-In | Accumulated | ||||||||||||||||||||||||||||||
| Shares | Amount | Capital | Shares | Amount | Capital | Deficit | Total | |||||||||||||||||||||||||
| Balance at March 31, 2019 | 10,574,627 | $ | 10,575 | $ | 14,053,057 | 5,500,000 | $ | 5,500 | $ | 648,949 | $ | (17,808,031 | ) | $ | (3,089,950 | ) | ||||||||||||||||
| Conversion of notes payable | 1,399,106 | 1,399 | 3,261,315 | - | - | - | - | 3,262,714 | ||||||||||||||||||||||||
| Stock-based compensation | - | - | - | - | - | 33,070 | - | 33,070 | ||||||||||||||||||||||||
| Net loss | - | - | - | - | - | - | (3,580,222 | ) | (3,580,222 | ) | ||||||||||||||||||||||
| Balance at March 31, 2020 | 11,973,733 | $ | 11,974 | $ | 17,314,372 | 5,500,000 | $ | 5,500 | $ | 682,019 | $ | (21,388,253 | ) | $ | (3,374,388 | ) | ||||||||||||||||
See Independent Auditor’s Report and the accompanying notes to the consolidated financial statements, which are an integral part of these consolidated financial statements.
- 20 -
VIRTUIX HOLDINGS, INC. AND SUBSIDIARIES
CONSOLIDATED STATEMENTS OF CASH FLOWS
FOR THE YEARS ENDED MARCH 31, 2021 AND 2020
| 2021 | 2020 | |||||||
| CASH FLOWS FROM OPERATING ACTIVITIES | ||||||||
| Net loss | $ | (3,845,456 | ) | $ | (3,580,222 | ) | ||
| Adjustments to reconcile net loss to net cash used in operating activities: | ||||||||
| Depreciation and amortization expense | 248,485 | 184,510 | ||||||
| Amortization of discount on notes payable | 83,842 | 66,072 | ||||||
| Stock-based compensation | 16,436 | 33,070 | ||||||
| Loss on disposal of assets | 3,672 | - | ||||||
| Loss on investment in joint venture | - | 44,549 | ||||||
| Gain on extinguishment of debt | (178,056 | ) | - | |||||
| Beneficial conversion feature discount | 248,888 | - | ||||||
| (Increase) decrease in assets: | ||||||||
| Prepaid expenses and other current assets | 849 | (60,475 | ) | |||||
| Accounts receivable | 40,880 | (141,504 | ) | |||||
| Other receivables | (3,462 | ) | 731 | |||||
| Inventory | 308,921 | (301,083 | ) | |||||
| Increase (decrease) in liabilities: | ||||||||
| Accounts payable | (381,165 | ) | 548,683 | |||||
| Accrued expenses | 184,580 | 556,147 | ||||||
| Deferred revenue | (218,439 | ) | 464,345 | |||||
| CASH USED IN OPERATING ACTIVITIES | (3,490,025 | ) | (2,185,177 | ) | ||||
| CASH FLOWS FROM INVESTING ACTIVITIES | ||||||||
| Cash paid for purchases of property and equipment, including intangibles | (88,527 | ) | (478,877 | ) | ||||
| CASH USED IN INVESTING ACTIVITIES | (88,527 | ) | (478,877 | ) | ||||
| CASH FLOWS FROM FINANCING ACTIVITIES | ||||||||
| Issuance of preferred stock | 11,027,472 | - | ||||||
| Offering costs | (914,470 | ) | - | |||||
| Proceeds from PPP loans | 354,134 | - | ||||||
| Proceeds from long-term notes payable - EIDL Loan | 25,000 | - | ||||||
| Payments on long-term notes payable | (669,458 | ) | (690,221 | ) | ||||
| Payments on short-term notes payable | (6,524 | ) | - | |||||
| Proceeds from long-term notes payable | - | 2,584,000 | ||||||
| Proceeds from convertible notes payable | 1,019,025 | - | ||||||
| Payments of promissory notes payable | (1,164,000 | ) | - | |||||
| Issuance costs of convertible notes payable | (43,452 | ) | - | |||||
| Due to related parties | (4,256 | ) | (10,192 | ) | ||||
| CASH PROVIDED BY FINANCING ACTIVITIES | 9,623,471 | 1,883,587 | ||||||
| NET INCREASE (DECREASE) IN CASH | 6,044,919 | (780,467 | ) | |||||
| CASH AT BEGINNING OF YEAR | 152,376 | 932,843 | ||||||
| CASH AT END OF YEAR | $ | 6,197,295 | $ | 152,376 | ||||
See Independent Auditor’s Report and the accompanying notes to the consolidated financial statements, which are an integral part of these consolidated financial statements.
- 21 -
VIRTUIX HOLDINGS, INC. AND SUBSIDIARIES
CONSOLIDATED STATEMENTS OF CASH FLOWS
FOR THE YEARS ENDED MARCH 31, 2021 AND 2020
| 2021 | 2020 | |||||||
| SUPPLEMENTAL DISCLOSURE OF CASH FLOW INFORMATION: | ||||||||
| Interest paid | $ | 355,436 | $ | 123,734 | ||||
| Enterprise income taxes paid to People's Republic of China | $ | - | $ | 854 | ||||
| Delaware franchise tax paid | $ | 28,333 | $ | 8,640 | ||||
| Transfer from property and equipment to inventory | $ | 19,385 | $ | 35,161 | ||||
| SUPPLEMENTAL DISCLOSURE OF NON-CASH FINANCING ACTIVITIES: | ||||||||
| Conversion of promissory notes to convertible notes | $ | 1,300,000 | $ | - | ||||
| Conversion of accrued interest on promissory notes to convertible notes | $ | 217,978 | $ | - | ||||
| Conversion of promissory notes to preferred stock | $ | 120,000 | $ | - | ||||
| Conversion of accrued interest on promissory notes to preferred stock | $ | 58,667 | $ | - | ||||
| Convertible notes converted to preferred stock | $ | 2,559,304 | $ | 2,999,742 | ||||
| Accrued interest on convertible notes converted to preferred stock | $ | 97,221 | $ | 262,972 | ||||
| Issuance of convertible promissory notes in lieu of compensation | $ | 22,301 | $ | - | ||||
| Exercise of preferred stock warrant | $ | 25 | $ | - | ||||
See Independent Auditor’s Report and the accompanying notes to the consolidated financial statements, which are an integral part of these consolidated financial statements.
- 22 -
Virtuix Holdings, Inc. and Subsidiaries
Notes to Consolidated Financial Statements
Note 1. Nature of Operations
Virtuix Holdings Inc. (“Virtuix Holdings” or the “Company”) was formed on December 20, 2013 as a Delaware Corporation. The Company has a wholly-owned subsidiary, Virtuix, Inc., a Delaware corporation formed on April 15, 2013. Virtuix, Inc. develops virtual reality hardware and software, primarily the Omni, the first virtual reality interface that allows users to move freely and naturally in video games and virtual worlds, and in February 2019, the VR ARENA, subsequently renamed the Omni Arena, a four-player esports attraction that includes four Omni motion platforms. On June 24, 2015, the Company acquired 10,000 shares of common stock of Virtuix Manufacturing, Limited (“VML”), a wholly-owned subsidiary. VML is a Hong Kong corporation that was formed to conduct manufacturing operations and transact USD-denominated business with suppliers. Virtuix Manufacturing (Zhuhai) Co., Ltd. (“VML_ZH”) was formed on July 28, 2016, and is a wholly-owned subsidiary of VML. VML_ZH is a Wholly Foreign-Owned Enterprise (“WFOE”) registered in Zhuhai, Guangdong, China that was formed to sell products to Chinese customers and transact CNY-denominated business with Chinese suppliers.
In July 2016, the Company formed a joint venture with Hero Entertainment, a Chinese game publisher and esports operator, to develop active virtual reality content and product bundles for the Chinese and U.S. markets. The joint venture, named Heroix VR (Shanghai) Co., Ltd. (the “Joint Venture” or “Heroix”), is a Sino-foreign equity joint venture company established under the laws of the People's Republic of China and registered in Shanghai. VML has 49% ownership and does not have control over the Joint Venture, therefore, the investment is accounted for using the equity method. In October 2016, the Joint Venture began operations.
In response to the public health crisis posed by the COVID-19 outbreak, effective on or about March 17, 2020, the Company continued to serve customers, although business operations were being affected by applicable regulatory restrictions, including stay-at-home requirements, temporary supply chain disruptions, and other temporary disruptions. The full impact of the COVID-19 outbreak continues to evolve as of the date of this report. As such, it is uncertain as to the full magnitude that the crisis will have on the Company’s financial condition, liquidity, and future results of operations. Management is actively monitoring the global situation on its financial condition, liquidity, operations, suppliers, industry, and workforce.
Note 2. Summary of Significant Accounting Policies
Principles of Consolidation
The accompanying consolidated financial statements include the accounts of Virtuix Holdings, Inc. as well as its subsidiaries required to be consolidated under accounting principles generally accepted in the United States of America (“GAAP”). Significant intercompany accounts and transactions have been eliminated upon consolidation.
Basis of Presentation
The consolidated financial statements are presented using the accrual basis of accounting, in U.S. dollars which is the Company’s functional currency. Therefore, revenues are recognized when earned and expenses are recognized when incurred.
The Company has adopted a fiscal year ending March 31st of each year.
Management's Estimates
Preparing the Company’s consolidated financial statements in conformity with GAAP requires management to make estimates and assumptions that affect reported amounts of assets and liabilities and disclosure of contingent assets and liabilities at the date of the consolidated financial statements and the reported amounts of revenues and expenses during the reporting period. Actual results could differ from those estimates.
- 23 -
Virtuix Holdings, Inc. and Subsidiaries
Notes to Consolidated Financial Statements
Note 2. Summary of Significant Accounting Policies (continued)
Revenue Recognition
Revenue is recognized upon transfer of control of promised products or services to customers in an amount that reflects the consideration we expect to receive in exchange for those products or services. The Company enters into contracts that can include various combinations of products and services, which are generally capable of being distinct and accounted for as separate performance obligations.
On April 1, 2019, the Company adopted Accounting Standards Update (“ASU”) 2014-09 Revenue from Contracts with Customers and all subsequent amendments to the ASU (collectively, “ASC 606”), which creates a single framework for recognizing revenue from contracts with customers that fall within its scope and revises when it is appropriate to recognize a gain (loss) from the transfer of nonfinancial assets. ASC 606 is applied using the full retrospective method, which requires a restatement of each prior reporting period presented. The majority of the Company's revenue arrangements generally consist of a single performance obligation to either transfer or install the promised goods, which is when an individual Omni and/or related accessories is shipped, or when an Omni Arena is installed at a customer location, at which time the title transfers to the customer. In conjunction with the Omni Arena contract, each customer is obligated to be enrolled in the Omni Care program, which is separate performance obligation. Such revenue is recognized over the life of the program. Based on the Company’s evaluation process and review of its contracts with customers, the timing and amount of revenue recognized previously for individual Omni units and their related accessories is consistent with how revenue is recognized under the new standard. For Omni Arenas, revenue recognition should occur upon installation at a customer’s location.
Revenue recognition under ASC 605 Multiple-Deliverable Revenue Arrangements applies to the sale of virtual goods in gaming industries. The Company began selling Omniverse credits in late fiscal year 2018, which are credits sold to customers for play time on the Omni units and Omni Arenas. The Company recognizes revenue over the period during which the operator is expected to be able to access and consume the benefits, which has been determined to be two months.
Cash and Cash Equivalents
The Company considers deposits that can be redeemed on demand and investments that have original maturities of less than three months, when purchased, to be cash equivalents. As of March 31, 2021 and March 31, 2020, the Company’s cash and cash equivalents were deposited primarily in four and three, respectively, financial institutions, which exceeded federally insured limits by $5,438,301 and $0, respectively. At March 31, 2021 and 2020, respectively, a bank overdraft in the amount of $0 and $66,321 is classified as a current liability. Cash and cash equivalents in the amount of $86,278 and $147,299, representing foreign deposits at financial institutions, are not insured by the Federal Deposit Insurance Corporation at March 31, 2021 and March 31, 2020, respectively.
Accounts Receivable
Terms of payment are generally thirty days from the invoice date. The collectability of amounts due from customer accounts requires the Company to make judgments regarding future events and trends. This process consists of a thorough review of historical collection experience, current aging status of the customer accounts, and financial condition of the Company's customers. The Company considers its receivables to be fully collectible, accordingly no allowance for doubtful accounts has been recorded. Accounts are charged to bad debt expense as they are determined to be uncollectible.
- 24 -
Virtuix Holdings, Inc. and Subsidiaries
Notes to Consolidated Financial Statements
Note 2. Summary of Significant Accounting Policies (continued)
Inventory Valuation
Inventory is stated at the lower of cost (first-in, first-out) or net realizable value in accordance with Topic 330, Inventory. Cost is computed using standard cost, which approximates actual cost. The Company applies net realizable value and obsolescence to the gross value of the inventory. The Company estimates net realizable value based on estimated selling price less further costs to completion and disposal. The Company impairs slow-moving products by comparing inventories on hand to projected demand. When impairments are established, a new cost basis of the inventory is created.
Property and Equipment
Property and equipment are recorded at cost, less accumulated depreciation. Expenditures for major additions and improvements are capitalized and minor replacements, maintenance, and repairs are charged to expense as incurred. When property and equipment are retired or otherwise disposed of, the cost and accumulated depreciation are removed from the accounts and any resulting gain or loss is included in the results of operations for the respective period. Depreciation is provided over the estimated useful lives of the related assets using the straight-line method for financial statement purposes. The Company uses other depreciation methods (generally accelerated) for tax purposes where appropriate.
The estimated useful lives for significant property and equipment categories are as follows:
| Computer Equipment | 5 years | |||
| Furniture and Fixtures | 7 years | |||
| Machinery and Equipment | 3 – 7 years | |||
| Office Equipment | 5 – 7 years |
Fair Value Measurements
The Company’s financial instruments consist primarily of cash, accounts receivable, prepaids, accounts payable, accrued expenses, and notes payable. The carrying amounts of such financial instruments approximate their respective estimated fair value due to the short-term maturities and approximate market interest rates of these instruments.
Financial Accounting Standards Board (“FASB”) guidance specifies a hierarchy of valuation techniques based on whether the inputs to those valuation techniques are observable or unobservable. Observable inputs reflect market data obtained from independent sources, while unobservable inputs reflect market assumptions. The hierarchy gives the highest priority to unadjusted quoted prices in active markets for identical assets or liabilities (Level 1 measurement) and the lowest priority to unobservable inputs (Level 3 measurement). The three levels of the fair value hierarchy are as follows:
| · | Level 1 - Unadjusted quoted prices in active markets for identical assets or liabilities that the reporting entity has the ability to access at the measurement date. Level 1 primarily consists of financial instruments whose value is based on quoted market prices such as exchange-traded instruments and listed equities. |
| · | Level 2 - Inputs other than quoted prices included within Level 1 that are observable for the asset or liability, either directly or indirectly (e.g., quoted prices of similar assets or liabilities in active markets, or quoted prices for identical or similar assets or liabilities in markets that are not active). |
| · | Level 3 - Unobservable inputs for the asset or liability. Financial instruments are considered Level 3 when their fair values are determined using pricing models, discounted cash flows or similar techniques and at least one significant model assumption or input is unobservable. |
- 25 -
Virtuix Holdings, Inc. and Subsidiaries
Notes to Consolidated Financial Statements
Note 2. Summary of Significant Accounting Policies (continued)
The carrying amounts reported in the consolidated balance sheets approximate their fair value.
Intangibles
The Company’s intangible assets represent software, trademarks, customer lists, and a website, which are amortized on a straight-line basis over the years expected to be benefited. The costs of developing any intangibles for internal use are expensed as incurred.
The estimated useful lives for significant intangible asset categories are as follows:
| Software | 3 - 5 years | |||
| Trademarks | 0 years | |||
| Customer Lists | 3 years | |||
| Website | 15 years |
Software Development Costs
The Company accounts for software development costs in accordance with several accounting pronouncements, including Topic 730, Research and Development, Topic 350-40, Internal-Use Software, Topic 985-20, Costs of Computer Software to be Sold, Leased, or Marketed and Topic 350-50, Website Development Costs.
Costs incurred during the period of planning and design, prior to the period determining technological feasibility, for all software developed for internal and external use, has been charged to operations in the period incurred as research and development costs. Additionally, costs incurred after determination of readiness for market have been expensed as research and development. The Company capitalizes certain costs in the development of its proprietary software (computer software to be sold, leased or licensed) for the period after technological feasibility was determined and prior to marketing and initial sales. Once technological feasibility is reached, such costs are capitalized and amortized to cost of revenue over the estimated lives of the products.
Website development costs have been capitalized, under the same criteria as marketed software.
Deferred Revenue
Deferred revenue represents revenues collected but not earned as of March 31, 2021 and 2020. This is primarily composed of pre-orders of the Omni that have not been completed by the end of the financial reporting period. Deferred revenue also includes pre-orders of Omni Arenas not yet installed, as well as Omniverse Credits and Omni Care pertaining to Omni Arena units installed as of March 31, 2021 and 2020, but for which revenue cannot yet be recognized. For the years ended March 31, 2021 and 2020, changes in deferred revenue were due to the following:
| 2021 | 2020 | |||||||
| Beginning deferred revenue | $ | 1,085,883 | $ | 621,538 | ||||
| Amounts deferred during the year | 1,228,786 | 3,784,335 | ||||||
| Less refunds | (24,198 | ) | (61,475 | ) | ||||
| Less revenue recognized | (1,423,027 | ) | (3,258,515 | ) | ||||
| Ending deferred revenue | $ | 867,444 | $ | 1,085,883 | ||||
- 26 -
Virtuix Holdings, Inc. and Subsidiaries
Notes to Consolidated Financial Statements
Note 2. Summary of Significant Accounting Policies (continued)
Deferred revenue as of March 31, 2021 and 2020 consists of the following:
| 2021 | 2020 | |||||||
| Omni units and accessories | $ | 497,903 | $ | 516,101 | ||||
| Omni Arena | 312,657 | 434,175 | ||||||
| Omniverse credits | 9,550 | 2,940 | ||||||
| Omni Care program | 47,334 | 132,667 | ||||||
| Total | $ | 867,444 | $ | 1,085,883 | ||||
As mentioned previously in Note 2, the Omni Care program is a separate performance obligation, for which revenue is recognized over the life of the program, which is generally twelve months. Therefore, amounts not yet recognized in revenue for the Omni Care program are included in deferred revenue.
Net Loss Per Share
Net loss per share is computed by dividing net loss by the weighted-average number of shares of common stock outstanding during the period, excluding shares subject to redemption or forfeiture. The Company presents basic and diluted earnings per share. Basic and diluted earnings per share reflect the actual weighted average of common shares issued and outstanding during the period. No dilutive effects were considered since the Company is in a net loss position as of March 31, 2021 and 2020. As a result, diluted loss per share is the same as basic loss per share for the periods presented.
Federal Income Taxes
Topic 740, Income Taxes, clarifies the accounting for income taxes by prescribing the minimum recognition threshold a tax position is required to meet before being recognized in the financial statements. Topic 740 also provides guidance on derecognition, measurement, classification, interest and penalties, accounting in interim periods, disclosure, and transition. For the years ended March 31, 2021 and 2020, no uncertain tax positions were identified. The Company recognizes tax related interest and penalties, if any, as a component of income tax expense.
The U.S. federal tax returns are subject to examination by the Internal Revenue Service, generally for three years after they are filed. State tax returns are subject to examination generally for five years after they are filed.
Recent Accounting Pronouncements
In February 2016, the FASB issued ASU 2016-02 Leases. ASU 2016-02 affects any entity that enters into a lease and is intended to increase the transparency and comparability of financial statements among organizations. The ASU requires, among other changes, a lessee to recognize on its balance sheet a lease asset and a lease liability for those leases previously classified as operating leases. The lease asset would represent the right to use the underlying asset for the lease term and the lease liability would represent the discounted value of the required lease payments to the lessor. The ASU would also require entities to disclose key information about leasing arrangements. ASU 2016-02 was effective beginning in 2020, and early adoption was permitted, however, on June 3, 2020, the FASB issued ASU 2020-05 providing an optional one-year deferral of the effective date of ASU 2016-02 to January 1, 2022. The Company is currently evaluating the impact that ASU 2016-02 and 2020-05 will have on its consolidated financial position, results of operations and disclosures.
- 27 -
Virtuix Holdings, Inc. and Subsidiaries
Notes to Consolidated Financial Statements
Note 2. Summary of Significant Accounting Policies (continued)
In January 2017, the FASB issued ASU 2017-04, Intangibles - Goodwill and Other (Topic 350), simplifying Accounting for Goodwill Impairment. ASU 2017-04 removes the requirement to perform a hypothetical purchase price allocation to measure goodwill impairment. A goodwill impairment will now be the amount by which a reporting unit’s carrying value exceeds its fair value, not to exceed the carrying amount of goodwill. ASU 2017-04 also addresses the cost of developing, maintaining, or restoring internally generated intangible assets, as well as financial statement presentation of intangible assets in the balance sheet, income statement, and disclosures in the notes to financial statements. The amendments in this update are effective for public entities for fiscal years, and interim periods within those fiscal years, beginning after December 15, 2020. For all other entities, the amendment is effective for fiscal years beginning after December 15, 2022, including interim periods within those fiscal years. The Company is currently evaluating the impact the adoption of ASU 2017-04 will have on its consolidated financial position, results of operations and disclosures.
In July 2018, the FASB issued ASU 2018-09, Codification Improvements, which makes updates for clarifications, technical corrections and other minor improvements to a wide variety of topics to make the ASC easier to understand and to apply. The transition and effective date is based on the facts and circumstances of each amendment with some amendments effective upon issuance. The remaining amendments are effective for annual periods beginning after December 15, 2019. The Company adopted the remaining applicable amendments within this guidance on April 1, 2020. In August 2018, the FASB issued ASU 2018-15, Intangibles — Goodwill and Other — Internal-Use Software (Subtopic 350-40): Customer’s Accounting for Implementation Costs Incurred in a Cloud Computing Arrangement that is a Service Contract. ASU 2018-15 requires a customer in a cloud computing arrangement that is a service contract to follow the internal-use software guidance in ASC 350-40 to determine which implementation costs to defer and recognize as an asset. The amendments in this update are effective for public entities for fiscal years, and interim periods within those fiscal years, beginning after December 15, 2019. For all other entities, the amendment is effective for fiscal years beginning after December 15, 2020, and interim periods within fiscal years beginning after December 15, 2021. The Company is still in the process of evaluating the new standard but expects it to be non-significant to the consolidated financial statements. The Company has not early adopted this standard.
In August 2020, the FASB issued ASU 2020-06, Accounting for Convertible Instruments and Contracts in an Entity’s Own Equity, as part of its overall simplification initiative to reduce costs and complexity of applying accounting standards while maintaining or improving the usefulness of the information provided to users of financial statements. Among other changes, the new guidance removes from GAAP separation models for convertible debt that require the convertible debt to be separated into a debt and equity component, unless the conversion feature is required to be bifurcated and accounted for as a derivative or the debt is issued at a substantial premium. As a result, after adopting the guidance, entities will no longer separately present such embedded conversion features in equity and will instead account for the convertible debt wholly as debt. The new guidance also requires use of the “if-converted” method when calculating the dilutive impact of convertible debt on earnings per share, which is consistent with the Company’s current accounting treatment under the current guidance. The guidance is effective for financial statements issued for fiscal years beginning after December 15, 2021, and interim periods within those fiscal years, with early adoption permitted, but only at the beginning of the fiscal year. The Company is currently evaluating the impact the adoption of ASU 2020-06 will have on its consolidated financial position, results of operations and disclosures.
Management does not believe that any recently issued, but not yet effective, accounting standards could have a material effect on the accompanying consolidated financial statements. As new accounting pronouncements are issued, the Company will adopt those that are applicable under the circumstances.
- 28 -
Virtuix Holdings, Inc. and Subsidiaries
Notes to Consolidated Financial Statements
Note 2. Summary of Significant Accounting Policies (continued)
Foreign Currency Remeasurements
The non-U.S. subsidiary, VML, and its wholly-owned subsidiary, VML_ZH, operate using the U.S. dollar as the functional currency. The effect of foreign currency exchange rates on consolidated balance sheet accounts was not material for the years ended March 31, 2021 and 2020.
Convertible Instruments
GAAP requires companies to bifurcate conversion options from their host instruments and account for them as free standing derivative financial instruments according to certain criteria. The criteria include circumstances in which (a) the economic characteristics and risks of the embedded derivative instrument are not clearly and closely related to the economic characteristics and risks of the host contract, (b) the hybrid instrument that embodies both the embedded derivative instrument and the host contract is not re-measured at fair value under otherwise applicable generally accepted accounting principles with changes in fair value reported in earnings as they occur and (c) a separate instrument with the same terms as the embedded derivative instrument would be considered a derivative instrument. An exception to this rule is when the host instrument is deemed to be conventional as that term is described under applicable GAAP.
When the Company has determined that the embedded conversion options should not be bifurcated from their host instruments, the Company records, when necessary, discounts to convertible notes for the intrinsic value of conversion options embedded in debt instruments based upon the differences between the fair value of the underlying common stock at the commitment date of the note transaction and the effective conversion price embedded in the note. Debt discounts under these arrangements are amortized over the term of the related debt to their stated date of redemption. The Company also records, when necessary, deemed dividends for the intrinsic value of conversion options embedded in preferred shares based upon the differences between the fair value of the underlying common stock at the commitment date of the transaction and the effective conversion price embedded in the preferred shares.
Beneficial Conversion Features
Accounting for Convertible Notes and Securities with Beneficial Conversion Features Convertible debt is accounted for under the guidelines established by ASC 470-20, Debt with Conversion and Other Options. ASC 470-20 governs the calculation of an embedded beneficial conversion, which is treated as an additional discount to the instruments where derivative accounting does not apply. The amount of the beneficial conversion feature may reduce the carrying value of the instrument. The discounts relating to the initial recording of the derivatives or beneficial conversion features are accreted over the term of the debt. When beneficial conversion features are based on a future contingent event, the beneficial conversion feature is deferred and recorded at the time when the contingency no longer exists.
Note 3. Inventory
Inventory consisted of the following as of:
| March 31, | March 31, | |||||||
| 2021 | 2020 | |||||||
| Raw Materials | $ | 418,030 | $ | 652,267 | ||||
| Work In Process | 5,959 | 37,115 | ||||||
| Finished Goods | 90,335 | 114,478 | ||||||
| $ | 514,324 | $ | 803,860 | |||||
- 29 -
Virtuix Holdings, Inc. and Subsidiaries
Notes to Consolidated Financial Statements
Note 4. Property and Equipment
Property and equipment consist of the following as of:
| March 31, | March 31, | |||||||
| 2021 | 2020 | |||||||
| Computer Equipment | $ | 37,430 | $ | 61,789 | ||||
| Furniture and Equipment | 29,858 | 28,808 | ||||||
| Machinery and Equipment | 676,923 | 740,433 | ||||||
| Office Equipment | - | 1,048 | ||||||
| 744,211 | 832,078 | |||||||
| Less Accumulated Depreciation | (538,242 | ) | (479,134 | ) | ||||
| $ | 205,969 | $ | 352,944 | |||||
For the years ended March 31, 2021 and 2020, the Company has recorded depreciation expense in the consolidated statements of operations of $143,463 and $120,114, respectively.
Note 5. Intangibles
Intangible assets consist of the following as of:
| March 31, | March 31, | |||||||
| 2021 | 2020 | |||||||
| Software and game design | $ | 515,328 | $ | 450,838 | ||||
| Trademarks | 38,879 | 38,879 | ||||||
| Website | 88,930 | 88,930 | ||||||
| Customer List | 5,000 | 5,000 | ||||||
| 648,137 | 583,647 | |||||||
| Less Accumulated Amortization | (225,490 | ) | (126,172 | ) | ||||
| $ | 422,647 | $ | 457,475 | |||||
For the years ended March 31, 2021 and 2020, the Company has recorded amortization expense in the consolidated statements of operations of $105,022 and $64,396, respectively.
Note 6. Notes Payable
Effective January 1, 2017, the Company entered into an agreement to obtain financing with WTI. The initial commitment of $1,500,000 was received on February 1, 2017. Terms of the note were interest-only payments through January 31, 2018, followed by thirty months of principal and interest payments which began on February 1, 2018 in the amount of $56,829, and matured on August 1, 2020. The note had a fixed rate of interest of 10.99% and was secured by all assets of the Company.
The Company had granted warrants associated with 2017 debt to acquire shares of Series A-1 Preferred Stock (formerly Series A Preferred Stock – see Note 9), which according to Topic 470-20, Debt, such warrants were recorded in equity as additional paid-in capital - preferred stock warrants, at fair value as of the date of issuance, and in liabilities, as a contra account, called discount on note payable, which was amortized over the life of the note. As of August 1, 2020, the warrants were fully amortized.
- 30 -
Virtuix Holdings, Inc. and Subsidiaries
Notes to Consolidated Financial Statements
Note 6. Notes Payable (continued)
The fair value of Series A-1 Preferred Stock warrants associated with 2017 debt as of their issuance date was determined to be $46,846 using the Black-Scholes model with the following assumptions.
| Exercise Price | $ | 0.65 | ||
| Dividend Yield | 0.00 | % | ||
| Volatility | 31.80 | % | ||
| Risk-free Rate | 2.10 | % | ||
| Expected life (years) | 5 |
Prior to August 1, 2020, the discount was being amortized over the life of the note using the effective interest method. The carrying value of the note at March 31, 2021 and 2020, respectively, was $0 and $239,793 ($241,448 principal, less unamortized deferred loan costs of $955 and discount of $700). Discount amortization and amortization of loan costs included in interest expense was $1,655 and $10,343 for the years ended March 31, 2021 and 2020, respectively. Interest expense on the note was $5,825 and $63,939 for the years ended March 31, 2021 and 2020, respectively.
Effective November 1, 2018, the Company entered into an agreement to obtain financing with WTI. The initial commitment of $500,000 was received on November 13, 2018. Terms of the note were interest-only payments through October 1, 2019, followed by thirty months of principal and interest payments beginning November 1, 2019 in the amount of $19,211, due on April 1, 2022. The note had a fixed rate of interest of 12.25% and was secured by all assets of the Company. On March 15, 2021, the Company paid off the outstanding balance of the note.
The Company had granted warrants associated with 2018 debt to acquire shares of Series A-1 Preferred Stock. As of March 15, 2021, the warrants were fully amortized. The fair value of Series A-1 Preferred Stock warrants associated with 2018 debt as of their issuance date was determined to be $23,606 using the Black-Scholes model with the following assumptions.
| Exercise Price | $ | 0.65 | ||
| Dividend Yield | 0.00 | % | ||
| Volatility | 31.80 | % | ||
| Risk-free Rate | 3.05 | % | ||
| Expected Years | 5 |
Prior to March 15, 2021, the discount was being amortized over the life of the note using the effective interest method starting in January 2019. The carrying value of the note at March 31, 2021 and 2020, respectively, was $0 and $411,575 ($428,009 principal, less unamortized deferred loan costs of $5,949 and discount of $10,485). Discount amortization and amortization of loan costs included in interest expense was $16,435 and $13,504 for the years ended March 31, 2021 and 2020, respectively. Interest expense on the note was $52,276 and $59,795 for the years ended March 31, 2021 and 2020, respectively.
The Company issued subordinated unsecured convertible promissory notes (the “Convertible Notes”) amounting to $2,999,742 between April and September 2018. Interest accrued at 6% until the notes matured on December 31, 2019. These Convertible Notes were convertible into shares of preferred stock of the Company in connection with a qualified financing or, in certain circumstances, into shares of the Company’s Series A-1 Preferred Stock. The unpaid principal and interest on these notes were not converted prior to December 31, 2019, and therefore all principal and interest converted on January 1, 2020 to shares of Series A-1 Preferred Stock of the Company, having the same terms as the Company’s Series A-1 Preferred Stock at a price per share equal to $2.332. The Company set aside and reserved for the issuance upon the potential conversion of the principal and accrued interest on the notes, 1,425,000 shares of Series A-1 Preferred Stock. On January 1, 2020 $262,972 of accrued interest and $2,999,742 of principal was converted into 1,399,106 shares of Series A-1 Preferred Stock. Interest expense on the Convertible Notes was $0 and $135,605 for the years ended March 31, 2021 and 2020, respectively.
- 31 -
Virtuix Holdings, Inc. and Subsidiaries
Notes to Consolidated Financial Statements
Note 6. Notes Payable (continued)
On May 31, 2019, the Company received consent of the board to raise $1,500,000 of subordinated promissory notes (“Subordinated Promissory Notes”). This consent was later amended to extend the financing to $2,250,000 on September 23, 2019. The Company also received consent of the board to raise an additional $500,000 of Subordinated Promissory Notes on January 24, 2020. From May 2019 through March 2020, the Company raised $2,584,000 through various investors with an interest rate of 18%. The principal of these Subordinated Promissory Notes matured and was payable with all accrued interest on July 31, 2020 and could, at the Company’s sole discretion, be extended for up to two additional six month periods. The first extension period ran through January 31, 2021, and the second would run through July 31, 2021. On April 15, 2020 the Company resolved to raise additional financing under a note purchase agreement (the “Purchase Agreement”) dated April 16, 2020, with investors, in the maximum aggregate amount of $2,000,000, through the issuance of subordinated convertible promissory notes (the “2020 Convertible Notes”). From April 2020 through August 2020, the Company converted $217,978 of accrued interest and $1,300,000 of principal from the Subordinated Promissory Notes into the 2020 Convertible Notes. From January 2021 through March 2021, the Company converted $58,667 of accrued interest and $120,000 of principal from the Subordinated Promissory Notes into 59,635 shares of Series A-2 Preferred Stock (see Note 9). On March 15, 2021, the Company paid the balance of $297,654 of accrued interest and $1,164,000 of principal to investors. Interest expense on the Subordinated Promissory Notes was $290,772 and $283,195 for the years ended March 31, 2021 and 2020, respectively.
On August 25, 2020, the Purchase Agreement was amended to increase the 2020 Convertible Notes financing to a maximum amount of $3,000,000. The 2020 Convertible Notes were convertible into shares of Preferred Stock of the Company in connection with a qualified or other financing or, in certain circumstances, into shares of the Company’s Series A-1 Preferred Stock. The 2020 Convertible Notes contained a beneficial conversion feature, a 30% conversion discount, based on a future contingent event. The Company had set aside and reserved for the issuance upon the potential conversion of these notes, 950,000 shares of Series A-1 Preferred Stock. From April 2020 through August 2020, the Company issued $2,559,304 of 2020 Convertible Notes to various investors with an interest rate of 8%, comprised of $1,041,326 of new issuances and $1,517,978 of converted Subordinated Promissory Notes. The principal of the 2020 Convertible Notes was to mature and was payable with all accrued interest on December 31, 2020. On December 30, 2020, the Company converted $97,221 of accrued interest and $2,559,304 of principal from the 2020 Convertible Notes into 1,266,669 shares of Series A-2 Preferred Stock (see Note 9). A $248,888 discount on beneficial conversion feature was recorded to interest expense and additional paid-in capital on this conversion, which resolved the contingency on the 30% conversion discount. Interest expense on the 2020 Convertible Notes was $97,221 and $0 for the years ended March 31, 2021 and 2020, respectively.
Pursuant to the Paycheck Protection Program (the “PPP”) under Division A, Title I of the Coronavirus Aid, Relief, and Economic Security (“CARES”) Act, which was enacted March 27, 2020,
the Company was granted a loan (the “PPP Loan”) from Bank of Houston, N.A. in the amount of $177,067, on April 13, 2020. The PPP Loan was expected to mature in April 2022 and had an interest rate of 1.00% per year, and was payable monthly beginning ten months after the covered period ends, in accordance with terms of the PPP. The PPP Loan could be prepaid at any time prior to maturity with no prepayment penalties. Funds from the PPP Loan could only be used for payroll costs, costs used to continue group health care benefits, mortgage payments, rent, utilities, and interest on other debt obligations incurred before February 15, 2020. Under the terms of the PPP, certain amounts of the PPP Loan could be forgiven if they were used for qualifying expenses as described in the CARES Act. On November 6, 2020, the Company was granted forgiveness of its PPP loan. Interest expense on the PPP Loan was $989 for the year ended March 31, 2021. Principal and accrued interest in the amount of $178,056 was reclassified to gain on extinguishment of debt, which is included in other income in the consolidated statements of operations for the year ended March 31, 2021.
- 32 -
Virtuix Holdings, Inc. and Subsidiaries
Notes to Consolidated Financial Statements
Note 6. Notes Payable (continued)
On January 28, 2021, the Company was granted a second loan (the “Second PPP Loan”) from Bank of Houston, N.A. in the amount of $177,067, pursuant to the PPP under Division A, Title I of the CARES Act. The Second PPP Loan is set to mature in January 2026 and bears interest at a rate of 1.00% per year. It is classified as a current liability in the Company’s consolidated balance sheets as full loan forgiveness is expected in fiscal year 2022. Interest expense on the Second PPP Loan was $314 for the year ended March 31, 2021.
On August 29, 2020, the Company received a loan from the U.S. Small Business Administration under its Economic Injury Disaster Loan assistance program (the “EIDL Loan”) in light of the impact of the COVID-19 pandemic on the Company’s business. The principal amount of the EIDL Loan was $25,000, with proceeds to be used for working capital purposes. The EIDL Loan is expected to mature in August 2050, bears interest at a rate of 3.75% per year, and is payable monthly beginning in August 2021. Interest expense on the Loan was $524 for the year ended March 31, 2021.
Amounts included current portion of notes payable pertaining to insurance financing was $26,875 and $33,399 at March 31, 2021 and 2020, respectively. Interest expense on these short-term notes payable was $1,388 and $1,977 for the years ended March 31, 2021 and 2020, respectively.
Future maturities of notes payable are as follows as of March 31:
| Principal | |||||
| 2022 | $ | 204,273 | |||
| 2023 | 513 | ||||
| 2024 | 532 | ||||
| 2025 | 552 | ||||
| 2026 | 573 | ||||
| Thereafter | 22,499 | ||||
| $ | 228,942 | ||||
Note 7. Research and Development
Expenses relating to research and development are expensed as incurred. Research and development includes costs such as design expenses, game and software development expenses, salaries, prototypes, and various other research and development expenses.
Note 8. Royalty Commitments
The Company has certain royalty commitments associated with the shipment of its products for the use of licensed software and modifications together with the Company’s hardware and other software. Royalty expense is generally based on a dollar amount per unit shipped and can range from $1 per unit to $8 per unit. For the years ended March 31, 2021 and 2020, management has recorded royalty expense in the consolidated statements of operations of $1,048 and $2,816, respectively.
- 33 -
Virtuix Holdings, Inc. and Subsidiaries
Notes to Consolidated Financial Statements
Note 9. Capital Stock
Effective May 6, 2015, the number of shares of $.001 par value common stock (“Common Stock”) authorized increased from 15,000,000 shares to 16,000,000 shares, and the Company also increased its authorized $.001 par value Series Seed Preferred Stock (the “Preferred Stock”) from 7,000,000 shares to 8,300,000 shares.
Effective March 9, 2016, the number of shares of Common Stock authorized increased from 16,000,000 shares to 23,000,000 shares, and the Company also increased its authorized Preferred Stock to 15,300,000 shares. The Preferred Stock is designated as 4,000,000 shares of Series Seed Preferred Stock, 4,300,000 shares of Series 2 Seed Preferred Stock, and 7,000,000 shares of Series A Preferred Stock.
As mentioned in Note 6, the Convertible Notes and related accrued interest were converted into 1,399,106 shares of Series A-1 Preferred Stock on January 1, 2020. On December 30, 2020, the 2020 Convertible Notes and accrued interest were converted into 1,266,669 shares of Series A-2 Preferred Stock. A $248,888 discount on beneficial conversion feature was recorded to interest expense and additional paid-in capital on this conversion, which resolved the contingency on the 30% conversion discount. From January 2021 through March 2021, the Company converted certain of the Subordinated Promissory Notes and accrued interest into 59,635 shares of Series A-2 Preferred Stock for a total conversion of notes payable to 1,326,304 shares of A-2 Preferred Stock.
On September 23, 2020, under the Fourth Amended and Restated Certificate of Incorporation of the Corporation, the number of shares of Common Stock authorized increased from 23,000,000 shares to 28,000,000 shares, and the Company also increased the number of shares of Preferred Stock authorized from 15,300,000 to 20,300,000 shares. The Preferred Stock is designated as 4,000,000 shares of Series Seed Preferred Stock, 4,300,000 shares of Series 2 Seed Preferred Stock, 7,000,000 shares of Series A-1 Preferred Stock, and 5,000,000 shares of a new class of Preferred Stock, designated as Series A-2 Preferred Stock. All shares of Preferred Stock that had been designated as Series A Preferred Stock of the Corporation under the Third Amended and Restated Certificate of Incorporation of the Corporation, including all shares of Series A Preferred Stock of the Corporation issued and outstanding immediately prior to such filing, were reconstituted and re-designated as shares of Series A-1 Preferred Stock effective September 23, 2020.
Effective October 14, 2020, the number of shares of Common Stock authorized increased from 28,000,000 shares to 30,000,000 shares, and the Company also increased its authorized Preferred Stock to 22,300,000. The Preferred Stock is designated as 4,000,000 shares of Series Seed Preferred Stock, 4,300,000 shares of Series 2 Seed Preferred Stock, 7,000,000 shares of Series A-1 Preferred Stock, and 7,000,000 shares of Series A-2 Preferred Stock.
Effective December 17, 2020, the Company was qualified by the Securities and Exchange Commission to offer up to 5,006,675 shares of its Preferred Stock (designated as Series A-2 Preferred Stock) to accredited and non-accredited investors in a Regulation A offering. On or about March 15, 2021, the Company was authorized to offer up to 726,655 shares of Series A-2 Preferred Stock to accredited investors in a Regulation D Offering. As of March 31, 2021, $11,027,472 of Series A-2 Preferred Stock subscriptions were closed and 3,680,727 shares were issued.
Dividend Rights
Holders of Preferred Stock are entitled to receive dividends, as may be declared from time to time by the board of directors out of legally available funds. Those dividends are paid ratably to the holders of Common Stock and Preferred Stock based on the number of shares of Common Stock which would be held by each stockholder if all of the Preferred Stock was converted to Common Stock under the terms of the Company's Fourth Amended and Certificate of Incorporation. The Company has never declared or paid cash dividends on any of its capital stock and currently does not anticipate paying any cash dividends after this offering or in the foreseeable future.
- 34 -
Virtuix Holdings, Inc. and Subsidiaries
Notes to Consolidated Financial Statements
Note 9. Capital Stock (continued)
Voting Rights
Each holder of Preferred Stock is entitled to one vote for each share of Common Stock which would be held by each stockholder if all of the Preferred Stock was converted into Common Stock. Fractional votes are not permitted and if the conversion results in a fractional share, it will be rounded to the closest whole number. Holders of Preferred Stock are entitled to vote on all matters submitted to a vote of the stockholders, including the election of directors, as a single class with the holders of Common Stock. Specific matters submitted to a vote of the stockholders require the approval of a majority of the holders of Preferred Stock voting as a separate class.
These matters include any vote to:
| · | Amend or repeal of any provision of the Certificate of Incorporation or Bylaws if the action would alter, change or otherwise adversely affect the powers, preferences, or privileges, of any series of the Preferred Stock; |
| · | Increase or decrease the authorized number of shares of Preferred Stock or Common Stock; |
| · | Authorize any new, or reclassify any existing class or series of equity securities with rights superior to or on par with any series of Preferred Stock; |
| · | Redeem, repurchase, or otherwise acquire for value any shares of Common Stock or Preferred Stock other than certain allowable repurchases; |
| · | Declare a dividend or distribute cash or property to holders of Common Stock; and |
| · | Liquidate, dissolve, or windup the business, or effect any merger or consolidation of the Company. |
Right to Receive Liquidation Distributions
In the event of the Company's liquidation, dissolution, or winding up, holders of its Preferred Stock are entitled to a liquidation preference superior to the Common Stock. Holders of Preferred Stock will receive an amount for each share equal to the original price paid for the shares plus any declared but unpaid dividends thereon. If, upon such liquidation, dissolution or winding up, the assets and funds that are distributable to the holders of Preferred Stock are insufficient to permit the payment to such holders of the full amount of their respective liquidation preference, then all of such assets and funds will be distributed ratably among the holders of the Preferred Stock in proportion to the full preferential amounts to which they would otherwise be entitled to receive.
The Preferred Stock has liquidation preferences of $0.80 per share, $1.05 per share, $2.332, and $2.996 per share for the Series Seed Preferred Stock, Series 2 Seed Preferred Stock, Series A-1 Preferred Stock, and Series A-2 Preferred Stock, respectively. The total liquidation preference on all Preferred Stock as of March 31, 2021 and 2020 was $32,619,620 and $17,560,473, respectively.
Terms of Conversion
The Preferred Stock of Virtuix Holdings Inc. is convertible into the Common Stock of the Company as provided by Section 4.3 of the Fourth Amended and Restated Certificate of Incorporation. Each share of Preferred Stock is convertible at the option of the holder of the share as any time after issuance and prior to the closing of any transaction that constitutes liquidation event of the Company. The conversion price of the Preferred Stock is equal to the issue price subject to adjustment as discussed under Anti-Dilution Rights below.
Additionally, each share of the Preferred Stock will automatically convert into the Common Stock of the Company immediately prior to the closing of a firm commitment underwritten public offering, registered under the Securities Act of 1933, in which the aggregate gross proceeds raised are at least $40 million. The shares will convert in the same manner as the voluntary conversion.
- 35 -
Virtuix Holdings, Inc. and Subsidiaries
Notes to Consolidated Financial Statements
Note 9. Capital Stock (continued)
Anti-Dilution Rights
Holders of Preferred Stock will receive certain antidilution protective provisions that will be applied to adjust the number of shares of Common Stock issuable upon conversion of the shares of the respective series of Preferred Stock.
If equity securities are subsequently issued by the Company at a price per share less than the conversion price of the Preferred Stock then in effect, the conversion price of the Preferred Stock will be adjusted using a broad-based, weighted-average adjustment formula as provided for in the Fourth Amended and Restated Certificate of Incorporation.
Outstanding Stock
At both March 31, 2021 and March 31, 2020, total outstanding Common Stock was 5,500,000; total outstanding Series Seed Preferred Stock was 3,750,000; and total outstanding Series Seed 2 Preferred Stock was 3,601,709. Total outstanding Series A-1 Preferred Stock was 4,646,982 and 4,622,024 at March 31, 2021 and 2020, respectively. Total outstanding Series A-2 Preferred Stock was 5,007,031 and 0 at March 31, 2021 and 2020, respectively.
Effective September 23, 2020, the Company authorized an additional 500,000 shares of Common Stock to be set aside and reserved for issuance pursuant to the Long Term Incentive Plan. As of March 31, 2021, the Company has reserved 24,800,000 shares of its authorized but unissued Common Stock for possible future issuance in connection with the following:
| Shares | ||||
| Long Term Incentive Plan | 2,500,000 | |||
| Conversion of Preferred Stock | 21,951,662 | |||
| Exercise of stock warrants | 348,338 | |||
Warrants
Warrants are issued in connection with equity from time to time at the Company’s discretion.
As of March 31, 2021, the Company had warrants exercisable into 156,250 shares of Series Seed Preferred Stock and 192,088 shares of Series A-1 Preferred Stock, for a total of 348,338 shares of Preferred Stock. In March 2021, a warrant for 112,612 warrant shares was exercised, for which the Company issued 24,958 shares of Series A-1 Preferred Stock. As of March 31, 2020, the Company had warrants exercisable into 156,250 shares of Series Seed Preferred Stock and 304,700 shares of Series A-1 Preferred Stock, for a total of 460,950 shares of Preferred Stock. The warrants are all exercisable as of both March 31, 2021 and March 31, 2020. The warrants have a weighted average exercise price of $1.64 per share, with a weighted average remaining term to expiration of 4.6 years.
According to guidance of Topic 470-20, these warrants are recorded in equity as additional paid-in capital – preferred stock warrants, at fair value as of the date of issuance, and as a reduction of additional paid in capital - preferred stock for the related stock purchased.
Note 10. Stock Options
The Company accounts for stock-based compensation under the provisions of Topic 718, Compensation – Stock Compensation, which requires the measurement and recognition of compensation expense for all share-based payment awards made to employees and non-employee officers based on estimated fair values as of the date of grant. Compensation expense is recognized on a straight-line basis over the requisite service period.
- 36 -
Virtuix Holdings, Inc. and Subsidiaries
Notes to Consolidated Financial Statements
Note 10. Stock Options (continued)
As mentioned in Note 9, the Company has a stock-based employee compensation plan, the Long Term Incentive Plan (the “Plan”), for which 2,500,000 shares of common stock are reserved for issuance under the Plan. Awards granted under the Plan typically expire ten years after the grant date. At March 31, 2021, 647,992 shares were available for issuance under the Plan.
Incentive Stock Options (“ISOs”) are granted to certain employees of Virtuix, Inc. from time to time. As of both March 31, 2021 and March 31, 2020, 1,245,823 ISO options were granted. As of March 31, 2021 and March 31, 2020, respectively, 335,508 and 286,446 ISO options were vested. As of March 31, 2021 and March 31, 2020, 810,315 ISO options were forfeited.
The board of directors of the Company has granted three non-qualified stock options (“NQSOs”) for a total of 1,182,030 shares, with an exercise price of $0.11 per share, to certain independent contractors and advisors of Virtuix, Inc.
From time to time, the Company grants NQSOs to various other non-employees with exercise prices based on current stock valuations. As of March 31, 2021 and March 31, 2020, 1,529,000 NQSO options had been granted, and 1,411,500 and 1,314,625 NQSO options, respectively, were vested. As of March 31, 2021 and March 31, 2020, 112,500 NQSO options were forfeited.
Compensation expense pertaining to ISOs of $11,334 and $16,753, and compensation expense pertaining to NQSOs of $5,102 and $16,317 was recorded for the years ended March 31, 2021 and 2020, respectively, in general and administrative expenses in the consolidated statements of operations.
Total compensation cost related to non-vested awards not yet recognized as of March 31, 2021 was $11,737 and will be recognized over a weighted-average period of approximately 15 months.
The amount of future stock option compensation expense could be affected by any future option grants or by option holders leaving the Company before their grants are fully vested or exercised. Determining the appropriate fair value of stock-based awards requires the input of subjective assumptions, including the fair value of the Company’s common stock, and for stock options, the expected life of the option, and expected stock price volatility. The Company used the Black-Scholes option pricing model to value its stock option awards. The assumptions used in calculating the fair value of stock-based awards represent management’s best estimates and involve inherent uncertainties and the application of management’s judgment. As a result, if factors change and management uses different assumptions, stock-based compensation expense could be materially different for future awards.
The expected life of stock options was estimated using the “simplified method,” which is the midpoint between the vesting date and the end of the contractual term, as the Company has limited historical information to develop reasonable expectations about future exercise patterns and employment duration for its stock options grants. The simplified method is based on the average of the vesting tranches and the contractual life of each grant. For stock price volatility, the Company uses comparable public companies as a basis for its expected volatility to calculate the fair value of options grants. The risk-free interest rate is based on U.S. Treasury notes with a term approximating the expected life of the option. The estimation of the number of stock awards that will ultimately vest requires judgment, and to the extent actual results or updated estimates differ from the Company’s current estimates, such amounts are recognized as an adjustment in the period in which estimates are revised.
- 37 -
Virtuix Holdings, Inc. and Subsidiaries
Notes to Consolidated Financial Statements
Note 10. Stock Options (continued)
The assumptions utilized in determining the fair value of option grants during the years ended March 31, 2021 and 2020 are as follows:
| 2021 | 2020 | |||||||
| Exercise Price - ISOs | N/A | $ | 0.70 | |||||
| Exercise Price - NQSOs | N/A | $ | 0.70 | |||||
| Dividend Yield | N/A | 0.00 | % | |||||
| Volatility | N/A | 54.40 | % | |||||
| Risk-free Rate - ISOs | N/A | 1.78 | % | |||||
| Risk-free Rate - NQSOs | N/A | 1.78 | % | |||||
| Years to Expiration - ISOs | N/A | 6.25 | ||||||
| Years to Expiration - NQSOs | N/A | 6.25 | ||||||
Vesting generally occurs over a period of three to four years for employees and two to three years for non-employee consultants. A summary of information related to stock options as of March 31, 2021 and 2020, is as follows:
| 2021 | 2020 | |||||||||||||||
| Shares | Price | Shares | Price | |||||||||||||
| Outstanding - beginning of period | 1,852,008 | $ | 0.26 | 1,817,008 | $ | 0.26 | ||||||||||
| Granted | - | - | 40,000 | .70 | ||||||||||||
| Exercised | - | - | - | - | ||||||||||||
| Forfeited | - | - | (5,000 | ) | .65 | |||||||||||
| Outstanding - end of period | 1,852,008 | $ | 0.26 | 1,852,008 | $ | 0.26 | ||||||||||
| Exercisable at end of period | 1,747,008 | $ | 0.24 | 1,601,071 | $ | 0.19 | ||||||||||
| Weighted average duration to expiration of outstanding options at period-end (years) | 4.1 | 5.2 | ||||||||||||||
| Weighted average grant date fair value | N/A | $ | 0.24 | |||||||||||||
The total intrinsic value of the stock options at March 31, 2021 is $823,478.
- 38 -
Virtuix Holdings, Inc. and Subsidiaries
Notes to Consolidated Financial Statements
Note 11. Income Taxes
Deferred taxes are recognized for temporary differences between the basis of assets and liabilities for financial statement and income tax purposes. The differences relate primarily to depreciable assets using accelerated depreciation methods for income tax purposes, share-based compensation expense, and for net operating loss carryforwards.
| March 31 2021 | March 31, 2020 | |||||||
| Deferred tax assets: | ||||||||
| Share-based compensation expense | $ | 72,707 | $ | 74,232 | ||||
| Net operating loss carryforward | 4,193,403 | 3,646,467 | ||||||
| Property and equipment | - | 37,810 | ||||||
| Long-term deferred tax liabilities: | ||||||||
| Property and equipment | (22,310 | ) | - | |||||
| Net deferred tax assets and liabilities | 4,243,800 | 3,758,509 | ||||||
| Valuation allowance | (4,243,800 | ) | (3,758,509 | ) | ||||
| Net deferred tax asset | $ | - | $ | - | ||||
The Company recognizes deferred tax assets to the extent that it believes that these assets are more likely than not to be realized. In making such a determination, the Company considers all available positive and negative evidence, including future reversals of existing taxable temporary differences, projected future taxable income, tax-planning strategies, and results of recent operations. The federal tax rate in effect affecting future tax benefits at March 31, 2021 and 2020 was 21%. The Company assessed the need for a valuation allowance against its net deferred tax assets and determined a full valuation allowance, as indicated above, is required due to net operating losses for the years ended March 31, 2021 and 2020, and due to the cumulative loss through March 31, 2021. Accordingly, no provision for deferred income taxes has been recognized for the years ended March 31, 2021 and 2020.
The Company's ability to utilize net operating loss carryforwards will depend on its ability to generate adequate future taxable income. NOL carryforwards generated in years beginning after December 31, 2017 carryforward indefinitely and apply to 80% of future taxable income. Carrybacks of NOLs are disallowed. In March 2020, the CARES Act was enacted providing a five-year carryback for losses incurred in 2018, 2019, or 2020, which allows companies to modify tax returns up to five years prior to offset taxable income from those tax years. The CARES Act also suspended the NOL limit of 80% of taxable income. The Company has not had income in prior years, thus, NOL carryforwards available to offset future taxable income amount to $19,968,587 as of March 31, 2021, of which $12,561,963, pertains to years prior to 2018 and expire between 2034 and 2038, and $7,406,624 pertains to years subsequent to 2018 and carryforward indefinitely. Such amounts have been fully reserved in the valuation allowance discussed above.
Topic 718 provides that income tax effects of share-based payments are recognized in the financial statements for those awards that will normally result in tax deductions under existing tax law. Under current U.S. federal tax law, the Company receives a compensation expense deduction related to NQSOs only when those options are exercised. Accordingly, the consolidated financial statement recognition of compensation cost for NQSOs creates a deductible temporary difference, which results in a deferred tax asset and a corresponding deferred tax benefit in the consolidated statement of operations. The Company does not recognize a tax benefit for compensation expense related to ISOs unless the underlying shares are disposed of in a disqualifying disposition. Accordingly, compensation expense related to ISOs is treated as a permanent difference for income tax purposes.
- 39 -
Virtuix Holdings, Inc. and Subsidiaries
Notes to Consolidated Financial Statements
Note 11. Income Taxes (continued)
Under the People’s Republic of China Enterprise Income Tax Law, enterprise income tax is collected from companies on a quarterly basis, and is based on the net income companies obtain while exercising their business activity, normally during one business year. The standard tax rate is 25%. For VML_ZH, taxes attributable to the years ended March 31, 2021 and 2020, was $0 and $854, respectively.
Note 12. Investment in Joint Venture
As mentioned in Note 1, the Company has an investment in a Joint Venture. VML has 49% ownership and does not have control over the Joint Venture, therefore, the investment has been accounted for using the equity method. As of March 31, 2020, the Company discontinued using the equity method after recording a loss from the Joint Venture, which brought the investment balance to zero. The Company’s share of any future profits earned by the Joint Venture will be recorded using the equity method, but losses can only be recorded to the extent there is an asset balance.
As of March 31, 2021, the Joint Venture had total assets of $262,926, total liabilities of $454,345, and a total deficit of ($191,419).
As of March 31, 2020, the Joint Venture had total assets of $165,711, total liabilities of $347,852, and a total deficit of ($182,141).
For the fiscal year ended March 31, 2021, the Joint Venture had operating revenue of $841,943, cost of goods sold of $638,658, operating costs of $212,563, and net loss of $9,278. Under the equity method, net loss attributable to the Company was $4,546. As of March 31, 2021, the cumulative loss on investment to be applied when the joint venture earns profits was $32,336.
For the fiscal year ended March 31, 2020, the Joint Venture had operating revenue of $454,972, cost of goods sold of $241,524, operating costs of $361,759, and net loss of $147,632. Under the equity method, net loss attributable to the Company was $72,339, of which $44,549 was applied to the investment in joint venture and was recorded as a loss on investment in joint venture in the consolidated statements of operations, and a $27,790 remaining cumulative loss on investment was to be applied when the joint venture earned profits.
Note 13. Disaggregation of Revenue
Revenue streams from performance obligations included in net sales as of March 31, 2021 and 2020 in the consolidated statements of operations are as follows:
| 2021 | 2020 | |||||||
| SALES | ||||||||
| Omni Arenas | $ | 1,468,162 | $ | 2,902,503 | ||||
| Omni units and accessories, net | 380,225 | 832,617 | ||||||
| Omni Care program | 165,333 | 31,333 | ||||||
| Omniverse credits | 89,370 | 88,740 | ||||||
| NET SALES | $ | 2,103,090 | $ | 3,855,193 | ||||
Note 14. Going Concern
The accompanying consolidated financial statements have been prepared on a going concern basis, which contemplates the realization of assets and the satisfaction of liabilities in the normal course of business.
The Company has not generated profits since inception, has negative cash flows from operations, has sustained net losses of $3,845,456 and $3,580,222 for the years ended March 31, 2021 and 2020, respectively, and has an accumulated deficit of $25,233,709 as of March 31, 2021. These factors, among others, raise substantial doubt about the ability of the Company to continue as a going concern within one year after the date that the consolidated financial statements are available to be issued.
- 40 -
Virtuix Holdings, Inc. and Subsidiaries
Notes to Consolidated Financial Statements
Note 14. Going Concern (continued)
Management has taken several actions to ensure that the Company will continue as a going concern for the next twelve months from the date the consolidated financial statements are available to be issued:
| 1. | The Company will continue to sell Omni Arena during the next twelve months and anticipates significant revenues from the Omni Arena product as restrictions and lockdowns related to the Covid-19 pandemic are lifted nationwide. |
| 2. | The Company's current cash position is approximately $9 million which is adequate to cover the expected upcoming one year cash flow needs. Historic losses for the current and prior years are approximately $3.5 million with operating cash outflows slightly less than that. Therefore, current capital on hand as of the date these consolidated financial statements are available to be issued should sufficiently fund operations of the Company. |
| 3. | The Company continues to raise capital from existing shareholders and third parties as necessary to fund its operating needs (see Note 17). |
Management concluded that its plans successfully alleviate the substantial doubt to the ability of the Company to continue as a going concern within one year after the date that the consolidated financial statements are issued. No assurance can be given that the Company will be successful in these efforts. The consolidated financial statements do not include any adjustments relating to the recoverability and classification of recorded asset amounts or the amounts and classification of liabilities that might be necessary should the Company be unable to continue as a going concern.
Note 15. Commitments and Contingencies
On June 25, 2015, the Company entered into a 39-month non-cancelable operating lease agreement for office space. On February 19, 2018, the Company entered into a 60-month extension of the lease term beginning on October 1, 2018 and expiring on September 30, 2023. Monthly rent payments will continue at the previous rate of $7,200 per month and increase at about 3% per square foot to $8,100 over the course of the 60 months.
Future minimum lease payments under this lease agreement at March 31, 2021:
| 2022 | $ | 93,150 | |||
| 2023 | 95,850 | ||||
| Thereafter | 48,600 | ||||
| Total lease payments | $ | 237,600 |
Rent expense included in the consolidated statements of operations was $134,522 and $134,975 for the years ended March 31, 2021 and 2020, respectively.
Note 16. Patents
As of March 31, 2021, the Company owns seven issued utility patents and eight issued design patents, and six additional applications are still pending.
Note 17. Subsequent Events
Management has evaluated subsequent events through July 23, 2021, the date the consolidated financial statements were available to be issued.
As of the date these consolidated financial statements were available to be issued, the Company has closed on an additional 1,827,081 shares of its Series A-2 Preferred Stock for a total investment of $5,473,948.
No additional material events were identified which require adjustment or disclosure in the consolidated financial statements.
- 41 -
Item 8.
INDEX TO EXHIBITS
The documents listed in the Exhibit Index of this report are incorporated by reference or are filed with this report, in each case as indicated below.
*Previously filed with the company’s Form 1-A and incorporated by reference by hyperlink
- 42 -
SIGNATURES
Pursuant to the requirements of Regulation A, the issuer has duly caused this report to be signed on its behalf by the undersigned, thereunto duly authorized, in the City of Austin, State of Texas, on July 29, 2021.
Virtuix Holdings Inc.
| By | /s/ Jan Goetgeluk | |
| Jan Goetgeluk, Chief Executive Officer of | ||
| Virtuix Holdings Inc. | ||
Pursuant to the requirements of Regulation A, this report has been signed below by the following persons in the capacities and on the dates indicated.
| /s/ Jan Goetgeluk | |
| Jan Goetgeluk, Chief Executive Officer and Director | |
| Date: July 29, 2021 | |
| /s/ David Robert Malcolm Allan | |
| David Robert Malcolm Allan, President, COO and Director | |
| Date: July 29, 2021 | |
| /s/ Jan Goetgeluk | |
| Jan Goetgeluk, Chief Financial Officer | |
| Date: July 29, 2021 | |
| /s/ Michael Bradley McGovern | |
| Michael Bradley McGovern, Director | |
| Date: July 29, 2021 | |
- 43 -