Exhibit (c)(3)

INVESTMENT BANKING • RESEARCH • INSTITUTIONAL SALES & TRADING December 29, 2023 Project Bluebonnet Discussion Materials for the Special Committee of the Board of Directors

Legal Disclaimers & Disclosures These materials are provided solely for the information of the Special Committee of the Board of Directors (the “Special Committee”) of Via Renewables, Inc. (the “Company”) by B. Riley Securities, Inc. (“B. Riley”) in connection with the Special Committee’s consideration of a potential transaction (the “Proposed Transaction”) involving the Company. These materials are for discussion purposes only and may not be relied upon by any security holder of the Company or any other party or person for any purpose whatsoever. These materials were prepared for a specific use by specific persons familiar with the business and affairs of the Company and were not prepared with a view to public disclosure or to conform with any disclosure standards under securities laws or otherwise. Accordingly, none of the Special Committee, the Company, B. Riley or their respective advisors take any responsibility for the use of these materials by persons other than the Special Committee. These materials are provided on a confidential basis solely for the information of the Special Committee and may not be disclosed to or shar ed with others, in whole or in part, or summarized or otherwise referred to, except as agreed to in writing by B. Riley. These materials necessarily are based on financial, economic, market and other conditions as in effect on, and the information made available to us as of, the date of these materials. B. Riley undertakes no obligation to update, revise or reaffirm these materials. These materials do not constitute any opinion. B. Riley’s only opinion is the opinion, if any, that is actually delivered to the Special Committee. These materials are not intended to provide the sole basis for evaluation of the Proposed Transaction, and do not purport to contain all information that may be required. The analyses contained in these materials must be considered as a whole. Selecting portions of the analyses, without considering all analyses, together with the accompanying footnotes and discussion, could create an incomplete view. Individual analyses of value contained in the analyses are not appraisals and are not necessarily indicative of actual value, which may be significantly more or less favorable than as indicated by such analyses. In preparing these materials, B. Riley has not conducted any physical inspection or independent appraisal or evaluation of any of the assets, properties or liabilities (contingent or otherwise) of the Company or any other participant in the Proposed Transaction, nor was B. Riley provided with any such appraisal or evaluation. B. Riley has assumed and relied upon the accuracy and completeness of the financial and other information obtained from management of the Company, other parties to the Proposed Transaction, their respective advisors and public sources without assuming any responsibility for independent verification of such information, makes no representation or warranty (express or implied) in respect of the accuracy or completeness of such information and has further relied upon the assurances of the Company that it is not aware of any facts or circumstances that would make such information inaccurate or misleading. To the extent such information includes estimates, projections and forecasts of future financial performance prepared by or reviewed or discussed with management of the Company or other parties to the Proposed Transaction, or obtained from public sources, we have assumed that such estimates, projections and forecasts have been reasonably prepared in good faith on bases reflecting the best currently available estimates, projections and judgments of such management (or, with respect to estimates and forecasts obtained from public sources, represent reasonable estimates). B. Riley takes no responsibility for such estimates, projections or forecasts or the assumptions on which they are based. B. Riley role in reviewing any information was limited solely to performing such a review as it shall deem necessary to support its own analysis and opinion and not on behalf of the Special Committee, the Company or any other person. In addition, we have relied upon and assumed, without independent verification, that the final forms of the draft documents reviewed by us will not differ in any material respect from such draft documents.

Table of Contents 1. Engagement Overview 2. Transaction Overview 3. Financial Analysis 4. Appendix

1 Engagement Overview

Scope of Assignment Pursuant to an engagement letter dated November 17, 2023, the Special Committee of the Board of Directors (“Board”) of Via Renewables, Inc. (“Via” or the “Company”) has engaged B. Riley Securities, Inc. (“B. Riley”), as its financial advisor in connection with the potential sale transaction involving the Company. As part of its engagement, the Special Committee has requested that B. Riley provide an opinion (“the Opinion”) to the Special Committee as to the fairness, from a financial point of view, to the holders of Class A Common Stock of the Company, other than holders of Excluded Shares or Insider Shares (each as defined below), of the consideration (the “Merger Consideration”) to be received by such holders (other than holders of Excluded Shares or Insider Shares) in the merger (the “Transaction”) pursuant to the Merger Agreement "Excluded Shares" means, collectively, shares of Company Common Stock (i) held by the Company or any subsidiary of the Company or (ii) held or beneficially owned by William Keith Maxwell, III or any person or entity controlled by William Keith Maxwell, III, including, without limitation, RetailCo, LLC ("Parent"), Merger Sub and NuDevco Retail, LLC. "Insider Shares" means shares of Company Common Stock held or beneficially owned by any (i) member of the board of directors (the "Board") of the Company, (ii) any officer of the Company and (iii) any immediate family members of any of the foregoing individuals B. Riley is an investment bank, a member of the Financial Industry Regulatory Authority (“FINRA”) and the Securities Investor Protection Corporation (“SIPC”), and has been in the business of assisting middle market companies since 1997 B. Riley, as part of its investment banking business, is periodically engaged in the valuation of corporate securities B. Riley has not identified any engagements during the last two years for which it represented Via, Parent or Maxwell and received compensation

2 Transaction Overview
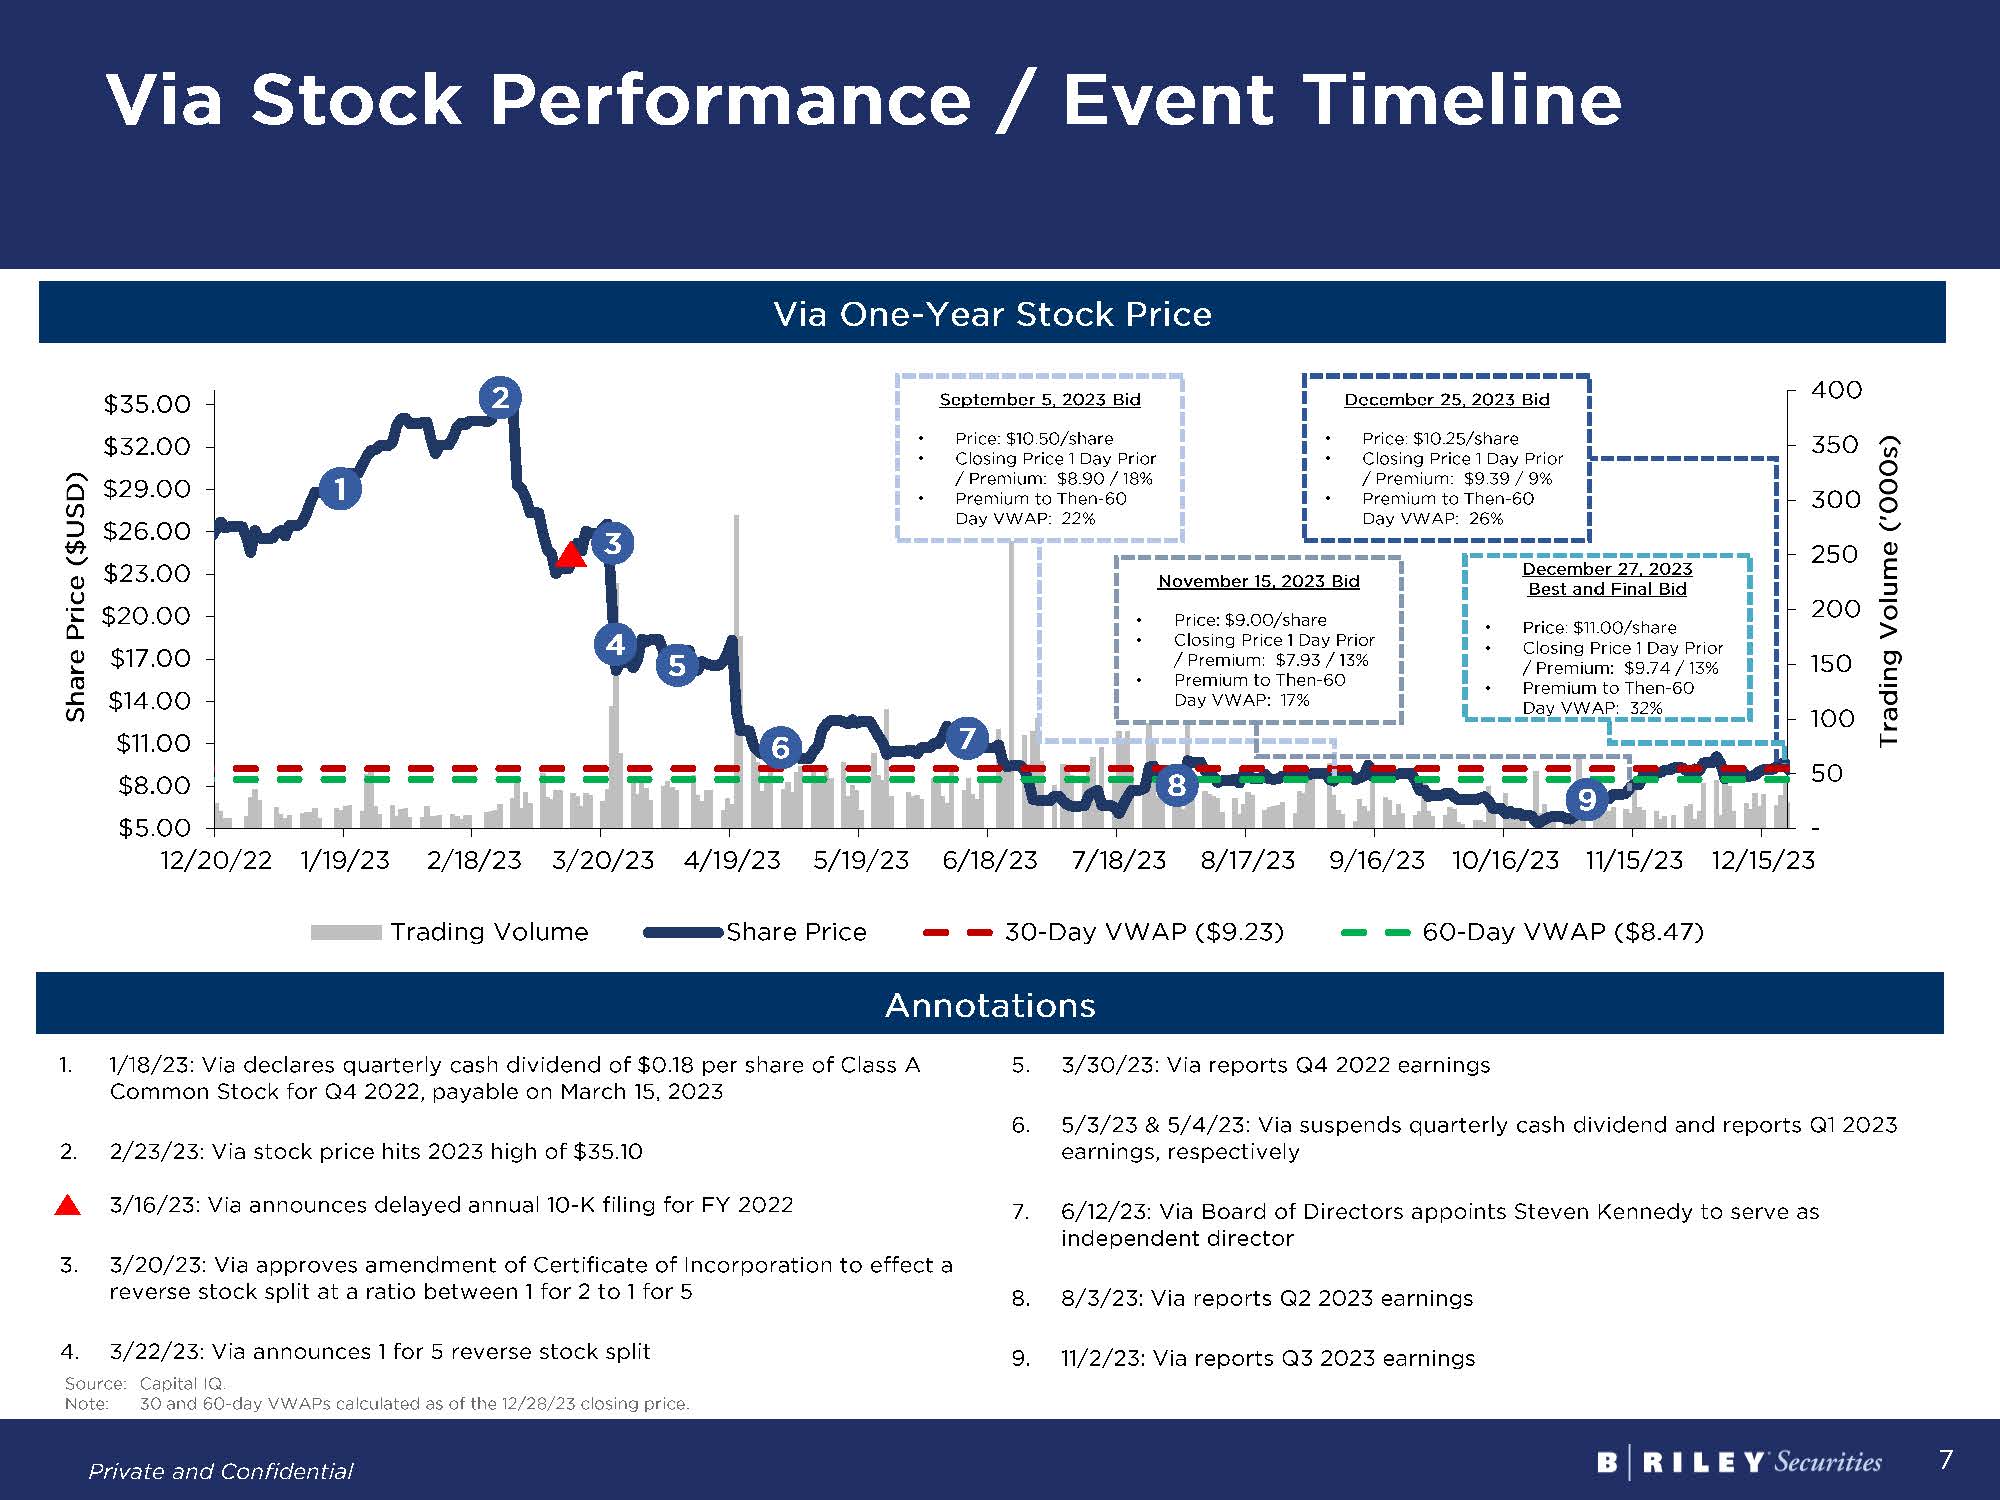
3/30/23: Via reports Q4 2022 earnings 5/3/23 & 5/4/23: Via suspends quarterly cash dividend and reports Q1 2023 earnings, respectively 6/12/23: Via Board of Directors appoints Steven Kennedy to serve as independent director 8/3/23: Via reports Q2 2023 earnings 11/2/23: Via reports Q3 2023 earnings Via Stock Performance / Event Timeline Via One-Year Stock Price Annotations 2 1/18/23: Via declares quarterly cash dividend of $0.18 per share of Class A Common Stock for Q4 2022, payable on March 15, 2023 2/23/23: Via stock price hits 2023 high of $35.10 3/16/23: Via announces delayed annual 10-K filing for FY 2022 3/20/23: Via approves amendment of Certificate of Incorporation to effect a reverse stock split at a ratio between 1 for 2 to 1 for 5 3/22/23: Via announces 1 for 5 reverse stock split Source: Capital IQ. Note: 30 and 60-day VWAPs calculated as of the 12/28/23 closing price. September 5, 2023 Bid Price: $10.50/share Closing Price 1 Day Prior / Premium: $8.90 / 18% Premium to Then-60 Day VWAP: 22% 3 4 6 8 1 9 5 7 November 15, 2023 Bid Price: $9.00/share Closing Price 1 Day Prior / Premium: $7.93 / 13% Premium to Then-60 Day VWAP: 17% December 27, 2023 Best and Final Bid Price: $11.00/share Closing Price 1 Day Prior / Premium: $9.74 / 13% Premium to Then-60 Day VWAP: 32% December 25, 2023 Bid Price: $10.25/share Closing Price 1 Day Prior / Premium: $9.39 / 9% Premium to Then-60 Day VWAP: 26%

Via Public Market Overview Stock Valuation Historical & Projected Financials Top-10 Shareholder Analysis(3) (2) Source: Company management. Note: Adjusted EBITDA refers to Earnings Before Interest, Taxes, Depreciation and Amortization, adjusted for certain non-recurring items. Market data as of 12/28/23. Balance sheet data as of 9/30/23. NCI is now negative and therefore is a deduct in arriving at Enterprise Value. 12/31/21A Adjusted EBITDA inclusive of $60mm non-recurring event – Winter Storm Uri. William Keith Maxwell III’s common stock equivalent held includes 4 million Class B shares. (1)

Summary of Selected Terms Summary Transaction Terms Summary Premiums and Multiples Source: Capital IQ, Bloomberg, public filings, and management projections. Note: Market data as of 12/28/23. Balance sheet data as of 9/30/23. (1) NCI is now negative and therefore is a deduct in arriving at Enterprise Value. Merger Consideration $11.00 per share in cash Implied fully diluted equity value of $81.7 million Implied enterprise value of $222.5 million Structure and Consideration Merger of Merger Sub with the Company, following which the Company will be a wholly-owned subsidiary of the Acquirer Merger consideration in cash Marketing Process 30-day Go-Shop process will be conducted Conditions to Close Via shareholder approval Compliance with covenants in all material respects Absence of material adverse effect

Source: Company management. (1) Changes to discussion materials dated 12/6/23 provided to the Special Committee. Evolution of Analysis and Management Projections Summary of Changes to Analyses(1) Summary of Management’s Changes to Financial Projections Via Financial Projections Management lowered the variable contract rate in the forecasted periods 2025 and 2026 Premiums Paid Analysis Adjusted methodologies to show premiums paid to 1 day, 1 week, 1 month, and 3 month stock prices compared to 1 day, 30 day and 60 day VWAP in prior analysis Discounted Cash Flow Analysis Adjusted DCF analysis using revised management projections Base case WACC changed to 17.0% from 25.0% Base case exit multiple changed to 3.0x from 4.5x Selected Transactions Analysis Adjusted EV / LTM 9/30/23 Adj EBITDA range from 4.00x – 6.00x to 3.75x – 5.75x

3 Financial Analysis
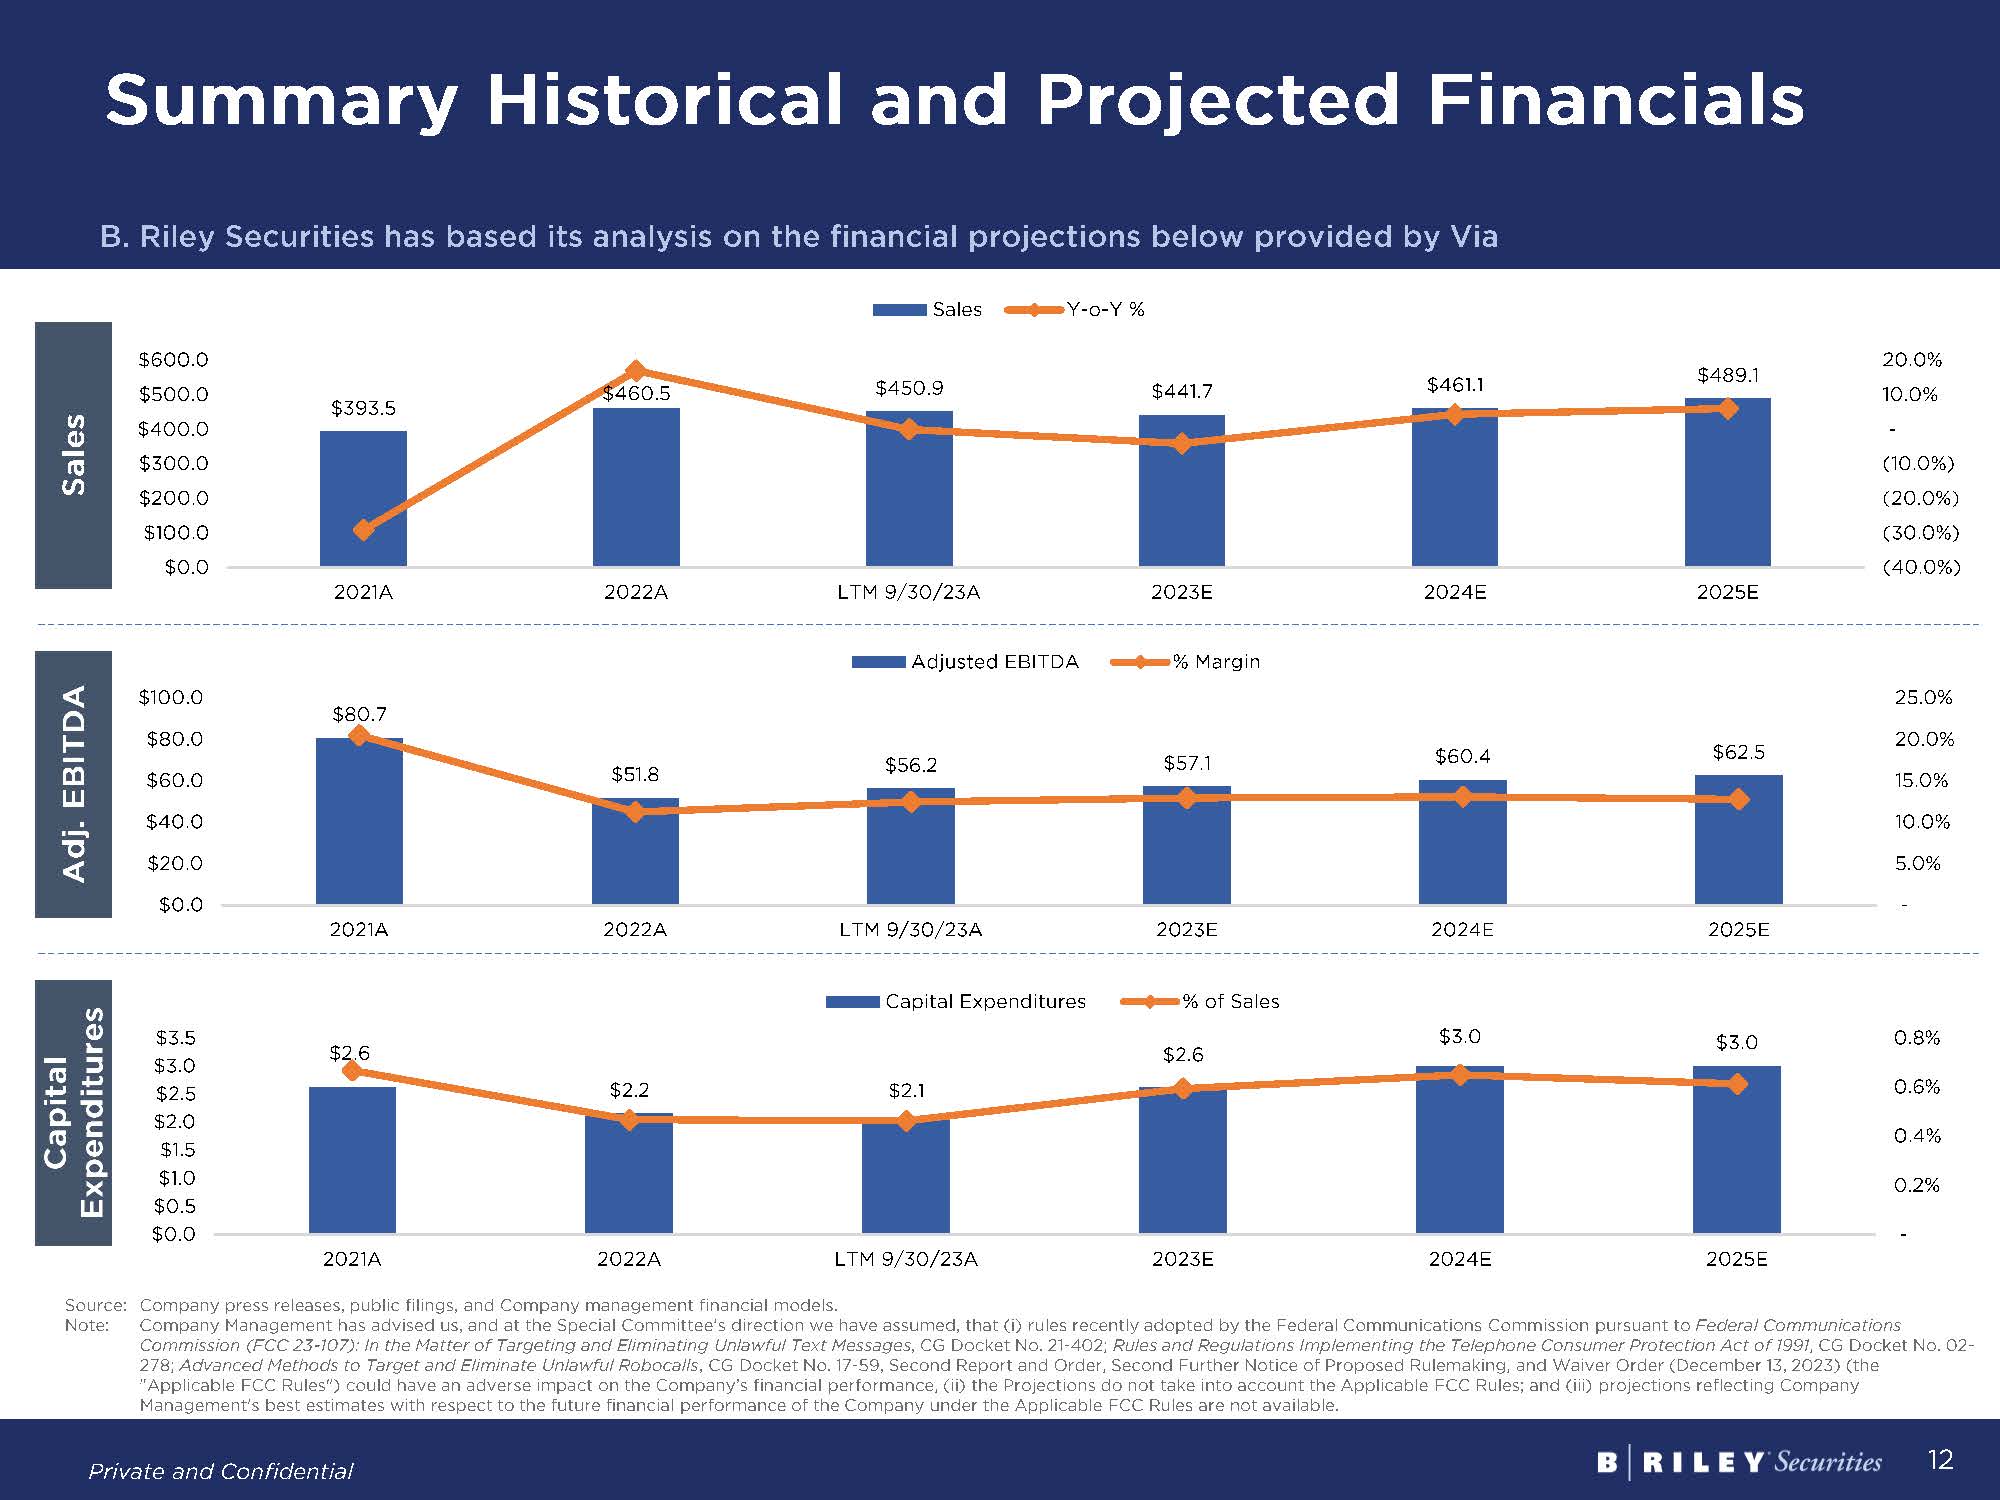
Source: Company press releases, public filings, and Company management financial models. Note: Company Management has advised us, and at the Special Committee’s direction we have assumed, that (i) rules recently adopted by the Federal Communications Commission pursuant to Federal Communications Commission (FCC 23-107): In the Matter of Targeting and Eliminating Unlawful Text Messages, CG Docket No. 21-402; Rules and Regulations Implementing the Telephone Consumer Protection Act of 1991, CG Docket No. 02-278; Advanced Methods to Target and Eliminate Unlawful Robocalls, CG Docket No. 17-59, Second Report and Order, Second Further Notice of Proposed Rulemaking, and Waiver Order (December 13, 2023) (the "Applicable FCC Rules") could have an adverse impact on the Company’s financial performance, (ii) the Projections do not take into account the Applicable FCC Rules; and (iii) projections reflecting Company Management's best estimates with respect to the future financial performance of the Company under the Applicable FCC Rules are not available. B. Riley Securities has based its analysis on the financial projections below provided by Via Summary Historical and Projected Financials Sales Adj. EBITDA Capital Expenditures

Summary of Financial Analyses Note: Equity value per share is derived by deducting net debt of $59.9 million and preferred stock of $88.0 million and adding $7.1 million in NCI to enterprise value. Analysis assumes 7.4 million shares. EV / LTM 9/30/23 Adj EBITDA (3.75x – 6.50x) EV / 2023E Adj EBITDA (3.75x – 6.00x) Comparable Trading Analysis EV / 2024E Adj EBITDA (3.50x – 4.50x) Does not reflect synergies or change of control premium EV / LTM 9/30/23 Adj EBITDA (3.75x – 5.75x) Reflects change of control premium WACC of 15.0% - 19.0% Exit Multiple of 2.5x – 3.5x 1 Day (22.4% – 34.6%) 1 Week (25.5% – 38.1%) Precedent Transaction Analysis Discounted Cash Flow Analysis Premiums Paid Analysis Price at 12/28 Close: $9.41 per share Merger Consideration: $11.00 per share 1 Month (29.7% – 41.9%) 3 Month (35.1% – 38.4%)

Selected Companies Analysis – Selected Public Companies Evergy, Inc.(NasdaqGS:EVRG) Engages in the generation, transmission, distribution, and sale of electricity in Kansas and Missouri Generates electricity through coal, hydroelectric, landfill gas, uranium, natural gas and oil sources, as well as solar, win, and renewable sources It serves residences, commercial firms, industrials, municipalities, and other electric utilities Half of the power supplied by Evergy comes from clean sources, creating more reliable energy with less impact to the environment Founded in 2017 and is based in Kansas City, Missouri For the fiscal year ended December 31st, 2022, reported $5,859.1mm in Revenue and $2,364.9mm in Adj. EBITDA Eversource Energy(NYSE:ES) Engages in the energy delivery business and operates through electric distribution, electric transmission, natural gas distribution, and water distribution segments Involved in the transmission and distribution of electricity; solar power facilities; and distribution of natural gas Operates regulated water utilities that provide water services to approximately 237,000 customers Serves residential, commercial, industrial, municipal and fire protection, and other customers in Connecticut, Massachusetts, and New Hampshire Changed its name to Eversource in April of 2015 and is based in Springfield, Massachusetts For the fiscal year ended December 31st, 2022, reported $12,289.3mm in Revenue and $3,225.8mm in Adj. EBITDA Genie Energy Ltd.(NYSE:GNE) Supplies electricity and natural gas to residential and small business customers in the United States and internationally Operates through two segments, Genie Retail Energy and Genie Renewables Develops, constructs, and operates solar projects for commercial and industrial customers Provides energy advisory and brokerage services Founded in 2011 and is based in Newark, New Jersey For the fiscal year ended December 31st, 2019, reported $315.5mm in Revenue and $65.2mm in Adj. EBITDA

Selected Public Companies (cont’d) NRG Energy, Inc.(NYSE:NRG) Operates as an integrated power company in Texas, and on the east and west coast Involved in the productions and selling of electricity and related products and serves residential, commercial, industrial, and wholesale customers Generates electricity using natural gas, coal, oil, solar, nuclear, and battery storage Trades electric power, natural gas, and related commodities; environmental products; weather products; and financial products Founded in 1989 and is headquartered in Houston, Texas For the fiscal year ended December 31st, 2022, reported $31,543.0mm in Revenue and $2,800.0mm in Adj. EBITDA OGE Energy Corp.(NYSE:OGE) Operates as an energy and energy services provider that offers physical delivery and related services in the United States Operates through Electric Company Operations and Natural Gas Midstream segments Generates, transmits, distributes, and sells electric energy Provides retail electricity service to approximately 889,000 customers Owns and operates coal-fired, natural gas-fired, wind-powered, and solar-powered generating assets Founded in 1902 and is based in Oklahoma City, Oklahoma For the fiscal year ended December 31st, 2022, reported $3,375.7mm in Revenue and $1,143.2mm in Adj. EBITDA Vistra Corp.(NYSE:VST) Operates as an integrated retail electricity and power generation company Retails electricity and natural gas to residential, commercial, and industrial customers across 20 states in the United States Involved in electricity generation, wholesale energy purchases and sales, commodity risk management, fuel production, and fuel logistics management activities Serves approximately 3.5 million customers with a generation capacity of approximately 37,000 megawatts Founded in 1882 and is based in Irving, Texas For the fiscal year ended December 31st, 2019, reported $13,728.0mm in Revenue and $3,297.0mm in Adj. EBITDA

Selected Public Companies Enterprise Value Market Capitalization Source: Public filings, Capital IQ, and Wall Street equity research. Note: Market data as of 12/28/2023.
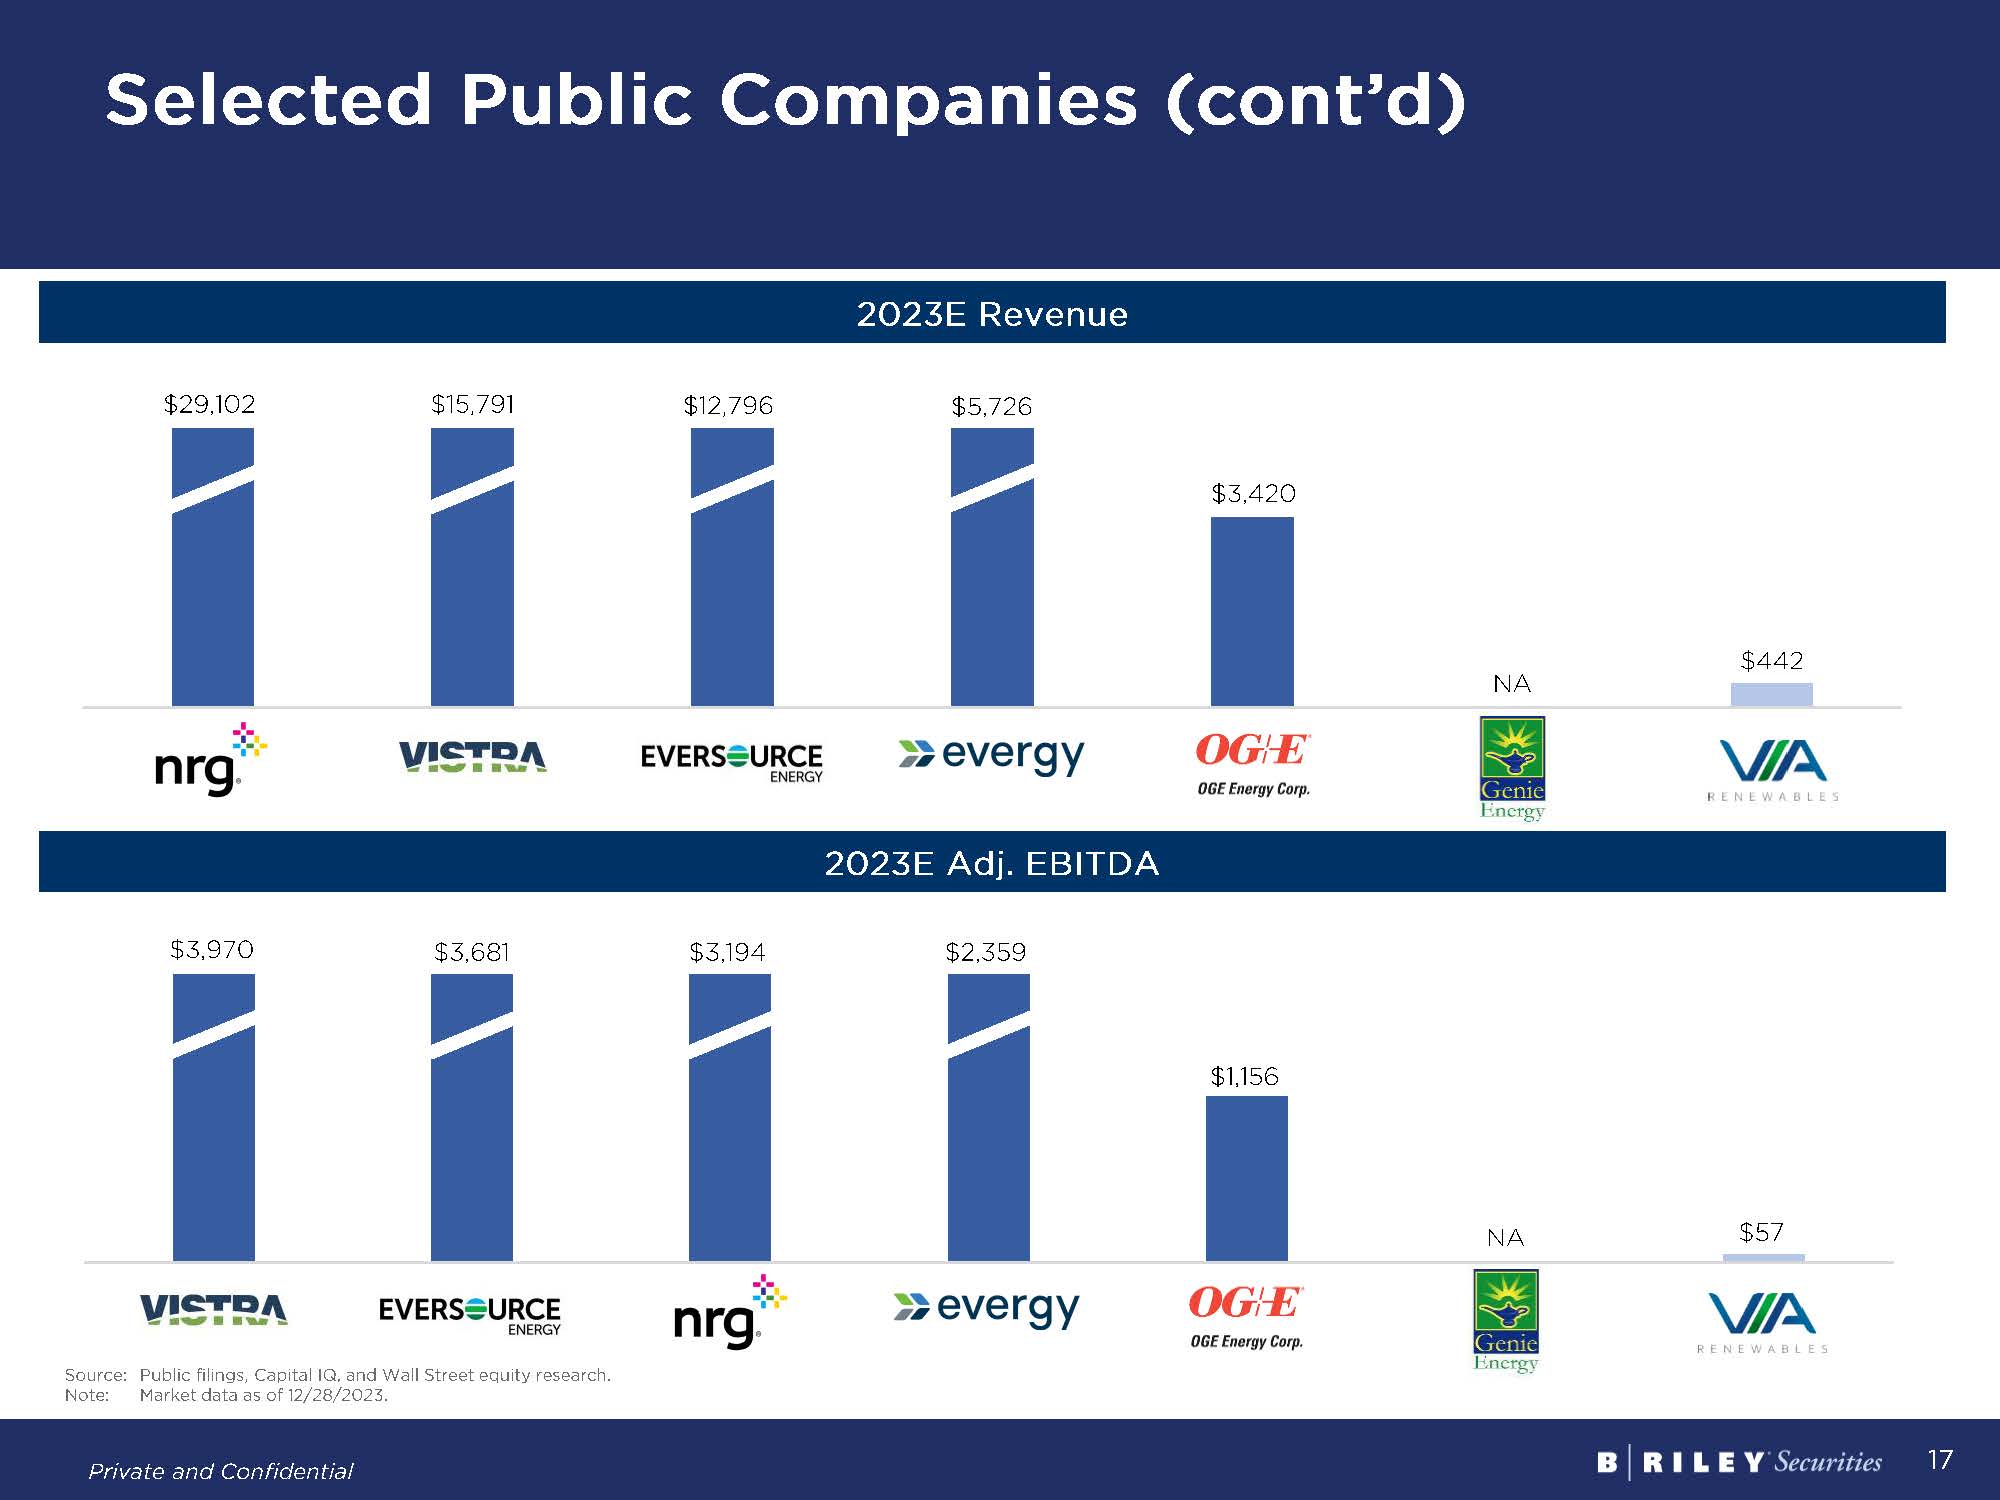
Selected Public Companies (cont’d) 2023E Revenue 2023E Adj. EBITDA Source: Public filings, Capital IQ, and Wall Street equity research. Note: Market data as of 12/28/2023.
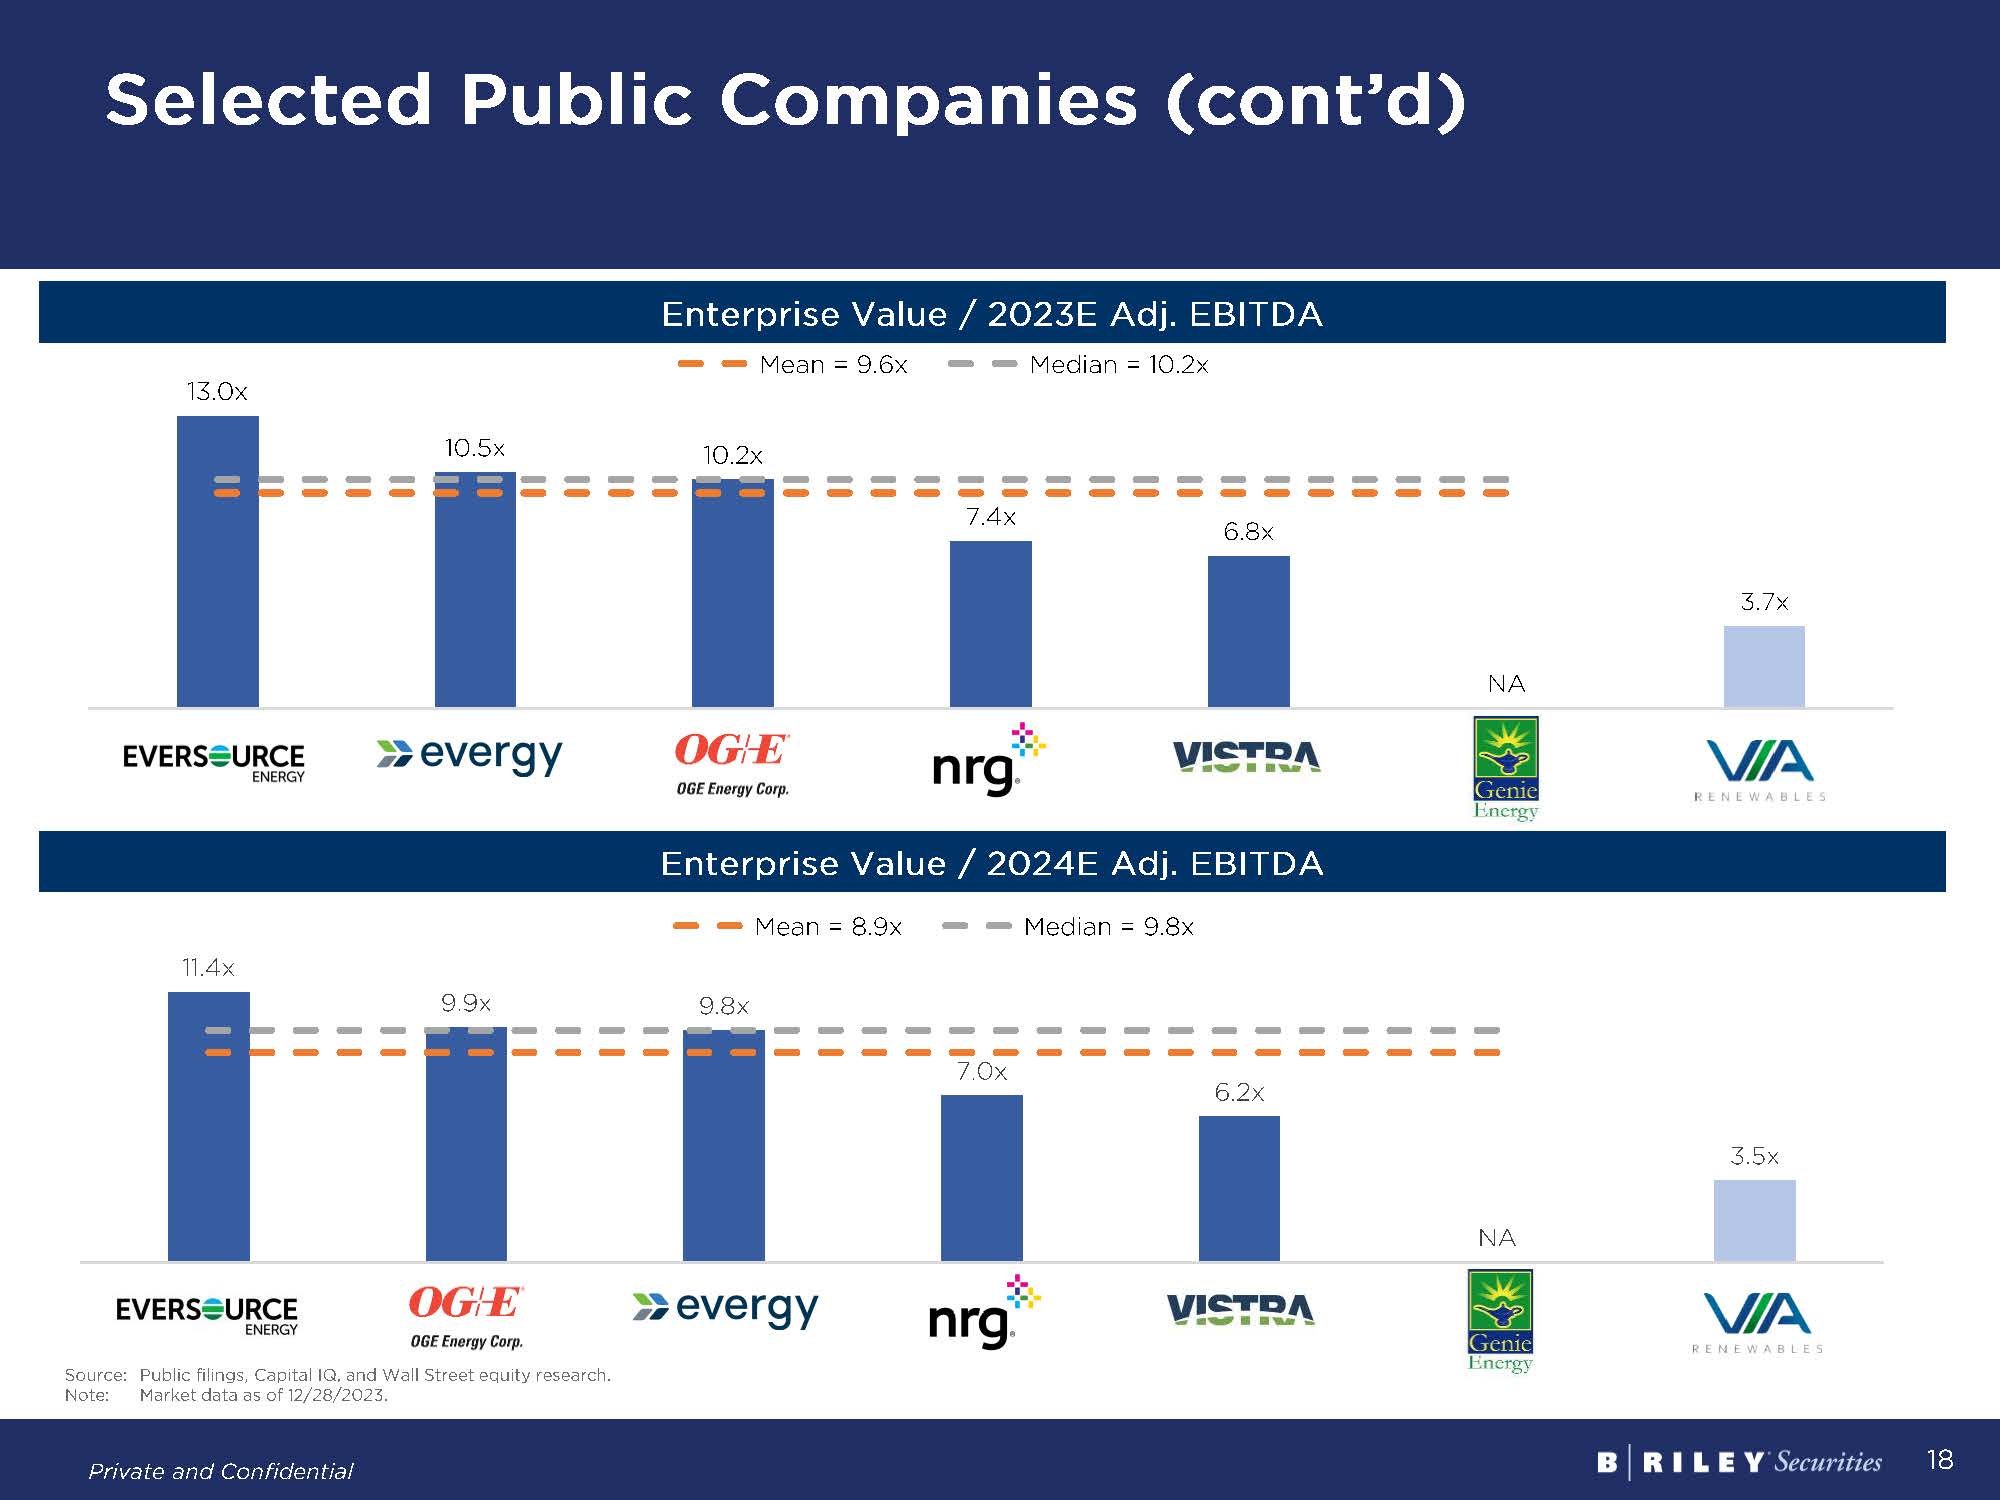
Selected Public Companies (cont’d) Enterprise Value / 2023E Adj. EBITDA Enterprise Value / 2024E Adj. EBITDA Source: Public filings, Capital IQ, and Wall Street equity research. Note: Market data as of 12/28/2023.
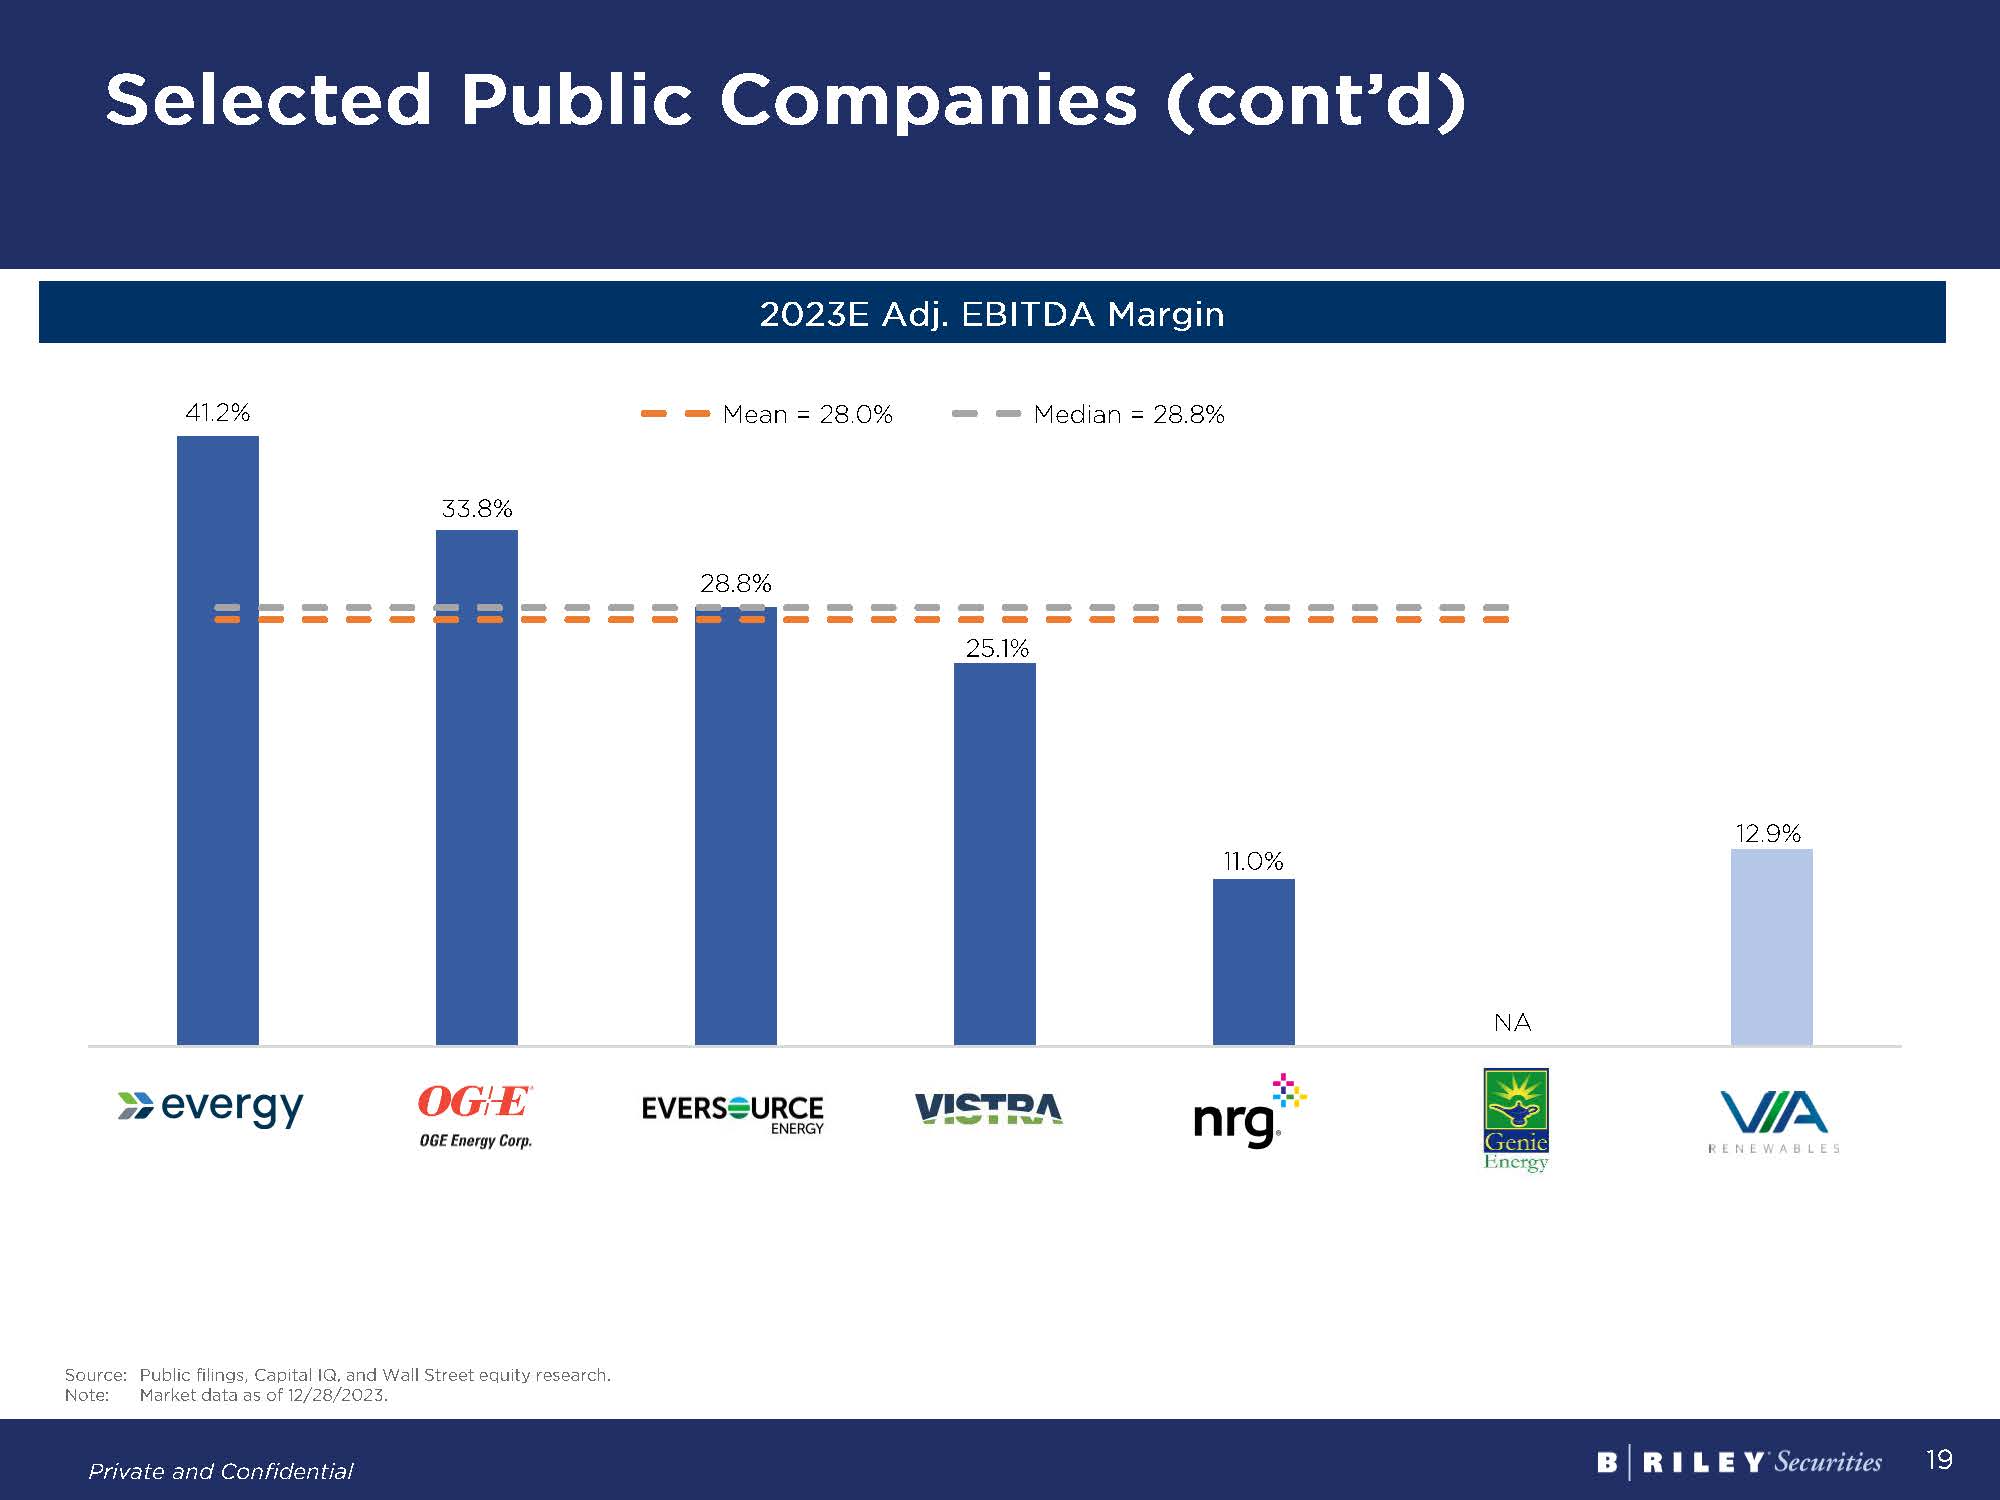
Selected Public Companies (cont’d) 2023E Adj. EBITDA Margin Source: Public filings, Capital IQ, and Wall Street equity research. Note: Market data as of 12/28/2023.
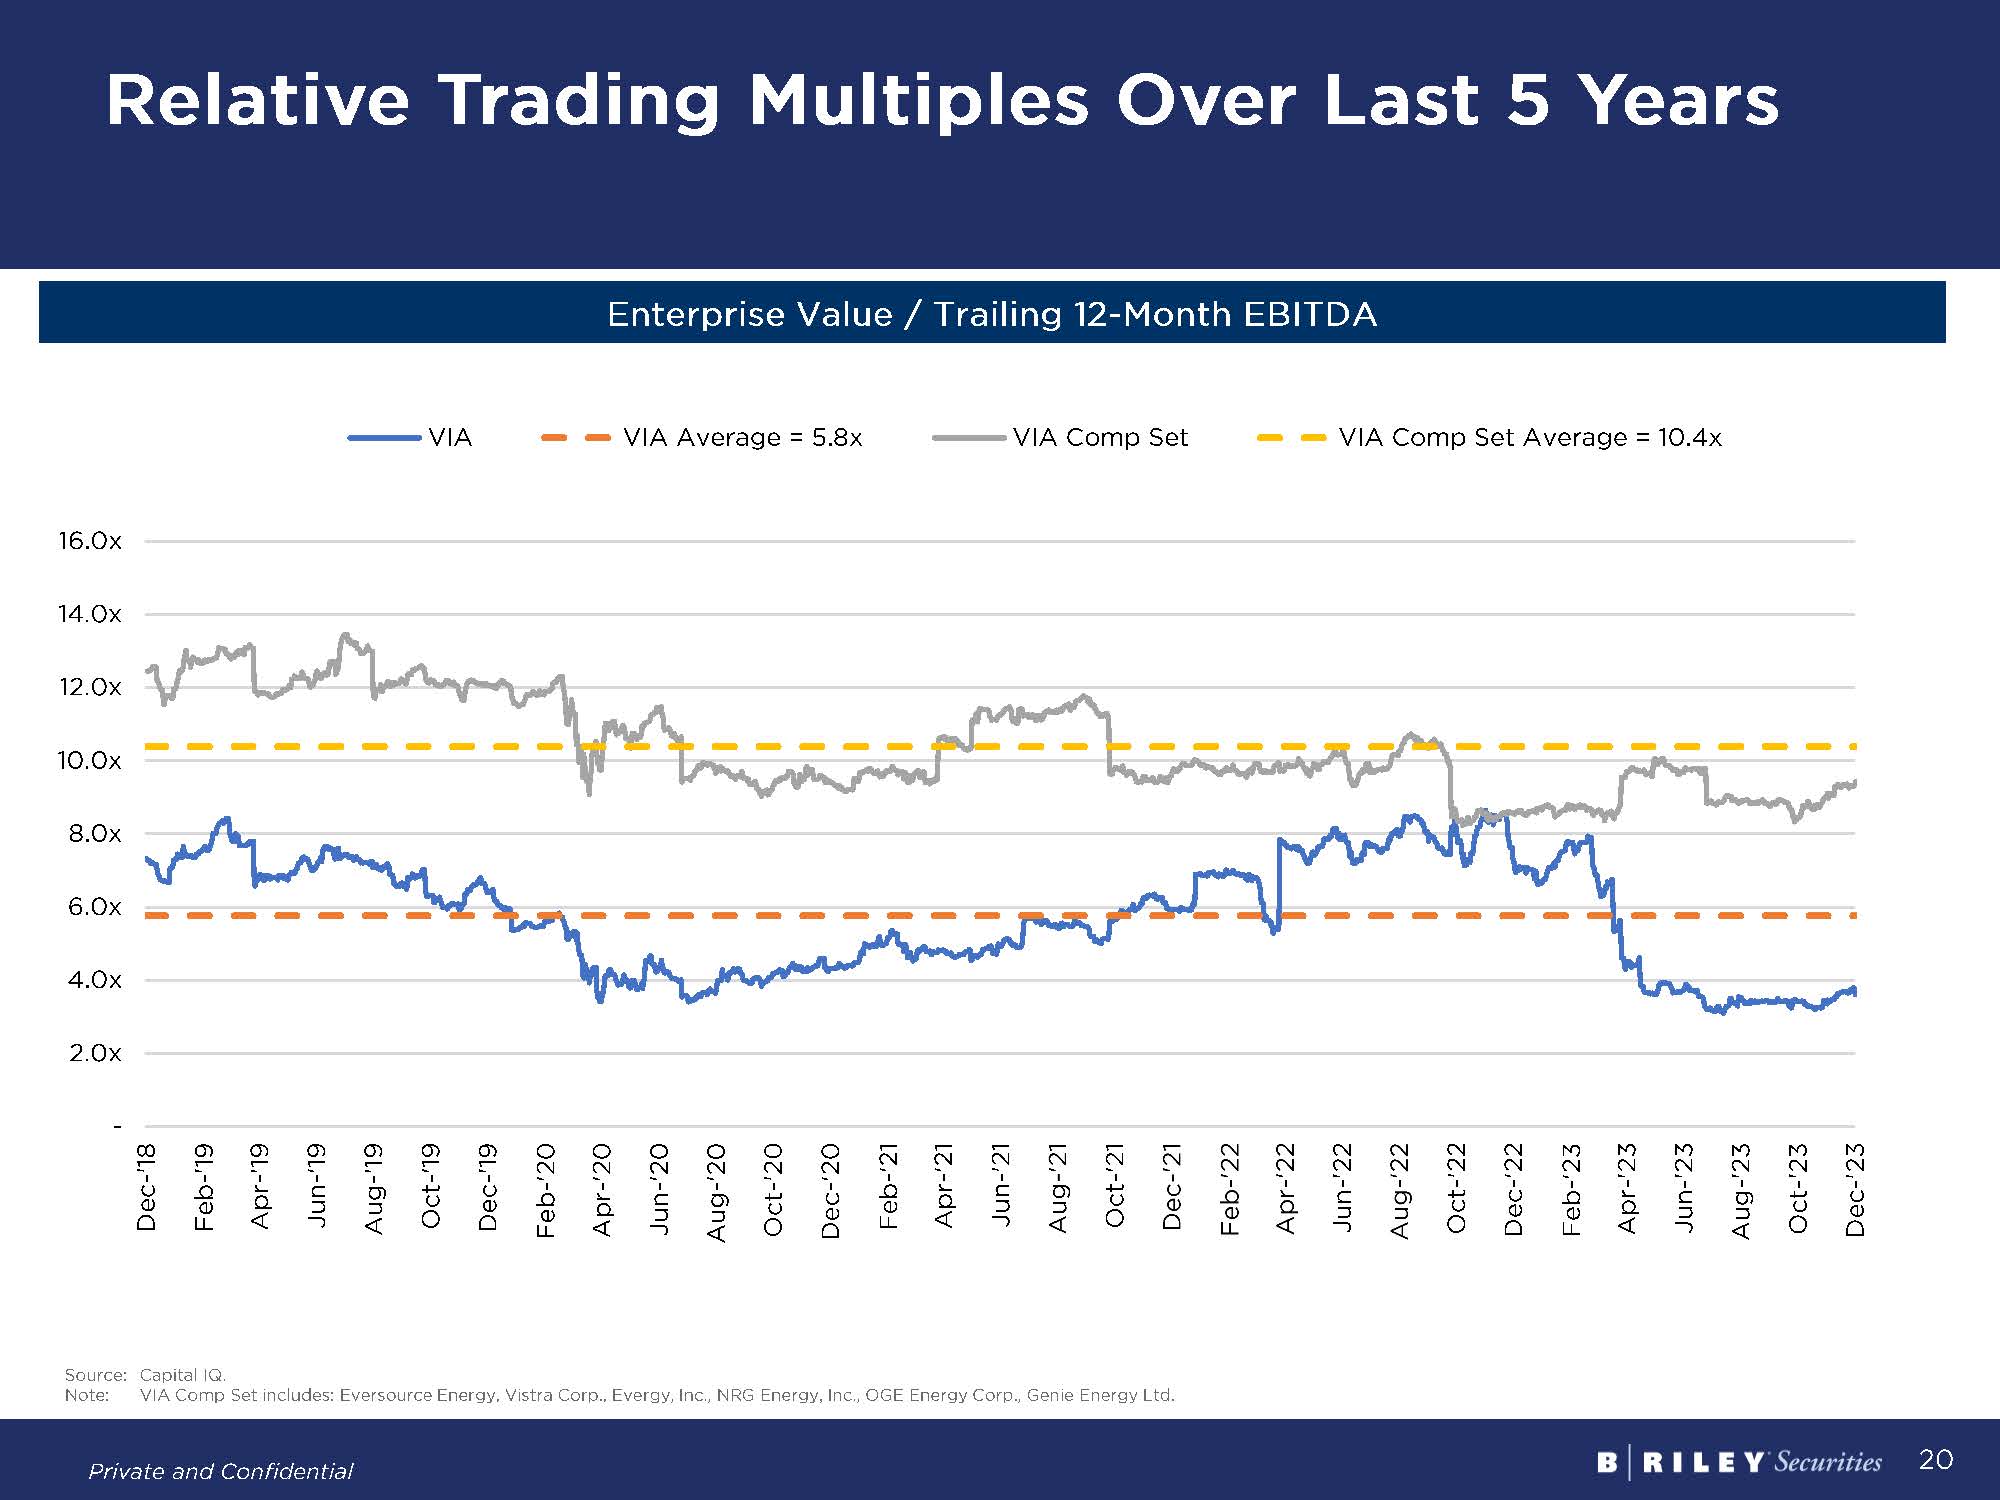
Relative Trading Multiples Over Last 5 Years Enterprise Value / Trailing 12-Month EBITDA Source: Capital IQ. Note: VIA Comp Set includes: Eversource Energy, Vistra Corp., Evergy, Inc., NRG Energy, Inc., OGE Energy Corp., Genie Energy Ltd.
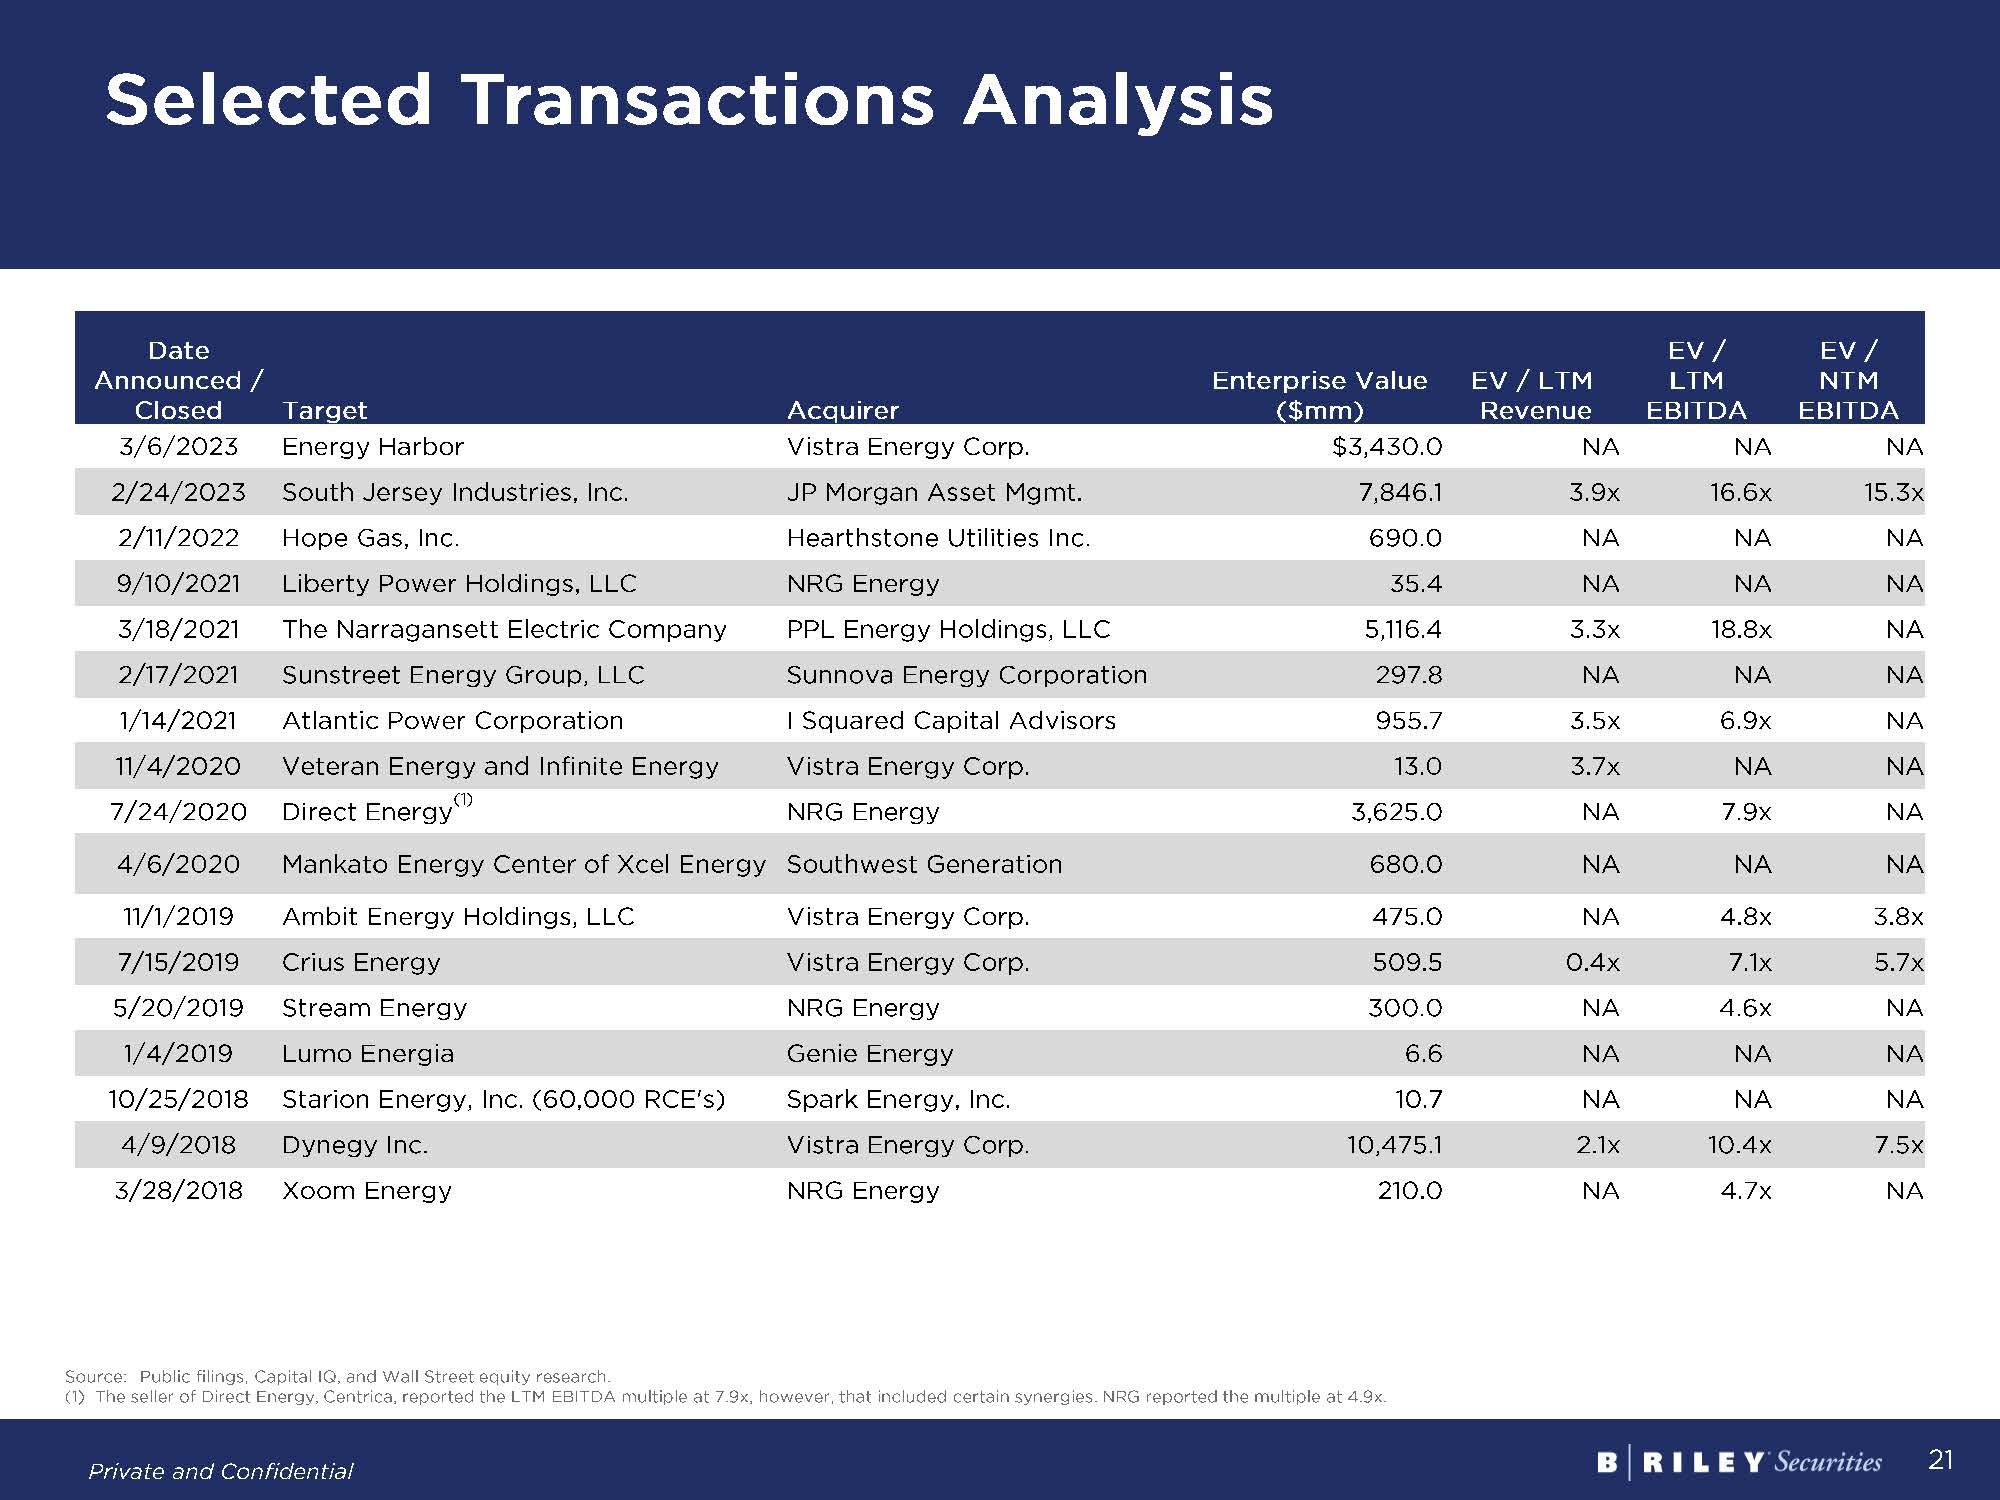
Date Announced / Closed Target Acquirer Enterprise Value ($mm) EV / LTM Revenue EV / LTM EBITDA EV / NTM EBITDA 3/6/2023 Energy Harbor Vistra Energy Corp. $3,430.0 NA NA NA 2/24/2023 South Jersey Industries, Inc. JP Morgan Asset Mgmt. 7,846.1 3.9x 16.6x 15.3x 2/11/2022 Hope Gas, Inc. Hearthstone Utilities Inc. 690.0 NA NA NA 9/10/2021 Liberty Power Holdings, LLC NRG Energy 35.4 NA NA NA 3/18/2021 The Narragansett Electric Company PPL Energy Holdings, LLC 5,116.4 3.3x 18.8x NA 2/17/2021 Sunstreet Energy Group, LLC Sunnova Energy Corporation 297.8 NA NA NA 1/14/2021 Atlantic Power Corporation I Squared Capital Advisors 955.7 3.5x 6.9x NA 11/4/2020 Veteran Energy and Infinite Energy Vistra Energy Corp. 13.0 3.7x NA NA 7/24/2020 Direct Energy(1) NRG Energy 3,625.0 NA 7.9x NA 4/6/2020 Mankato Energy Center of Xcel Energy Southwest Generation 680.0 NA NA NA 11/1/2019 Ambit Energy Holdings, LLC Vistra Energy Corp. 475.0 NA 4.8x 3.8x 7/15/2019 Crius Energy Vistra Energy Corp. 509.5 0.4x 7.1x 5.7x 5/20/2019 Stream Energy NRG Energy 300.0 NA 4.6x NA 1/4/2019 Lumo Energia Genie Energy 6.6 NA NA NA 10/25/2018 Starion Energy, Inc. (60,000 RCE's) Spark Energy, Inc. 10.7 NA NA NA 4/9/2018 Dynegy Inc. Vistra Energy Corp. 10,475.1 2.1x 10.4x 7.5x 3/28/2018 Xoom Energy NRG Energy 210.0 NA 4.7x NA Selected Transactions Analysis Source: Public filings, Capital IQ, and Wall Street equity research. (1) The seller of Direct Energy, Centrica, reported the LTM EBITDA multiple at 7.9x, however, that included certain synergies. NRG reported the multiple at 4.9x.
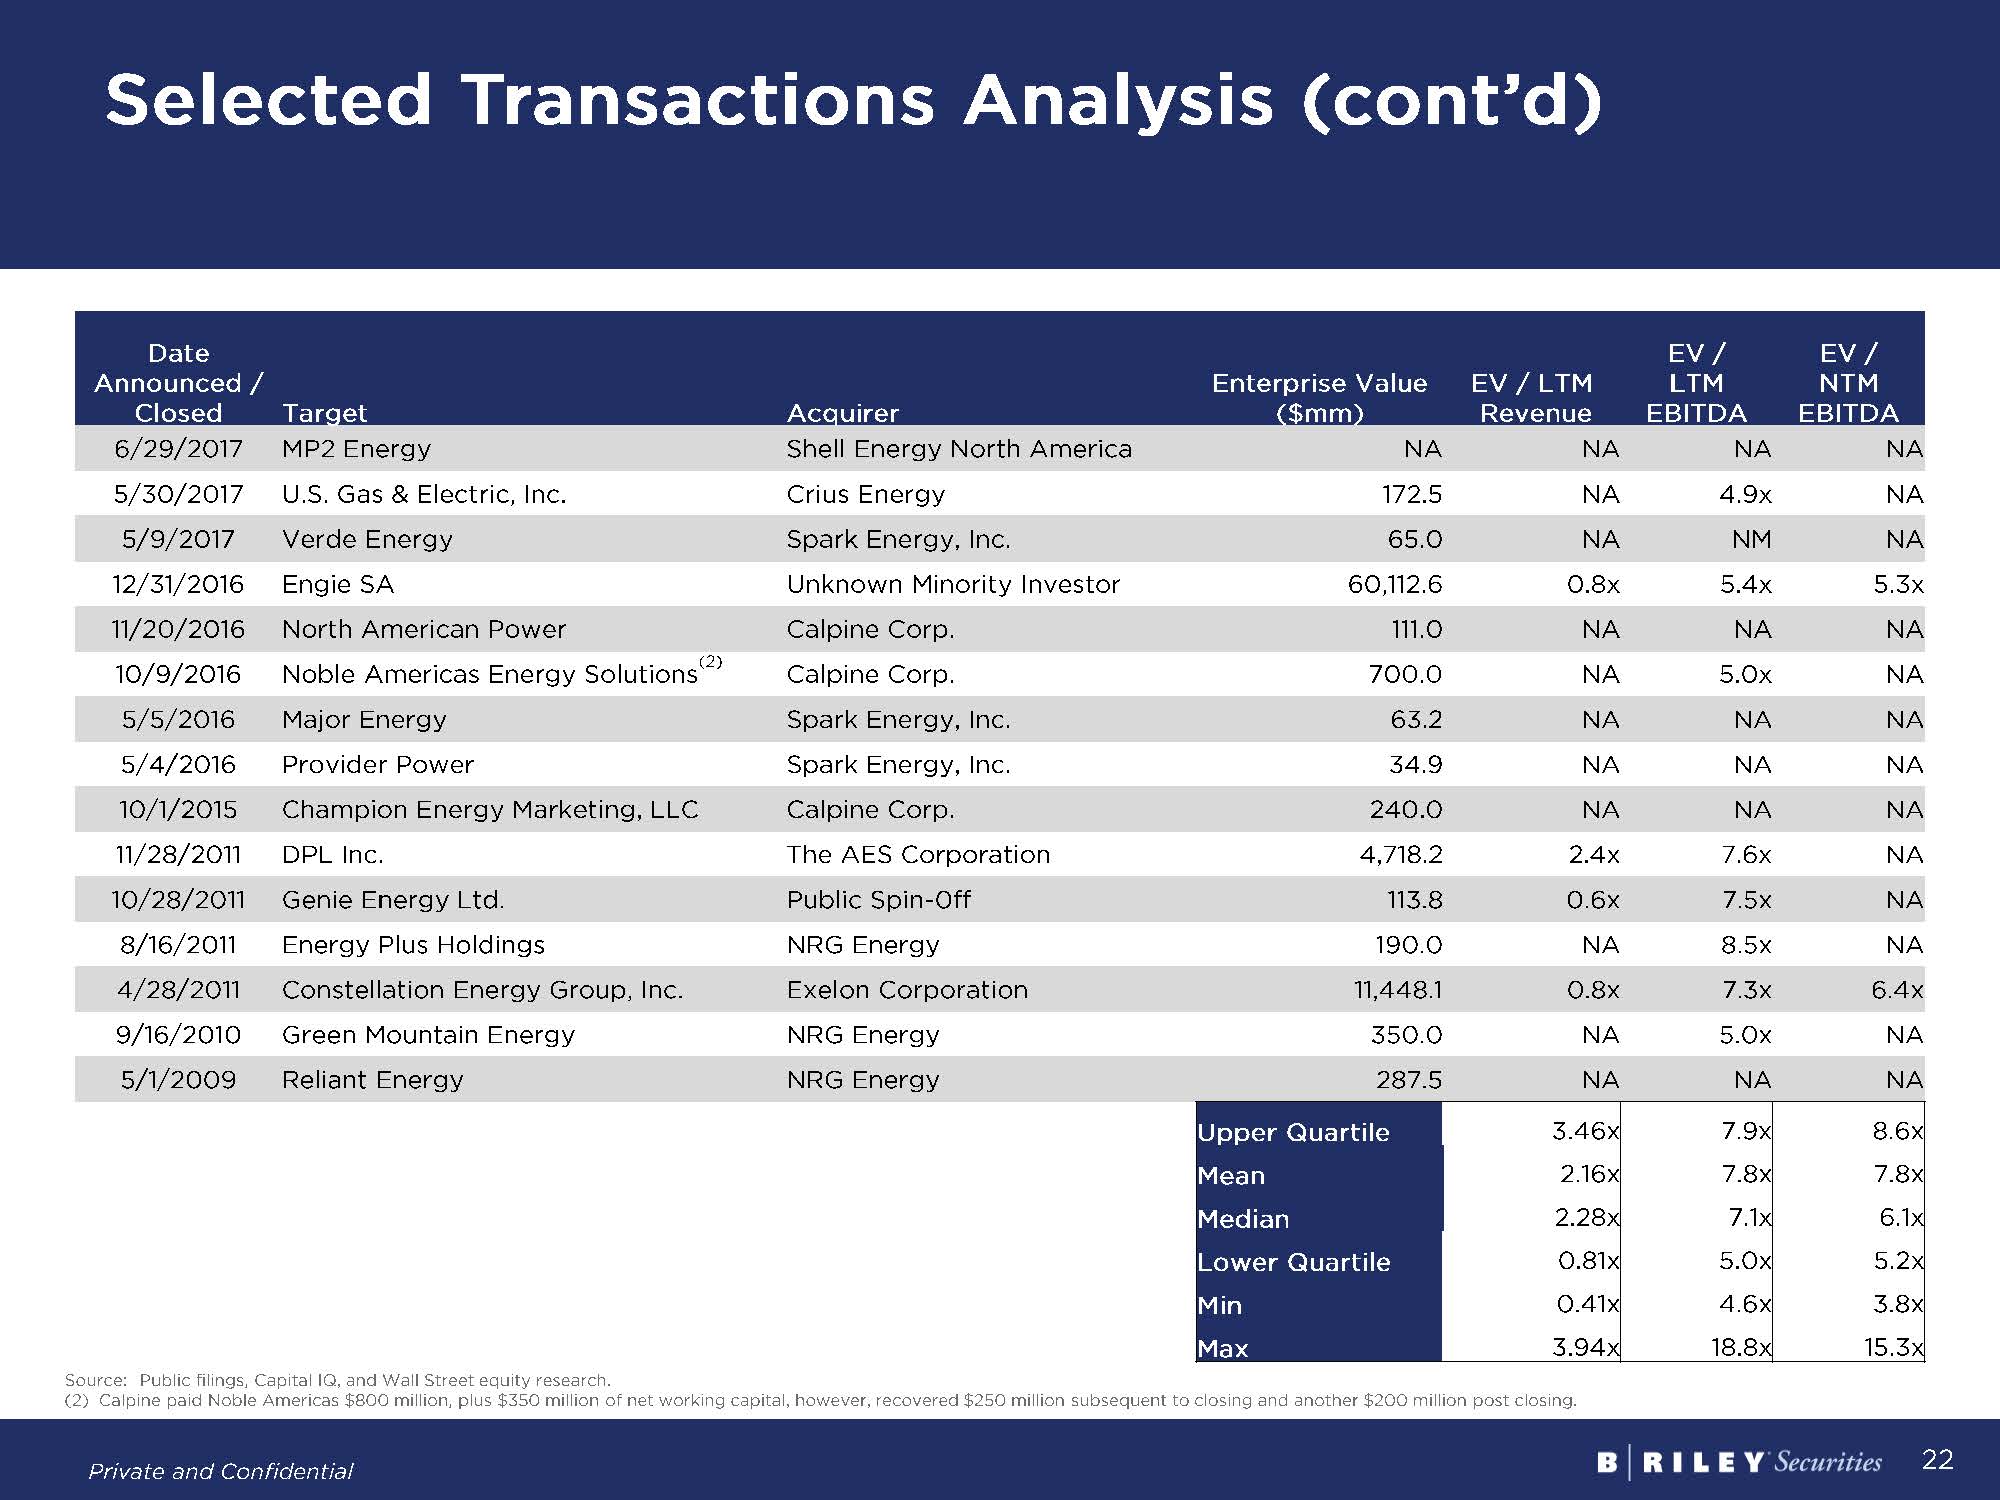
Date Announced / Closed Target Acquirer Enterprise Value ($mm) EV / LTM Revenue EV / LTM EBITDA EV / NTM EBITDA 6/29/2017 MP2 Energy Shell Energy North America NA NA NA NA 5/30/2017 U.S. Gas & Electric, Inc. Crius Energy 172.5 NA 4.9x NA 5/9/2017 Verde Energy Spark Energy, Inc. 65.0 NA NM NA 12/31/2016 Engie SA Unknown Minority Investor 60,112.6 0.8x 5.4x 5.3x 11/20/2016 North American Power Calpine Corp. 111.0 NA NA NA 10/9/2016 Noble Americas Energy Solutions(2) Calpine Corp. 700.0 NA 5.0x NA 5/5/2016 Major Energy Spark Energy, Inc. 63.2 NA NA NA 5/4/2016 Provider Power Spark Energy, Inc. 34.9 NA NA NA 10/1/2015 Champion Energy Marketing, LLC Calpine Corp. 240.0 NA NA NA 11/28/2011 DPL Inc. The AES Corporation 4,718.2 2.4x 7.6x NA 10/28/2011 Genie Energy Ltd. Public Spin-0ff 113.8 0.6x 7.5x NA 8/16/2011 Energy Plus Holdings NRG Energy 190.0 NA 8.5x NA 4/28/2011 Constellation Energy Group, Inc. Exelon Corporation 11,448.1 0.8x 7.3x 6.4x 9/16/2010 Green Mountain Energy NRG Energy 350.0 NA 5.0x NA 5/1/2009 Reliant Energy NRG Energy 287.5 NA NA NA Upper Quartile 3.46x 7.9x 8.6x Mean 2.16x 7.8x 7.8x Median 2.28x 7.1x 6.1x Lower Quartile 0.81x 5.0x 5.2x Min 0.41x 4.6x 3.8x Max 3.94x 18.8x 15.3x Selected Transactions Analysis (cont’d) Source: Public filings, Capital IQ, and Wall Street equity research. (2) Calpine paid Noble Americas $800 million, plus $350 million of net working capital, however, recovered $250 million subsequent to closing and another $200 million post closing.
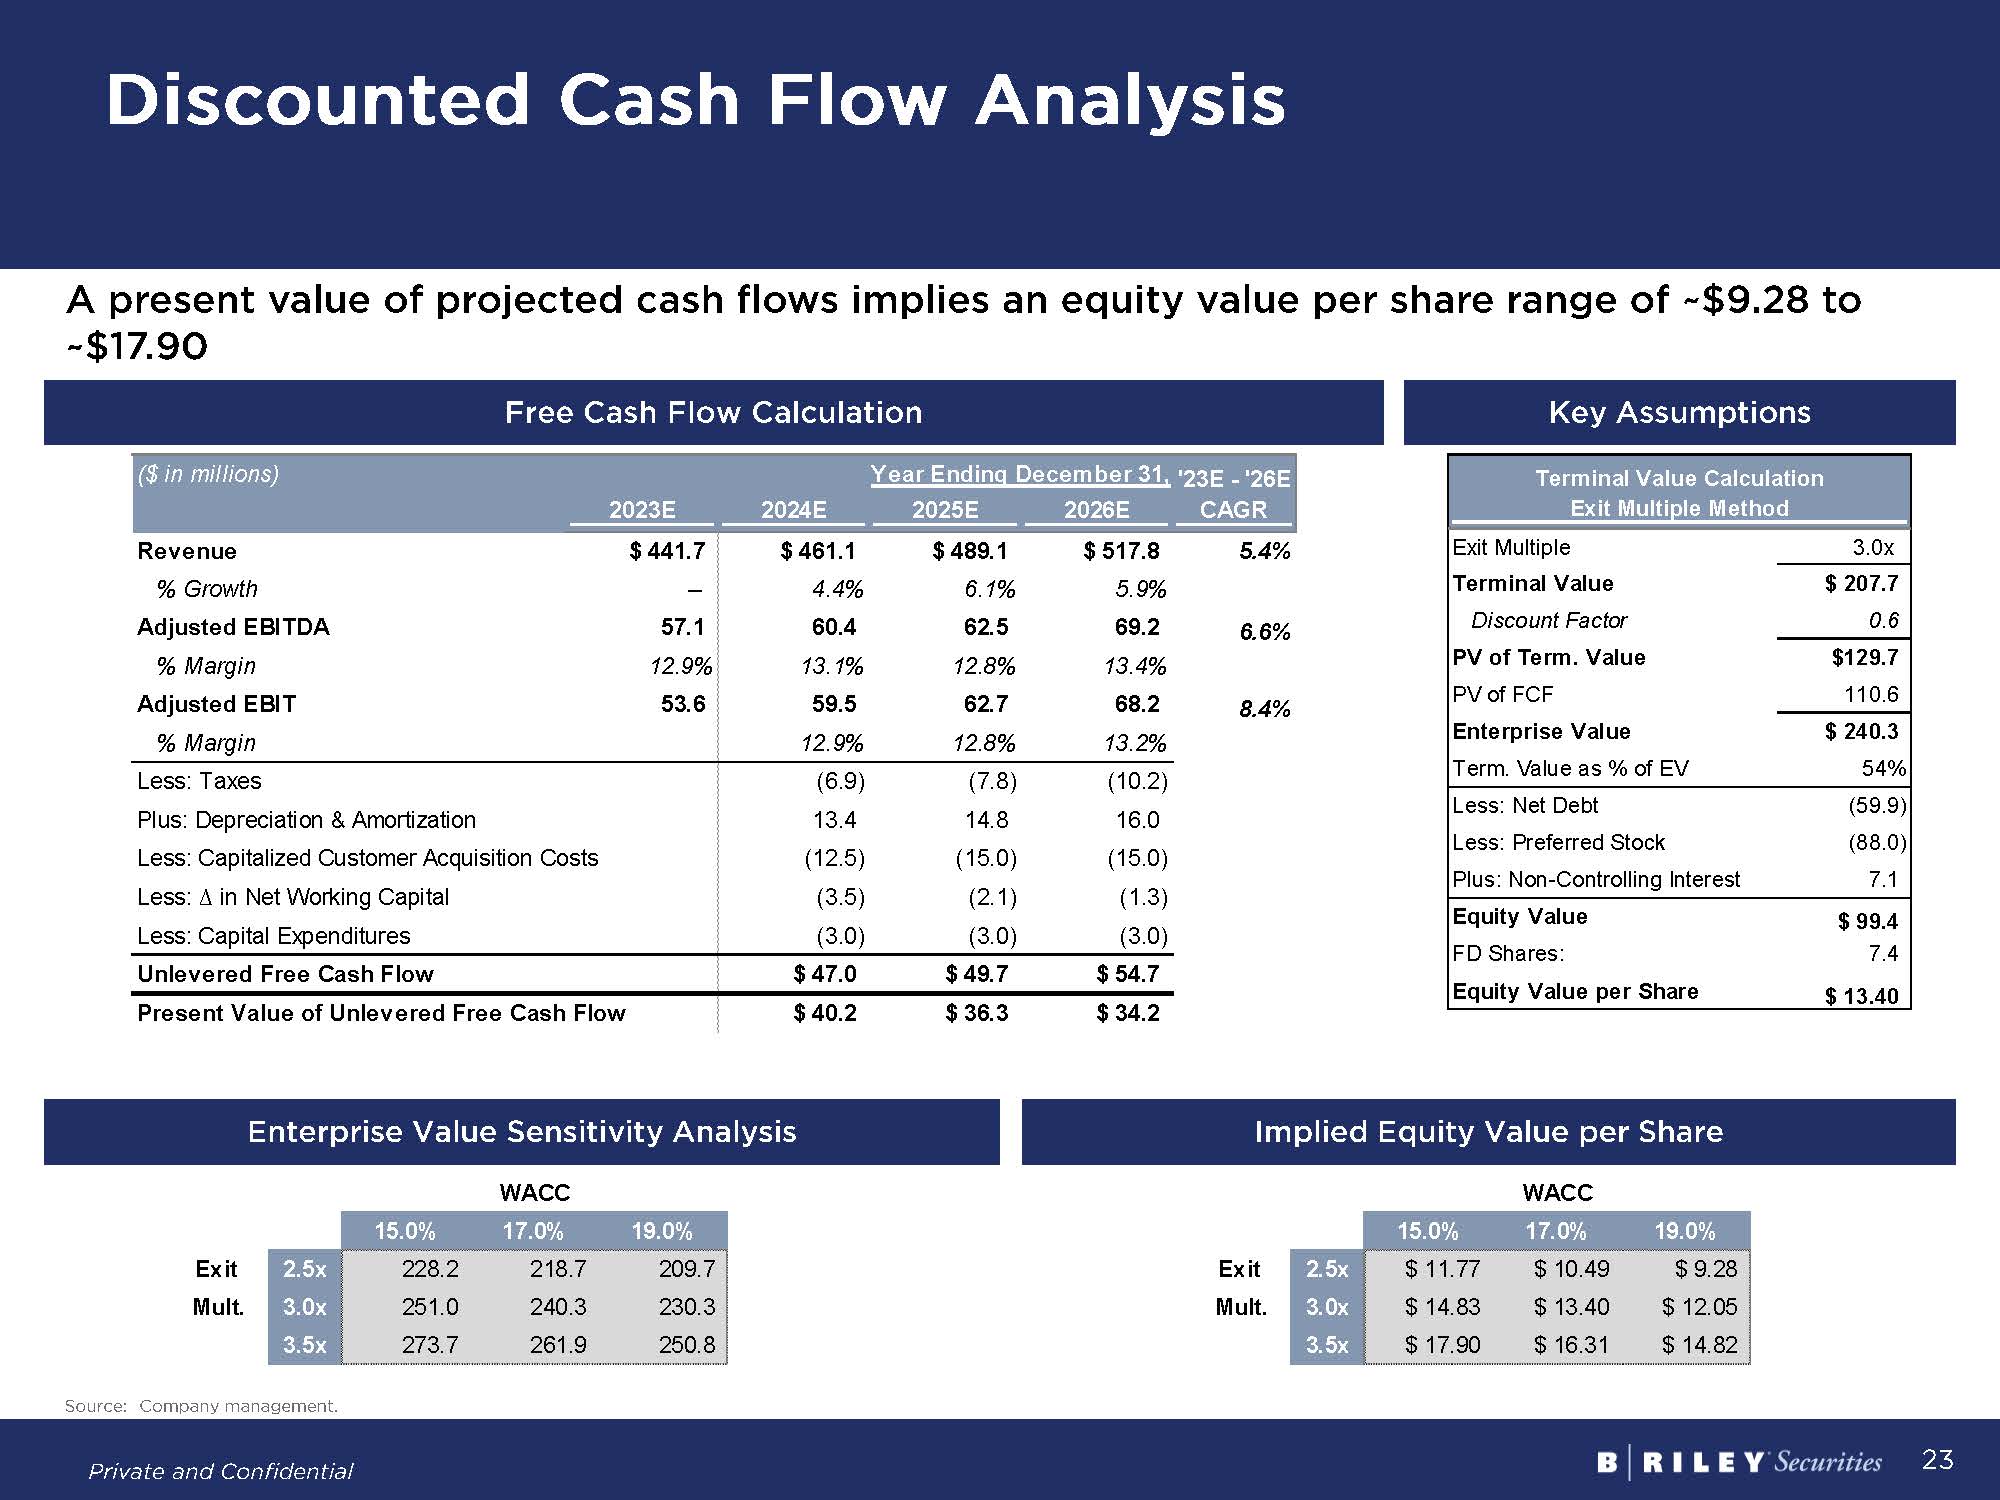
Discounted Cash Flow Analysis A present value of projected cash flows implies an equity value per share range of ~$9.28 to ~$17.90 Source: Company management. Free Cash Flow Calculation Key Assumptions Enterprise Value Sensitivity Analysis Implied Equity Value per Share
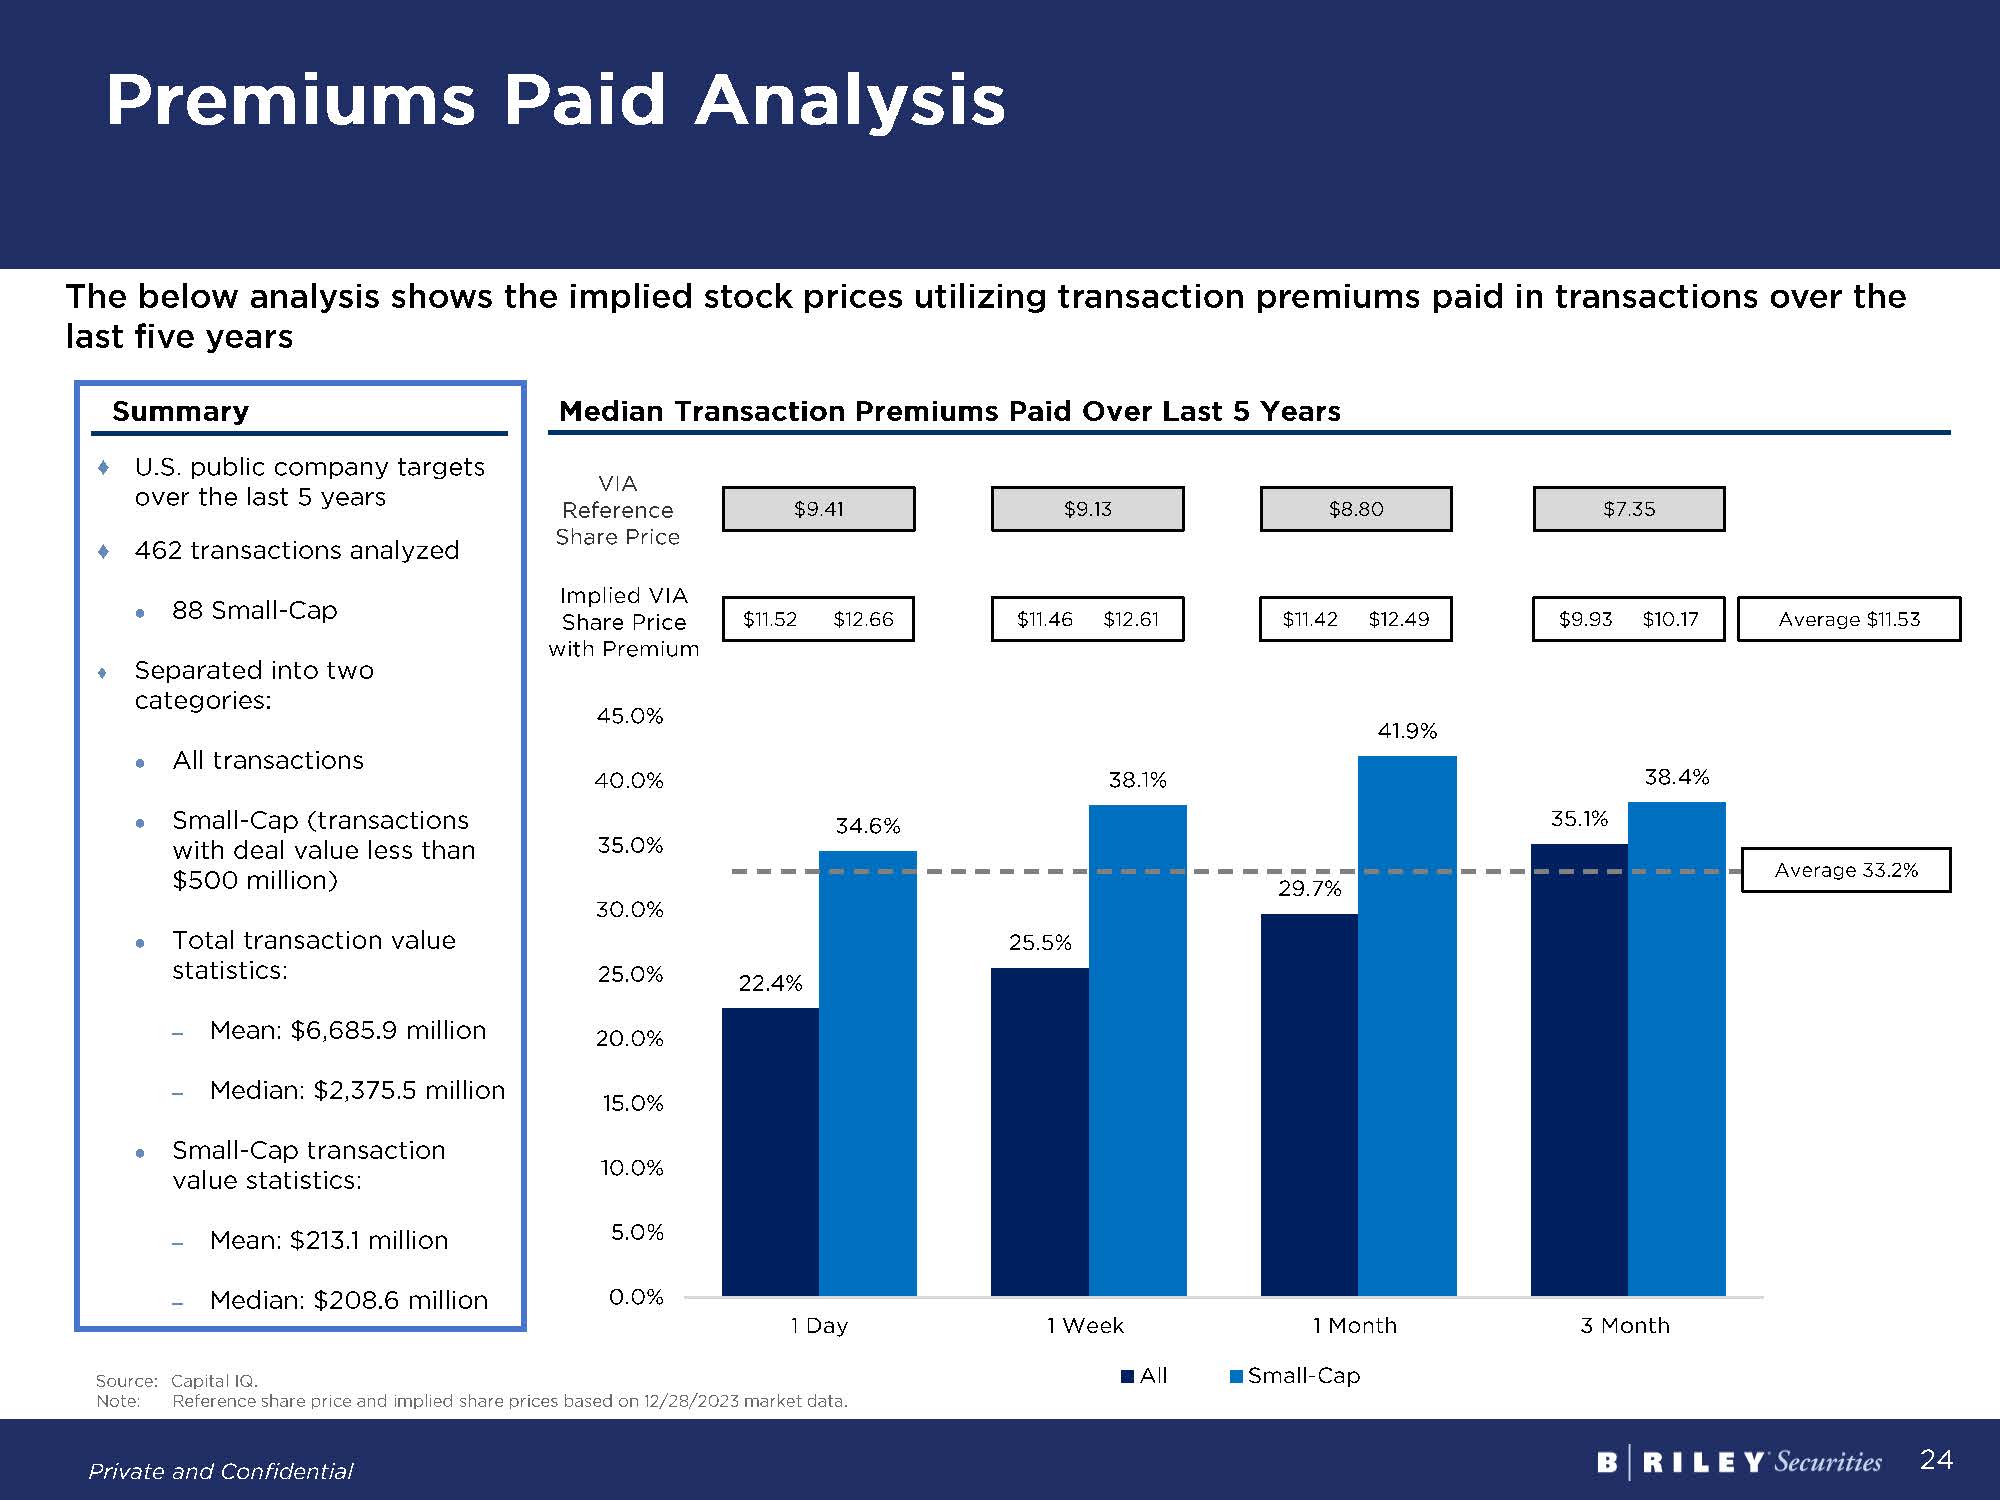
Premiums Paid Analysis The below analysis shows the implied stock prices utilizing transaction premiums paid in transactions over the last five years Source: Capital IQ. Note: Reference share price and implied share prices based on 12/28/2023 market data. $7.25 $9.30 $9.65 Average Implied VIA Share Price with Premium Average $11.53 Average 33.2% VIA Reference Share Price $11.52 $12.66 $9.41 Summary U.S. public company targets over the last 5 years 462 transactions analyzed 88 Small-Cap Separated into two categories: All transactions ��Small-Cap (transactions with deal value less than $500 million) Total transaction value statistics: Mean: $6,685.9 million Median: $2,375.5 million Small-Cap transaction value statistics: Mean: $213.1 million Median: $208.6 million Median Transaction Premiums Paid Over Last 5 Years $11.46 $12.61 $9.13 $11.42 $12.49 $8.80 $9.93 $10.17 $7.35

4 Appendix
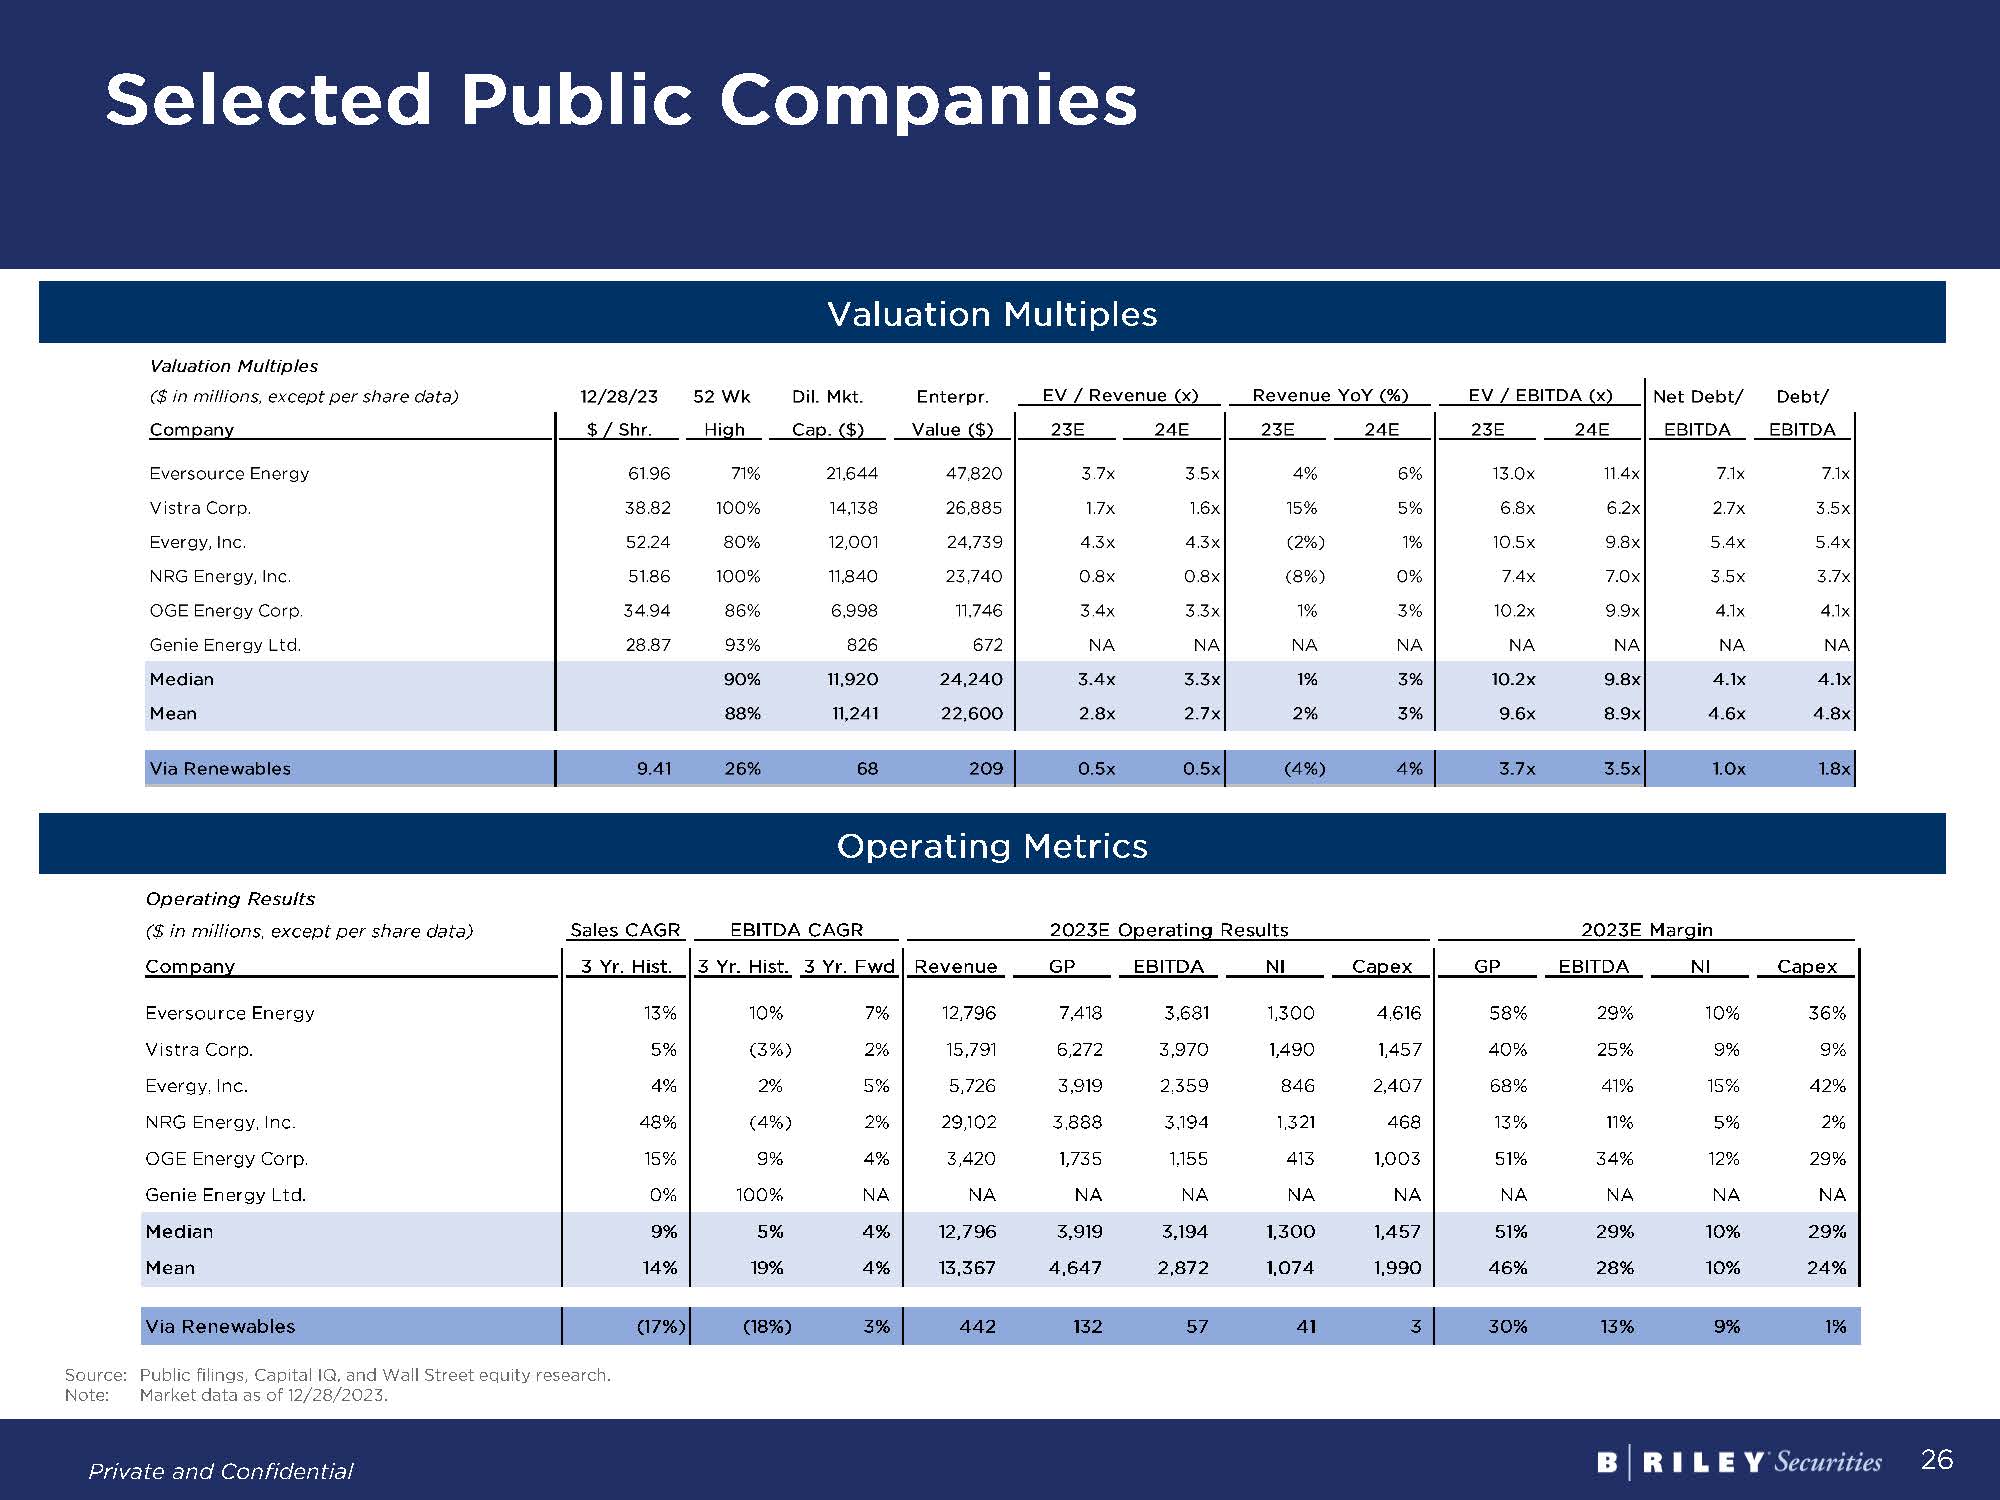
Selected Public Companies Valuation Multiples Operating Metrics Source: Public filings, Capital IQ, and Wall Street equity research. Note: Market data as of 12/28/2023.

Weighted Average Cost of Capital Calculation Source: Public filings, Capital IQ, and Wall Street equity research. Note: Market data as of 12/6/23. Based on rate as of 12/6/23. As per Duff & Phelps data. As per Duff & Phelps data.

For more information, please visit www.brileysecurities.com