Exhibit 99.2
|
|
| Fourth Quarter and Full Year 2016 Financial Results Presentation NASDAQ: GNBC January 26, 2017 |

| Today’s Speakers • • • Manny Mehos – Chairman and Chief Executive Officer Geoff Greenwade – President and Bank Chief Executive Officer Donald Perschbacher – Executive Vice President and Corporate Chief Credit Officer • Elizabeth Vandervoort – Executive Vice President and Interim Chief Financial Officer 2 |

| Safe Harbor The following information contains, or may be deemed to contain, "forward-looking statements" (as defined in the U.S. Private Securities Litigation Reform Act of 1995) giving Green Bancorp, Inc.’s (“Green Bancorp”) expectations or predictions of future financial or business performance or conditions. Most forward-looking statements contain words that identify them as forward-looking, such as "plan", "seek", "expect", "intend", "estimate", "anticipate", "believe", "project", "opportunity", "target", "goal", "growing“, "continue“, “positions,” “prospects” or “potential,” by future conditional verbs such as “will,” “would,” “should,” “could” or “may”, or by variations of such words or by similar expressions that relate to future events, as opposed to past or current events. By their nature, forward-looking statements are not statements of historical facts and involve risks and uncertainties because they relate to events and depend on circumstances that may or may not occur in the future. These statements give Green Bancorp's current expectation of future events or its future performance and do not relate directly to historical or current events or Green Bancorp's historical or future performance. As such, Green Bancorp's future results may vary from any expectations or goals expressed in, or implied by, the forward-looking statements included in this presentation, possibly to a material degree. Green Bancorp cannot assure you that the assumptions made in preparing any of the forward-looking statements will prove accurate or that any long-term financial goals will be realized. All forward-looking statements included in this presentation speak only as of the date made, and Green Bancorp undertakes no obligation to update or revise publicly any such forward-looking statements, whether as a result of new information, future events, or otherwise. In particular, Green Bancorp cautions you not to place undue weight on certain forward-looking statements pertaining to potential growth opportunities or long-term financial goals set forth herein. Green Bancorp's business is subject to numerous risks and uncertainties, which may cause future results of operations to vary significantly from those presented herein. In addition to factors previously disclosed in Green Bancorp’s reports filed with the SEC and those identified elsewhere in this communication, the following factors among others, could cause actual results to differ materially from forward-looking statements: difficulties and delays in integrating the Green Bancorp and Patriot Bancshares, Inc. businesses or fully realizing cost savings and other benefits; business disruption following the proposed transaction; changes in asset quality and credit risk; the inability to sustain revenue and earnings growth; changes in interest rates and capital markets; inflation; customer borrowing, repayment, investment and deposit practices; customer disintermediation; the introduction, withdrawal, success and timing of business initiatives; competitive conditions; the inability to realize cost savings or revenues or to implement integration plans and other consequences associated with mergers, acquisitions and divestitures; economic conditions; and the impact, extent and timing of technological changes, capital management activities, and other actions of the Federal Reserve Board and legislative and regulatory actions and reforms. Annualized, pro forma, projected and estimated numbers are used for illustrative purpose only, are not forecasts and may not reflect actual results. 3 |
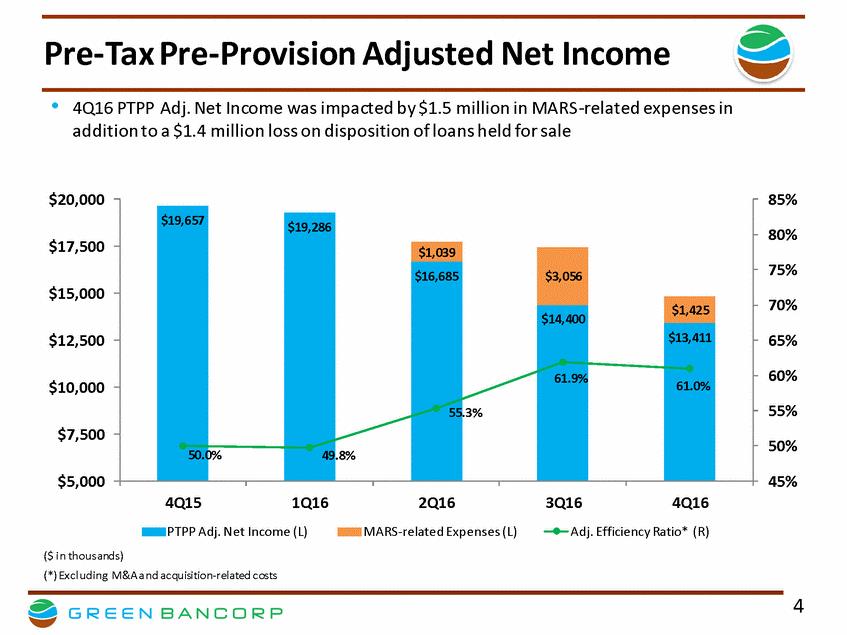
| Pre-Tax Pre-Provision Adjusted Net Income •4Q16 PTPP Adj. Net Income was impacted by $1.5 million in MARS-related expenses in addition to a $1.4 million loss on disposition of loans held for sale $20,000 85% 80% $17,500 75% $15,000 70% $12,500 65% 60% $10,000 55% .3% $7,500 50% .0% $5,000 45% 4Q15 1Q16 2Q16 MARS-related Expenses (L) 3Q16 4Q16 PTPP Adj. Net Income (L) Adj. Efficiency Ratio* (R) ($ i n thous ands) (*) Excl uding M&A a nd acquisition-related costs 4 $19,657 50 $19,286 49 .8% $1,039 $3,056 $16,685 55 $1,425 $14,400 61.9% $13,411 61.0% |
| Managed Asset Reduction Strategy ‘MARS’ • • MARS program was announced on April 28, 2016 during the first quarter conference call Primary goal of MARS is to resolve, primarily via payoff or sale, the company’s energy and other classified assets − Since inception, the program has resolved $157 million of energy production and oil field service loans During the fourth quarter, $32.8 million of energy loans were moved to the bank’s holding company and marked to their fair market value − These loans consisted of: − $20.5 million of energy production loans − $12.3 million of oil field service loans The company’s total energy exposure stood at $95.5 million or 3.1% of total loans as of December 31, 2016 (excluding $24.0 million of loans held for sale), comprised of $14.0 million in energy production loans and $81.5 million in oil field services loans • • 5 |
|
|
| Overview of Energy Portfolio Progress ($ in millions) $ 166 $ 140 $ 120 $ 104 $ 24 $ 82 $ 111 $ 110 $ 82 $ 65 $ 38 $ 14 1Q16 2Q16 (incl. HFS) 3Q16 (incl. HFS) 4Q16 (incl. HFS) HFS 4Q16 (excl. HFS) Energy Production Oil Field Services Held for Sale 6 $ 169 $ 96 $ 250 $ 277 Energy Portfolio Resolution History |
| Deposit Update • As of Dec. 31, 2016 ($ in millions) Total deposits increased by $58.8 million during the fourth quarter to $3.4 billion Noninterest-bearing deposits were 19.3% of deposits at December 31, 2016, compared to 18.6% as of September 30, 2016 Cost of deposits including noninterest-bearing was 0.66%, roughly stable compared to the third quarter $4,000 $3,500 $3,000 $2,500 $2,000 $1,500 $1,000 $500 $0 • • 4Q15 1Q16 2Q16 3Q16 4Q16 Certificates and other time deposits Savings Money market Interest-bearing transaction Noninterest-bearing 7 Total Deposit Composition Highlights |
| Loan Update • As of Dec. 31, 2016 ($ in millions) Total loans increased by $50.6 million during the fourth quarter to $3.1 billion Loan yield for the fourth quarter of 2016 was 4.71%, down 6 bps compared to the third quarter $3,500 $3,000 • $2,500 $2,000 – $1,500 Loan yield, excluding fees, for the fourth quarter was 4.29%, up 9 bps from the third quarter Fees and discounts at payoff contributed approximately 9 basis points to the fourth quarter loan yield Accretion of fees and discounts (net) contributed approximately 33 basis points to the fourth quarter loan yield $1,000 $500 – $0 4Q15 1Q16 2Q16 3Q16 4Q16 Other consumer Residential mortgage Construction, land & land development Commercial real estate Owner occupied commercial real estate Commercial & industrial – 8 Total Loan Composition Highlights |
| Existing Banker Capacity • Our current staff of bankers has the capacity to support up to $4 billion of loans and deposits • • Private Banker Specialty Banker As of December 31, 2016 ‒ ‒ ‒ ‒ DFW – 5 DFW – 7 HOU – 4 OTH – 3 • Business Banker 5% ‒ ‒ 20% DFW – 7 HOU – 9 18% • Deposit Relationship Manager ‒ DFW – 8 ‒ HOU – 10 • Commercial Banker 14% ‒ ‒ ‒ DFW – 13 HOU – 21 OTH – 3 41% Private Banker - 5 Business Banker - 16 Commercial Banker - 37 Specialty Banker - 14 Deposit Relationship Manager - 18 DFW – Dallas/Fort Worth/Arlington MSA HOU – Houston/Sugar Land/Baytown MSA OTH – Other MSAs 9 Banking Staff Regional Distribution |
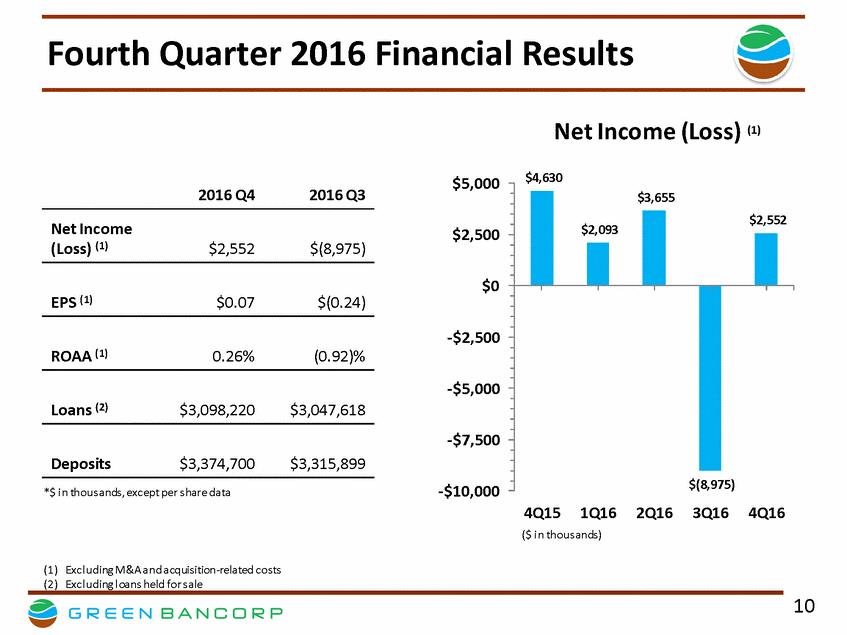
| Fourth Quarter 2016 Financial Results Net Income (Loss) (1) $4,630 $5,000 2016 Q4 2016 Q3 Net Income (Loss) (1) $2,500 $2,552 $(8,975) $0 EPS (1) $0.07 $(0.24) -$2,500 ROAA (1) 0.26% (0.92)% -$5,000 Loans (2) $3,098,220 $3,047,618 -$7,500 Deposits $3,374,700 $3,315,899 -$10,000 *$ i n thous ands, except per s hare data 4Q15 1Q16 2Q16 3Q16 4Q16 ($ i n thous ands) (1) Excl uding M&A a nd a cquisition-related costs (2) Excl uding l oans held for s ale 10 $3,655 $2,093 $2,552 $(8,975) |
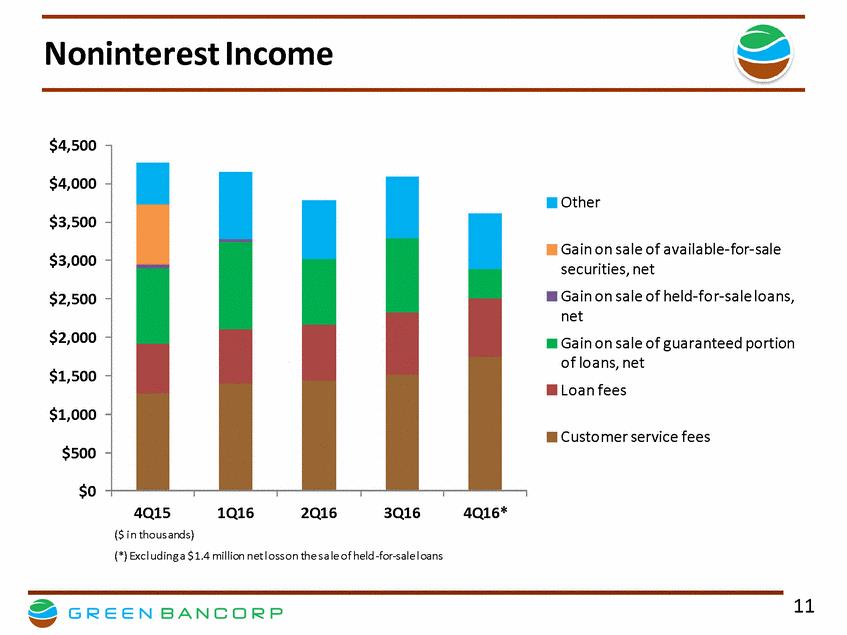
| Noninterest Income $4,500 $4,000 Other $3,500 Gain on sale of available-for-sale securities, net Gain on sale of held-for-sale loans, net Gain on sale of guaranteed portion of loans, net Loan fees $3,000 $2,500 $2,000 $1,500 $1,000 Customer service fees $500 $0 4Q15 ($ i n thous ands) 1Q16 2Q16 3Q16 4Q16* (*) Excl uding a $1.4 million net l oss on the s a le of held -for-sale l oans 11 |
| Noninterest Expense $25,000 M&A and acquisition related costs Other $20,000 $15,000 Professional and regulatory fees Occupancy $10,000 Salaries and employee benefits $5,000 $0 4Q15 ($ in thousands) 1Q16 2Q16 3Q16 4Q16 12 |
| Net Interest Income and Net Interest Margin $36,000 5.50% $34,228 $31,000 5.00% $26,000 4.50% NII (L) 4.22% NIM (R) $21,000 4.00% Loan Yield (R) Loan Yield excl. Fees (R) $16,000 3.50% $11,000 3.00% 4Q15 ($ in thousands) 1Q16 2Q16 3Q16 4Q16 13 Net Interest Income Net Interest Margin $35,007 4.91% 3.92% $33,541$33,675 4.81% 4.29% 3.87% 4.76% 4.29% 3.74% 4.77% 4.20% 3.62% $32,184 4.71% 4.29% 3.40% |
| Credit Quality • Nonperforming assets (NPAs) totaled $106.3 million or 2.64% of period end assets at December 31, 2016 compared to $130.1 million or 3.31% of period end assets at September 30, 2016 • Excluding loans held for sale, total nonperforming assets would have been $99.7 million or 2.48% of period end total assets at December 31, 2016 • Allowance for loan losses was 0.85% of total loans at December 31, 2016, and the allowance for loan losses plus the acquired loan net discount to total loans adjusted for the acquired loan net discount was 1.17% • Provision expense of $9.5 million in the fourth quarter of 2016 reflects the addition of: − $8.6 million related to energy reserves 14 |
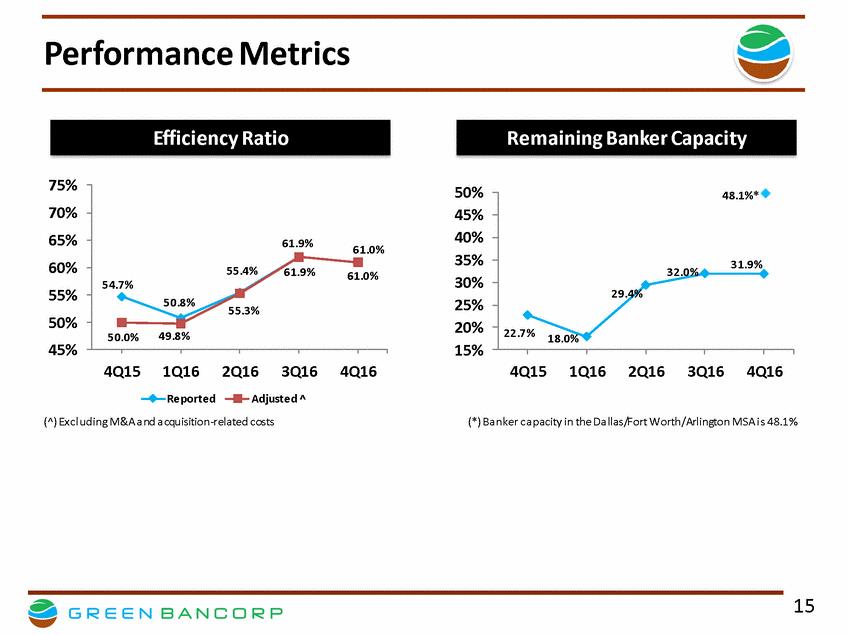
| Performance Metrics 75% 70% 65% 60% 55% 50% 45% 50% 45% 40% 35% 30% 25% 20% 15% 4Q15 1Q162Q16 3Q16 4Q16 4Q15 1Q16 2Q16 3Q16 4Q16 Reported Adjusted ^ (^) Excl uding M&A a nd a cquisition-related costs (*) Ba nker ca pacity in the Da llas/Fort Worth/Arlington MSA i s 48.1% 15 48.1%* 32.0%31.9% 29.4% 22.7%18.0% 61.9%61.0% 55.4%61.9%61.0% 54.7% 50.8%55.3% 50.0% 49.8% Efficiency Ratio Remaining Banker Capacity |
| Question & Answer Session 16 |