Exhibit 99.2
![](https://capedge.com/proxy/8-K/0001140361-19-013330/ex99_2slide1.jpg)
Q2 2019 Earnings Presentation July 24, 2019
![](https://capedge.com/proxy/8-K/0001140361-19-013330/ex99_2slide2.jpg)
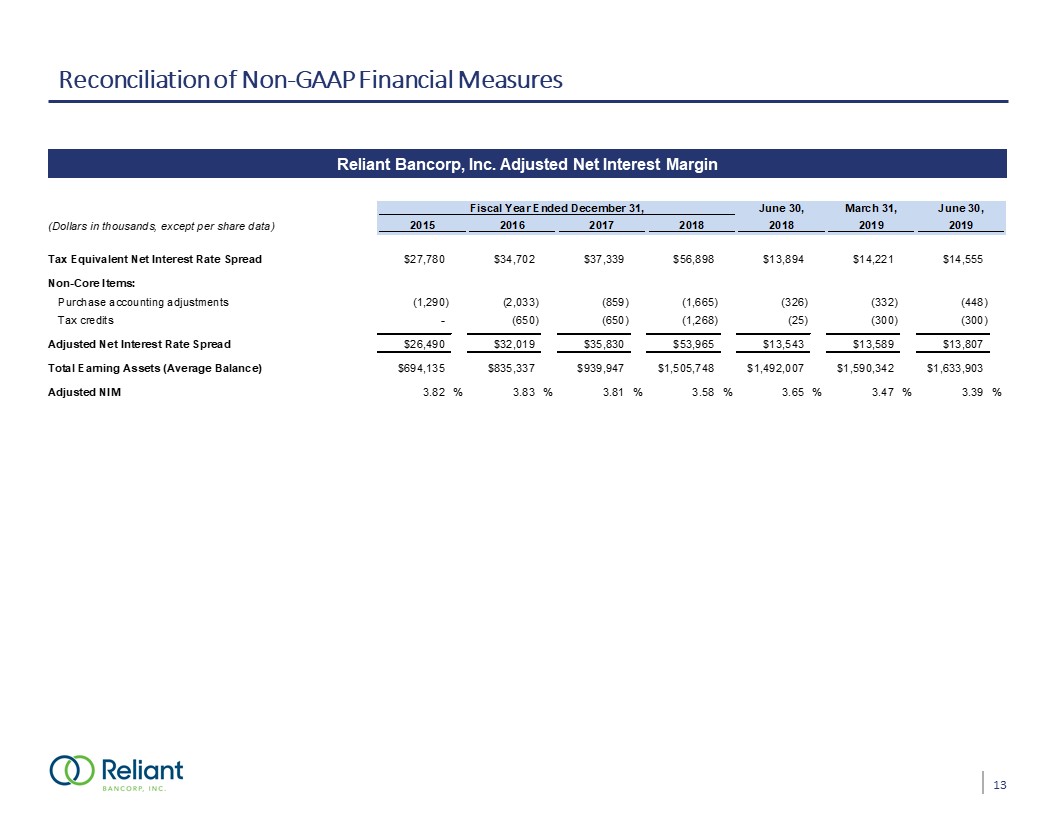
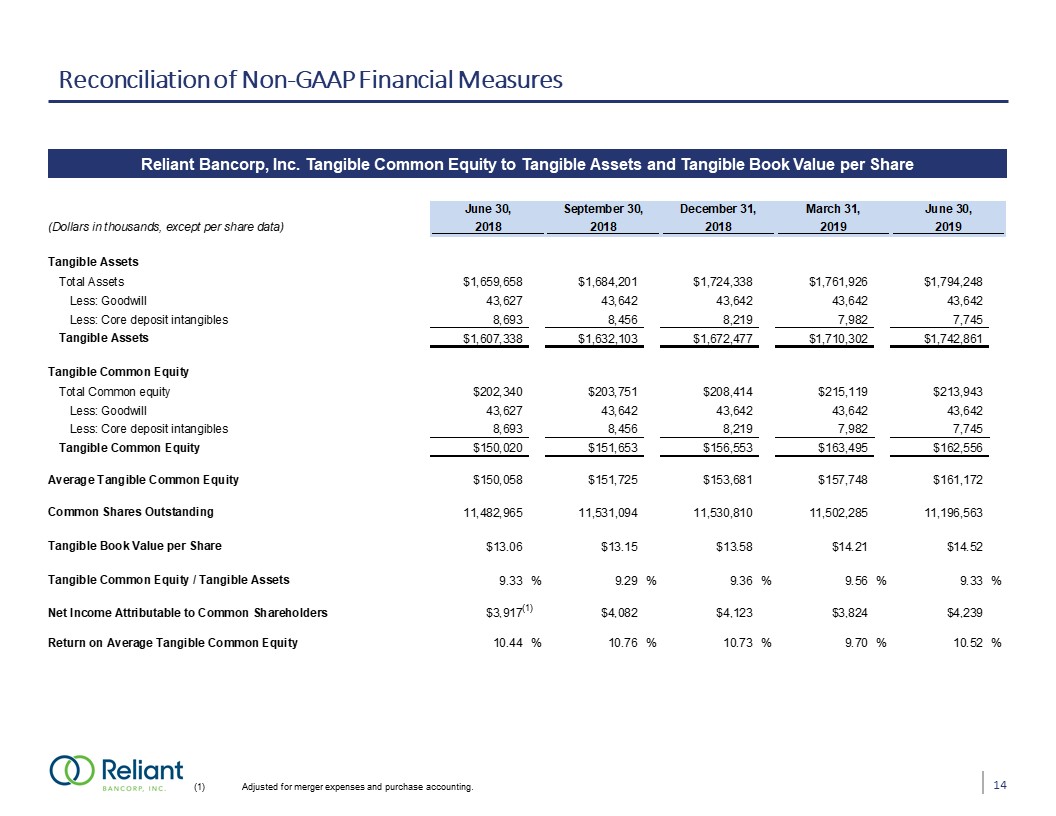
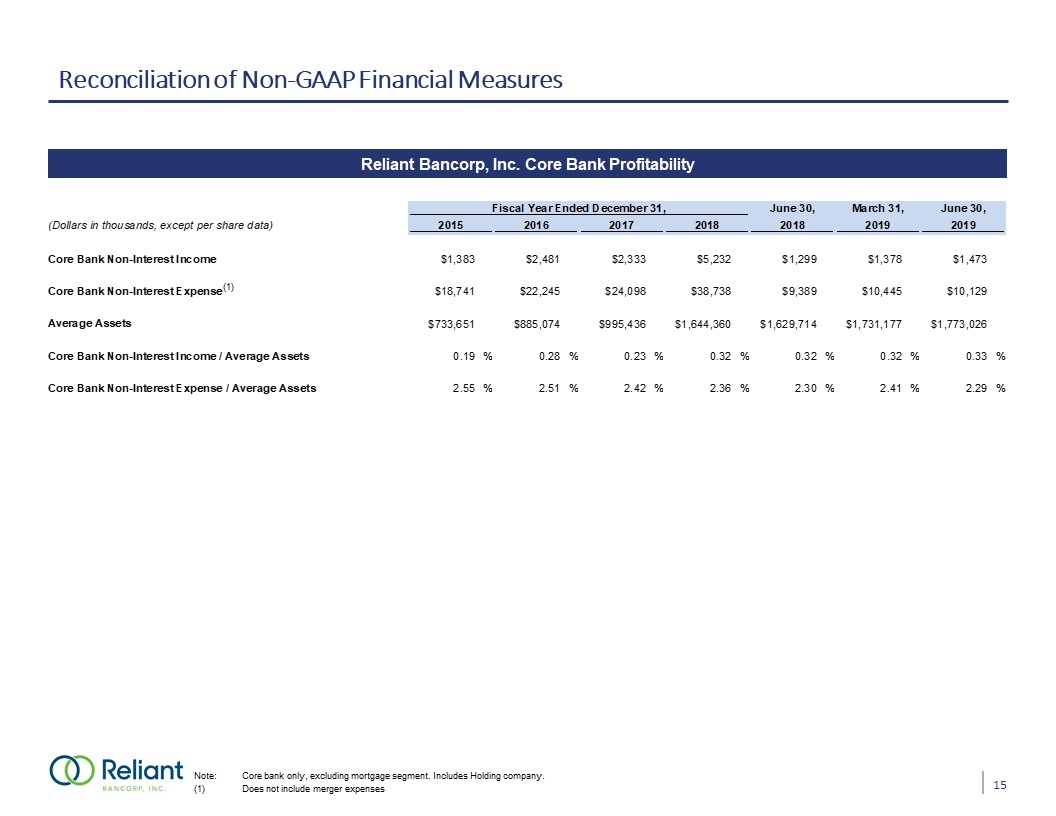
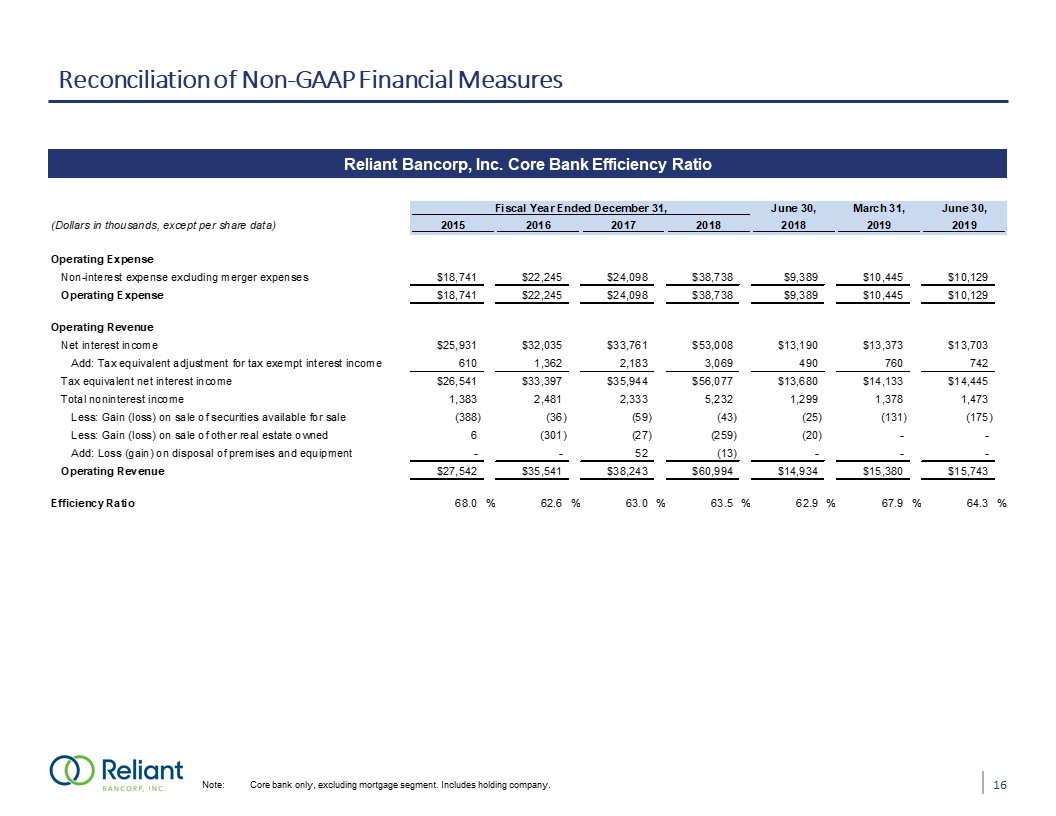
* Safe Harbor Statements FORWARD LOOKING STATEMENTSAll statements, other than statements of historical fact, included in this presentation, including any oral statements made regarding content of this presentation, are “forward-looking statements” within the meaning of Section 27A of the Securities Act of 1933, as amended, and Section 21E of the Securities Exchange Act of 1934, as amended, and are made pursuant to the safe harbor provisions of the Private Securities Litigation Reform Act of 1995. The words “believe,” “anticipate,” “expect,” “may,” “will,” “assume,” “should,” “predict,” “could,” “would,” “intend,” “targets,” “estimates,” “projects,” “plans,” and “potential,” and other similar words and expressions of the future, are intended to identify such forward-looking statements, but other statements not based on historical information may also be considered forward-looking, including statements about the future financial and operating results of Reliant Bancorp, Inc. (the “Company”) and the Company’s plans, objectives, and intentions. All forward-looking statements are subject to risks, uncertainties, and other factors that may cause the actual results, performance, or achievements of the Company to differ materially from any results, performance, or achievements expressed or implied by such forward-looking statements. Such risks, uncertainties, and other factors include, among others: (1) the possibility that our asset quality could decline or that we experience greater loan losses than anticipated, (2) increased levels of other real estate, primarily as a result of foreclosures, (3) the impact of liquidity needs on our results of operations and financial condition, (4) competition from financial institutions and other financial service providers, (5) the effect of interest rate increases on the cost of deposits, (6) unanticipated weakness in loan demand or loan pricing, (7) lack of strategic growth opportunities or our failure to execute on those opportunities, (8) deterioration in the financial condition of borrowers resulting in significant increases in loan losses and provisions for those losses, (9) the ability to grow and retain low-cost core deposits and retain large, uninsured deposits, (10) our ability to effectively manage problem credits, (11) our ability to successfully implement efficiency initiatives on time and in amounts projected, (12) our ability to successfully develop and market new products and technology, (13) the impact of negative developments in the financial industry and U.S. and global capital and credit markets, (14) our ability to retain the services of key personnel, (15) our ability to adapt to technological changes, (16) risks associated with litigation, including the applicability of insurance coverage, (17) the vulnerability of Reliant Bank’s network and online banking portals, and the systems of parties with whom the Company and Reliant Bank contract, to unauthorized access, computer viruses, phishing schemes, spam attacks, human error, natural disasters, power loss, and other security breaches, (18) changes in state and federal laws, rules, regulations, or policies applicable to banks or bank or financial holding companies, including regulatory or legislative developments, (19) adverse results (including costs, fines, reputational harm, and/or other negative effects) from current or future litigation, regulatory examinations, or other legal and/or regulatory actions, and (20) general competitive, economic, political, and market conditions, including economic conditions in the local markets where we operate. Additional factors which could affect the forward-looking statements can be found in the Company’s annual report on Form 10-K, quarterly reports on Form 10-Q, and current reports on Form 8-K, in each case filed with or furnished to the Securities and Exchange Commission (the “SEC”) and available on the SEC’s website at http://www.sec.gov. The Company believes the forward-looking statements contained in this presentation are reasonable; however, many of such risks, uncertainties, and other factors are beyond the Company’s ability to control or predict and undue reliance should not be placed on any forward-looking statements, which are based on current expectations and speak only as of the date that they are made. The Company disclaims any obligation to update or revise any forward-looking statements. NON-GAAP FINANCIAL MEASURESThis presentation contains certain financial measures that are not measures recognized under U.S. generally accepted accounting principles (GAAP) and, therefore, are considered non-GAAP financial measures. Members of the Company’s management use these non-GAAP financial measures in their analysis of the Company’s performance, financial condition, and efficiency of operations. Management of the Company believes that these non-GAAP financial measures provide a greater understanding of ongoing operations, enhance comparability of results with prior periods, and demonstrate the effects of significant gains and charges in the current period. Management of the Company also believes that investors find these non-GAAP financial measures useful as they assist investors in understanding underlying operating performance and the analysis of ongoing operating trends. However, the non-GAAP financial measures discussed herein should not be considered in isolation or as a substitute for the most directly comparable or other financial measures calculated in accordance with GAAP. Moreover, the manner in which the non-GAAP financial measures discussed herein are calculated may differ from that of other companies reporting measures with similar names. You should understand how such other banking organizations calculate their financial measures similar to, or with names similar to, the non-GAAP financial measures we have discussed herein when comparing such non-GAAP financial measures.The non-GAAP financial measures contained in this presentation include, without limitation, adjusted net income attributable to common shareholders, adjusted return on averageassets (adjusted ROAA), adjusted return on average tangible common equity (adjusted ROATCE), ROATCE, adjusted quarterly earnings per share,adjusted net interest rate spread, adjusted NIM, tangible assets, tangible common equity, tangible book value per share (TBVPS), tangible common equity to tangible assets,adjusted non-interest expense, efficiency ratio, core bank efficiency ratio, and allowance for loan losses plus unamortized loan accretion to total loans.
![](https://capedge.com/proxy/8-K/0001140361-19-013330/ex99_2slide3.jpg)
Financial Highlights and Recent Developments * Quarterly Highlights for Q2’19 Financial Results (1) Gross figure(2) Non-GAAP figures. Refer to appendix for “reconciliation of non-GAAP financial measures” Reported record EPS of $0.38 per common diluted share and $4.2 million of net income attributable to common shareholders for the second quarter of 2019.Loans Held for Investment grew at a 16.0% annualized rate crossing $1.3 billion.Generated $150.0 million of organic, in-market loans at a 5.5% WAR.Rotated $26.0 million from bond portfolio at a WAR of 2.8% into new loan growth at a WAR of 5.5%Reduced Non-Interest Expense (when mortgage company is excluded) by 3.0% quarter-over-quarter.Repurchased 363,000 common shares for $7.6 million during the quarter. Declared quarterly dividend of $0.09 on June 26th, a 12.5% increase over the quarterly dividend declared during second quarter of 2018 and 17th consecutive quarterly dividend. Repurchased 365,000 common shares for $8.3 million during 2019 (in total, have repurchased $8.3 million of common shares of the $12 million of common shares authorized by Board of Directors).Connie McGee and Linda Rebrovick joined the Reliant Bancorp, Inc. Board of Directors.Named new president for Maury / Hickman counties market. Recent Developments (1) (2) (2) (2) (2)
![](https://capedge.com/proxy/8-K/0001140361-19-013330/ex99_2slide4.jpg)
Why Reliant? * High Growth, Desirable MarketsFocused, Balanced Business ModelOpportunistic AcquisitionsOrganic, In-Market Loan & Deposit Growth Balanced, Sustainable GrowthDisciplined Approach to PricingMargin OptimizationFocus on Expense Management Strong Corporate GovernanceExperienced, Consistent LeadershipStable, Diverse WorkforceClient Focused Service Scalability of ModelDisciplined Credit CultureConservative Loan Reserves and Purchase DiscountsWell Capitalized Strategic Focus Company Culture Profitability and Growth Financial Strength
![](https://capedge.com/proxy/8-K/0001140361-19-013330/ex99_2slide5.jpg)
Experienced, Committed Leadership Team * Source: S&P Global Market Intelligence DeVan Ard, Jr. Chairman, President and CEO Former Area Executive in Middle Tennessee at AmSouth Bank Founder of Reliant Bank in 2006 38 years of banking experience / 14 years at RBNC / 20 years in Middle TN James Daniel DellingerEVP, Chief Financial Officer Former Chief Financial Officer at Premier Bank of Brentwood Former Chief Financial Officer at Erwin National Bank 27 years of banking experience / 13 years at RBNC / 22 years in Middle TN Louis E. HollowayEVP, Chief Operating Officer Executive Vice President – Chief Operating Officer since January 2018Former Chief Executive Officer of Community First, Inc. 42 years of banking experience / 1 year at RBNC / 33 years in Middle TN Alan MimsEVP, Chief Credit Officer Eddie Gammon EVP, Director of Operations Kim YorkEVP, Chief Strategy Officer John R. WilsonEVP, Chief Loan Officer Executive Vice President – Chief Credit Officer since December 2017Former Senior Examiner and Case Manager for the Federal Reserve Bank of Atlanta 30 years of banking experience / 2 years at RBNC / 2 years in Middle TN Executive Vice President – Director of Operations since March 2016 Former Senior Vice President of Operations at IBERIABANKFormer Senior Vice President – Director of Deposit Operations at Avenue Bank 34 years of banking experience / 3 years at RBNC / 4 years in Middle TN Executive Vice President – Chief Loan OfficerFormer Spring Hill Market President for Cumberland Bank 30 years of banking experience / 13 years at RBNC / 30 years in Middle TN Executive Vice President – Chief Strategy Officer since March 2017Former Senior Vice President and Chief Marketing Officer at Ascend Federal Credit Union 24 years of banking experience / 3 years at RBNC / 24 years in Middle TN
![](https://capedge.com/proxy/8-K/0001140361-19-013330/ex99_2slide6.jpg)
Diverse Deposit Portfolio Mix * Cost of Deposits: Cost of Funds: Note: $ in millions, unless otherwise specified. Data as of or for the three months ended each respective quarter or twelve months ended each year. Reflects consolidated numbers for Reliant Bancorp, Inc. Wholesale and Other Purchased Funds 0.38% 0.40% 0.61% 0.96% 1.34% 1.45% �� 0.42% 0.43% 0.66% 1.07% 1.44% 1.52% Total Deposits CAGR: 28.8% % of Total Deposits: Wt. Avg. Cost: Wt. Avg. Duration (Months): 1.73% 1.96% 2.19% 2.35% 2.34% 1.9 1.5 2.4 1.5 3.0
![](https://capedge.com/proxy/8-K/0001140361-19-013330/ex99_2slide7.jpg)
Balancing Growth and Profitability * Coupon + Fees: Growing Loan Portfolio(1) Notes: $ in millions, unless otherwise specified. Data as of or for the three months ended each respective quarter or twelve months ended each year. (1) Does not include loans held for sale. CAGR: 24.0% Loan Yields
![](https://capedge.com/proxy/8-K/0001140361-19-013330/ex99_2slide8.jpg)
Disciplined Credit Culture * Loan Reserves(1) Net Charge-Offs (Recoveries) / Average Loans Non Performing Assets / Total Assets Source: Company documentsNote: Data as of or for the three months ended each respective quarter.(1) Non-GAAP figure. Refer to appendix for “reconciliation of non-GAAP financial measures.”
![](https://capedge.com/proxy/8-K/0001140361-19-013330/ex99_2slide9.jpg)
* Diversified Lending Platform C&D Portfolio Commercial Real Estate Portfolio Source: S&P Global Market Intelligence, Company documentsNote: $ in millions, unless otherwise specified. Data as of or for the three months ended each respective quarter. Outstanding balance as a % of Total Capital
![](https://capedge.com/proxy/8-K/0001140361-19-013330/ex99_2slide10.jpg)
Growing, Profitable Core Bank (Excludes Mortgage Subsidiary Financial Results) * Core Bank Net Income(1) ($mm) Source: Company documentsNote: $ in millions, unless otherwise specified; Data as of or for the three months ended each respective quarter or twelve months ended each year.Includes holding companyCore bank excluding mortgage segment, Includes holding company. Does not include merger expenses. Refer to appendix for “reconciliation of non-GAAP financial measures.”Non-GAAP figure. Refer to appendix for “reconciliation of non-GAAP financial measures.” Core Bank Net Interest Income(2) ($mm) Core Bank Adjusted Non-Interest Expenses(2),(3) ($mm) Adj. NIM(4): Core Bank Efficiency(1),(2):
![](https://capedge.com/proxy/8-K/0001140361-19-013330/ex99_2slide20.jpg)
Financial Strength Positions Company for Growth 10 Source: Company documents, SNL FinancialNote: Data as of or for the three months ended each respective quarter; Chart and table reflect consolidated numbers for Reliant Bancorp, Inc.Estimated figures only since call is not finalized. Non-GAAP figure. Refer to appendix for “reconciliation of non-GAAP financial measures.” (1) (2)
![](https://capedge.com/proxy/8-K/0001140361-19-013330/ex99_2slide12.jpg)
Delivering Shareholder Value * Reported Quarterly Diluted EPS Tangible Book Value per Share(1) Reported ROAA Reported ROATCE(1) Source: Company documentsNote: Data as of or for the three months ended each respective quarter. (1) Non-GAAP figures. Refer to appendix for “reconciliation of non-GAAP financial measures”. CAGR: 11.2% Green bars indicate adjustments for merger expenses and purchase accounting
![](https://capedge.com/proxy/8-K/0001140361-19-013330/ex99_2slide13.jpg)
Appendix
![](https://capedge.com/proxy/8-K/0001140361-19-013330/ex99_2slide14.jpg)
Reconciliation of Non-GAAP Financial Measures 12 Reliant Bancorp, Inc. Adjusted Return on Average Assets and Average Tangible Common Equity and Earnings Per Share
![](https://capedge.com/proxy/8-K/0001140361-19-013330/ex99_2slide15.jpg)
Reconciliation of Non-GAAP Financial Measures 13 Reliant Bancorp, Inc. Adjusted Net Interest Margin
![](https://capedge.com/proxy/8-K/0001140361-19-013330/ex99_2slide16.jpg)
Reconciliation of Non-GAAP Financial Measures 14 Reliant Bancorp, Inc. Tangible Common Equity to Tangible Assets and Tangible Book Value per Share (1) Adjusted for merger expenses and purchase accounting. (1)
![](https://capedge.com/proxy/8-K/0001140361-19-013330/ex99_2slide17.jpg)
Reconciliation of Non-GAAP Financial Measures 15 Reliant Bancorp, Inc. Core Bank Profitability Note: Core bank only, excluding mortgage segment. Includes Holding company.(1) Does not include merger expenses (1)
![](https://capedge.com/proxy/8-K/0001140361-19-013330/ex99_2slide18.jpg)
Reconciliation of Non-GAAP Financial Measures 16 Reliant Bancorp, Inc. Core Bank Efficiency Ratio Note: Core bank only, excluding mortgage segment. Includes holding company.
![](https://capedge.com/proxy/8-K/0001140361-19-013330/ex99_2slide19.jpg)
Reconciliation of Non-GAAP Financial Measures 17 Reliant Bancorp, Inc. Loan Reserves