Exhibit 99.2

MAY 23, 2019 NASDAQ: RBNC Annual Meeting of Shareholders
1 Safe Harbor Statements Forward Looking StatementsAll statements, other than statements of historical fact, included in this presentation are “forward-looking statements” within the meaning of Section 27A of the Securities Act of 1933, as amended, and Section 21E of the Securities Exchange Act of 1934, as amended, and are made pursuant to the safe harbor provisions of the Private Securities Litigation Reform Act of 1995. The words “believe,” “anticipate,” “expect,” “may,” “will,” “assume,” “should,” “predict,” “could,” “would,” “intend,” “targets,” “estimates,” “projects,” “plans,” and “potential,” and other similar words and expressions of the future, are intended to identify such forward-looking statements, but other statements not based on historical information may also be considered forward-looking, including statements about the future financial and operating results of Reliant Bancorp, Inc. (the “Company”) and the Company’s plans, objectives, and intentions. All forward-looking statements are subject to risks, uncertainties, and other factors that may cause the actual results, performance, or achievements of the Company to differ materially from any results, performance, or achievements expressed or implied by such forward-looking statements. Such risks, uncertainties, and other factors include, among others: (1) the possibility that our asset quality could decline or that we experience greater loan losses than anticipated, (2) increased levels of other real estate, primarily as a result of foreclosures, (3) the impact of liquidity needs on our results of operations and financial condition, (4) competition from financial institutions and other financial service providers, (5) the effect of interest rate increases on the cost of deposits, (6) unanticipated weakness in loan demand or loan pricing, (7) lack of strategic growth opportunities or our failure to execute on those opportunities, (8) deterioration in the financial condition of borrowers resulting in significant increases in loan losses and provisions for those losses, (9) the ability to grow and retain low-cost core deposits and retain large, uninsured deposits, (10) our ability to effectively manage problem credits, (11) our ability to successfully implement efficiency initiatives on time and in amounts projected, (12) our ability to successfully develop and market new products and technology, (13) the impact of negative developments in the financial industry and U.S. and global capital and credit markets, (14) our ability to retain the services of key personnel, (15) our ability to adapt to technological changes, (16) risks associated with litigation, including the applicability of insurance coverage, (17) the vulnerability of Reliant Bank’s network and online banking portals, and the systems of parties with whom the Company and Reliant Bank contract, to unauthorized access, computer viruses, phishing schemes, spam attacks, human error, natural disasters, power loss, and other security breaches, (18) changes in state and federal laws, rules, regulations, or policies applicable to banks or bank or financial holding companies, including regulatory or legislative developments, (19) adverse results (including costs, fines, reputational harm, and/or other negative effects) from current or future litigation, regulatory examinations, or other legal and/or regulatory actions, and (20) general competitive, economic, political, and market conditions, including economic conditions in the local markets where we operate. Additional factors which could affect the forward-looking statements can be found in the Company’s annual report on Form 10-K, quarterly reports on Form 10-Q, and current reports on Form 8-K, in each case filed with or furnished to the Securities and Exchange Commission (the “SEC”) and available on the SEC’s website at http://www.sec.gov. The Company believes the forward-looking statements contained in this presentation are reasonable; however, many of such risks, uncertainties, and other factors are beyond the Company’s ability to control or predict and undue reliance should not be placed on any forward-looking statements, which are based on current expectations and speak only as of the date that they are made. The Company disclaims any obligation to update or revise any forward-looking statements contained in this presentation, which speak only as of the date hereof, whether as a result of new information, future events, or otherwise. Non-GAAP Financial MeasuresThis presentation contains certain financial measures that are not measures recognized under U.S. generally accepted accounting principles (GAAP) and, therefore, are considered non-GAAP financial measures. Members of the Company’s management use these non-GAAP financial measures in their analysis of the Company’s performance, financial condition, and efficiency of operations. Management of the Company believes that these non-GAAP financial measures provide a greater understanding of ongoing operations, enhance comparability of results with prior periods, and demonstrate the effects of significant gains and charges in the current period. Management also believes that investors find these non-GAAP financial measures useful as they assist investors in understanding underlying operating performance and the analysis of ongoing operating trends. However, the non-GAAP financial measures discussed herein should not be considered in isolation or as a substitute for the most directly comparable or other financial measures calculated in accordance with GAAP. Moreover, the manner in which the non-GAAP financial measures discussed herein are calculated may differ from that of other companies reporting measures with similar names. You should understand how such other banking organizations calculate their financial measures similar to, or with names similar to, the non-GAAP financial measures we have discussed herein when comparing such non-GAAP financial measures.This presentation contains certain non-GAAP financial measures, including, without limitation, tangible assets, tangible book value, tangible common equity, tangible common equity to assets, efficiency ratio, adjusted income return on average assets, and return on tangible common equity. A reconciliation of these non-GAAP financial measures to the most directly comparable GAAP measures are provided in the appendix to this presentation.
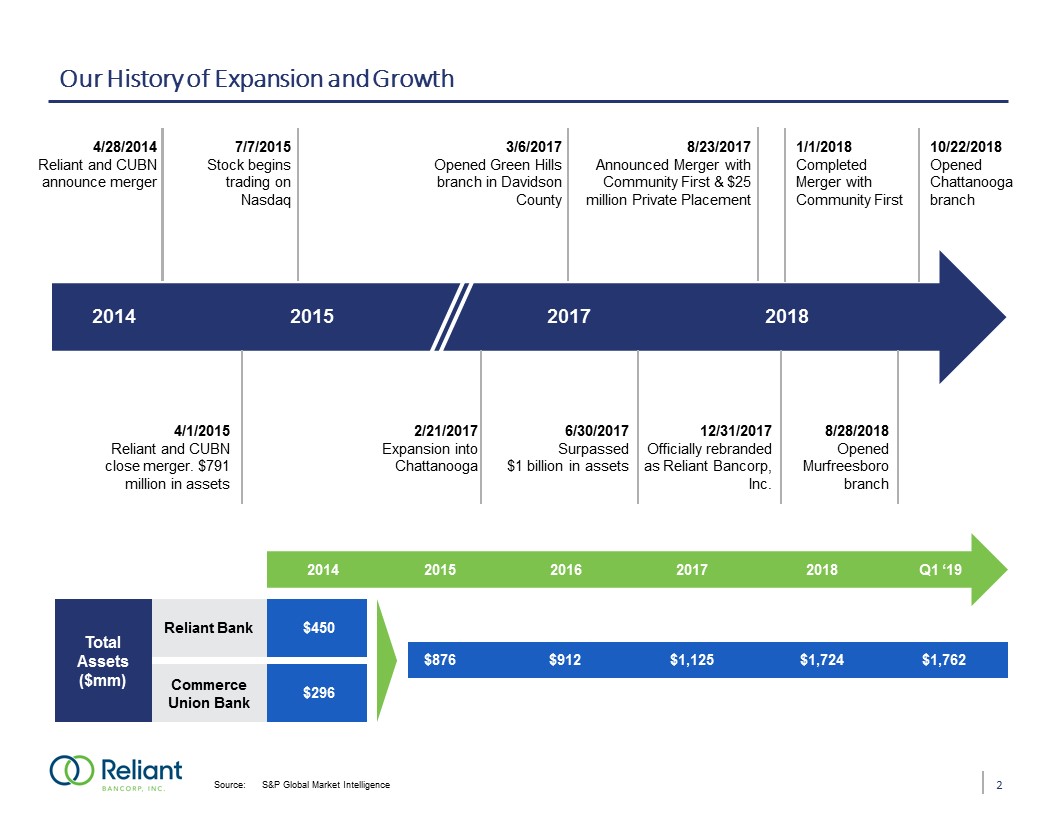
2 Source: S&P Global Market Intelligence 2014 2015 2017 4/1/2015Reliant and CUBN close merger. $791 million in assets 4/28/2014Reliant and CUBN announce merger 7/7/2015Stock begins trading on Nasdaq 3/6/2017Opened Green Hills branch in Davidson County Total Assets($mm) Reliant Bank Commerce Union Bank 2014 2015 2017 2016 $450 $296 $876 $912 $1,125 2/21/2017Expansion into Chattanooga 6/30/2017Surpassed$1 billion in assets 8/23/2017Announced Merger with Community First & $25 million Private Placement 2018 $1,724 2018 1/1/2018Completed Merger with Community First 12/31/2017Officially rebranded as Reliant Bancorp, Inc. 8/28/2018Opened Murfreesboro branch 10/22/2018Opened Chattanooga branch $1,762 Q1 ‘19 Our History of Expansion and Growth
3 Nashville Demographics Sustainable GrowthThe Nashville MSA is expected to surpass the current size of Austin, Charlotte, Portland, and Denver regions by 2035, with a population of 2.6 millionThe Nashville MSA is the 8th largest Southeast metropolitan area with a population exceeding 1.9 million as of July 2018The Nashville region gained 94 net new people per day on average in 2017Population grew approximately 11.9% from 2012 through 2018 at 1.90% annually Unemployment rate of 2.6% is below the national average of 3.8% as of March 2019Median HHI growth of 16.5% from 2000-2012Strong Business EnvironmentRanked 3rd in “The Best Big Cities for Jobs 2017” 7th on Forbes’ list of fastest-growing cities of 2018Ranked 1st on Forbes’ list for metro area job growth in professional and business services (2017)Historic success in landing major brand-name corporate relocations including Nissan North America, Dell Computer, Caterpillar Financial, Ford Motor Credit, and AllianceBernstein (2018)Home to 14 Fortune 1000 companies, including 5 Fortune 500 headquartersRecent announcements by Amazon and E&Y to bring 5,600 jobs to Nashville Source: S&P Global Market Intelligence, Bureau of Labor Statistics, Nashville Area Chamber of Commerce, U.S. Census Bureau- 2018, Forbes, FRED
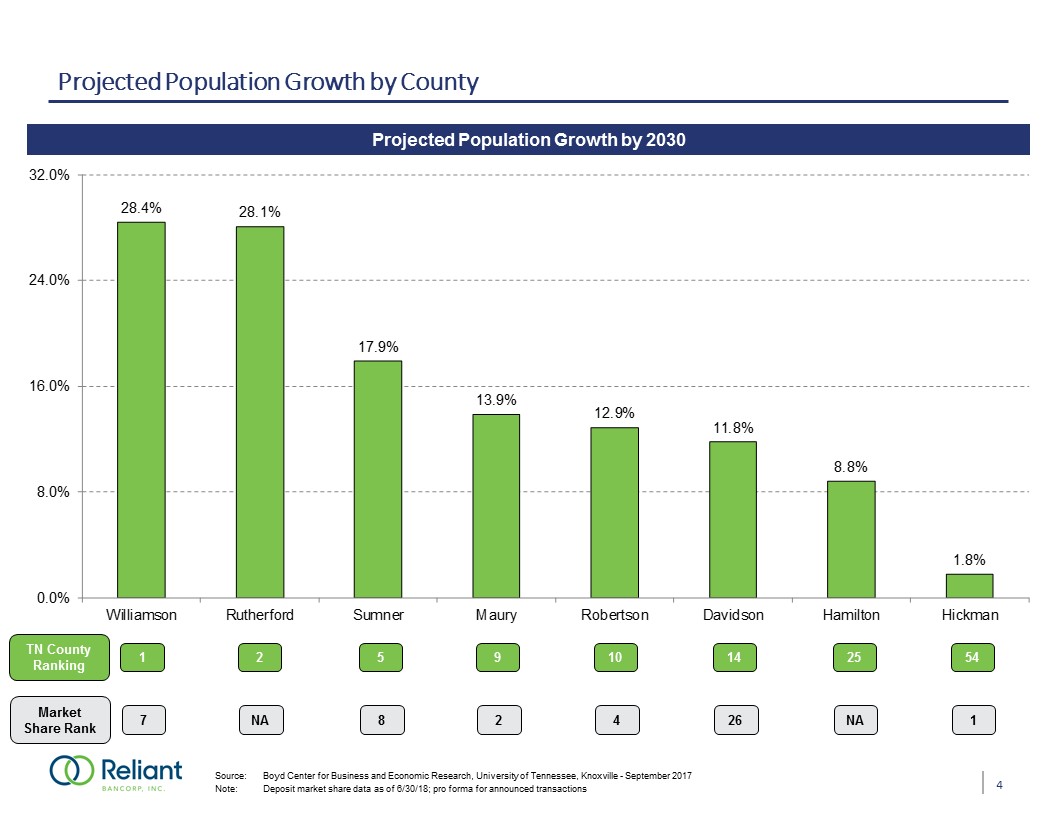
4 Projected Population Growth by County Projected Population Growth by 2030 Source: Boyd Center for Business and Economic Research, University of Tennessee, Knoxville - September 2017Note: Deposit market share data as of 6/30/18; pro forma for announced transactions TN County Ranking Market Share Rank 1 2 5 9 10 14 25 54 7 NA 8 2 4 26 NA 1

2018 Financial Highlights 5 Completed acquisition of Community First on January 1, 2018Opened full service banking centers in Murfreesboro (Q3) and Chattanooga (Q4)Net loan growth of $459 million or 59% for the year ended December 31, 2018Deposits grew by $554 million or 63% from 2017 to 2018; average non-interest bearing deposits increased by 62.8%Increased dividend by 25% YoY ($0.30 in 2018 vs. $0.24 in 2017)Maintained focus on superior asset quality with nonperforming assets to total assets of just 0.44%Strong job growth fueling the economy in Nashville and ChattanoogaAuthorized repurchase of $12 million of shares
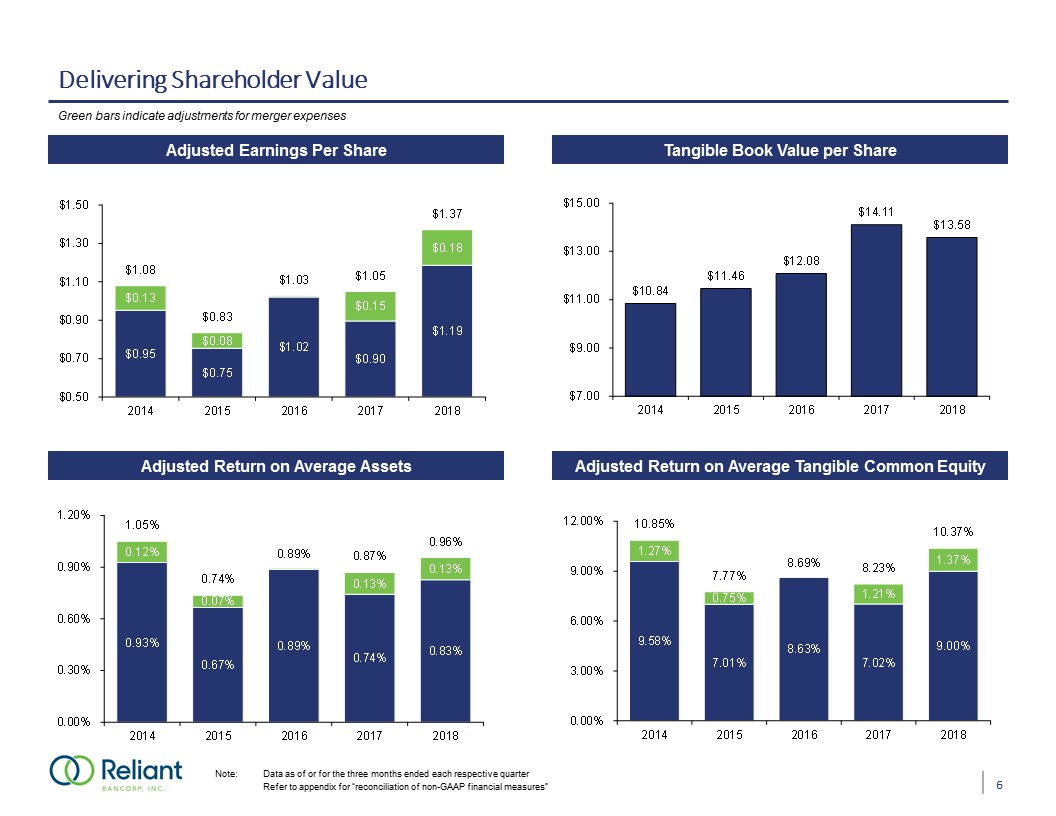
Delivering Shareholder Value 6 Adjusted Earnings Per Share Tangible Book Value per Share Adjusted Return on Average Assets Adjusted Return on Average Tangible Common Equity Note: Data as of or for the three months ended each respective quarter Refer to appendix for “reconciliation of non-GAAP financial measures” Green bars indicate adjustments for merger expenses

Balancing Growth and Profitability 7 Loan Portfolio(1) Note: $ in millions, unless otherwise specified; Data as of or for the twelve months ended each year. C&I Loans include Owner-Occupied CREDoes not include loans held for sale CAGR: 37.6% Deposit Portfolio CAGR: 44.0% Cost of Funds: Loan Yield:

Disciplined Credit Culture 8 Loan Reserves(1) Net Charge-Offs (Recoveries) / Average Loans Non Performing Assets / Total Assets Note: Data as of or for the three months ended each respective quarter(1) Refer to appendix for “reconciliation of non-GAAP financial measures”

First Quarter 2019 Highlights 9 Annualized loan growth of 10.1%, all organic customer growthAnnualized deposit growth of 20.4%Annualized tangible book value per share growth of 18.6%No loan loss provision expenseNet recovery increased loan loss reserveTax efficient business strategyStrong performance of new branch locations in Murfreesboro and ChattanoogaDeclared quarterly dividend of $0.09 on March 26, 2019Share repurchase program progressing

10 Our Strategy for 2019 and Beyond Core deposit growth and improved funding mixLow double digit organic loan growthDisciplined M&ALeverage presence in new marketsAdd experienced banking talent in key growth marketsCommitment to superior asset qualityExpand digital channelImprove operating efficiency

Appendix

Reconciliation of Non-GAAP Financial Measures 12 Reliant Bancorp, Inc. Adjusted Net Interest Margin

Reconciliation of Non-GAAP Financial Measures 13 Reliant Bancorp, Inc. ROAA, ROATCE, TCE/TA and TBVPS

Reconciliation of Non-GAAP Financial Measures 14 Reliant Bancorp, Inc. Adjusted ROAA, ROATCE and EPS
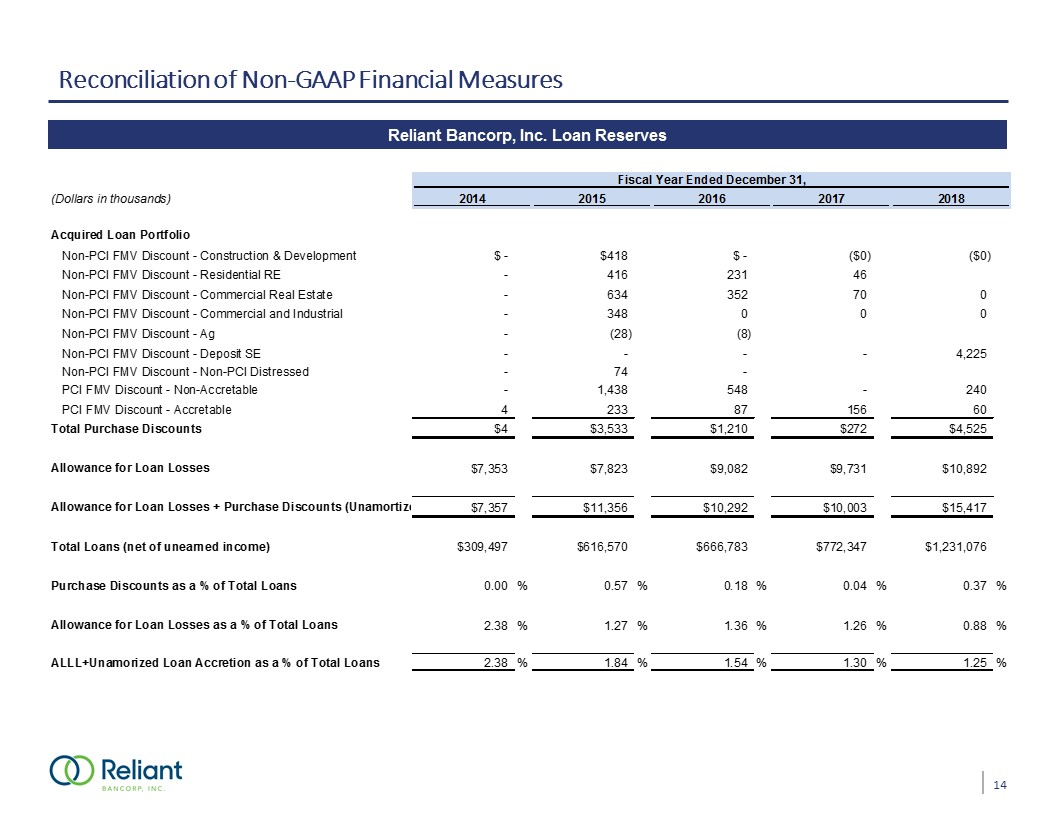
Reconciliation of Non-GAAP Financial Measures 15 Reliant Bancorp, Inc. Loan Reserves