Atento Reports Fiscal 2015 Fourth-Quarter and Full-Year Results,
Achieves Full-Year Targets for Strong Revenue Growth, Adjusted EBITDA Margin
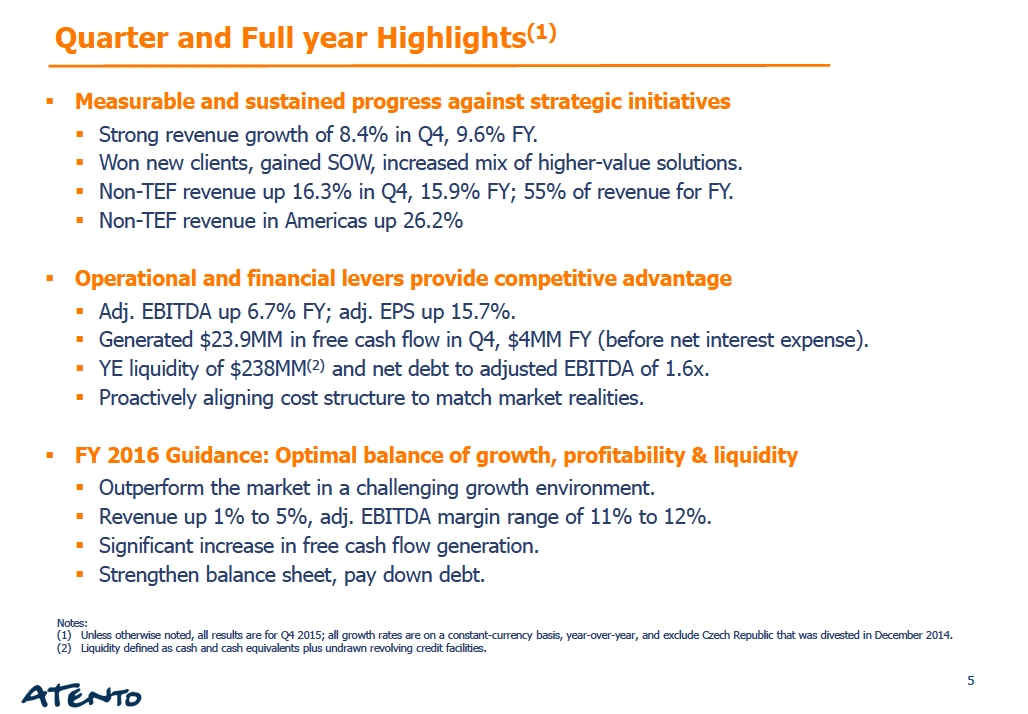
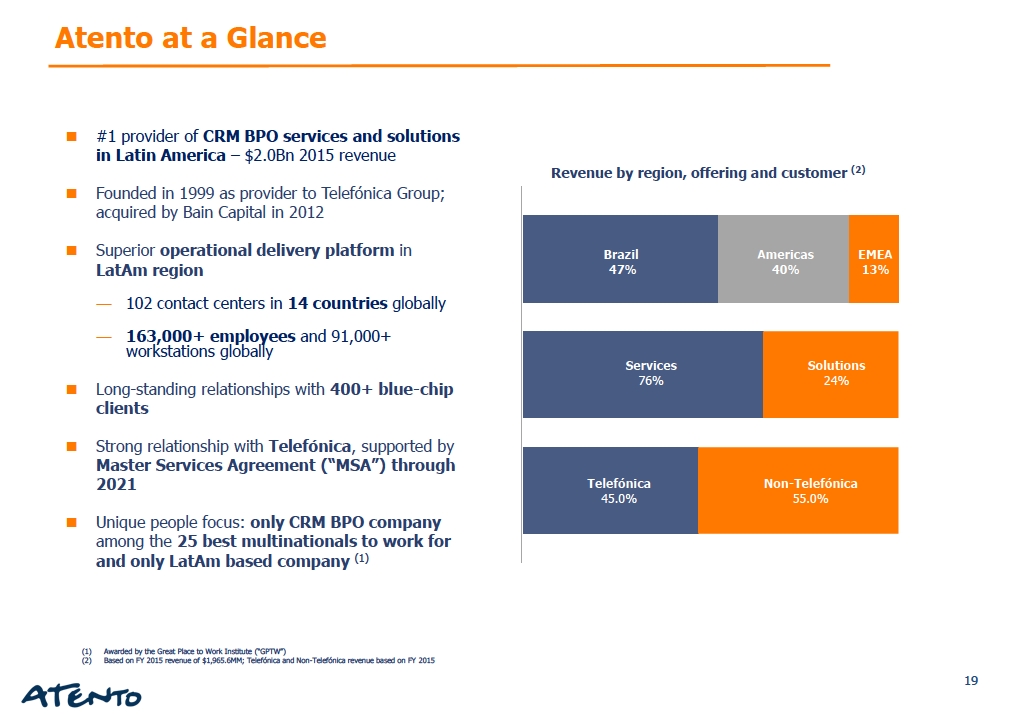
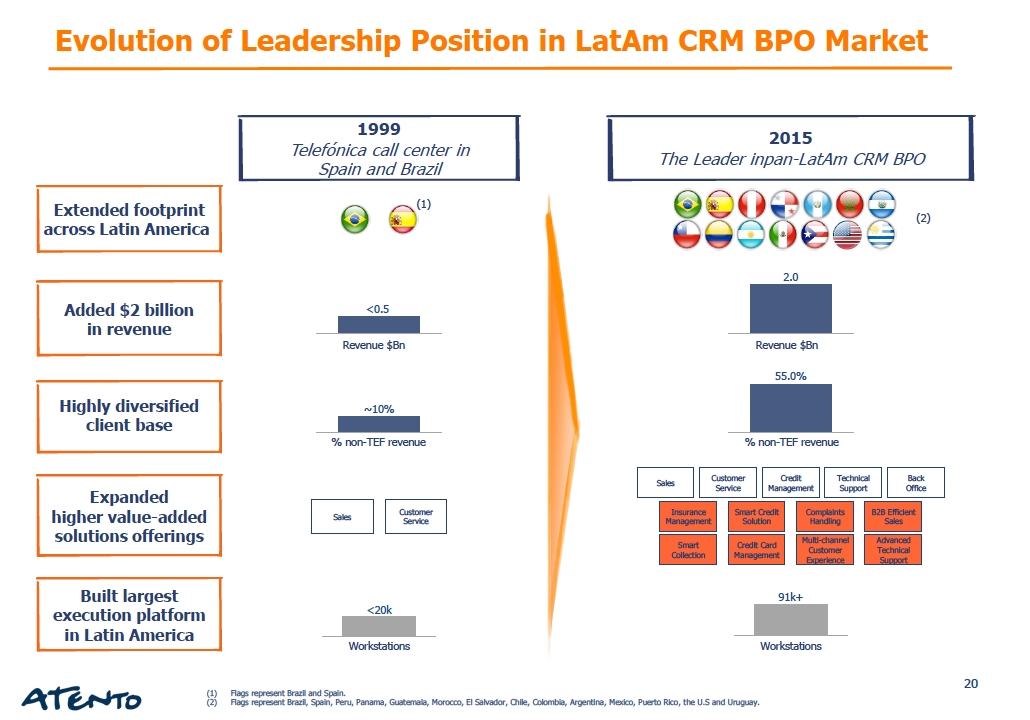
· Extended CRM/BPO leadership position in Latin America
· Consolidated fiscal-2015 revenue grew 9.6%, adjusted EBITDA margin of 13% on constant-currency basis
· Revenue from Latin America up 10.2% in the quarter, 12.8% for the full-year
· Adjusted EPS up 15.2% in the quarter, 15.7% for the full-year on constant-currency basis
· Generated $23.9 million in free cash flow in the quarter, before net interest
· Outlined key financial targets for Fiscal 2016
NEW YORK, March 8, 2016 –Atento S.A. (NYSE: ATTO), the largest provider of customer-relationship management and business-process outsourcing services in Latin America, and among the top three providers globally, today announced its fourth-quarter and full-year 2015 operating results which include solidly higher revenue and adjusted EBITDA (earnings before interest, taxes, depreciation and amortization) for the year. Those and all comparisons in this announcement are year-over-year, on a constant-currency (CCY) basis unless noted otherwise.
Summary
($ in millions) | | Q4 2015 | | Q4 2014 | | FY 2015 | | FY 2014 |
Revenue | | 457.8 | | 555.1 | | 1,965.6 | | 2,298.3 |
CCY growth (1) | | 8.4% | | | | 9.6% | | |
Adjusted EBITDA | | 64.0 | | 86.5 | | 250.3 | | 306.4 |
Margin | | 14.0% | | 15.6% | | 12.7% | | 13.3% |
CCY growth | | -1.6% | | | | 6.7% | | |
Adjusted EPS(2) | | 0.31 | | 0.36 | | 1.03 | | 1.20 |
CCY growth | | 15.2% | | | | 15.7% | | |
Leverage (x)(3) | | 1.6 | | 1.4 | | 1.6 | | 1.4 |
(1) Constant currency revenue growth from continuing operations excludes the Czech Republic, which was divested in December 2014.
(2) Adjusted earnings per share, for the period ended December 31, 2015, were calculated considering the number of ordinary shares of 73,648,760. For the period ended December 31, 2014 the number of ordinary shares was 73,619,511.
(3) Considered the pro-forma Net Debt adjusted to give effect to the Reorganization Transaction, regarding Preferred Equity Certificates.
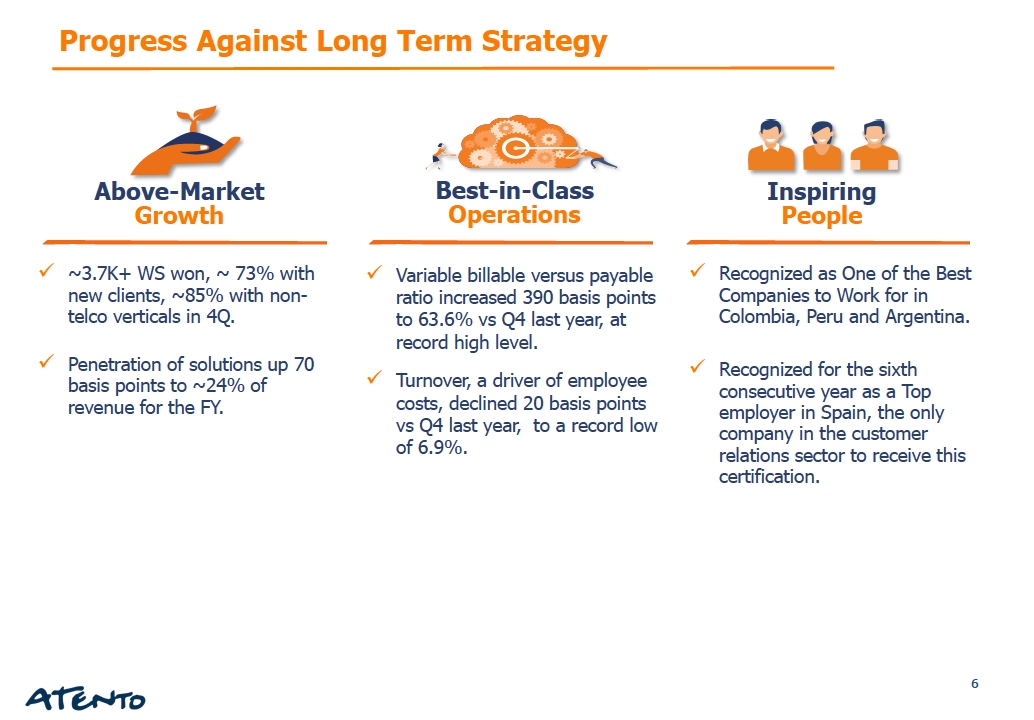
“I am extremely pleased with our performance in 2015 where we achieved our top-line and profitability targets, in spite of a very challenging macro-economic environment in Brazil,” said Alejandro Reynal, Atento´s Chief Executive Officer. “We increased our share of wallet with existing clients, won new business, and broadened our geographic and industry reach as we increased the mix of higher-value solutions provided to our clients. We also continued to execute on our revenue diversification strategy. For example in the fourth quarter, we drove a 16.3% increase in revenue from non-Telefónica clients and for the year these clients represented more than half of Atento’s revenue.” Our long term strategy, which encompasses growth, operational efficiencies and the optimization of our capital structure remains on track. At the same time, our company is financially strong and flexible,” Mr. Reynal continued.
Atento ended fiscal 2015 with $238 million in liquidity and net debt to adjusted EBITDA of just 1.6 times. Mr. Reynal said that Atento’s healthy balance sheet is continuing to serve it well, as he expects that macro-economic challenges will persist through 2016, particularly in Brazil.
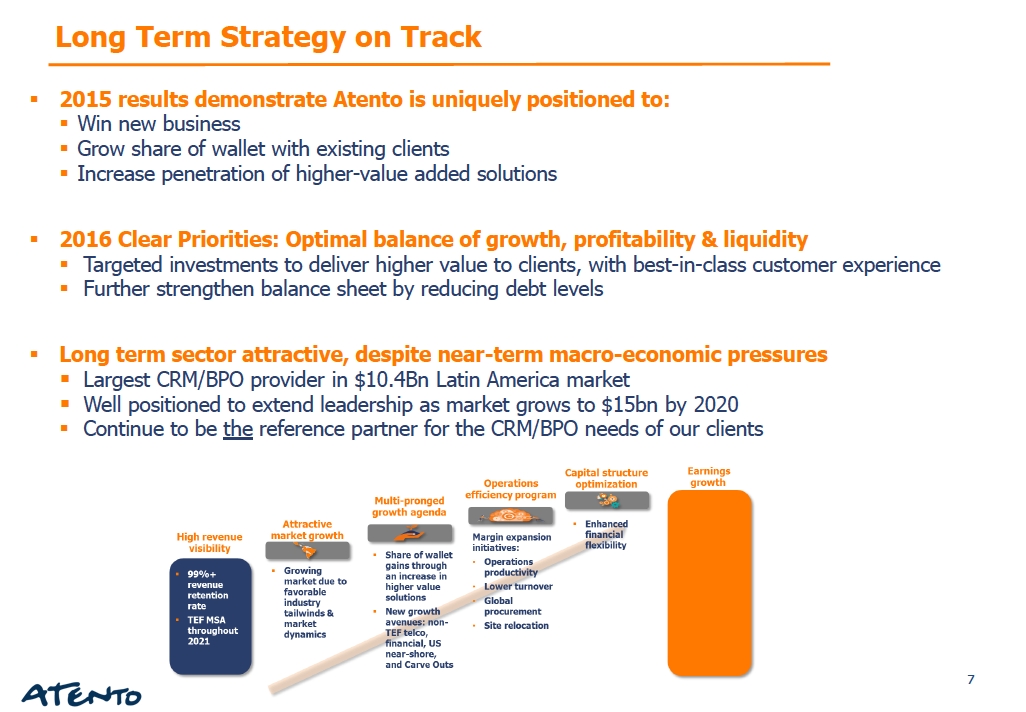
“While 2016 will be a challenging growth environment, we believe we can once again outperform the market, increase our leadership position in Latin America, and remainthe reference partner for the CRM/BPO needs of our clients. Our priorities remain to drive an optimal balance of growth, profitability and liquidity; make targeted investments to deliver even higher value to our clients through the best and most efficient customer-experience solutions; and further strengthen our balance sheet by reducing our level of debt,” he said.
For fiscal 2016, Atento is targeting year-over-year revenue of up 1% to 5%, and an adjusted EBITDA margin in the 11% to 12% range – both on a constant-currency basis.
All growth rates are in constant currency and year-over-year unless noted otherwise
 | 1 |
Fourth Quarter Consolidated Operating Results
Revenue for the quarter, excluding the Czech Republic which was divested in December 2014, increased 8.4%. This growth, which was driven by a 4.5% increase in Brazil, and an 18.2% increase in the Americas, was modestly offset by a 2.9% decline in EMEA. Growth in Latin America was up 10.2%. On a reported basis, revenue declined 17.3%.
Adjusted EBITDA declined 1.6% while adjusted EBITDA margin declined 160 basis points to 14.0%. This decline was largely driven by a shift in the mix of countries, particularly Brazil, due to material devaluation of currencies as well as the impacts of inflation. On a constant currency basis adjusted EBITDA margin was down 140 basis points to 14.2%.
Adjusted EPS increased 15.2% to $0.31, driven by a decline in both tax and net interest expense.
Fourth-quarter reported financial results included $14.6 million in non-recurring items mostly related to actions taken to proactively align the Company’s cost structure with market condition realities including current and expected macro-driven volume declines in Brazil and Spain.
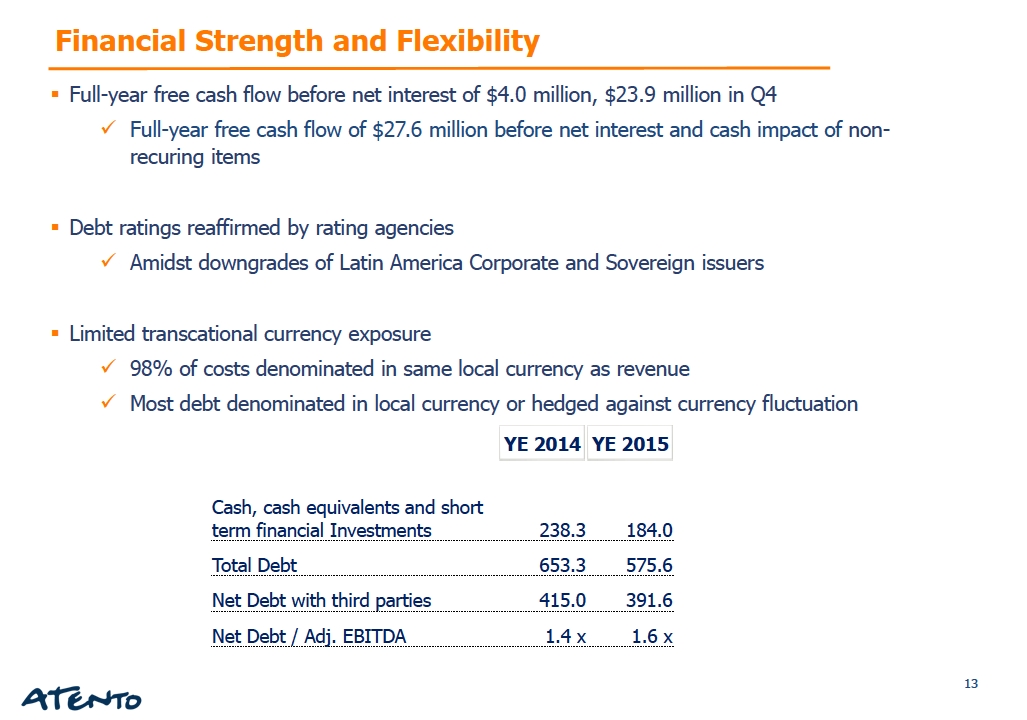
In the quarter, the Company generated $23.9 million in free cash flow before net interest. Excluding the impact of non-recurring items, the Company generated $34.2 million in free cash flow before net interest.
Adjusted quarterly earnings and EBITDA are non-GAAP financial measures and are reconciled to their most directly comparable GAAP measures in the accompanying financial tables.
Segment Reporting
| | Q4 2015 | | Q4 2014 | | FY 2015 | | FY 2014 |
Brazil Region | | | | | | | | |
Revenue | | 192.6 | | 278.6 | | 930.2 | | 1,184.8 |
CCY growth | | 4.5% | | | | 10.0% | | |
Adjusted EBITDA | | 29.4 | | 48.4 | | 129.4 | | 172.1 |
Margin | | 15.3% | | 17.4% | | 13.9% | | 14.5% |
CCY growth | | -8.9% | | | | 7.2% | | |
Americas Region | | | | | | | | |
Revenue | | 203.9 | | 202.7 | | 789.8 | | 779.4 |
CCY growth | | 18.2% | | | | 17.0% | | |
Adjusted EBITDA | | 29.1 | | 32.5 | | 109.1 | | 117.7 |
Margin | | 14.3% | | 16.0% | | 13.8% | | 15.1% |
CCY growth | | 6.8% | | | | 9.1% | | |
EMEA Region | | | | | | | | |
Revenue | | 61.7 | | 74.0 | | 247.4 | | 334.8 |
CCY growth(1) | | -2.9% | | | | -9.0% | | |
Adjusted EBITDA | | 7.3 | | 9.0 | | 19.1 | | 26.4 |
Margin | | 11.8% | | 12.2% | | 7.7% | | 7.9% |
CCY growth | | -7.8% | | | | -14.8% | | |
(1) Constant currency revenue growth from continuing operations excludes the Czech Republic, which was divested in December 2014
| 2 |
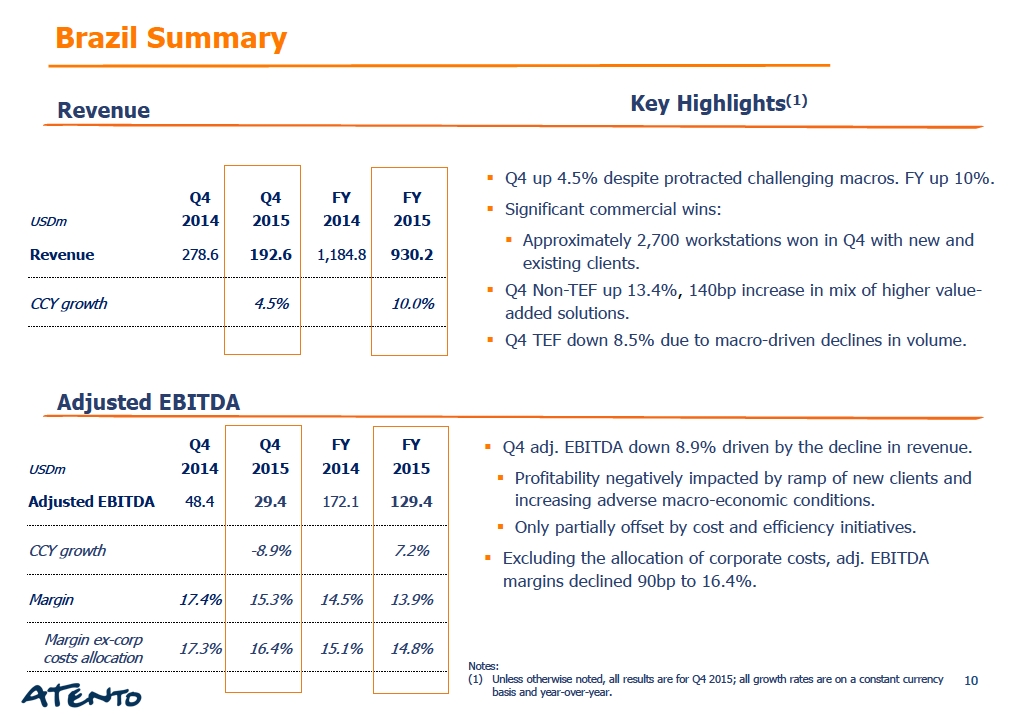
Brazil Region
Revenue for the Brazil region increased 4.5% driven by a 13.4% increase in revenue from non-Telefónica clients. This growth was supported by new clients and the introduction of new services with existing clients, particularly in financial services. Revenue from Telefónica declined 8.5% due to macro-driven declines in volume. On a reported basis, revenue declined 30.9%.
Adjusted EBITDA decreased 8.9% while margin declined 210 basis points to 15.3%. This decline in profitability was driven by the ramp of new clients and impacts from protracted adverse macro-economic conditions which were partially offset by cost and efficiency initiatives. Excluding the impact of corporate cost allocations, adjusted EBITDA was $31.7 million and margin decreased 90 basis points to 16.4%.
Americas Region
Revenue for the Americas region increased 18.2% driven by a 26.2% increase in revenue from non-Telefónica clients. Growth from new and existing clients was particularly strong in Mexico, Colombia, Peru and U.S. nearshore. A 9.6% increase in revenue from Telefónica was driven by double-digit gains in Mexico, Peru and Argentina. On a reported basis revenue increased 0.6%.
Adjusted EBITDA increased 6.8% due to the strong growth in revenue while margin declined 170 basis points to 14.3%. The decline in margin was mostly driven by a shift in mix of services, ramp-up of new clients, and inflationary pressures. Excluding the impact of corporate cost allocations, adjusted EBITDA was $31.8 million and margin decreased 270 basis points to 15.6%.
EMEA Region
Revenue for the EMEA region declined 2.9%, driven by a 3.2% decline in revenue from non-Telefónica clients. As expected, these declines were driven by lower volumes from Public Administration contracts in Spain and the exiting of lower-value contracts,which more than offset strong growth from private sector clients. Revenue from Telefónica declined 2.8% largely driven by Spain. On a reported basis, revenue declined 14.8%.
Adjusted EBITDA declined 7.8%, driven by the decline in revenue, while adjusted EBITDA margin declined 40 basis points to 11.8%. The decline in adjusted EBITDA margin was driven by the ramp of new clients and shifts in revenue mix which were partially offset by cost and efficiency initiatives. Excluding the impact of corporate cost allocations, adjusted EBITDA was $7.6 million and margin increased 10 basis points to 12.3%.
Strong Balance Sheet and Ample Liquidity Enhance Financial Flexibility
At December 31, 2015, the Company had cash, cash equivalents and short-term financial investments totaling $184 million and undrawn revolving credit facilities of €50 million for total liquidity of $238 million. Total net debt with third parties totaled $391.6 million, a decline of $23.4 million. The Company’s last twelve month (LTM) adjusted EBITDA to net debt with third parties was 1.6 times.
During the fourth quarter of 2015, the Company invested $38.1 million, or 8.3% of revenue, in capital expenditures related to investments in maintenance and growth. For the full year capital expenditures totaled $121.2 million, or 6.2% of revenue.
| 3 |
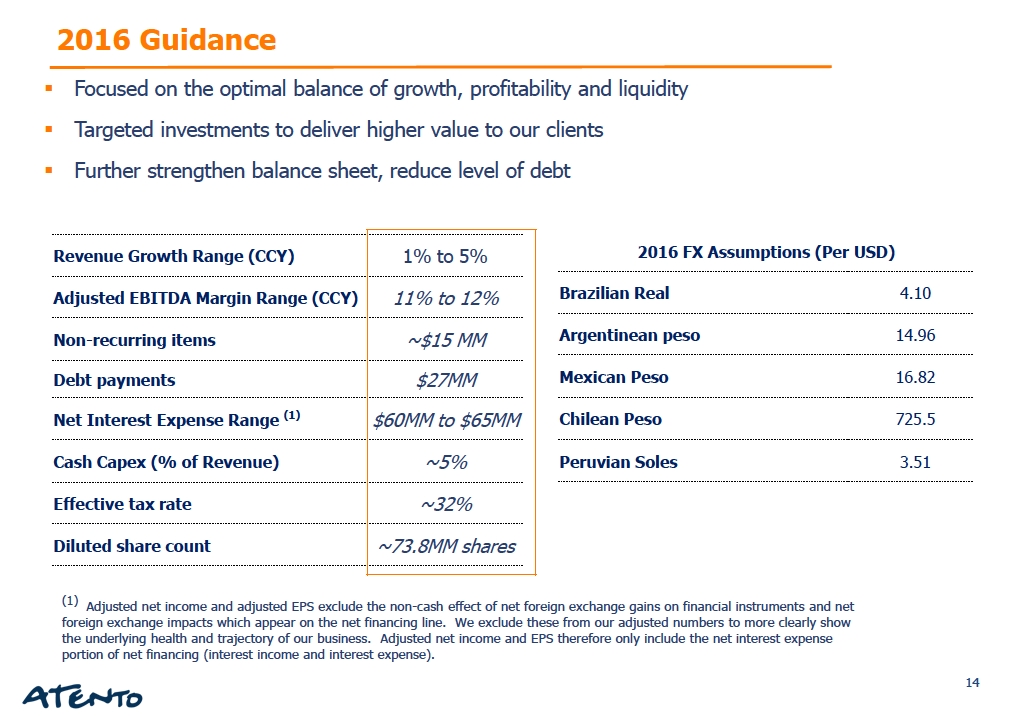
Fiscal 2016 Guidance
While 2016 will be a challenging growth environment, the Company believes it can outperform the market, increase its leadership position in Latin America, and remainthereference partner for the CRM/BPO needs of its clients. In addition advancing its long term strategy, the Company will focus on the optimal balance of profitable growth and liquidity, strengthening its balance sheet and maintaining financial flexibility.
For the full year Fiscal 2016, the Company is targeting revenue growth in the range of 1% to 5%, and adjusted EBITDA margin in the range of 11% to 12%, both on a constant-currency basis. Non-recurring items, which are included as add-backs in adjusted EBITDA, are expected to be approximately $15 million with roughly two-thirds expected in the first-half of the year as the Company continues to align its cost structure with prevailing market conditions. During the year the Company expects to pay down $27 million in debt and expects net interest expense in the range of $60 to $65 million. The Company expects cash capital expenditures of approximately 5% of revenue reflecting investments in both growth and maintenance, an effective tax rate of approximately 32%, and a fully diluted share count of approximately 73.8 million shares.
This guidance assumes no acquisitions or changes in the current operating environment, capital structure or exchange rates movements on the translation of our financial statements in USD.
Conference Call
Atento will host a conference call and webcast for analysts on Tuesday, March 8, 2016 at 5:00 am ET to discuss the financial results. The conference call can be accessed by dialing: +1 (877) 407-3982 toll free domestic, UK: (+44) 0 800 756 3429 toll free, Brazil: (+55) 0 800 891 6221 toll free, or Spain: (+34) 900 834 236 toll free. All other international callers can access the conference call by dialing: +1 (201) 493-6780 toll free. No passcode is required. Individuals who dial in will be asked to identify themselves and their affiliations. The conference call will also be webcasted through a link on Atento's Investor Relations website at investors.atento.com. A web-based archive of the conference call will also be available at the above website.
About Atento
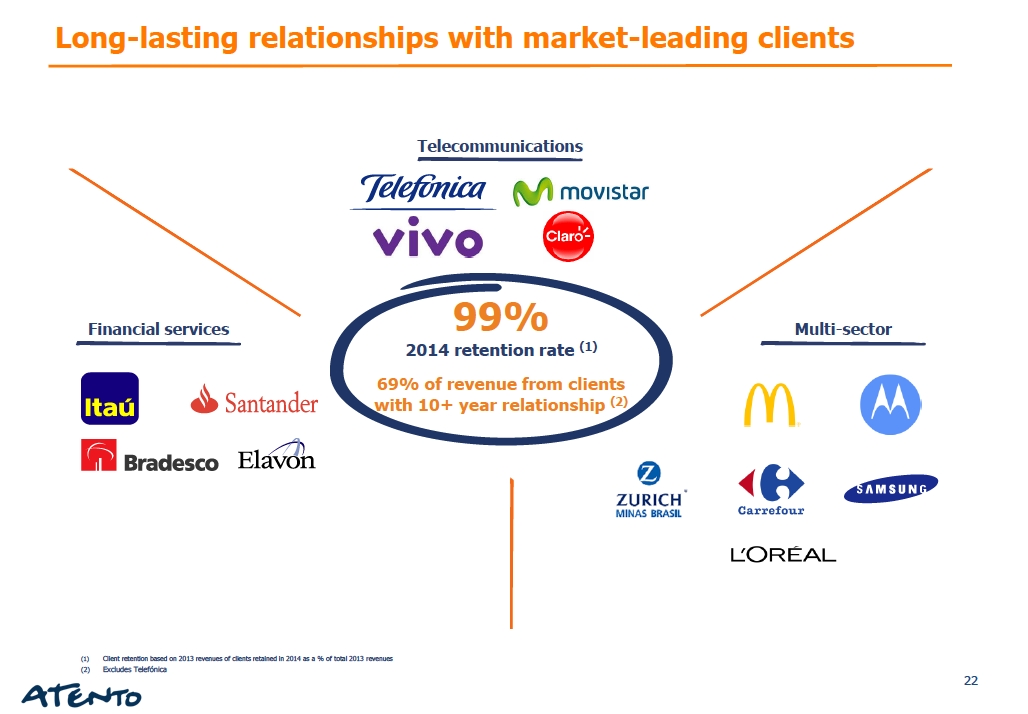
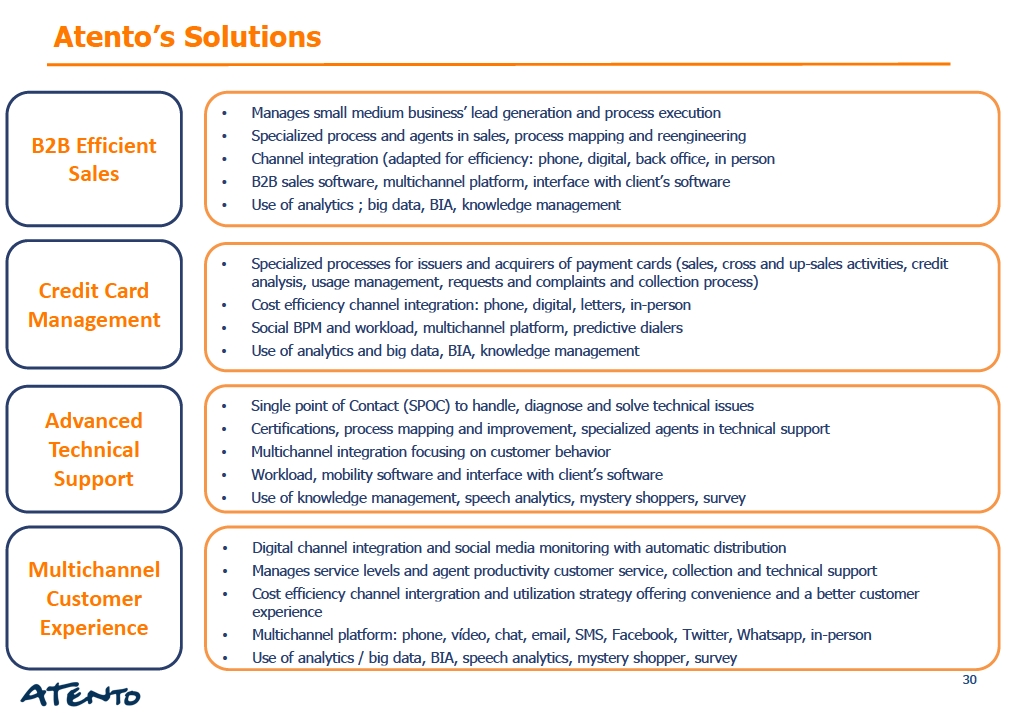
Atento is the largest provider of customer relationship management and business process outsourcing (CRM BPO) services in Latin America, and among the top three providers globally, based on revenues. Atento is also a leading provider for U.S.-based companies nearshoring CRM/BPO services to Latin America. Since 1999, the company has developed its business model in 14 countries where it employs more than 160,000 people. Atento has over 400 clients to whom it offers a wide range of CRM BPO services across multiple channels. Atento's clients are mostly leading multinational corporations in sectors such as telecommunications, banking and financial services, media and technology, health, retail and public administrations, among others. Atento´s shares trade under the symbol ATTO on the New York Stock Exchange (NYSE). In 2015, Atento was named one of the World´s 25 Best Multinational Workplaces by Great Place to Work® for third consecutive year. For more information visitwww.atento.com
Investor Relations
Lynn Antipas Tyson
+ 1 914-485-1150
lynn.tyson@atento.com
Media Relations
Maite Cordero
+ 34 91 740 74 47
media@atento.com
| 4 |

Forward-Looking Statements
This press release contains forward-looking statements. Forward-looking statements can be identified by the use of words such as "may," "should," "expects," "plans," "anticipates," "believes," "estimates," "predicts," "intends," "continue" or similar terminology. These statements reflect only Atento's current expectations and are not guarantees of future performance or results. These statements are subject to risks and uncertainties that could cause actual results to differ materially from those contained in the forward-looking statements. These risks and uncertainties include, but are not limited to, competition in Atento’s highly competitive industries; increases in the cost of voice and data services or significant interruptions in these services; Atento’s ability to keep pace with its clients’ needs for rapid technological change and systems availability; the continued deployment and adoption of emerging technologies; the loss, financial difficulties or bankruptcy of any key clients; the effects of global economic trends on the businesses of Atento’s clients; the non-exclusive nature of Atento’s client contracts and the absence of revenue commitments; security and privacy breaches of the systems Atento uses to protect personal data; the cost of pending and future litigation; the cost of defending Atento against intellectual property infringement claims; extensive regulation affecting many of Atento’s businesses; Atento’s ability to protect its proprietary information or technology; service interruptions to Atento’s data and operation centers; Atento’s ability to retain key personnel and attract a sufficient number of qualified employees; increases in labor costs and turnover rates; the political, economic and other conditions in the countries where Atento operates; changes in foreign exchange rates; Atento’s ability to complete future acquisitions and integrate or achieve the objectives of its recent and future acquisitions; future impairments of our substantial goodwill, intangible assets, or other long-lived assets; and Atento’s ability to recover consumer receivables on behalf of its clients. In addition, Atento is subject to risks related to its level of indebtedness. Such risks include Atento’s ability to generate sufficient cash to service its indebtedness and fund its other liquidity needs; Atento’s ability to comply with covenants contained in its debt instruments; the ability to obtain additional financing; the incurrence of significant additional indebtedness by Atento and its subsidiaries; and the ability of Atento’s lenders to fulfill their lending commitments. Atento is also subject to other risk factors described in documents filed by the company with the United States Securities and Exchange Commission.
These forward-looking statements speak only as of the date on which the statements were made. Atento undertakes no obligation to update or revise publicly any forward-looking statements, whether as a result of new information, future events or otherwise.
SELECTED FINANCIAL DATA
The following selected financial information should be read in conjunction with the interim consolidated financial statements and the section entitled “Management’s Discussion and Analysis of Financial Condition and Results of Operations” presented elsewhere in the Form 6-K.
| 5 |
Consolidated Income Statements |
| | | | | | | | | | | |
| For three months ended December 31, | | Change excluding | | For the year ended December 31, | | Change excluding |
($ in millions, except percentage changes) | 2015 | | 2014 (**) | | FX (%) | | 2015 | | 2014 (**) | | FX (%) |
| (unaudited) | | | | (unaudited) | (audited) | | |
Revenue | 457.8 | | 555.1 | | 8.1 | | 1,965.6 | | 2,298.3 | | 9.2 |
Other operating income | 2.3 | | 2.8 | | (3.6) | | 4.3 | | 4.6 | | 10.9 |
Own work capitalized | - | | 0.1 | | N.M | | - | | 0.5 | | N.M |
Other gains | - | | 0.6 | | N.M | | - | | 35.1 | | N.M |
Supplies | (18.6) | | (25.6) | | (2.0) | | (78.4) | | (104.8) | | (2.9) |
Employee benefit expenses | (329.3) | | (390.0) | | 9.8 | | (1,422.7) | | (1,636.4) | | 10.2 |
Depreciation | (12.6) | | (14.6) | | 16.4 | | (51.1) | | (59.0) | | 11.7 |
Amortization | (11.4) | | (13.6) | | 11.8 | | (51.8) | | (60.8) | | 10.0 |
Changes in trade provisions | (0.3) | | 1.9 | | (121.1) | | (1.2) | | 1.7 | | N.M |
Other operating expenses | (62.5) | | (110.0) | | (24.5) | | (245.1) | | (360.2) | | (12.2) |
Impairment charges | - | | 0.7 | | N.M | | - | | (31.8) | | N.M |
Total Operating Expenses | (434.7) | | (551.2) | | 3.2 | | (1,850.3) | | (2,251.3) | | 4.7 |
| | | | | | | | | | | |
OPERATING PROFIT/(LOSS) | 25.4 | | 7.4 | | N.M | | 119.6 | | 87.2 | | 80.5 |
| | | | | | | | | | | |
Finance income | 2.8 | | 4.0 | | 2.5 | | 15.5 | | 17.3 | | 24.3 |
Finance costs | (17.7) | | (21.7) | | 9.2 | | (75.7) | | (122.1) | | (19.8) |
Change in fair value of financial instruments (**) | 3.5 | | 20.0 | | N.M | | 17.5 | | 27.3 | | N.M |
Net foreign exchange gains/(loss) | (4.5) | | (14.9) | | (57.7) | | (4.0) | | (33.3) | | N.M |
| | | | | | | | | | | |
NET FINANCE EXPENSE | (15.9) | | (12.6) | | 78.6 | | (46.7) | | (110.8) | | (43.0) |
| | | | | | | | | | | |
PROFIT/(LOSS) BEFORE TAX | 9.5 | | (5.2) | | N.M | | 72.9 | | (23.6) | | N.M |
| | | | | | | | | | | |
Income tax expenses | (4.1) | | (20.7) | | (74.9) | | (23.8) | | (18.5) | | 64.3 |
PROFIT/(LOSS) FOR THE PERIOD | 5.4 | | (25.9) | | N.M | | 49.1 | | (42.1) | | N.M |
| | | | | | | | | | | |
Basic result per share (in U.S. dollars) (*) | 0.07 | | (0.35) | | N.M | | 0.67 | | (0.57) | | N.M |
(*) The basic result per share, for the period presented in the table above, was calculated based on the number of ordinary shares of 73,648,760 as of December 31, 2015. For the period ended December 31, 2014 the number of ordinary shares was 73,619,511.
(**) The gain or loss of the fair value of derivatives was recorded in the Income Statements within Finance income ($25.9 million for the three months ended December 31, 2014 and $40.9 million for the year ended December 31, 2014) and Finance costs ($5.9 million for the three months ended December 31, 2014 and $13.6 million for the year ended December 31, 2014), instead of Changes in fair value of financial instruments.
| 6 |
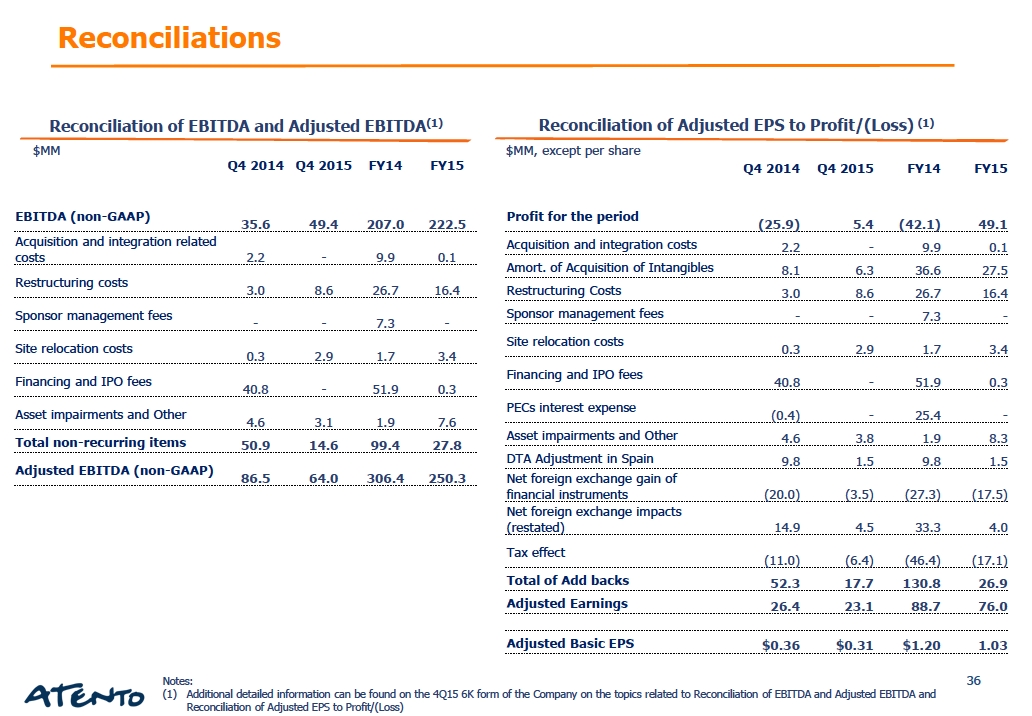
| Reconciliation of EBITDA and Adjusted EBITDA to Profit/(Loss): |
| | | | | | | | |
| | For the three months ended December 31, | | For the year ended December 31, |
($ in millions) | | 2015 | | 2014 | | 2015 | | 2014 |
| | (unaudited) | | (unaudited) | (audited) |
Profit/(loss) for the period | 5.4 | | (25.9) | | 49.1 | | (42.1) |
| | | | | | | | |
Net finance expense | | 15.9 | | 12.6 | | 46.7 | | 110.8 |
Income tax expense | | 4.1 | | 20.7 | | 23.8 | | 18.5 |
Depreciation and amortization | 24.0 | | 28.2 | | 102.9 | | 119.8 |
| | | | | | | | |
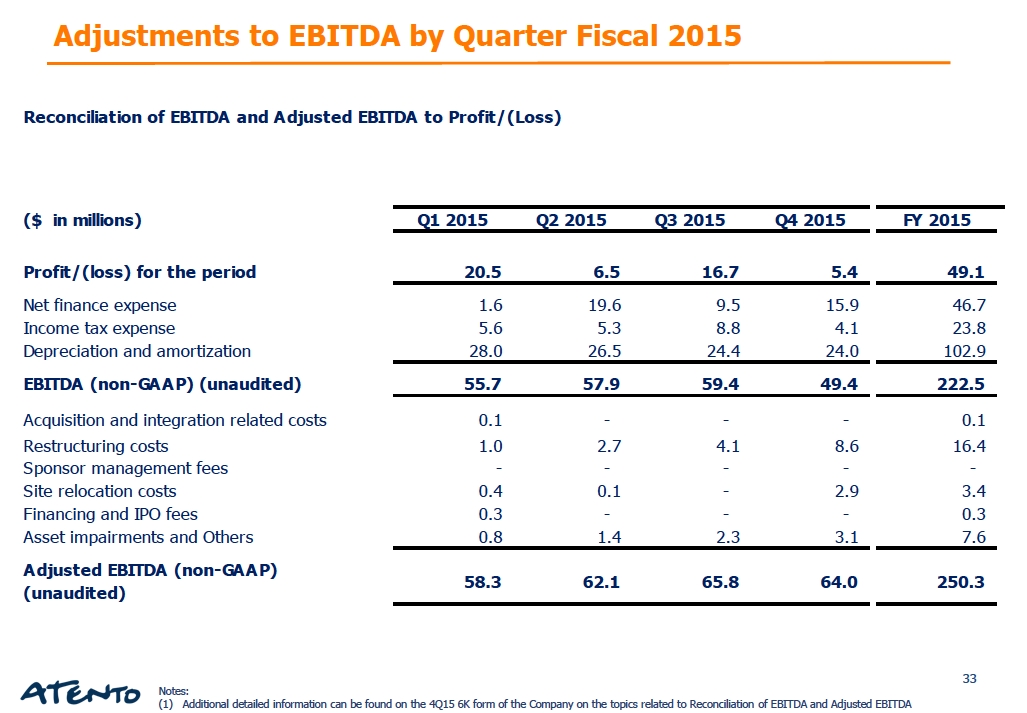
EBITDA (non-GAAP) (unaudited) | 49.4 | | 35.6 | | 222.5 | | 207.0 |
| | | | | | | | |
Acquisition and integration related costs(a) | - | | 2.2 | | 0.1 | | 9.9 |
Restructuring costs(b) | | 8.6 | | 3.0 | | 16.4 | | 26.7 |
Sponsor management fees(c) | | - | | - | | - | | 7.3 |
Site relocation costs(d) | | 2.9 | | 0.3 | | 3.4 | | 1.7 |
Financing and IPO fees (e) | - | | 40.8 | | 0.3 | | 51.9 |
Asset impairments and Others(f) | 3.1 | | 4.6 | | 7.6 | | 1.9 |
Total non-recurring items | | 14.6 | | 50.9 | | 27.8 | | 99.4 |
| | | | | | | | |
Adjusted EBITDA (non-GAAP) (unaudited) | 64.0 | | 86.5 | | 250.3 | | 306.4 |
| | | | | | | | | | |
(a) Acquisition and integration related costs incurred in 2014, are costs associated with the post-acquisition process in connection with the full strategy review. These projects were substantially completed by the end of 2014. For the year ended December 31, 2014 acquisition and integration related costs primarily resulted from consulting fees incurred in connection with the full strategy review including our growth plan and operational set-up with a leading consulting firm ($4.0 million), improving procurement efficiency ($2.3 million), and IT transformation projects ($2.5 million). Acquisition and integration related costs incurred for the year ended December 31, 2015 primarily related to the finalization the SAP IT transformation project during the three months ended March 31, 2015.
Acquisition and integration related costs incurred during the three months ended December 31, 2014 primarily related to consulting fees incurred in connection with IT transformation projects. During the three months ended December 31, 2015, we have no costs related to our acquisition and integration process. These projects were substantially completed by the end of 2014.
(b) Restructuring costs incurred in 2014 and 2015 primarily included a number of restructuring activities and other personnel costs that were not related to our core result of operations. Restructuring costs incurred for the year ended December 31, 2014, are primarily related to headcount restructuring activities in Spain. In addition, we incurred restructuring costs not related to our core results of operations in Argentina and Peru of $4.8 million, $2.5 million in Chile of restructuring expenses incurred in connection with the implementation of a new service delivery model with Telefónica, and certain changes to the executive team, and an additional $0.7 million related to the relocation of corporate headquarters. Restructuring costs incurred in the year ended December 31, 2015, primarily relates to optimization of labor force to current or expected adjustments in activity levels, mainly in EMEA and Brazil.
Restructuring costs incurred for the three months ended December 31, 2014, primarily include $2.7 million related to restructuring in Chile ($1.1 million) in connection with certain changes to the executive team, and the restructuring of specific operations in Peru and Argentina ($1.6 million). For the three months ended December 31, 2015 restructuring costs primarily relates to labor force optimization to current activity level declines mainly in Telefónica business, both in Brazil and EMEA.
(c) Sponsor management fees represent the annual advisory fee paid to Bain Capital Partners, LLC that were expensed during the period presented. The advisory agreement was terminated in connection with the initial public offering.
(d) Site relocation costs incurred for the three months and year ended December 31, 2014 include costs associated with our current strategicinitiative of relocating call centers from tier 1 cities to tier 2 cities in Brazil to achieve efficiencies through lower rental costs, attrition and absenteeism. Site relocation costs incurred for the three months ended December 31, 2015 related to the anticipation for site closures in Brazil in connection of the site relocation program to tier 2 and tier 3 cities.
(e) Financing and IPO fees for the three months and year ended December 31, 2014 primarily relate to non-core professional fees incurred during the IPO process, including advisory, auditing and legal expenses. Financing and IPO fees for the three months and year ended December 31, 2015 relate to remaining costs incurred during the three months ended March 31, 2015 in connection with the IPO process.
(f) Asset impairments and other costs incurred for the year ended December 31, 2014, mainly relate to the goodwill and other intangible asset impairment relating to our operation in Czech Republic (divested in December 2014) of $3.7 million and Spain of $28.8 million, offset by the amendment of the MSA with Telefónica, by which the minimum revenue commitment for Spain was reduced against a $34.5 million penalty fee paid by Telefónica. Asset impairment and other costs for the year ended December 31, 2015 mainly refer to consulting and other costs in connection with efficiencies and costs reduction projects implemented in Brazil and EMEA.
Asset impairments and other costs incurred for the three months ended December 31, 2014 primarily related to a revenue adjustment in Spain ($2.4 million) for prior fiscal years and a one off tax penalty in Colombia ($1.3 million). Asset impairments and other costs for the three months ended December 31, 2015 mainly refer to consulting and other costs in connection with efficiencies and costs reduction projects in implementation in Brazil and EMEA.
| 7 |
Reconciliation of Adjusted Earnings to profit/(loss):
| | | For the three months ended December 31, | | For the year ended December 31, |
($ in millions, except percentage changes) | | 2015 | | 2014 | | 2015 | | 2014 |
| | | (unaudited) | | (unaudited) | (audited) |
Profit/(Loss) attributable to equity holders of the parent | | 5.4 | | (25.9) | | 49.1 | | (42.1) |
| | | | | | | | | |
Acquisition and integration related Costs(a) | | - | | 2.2 | | 0.1 | | 9.9 |
Amortization of Acquisition related Intangible assets(b) | | 6.3 | | 8.1 | | 27.5 | | 36.6 |
Restructuring Costs(c) | | 8.6 | | 3.0 | | 16.4 | | 26.7 |
Sponsor management fees(d) | | - | | - | | - | | 7.3 |
Site relocation costs(e) | | 2.9 | | 0.3 | | 3.4 | | 1.7 |
Financing and IPO fees(f) | | - | | 40.8 | | 0.3 | | 51.9 |
PECs interest expense(g) | | - | | (0.4) | | - | | 25.4 |
Asset impairments and Others(h) | | 3.8 | | 4.6 | | 8.3 | | 1.9 |
DTA adjustment in Spain (i) | | 1.5 | | 9.8 | | 1.5 | | 9.8 |
Net foreign exchange gain on financial instruments(j) | | (3.5) | | (20.0) | | (17.5) | | (27.3) |
Net foreign exchange impacts(k) | | 4.5 | | 14.9 | | 4.0 | | 33.3 |
Tax effect(l) | | (6.4) | | (11.0) | | (17.1) | | (46.4) |
Total of Add backs | | 17.7 | | 52.3 | | 26.9 | | 130.8 |
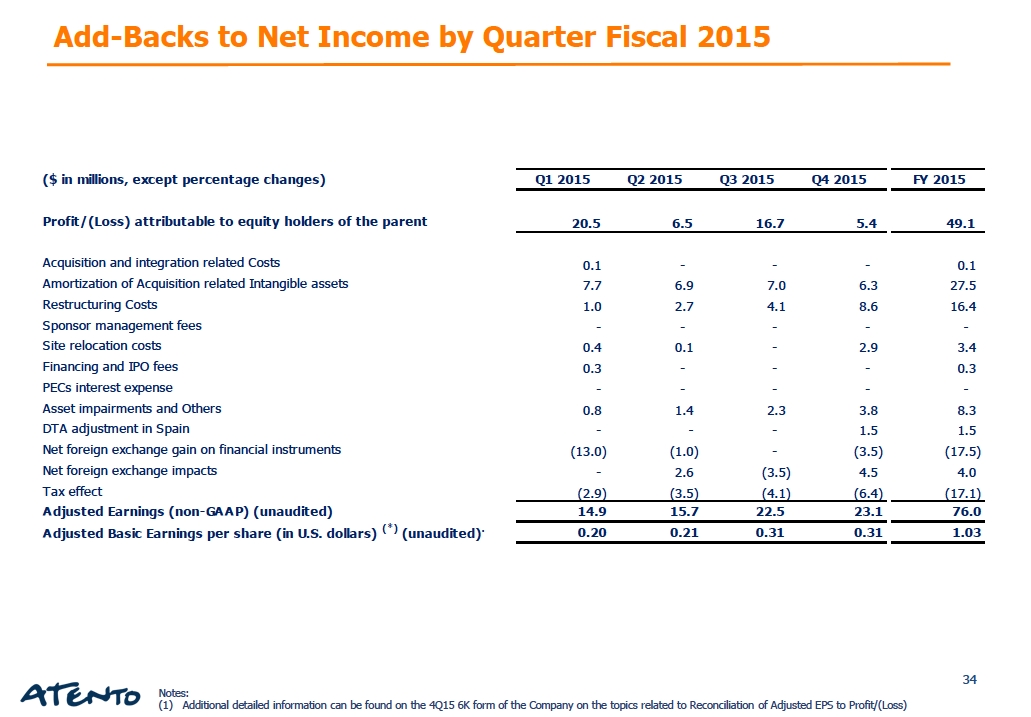
Adjusted Earnings (non-GAAP) (unaudited) | | 23.1 | | 26.4 | | 76.0 | | 88.7 |
Adjusted Basic Earnings per share(in U.S. dollars)(*) (unaudited) | | 0.31 | | 0.36 | | 1.03 | | 1.20 |
| | | | | | | | | | |
(a) Acquisition and integration related costs incurred in 2014, are costs associated with the post-acquisition process in connection with the full strategy review. These projects were substantially completed by the end of 2014. For the year ended December 31, 2014 acquisition and integration related costs primarily resulted from consulting fees incurred in connection with the full strategy review including our growth plan and operational set-up with a leading consulting firm ($4.0 million), improving procurement efficiency ($2.3 million), and IT transformation projects ($2.5 million). Acquisition and integration related costs incurred for the year ended December 31, 2015 primarily relate to the finalization the SAP IT transformation project during the three months ended March 31, 2015.
Acquisition and integration related costs incurred during the three months ended December 31, 2014 primarily related to consulting fees incurred in connection with IT transformation projects. During the three months ended December 31, 2015, we have no costs related to our acquisition and integration process. These projects were substantially completed by the end of 2014.
(b) Amortization of acquisition related intangible assets represents the amortization expense of intangible assets resulting from the acquisition and has been adjusted to eliminate the impact of the amortization arising from the acquisition which is not in the ordinary course of our daily operations, and also distorts comparisons with peers and our results for prior periods. Such intangible assets primarily include contractual relationships with customers, for which the useful life has been estimated at primarily nine years.
(c) Restructuring costs incurred in 2014 and 2015 primarily included a number of restructuring activities and other personnel costs that were not related to our core result of operations. Restructuring costs incurred for the year ended December 31, 2014, are primarily related to headcount restructuring activities in Spain. In addition, we incurred restructuring costs not related to our core results of operations in Argentina and Peru of $4.8 million, $2.5 million in Chile of restructuring expenses incurred in connection with the implementation of a new service delivery model with Telefónica, and certain changes to the executive team, and an additional $0.7 million related to the relocation of corporate headquarters. Restructuring costs incurred in the year ended December 31, 2015, primarily relates to optimization of labor force to current or expected adjustments in activity levels, mainly in EMEA and Brazil.
Restructuring costs incurred for the three months ended December 31, 2014, primarily include $2.7 million related to restructuring in Chile ($1.1 million) in connection with certain changes to the executive team, and the restructuring of specific operations in Peru and Argentina ($1.6 million). For the three months ended December 31, 2015 restructuring costs primarily relates to labor force optimization to current activity level declines mainly in TEF business, both in Brazil and EMEA.
(d) Sponsor management fees represent the annual advisory fee paid to Bain Capital Partners, LLC that are expensed during the period presented.
The advisory agreement was terminated in connection with the initial public offering.
(e) Site relocation costs incurred for the three months and year ended December 31, 2014 include costs associated with our current strategic initiative of relocating call centers from tier 1 cities to tier 2 cities in Brazil to achieve efficiencies through lower rental costs, attrition and absenteeism. Site relocation costs incurred for the three months ended December 31, 2015 related to the anticipation for site closures in Brazil in connection of the site relocation program to tier 2 and tier 3 cities.
(f) Financing and IPO fees for the three months and year ended December 31, 2014 primarily relate to non-core professional fees incurred during the IPO process, including advisory, auditing and legal expenses. Financing and IPO fees for the three months and year ended December 31, 2015 relate to remaining costs incurred during the three months ended March 31, 2015 in connection with the IPO process.
(g) PECs Interest expense represents accrued interest on the preferred equity certificates that were capitalized in connection with the IPO.
(h) Asset impairment and other costs incurred for the year ended December 31, 2014, mainly relate to the goodwill and other intangible asset impairment relating to our operation in Czech Republic (divested in December 2014) of $3.7 million and Spain of $28.8 million, offset by the amendment of the MSA with Telefónica, by which the minimum revenue commitment for Spain was reduced against a $34.5 million penalty fee paid by Telefónica. Asset impairments and other costs for the year ended December 31, 2015 mainly refer to consulting and other costs in connection with efficiencies and costs reduction projects implemented in Brazil and EMEA.
Asset impairments and other costs incurred for the three months ended December 31, 2014 primarily related to a revenue adjustment in Spain ($2.4 million) for prior fiscal years and a one off tax penalty in Colombia ($1.3 million). Asset impairments and other costs for the three months ended December 31, 2015 mainly refer to consulting and other costs in connection with efficiencies and costs reduction projects in implementation in Brazil and EMEA.
(i) Deferred tax asset adjustment as a consequence of the tax rate reduction in Spain from 30% to 28% in 2015 and to 25% in 2016.
(j) As of April 1, 2015, the Company designated the foreign currency risk on certain of its subsidiaries as net investment hedges using financial instruments as the hedging items. As a consequence, any gain or loss on the hedging instrument, related to the effective portion of the hedge will be recognized in other comprehensive income (equity) as from that date. The gain or loss related to the ineffective portion will be recognized in the income statements. Cumulative net foreign exchange gain of such instruments was reversed from equity to profit/(loss) in the three months ended March 31, 2015 in the amount of $13.0 million and in the three months ended September 30, 2015 an amount of $1.0 million. For comparability, this one time adjustment was added back to calculate adjusted earnings.
(k) As of 2015, management analyzes the Company financial condition performance excluding net foreign exchange impacts, which eliminates the volatility to foreign exchange variances from our operational results. For comparability purposes, 2014 adjusted earnings was restated by the net foreign exchange non-cash results from currency fluctuations impacting loans between group companies and other minor effects.
(l) The tax effect represents the tax impact of the total adjustments based on a tax rate of 28.7% for 2014 and 30.5% for the year ended December 31, 2015. For the three months ended December 31, 2014 and 2015 18.8% and 29.6% respectively. The adjustments for the three months ended December 31, 2015 include $1.5 million of DTA adjustments that are both excluded from the adjustments base for tax effect calculation.
(*) The Adjusted Earnings per share, for the period presented in the table above, was calculated considering the number of ordinary shares of 73,648,760 (weighted average number of ordinary shares) as of December 31, 2015. For the period ended December 31, 2014 the number of ordinary shares was 73,619,511.
| 8 |
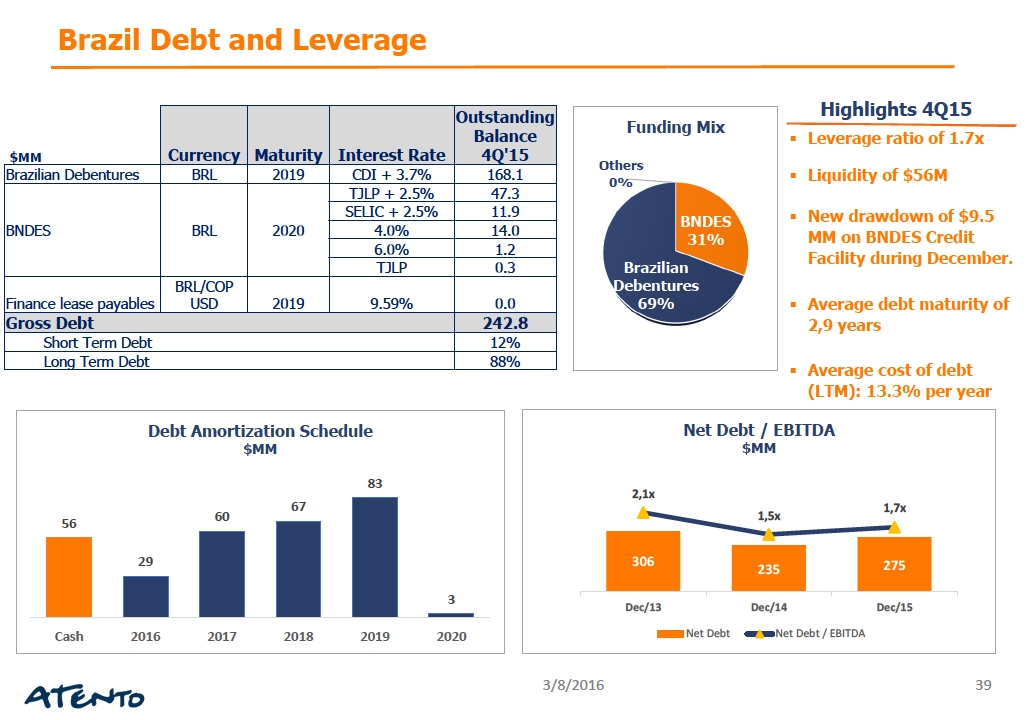
| Reconciliation of Total Debt to Net Debt with Third Parties |
| | | | |
| | As of December 31, |
| | (unaudited) |
($ in millions, except Net Debt/Adj. EBITDA LTM) | | 2015 | | 2014 |
| | | | |
Cash and cash equivalents | | 184.0 | | 211.4 |
Short term financial investments | | - | | 26.9 |
Debt: | | | | |
7.375% Sr. Sec. Notes due 2020 | | 301.7 | | 300.3 |
Brazilian Debentures | | 168.1 | | 245.9 |
Vendor Loan Note(1) | | - | | - |
Contingent Value Instrument | | 26.3 | | 36.4 |
Preferred Equity Certificates | | - | | - |
Finance Lease Payables | | 4.7 | | 9.0 |
Other Borrowings | | 74.8 | | 61.7 |
Total Debt | | 575.6 | | 653.3 |
Preferred Equity Certificates | | - | | - |
Total Debt excluding PECs | | 575.6 | | 653.3 |
Net Debt with third parties(2)(unaudited) | | 391.6 | | 415.0 |
Adjusted EBITDA LTM(3)(non - GAAP) (unaudited) | | 250.3 | | 306.4 |
Net Debt/Adjusted EBITDA LTM (non-GAAP) (unaudited) | | 1.6x | | 1.4x |
(1) Reflects the prepayment to Telefónica of the entire indebtedness under the Vendor Loan Note. The loan was liquidated in connection with the IPO.
(2) In considering our financial condition, our management analyzes net debt with third parties, which is defined as total debt less cash, cash equivalents, and short-term financial investments. Net debt with third parties is not a measure defined by IFRS and it has limitations as an analytical tool. Net debt is neither a measure defined by or presented in accordance with IFRS nor a measure of financial performance, and should not be considered in isolation or as an alternative financial measure determined in accordance with IFRS. Net debt is not necessarily comparable to similarly titled measures used by other companies.
(3) Adjusted EBITDA LTM (Last Twelve Months) is defined as EBITDA adjusted to exclude acquisition and integration related costs, restructuring costs, sponsor management fees, asset impairments, site-relocation costs, financing fees, IPO costs and other items, which are not related to our core results of operations for the last twelve months.
Free Cash Flow
($ in millions) | | For the three months ended December 31, | | For the year ended December 31, |
| | | 2015 | | 2014 | | 2015 | | 2014 |
| | (unaudited) | | (unaudited) | (audited) |
EBITDA (non-GAAP) (unaudited) | | 49.4 | 35.6 | | 222.5 | 207.0 |
Changes in Working Capital | | 13.5 | | 13.1 | | (108.3) | | 23.1 |
Payments for acquisition of property, plant, equipment and intangible assets | | (35.8) | | (36.7) | | (96.4) | | (117.9) |
Disposals of property plant, equipment, and intangible assets | | - | | (0.1) | | 2.4 | | 0.9 |
Income tax paid | | (3.2) | | (3.0) | | (16.2) | | (19.0) |
Free cash flow before interest | | 23.9 | | 8.9 | | 4.0 | | 94.1 |
Net interest | | (15.6) | | (17.5) | | (48.4) | | (72.5) |
Free cash flow (non-GAAP) (unaudited) | | 8.3 | | (8.6) | | (44.4) | | 21.6 |
| 9 |