
Atento Reports Fiscal 2020 Second Quarter Results
Progressive improvement intra-quarter drove solid EBITDA recovery in June
Three Horizon Plan delivers higher Multisector sales and further penetrates high-growth verticals
Continued working capital improvements strengthen cash position and financial liquidity
NEW YORK, August 5, 2020 -- Atento S.A. (NYSE: ATTO) (“Atento” or the “Company”), the largest provider of customer-relationship management and business-process outsourcing services in Latin America, and among the top five providers globally, today announced its second quarter operating and financial results for the period ending June 30, 2020. All comparisons in this announcement are year-over-year (YoY) and in constant-currency (CCY), unless noted otherwise, and may differ from the corresponding 6-K filing due to certain intra-group eliminations.
Q2 2020 highlights
Rapid Covid-19 response continues protecting stakeholders and improves delivery capacity to 97.5% · 60% of agents working from home, with call centers operating safely at full operating capacity · Approximately 80% of agents are now recruited, onboarded and initially trained online · Company continues helping assure continuity of essential services, through remote and secure customer services Strong Recovery Intra-Quarter with Three Horizon Plan delivering growth via targeted fast-growing verticals · Higher sales to Born-Digital, Tech and Media & Entertainment companies; 20 new clients, including US companies · Multisector sales up 5.2% YoY and 7.7% YTD, twice the rate of the market, with mix increasing 540 bps to 68.2% of total revenue in 6M 2020 · Run-rate EBITDA increases 31.9% YoY and 35.8% YTD, with corresponding margin expanding 330 bps to 14.7% in Q2 and 360 bps to 14.3% YTD Cash position rises to $207.2 million, strengthening financial liquidity · Cash position increases 9.0% (ex revolvers) vs June 30, 2019 on working capital improvements · Free Cash Flow of $44.1 million, with $51.0 million in Operating Cash Flow · Leverage under control, even under adverse operating and FX scenarios, with Net Debt-to-EBITDA at 4.0x Operational improvements accelerated under New Cost Savings program · New program targets $80 million in annual savings, with $47 million already implemented · Further reduction of cost structure through right-sizing of operations, as well as implementation of shared services, ZBB and WAHA model New shareholders fully incorporated into Atento team · Significant support of Three Horizon Plan · Near-term priorities are reducing cost structure, refinancing debt and improving capital structure to unlock value for equity holders |
Summarized Financials
| ($ in millions except EPS) | Q2 2020 | Q2 2019 | CCY
Growth (1) | YTD 2020 | YTD 2019 | CCY
Growth (1) |
| Income Statement | | | | | | |
| Revenue | 314.5 | 441.1 | -12.1% | 689.9 | 877.8 | -7.3% |
| EBITDA (2) | 22.2 | 42.6 | -33.0% | 63.0 | 84.5 | -10.2% |
| EBITDA Margin | 7.1% | 9.6% | -2.6 p.p. | 9.1% | 9.6% | -0.5 p.p. |
| Net Income (3) | (18.3) | (6.8) | N.M | (25.8) | (52.2) | 48.5% |
| Recurring Net Income (2) | (10.2) | (7.0) | N.M | (13.4) | (12.5) | 40.6% |
| Earnings Per Share (EPS) ((2) (3) | ($0.26) | ($0.09) | N.M | ($0.36) | ($0.71) | 47.7% |
| Recurring Earnings Per Share (2) | ($0.14) | ($0.09) | N.M | ($0.19) | ($0.16) | 45.6% |
| Earnings Per Share in the reverse split basis ((2) (3) (5)) | ($1.30) | ($0.47) | N.M | ($1.82) | ($3.58) | 47.7% |
| Recurring EPS in the reverse split basis (2) (5) | ($0.72) | ($0.47) | N.M | ($0.95) | ($0.81) | 45.6% |
| Cash flow, Debt and Leverage | | | | | | |
| Net Cash Used In Operating Activities | 53.4 | 26.5 | | 57.7 | (13.3) | |
| Cash and Cash Equivalents | 207.2 | 116.6 | | | | |
| Net Debt (4) | 525.9 | 571.5 | | | | |
| Net Leverage (4) | 4.0x | 3.3x | | | | |
| (1) | Unless otherwise noted, all results are for Q2 2020; all revenue growth rates are on a constant currency basis, year-over-year. |
| (2) | EBITDA, Recurring Net Income/Recurring Earnings per Share (EPS) are Non-GAAP measures. |
| (3) | Reported Net Income and Earnings per Share (EPS) include the impact of non-cash foreign exchange gains/losses on intercompany balances. |
| (4) | Includes IFRS 16 impact in Net Debt and Leverage |
| (5) | Earnings per share and Recurring Earnings per share in the reverse split basis is calculated by applying the ratio of conversion of 5.027090466672970 used in the reverse split into the previous weighted average number of ordinary shares outstanding |
| 1 |  |
| | |
Message from the CEO and CFO
Carlos López-Abadía, Atento’s Chief Executive Officer, commented, “Results in this quarter showed significant and progressive improvement. We exited the quarter with run-rate EBITDA and volume levels consistent with those in June 2019, with the severe impact of the Covid-19 pandemic now behind us. Despite substantially weak operational and economic conditions earlier in the quarter, we continued winning new clients, including leading US brands, in the high-growth Born-Digital and Tech verticals and, more recently, in the Media & Entertainment industry. Clients in these and other higher margin sectors drove Atento’s Multisector revenues 5.2% higher, helping extend our run-rate EBITDA growth with a 29% year-on-year increase, with the corresponding margin expanding 360 basis points to 14.3% on a six-month basis. These clients have been beneficiaries of shifts in spending patterns during the pandemic, many of which are likely to be permanent changes.
At the same time, we continued improving working capital - doubling operating cash flow and generating $44.1 million in free cash flow during the quarter - and launched a new expense reduction program to substantially reduce Atento’s cost structure. This includes rightsizing more of our operations, by shifting more of them to the WAHA model.
Economic conditions will undoubtedly remain challenging for the rest of the year, as the scope, duration and impact of the pandemic remains largely unknown. Nevertheless, we are confident in our ability to effectively address new challenges, as well as seize opportunities, with over half of the committed and collaborative employees who make up One Atento either working from home or at safe, reconfigured call centers. Given Atento’s recovering volumes, renewed sales growth, improving run-rate profitability, sound financial liquidity, as well as our Company’s stronger shareholder and board structures, we expect to continue advancing our Three Horizon transformation plan to achieve consistently higher levels of profitable growth.”
José Azevedo, Atento’s Chief Financial Officer said, “Stronger management of our working capital combined with drawing down Atento’s remaining credit lines substantially reinforced financial liquidity while we drove operating and free cash flow markedly higher during the second quarter.
At the same time, we have been implementing a new cost savings program to augment and accelerate operational improvements under the Three Horizon Plan. We are successfully reducing fixed and variable costs, including administrative expenses, to reduce Atento’s cost structure and drive operating leverage as economic and business environments improve in our markets. Our current efforts to become more cost efficient, combined with a zero based budgeting system that will be fully effective by year-end, are expected to result in $80 million of annualized cost savings beginning next year, of which $47 million has already been achieved on a run-rate basis.
Under our two-pronged financial strategy, we are now turning more of our attention toward capital efficiency. We have begun the process to refinance the $500 million 2022 bond, with the aim of improving Atento’s capital structure in a way that will better align it with our ambitious growth strategy and help unlock more shareholder value.”
Second Quarter Consolidated Financial Results
Atento’s financial liquidity strengthened further during the second quarter, with cash and cash equivalents increasing 27.2% sequentially to $207.2 million, while the Three Horizon Plan drove underlying performance levels higher. Continued improvements in working capital led to strong Free Cash Flow of $44.1 million in the quarter. Due to the Company’s rapid response to disruptions caused by the Covid-19 pandemic, delivery capacity has increased to 97.5%, with most call centers operational and 60% of agents working under the WAHA[1] model.
Multisector sales increased 5.2% to $218.0 million, despite an adverse economic and business environment during April and May, evidencing the effectiveness of Atento’s Three Horizon Plan. The increase in consolidated Multisector revenue during the quarter was driven by an 11.2% increase in Brazil, Atento’s flagship operation, while a 54% increase in US Multisector sales helped offset a decline in this category in Argentina and Peru, resulting in a 1.6% decrease for the Americas. Like Brazil, EMEA multisector revenues also continued to expand, rising 3.2% in the quarter.
Consolidated total revenue declined 12.1% to $314.5 million, mainly reflecting lower revenues from Telefónica (TEF). TEF revenues decreased 38.0% due to a combination of (i) the discontinuation of unprofitable programs in Brazil since the fourth quarter of 2019; and (ii) lower volumes due to Covid-19’s impact in all regions during April and part of May. Based on recent demand, the Company expects volumes to recover to pre-pandemic levels during the second half of 2020.
Atento’s total EBITDA in Q2 2020 decreased 33% year-on-year to $22.2 million, with the corresponding margin contracting 260 basis points to 7.1%. Of this amount, $14.8 million, or 70%, was generated in June, when volumes reached near normal levels. On a run-rate basis, excluding the impact of Covid-19, total EBITDA increased 31.9% compared to normalized EBITDA in second quarter 2019. On a six-month basis, the run rate EBITDA margin expanded 360 basis points to 14.3%. The underlying improvement in the Company’s EBITDA was due to continued improvements in the client and service mix as well as to additional operational improvements under a new cost reduction program, which targets $80 million in annualized savings, with $47 million of these savings measures already in effect as of June 30.
1 Work-at-Home Agent
| 2 | |
| | |
Recurring Net Income decreased from a $7.0 million loss in Q2 2019 to $10.2 loss in Q2 2020, with recurring EPS of -$0.14 in the latter quarter. Excluding the impact of Covid-19 and costs related to drawing down credit lines, Recurring EPS was +$0.15 in Q2 2020.
Segment Reporting
Brazil
| ($ in millions) | Q2 2020 | Q2 2019 | CCY growth | YTD 2020 | YTD 2019 | CCY growth |
| Brazil Region | | | | | | |
| Revenue | 135.2 | 210.4 | -11.9% | 307.3 | 428.7 | -9.2% |
| Adjusted EBITDA | 10.6 | 26.5 | -45.2% | 35.0 | 54.3 | -18.0% |
| Adjusted EBITDA Margin | 7.8% | 12.6% | -4.8 p.p. | 11.4% | 12.7% | -1.3 p.p. |
| Operating Income/(loss) | (8.0) | (2.9) | N.M | (16.2) | (8.9) | 129.8% |
| Brazil Revenue Mix | 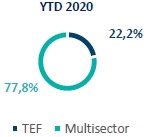 | 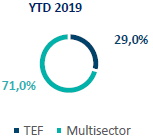 |
In Brazil, Multisector sales increased 11.2% YoY, while TEF sales decreased 51.5%, leading to an 11.9% decrease in total revenues.
On a year-to-date basis, Multisector sales as a percentage of Brazil’s total revenue expanded 680 basis points, primarily due to higher sales to Born-Digital clients acquired during 2019 and new clients in 2020. Among new clients this year is Riot Games, a US-based company that develops and publishes popular video games, such as League of Legends. In May, Atento signed a partnership agreement with Riot Games to provide services to Brazilian game players. Atento was selected because of its ability to create Customer Experience environments consistent with Riot Games’ culture and to hire, manage and maintain CX specialists with appropriate profiles and gaming experience.
The decrease in TEF sales in Brazil during the second quarter was mainly due to the discontinuation of unprofitable programs since the fourth quarter of 2019 and to the pandemic’s impact on volumes, mostly during April and part of May, as the company decided to focus its delivery capacity to the Multisector clients.
Brazil’s reported EBITDA decreased 45.2% to $10.6 million, with the EBITDA margin contracting 480 basis points to 7.8%, mainly due to the Covid-19 impact.
| 3 | |
| | |
Americas Region
| ($ in millions) | Q2 2020 | Q2 2019 | CCY growth | YTD 2020 | YTD 2019 | CCY growth |
| Americas Region | | | | | | |
| Revenue | 129.9 | 171.8 | -11.4% | 277.3 | 333.5 | -5.2% |
| Adjusted EBITDA | 14.5 | 18.6 | -10.7% | 28.2 | 32.7 | -5.2% |
| Adjusted EBITDA Margin | 11.2% | 10.8% | 0.3 p.p. | 10.2% | 9.8% | 0.4 p.p. |
| Operating Income/(loss) | (0.3) | 0.4 | N.M | (7.1) | (7.2) | 24.6% |
| | | | | | | |
| Americas Revenue Mix | 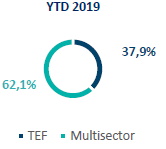 | 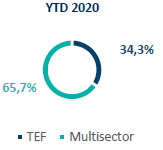
|
Second quarter Americas revenue decreased 11.4% to $129.9 million. In total, Multisector sales decreased 1.6% during the quarter, with an above 50% growth in US Multisector clients helping offset lower volumes in Peru and Argentina, countries with stricter lockdown rules and highly impacted by Covid-19. As a percentage of the region’s revenue, Multisector sales expanded 360 basis points, compared to the first six months of 2019. Lower volumes resulting from the pandemic also mainly accounted for the 31.7% decrease in TEF revenues in the region.
Reported EBITDA in the Americas decreased 10.7% to $14.5 million on lower volumes during the second quarter, while the corresponding margin expanded 30 basis points to 11.2%, despite the impact of Covid-19, due to a better revenue mix and cost management.
EMEA Region
| ($ in millions) | Q2 2020 | Q2 2019 | CCY growth | YTD 2020 | YTD 2019 | CCY growth |
| EMEA Region | | | | | | |
| Revenue | 50.5 | 61.2 | -15.7% | 108.0 | 123.3 | -10.2% |
| Adjusted EBITDA | (0.3) | 5.5 | N.M | 3.5 | 11.8 | -69.8% |
| Adjusted EBITDA Margin | -0.5% | 9.0% | -9.5 p.p. | 3.2% | 9.6% | -6.4 p.p. |
| Operating Income/(loss) | (3.4) | 4.2 | N.M | (3.9) | 0.2 | N.M |
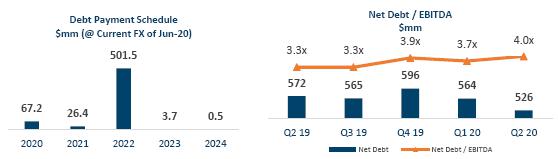
| EMEA Revenue Mix | 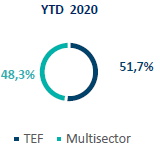
|  |
Multisector sales continued to expand in the region, with the 3.2% growth in the quarter helping to further diversify revenues. On a six-month basis, Multisector sales expanded 840 basis points year-over-year to 48.3% of EMEA revenue. TEF sales were impacted by lower volumes, mainly due to Covid-19, leading to a 28.1% decrease, resulting in a 15.7% year-over-year decline in the region’s overall revenue.
| 4 | |
| | |
EMEA’s second quarter EBITDA decreased to slightly below the breakeven point, from $5.5 million in the same quarter of last year. At the end of the quarter, the region’s EBITDA margin was negative 0.5% versus a positive 9.0% in the comparable 2019 period, mostly due to the impact of Covid-19.
Cash Flow and Capital Structure
| ($ in millions) | Q2 2020 | Q2 2019 | YTD 2020 | YTD 2019 |
| Consolidated Cash Flow Statement | | | | |
| Net Cash (used in) from Operating activities | 53.4 | 26.5 | 57.7 | -13.3 |
| Net Cash used in Investing activities | -7.3 | -21.4 | -18.6 | -38.1 |
| Net Cash provided by Financing activities | -1.6 | 32.0 | 57.2 | 33.8 |
| Net (increase/decrease) in cash and cash equivalents | 44.5 | 37.1 | 96.3 | -17.5 |
Additional operational improvements under the transformation plan further enhanced Atento’s working capital, resulting in higher operating and free cash flows, with the former increasing twofold to $51.1 million and the latter turning positive to $44.1 million in the second quarter. During the quarter, the Company obtained another $10 million in one-off overdue collections, bringing the total to $30 million year-to-date. During the first six months of the year, Atento’s DSO were reduced by approximately 4 days, while DPO improved by circa 13 days, due to strengthened collections and procurement policies.
Cash capex was equivalent to 2.7% of revenues during the first six months of 2020, and includes costs associated with shifting a portion of Atento’s call center employees to the WAHA model. Owing to the impact of the Covid-19 pandemic on Atento’s markets, all non-essential capital expenditures remained suspended mainly in April and May.
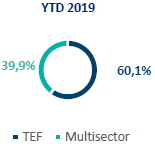
At June 30, 2020, cash and cash equivalents totaled $207.2 million, up 9.0% when excluding drawdowns of $80 million from existing credit lines during the first six months of 2020. Net debt was $525.9 million, which includes $129.6 million related to IFRS16. Atento’s total debt has an average maturity of 2.1 years and an average LTM cost of 7.0%. At the end of the second quarter, the LTM net debt-to-EBITDA ratio was 4.0 times, which is a controllable level due to the Company’s strong financial liquidity and the normalization of EBITDA generation in June. The Company has initiated the process to refinance the $500 million 2022 bond, with the aim of extending the maturity of the debt and improving Atento’s capital structure.
| ($ in millions) as of June 30, 2020 | Maturity | Interest Rate | Outstanding Balance 2Q20 |
| Indebtness | | | |
| Senior Secured Notes | 2022 | 6.125% | 503.8 |
| Super Senior Credit Facility | 2020 | 5.223% | 50.7 |
| Other Credit Facilities | 2020 | CDI + 2.40% | 35.9 |
| Other borrowings and leases | 2023 | Variable | 12.4 |
| BNDES (BRL) | 2022 | TJLP + 2.0% | 0.7 |
| Debt with third parties | 603.5 |
| Leasing (IFRS16) | 129.6 |
| Gross Debt (third parties + IFRS16) | 733.1 |
| Cash and Cash Equivalents | 207.2 |
| Net Debt | 525.9 |
| 5 | |
| | |
Update On Covid-19 Response: Company Continues Effectively Executing Transformation Plan and Preparing to Capture Post-crisis Market Opportunities
As a socially responsible company, Atento remains fully committed to helping ensure that its remote and secure customer services remain available to people and businesses in the 13 countries where it operates. This commitment includes maintaining robust health and safety protocols and measures to protect employees at Atento facilities, to help ensure business continuity for the duration of the Covid-19 pandemic.
Currently, Atento has over 64,000 work-at-home agents (WAHA), or approximately 60% of its call center employees. For agents working at Atento call centers, most of which are operational, individual workstations are still kept at safe distances and personal work equipment (individual headset, keyboard, mouse, etc.) remains available. With operating capacity at 97.5%, the Company has a broad capacity to meet the needs of all clients. The transition to a WAHA model was facilitated by the digital transformation process underway, since 2019, under Atento’s Three Horizon Transformation Plan, which has included re-skilling as well as digital recruiting, onboarding and training.
This model as well as other enhanced digital capabilities are also allowing the Company to capture medium- and long-term CRM and BPO opportunities arising from dramatic shifts in consumer behaviors and related changes being implemented by emerging and established companies seeking to attract and retain more customers in Latin America, the US and Europe. The growing strength of Atento’s digital capabilities, evolving portfolio of Next Generation Services and journey orchestration, coupled with accelerated operational improvements that are resulting in a more competitive cost structure, are allowing the Company to continue leading Next Generation Customer Experience in the future.
Share Repurchase Program
Under a $30 million 12-month share buyback program approved by Atento’s Board of Directors earlier in the year, the Company purchased $0.4 million of shares during the second quarter.
Reverse Share Split
On July 28, 2020, Atento announced that the Company’s shareholders had approved the conversion of the entire share capital of 75,406,357 ordinary shares into 15,000,000 ordinary shares, without nominal value, using a conversion ratio of 5.027090466672970, effective after trading hours on July 29, 2020. Atento’s ordinary shares started trading on a split-adjusted basis on the NYSE at the open of trading on July 30, 2020.
The Company proposed to effect the reverse share split in response to a notification received from the NYSE that its ordinary shares did not meet the minimum price threshold average closing price of $1.00 per share over a consecutive 30-trading day period. Although Atento’s ordinary shares had resumed trading above this threshold, the reverse share split is intended to provide a structural solution to allow the Company to remain compliant with NYSE’s listing rules.
Awards and Recognitions
Atento was recognized recently by the Everest Group as one of the leading companies in Customer Experience Management in its annual PEAK Matrix® Assessment 2020. Among Major Contenders, Atento was the only company rated a Star Performer, a title conferred to providers that demonstrate the most improvement over time on the Matrix. Atento stood out for promoting a culture of co-innovation, offering integrated multi-channel capabilities based on Artificial Intelligence, IoT (Internet of Things) and RPA (Robotic Process Automation), among other digital strengths, and for building an increasingly satisfying customer experience. The Star Performer rating reflects the competitiveness of Atento’s offerings in the CRM/BPO market, where companies increasingly expect their service providers to exhibit proactiveness and drive innovation.
Conference Call
The Company will host a conference call and webcast on Thursday, August 6, 2020 at 11:00 am ET to discuss its financial results. The conference call can be accessed by dialing: USA: +1 (412) 717-9627; UK: (+44) 20 3795 9972; Brazil: (+55) 11 3181-8565; or Spain: (+34) 91 038 9593. It can also be acess by web phone (Click here) No passcode is required. Individuals who dial in will be asked to identify themselves and their affiliations. The live webcast of the conference call will be available on Atento's Investor Relations website at investors.atento.com. A web-based archive of the conference call will also be available at the above website.
| 6 | |
| | |
About Atento
Atento is the largest provider of customer relationship management and business process outsourcing (CRM BPO) services in Latin America, and among the top five providers globally, based on revenues. Atento is also a leading provider of nearshoring CRM/BPO services to companies that carry out their activities in the United States. Since 1999, the company has developed its business model in 13 countries where it employs 150,000 people. Atento has over 400 clients to whom it offers a wide range of CRM/BPO services through multiple channels. Atento’s clients are mostly leading multinational corporations in sectors such as telecommunications, banking and financial services, health, retail and public administrations, among others. In 2019, Atento was named one of the World’s 25 Best Multinational Workplaces and one of the Best Multinationals to Work for in Latin America by Great Place to Work®. Atento is also the world’s first CRM company to be ISO 56002 certified in Innovation Management. Atento’s shares trade under the symbol ATTO on the New York Stock Exchange (NYSE). For more information visit www.atento.com.
Investor Relations
Shay Chor
+ 55 11 3293-5926
shay.chor@atento.com | Investor Relations Fernando Schneider + 55 11 3779-8119 fernando.schneider@atento.com | Media Relations
Pablo Sánchez Pérez +34 670031347
pablo.sanchez@atento.com |
Forward-Looking Statements
This press release contains forward-looking statements. Forward-looking statements can be identified by the use of words such as "may," "should," "expects," "plans," "anticipates," "believes," "estimates," "predicts," "intends," "continue" or similar terminology. These statements reflect only Atento's current expectations and are not guarantees of future performance or results. Forward-looking statements by their nature address matters that are, to different degrees, uncertain, such as statements about the potential impacts of the Covid-19 pandemic on our business operations, financial results and financial position and on the world economy. These statements are subject to risks and uncertainties that could cause actual results to differ materially from those contained in the forward-looking statements. These risks and uncertainties include, but are not limited to, competition in Atento's highly competitive industries; increases in the cost of voice and data services or significant interruptions in these services; Atento's ability to keep pace with its clients' needs for rapid technological change and systems availability; the continued deployment and adoption of emerging technologies; the loss, financial difficulties or bankruptcy of any key clients; the effects of global economic trends on the businesses of Atento's clients; the non-exclusive nature of Atento's client contracts and the absence of revenue commitments; security and privacy breaches of the systems Atento uses to protect personal data; the cost of pending and future litigation; the cost of defending Atento against intellectual property infringement claims; extensive regulation affecting many of Atento's businesses; Atento's ability to protect its proprietary information or technology; service interruptions to Atento's data and operation centers; Atento's ability to retain key personnel and attract a sufficient number of qualified employees; increases in labor costs and turnover rates; the political, economic and other conditions in the countries where Atento operates; changes in foreign exchange rates; Atento's ability to complete future acquisitions and integrate or achieve the objectives of its recent and future acquisitions; future impairments of our substantial goodwill, intangible assets, or other long-lived assets; and Atento's ability to recover consumer receivables on behalf of its clients. In addition, Atento is subject to risks related to its level of indebtedness. Such risks include Atento's ability to generate sufficient cash to service its indebtedness and fund its other liquidity needs; Atento's ability to comply with covenants contained in its debt instruments; the ability to obtain additional financing; the incurrence of significant additional indebtedness by Atento and its subsidiaries; and the ability of Atento's lenders to fulfill their lending commitments. Atento is also subject to other risk factors described in documents filed by the company with the United States Securities and Exchange Commission.
These forward-looking statements speak only as of the date on which the statements were made. Atento undertakes no obligation to update or revise publicly any forward-looking statements, whether as a result of new information, future events or otherwise.
| 7 | |
| | |
SELECTED FINANCIAL DATA:
The following selected financial information should be read in conjunction with the interim consolidated financial statements presented elsewhere in the Form 6-K.
Consolidated Statements of Operations for the Three and Six Months Ended June 30, 2019 and 2020
| ($ in millions, except percentage changes) | For the three months ended June 30, | Change (%) | Change excluding FX (%) | For the six months ended June 30, | Change (%) | Change excluding FX (%) |
| 2019 | 2020 | 2019 | 2020 |
| (unaudited) | | | (unaudited) | | |
| Revenue | 441,1 | 314,5 | (28.7) | (12.1) | 877.8 | 689.9 | (21.4) | (7.3) |
| Other operating income | 0.7 | 1.1 | 50.3 | 65.0 | 1.4 | 2.0 | 43.3 | 54.5 |
| Other gains and own work capitalized | 0.1 | - | (100.0) | (100.0) | 0.1 | - | (95.1) | (95.1) |
| Operating expenses: | | | | | | | | |
| Supplies | (15.1) | (16.0) | 6.1 | 31.3 | (31.9) | (32.7) | 2.6 | 20.1 |
| Employee benefit expenses | (334.7) | (245.0) | (26.8) | (10.0) | (674.0) | (534.0) | (20.8) | (6.7) |
| Depreciation | (19.9) | (17.8) | (10.3) | 12.2 | (41.7) | (37.6) | (9.8) | 6.4 |
| Amortization | (13.3) | (10.9) | (18.4) | 1.4 | (26.9) | (22.6) | (16.0) | (1.0) |
| Changes in trade provisions | (1.5) | (1.4) | (4.6) | 24.8 | (1.5) | (1.9) | 31.7 | 71.9 |
| Impairment charges | - | - | N.M. | N.M. | - | - | (100.0) | (100.0) |
| Other operating expenses | (48.1) | (31.1) | (35.5) | (22.4) | (87.3) | (60.3) | (30.9) | (19.4) |
| Total operating expenses | (432.6) | (322.2) | (25.5) | (8.5) | (863.2) | (689.1) | (20.2) | (6.0) |
| Operating profit | 9.3 | (6.5) | N.M. | N.M. | 16.1 | 2.8 | (82.5) | (76.7) |
| Finance income | 2.1 | 8.6 | N.M. | N.M. | 4.4 | 11.0 | 147.5 | N.M. |
| Finance costs | (19.7) | (17.0) | (14.0) | (1.6) | (37.9) | (32.8) | (13.3) | (2.8) |
| Net foreign exchange loss | (1.4) | (5.8) | N.M. | N.M. | (3.0) | (9.3) | N.M. | N.M. |
| Net finance expense | (19.1) | (14.2) | (25.6) | (8.4) | (36.4) | (31.1) | (14.6) | 3.8 |
| Loss before income tax | (9.7) | (20.7) | 112.9 | 130.0 | (20.3) | (28.3) | 39.0 | 57.7 |
| Income tax benefit/(expense) | 3.1 | 2.4 | (23.8) | (21.1) | (31.9) | 2.5 | (107.9) | (107.9) |
| Loss for the period | (6.6) | (18.3) | N.M. | N.M. | (52.2) | (25.8) | (50.7) | (48.5) |
| (Loss)/profit attributable to: | | | | | | | | |
| Owners of the parent | (6.9) | (18.3) | N.M. | N.M. | (52.8) | (25.8) | (51.2) | (49.0) |
| Non-controlling interest | 0.2 | - | (100.0) | (100.0) | 0.6 | - | (100.0) | (100.0) |
| Loss for the period | (6.6) | (18.3) | N.M. | N.M. | (52.2) | (25.8) | (50.7) | (48.5) |
| Other financial data: | | | | | | | | |
| EBITDA (1) (unaudited) | 42.6 | 22.2 | (47.8) | (33.0) | 84.6 | 63.0 | (25.6) | (10.2) |
| Adjusted EBITDA (1) (unaudited) | 42.6 | 22.2 | (47.8) | (33.0) | 84.6 | 63.0 | (25.6) | (10.2) |
(1) For the reconciliation of these non-GAAP measures to the closest comparable IFRS measure, see section "Summary Consolidated Historical Financial Information - Reconciliation of EBITDA and Adjusted EBITDA to profit/(loss)".
N.M. means not meaningful
| 8 | |
| | |
Consolidated Statements of Operations by Segment for the Three Months Ended June 30, 2019 and 2020
| ($ in millions, except percentage changes) | For the three months ended June 30, | Change (%) | Change Excluding FX (%) | For the six months ended June 30, | Change (%) | Change Excluding FX (%) |
| 2019 | 2020 | 2019 | 2020 |
| | (unaudited) |
| Revenue: | | | | | | | | |
| Brazil | 210.4 | 135.2 | (35.7) | (11.9) | 428.7 | 307.3 | (28.3) | (9.2) |
| Americas | 171.8 | 129.9 | (24.4) | (11.4) | 333.5 | 277.3 | (16.9) | (5.2) |
| EMEA | 61.2 | 50.5 | (17.4) | (15.7) | 123.3 | 108.0 | (12.4) | (10.2) |
| Other and eliminations (1) | (2.3) | (1.1) | (49.8) | (42.4) | (7.7) | (2.6) | (66.1) | (63.6) |
| Total revenue | 441.1 | 314.5 | (28.7) | (12.1) | 877.8 | 689.9 | (21.4) | (7.3) |
| Operating expenses: | | | | | | | | |
| Brazil | (204.8) | (141.6) | (30.8) | (5.2) | (419.9) | (309.4) | (26.3) | (6.7) |
| Americas | (165.1) | (128.9) | (21.9) | (8.4) | (330.0) | (278.1) | (15.7) | (3.7) |
| EMEA | (59.6) | (54.3) | (8.9) | (7.0) | (121.4) | (112.7) | (7.2) | (4.8) |
| Other and eliminations (1) | (3.1) | 2.7 | N.M. | N.M. | 8.0 | 11.2 | 39.2 | 99.7 |
| Total operating expenses | (432.6) | (322.2) | (25.5) | (8.5) | (863.2) | (689.1) | (20.2) | (6.0) |
| Operating profit/(loss): | | | | | | | | |
| Brazil | 5.7 | (6.4) | N.M. | N.M. | 9.0 | (2.1) | (123.2) | (130.0) |
| Americas | 7.0 | 2.0 | (71.0) | (66.9) | 4.1 | 0.5 | (87.9) | (87.9) |
| EMEA | 2.0 | (3.8) | N.M. | N.M. | 2.6 | (4.2) | N.M. | N.M. |
| Other and eliminations (1) | (5.3) | 1.6 | (129.7) | (128.5) | 0.4 | 8.6 | N.M. | N.M. |
| Total operating profit/(loss) | 9.3 | (6.5) | N.M. | N.M. | 16.1 | 2.8 | (82.5) | (76.7) |
| Net finance expense: | | | | | | | | |
| Brazil | (8.8) | (5.1) | (42.2) | (20.4) | (20.8) | (21.6) | 3.6 | 31.1 |
| Americas | (4.3) | (0.7) | (83.7) | (77.6) | (9.5) | (4.8) | (49.2) | (35.7) |
| EMEA | (0.1) | (0.5) | N.M. | N.M. | (0.8) | (0.5) | (41.3) | (39.4) |
| Other and eliminations (1) | (5.9) | (8.0) | 35.2 | 35.5 | (5.2) | (4.2) | (19.5) | (19.0) |
| Total net finance expense | (19.1) | (14.2) | (25.6) | (8.4) | (36.4) | (31.1) | (14.6) | 3.8 |
| Income tax benefit/(expense): | | | | | | | | |
| Brazil | 0.1 | 3.5 | N.M. | N.M. | 3.0 | 7.5 | 148.6 | N.M. |
| Americas | (2.4) | (1.6) | (31.8) | (34.5) | (1.8) | (2.8) | 58.8 | 24.3 |
| EMEA | 2.4 | 0.9 | (63.2) | (63.3) | (1.6) | 0.7 | (144.8) | (147.5) |
| Other and eliminations (1)(3) | 2.9 | (0.4) | (112.5) | (112.5) | (31.5) | (2.9) | (91.0) | (90.7) |
| Total income tax benefit/(expense) | 3.1 | 2.4 | (23.8) | (21.1) | (31.9) | 2.5 | (107.9) | (107.9) |
| Profit/(loss) for the period: | | | | | | | | |
| Brazil | (2.9) | (8.0) | N.M. | N.M. | (8.9) | (16.2) | 83.1 | 129.8 |
| Americas | 0.4 | (0.3) | N.M. | (146.9) | (7.2) | (7.1) | (1.3) | 24.6 |
| EMEA | 4.2 | (3.4) | N.M. | N.M. | 0.2 | (3.9) | N.M. | N.M. |
| Other and eliminations (1) | (8.3) | (6.7) | (18.5) | (21.0) | (36.3) | 1.5 | (104.2) | (104.1) |
| Loss for the period | (6.6) | (18.3) | N.M. | N.M. | (52.2) | (25.8) | (50.7) | (48.5) |
| Profit/(loss) attributable to: | | | | | | | | |
| Owners of the parent | (6.9) | (18.3) | N.M. | N.M. | (52.8) | (25.8) | (51.2) | (49.0) |
| Non-controlling interest | 0.2 | - | (100.0) | (100.0) | 0.6 | - | (100.0) | (100.0) |
| Other financial data: | | | | | | | | |
| EBITDA (2): | | | | | | | | |
| Brazil | 23.8 | 8.7 | (63.3) | (49.4) | 46.3 | 29.8 | (35.6) | (18.3) |
| Americas | 18.7 | 12.6 | (32.4) | (22.1) | 28.6 | 22.8 | (20.3) | (12.9) |
| EMEA | 5.2 | (0.8) | (116.2) | (116.6) | 9.2 | 1.7 | (81.4) | (80.8) |
| Other and eliminations (1) | (5.2) | 1.7 | (131.8) | (130.2) | 0.5 | 8.7 | N.M. | N.M. |
| Total EBITDA (unaudited) | 42.6 | 22.2 | (47.8) | (33.0) | 84.6 | 63.0 | (25.6) | (10.2) |
| Adjusted EBITDA (2): | | | | | | | | |
| Brazil | 26.5 | 10.6 | (60.2) | (45.2) | 54.3 | 35.0 | (35.6) | (18.0) |
| Americas | 18.6 | 14.5 | (21.9) | (10.7) | 32.7 | 28.2 | (13.8) | (5.2) |
| EMEA | 5.5 | (0.3) | (104.9) | (105.0) | 11.8 | 3.5 | (70.6) | (69.8) |
| Other and eliminations (1) | (8.0) | (2.6) | (67.5) | (66.4) | (14.2) | (3.7) | (74.1) | (73.3) |
| Total Adjusted EBITDA (unaudited) | 42.6 | 22.2 | (47.8) | (33.0) | 84.6 | 63.0 | (25.6) | (10.2) |
(1) Included revenue and expenses at the holding-company level (such as corporate expenses and acquisition related expenses), as applicable, as well as consolidation adjustments. N.M. means not meaningful
| 9 | |
| | |
Balance Sheet ($ Thousands)
| ASSETS | | |
| December 31, | June 30, |
| 2019 | 2020 |
| | (audited) | (unaudited) |
| NON-CURRENT ASSETS | 765,839 | 602,715 |
| | | |
| Intangible assets | 160,041 | 115,629 |
| Goodwill | 119,902 | 98,229 |
| Right-of-use assets | 181,564 | 124,363 |
| Property, plant and equipment | 116,893 | 89,043 |
| Non-current financial assets | 82,158 | 73,919 |
| Trade and other receivables | 22,124 | 16,635 |
| Other non-current financial assets | 54,652 | 41,093 |
| Derivative financial instruments | 5,382 | 16,191 |
| Other taxes receivable | 5,650 | 4,638 |
| Deferred tax assets | 99,631 | 96,894 |
| | | |
| CURRENT ASSETS | 538,772 | 559,160 |
| | | |
| Trade and other receivables | 388,308 | 310,157 |
| Trade and other receivables | 359,599 | 282,832 |
| Current income tax receivable | 28,709 | 27,325 |
| Derivative financial instruments | - | 1,405 |
| Other taxes receivable | 24,664 | 39,221 |
| Other current financial assets | 1,094 | 1,183 |
| Cash and cash equivalents | 124,706 | 207,194 |
| | | |
| TOTAL ASSETS | 1,304,611 | 1,161,875 |
| 10 | |
| | |
| | | |
| EQUITY AND LIABILITIES | December 31, | June 30, |
| 2019 | 2020 |
| | (audited) | (unaudited) |
| | | |
| TOTAL EQUITY | 207,020 | 89,254 |
| EQUITY ATTRIBUTABLE TO: | | |
| OWNERS OF THE PARENT COMPANY | 207,020 | 89,254 |
| | | |
| Share capital | 49 | 49 |
| Share premium | 619,461 | 613,647 |
| Treasury shares | (19,319) | (11,593) |
| Retained losses | (127,070) | (156,011) |
| Translation differences | (271,273) | (317,998) |
| Cash flow / Net investment Hedge | (8,872) | (51,471) |
| Stock-based compensation | 14,044 | 12,631 |
| | | |
| NON-CURRENT LIABILITIES | 718,989 | 655,491 |
| | | |
| Deferred tax liabilities | 20,378 | 14,282 |
| Debt with third parties | 633,498 | 586,092 |
| Derivative financial instruments | 2,289 | 4,812 |
| Provisions and contingencies | 48,326 | 39,715 |
| Non-trade payables | 11,744 | 8,699 |
| Other taxes payable | 2,754 | 1,891 |
| | | |
| CURRENT LIABILITIES | 378,602 | 417,130 |
| | | |
| Debt with third parties | 87,117 | 147,030 |
| Derivative financial instruments | 167 | - |
| Trade and other payables | 272,547 | 247,501 |
| Trade payables | 71,676 | 68,215 |
| Income tax payables | 12,671 | 15,005 |
| Other taxes payables | 93,765 | 91,762 |
| Other non-trade payables | 94,435 | 72,519 |
| Provisions and contingencies | 18,771 | 22,595 |
| TOTAL EQUITY AND LIABILITIES | 1,304,611 | 1,161,875 |
| 11 | |
| | |
Cash Flow ($ thousand)
| | For the three months ended June 30, | For the six months ended June 30, |
| | 2019 | 2020 | 2019 | 2020 |
| | (unaudited) |
| Operating activities | | | | |
| Loss before income tax | (9.7) | (20.7) | (20.3) | (28.3) |
| Adjustments to reconcile loss before income tax to net cash flows: | | | | |
| Amortization and depreciation | 33.2 | 28.7 | 68.5 | 60.2 |
| Changes in trade provisions | 1.5 | 1.4 | 1.5 | 1.9 |
| Share-based payment expense | 1.5 | 0.5 | 2.1 | 1.1 |
| Change in provisions | 12.0 | 12.3 | 21.6 | 16.4 |
| Grants released to income | (0.2) | (0.2) | (0.4) | (0.3) |
| Losses on disposal of property, plant and equipment | 0.1 | - | 0.1 | 0.2 |
| Finance income | (2.1) | (8.6) | (4.4) | (11.0) |
| Finance costs | 19.7 | 17.0 | 37.9 | 32.8 |
| Net foreign exchange differences | 1.4 | 5.8 | 3.0 | 9.3 |
| Change in other (gains)/ losses and own work capitalized | (7.5) | 0.9 | 2.1 | (0.4) |
| | 59.4 | 57.8 | 131.9 | 110.2 |
| Changes in working capital: | | | | |
| Changes in trade and other receivables | (35.6) | 27.4 | (105.2) | (9.8) |
| Changes in trade and other payables | 38.0 | 22.3 | 33.4 | 32.6 |
| Other assets/(payables) | (0.9) | (26.2) | 3.5 | (21.8) |
| | 1.5 | 23.5 | (68.3) | 1.0 |
| | | | | |
| Interest paid | (4.9) | (2.3) | (23.2) | (22.0) |
| Interest received | 0.3 | 0.3 | 0.3 | 10.1 |
| Income tax paid | (10.7) | (0.4) | (14.4) | (7.5) |
| Other payments | (9.4) | (4.8) | (19.1) | (5.7) |
| | (24.7) | (7.2) | (56.5) | (25.1) |
| Net cash flows from/(used in) operating activities | 26.5 | 53.4 | (13.3) | 57.7 |
| Investing activities | | | | |
| Payments for acquisition of intangible assets | (0.6) | (3.5) | (15.7) | (3.6) |
| Payments for acquisition of property, plant and equipment | (3.2) | (3.8) | (6.5) | (14.8) |
| Acquisition of subsidiaries, net of cash acquired | (14.9) | - | (14.9) | - |
| Payments for financial instruments | (0.9) | - | (1.1) | (0.3) |
| Proceeds from sale of PP&E and intangible assets | (1.8) | - | - | - |
| Net cash flows used in investing activities | (21.4) | (7.3) | (38.1) | (18.6) |
| Financing activities | | | | |
| Proceeds from borrowing from third parties | 113.8 | 22.9 | 150.3 | 100.4 |
| Repayment of borrowing from third parties | (65.2) | (13.9) | (86.3) | (23.3) |
| Payments of lease liabilities | (16.0) | (10.0) | (29.7) | (19.4) |
| Acquisition of treasury shares | (0.5) | (0.5) | (0.5) | (0.5) |
| Net cash flows provided by/(used in) financing activities | 32.0 | (1.6) | 33.8 | 57.1 |
| Net (decrease)/increase in cash and cash equivalents | 37.1 | 44.5 | (17.5) | 96.2 |
| Foreign exchange differences | 1.6 | (0.1) | 0.6 | (13.9) |
| Cash and cash equivalents at beginning of period | 77.9 | 162.8 | 133.5 | 124.7 |
| Cash and cash equivalents at end of period | 116.6 | 207.2 | 116.6 | 207.2 |
| 12 | |
| | |
Adjustments to EBITDA by Quarter
| | | Fiscal 2018 | Fiscal 2019 | Fiscal 2020 |
| ($ in millions) | | Q1 | Q2 | Q3 | Q4 | FY | Q1 | Q2 | Q3 | Q4 | FY | Q1 | Q2 |
| Profit/(loss) for the period | | (1.7) | 4.0 | 3.1 | 15.0 | 20.5 | (45.6) | (6.6) | 1.3 | (29.6) | (80.7) | (7.4) | (18.3) |
| Net finance expense | | 19.6 | 21.9 | 18.3 | (4.2) | 55.6 | 17.3 | 19.1 | 13.8 | 6.9 | 57.1 | 16.9 | 14.2 |
| Income tax expense | | 5.5 | (0.5) | 3.8 | 4.6 | 13.4 | (2.9) | (3.1) | 2.3 | 2.0 | 36.2 | (0.2) | (2.4) |
| Write-off of deferred tax assets | | - | - | - | - | - | 37.8 | - | - | - | - | - | - |
| Depreciation and amortization | | 26.3 | 23.6 | 21.8 | 23.6 | 95.2 | 35.3 | 33.2 | 30.8 | 41.4 | 140.8 | 31.5 | 28.7 |
| EBITDA (non-GAAP) (unaudited) | | 49.8 | 49.1 | 46.9 | 39.0 | 184.8 | 42.0 | 42.6 | 48.1 | 20.7 | 153.4 | 40.8 | 22.2 |
| Adjusted EBITDA (non-GAAP) (unaudited) | | 49.8 | 49.1 | 46.9 | 39.0 | 184.8 | 42.0 | 42.6 | 48.1 | 20.7 | 153.4 | 40.8 | 22.2 |
| Adjusted EBITDA Margins | | 10.1% | 10.4% | 10.9% | 9.2% | 10.2% | 9.6% | 9.6% | 12.8% | 5.0% | 9.0% | 10.9% | 7.1% |
IFRS 16 Effect
| | IFRS 16: Effect (YTD 2020) |
| Revenue | 0.0 |
| EBITDA | 27.1 |
| Depreciation & Amortization | (22.3) |
| Operating Profit | 4.8 |
| Finance costs | (6.8) |
| (Loss)/profit before income tax | (2.0) |
| Income tax expense | 0.0 |
| (Loss)/profit after income tax | (2.0) |
Add-Backs to Net Income by Quarter
| | Fiscal 2018 | Fiscal 2019 | Fiscal 2020 |
| ($ in millions, except percentage changes) | Q1 | Q2 | Q3 | Q4 | FY | Q1 | Q2 | Q3 | Q4 | FY | Q1 | Q2 |
| Profit/(Loss) attributable to equity holders of the parent | (1.7) | 4.0 | 3.1 | 15.0 | 20.5 | (45.6) | (6.6) | 1.3 | (29.6) | (80.7) | (7.4) | (18.3) |
| Amortization of Acquisition related Intangible assets | 5.7 | 5.3 | 5.1 | 5.1 | 21.2 | 5.1 | 5.0 | 4.9 | 5.5 | 20.6 | 5.0 | 4.3 |
| Net foreign exchange gain on financial instruments | 3.1 | (9.0) | 5.9 | - | 0.0 | - | - | - | - | | - | |
| Net foreign exchange impacts | 2.8 | 19.0 | 9.3 | (2.3) | 28.8 | 1.6 | 1.4 | (2.3) | 8.4 | 9.1 | 3.5 | 5.8 |
| Tax effect | (2.4) | (3.7) | (4.6) | (1.6) | (11.3) | 33.2 | (6.6) | (1.0) | 2.2 | 27.7 | (4.5) | (2.0) |
| Other | - | - | - | - | - | 0.6 | - | (0.6) | - | | | |
| Adjusted Earnings (non-GAAP) (unaudited) | 7.5 | 15.1 | 15.7 | 16.2 | 59.1 | (5.1) | (6.8) | 2.3 | (13.5) | (23.3) | (3.4) | (10.2) |
| Adjusted Basic Earnings per share (in U.S. dollars) (*) (unaudited). | 0.10 | 0.20 | 0.25 | 0.22 | 0.80 | (0.07) | (0.09) | 0.03 | (0.19) | (0.32) | (0.05) | (0.14) |
| Adjusted Earnings attributable to Owners of the parent (non-GAAP) (unaudited) | 7.8 | 14.3 | 18.4 | 15.7 | 57.2 | (5.5) | (7.0) | 2.3 | (13.5) | (23.9) | (3.4) | (10.2) |
| Adjusted basic Earnings per share attributable to Owners of the parent (in U.S. dollars) (**) (unaudited) | 0.10 | 0.19 | 0.25 | 0.21 | 0.77 | (0.07) | (0.09) | 0.03 | (0.19) | (0.32) | (0.05) | (0.14) |
| Adjusted Earnings per share (in U.S. dollars) in the reverse split basis | 0.51 | 1.01 | 1.27 | 1.11 | 4.02 | (0.35) | (0.46) | 0.16 | (0.97) | (1.63) | (0.24) | (0.72) |
| Adjusted Earnings attributable to Owners of the parent (in U.S. dollars) in the reverse split basis | 0.53 | 0.96 | 1.25 | 1.06 | 3.87 | (0.37) | (0.47) | 0.16 | (0.97) | (1.66) | (0.24) | (0.72) |
| (*) | We define non-recurring items as items that are limited in number, clearly identifiable, unusual, are unlikely to be repeated in the near future in the ordinary course of business and that have a material impact on the consolidated results of operations. Non-recurring items can be summarized as demonstrated below: |
| 13 | |
| | |
| (a) | Amortization of acquisition related intangible assets represents the amortization expense of customer base, recorded as intangible assets. This customer base represents the fair value (within the business combination involving the acquisition of control of Atento Group) of the intangible assets arising from service agreements (tacit or explicitly formulated in contracts) with Telefónica Group and with other customers. |
| (b) | Since April 1, 2015, the Company designated the foreign currency risk on certain of its subsidiaries as net investment hedges using financial instruments as the hedging items. As a consequence, any gain or loss on the hedging instrument, related to the effective portion of the hedge is recognized in other comprehensive income (equity) as from that date. The gains or losses related to the ineffective portion are recognized in the statements of operations and for comparability, and those adjustments are added back to calculate Adjusted Earnings. |
| (c) | The tax effect represents the impact of the taxable adjustments based on tax nominal rate by country. For the three months ended March 31, 2019, in the context of a global Tax Audit of the periods 2013-2016, Atento Spain, as the representative company of the tax group comprised of the Spanish direct subsidiaries of Atento S.A., signed a tax agreement with the Spanish tax authorities. The criteria adopted by the Tax Administration was in connection with certain aspects, among others, of the deductibility of certain specific intercompany financing and operating expenses originated during the acquisition of Atento Spain, which was different from the tax treatment applied by the Company. As a result of this discrepancy, the amount of the tax credits of the Spanish tax group, together with the corresponding effects in subsequent tax periods, has being reduced in an amount of $33.5 million. |
| (**) | Adjusted Earnings per share is calculated based on weighted average number of ordinary shares outstanding of 74,157,789 and 71,020,356 for the three months ended June 30, 2019 and 2020, respectively. |
(***) Adjusted Earnings per share in the reverse split basis is calculated by applying the ratio of conversion of 5.027090466672970 used in the reverse split into the previous weighted average number of ordinary shares outstanding
Effective Tax Rate
| ($ in millions, except percentage changes) | Fiscal 2018 | Fiscal 2019 | YTD 2020 | Q1 2018 | Q2 2018 | Q3 2018 | Q4 2018 | Q1 2019 | Q2 2019 | Q3 2019 | Q4 2019 | Q1 2020 | Q2 2020 |
| Profit/(loss) before tax1 | 33.9 | (44.5) | (28.3) | 3.9 | 3.6 | 6.9 | 19.6 | (10.6) | (9.7) | 3.5 | (27.6) | (7.6) | (20.7) |
| (+) Total Add-backs to Net Income (excluding tax effect) | 50.0 | 29.7 | 18.6 | 11.5 | 15.3 | 20.3 | 2.8 | 7.3 | 6.5 | 2.0 | 13.9 | 8.5 | 10.1 |
| Amortization of Acquisition related Intangible assets | 21.2 | 20.6 | 9.3 | 5.7 | 5.3 | 5.1 | 5.1 | 5.1 | 5.0 | 4.9 | 5.5 | 5.0 | 4.3 |
| Net foreign exchange gain on financial instruments | 0.0 | - | - | 3.1 | (9.0) | 5.9 | - | - | - | - | - | - | - |
| Net foreign exchange impacts | 28.8 | 9.1 | 9.3 | 2.8 | 19.0 | 9.3 | (2.3) | 1.6 | 1.4 | (2.3) | 8.4 | 3.5 | 5.8 |
| Other | - | - | - | - | - | - | - | 0.6 | - | (0.6) | - | - | - |
| = Recurring Profit/(loss) before tax (non-GAAP) (unaudited) | 83.9 | (14.8) | (9.7) | 15.4 | 18.9 | 27.2 | 22.4 | (3.3) | (3.2) | 5.5 | (13.7) | 0.9 | (10.6) |
| (-) Recurring Tax | (24.7) | (8.5) | (3.7) | (7.9) | (3.2) | (8.4) | (6.2) | (1.8) | (3.5) | (3.3) | 0.1 | (4.3) | 0.4 |
| Income tax expense (reported) | (13.4) | (36.2) | 2.6 | (5.5) | 0.5 | (3.8) | (4.6) | (35.0) | 3.1 | (2.3) | (2.0) | 0.2 | 2.4 |
| Tax effect (non-recurring) | (11.3) | 27.7 | (6.3) | (2.4) | (3.7) | (4.6) | (1.6) | 33.2 | (6.6) | (1.0) | 2.2 | (4.5) | (2.0) |
| = Adjusted Earnings (non-GAAP) (unaudited) | 59.2 | (23.2) | (13.4) | 7.5 | 15.7 | 18.7 | 16.2 | (5.1) | (6.8) | 2.2 | (13.5) | (3.4) | (10.2) |
| | | | | | | | | | | | | | |
| Recurring ETR | 30.5% | 57.4% | 38.5% | 51.3% | 17.7% | 31.1% | 31.4% | 53.6% | 108.8% | 60.3% | 0.8% | 468.9% | 3.8% |
1 Profit/(loss) before income tax from continuing operations
Financing Arrangements
Net debt with third parties as of June 30, 2019 and 2020 is as follow:
| ($ in millions, except Net Debt/Adj. EBITDA LTM) | On June 30, 2019 | On June 30, 2020 |
| Cash and cash equivalents | 116.6 | 207.2 |
| Debt: | | |
| Senior Secured Notes | 499.9 | 503.8 |
| Super Senior Credit Facility | - | 50.7 |
| BNDES | 1.4 | 0.7 |
| Lease Liabilities (3) | 169.6 | 134.7 |
| Other Borrowings | 17.2 | 43.3 |
| Total Debt | 688.1 | 733.1 |
| Net Debt with third parties (1) (unaudited) | 571.5 | 525.9 |
| EBITDA LTM (2) (non-GAAP) (unaudited) | 173.4 | 131.8 |
| Net Debt/Adjusted EBITDA LTM (non-GAAP) (unaudited) | 3.3x | 4.0x |
| 14 | |
| | |
| (1) | In considering our financial condition, our management analyzes Net debt with third parties, which is defined as total debt less cash and cash equivalents. Net debt with third parties is not a measure defined by IFRS and it has limitations as an analytical tool. Net debt with third parties is neither a measure defined by or presented in accordance with IFRS nor a measure of financial performance and should not be considered in isolation or as an alternative financial measure determined in accordance with IFRS. Net debt is not necessarily comparable to similarly titled measures used by other companies. |
| (2) | EBITDA LTM (Last Twelve Months) |
| (3) | Consider the impact in June 30, 2020 of application of IFRS16 (former operating leases not related to short-term or low-value leases are now shown as debt) was $129.6 million and $5.1 million of other financial leases. |
Revenue Mix by Service Type
| | Fiscal 2018 | Fiscal 2019 | Fiscal 2020 |
| Q1 | Q2 | Q3 | Q4 | FY | Q1 | Q2 | Q3 | Q4 | FY | Q1 | Q2 |
| Customer Service | 51.1% | 51.8% | 50.6% | 50.3% | 50.7% | 51.7% | 52.0% | 53.0% | 54.6% | 52.8% | 56.4% | 60.9% |
| Sales | 18.1% | 18.0% | 18.3% | 18.5% | 17.7% | 17.0% | 16.9% | 16.9% | 15.6% | 16.6% | 13.3% | 9.8% |
| Collection | 7.3% | 7.5% | 8.2% | 8.8% | 8.2% | 7.9% | 7.8% | 7.4% | 7.1% | 7.5% | 7.1% | 7.0% |
| Back Office | 12.0% | 12.2% | 13.1% | 12.5% | 12.9% | 12.8% | 12.3% | 12.8% | 13.0% | 12.7% | 13.5% | 13.0% |
| Technical Support | 7.7% | 6.9% | 6.3% | 6.3% | 6.9% | 6.7% | 7.1% | 6.2% | 5.9% | 6.4% | 6.1% | 5.9% |
| Others | 3.8% | 3.7% | 3.5% | 3.6% | 3.6% | 3.9% | 3.9% | 3.7% | 3.8% | 4.0% | 3.6% | 3.3% |
| Total | 100.0% | 100.0% | 100.0% | 100.0% | 100.0% | 100.0% | 100.0% | 100.0% | 100.0% | 100.0% | 100.0% | 100.0% |
Number of Workstations and Delivery Centers
| | Number of Workstations | Number of Service
Delivery Centers (1) |
| | 2019 | 2020 | 2019 | 2020 |
| Brazil | 49,592 | 49,211 | 34 | 31 |
| Americas | 37,579 | 38,847 | 50 | 48 |
| Argentina (2) | 4,474 | 4,358 | 12 | 12 |
| Central America (3) | 2,510 | 2,845 | 4 | 3 |
| Chile | 2,829 | 2,484 | 4 | 4 |
| Colombia | 8,731 | 9,133 | 9 | 9 |
| Mexico | 9,319 | 9,881 | 15 | 14 |
| Peru | 8,513 | 8,847 | 3 | 3 |
| United States (4) | 1,203 | 1,299 | 3 | 3 |
| EMEA | 5,344 | 5,171 | 15 | 14 |
| Spain | 5,344 | 5,171 | 15 | 14 |
| Total | 92,515 | 93,229 | 99 | 93 |
FX Rates
| FX Assumptions (Average) | Q1 2018 | Q2 2018 | Q3 2018 | Q4 2018 | FY 2018 | Q1 2019 | Q2 2019 | Q3 2019 | Q4 2019 | FY 2019 | Q1 2020 | Q2 2020 |
| Euro (EUR) | 0.81 | 0.84 | 0.86 | 0.88 | 0.85 | 0.88 | 0.89 | 0.90 | 0.90 | 0.89 | 0.91 | 0.91 |
| Brazilian Real (BRL) | 3.25 | 3.60 | 3.96 | 3.81 | 3.65 | 3.77 | 3.92 | 3.97 | 4.12 | 3.94 | 4.46 | 5.38 |
| Mexican Peso (MXN) | 18.71 | 19.42 | 18.98 | 19.85 | 19.24 | 19.20 | 19.12 | 19.44 | 19.25 | 19.25 | 20.00 | 23.33 |
| Colombian Peso (COP) | 2,858.33 | 2,838.34 | 2,961.69 | 3,162.98 | 2,955.34 | 3,135.29 | 3,240.94 | 3,340.81 | 3,408.36 | 3,281.35 | 3,534.22 | 3,847.83 |
| Chilean Peso (CLP) | 601.97 | 620.73 | 663.19 | 679.62 | 641.38 | 667.01 | 683.69 | 705.50 | 754.86 | 702.77 | 802.78 | 823.43 |
| Peruvian Soles (PEN) | 3.24 | 3.26 | 3.29 | 3.36 | 3.29 | 3.32 | 3.32 | 3.34 | 3.36 | 3.34 | 3.40 | 3.43 |
| Argentinean Peso (ARS) | 19.71 | 23.55 | 32.09 | 37.12 | 28.12 | 39.05 | 43.91 | 50.56 | 59.38 | 48.22 | 61.55 | 67.64 |