
Atento Reports Fiscal 2020 Third Quarter Results
Revenue growth accelerates 10.5% sequentially and rises 2.2% YoY on consistent Multisector growth
across regions, driven by next-generation services, Brazil and US+Nearshore
EBITDA up 102% sequentially and 13.9% YoY on 10.8% rise in Multisector sales,
more profitable programs and higher operating efficiencies
YTD free cash flow of $9 million, up approximately $100 million YoY
NEW YORK, November 11, 2020 -- Atento S.A. (NYSE: ATTO) (“Atento” or the “Company”), the largest provider of customer-relationship management and business-process outsourcing services in Latin America, and among the top five providers globally, today announced its third quarter operating and financial results for the period ending September 30, 2020. All comparisons in this announcement are year-over-year (YoY) and in constant-currency (CCY), unless noted otherwise, and may differ from the corresponding 6-K filing due to certain intra-group eliminations.
Three Horizon Plan continues driving profitable growth on higher mix of Multisector sales and Next Generation Services · Consistent Multisector growth (+10.8% YoY) across all regions, driven by Next Generation Services, Brazil and US clients · Multisector now represents 68% of consolidated revenues, with Born-digital comprising 6% of revenue mix · TEF revenues increase 16.8% sequentially; reshaping the relationship, moving into NextGen services and remaining the leader in CX share of client’s wallet;. · EBITDA increases in all regions, with total EBITDA rising 13.9% on continued improvements in client and services mix as well as higher efficiency levels · EBITDA margin expands 560 bps sequentially and 100 bps YoY to 12.7%, with Brazil margin increasing 260 bps to 16.2% Operational improvements continue raising efficiency levels · Approxmatelly $65 million of $80 million in target annualized cost savings implemented YTD through operations rightsizing, shared services, strict cost controls, Atento@Home operating model and ZBB FCF generation reduces net debt for third consecutive quarter, while cash position remains healthy · 9M FCF of $9 million versus negative $88 million in 9M19 · Net debt falls 9.0% YoY to $514.2 million; Leverage remains under control at 3.2x when excluding Argentina impairment in Q4 2019 · Solid cash position of $196.6 million Atento maintains undisputed leadership in Latin America* · Market share nearly three times greater than next-largest competitor in domestic CRM/BPO segment · 27.9% of market share in Brazil, with 19.4 p.p. lead to country´s number two |
* Frost & Sullivan: “Growth Opportunities in the Customer Experience Outsourcing Services Market in Latin America and the Caribbean” (2019)
Summarized Consolidated Financials
| ($ in millions except EPS) | Q3 2020 | Q3 2019 | CCY
Growth (1) | YTD 2020 | YTD 2019 | CCY
Growth (1) |
| Income Statement | | | | | | |
| Revenue | 352.7 | 412.3 | 2.2% | 1,042.7 | 1,290.1 | -4.3% | |
| EBITDA (2) | 44.8 | 48.1 | 13.9% | 107.8 | 132.7 | -1.5% | |
| EBITDA Margin | 12.7% | 11.7% | 1.0 p.p. | 10.3% | 10.3% | 0.1 p.p. | |
| Net Income (3) | (13.1) | 1.3 | N.M | (38.9) | (51.1) | -18.0% | |
| Recurring Net Income (2) | (1.2) | 1.6 | -45.3% | (14.6) | (9.1) | -37.2% | |
| Earnings Per Share in the reverse split basis (2) (3) (5) | ($0.93) | $0.09 | N.M. | ($2.75) | ($3.53) | -15.8% | |
| Recurring EPS in the reverse split basis (2) (5) | ($0.09) | $0.11 | N.M. | ($1.04) | ($0.62) | -42.3% | |
| Cash Flow, Debt and Leverage | | | | | | | |
| Net Cash Used In Operating Activities | 10.7 | 12.1 | | 68.2 | (1.6) | | |
| Cash and Cash Equivalents | 196.6 | 105.5 | | | | | |
| Net Debt (4) | 514.2 | 564.9 | | | | | |
| Net Leverage (4) | 4.0 | 3.3 | | | | | |
| | | | | | | | | | | | | | |
| (1) | Unless otherwise noted, all results are for Q3 2020; all revenue growth rates are on a constant currency basis, year-over-year. |
| (2) | EBITDA, Recurring Net Income/Recurring Earnings per Share (EPS) are Non-GAAP measures. |
| (3) | Reported Net Income and Earnings per Share (EPS) include the impact of non-cash foreign exchange gains/losses on intercompany balances. |
| (4) | Includes IFRS 16 impact in Net Debt and Leverage |
| (5) | Earnings per share and Recurring Earnings per share in the reverse split basis is calculated by applying the ratio of conversion of 5.027090466672970 used in the reverse split into the previous weighted average number of ordinary shares outstanding |
| 1 |  |
Message from the CEO and CFO
Carlos López-Abadía, Atento’s Chief Executive Officer, commented, “As we promised in our Q2 earnings call, our business continued to recover significantly on still improving market conditions, with revenue growing over 10% sequentially, EBITDA doubling and our margin expanding almost 600 basis points, all three of which are above pre-crisis levels. The strong and broad-based recovery in our performance, which continues today, reflects consistent and disciplined execution of our Three Horizon Plan, which drove Multisector sales higher across all three of Atento’s geographic markets during the quarter. Our multisector clients now represent almost 70% of revenues, up from 60% when we started to implement the strategic plan. Moreover, we have been expanding into fast-growing verticals, such as born digital, tech, e-commerce and media, which are businesses that demand more digital and tech enabled solutions and therefore carry higher margins. We are also reshaping the relationship with Telefónica by selling more of these higher margin services to them, helping solidify Atento’s position as the company’s Partner of Choice and driving revenues 17% sequentially higher with this client.
With the recent inauguration of innovation centers in Brazil and Spain, we intend to strengthen our culture of innovation as well as Atento’s leadership in fundamentally transforming and substantially improving the Customer Experience delivered by our industry. This year alone, 10% of Atento’s new sales were for next generation services developed within the last 12 months. Atento’s governance has also been strengthening, with the appointment of two additional independent directors in the last six months, one of whom brings substantial experience managing and governing technology companies.
As we approach the end of the year, we are operating at significantly higher performance levels and from a position of relative strength, one that enables us to continue effectively addressing the many challenges of today’s still complex and highly dynamic operating environment, while seizing more of the opportunities emerging among high-growth verticals in Brazil and the Americas and from ever-growing demand for innovative next-generation CX and BPO services. We remain confident in our ability to successfully execute in both regards, given the proven effectiveness of our Three Horizon Plan, Atento’s growing technology progress, and our commanding market position in Latin America. We therefore expect to end 2020 with EBITDA levels similar to last year’s in current currency, which is a remarkable result considering the significant crisis and an adverse BRL devaluation of 35%. This means a 200 basis points margin expansion versus 2019 and the implied exit rate we forecast to Q4 gives us confidence to continue delivering improved results in 2021 and puts us on track to deliver the 2022 targets that we communicated last November in our Investor Day. We expect the market to recognize the track record we have created in the last couple of quarters and, as we continue to deliver better results, our share price will reflect the solid fundamentals of our business.”
José Azevedo, Atento’s Chief Financial Officer, said, “Our third quarter financial and operating results make clear that we continue to improve operationally. The fundamental changes we have been making within our business, in terms of sustainable top line growth, a more diversified and profitable revenue stream, and more efficient delivery, are now driving operating and free cash flow higher. We generated $9 million free cashflow in the first nine months of the year, an increase of almost $100 million when compared to the same period of 2019, and we accomplished this despite the impact of COVID-19 across our markets. This allowed for a decrease in our net debt for the third consecutive quarter, which combined with increasing EBITDA,makes us confident towards our target of 2.0 to 2.5 times net debt-to-EBITDA. In the meantime, we are comfortable with our current level of leverage and remain committed to refinancing Atento’s 2022 bond, with the aim of improving our debt profile and capital structure as another means to unlock shareholder value.”
Third Quarter and Nine Months 2020 Consolidated Financial Results
Atento’s revenue grew 10.5% sequentially and 2.2% YoY to $352.7 million, based on strong Multisector sales, which increased 7.8% and 10.8%, respectively, to $238.0 million. While the pandemic demanded a flexible business model and fast decisions, such as a rapid transition to a work at home model, the dynamics of the crisis has accelerated positive demand, mainly in the digital space, as consumers shift more of their purchases online. Capitalizing on these trends, Atento increased Multisector revenue during the third quarter, mainly driven by the Americas, which increased sales in this category 13.1% YoY, and by Brazil, where these sales grew 5.3% during this period. US and Nearshore sales continued contributing to Multisector growth, rising 20% YoY. Atento’s base of Born-Digital, Tech and Media & Entertainment clients continued expanding during the quarter, with 20 new clients and new next gen sales increasing 23% YoY. Within the Company’s 9M revenue mix, sales to Born-digital Companies expanded from 2.7% to 6.0%.
Growth in total revenue was partially offset by an 11.9% decrease in Telefónica’s, although a greater proportion of TEF sales during the third quarter already comprised next-generation services and Atento increased share of wallet with this client. More importantly, TEF revenue increased 16.8% sequentially.
Consolidated EBITDA increased 13.9% to $44.8 million, based on higher sales, continued improvements in the client and services mix, as well as higher efficiency levels. The corresponding margins expanded 560 basis points sequentially and 100 basis points YoY, with Brazil’s margin expanding 260 basis points YoY to 16.2%.
| 2 | |
During the quarter, the Company continued making operational improvements under the Three Horizon Plan, with approximately $65 million of annualized cost savings implemented YTD of the $80 million targeted. Ongoing efficiency initiatives include the rightsizing of Atento’s operations, maintaining strict cost controls, increasing use of the Atento@home operating model, implementating Zero-Based Budgeting, as well as expanding the use of shared services, among other initiatives to reduce SG&A expenses.
Recurring net income improved sequentially to a loss of $1.2 million from a loss of $10.2 million in 2Q 2020, or a YoY decrease of $3.2 million compared to 3Q 2019. Recurring EPS was a negative $0.09 in 3Q 2020 versus positive $0.11 in last year’s quarter and negative $0.72 in 2Q 2020.
Atento maintained a comfortable level of financial liquidity at the end of the quarter, with net debt decreasing for the third consecutive quarter to $514.2 million, representing a YoY decrease of 9%, and a cash position of $196.6 million, including revolvers. During 9M 2020, the Company generated $9.3 million in FCF, a $97.4 million increase compared to negative $88 million in YTD 2019, on client contracts that generate higher levels of profitability and on further improvements in working capital that stem from rigorous financial controls that have been implemented.
Segment Reporting
Brazil
| ($ in millions) | Q3 2020 | Q3 2019 | CCY growth | YTD 2020 | YTD 2019 | CCY growth |
| Brazil Region | | | | | | |
| Revenue | 145.2 | 203.8 | -3.4% | 452.5 | 632.5 | -7.5% |
| Adjusted EBITDA | 23.5 | 27.7 | 15.4% | 58.5 | 82.0 | -7.2% |
| Adjusted EBITDA Margin | 16.2% | 13.6% | 2.6 p.p. | 12.9% | 13.0% | 0.0 p.p. |
| Operating Income/(loss) | (5.2) | (4.4) | 53.6% | (21.4) | (13.3) | 105.2% |
| Brazil Revenue Mix | 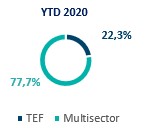 | 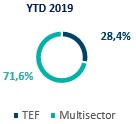 |
In Brazil, Atento’s flagship business, Multisector sales grew 4.5% sequentially and 5.3% YoY to $112.4 million. The growth was due to an increase in sales to Born-digital companies, which have been purchasing more-next generation services, including high value voice, integrated multichannel and automated back office services. Multisector sales accounted for 77.7% of total revenue in this market, 610 basis points higher than year-end 2019.
TEF revenues, in turn, decreased 24.8%, which resulted in a 3.4% YoY decline in total Brazil revenue to $145.2 million. The decrease was mainly related to the unprofitable client programs that had been returned in Q4 2019. On a sequential basis, TEF revenue increased 20.8% in Brazil.
Brazil’s profitability improved significantly during the quarter. Adjusted EBITDA increased 15.4% to $23.5 million, with the corresponding margin expanding 260 basis points YoY to 16.2% on a greater proportion of new next-generation services with margins above 20%. Adjusted EBITDA also benefited from the discontinuation of unprofitable programs in Q4 2019, which has had an estimated recurring positive impact of 100bps since Q1 2020.
Americas Region
| ($ in millions) | Q3 2020 | Q3 2019 | CCY growth | YTD 2020 | YTD 2019 | CCY growth |
| Americas Region | | | | | | |
| Revenue | 148.8 | 159.6 | 4.0% | 426.1 | 493.1 | -2.1% |
| Adjusted EBITDA | 17.1 | 17.5 | 9.1% | 45.3 | 50.2 | -0.2% |
| Adjusted EBITDA Margin | 11.5% | 11.0% | 0.5 p.p. | 10.6% | 10.2% | 0.5 p.p. |
| 3 | |
| Operating Income/(loss) | (0.8) | (1.8) | 44.5% | (8.0) | (9.2) | 24.7% |
| Americas Revenue Mix | YTD 2020 
| YTD 2019 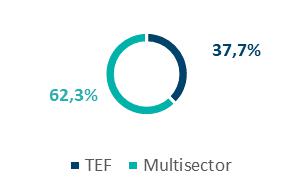
|
Americas revenue increased 4.0% to $148.8 million on a 17.5% increase in Multisector revenues. S and Nearshore revenues increased 20%. In South America, Multsector sales were strong in Colombia, a country that is expect to continue delivering growth, as it is a hub for Atento’s EMEA and US nearshore businesses. We continue to expand our business in the hard currency, with Multisector revenues growing 20% in the US & Nearshore region. As a percentage of total revenue in the Americas, Multisector sales expanded 370 basis points to 65.9% versus year-end 2019.
Growth generated from Multisector clients was partially offset by a 14.9% decrease in TEF sales in the Americas, primarily due to persistent volume declines in Peru, where the pandemic continued to have a severe economic impact. Sequentially, TEF revenue increased 15.5% in the region.
Such performance, coupled with increased operating efficiency contributed to margin improvement. The region’s Adjusted EBITDA increased 9.1% to $17.1 million, while the corresponding margin expanded 50 basis points to 11.5%.
EMEA Region
| ($ in millions) | Q3 2020 | Q3 2019 | CCY growth | YTD 2020 | YTD 2019 | CCY growth |
| EMEA Region | | | | | | |
| Revenue | 60.5 | 52.1 | 10.7% | 168.5 | 175.4 | -3.7% |
| Adjusted EBITDA | 7.3 | 5.9 | 18.7% | 10.8 | 17.8 | -38.9% |
| Adjusted EBITDA Margin | 12.1% | 11.4% | 0.7 p.p. | 6.4% | 10.1% | -3.7 p.p. |
| Operating Income/(loss) | 2.6 | (0.1) | N.M | (1.3) | 0.1 | N.M |
| EMEA Revenue Mix | YTD 2020 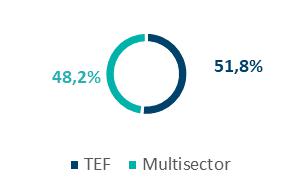
|  |
In EMEA, Atento continued to diversify its revenue base through expanded Multisector sales, which grew 6.1% to 48.2% of total revenue, up 600 basis from the same period in 2019. Driving growth in this category were higher volumes and new business at current customers, in addition to new clients.
A 15.4% increase in TEF revenue also contributed to the 10.7% increase in total revenue of $60.5 million, due to higher volumes, although this compares with an unusually low volume base in the prior year’s quarter. On a sequential basis, TEF revenues increased 14.0% in the region.
EMEA’s Adjusted EBITDA increased 18.7% to $7.3 million on sales growth, a greater proportion of Multisector sales and next-generation services in the revenue mix, as well as improved efficiency levels under the Company’s transformation plan, with the corresponding margin increasing 70 basis points to 12.1%.
| 4 | |
Cash Flow and Capital Structure
| ($ in millions) | Q3 2020 | Q3 2019 | YTD 2020 | YTD 2019 |
| Cash and cash equivalents at beginning of period | 207.2 | 116.6 | 124.7 | 133.5 |
| Net Cash (used in) from Operating activities | 10.7 | 12.1 | 68.2 | -1.6 |
| Net Cash used in Investing activities | -8.7 | -10.6 | -27.4 | -48.7 |
| Net Cash provided by Financing activities | -21.1 | -4.7 | 36.2 | 29.6 |
| Net (increase/decrease) in cash and cash equivalents | -19.1 | -3.2 | 77.0 | -20.7 |
| Effect of changes in exchanges rates | 8.5 | -7.9 | -5.1 | -7.3 |
| Cash and cash equivalents at end of period | 196.6 | 105.5 | 196.6 | 105.5 |
At the end of Q3 2020, Atento’s cash and cash equivalents totaled $196.6 million, down $10.6 million sequentially due to payments of interest on the 2022 bond, partial pre-payment of higher cost revolvers and payments of certain taxes deferred in Q2 due to the pandemic. This amount includes approximately $80 million of existing revolvers.
Cash capex was 2.6% in YTD 2020, flat compared to YTD 2019, as the Company emphasized cash preservation and limited investments to essential capex during the second quarter, due to the pandemic. For the year, the company expects cash capex to be approximately 3% of revenues.
Total debt was $710.8 million, including $123.3 million related to IFRS16, with an average maturity of 1.7 years and an average LTM cost of 6.3%.
Net debt decreased 9.0% YoY to $514.2 million at the end of the quarter, the third consecutive quarterly decrease.
LTM net-debt-to-EBITDA was 4.0 times, mainly due to COVID-19’s impact on EBITDA in Q2 2020, the $30.9 million impairment charge in Argentina in Q4 2010 and 16% FX impact on LTM EBITDA. Leverage remains under control due to the Company’s current debt maturity profile and EBITDA generation during the third quarter. Excluding the aforementioned impairment charge, the leverage ratio was 3.2 times, down from 3.3 times at the end of September 2019, an improvement that was achieved during a period when the value of the Brazilian real declined 35%. The Company continues to focus on refinancing the $500 million 2022 notes, in order to extend the maturity of this debt and to improve Atento’s capital structure, as another means to unlock shareholder values.
| ($ in millions) as of June 30, 2020 | Maturity | Interest Rate | Outstanding Balance 3Q20 |
| Indebtness | | | |
| Senior Secured Notes | 2022 | 6.125% | 497.0 |
| Super Senior Credit Facility | 2020 | 5.223% | 50.1 |
| Other Credit Facilities | 2020 | CDI + 2.40 | 25.0 |
| Other borrowings and leases | 2023 | Variable | 14.9 |
| BNDES (BRL) | 2022 | TJLP + 2.0% | 0.6 |
| Debt with third parties | 587.6 |
| Leasing (IFRS16) | 123.3 |
| Gross Debt (third parties + IFRS16) | 710.8 |
| Cash and Cash Equivalents | 196.6 |
| Net Debt | 514.2 |
| 5 | |

Resuming 2020 Guidance
| | FY 2020 |
| Revenue growth (in constant currency) | ~ -5% |
| EBITDA margin | ~ 11% |
| Cash Capex (as % of revenues) | ~ 3% |
| Leverage (x) | ~ 4x |
Share Repurchase Program
In the quarter, the Company repurchased 42,237 shares under its Share Repruchase Program, at a cost of $0.4 million, an average price of $8.75. At the end of September 2020, Atento held 973,138 shares in treasury.
Reverse Share Split
As of July 28, Atento SA announced a reverse share split that converted the Company’s entire share capital of 75,406,357 into 15,000,000 shares.
Conference Call
The Company will host a conference call and webcast on Thursday, November 12, 2020 at 10:00 am ET to discuss its financial results. The conference call can be accessed by dialing: USA: +1 (412) 717-9627; UK: (+44) 20 3795 9972; Brazil: (+55) 11 3181-8565; or Spain: (+34) 91 038 9593. It can also be accessed by web phone (Click here). No passcode is required. Individuals who dial in will be asked to identify themselves and their affiliations. The live webcast of the conference call will be available on Atento's Investor Relations website at investors.atento.com (Click here). A web-based archive of the conference call will also be available at the above website.
About Atento
Atento is the largest provider of customer relationship management and business process outsourcing (CRM BPO) services in Latin America, and among the top five providers globally, based on revenues. Atento is also a leading provider of nearshoring CRM/BPO services to companies that carry out their activities in the United States. Since 1999, the company has developed its business model in 13 countries where it employs 150,000 people. Atento has over 400 clients to whom it offers a wide range of CRM/BPO services through multiple channels. Atento’s clients are mostly leading multinational corporations in sectors such as telecommunications, banking and financial services, health, retail and public administrations, among others. In 2019, Atento was named one of the World’s 25 Best Multinational Workplaces and one of the Best Multinationals to Work for in Latin America by Great Place to Work®. Atento is also the world’s first CRM company to be ISO 56002 certified in Innovation Management. Atento’s shares trade under the symbol ATTO on the New York Stock Exchange (NYSE). For more information visit www.atento.com.
Investor Relations
Shay Chor
+ 55 11 3293-5926
shay.chor@atento.com | Investor Relations Fernando Schneider + 55 11 3779-8119 fernando.schneider@atento.com | Media Relations
Pablo Sánchez Pérez +34 670031347
pablo.sanchez@atento.com |
| 6 | |
Forward-Looking Statements
This press release contains forward-looking statements. Forward-looking statements can be identified by the use of words such as "may," "should," "expects," "plans," "anticipates," "believes," "estimates," "predicts," "intends," "continue" or similar terminology. These statements reflect only Atento's current expectations and are not guarantees of future performance or results. Forward-looking statements by their nature address matters that are, to different degrees, uncertain, such as statements about the potential impacts of the Covid-19 pandemic on our business operations, financial results and financial position and on the world economy. These statements are subject to risks and uncertainties that could cause actual results to differ materially from those contained in the forward-looking statements. These risks and uncertainties include, but are not limited to, competition in Atento's highly competitive industries; increases in the cost of voice and data services or significant interruptions in these services; Atento's ability to keep pace with its clients' needs for rapid technological change and systems availability; the continued deployment and adoption of emerging technologies; the loss, financial difficulties or bankruptcy of any key clients; the effects of global economic trends on the businesses of Atento's clients; the non-exclusive nature of Atento's client contracts and the absence of revenue commitments; security and privacy breaches of the systems Atento uses to protect personal data; the cost of pending and future litigation; the cost of defending Atento against intellectual property infringement claims; extensive regulation affecting many of Atento's businesses; Atento's ability to protect its proprietary information or technology; service interruptions to Atento's data and operation centers; Atento's ability to retain key personnel and attract a sufficient number of qualified employees; increases in labor costs and turnover rates; the political, economic and other conditions in the countries where Atento operates; changes in foreign exchange rates; Atento's ability to complete future acquisitions and integrate or achieve the objectives of its recent and future acquisitions; future impairments of our substantial goodwill, intangible assets, or other long-lived assets; and Atento's ability to recover consumer receivables on behalf of its clients. In addition, Atento is subject to risks related to its level of indebtedness. Such risks include Atento's ability to generate sufficient cash to service its indebtedness and fund its other liquidity needs; Atento's ability to comply with covenants contained in its debt instruments; the ability to obtain additional financing; the incurrence of significant additional indebtedness by Atento and its subsidiaries; and the ability of Atento's lenders to fulfill their lending commitments. Atento is also subject to other risk factors described in documents filed by the company with the United States Securities and Exchange Commission.
These forward-looking statements speak only as of the date on which the statements were made. Atento undertakes no obligation to update or revise publicly any forward-looking statements, whether as a result of new information, future events or otherwise.
| 7 | |
SELECTED FINANCIAL DATA:
The following selected financial information should be read in conjunction with the interim consolidated financial statements presented elsewhere in the Form 6-K.
Consolidated Statements of Operations for the Three and Nine Months Ended September 30, 2019 and 2020
| ($ in millions, except percentage changes) | For the three months ended September 30, | Change (%) | Change excluding FX (%) | For the nine months ended September 30, | Change (%) | Change excluding FX (%) |
| 2019 | 2020 | 2019 | 2020 |
| | (unaudited) | | | (unaudited) | | |
| Revenue | 412.3 | 352.7 | (14.4) | 2.2 | 1,290.1 | 1,042.7 | (19.2) | (4.3) |
| Other operating income | 1.3 | 1.1 | (15.6) | (11.5) | 2.7 | 3.1 | 14.8 | 22.0 |
| Other gains and own work capitalized | 6.9 | - | (99.5) | (99.5) | 7.0 | - | (99.4) | (99.4) |
| Operating expenses: | | | | | | | | |
| Supplies | (17.4) | (18.5) | 6.1 | 26.1 | (49.3) | (51.2) | 3.8 | 22.2 |
| Employee benefit expenses | (312.7) | (259.9) | (16.9) | (1.4) | (986.7) | (793.9) | (19.5) | (5.0) |
| Depreciation | (17.8) | (18.4) | 3.7 | 25.3 | (59.4) | (56.0) | (5.8) | 11.9 |
| Amortization | (13.1) | (11.6) | (11.3) | 6.6 | (39.9) | (34.2) | (14.4) | 1.5 |
| Changes in trade provisions | (1.9) | (1.6) | (18.9) | (11.3) | (3.4) | (3.5) | 3.0 | 21.2 |
| Other operating expenses | (40.3) | (29.1) | (27.7) | (15.0) | (127.6) | (89.4) | (29.9) | (18.0) |
| Total operating expenses | (403.1) | (339.1) | (15.9) | (0.2) | (1,266.4) | (1,028.2) | (18.8) | (4.2) |
| Operating profit | 17.3 | 14.8 | (14.6) | 7.4 | 33.3 | 17.6 | (47.2) | (31.7) |
| Finance income | 0.2 | 2.0 | N.M. | N.M. | 4.6 | 13.0 | N.M. | N.M. |
| Finance costs | (16.3) | (18.8) | 15.4 | 28.9 | (54.1) | (51.6) | (4.7) | 6.8 |
| Net foreign exchange gain/(loss) | 2.3 | (8.8) | N.M. | N.M. | (0.7) | (18.1) | N.M. | N.M. |
| Net finance expense | (13.8) | (25.6) | 85.8 | N.M. | (50.2) | (56.7) | 12.9 | 50.0 |
| Profit/(loss) before income tax | 3.5 | (10.8) | N.M. | N.M. | (16.9) | (39.1) | 131.5 | N.M. |
| Income tax (expense)/ benefit | (2.3) | (2.3) | 0.9 | (29.6) | (34.2) | 0.2 | (100.7) | (100.6) |
| Profit/(loss) for the period | 1.3 | (13.1) | N.M. | N.M. | (51.1) | (38.9) | (23.9) | (18.0) |
| Profit/(loss) attributable to: | | | | | | | | |
| Owners of the parent | 1.3 | (13.1) | N.M. | N.M. | (51.7) | (38.9) | (24.8) | (18.8) |
| Non-controlling interest | - | - | N.M. | N.M. | 0.6 | - | (100.0) | (100.0) |
| Profit/(loss) for the period | 1.3 | (13.1) | N.M. | N.M. | (51.1) | (38.9) | (23.9) | (18.0) |
| Other financial data: | | | | | | | | |
| EBITDA (1) (unaudited) | 48.1 | 44.8 | (6.9) | 13.9 | 132.7 | 107.8 | (18.8) | (1.5) |
| Adjusted EBITDA (1) (unaudited) | 48.1 | 44.8 | (6.9) | 13.9 | 132.7 | 107.8 | (18.8) | (1.5) |
(1) For the reconciliation of these non-GAAP measures to the closest comparable IFRS measure, see section "Summary Consolidated Historical Financial Information - Reconciliation of EBITDA and Adjusted EBITDA to profit/(loss)".
N.M. means not meaningful
| 8 | |
Consolidated Statements of Operations by Segment for the Three and Nine Months Ended September 30, 2019 and 2020
| ($ in millions, except percentage changes) | For the three months ended September 30, | Change (%) | Change Excluding FX (%) | For the nine months ended September 30, | Change (%) | Change Excluding FX (%) |
| 2019 | 2020 | 2019 | 2020 |
| | (unaudited) |
| Revenue: | | | | | | | | |
| Brazil | 203.8 | 145.2 | (28.8) | (3.4) | 632.5 | 452.5 | (28.5) | (7.5) |
| Americas | 159.6 | 148.8 | (6.7) | 4.0 | 493.1 | 426.1 | (13.6) | (2.1) |
| EMEA | 52.1 | 60.5 | 16.1 | 10.7 | 175.4 | 168.5 | (4.0) | (3.7) |
| Other and eliminations (1) | (3.2) | (1.8) | (45.0) | (41.4) | (10.9) | (4.4) | (59.9) | (57.0) |
| Total revenue | 412.3 | 352.7 | (14.4) | 2.2 | 1,290.1 | 1,042.7 | (19.2) | (4.3) |
| Operating expenses: | | | | | | | | |
| Brazil | (196.5) | (140.3) | (28.6) | (3.3) | (616.3) | (449.7) | (27.0) | (5.7) |
| Americas | (155.8) | (145.9) | (6.3) | 4.4 | (485.7) | (424.0) | (12.7) | (1.1) |
| EMEA | (58.2) | (58.6) | 0.7 | (4.4) | (179.6) | (171.3) | (4.7) | (4.7) |
| Other and eliminations (1) | 7.3 | 5.7 | (21.9) | (8.1) | 15.3 | 16.9 | 10.1 | 43.1 |
| Total operating expenses | (403.1) | (339.1) | (15.9) | (0.2) | (1,266.4) | (1,028.2) | (18.8) | (4.2) |
| Operating profit/(loss): | | | | | | | | |
| Brazil | 7.6 | 4.9 | (35.5) | (11.2) | 16.6 | 2.8 | (83.0) | (77.3) |
| Americas | 4.1 | 3.2 | (22.9) | (11.4) | 8.1 | 3.7 | (55.0) | (51.8) |
| EMEA | 1.4 | 2.9 | 104.3 | 109.8 | 4.0 | (1.3) | (132.2) | (133.2) |
| Other and eliminations (1) | 4.2 | 3.8 | (8.0) | 16.8 | 4.6 | 12.4 | N.M. | N.M. |
| Total operating profit | 17.3 | 14.8 | (14.6) | 7.4 | 33.3 | 17.6 | (47.2) | (31.7) |
| Net finance expense: | | | | | | | | |
| Brazil | (15.1) | (12.3) | (18.8) | 10.0 | (36.0) | (33.9) | (5.8) | 22.6 |
| Americas | (4.9) | (1.6) | (68.5) | (51.5) | (14.5) | (6.4) | (56.0) | (40.7) |
| EMEA | - | 1.0 | N.M. | N.M. | (0.8) | 0.5 | N.M. | N.M. |
| Other and eliminations (1) | 6.3 | (12.8) | N.M. | N.M. | 1.1 | (16.9) | N.M. | N.M. |
| Total net finance expense | (13.8) | (25.6) | 85.8 | N.M. | (50.2) | (56.7) | 12.9 | 50.0 |
| Income tax benefit/(expense): | | | | | | | | |
| Brazil | 3.1 | 2.2 | (28.0) | (2.9) | 6.1 | 9.7 | 59.2 | 103.9 |
| Americas | (1.0) | (2.4) | 140.1 | N.M. | (2.8) | (5.2) | 88.5 | 63.7 |
| EMEA | (1.5) | (1.3) | (15.2) | (18.2) | (3.1) | (0.6) | (81.3) | (81.1) |
| Other and eliminations (1) | (2.8) | (0.8) | (72.0) | (73.9) | (34.3) | (3.6) | (89.4) | (89.2) |
| Total income tax (expense)/benefit | (2.3) | (2.3) | 0.9 | (29.6) | (34.2) | 0.2 | (100.7) | (100.6) |
| Profit/(loss) for the period: | | | | | | | | |
| Brazil | (4.4) | (5.2) | 16.3 | 53.6 | (13.3) | (21.4) | 60.8 | 105.2 |
| Americas | (1.8) | (0.8) | (55.7) | 44.5 | (9.2) | (8.0) | (13.1) | 24.7 |
| EMEA | (0.1) | 2.6 | N.M. | N.M. | 0.1 | (1.3) | N.M. | N.M. |
| Other and eliminations (1) | 7.7 | (9.7) | N.M. | N.M. | (28.7) | (8.2) | (71.5) | (73.3) |
| Profit/(loss) for the period | 1.3 | (13.1) | N.M. | N.M. | (51.1) | (38.9) | (23.9) | (18.0) |
| Profit/(loss) attributable to: | | | | | | | | |
| Owners of the parent | 1.3 | (13.1) | N.M. | N.M. | (51.7) | (38.9) | (24.8) | (18.8) |
| Non-controlling interest | - | - | N.M. | N.M. | 0.6 | - | (100.0) | (100.0) |
| Other financial data: | | | | | | | | |
| EBITDA (2): | | | | | | | | |
| Brazil | 23.9 | 20.6 | (13.8) | 17.6 | 70.2 | 50.4 | (28.2) | (6.6) |
| Americas | 15.3 | 14.1 | (7.6) | 3.8 | 43.9 | 36.9 | (15.8) | (7.1) |
| EMEA | 4.7 | 6.1 | 30.2 | 26.5 | 13.9 | 7.8 | (43.5) | (43.1) |
| Other and eliminations (1) | 4.3 | 3.9 | (7.3) | 17.1 | 4.8 | 12.6 | N.M. | N.M. |
| Total EBITDA (unaudited) | 48.1 | 44.8 | (6.9) | 13.9 | 132.7 | 107.8 | (18.8) | (1.5) |
| Adjusted EBITDA (2): | | | | | | | | |
| Brazil | 27.7 | 23.5 | (15.0) | 15.4 | 82.0 | 58.5 | (28.6) | (7.2) |
| Americas | 17.5 | 17.1 | (2.4) | 9.1 | 50.2 | 45.3 | (9.7) | (0.2) |
| EMEA | 5.9 | 7.3 | 23.2 | 18.7 | 17.8 | 10.8 | (39.2) | (38.9) |
| Other and eliminations (1) | (3.0) | (3.1) | 5.5 | 8.7 | (17.2) | (6.8) | (60.4) | (59.1) |
| Total Adjusted EBITDA (unaudited) | 48.1 | 44.8 | (6.9) | 13.9 | 132.7 | 107.8 | (18.8) | (1.5) |
(1) Included revenue and expenses at the holding-company level (such as corporate expenses and acquisition related expenses), as applicable, as well as consolidation adjustments.
(2) For the reconciliation of these non-GAAP measures to the closest comparable IFRS measure, see section "Summary Consolidated Historical Financial Information - Reconciliation of EBITDA and Adjusted EBITDA to profit/(loss)".
| 9 | |
Balance Sheet ($ Thousands)
| ASSETS | | |
| December 31, | September 30, |
| 2019 | 2020 |
| | (audited) | (unaudited) |
| NON-CURRENT ASSETS | 765,839 | 586,823 |
| | | |
| Intangible assets | 160,041 | 104,749 |
| Goodwill | 119,902 | 96,875 |
| Right-of-use assets | 181,564 | 123,104 |
| Property, plant and equipment | 116,893 | 84,103 |
| Non-current financial assets | 82,158 | 69,362 |
| Trade and other receivables | 22,124 | 16,826 |
| Other non-current financial assets | 54,652 | 39,061 |
| Derivative financial instruments | 5,382 | 13,475 |
| Other taxes receivable | 5,650 | 4,492 |
| Deferred tax assets | 99,631 | 104,138 |
| | | |
| CURRENT ASSETS | 538,772 | 554,995 |
| | | |
| Trade and other receivables | 388,308 | 322,011 |
| Trade and other receivables | 359,599 | 297,337 |
| Current income tax receivable | 28,709 | 24,674 |
| Other taxes receivable | 24,664 | 35,132 |
| Other current financial assets | 1,094 | 1,247 |
| Cash and cash equivalents | 124,706 | 196,605 |
| | | |
| TOTAL ASSETS | 1,304,611 | 1,141,818 |
| 10 | |
| | | |
| EQUITY AND LIABILITIES | December 31, | September 30, |
| 2019 | 2020 |
| | (audited) | (unaudited) |
| | | |
| TOTAL EQUITY | 207,020 | 85,987 |
| EQUITY ATTRIBUTABLE TO: | | |
| OWNERS OF THE PARENT COMPANY | 207,020 | 85,987 |
| | | |
| Share capital | 49 | 49 |
| Share premium | 619,461 | 613,680 |
| Treasury shares | (19,319) | (11,963) |
| Retained losses | (127,070) | (169,344) |
| Translation differences | (271,273) | (308,672) |
| Cash flow / Net investment Hedge | (8,872) | (52,434) |
| Stock-based compensation | 14,044 | 14,671 |
| | | . |
| NON-CURRENT LIABILITIES | 718,989 | 651,363 |
| | | |
| Deferred tax liabilities | 20,378 | 13,739 |
| Debt with third parties | 633,498 | 581,672 |
| Derivative financial instruments | 2,289 | 4,074 |
| Provisions and contingencies | 48,326 | 41,553 |
| Non-trade payables | 11,744 | 8,515 |
| Other taxes payable | 2,754 | 1,810 |
| | | |
| CURRENT LIABILITIES | 378,602 | 404,468 |
| | | |
| Debt with third parties | 87,117 | 129,176 |
| Derivative financial instruments | 167 | - |
| Trade and other payables | 272,547 | 252,474 |
| Trade payables | 71,676 | 60,233 |
| Income tax payables | 12,671 | 19,159 |
| Other taxes payables | 93,765 | 88,616 |
| Other non-trade payables | 94,435 | 84,466 |
| Provisions and contingencies | 18,771 | 22,818 |
| TOTAL EQUITY AND LIABILITIES | 1,304,611 | 1,141,818 |
| 11 | |
Cash Flow ($ thousand)
| | For the three months ended September 30, | For the nine months ended September 30, |
| | 2019 | 2020 | 2019 | 2020 |
| | (unaudited) |
| Operating activities | | | | |
| Profit/(loss) before income tax | 3.5 | (10.8) | (16.9) | (39.1) |
| Adjustments to reconcile profit/(loss) before income tax to net cash flows: | | | | |
| Amortization and depreciation | 30.8 | 30.0 | 99.4 | 90.2 |
| Changes in trade provisions | 1.9 | 1.6 | 3.4 | 3.5 |
| Share-based payment expense | 1.8 | 2.0 | 3.9 | 3.1 |
| Change in provisions | 7.1 | 5.6 | 32.6 | 22.0 |
| Grants released to income | (0.4) | (0.2) | (0.8) | (0.5) |
| Losses on disposal of property, plant and equipment | - | (0.1) | 0.1 | 0.1 |
| Finance income | (0.2) | (2.0) | (4.6) | (13.0) |
| Finance costs | 16.3 | 18.8 | 54.1 | 51.6 |
| Net foreign exchange differences | (2.3) | 8.8 | 0.7 | 18.1 |
| Change in other (gains)/ losses and own work capitalized | (7.0) | (0.3) | (4.9) | (0.7) |
| | 48.0 | 64.2 | 183.9 | 174.4 |
| Changes in working capital: | | | | |
| Changes in trade and other receivables | (5.8) | (3.3) | (110.9) | (13.1) |
| Changes in trade and other payables | 0.1 | (25.1) | 31.5 | 7.5 |
| Other assets/(payables) | (4.7) | 7.0 | (3.6) | (15.0) |
| | (10.4) | (21.4) | (83.0) | (20.6) |
| | | | | |
| Interest paid | (20.1) | (20.4) | (43.3) | (42.4) |
| Interest received | (1.1) | 1.6 | (0.8) | 11.7 |
| Income tax paid | (2.9) | 0.2 | (17.3) | (7.3) |
| Other payments | (5.0) | (2.8) | (24.2) | (8.5) |
| | (29.1) | (21.3) | (85.6) | (46.4) |
| Net cash flows from/(used in) operating activities | 12.1 | 10.7 | (1.6) | 68.2 |
| Investing activities | | | | |
| Payments for acquisition of intangible assets | 2.7 | (1.7) | (12.0) | (5.4) |
| Payments for acquisition of property, plant and equipment | (13.1) | (7.2) | (21.4) | (22.0) |
| Acquisition of subsidiaries, net of cash acquired | - | - | (14.9) | - |
| Payments for financial instruments | 0.2 | 0.2 | (0.4) | - |
| Proceeds from sale of PP&E and intangible assets | (0.4) | - | - | - |
| Net cash flows used in investing activities | (10.6) | (8.7) | (48.7) | (27.4) |
| Financing activities | | | | |
| Proceeds from borrowing from third parties | 22.5 | 9.2 | 172.9 | 109.6 |
| Repayment of borrowing from third parties | (11.5) | (17.8) | (97.8) | (41.0) |
| Payments of lease liabilities | (8.0) | (12.1) | (37.7) | (31.5) |
| Acquisition of treasury shares | (7.7) | (0.4) | (7.7) | (0.9) |
| Net cash flows provided by/(used in) financing activities | (4.7) | (21.1) | 29.6 | 36.2 |
| Net (decrease)/increase in cash and cash equivalents | (3.2) | (19.1) | (20.7) | 77.0 |
| Foreign exchange differences | (7.9) | 8.5 | (7.3) | (5.1) |
| Cash and cash equivalents at beginning of period | 116.6 | 207.2 | 133.5 | 124.7 |
| Cash and cash equivalents at end of period | 105.5 | 196.6 | 105.5 | 196.6 |
| 12 | |
Adjustments to EBITDA by Quarter
| | | Fiscal 2018 | Fiscal 2019 | Fiscal 2020 | |
| ($ in millions) | | Q1 | Q2 | Q3 | Q4 | FY | Q1 | Q2 | Q3 | Q4 | FY | Q1 | Q2 | Q3 |
| Profit/(loss) for the period | | (1.7) | 4.0 | 3.1 | 15.0 | 20.5 | (45.6) | (6.6) | 1.3 | (29.6) | (80.7) | (7.4) | (18.3) | (13.1) |
| Net finance expense | | 19.6 | 21.9 | 18.3 | (4.2) | 55.6 | 17.3 | 19.1 | 13.8 | 6.9 | 57.1 | 16.9 | 14.2 | 25.6 |
| Income tax expense/(benefit) | | 5.5 | (0.5) | 3.8 | 4.6 | 13.4 | (2.9) | (3.1) | 2.3 | 2.0 | 36.2 | (0.2) | (2.4) | 2.3 |
| Write-off of deferred tax assets | | - | - | - | - | - | 37.8 | - | - | - | - | - | - | - |
| Depreciation and amortization | | 26.3 | 23.6 | 21.8 | 23.6 | 95.2 | 35.3 | 33.2 | 30.8 | 41.4 | 140.8 | 31.5 | 28.7 | 30.0 |
| EBITDA (non-GAAP) (unaudited) | | 49.8 | 49.1 | 46.9 | 39.0 | 184.8 | 42.0 | 42.6 | 48.1 | 20.7 | 153.4 | 40.8 | 22.2 | 44.8 |
| Adjusted EBITDA Margins | | 10.1% | 10.4% | 10.9% | 9.2% | 10.2% | 9.6% | 9.6% | 11.7 | 5.0% | 9.0% | 10.9% | 7.1% | 12.7% |
Add-Backs to Net Income by Quarter
| | Fiscal 2018 | Fiscal 2019 | Fiscal 2020 | |
| ($ in millions, except percentage changes) | Q1 | Q2 | Q3 | Q4 | FY | Q1 | Q2 | Q3 | Q4 | FY | Q1 | Q2 | Q3 |
| Profit/(Loss) attributable to equity holders of the parent | (1.7) | 4.0 | 3.1 | 15.0 | 20.5 | (45.6) | (6.6) | 1.3 | (29.6) | (80.7) | (7.4) | (18.3) | (13.1) |
| Amortization of Acquisition related Intangible assets | 5.7 | 5.3 | 5.1 | 5.1 | 21.2 | 5.1 | 5.0 | 4.9 | 5.5 | 20.6 | 5.0 | 4.3 | 4.5 |
| Net foreign exchange gain on financial instruments | 3.1 | (9.0) | 5.9 | - | 0.0 | - | - | - | - | - | - | - | - |
| Net foreign exchange impacts | 2.8 | 19.0 | 9.3 | (2.3) | 28.8 | 1.6 | 1.4 | (2.3) | 8.4 | 9.1 | 3.5 | 5.8 | 8.8 |
| Tax effect | (2.4) | (3.7) | (4.6) | (1.6) | (11.3) | 34.6 | (6.6) | (2.2) | 2.2 | 27.7 | (4.5) | (2.0) | (1.4) |
| Other | - | - | - | - | - | - | - | - | - | | | | |
| Adjusted Earnings (non-GAAP) (unaudited) | 7.5 | 15.1 | 15.7 | 16.2 | 59.1 | (4.3) | (6.8) | 1.6 | (13.5) | (23.3) | (3.4) | (10.2) | (1.2) |
| Adjusted Earnings per share (in U.S. dollars) in the reverse split basis | 0.51 | 1.01 | 1.27 | 1.11 | 4.02 | (0.29) | (0.47) | 0.11 | (0.97) | (1.61) | (0.24) | (0.70) | (0.09) |
| Adjusted Earnings attributable to Owners of the parent (non-GAAP) (unaudited) | 7.8 | 14.3 | 18.4 | 15.7 | 57.2 | (4.7) | (7.2) | 1.6 | (13.5) | (23.9) | (3.4) | (10.2) | (1.2) |
| Adjusted Earnings attributable to Owners of the parent (in U.S. dollars) in the reverse split basis | 0.53 | 0.96 | 1.25 | 1.06 | 3.87 | (0.32) | (0.49) | 0.11 | (0.97) | (1.61) | (0.24) | (0.70) | (0.09) |
| (*) | We define non-recurring items as items that are limited in number, clearly identifiable, unusual, are unlikely to be repeated in the near future in the ordinary course of business and that have a material impact on the consolidated results of operations. Non-recurring items can be summarized as demonstrated below: |
| (a) | Amortization of acquisition related intangible assets represents the amortization expense of customer base, recorded as intangible assets. This customer base represents the fair value (within the business combination involving the acquisition of control of Atento Group) of the intangible assets arising from service agreements (tacit or explicitly formulated in contracts) with Telefónica Group and with other customers. |
| (b) | Since April 1, 2015, the Company designated the foreign currency risk on certain of its subsidiaries as net investment hedges using financial instruments as the hedging items. As a consequence, any gain or loss on the hedging instrument, related to the effective portion of the hedge is recognized in other comprehensive income (equity) as from that date. The gains or losses related to the ineffective portion are recognized in the statements of operations and for comparability, and those adjustments are added back to calculate Adjusted Earnings. |
| 13 | |
| (**) | Adjusted Earnings per share is calculated based on weighted average number of ordinary shares outstanding of 14,775,551 and 14,040,360 for the three months ended September 30, 2019 and 2020, respectively. |
(***) Adjusted Earnings per share in the reverse split basis is calculated by applying the ratio of conversion of 5.027090466672970 used in the reverse split into the previous weighted average number of ordinary shares outstanding
Effective Tax Rate
| ($ in millions, except percentage changes) | Fiscal 2018 | Fiscal 2019 | YTD 2020 | Q1 2018 | Q2 2018 | Q3 2018 | Q4 2018 | Q1 2019 | Q2 2019 | Q3 2019 | Q4 2019 | Q1 2020 | Q2 2020 | Q3 2020 |
| Profit/(loss) before tax1 | 33.9 | (44.5) | (28.3) | 3.9 | 3.6 | 6.9 | 19.6 | (10.6) | (9.7) | 3.5 | (27.6) | (7.6) | (20.7) | (10.8) |
| (+) Total Add-backs to Net Income (excluding tax effect) | 50.0 | 29.7 | 18.6 | 11.5 | 15.3 | 20.3 | 2.8 | 6.7 | 6.5 | 2.6 | 13.9 | 8.5 | 10.1 | 13.3 |
| Amortization of Acquisition related Intangible assets | 21.2 | 20.6 | 9.3 | 5.7 | 5.3 | 5.1 | 5.1 | 5.1 | 5.0 | 4.9 | 5.5 | 5.0 | 4.3 | 4.5 |
| Net foreign exchange gain on financial instruments | 0.0 | - | - | 3.1 | (9.0) | 5.9 | - | - | - | - | - | - | - | - |
| Net foreign exchange impacts | 28.8 | 9.1 | 9.3 | 2.8 | 19.0 | 9.3 | (2.3) | 1.6 | 1.4 | (2.3) | 8.4 | 3.5 | 5.8 | 8.8 |
| = Recurring Profit/(loss) before tax (non-GAAP) (unaudited) | 83.9 | (14.8) | (9.7) | 15.4 | 18.9 | 27.2 | 22.4 | (3.9) | (3.2) | 6.1 | (13.7) | 0.9 | (10.6) | 2.5 |
| (-) Recurring Tax | (24.7) | (8.5) | (3.7) | (7.9) | (3.2) | (8.4) | (6.2) | (0.4) | (3.7) | (4.5) | 0.1 | (4.3) | 0.4 | (3.7) |
| Income tax expense (reported) | (13.4) | (36.2) | 2.6 | (5.5) | 0.5 | (3.8) | (4.6) | (35.0) | 3.1 | (2.3) | (2.0) | 0.2 | 2.4 | (2.3) |
| Tax effect (non-recurring) | (11.3) | 27.7 | (6.3) | (2.4) | (3.7) | (4.6) | (1.6) | 34.6 | (6.8) | (2.2) | 2.2 | (4.5) | (2.0) | (1.4) |
| = Adjusted Earnings (non-GAAP) (unaudited) | 59.2 | (23.3) | (13.4) | 7.5 | 15.7 | 18.7 | 16.2 | (4.3) | (6.9) | 1.6 | (13.5) | (3.4) | (10.2) | (1.2) |
| | | | | | | | | | | | | | | |
| Recurring ETR | 30.5% | 57.7% | 38.5% | 51.3% | 17.7% | 31.1% | 31.4% | 9.8% | N.M. | 74.1% | 0.8% | N.M. | 3.8% | N.M. |
1 Profit/(loss) before income tax from continuing operations
Financing Arrangements
Net debt with third parties as of September 30, 2019 and 2020 is as follow:
| ($ in millions, except Net Debt/Adj. EBITDA LTM) | On September 30, 2019 | On September 30, 2020 |
| Cash and cash equivalents | 105.5 | 196.6 |
| Debt: | | |
| Senior Secured Notes | 493.5 | 497.0 |
| Super Senior Credit Facility | - | 50.1 |
| BNDES | 1.2 | 0.6 |
| Lease Liabilities (3) | 148.2 | 129.3 |
| Other Borrowings | 27.5 | 33.9 |
| Total Debt | 670.4 | 710.8 |
| Net Debt with third parties (1) (unaudited) | 564.9 | 514.2 |
| EBITDA LTM (2) (non-GAAP) (unaudited) | 171.7 | 128.5 |
| Net Debt/Adjusted EBITDA LTM (non-GAAP) (unaudited) | 3.3x | 4.0x |
| (1) | In considering our financial condition, our management analyzes Net debt with third parties, which is defined as total debt less cash and cash equivalents. Net debt with third parties is not a measure defined by IFRS and it has limitations as an analytical tool. Net debt with third parties is neither a measure defined by or presented in accordance with IFRS nor a measure of financial performance and should not be considered in isolation or as an alternative financial measure determined in accordance with IFRS. Net debt is not necessarily comparable to similarly titled measures used by other companies. |
| (2) | EBITDA LTM (Last Twelve Months) |
| (3) | Consider the impact in September 30, 2020 of application of IFRS16 (former operating leases not related to short-term or low-value leases are now shown as debt) was $123.3 million and $6.0 million of other financial leases. |
| 14 | |
Revenue Mix by Service Type
| | Fiscal 2018 | Fiscal 2019 | Fiscal 2020 |
| | Q1 | Q2 | Q3 | Q4 | FY | Q1 | Q2 | Q3 | Q4 | FY | Q1 | Q2 | Q3 |
| | | | | | | | | | | | | | |
| Customer Service | 51.1% | 51.8% | 50.6% | 50.3% | 50.7% | 51.7% | 52.0% | 53.0% | 54.6% | 52.8% | 56.4% | 60.9% | 58.2% |
| Sales | 18.1% | 18.0% | 18.3% | 18.5% | 17.7% | 17.0% | 16.9% | 16.9% | 15.6% | 16.6% | 13.3% | 9.8% | 12.6% |
| Collection | 7.3% | 7.5% | 8.2% | 8.8% | 8.2% | 7.9% | 7.8% | 7.4% | 7.1% | 7.5% | 7.1% | 7.0% | 7.1% |
| Back Office | 12.0% | 12.2% | 13.1% | 12.5% | 12.9% | 12.8% | 12.3% | 12.8% | 13.0% | 12.7% | 13.5% | 13.0% | 12.3% |
| Technical Support | 7.7% | 6.9% | 6.3% | 6.3% | 6.9% | 6.7% | 7.1% | 6.2% | 5.9% | 6.4% | 6.1% | 5.9% | 5.5% |
| Others | 3.8% | 3.7% | 3.5% | 3.6% | 3.6% | 3.9% | 3.9% | 3.7% | 3.8% | 4.0% | 3.6% | 3.3% | 4.3% |
| Total | 100.0% | 100.0% | 100.0% | 100.0% | 100.0% | 100.0% | 100.0% | 100.0% | 100.0% | 100.0% | 100.0% | 100.0% | 100.0% |
Number of Workstations and Delivery Centers
| | Number of Workstations | Number of Service
Delivery Centers (1) |
| | 2020 | 2019 | 2020 | 2019 |
| Brazil | 47,577 | 49,839 | 30 | 33 |
| Americas | 38,902 | 37,648 | 49 | 48 |
| Argentina (2) | 4,358 | 4,363 | 12 | 12 |
| Central America (3) | 2,840 | 2,335 | 3 | 3 |
| Chile | 2,318 | 2,835 | 4 | 4 |
| Colombia | 9,123 | 8,974 | 9 | 9 |
| Mexico | 10,053 | 9,487 | 15 | 14 |
| Peru | 8,907 | 8,451 | 3 | 3 |
| United States (4) | 1,303 | 1,203 | 3 | 3 |
| EMEA | 5,179 | 5,321 | 14 | 15 |
| Spain | 5,179 | 5,321 | 14 | 15 |
| Total | 91,658 | 92,808 | 93 | 96 |
FX Rates
| FX Assumptions (Average) | Q1 2018 | Q2 2018 | Q3 2018 | Q4 2018 | FY 2018 | Q1 2019 | Q2 2019 | Q3 2019 | Q4 2019 | FY 2019 | Q1 2020 | Q2 2020 | Q3 2020 | YTD 2020 |
| Euro (EUR) | 0.81 | 0.84 | 0.86 | 0.88 | 0.85 | 0.88 | 0.89 | 0.90 | 0.90 | 0.89 | 0.91 | 0.91 | 0.86 | 0.89 |
| Brazilian Real (BRL) | 3.25 | 3.60 | 3.96 | 3.81 | 3.65 | 3.77 | 3.92 | 3.97 | 4.12 | 3.94 | 4.46 | 5.38 | 5.38 | 5.07 |
| Mexican Peso (MXN) | 18.71 | 19.42 | 18.98 | 19.85 | 19.24 | 19.20 | 19.12 | 19.44 | 19.25 | 19.25 | 20.00 | 23.33 | 22.09 | 21.81 |
| Colombian Peso (COP) | 2,858.33 | 2,838.34 | 2,961.69 | 3,162.98 | 2,955.34 | 3,135.29 | 3,240.94 | 3,340.81 | 3,408.36 | 3,281.35 | 3,534.22 | 3,847.83 | 3,732.36 | 3,704.80 |
| Chilean Peso (CLP) | 601.97 | 620.73 | 663.19 | 679.62 | 641.38 | 667.01 | 683.69 | 705.50 | 754.86 | 702.77 | 802.78 | 823.43 | 780.80 | 802.34 |
| Peruvian Soles (PEN) | 3.24 | 3.26 | 3.29 | 3.36 | 3.29 | 3.32 | 3.32 | 3.34 | 3.36 | 3.34 | 3.40 | 3.43 | 3.55 | 3.46 |
| Argentinean Peso (ARS) | 19.71 | 23.55 | 32.09 | 37.12 | 28.12 | 39.05 | 43.91 | 50.56 | 59.38 | 48.22 | 61.55 | 67.64 | 73.31 | 67.50 |
| 15 | |