 |
Atento Reports Fiscal 2021 First Quarter Results
Commercial wins, revenue growth and efficiencies led to record positive operating cash flow;
Revenues in hard currencies already at 25% of total, on strong US growth;
On track to delivering guidance for FY 2021
NEW YORK, May 5, 2021 – Atento S.A. (NYSE: ATTO) (“Atento” or the “Company”), the largest provider of customer relationship management and business-process outsourcing services in Latin America, and among the top five providers globally, today announced its first quarter operating and financial results for the period ending March 31, 2021. All comparisons in this announcement are year-over-year (YoY) and in constant-currency (CCY), unless otherwise noted.
A strong start for 2021
| • | Q1 revenues grew 8.0% on a CCY basis, with consistent growth in Multisector across all regions, driven by Next Generation Services |
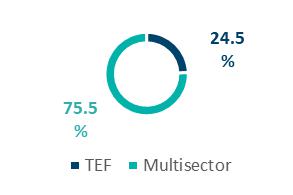
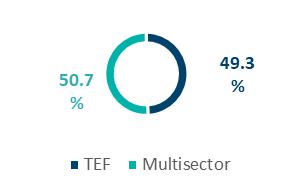
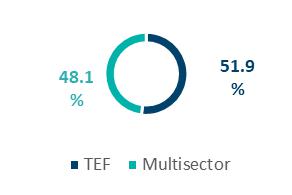
| • | Multisector revenues increased 11.0%, reaching 68.1% of total revenues, 0.7pp higher YoY |
| • | TEF resuming growth following new program wins |
| • | US revenues increased 52.0%, with EBITDA increasing 91% YoY |
| • | Consolidated EBITDA expanded 6.7% to $39.1 million YoY, with corresponding margin of 10.5%, in line with management expectations and reflecting historical seasonality for Q1 |
| • | Continued solid improvement in Cash Flow: operating cashflow +$11.9M vs Q1 2020, totaling $5.5M in Q1 2021, the first positive number for a first quarter since 2017 |
Building a track record in operating efficiency
| • | First stage implemented in 2019 and 2020 focused on structural opex, with $60 million in annualized savings carried to 2021 |
| • | Second stage to focus on contract profitability, with annualized savings expected to reach additional $25 million |
Debt refinancing resolved uncertainty related to capital structure
| • | Successfully concluded debt refinancing in Q1 2021, extending average debt life to 4.3 years |
| • | Healthy balance sheet with solid cash position of $176.1 million |
| • | Net debt reduction of 6.9% versus Q1 2020, with leverage at 3.3x |
| • | USD debt hedged for Principal and Coupons |
Avenues for Growth
| • | Remain focused on expanding NGS for multisector and US business, aiming at increasing revenue and EBITDA in hard currencies. |
Summarized Consolidated Financials
| ($ in millions except EPS) | Q1 2021 | Q1 2020 | CCY Growth (1) |
| Income Statement (6) | |||
| Revenue | 370.6 | 375.4 | 8.0% |
| EBITDA (2) | 39.1 | 40.8 | 6.7% |
| EBITDA Margin | 10.5% | 10.9% | -0.4 p.p. |
| Net Income (3) | (20.2) | (7.4) | N.M. |
| Recurring Net Income (2) | (9.9) | (3.5) | -116.3% |
| Earnings Per Share in the reverse split basis (2) (3) (5) | ($1.43) | ($0.52) | N.M. |
| Recurring EPS in the reverse split basis (2) (5) | ($0.70) | ($0.25) | -117.4% |
| Cash Flow, Debt and Leverage | |||
| Net Cash Used in Operating Activities | (0.6) | 4.4 | |
| Cash and Cash Equivalents | 176.1 | 162.8 | |
| Net Debt (4) | 525.4 | 564.3 | |
| Net Leverage (4) | 3.3x | 3.7x |
(1) Unless otherwise noted, all results are for Q1; all revenue growth rates are on a constant currency basis, year-over-year; (2) EBITDA, Recurring Net Income/Recurring Earnings per Share (EPS) are Non-GAAP measures; (3) Reported Net Income and Earnings per Share (EPS) include the impact of non-cash foreign exchange gains/losses on intercompany balances; (4) Includes IFRS 16 impact in Net Debt and Leverage; (5) Earnings per share and Recurring Earnings per share in the reverse split basis is calculated by applying the ratio of conversion of 5.027090466672970 used in the reverse split into the previous weighted average number of ordinary shares outstanding. (6) The following selected financial information are unaudited.
| 1 |
| |
Message from the CEO and CFO
Atento delivered solid Q1 2021 results, on the back of strong Next Generation services sales throughout the regions in which we operate, especially in the US and EMEA. Our revenues in the quarter went up 8.0% YoY on a constant currency basis, while EBITDA growth was 6.7%, with a 10.5% margin, despite implementation costs of new projects whose revenues will be fully accounted for from Q2 2021 onward and wage adjustments in Brazil. We are pleased to report that, for the first time since 2017, we generated positive operating cash flow in a first quarter.
The implementation of our Three Horizon Plan in 2019 successfully allowed us to convert our commercial pipeline, consistently increasing our sales as measured by Total Annual Value: new wins in this quarter surpassed $80 million, 4 times more than what we sold in the same period in 2018, and 50% more than Q1 2020. More than half of these revenues came from the U.S. We are proud to report that one of these wins is a contract with the State of Maryland where we assumed a front-line position in the fight against COVID by launching Atento’s Equitable Vaccination Distribution and Scheduling system using the Atento@home remote work solution, implemented in just two weeks.
A year ago, we said we wanted to serve the right clients, with the right services, and that’s what we have been delivering. We have been able to attract born-digital and tech brands that, along with media, now comprise more than 10% of our total revenues. When we add US and EMEA revenues hard currencies account for 25% of total revenues, mitigating the impact of foreign exchange variations from our Latin American businesses. More importantly, these clients demand more sophisticated services, allowing for better margins.
We are seeing opportunities to extract additional operating efficiencies throughout the year. After accomplishing annualized cost savings of $85 million in 2020, of which $60 million is being carried forward to 2021, we started the year focusing on contract profitability. There are important factors that impact the profitability of each program, and we have a delivery group currently implementing initiatives to best balance these factors so that we can improve our returns while improving service range and quality to our clients.
As we said in our 2019 Investor Day, improving the capital structure of Atento is a key element for generating value to shareholders. This quarter we successfully completed our debt refinancing, issuing new $500 million Senior Secured Notes that mature in February 2026, extending the average life of our debt to 4.3 years from 1.5 years and paving the way to improve our capital structure. Fulfilling the commitment made to investors, the new notes are protected by hedging instruments consisting mainly of cross-currency swaps in BRL, PEN and Euro, with the coupons hedged through maturity, while the principal is hedged for a period of 3 years.
The demand for our CX services remains strong and Atento is more than prepared to serve this demand. The combination of top line growth, expansion of revenues in hard currencies and additional operational efficiencies coupled with the success of our debt refinancing strengthens our confidence in achieving our guidance for EBITDA margins and leverage targets for 2021 and 2022.
Carlos López-Abadía Chief Executive Officer | José Azevedo Chief Financial Officer |
| 2 |
| |
First Quarter Consolidated Financial Results
Atento’s revenue increased 8.0% YoY in Q1 2021, to $370.6 million, mainly driven by an 11.0% growth in Multisector sales, which expanded across all regions, reflecting the company’s effort to continue improving revenue mix into fast-growing and more profitable verticals. Media, Tech and Born-digital already represent more than 10% of total revenues, with revenues in hard currencies already totaling 25% of total revenues.
Sales of Atento@home solutions have also increased. We are now serving more than 300 clients with this solution while maintaining our employees safely working from home, complying with all the security standards and reinforcing the culture of taking care of our people.
Telefónica revenues are stabilizing, with an increase of 2.2% YoY, mainly from higher volumes in Brazil and EMEA. It is worth highlighting that the initial impacts from the pandemic were already felt mid-March 2020, with the closing of centers that directly impacted TEF revenues for that period. We continue to improve our relationship with Telefónica and remain the leader in the share of wallet for CX services.
Multisector revenues reached 68.1% of total sales, up from 67.5% in Q1 2020 and from 62.4% two years ago, as a result of higher sales of Next Generation Services, such as high-value voice, integrated multichannel and automated back-office services, demand for which is even stronger with the change in consumer habits. NGS represented 30% of our new sales in this quarter.
Consolidated EBITDA expanded 6.7% to $39.1 million YoY, while the corresponding margin reached 10.5%, diminishing 40 basis point year-over-year. This slight decline reflects an impact of $6.6M from wage adjustments in Brazil, which we expect to recover as we pass it through to prices in the next quarters and of $1.3M implementation costs of new client programs in Brazil and the US. This EBITDA margin was in line with management expectations and reflects the historical first quarter seasonality.
Atento continued to maintain a comfortable level of financial liquidity, with net debt decreasing 6.9% to $525.4 million YoY. Operating Cash Flow was R$5.5 million in the quarter, the first positive OCF we registered in a Q1 since 2017. Free cash flow was $16.1M negative, the same level registered in Q1 2020, and includes around $10 million of one-time costs related to the debt refinancing and $11.7 million of interest payment net of hedge gains.
Segment Reporting
Brazil
| ($ in millions) | Q1 2021 | Q1 2020 | CCY growth | |
| Brazil Region | ||||
| Revenue | 148.9 | 172.0 | 6.7% | |
| Adjusted EBITDA | 17.9 | 24.4 | -9.5% | |
| Adjusted EBITDA Margin | 12.0% | 14.2% | -2.2 p.p. | |
| Profit/(loss) for the period | (4.9) | (8.2) | 28.2% | |
| Brazil Revenue Mix | 2021
| 2020
| ||
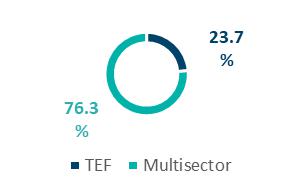
Revenue in Brazil, Atento’s flagship operation, increased 6.7% during the quarter to $148.9 million, fueled by 5.6% growth in multisector, due to Next Generation Services expansion with Born-Digital companies. Telefonica revenue went up by 10.5%, reflecting the partial impact of the new program implemented in March and also the weaker Q1 2020 that was impacted by the pandemic in the last two weeks of March 2020. Multisector clients acquired in the last twelve months came mainly from the Healthcare, Media and Born-Digital sectors.
| 3 |
| |
EBITDA was impacted by $6.6 million in wage adjustments, which we expect will be largely passed on to prices in the next couple of months, and $1.0 million of implementation costs related to new client programs, thus decreasing 9.5% YoY and totaling R$17.9 million. EBITDA margin, in turn, diminished 220 basis points to 12.0%. Excluding these impacts, EBITDA margin would have been 17.1%.
Americas Region
| ($ in millions) | Q1 2021 | Q1 2020 | CCY growth | |
| Americas Region | ||||
| Revenue | 154.1 | 147.4 | 8.6% | |
| Adjusted EBITDA | 17.1 | 13.7 | 25.5% | |
| Adjusted EBITDA Margin | 11.1% | 9.3% | 1.8 p.p | |
| Profit/(loss) for the period | (1.6) | (6.9) | 77.0% | |
| Americas Revenue Mix | 2021
| 2020
| ||
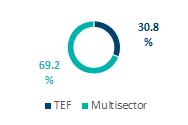
In the Americas, the Company recorded an increase in revenues of 8.6% YoY to $154.1 million, with Multisector sales increasing 15.8% YoY, mainly in Central America, Colombia and the US, where we won a new contract with the State of Maryland to support Covid-19 vaccine appointments and logistics. Telefónica revenues decreased 4.9% YoY, with the main impact coming from Peru as this country has been under a more severe lockdown to control the pandemic when compared to other countries.
When compared to Q1 2020, US revenues went up 52%, while EBITDA increased 91%, with EBITDA Margin reaching 15.8%, up by 3.2 percentage points. EBITDA was impacted by a $0.3 million implementation related cost for a new client program, implying normalized profitability closer to 17%. Our US clients already represent 7% of Atento’s total consolidated revenues, in line with our strategy of strengthening our revenues in hard currencies and expanding our presence in the American market.
The region’s Adjusted EBITDA was $17.1 million, increasing 25.5% YoY mainly due to higher revenue from the US coupled with improved operational efficiencies. EBITDA margin stood at 11.1%, an increase of 1.8 percentage points.
EMEA Region
| ($ in millions) | Q1 2021 | Q1 20210 | CCY growth | ||
| EMEA Region | |||||
| Revenue | 69.1 | 57.5 | 9.8% | ||
| Adjusted EBITDA | 8.5 | 3.7 | 105.8% | ||
| Adjusted EBITDA Margin | 12.3% | 6.5% | 5.8 p.p. | ||
| Profit/(loss) for the period | 0.9 | (0.6) | N.M | ||
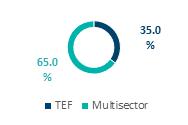
| EMEA Revenue Mix | 2021
| 2020 | |||
| 4 |
| |
In EMEA, a 15.8% increase in Multisector sales, driven by Next Generation Services, coupled with a 4.3% increase in TEF revenues, led to a 9.8% increase in revenues during the quarter, totaling $69.1 million.
EMEA’s Adjusted EBITDA more than doubled to $8.5 million, while the EBITDA margin expanded 580 basis points to 12.3%. The region’s profitability improved as a result of better operational efficiencies coupled with revenue growth.
Cash Flow
| Cashflow Statement ($ in millions) | Q1 2021 | Q1 2020 |
| Cash and cash equivalents at beginning of period | 209.0 | 124.7 |
| Net Cash from Operating activities | (0.6) | 4.4 |
| Net Cash used in Investing activities | (7.5) | (11.3) |
| Net Cash (used in)/ provided by Financing activities | (14.4) | 58.8 |
| Net (increase/decrease) in cash and cash equivalents | (22.4) | 51.9 |
| Effect of changes in exchanges rates | (10.5) | (13.9) |
| Cash and cash equivalents at end of period | 176.1 | 162.8 |
Indirect Cash Flow View – Q1 2021 ($ in millions)
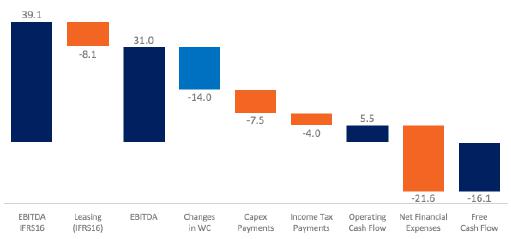
Despite historical seasonality for a first quarter, Atento closed the period with $5.5M of Operating Cash Flow, an $11.9 million improvement YOY because of a solid EBITDA coming from increased revenues and operational efficiencies. This was the first positive OCF in a first quarter since 2017, attesting the improvement in the Company’s financial discipline.
Free Cash Flow was negative $16.1 million, as one-time impact of approximately $10 million costs related to the debt refinancing (call premium to redeem previous outstanding bond and other issuance costs such as underwriter fees, lawyers and auditors) led to net financial expenses of $21.6 million. It is important to highlight that Q1 and Q3 are impacted by bond interest payment, which amounted to $11.7 million from interest payments net of hedge gains in this quarter.
Cash Capex was 2% of revenues in Q1 2021, compared to 3% in Q1 2020. While Q1 2021’s number was below guidance for the year, we believe this is a phasing effect as we have been deploying new projects, especially growth related, in line with our expectations. Therefore, we expect cash capex as a percentage of revenues to be aligned with our guidance of 4-4.5% for the entire year.
| 5 |
| |
Indebtedness & Capital Structure
| US$MM | Maturity | Interest Rate | Outstanding Balance 1Q2021 |
| SSN (1) (USD) | 2026 | 8.0% | 493.6 |
| Super Senior Credit Facility | 2021 | 4.5% | 30.0 |
| Other Revolving Credit Facilities | 2021 | CDI + 3.40 | 31.3 |
| Other Borrowings and Leases | 2025 | Variable | 15.2 |
| BNDES (BRL) | 2022 | TJLP + 2.0% | 0.5 |
| Debt with Third Parties | 570.6 | ||
| Leasing (IFRS 16) | 130.9 | ||
| Gross Debt (Debt with Third Parties + IFRS 16) | 701.5 | ||
| Cash and Cash Equivalents | 176.1 | ||
| Net Debt | 525.4 |
(1) Notes are protected by certain hedging instruments, with the coupons hedged through maturity, while the principal is hedged for a period of 3 years. The instruments consist mainly of cross-currency swaps in BRL, PEN and Euro.
Net Leverage

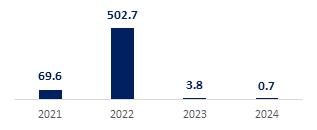
On February 19, 2021, Atento successfully completed its $500M bond refinancing. The new $500 million Senior Secured Notes matures on February 10, 2026 and will pay interest at a rate of 8.0% per annum. With this transaction, the Company’s average debt life increased from 1.5 years to 4.3 years.
Fulfilling the commitment made to investors in the refinancing process, the new notes are protected by certain hedging instruments, with the coupons hedged through maturity, while the principal is hedged for a period of 3 years. The instruments consist mainly of cross-currency swaps in BRL, PEN and Euro. As a reference, the BRL cost for principal and coupon is approximately 180% of CDI, equivalent to circa 5.0% p.a. with the current CDI, compared to 7% p.a. cost of the previous bond for coupons only.
Debt Payment Schedule | As of December 31, 2020 As of March 31, 2021 | |
 |  |
| 6 |
| |
At end of Q1 2021, gross debt was $701.5 million, which included $130.9 million in leasing obligations under IFRS 16. Atento finished the quarter with cash and cash equivalents of $176.1 million, a YoY increase of $13.3 million (+8.2%). At the end of March, we had approximately $80 million in available revolving credit facilities, of which $50 million were drawn down. Net debt, in turn, decreased 6.9% when compared to Q1 2020.
Fiscal 2021 Guidance
| FY 2021 | Q1 2021 Reported | |
| Revenue growth (in constant currency) | Mid-single digit | 8.0% |
| EBITDA margin | 12.5%-13.5% | 10.5% |
| Leverage (x) | 2.5x-3.0x | 3.3x |
| Cash Capex as % of Revenues | 4.0-4.5% | 2.0% |
Share Repurchase Program
In the quarter, the Company repurchased 18,555 shares under its Share Repurchase Program, at a cost of $369 million. On February 24, 2021, the Board of Directors approved the extension of the current program for additional 12 months, with the new expiration date on March 10, 2022. At the end of March 2021, Atento held 918,350 shares in treasury.
Conference Call
The Company will host a conference call and webcast on Thursday, May 6, 2021 at 10:00 am ET to discuss its financial results. The conference call can be accessed by dialing: USA: +1 (866) 807-9684; UK: (+44) 20 3514 3188; Brazil: (+55) 11 4933-0682; or Spain: (+34) 91 414 9260. No passcode is required. Individuals who dial in will be asked to identify themselves and their affiliations The live webcast of the conference call will be available on Atento's Investor Relations website at investors.atento.com (Click here). A web-based archive of the conference call will also be available at the website.
About Atento
Atento is the largest provider of customer relationship management and business process outsourcing (“CRM BPO”) services in Latin America, and among the top five providers globally. Atento is also a leading provider of nearshoring CRM BPO services to companies that carry out their activities in the United States. Since 1999, the company has developed its business model in 13 countries where it employs approximately 140,000 people. Atento has over 400 clients to whom it offers a wide range of CRM BPO services through multiple channels. Atento’s clients are mostly leading multinational corporations in sectors such as telecommunications, banking and financial services, health, retail and public administrations, among others. Atento’s shares trade under the symbol ATTO on the New York Stock Exchange (NYSE). In 2019, Atento was named one of the World’s 25 Best Multinational Workplaces and one of the Best Multinationals to Work for in Latin America by Great Place to Work®. Also, in 2021 Everest named Atento as a star performer Gartner named the company as a leader in the 2021 Gartner Magic Quadrant. For more information visit www.atento.com
| Investor Relations Shay Chor + 55 11 3293-5926 shay.chor@atento.com | Investor Relations Fernando Schneider + 55 11 3779-8119 fernando.schneider@atento.com | Media Relations +34 670031347 |
| 7 |
| |
Forward-Looking Statements
This press release contains forward-looking statements. Forward-looking statements can be identified by the use of words such as "may," "should," "expects," "plans," "anticipates," "believes," "estimates," "predicts," "intends," "continue" or similar terminology. These statements reflect only Atento's current expectations and are not guarantees of future performance or results. Forward-looking statements by their nature address matters that are, to different degrees, uncertain, such as statements about the potential impacts of the Covid-19 pandemic on our business operations, financial results and financial position and on the world economy. These statements are subject to risks and uncertainties that could cause actual results to differ materially from those contained in the forward-looking statements. These risks and uncertainties include, but are not limited to, competition in Atento's highly competitive industries; increases in the cost of voice and data services or significant interruptions in these services; Atento's ability to keep pace with its clients' needs for rapid technological change and systems availability; the continued deployment and adoption of emerging technologies; the loss, financial difficulties or bankruptcy of any key clients; the effects of global economic trends on the businesses of Atento's clients; the non-exclusive nature of Atento's client contracts and the absence of revenue commitments; security and privacy breaches of the systems Atento uses to protect personal data; the cost of pending and future litigation; the cost of defending Atento against intellectual property infringement claims; extensive regulation affecting many of Atento's businesses; Atento's ability to protect its proprietary information or technology; service interruptions to Atento's data and operation centers; Atento's ability to retain key personnel and attract a sufficient number of qualified employees; increases in labor costs and turnover rates; the political, economic and other conditions in the countries where Atento operates; changes in foreign exchange rates; Atento's ability to complete future acquisitions and integrate or achieve the objectives of its recent and future acquisitions; future impairments of our substantial goodwill, intangible assets, or other long-lived assets; and Atento's ability to recover consumer receivables on behalf of its clients. In addition, Atento is subject to risks related to its level of indebtedness. Such risks include Atento's ability to generate sufficient cash to service its indebtedness and fund its other liquidity needs; Atento's ability to comply with covenants contained in its debt instruments; the ability to obtain additional financing; the incurrence of significant additional indebtedness by Atento and its subsidiaries; and the ability of Atento's lenders to fulfill their lending commitments. Atento is also subject to other risk factors described in documents filed by the company with the United States Securities and Exchange Commission.
These forward-looking statements speak only as of the date on which the statements were made. Atento undertakes no obligation to update or revise publicly any forward-looking statements, whether as a result of new information, future events or otherwise.
| 8 |
| |
SELECTED FINANCIAL DATA:
The following selected financial information for the first quarter ended March 31, 2021 and March 31, 2020 are unaudited.
Consolidated Statements of Operations for the Three Months Ended March 31, 2020 and 2021
| For the three months ended March 31 | |||||
($ million, except percentage changes)
| 2021 | 2020 | Change (%) | Change excluding FX (%) | |
| (unaudited) | |||||
| Revenue | 370.6 | 375.4 | -1.3 | 8.0 | |
| Other operating income | 1.3 | 0.9 | 50.6 | 43.6 | |
| Operating expenses: | |||||
| Supplies | -20.9 | -16.7 | 25.1 | 38.3 | |
| Employee benefit expenses | -282.8 | -289.0 | -2.1 | 6.6 | |
| Depreciation | -17.7 | -19.8 | -10.5 | -0.2 | |
| Amortization | -12.8 | -11.7 | 9.5 | 22.2 | |
| Changes in trade provisions | 1.5 | -0.5 | N.M. | N.M. | |
| Other operating expenses | -30.7 | -29.3 | 4.8 | 16.6 | |
| Total operating expenses | -363.4 | -367.0 | -1.0 | 8.3 | |
| Operating profit | 8.6 | 9.3 | -8.0 | 1.7 | |
| Finance income | 3.0 | 2.4 | 23.6 | 60.9 | |
| Finance costs | -24.3 | -15.9 | 53.5 | 65.8 | |
| Change in fair value of financial instruments | -13.8 | - | N.M. | N.M. | |
| Net foreign exchange loss | 7.3 | -3.5 | N.M. | N.M. | |
| Net finance expense | -27.8 | -16.9 | 64.2 | 104.7 | |
| Profit/(loss) before income tax | -19.2 | -7.6 | N.M. | N.M. | |
| Income tax benefit/(expense) | -1.0 | 0.2 | N.M. | 6.3 | |
| Profit/(loss) for the period | -20.2 | -7.4 | N.M. | N.M. | |
| Other financial data: | |||||
| EBITDA (1) (unaudited) | 39.1 | 40.8 | -4.2 | 6.7 | |
| Adjusted EBITDA (1) (unaudited) | 39.1 | 40.8 | -4.2 | 6.7 | |
(1) For the reconciliation of these non-GAAP measures to the closest comparable IFRS measure, see section "Summary Consolidated Historical Financial Information - Reconciliation of EBITDA and Adjusted EBITDA to profit/(loss)".
N.M. means not meaningful
| 9 |
| |
Consolidated Statements of Operations by Segment for the Three Months Ended March 31, 2020 and 2021
| ($ in millions, except percentage changes) | For the three months ended March 31, | Change (%) | Change Excluding FX (%) | |
| 2021 | 2020 | |||
| (unaudited) | ||||
| Revenue: | ||||
| Brazil | 148.9 | 172.0 | -13.5 | 6.7 |
| Americas | 154.1 | 147.3 | 4.7 | 8.6 |
| EMEA | 69.1 | 57.5 | 20.3 | 9.8 |
| Other and eliminations (1) | -1.5 | -1.3 | -9.2 | -15.8 |
| Total revenue | 370.6 | 375.4 | -1.3 | 8.0 |
| Operating expenses: | ||||
| Brazil | -149.2 | -167.8 | -11.1 | 9.5 |
| Americas | -153.5 | -149.2 | 2.9 | 6.9 |
| EMEA | -66.6 | -58.4 | 14.1 | 4.3 |
| Other and eliminations (1) | 5.9 | 8.4 | -29.9 | -28.1 |
| Total operating expenses | -363.4 | -367.0 | -1.0 | 8.3 |
| Operating profit/(loss): | ||||
| Brazil | 2.9 | 4.3 | -32.6 | -10.9 |
| Americas | 1.3 | -1.5 | N.M. | N.M. |
| EMEA | 3.5 | -0.4 | N.M. | N.M. |
| Other and eliminations (1) | 0.9 | 7.0 | -87.3 | -87.0 |
| Total operating profit/(loss) | 8.6 | 9.3 | -8.0 | 1.7 |
| Net finance expense: | ||||
| Brazil | -9.3 | -16.5 | -43.6 | -30.6 |
| Americas | -2.4 | -4.1 | -42.5 | -41.4 |
| EMEA | -0.5 | -0.0 | N.M. | N.M. |
| Other and eliminations (1) | -15.5 | 3.8 | N.M. | N.M. |
| Total net finance expense | -27.8 | -16.9 | 64.2 | 104.7 |
| Income tax benefit/(expense): | ||||
| Brazil | 1.5 | 4.0 | -62.1 | -54.6 |
| Americas | -0.5 | -1.2 | 59.0 | 65.3 |
| EMEA | -2.1 | -0.2 | N.M. | N.M. |
| Other and eliminations (1) | 0.1 | -2.5 | 102.3 | 102.1 |
| Total income tax benefit/(expense) | -1.0 | 0.2 | N.M. | -6.3 |
| Profit/(loss) for the period: | ||||
| Brazil | -4.9 | -8.2 | 40.3 | 28.2 |
| Americas | -1.6 | -6.9 | 77.4 | 77.0 |
| EMEA | 0.9 | -0.6 | N.M. | N.M. |
| Other and eliminations (1) | -14.6 | 8.3 | N.M. | N.M. |
| Profit/(loss) for the period | -20.2 | -7.4 | N.M. | N.M. |
| Profit/(loss) attributable to: | ||||
| Owners of the parent | -20.2 | -7.4 | N.M. | N.M. |
| Other financial data: | ||||
| EBITDA (2): | ||||
| Brazil | 18.7 | 21.0 | -11.1 | 10.9 |
| Americas | 12.8 | 10.1 | 26.5 | 28.4 |
| EMEA | 6.6 | 2.6 | N.M. | 130.0 |
| Other and eliminations (1) | 1.0 | 7.0 | -86.4 | -86.1 |
| Total EBITDA (unaudited) | 39.1 | 40.8 | -4.2 | 6.7 |
| Adjusted EBITDA (2): | ||||
| Brazil | 17.9 | 24.4 | -26.7 | -9.5 |
| Americas | 17.1 | 13.7 | 25.3 | 25.5 |
| EMEA | 8.5 | 3.7 | 127.0 | 105.8 |
| Other and eliminations (1) | -4.5 | -1.1 | N.M. | N.M. |
| Total Adjusted EBITDA (unaudited) | 39.1 | 40.8 | -4.2 | 6.7 |
(1) Included revenue and expenses at the holding-company level (such as corporate expenses and acquisition related expenses), as applicable, as well as consolidation adjustments.
(2) For the reconciliation of these non-GAAP measures to the closest comparable IFRS measure, see section "Summary Consolidated Historical Financial Information - Reconciliation of EBITDA and Adjusted EBITDA to profit/(loss)".
| 10 |
| |
Balance Sheet ($ Thousands)
| ASSETS | ||
| March 31, | December 31, | |
| 2021 | 2020 | |
| (unaudited) | (audited) | |
| NON-CURRENT ASSETS | 559,020 | 604,327 |
| Intangible assets | 91,473 | 106,643 |
| Goodwill | 96,663 | 103,014 |
| Right-of-use assets | 125,340 | 137,842 |
| Property, plant and equipment | 85,938 | 90,888 |
| Non-current financial assets | 64,951 | 70,275 |
| Trade and other receivables | 27,909 | 20,995 |
| Other non-current financial assets | 34,424 | 38,192 |
| Derivative financial instruments | 2,618 | 11,088 |
| Other taxes receivable | 4,361 | 4,815 |
| Deferred tax assets | 90,294 | 90,850 |
| CURRENT ASSETS | 532,261 | 571,796 |
| Trade and other receivables | 318,731 | 324,850 |
| Trade and other receivables | 294,632 | 299,086 |
| Current income tax receivable | 24,099 | 25,764 |
| Other taxes receivable | 34,730 | 36,794 |
| Other current financial assets | 2,746 | 1,158 |
| Cash and cash equivalents | 176,054 | 208,994 |
| TOTAL ASSETS | 1,091,281 | 1,176,123 |
| 11 |
| |
| LIABILITIES AND SHAREHOLDERS’ EQUITY | March 31, | December 31, |
| 2021 | 2020 | |
| (unaudited) | (audited) | |
| TOTAL EQUITY | 60,749 | 119,676 |
| EQUITY ATTRIBUTABLE TO: | ||
| OWNERS OF THE PARENT COMPANY | 60,749 | 119,676 |
| Share capital | 49 | 49 |
| Share premium | 615,423 | 613,619 |
| Treasury shares | -13,020 | -12,312 |
| Retained losses | -200,019 | -178,988 |
| Translation differences | -307,409 | -280,715 |
| Cash flow / Net investment Hedge | -49,835 | -37,360 |
| Stock-based compensation | 15,560 | 15,383 |
| NON-CURRENT LIABILITIES | 644,710 | 651,662 |
| Debt with third parties | 580,671 | 594,636 |
| Derivative financial instruments | 16,342 | 5,220 |
| Provisions and contingencies | 42,084 | 45,617 |
| Non-trade payables | 3,817 | 4,296 |
| Other taxes payable | 1,796 | 1,893 |
| CURRENT LIABILITIES | 385,822 | 404,785 |
| Debt with third parties | 120,827 | 133,187 |
| Trade and other payables | 240,802 | 249,723 |
| Trade payables | 55,709 | 59,415 |
| Income tax payables | 14,937 | 16,838 |
| Other taxes payables | 84,870 | 97,104 |
| Other non-trade payables | 85,286 | 76,366 |
| Provisions and contingencies | 24,193 | 21,875 |
| TOTAL LIABILITIES AND SHAREHOLDERS’ EQUITY | 1,091,281 | 1,176,123 |
| 12 |
| |
Cash Flow ($ million)
| For the three months ended March 31, | ||
| 2021 | 2020 | |
| (unaudited) | ||
| Operating activities | ||
| Loss before income tax | (19.2) | (7.6) |
| Adjustments to reconcile loss before income tax to net cash flows: | ||
| Amortization and depreciation | 30.5 | 31.5 |
| Changes in trade provisions | (1.5) | 0.5 |
| Share-based payment expense | 2.2 | 0.6 |
| Change in provisions | 8.7 | 4.1 |
| Grants released to income | (0.2) | (0.2) |
| Losses on disposal of property, plant and equipment | (0.1) | 0.2 |
| Finance income | (3.0) | (2.4) |
| Finance costs | 24.3 | 15.9 |
| Net foreign exchange differences | (7.3) | 3.5 |
| Change in fair value of financial instruments | 13.8 | - |
| Change in other (gains)/ losses and own work capitalized | 0.0 | (1.3) |
| 67.4 | 52.3 | |
| Changes in working capital: | ||
| Changes in trade and other receivables | (36.0) | (37.2) |
| Changes in trade and other payables | 17.2 | 10.2 |
| Other assets/(payables) | 1.1 | 3.2 |
| (17.7) | (22.4) | |
| Interest paid | (29.3) | (19.6) |
| Interest received | 7.7 | 9.7 |
| Income tax paid | (4.0) | (7.1) |
| Other payments | (5.4) | (0.9) |
| (31.0) | (18.0) | |
| Net cash flows from/ (used in) operating activities | (0.6) | 4.4 |
| Investing activities | ||
| Payments for acquisition of intangible assets | (0.9) | (0.1) |
| Payments for acquisition of property, plant and equipment | (6.6) | (10.9) |
| Payments for financial instruments | - | (0.3) |
| Net cash flows used in investing activities | (7.5) | (11.3) |
| Financing activities | ||
| Proceeds from borrowing from third parties | 501.8 | 77.6 |
| Repayment of borrowing from third parties | (507.7) | (9.4) |
| Payments of lease liabilities | (8.1) | (9.4) |
| Acquisition of treasury shares | (0.4) | - |
| Net cash flows provided by/ (used in) financing activities | (14.4) | 58.8 |
| Net (decrease)/increase in cash and cash equivalents | (22.4) | 51.9 |
| Foreign exchange differences | (10.5) | (13.9) |
| Cash and cash equivalents at beginning of period | 209.0 | 124.7 |
| Cash and cash equivalents at end of period | 176.1 | 162.8 |
| 13 |
| |
Adjustments to EBITDA by Quarter
| Fiscal 2019 | Fiscal 2020 | Fiscal 2021 | |||||||||
| ($ million) | Q1 | Q2 | Q3 | Q4 | FY | Q1 | Q2 | Q3 | Q4 | FY | Q1 |
| Profit/(loss) for the period | (45.6) | (6.6) | 1.3 | (29.6) | (80.7) | (7.4) | (18.3) | (13.1) | (7.9) | (46.8) | (20.2) |
| Net finance expense | 17.3 | 19.1 | 13.8 | 6.9 | 57.1 | 16.9 | 14.2 | 25.6 | 25.3 | 82.0 | 27.8 |
| Income tax expense | (2.9) | (3.1) | 2.3 | 2.0 | 36.2 | (0.2) | (2.4) | 2.3 | 5.3 | 5.1 | 1.0 |
| Write-off of deferred tax assets | 37.8 | - | - | - | - | - | - | - | - | - | |
| Depreciation and amortization | 35.3 | 33.2 | 30.8 | 41.4 | 140.8 | 31.5 | 28.7 | 30.0 | 30.7 | 120.9 | 30.5 |
| EBITDA (non-GAAP) (unaudited) | 42.0 | 42.6 | 48.1 | 20.7 | 153.4 | 40.8 | 22.2 | 44.8 | 53.5 | 161.2 | 39.1 |
| Adjusted EBITDA Margins | 9.6% | 9.6% | 11.7 | 5.0% | 9.0% | 10.9% | 7.1% | 12.7% | 14.5% | 11.4% | 39.1 |
IFRS 16 Effect
| IFRS 16: Effect | Q1 2021 | Q1 2020 |
| Revenue | 0.0 | 0.0 |
| EBITDA | 7.3 | 9.4 |
| Depreciation & Amortization | (10.5) | (11.7) |
| Operating Profit | (3.2) | (2.3) |
| Finance costs | (3.4) | (3.7) |
| (Loss)/profit before income tax | (6.7) | (6.0) |
| Income tax expense | (0.0) | 0.0 |
| (Loss)/profit after income tax | (6.7) | (6.0) |
Add-Backs to Net Income by Quarter
| Fiscal 2019 | Fiscal 2020 | Fiscal 2021 | |||||||||
| ($ million, except percentage changes) | Q1 | Q2 | Q3 | Q4 | FY | Q1 | Q2 | Q3 | Q4 | FY | Q1 |
| Profit/(Loss) attributable to equity holders of the parent company | (45.6) | (6.6) | 1.3 | (29.6) | (80.7) | (7.4) | (18.3) | (13.1) | (7.9) | (46.8) | (20.2) |
| Amortization of Acquisition related to Intangible assets | 5.1 | 5.0 | 4.9 | 5.5 | 20.6 | 5.0 | 4.3 | 4.5 | 4.5 | 18.3 | 5.1 |
| Net foreign exchange gain on financial instruments | - | - | - | - | - | - | - | - | - | - | 13.8 |
| Net foreign exchange impacts | 1.6 | 1.4 | (2.3) | 8.4 | 9.1 | 3.5 | 5.8 | 8.8 | 9.7 | 27.8 | (7.3) |
| Tax effect | 34.6 | (6.8) | (2.2) | 2.2 | 27.7 | (4.5) | (2.0) | (1.4) | (1.7) | (9.4) | (1.3) |
| Other | - | - | - | - | - | ||||||
| Adjusted Earnings (non-GAAP) (unaudited) | (4.3) | (6.9) | 1.6 | (13.5) | (23.3) | (3.5) | (10.2) | (1.2) | 4.5 | (10.1) | (9.9) |
| Adjusted Earnings per share (in U.S. dollars) in the reverse split basis | (0.29) | (0.47) | 0.11 | (0.97) | (1.61) | (0.25) | (0.70) | (0.09) | 0.32 | (0.72) | (0.70) |
| Adjusted Earnings attributable to Owners of the parent (non-GAAP) (unaudited) | (4.7) | (7.2) | 1.6 | (13.5) | (23.9) | (3.5) | (10.2) | (1.2) | 4.5 | (10.1) | (9.9) |
| Adjusted Earnings attributable to Owners of the parent (in U.S. dollars) in the reverse split basis | (0.32) | (0.49) | 0.11 | (0.97) | (1.65) | (0.25) | (0.70) | (0.09) | 0.32 | (0.72) | (0.70) |
| (*) | We define non-recurring items as items that are limited in number, clearly identifiable, unusual, are unlikely to be repeated in the near future in the ordinary course of business and that have a material impact on the consolidated results of operations. Non-recurring items can be summarized as demonstrated below: |
| (a) | Amortization of acquisition related to intangible assets represents the amortization expense of customer base, recorded as intangible assets. This customer base represents the fair value (within the business combination involving the acquisition of control of Atento Group) of the intangible assets arising from service agreements (tacit or explicitly formulated in contracts) with Telefónica Group and with other customers. |
| (b) | Since April 1, 2015, the Company designated the foreign currency risk on certain of its subsidiaries as net investment hedges using financial instruments as the hedging items. Consequently, any gain or loss on the hedging instrument, related to the effective portion of the hedge is recognized in other comprehensive income (equity) as from that date. The gains or losses related to the ineffective portion are recognized in the statements of operations and for comparability, and those adjustments are added back to calculate Adjusted Earnings. |
| (**) | Adjusted Earnings per share is calculated based on weighted average number of ordinary shares outstanding of 14,159,237 and 14,090,948 for the three months ended March 31, 2020 and 2021, respectively. |
| (***) | Adjusted Earnings per share in the reverse split basis is calculated by applying the ratio of conversion of 5.027090466672970 used in the reverse split into the previous weighted average number of ordinary shares outstanding |
| 14 |
| |
Effective Tax Rate
| ($ million, except percentage changes) | Fiscal 2019 | Fiscal 2020 | Q1 2019 | Q2 2019 | Q3 2019 | Q4 2019 | Q1 2020 | Q2 2020 | Q3 2020 | Q4 2020 | Q1 2021 |
| Profit/(loss) before tax1 | (44.5) | (41.7) | (10.6) | (9.7) | 3.5 | (27.6) | (7.6) | (20.7) | (10.8) | (2.6) | (19.2) |
| (+) Total Add-backs to Net Income (excluding tax effect) | 29.7 | 46.1 | 6.7 | 6.5 | 2.6 | 13.9 | 8.5 | 10.1 | 13.3 | 14.2 | 11.6 |
| Amortization of Acquisition related Intangible assets | 20.6 | 18.3 | 5.1 | 5.0 | 4.9 | 5.5 | 5.0 | 4.3 | 4.5 | 4.5 | 5.1 |
| Net foreign exchange impacts | 9.1 | 27.8 | 1.6 | 1.4 | (2.3) | 8.4 | 3.5 | 5.8 | 8.8 | 9.7 | (7.3) |
| Change in fair value of financial instruments | - | - | - | - | - | - | - | - | - | - | 13.8 |
| = Recurring Profit/(loss) before tax (non-GAAP) (unaudited) | (14.8) | 4.4 | (3.9) | (3.2) | 6.1 | (13.7) | 0.9 | (10.6) | 2.5 | 11.6 | (7.6) |
| (-) Recurring Tax | (8.5) | (14.5) | (0.4) | (3.7) | (4.5) | 0.1 | (4.3) | 0.4 | (3.7) | (7.0) | (2.3) |
| Income tax expense (reported) | (36.2) | (5.1) | (35.0) | 3.1 | (2.3) | (2.0) | 0.2 | 2.4 | (2.3) | (5.3) | (1.0) |
| Tax effect (non-recurring) | 27.7 | (9.4) | 34.6 | (6.8) | (2.2) | 2.2 | (4.5) | (2.0) | (1.4) | (1.7) | (1.3) |
| = Adjusted Earnings (non-GAAP) (unaudited) | (23.3) | (10.1) | (4.3) | (6.9) | 1.6 | (13.5) | (3.4) | (10.2) | (1.2) | 4.6 | (9.9) |
| Recurring ETR | 57.7% | N.M. | 9.8% | N.M. | 74.1% | 0.8% | N.M. | 3.8% | N.M. | 60.3% | 30.3% |
(1) Profit/(loss) before income tax from continuing operations
Financing Arrangements
Net debt with third parties as of December 31, 2019 and 2020 is as follow:
| ($ million, except Net Debt/Adj. EBITDA LTM) | On March 31, 2021 | On March 31, 2020 |
| Cash and cash equivalents | 176.1 | 162.8 |
| Debt: | ||
| Senior Secured Notes | 493.6 | 495.3 |
| Super Senior Credit Facility | 30.0 | 50.0 |
| BNDES | 0.5 | 0.8 |
| Lease Liabilities (3) | 140.3 | 146.1 |
| Other Borrowings | 37.2 | 35.0 |
| Total Debt | 701.5 | 727.1 |
| Net Debt with third parties (1) (unaudited) | 525.4 | 564.4 |
| Adjusted EBITDA LTM (2) (non-GAAP) (unaudited) | 159.5 | 152.2 |
| Net Debt/Adjusted EBITDA LTM (non-GAAP) (unaudited) | 3.3x | 3.7x |
| (1) | In considering our financial condition, our management analyzes Net debt with third parties, which is defined as total debt less cash and cash equivalents. Net debt with third parties is not a measure defined by IFRS and it has limitations as an analytical tool. Net debt with third parties is neither a measure defined by or presented in accordance with IFRS nor a measure of financial performance and should not be considered in isolation or as an alternative financial measure determined in accordance with IFRS. Net debt is not necessarily comparable to similarly titled measures used by other companies. |
| (2) | EBITDA LTM (Last Twelve Months) |
| (3) | Considers the impact on March 31, 2021 of the application of IFRS16 (former operating leases not related to short-term or low-value leases are now shown as debt) of $130.9 million and $9.4 million of other financial leases. |
| 15 |
| |
Revenue Mix by Service Type
| Fiscal 2019 | Fiscal 2020 | Fiscal 2021 | |||||||||
| Q1 | Q2 | Q3 | Q4 | FY | Q1 | Q2 | Q3 | Q4 | FY | Q1 | |
| Customer Service | 51.7% | 52.0% | 53.0% | 54.6% | 52.8% | 56.4% | 60.9% | 58.2% | 59.5% | 58.5% | 61.7% |
| Sales | 17.0% | 16.9% | 16.9% | 15.6% | 16.6% | 13.3% | 9.8% | 12.6% | 12.9% | 12.3% | 12.1% |
| Collection | 7.9% | 7.8% | 7.4% | 7.1% | 7.5% | 7.1% | 7.0% | 7.1% | 6.6% | 6.9% | 6.2% |
| Back Office | 12.8% | 12.3% | 12.8% | 13.0% | 12.7% | 13.5% | 13.0% | 12.3% | 12.8% | 12.7% | 11.8% |
| Technical Support | 6.7% | 7.1% | 6.2% | 5.9% | 6.4% | 6.1% | 5.9% | 5.5% | 5.4% | 5.8% | 5.2% |
| Others | 3.9% | 3.9% | 3.7% | 3.8% | 4.0% | 3.6% | 3.3% | 4.3% | 2.8% | 3.8% | 3.1% |
| Total | 100.0% | 100.0% | 100.0% | 100.0% | 100.0% | 100.0% | 100.0% | 100.0% | 100% | 100.0% | 100.0% |
Number of Workstations and Delivery Centers
| Number of Workstations | Number of Service Delivery Centers (1) | Headcount | ||||
| 2021 | 2020 | 2021 | 2020 | 2021 | 2020 | |
| Brazil | 51,148 | 49,821 | 32 | 33 | 77,760 | 72,744 |
| Americas | 38,887 | 39,659 | 48 | 48 | 54,793 | 55,699 |
| Argentina (2) | 3,632 | 4,358 | 11 | 12 | 6,821 | 6,751 |
| Central America (3) | 2,824 | 2,516 | 3 | 3 | 5,318 | 5,088 |
| Chile | 2,314 | 2,549 | 4 | 4 | 5,094 | 5,489 |
| Colombia | 9,628 | 9,087 | 9 | 9 | 9,532 | 8,476 |
| Mexico | 10,281 | 11,437 | 15 | 14 | 17,098 | 17,564 |
| Peru | 8,905 | 8,475 | 3 | 3 | 9,395 | 11,219 |
| United States (4) | 1,303 | 1,237 | 3 | 3 | 1,535 | 1,112 |
| EMEA | 5,309 | 5,376 | 14 | 15 | 13,486 | 12,447 |
| Spain | 5,309 | 5,376 | 14 | 15 | 13,486 | 12,447 |
| Corporate | - | - | - | - | 125 | 83 |
| Total | 95,344 | 94,856 | 94 | 96 | 146,164 | 140,973 |
(1) Includes service delivery centers at facilities operated by us and those owned by our clients where we provide operations personnel and workstations.
(2) Includes Uruguay.
(3) Includes Guatemala and El Salvador.
(4) Includes Puerto Rico.
FX Rates
| FX Assumptions (Average) | Q1 2019 | Q2 2019 | Q3 2019 | Q4 2019 | FY 2019 | Q1 2020 | Q2 2020 | Q3 2020 | Q4 2020 | FY 2020 | Q1 2021 |
| Euro (EUR) | 0.88 | 0.89 | 0.90 | 0.90 | 0.89 | 0.91 | 0.91 | 0.86 | 0.84 | 0.88 | 0.83 |
| Brazilian Real (BRL) | 3.77 | 3.92 | 3.97 | 4.12 | 3.94 | 4.46 | 5.38 | 5.38 | 5.40 | 5.15 | 5.47 |
| Mexican Peso (MXN) | 19.20 | 19.12 | 19.44 | 19.25 | 19.25 | 20.00 | 23.33 | 22.09 | 20.55 | 21.49 | 20.33 |
| Colombian Peso (COP) | 3,135.29 | 3,240.94 | 3,340.81 | 3,408.36 | 3,281.35 | 3,534.22 | 3,847.83 | 3,732.36 | 3,663.43 | 3,694.46 | 3,552.49 |
| Chilean Peso (CLP) | 667.01 | 683.69 | 705.50 | 754.86 | 702.77 | 802.78 | 823.43 | 780.80 | 761.68 | 792.17 | 723.99 |
| Peruvian Soles (PEN) | 3.32 | 3.32 | 3.34 | 3.36 | 3.34 | 3.40 | 3.43 | 3.55 | 3.60 | 3.50 | 3.66 |
| Argentinean Peso (ARS) | 39.05 | 43.91 | 50.56 | 59.38 | 48.22 | 61.55 | 67.64 | 73.31 | 80.06 | 70.64 | 88.55 |
| 16 |