UNITED STATES
SECURITIES AND EXCHANGE COMMISSION
Washington, D.C. 20549
FORM 6-K/A
Report of Foreign Private Issuer
Pursuant to Rule 13a-16 or 15d-16 of the
Securities Exchange Act of 1934
For the month of May, 2022
Commission File Number 001-36671
Atento S.A.
(Translation of Registrant's name into English)
1 rue Hildegard Von Bingen
L-1282, Luxembourg
Grand Duchy of Luxembourg
(Address of principal executive office)
Indicate by check mark whether the registrant files or will file annual reports under cover of Form 20-F or Form 40-F.
Form 20-F: x Form 40-F: o
Indicate by check mark if the registrant is submitting the Form 6-K in paper as permitted by Regulation S-T Rule 101(b)(1):
Yes: o No: x
Note: Regulation S-T Rule 101(b)(1) only permits the submission in paper of a Form 6-K if submitted solely to provide an attached annual report to security holders.
Indicate by check mark if the registrant is submitting the Form 6-K in paper as permitted by Regulation S-T Rule 101(b)(7):
Yes: o No: x
Note: Regulation S-T Rule 101(b)(7) only permits the submission in paper of a Form 6-K if submitted to furnish a report or other document that the registrant foreign private issuer must furnish and make public under the laws of the jurisdiction in which the registrant is incorporated, domiciled or legally organized (the registrant’s “home country”), or under the rules of the home country exchange on which the registrant’s securities are traded, as long as the report or other document is not a press release, is not required to be and has not been distributed to the registrant’s security holders, and, if discussing a material event, has already been the subject of a Form 6-K submission or other Commission filing on EDGAR.

NEW YORK, May 3, 2022 – Atento S.A. (NYSE: ATTO, “Atento” or the “Company”), one of the world’s five largest providers of customer relationship and business process outsourcing (CRM / BPO) services and sector leader in Latin America. On March 30, 2022, Atento S.A. announced its fiscal 2021 fourth quarter and full year results. The results announced were management’s expectations at such time of the results Atento would subsequently report in its audited financial statements included in its annual report on Form 20-F, filed with the U.S. Securities and Exchange Commission. Atento recognizes revenue on an accrual basis for services provided during a fiscal period based on an amount of consideration to which Atento expects to be entitled in exchange for those services. Between announcing its results on March 30, 2022 and filing its annual report on Form 20-F, Atento revised the amount it expected to receive in exchange for services provided during the quarter to further reflect the impact of the cyberattack disruption on its Brazil operations. This revision decreased reported EBITDA and related amounts for the fiscal 2021 fourth quarter and full year from what was announced on March 30, 2022. A revised announcement reflecting this change is included in this Form 6-K.
Atento Reports Fiscal 2021 Fourth Quarter and Full Year Results
2021 revenue up 7.9% on recurring basis, with balanced contribution from Telefónica and Multisector
Annual Recurring EBITDA growth of 23.7%, with Recurring EBITDA margin of 12.9% and 15.5% in fourth quarter
Cyberattack has non-recurring revenue impact of $34.8 million in fourth quarter, following three quarters of solid revenue and EBITDA growth
Total Annual Value of sales of new business rises 20% to record $215 million
US annual revenue up 34% to $114.8 million, with US and EMEA representing 26% of recurring 2021 EBITDA
Reinforced presence in key growth sectors such as tech, healthcare and fintech, which accounted for 54%, 16% and 11% of new wins in 2021 and represented 37% of sales
Secured and extended key agreements with Telefónica, while expanding share of wallet
Latin America’s higher inflation, interest rates and currency fluctuations increased financing costs, and impacting 2021 shareholder equity and free cash flow
NEW YORK, May 3, 2022 – Atento S.A. (NYSE: ATTO) (“Atento” or the “Company”), one of the five largest providers of Customer Relationship Management and Business Process Outsourcing (CRM / BPO) services worldwide and sector leader in Latin America, announced today its fourth quarter and full year operating and financial results for the period ending December 31, 2021. All comparisons in this announcement are year-over-year (YoY) and in constant-currency (CCY), unless otherwise noted.
Total Annual Value of Sales (TAV) rise to record
| • | TAV increased 20% to $215 million, growing 59% in US |
| • | New In-Year revenue for new business rose 21%, increasing 69% in the US |
| • | Cyberattack disruption on Brazil operations resulted in $34.8 million in lost revenue |
| • | Annual revenue grew 5.3% to $1.45 billion, up 7.9% on a recurring basis (excluding impact of cyberattack) |
| • | Annual Multisector sales rose 5.4%, increasing 11.7% and 8.4% in the Americas and EMEA, respectively, while declining 3.1% in Brazil; Recurring Brazil Multisector sales grew 1.1% |
| • | Telefónica (TEF) sales grew 5.3% in 2021, or 9.1% on a recurring basis, as share of wallet continued to grow |
| • | Key service agreements with TEF were secured and extended |
| • | Atento won 61 new clients in 2021, with sales in fast-growing tech, healthcare and fintech sectors accounting for 54%, 16% and 11% of new wins, respectively, and representing 37% of total annual sales in 2021 |
| • | US revenues increased 34.1% to $114.8 million in 2021 |
| • | Hard-currency revenues expand 220 bps to 24% of 2021 revenue and 26% of EBITDA |
| 1 |  |
Strong recurring and hard currency EBITDA
| • | 2021 Recurring EBITDA rose 23.7% to $191.9 million and with corresponding margin expanding 150 bps to 12.9%, mainly on 240 bps increase in Brazil. 2021 EBITDA declined 6.1% to $145.8 million |
| • | 4Q Recurring EBITDA down slightly to $50.8 million and with margin expanding 110 bps to 15.5%. 4Q EBITDA decreased 90.8% to $4.7 million, mainly due to the $34.8 million in lost revenue in Brazil and 11.3 million in costs related to the cyberattack |
| • | US EBITDA of $4.7 million in Q4 and $22.1 million in 2021, up 60.3% and representing 14.7% of consolidated EBITDA, with EBITDA Margin at 10.9% in Q4 and 14.1% for the year, 320 bps higher than in 2020 |
| • | Hard currency EBITDA represented 26% of total EBITDA at year-end, up 600 bps, mainly due to US expansion |
| • | Recurring Net Loss of $1.6 million in Q4 and net loss of $46.3 million in 2021 |
| • | Reported EPS of -$3.29 in Q4 and -$6.61 in 2021, mainly due to $46.1 million impact of cyberattack and $45.7 million of net financial expense |
Debt leverage and maturity profile remain healthy
| • | At year-end 2021, net debt-to-EBITDA was 4.0x, or 3.1x when excluding EBITDA impact of cyberattack |
| • | Solid cash position of $129 million, including $56 million drawdown in revolving credit facilities |
| • | At December 31, 2021, shareholders’ equity was -$12.9 million, partly impacted by $85.1 million in non-cash items consisting of -$42.8 million of balance sheet and P&L conversion as well as -$42.3 million change in fair value of derivatives instruments |
Solid improvements in ESG performance
| • | Scope 1 carbon emissions decreased 16% in 2021 |
| • | Approximately 60% of Company’s energy comes from renewable resources |
| • | New record for client satisfaction, which increased 280 bps versus 2020 |
| • | Improved gender equality, with women comprising approximately 50% of management team |
Update on Cybersecurity measures
| • | Reinforced cybersecurity protection, detection, and remediation measures |
| • | Closed partnership agreements with best-in-class cyber security providers such as CrowdStrike and Microsoft, providing additional security for Company and customers |
| • | Establishing best practices and working closely with defense groups and agencies to improve early warning and threat preparedness |
Summarized Consolidated Financials
| ($ in millions except EPS) | Q4 2021 | Q4 2020 | CCY
Growth (1) | 2021 | 2020 | CCY
Growth (1) |
| Income Statement (6) | | | | | | |
| Revenue | 327.2 | 369.6 | -7.4% | 1,449.2 | 1412.3 | 5.3% |
| Recurring EBITDA (2) | 50.8 | 53.5 | -0.6% | 191.9 | 161.2 | 23.7% |
| Recurring EBITDA Margin | 15.5% | 14.5% | 1.1 p.p | 12.9% | 11.4% | 1.5 p.p |
| Recurring Net Income/Loss (2) | (1.6) | 4.8 | N.M. | (48.2) | (9.9) | N.M. |
| | | | | | | |
| EBITDA (2) | 4.7 | 53.5 | -90.8% | 145.8 | 161.2 | -6.1% |
| EBITDA Margin | 1.4% | 14.5% | -13,1 p.p. | 10.1% | 11.4% | -1.3p.p. |
| Net Loss (3) | (46.3) | (8.0) | N.M. | (93.0) | (46.9) | 100% |
| Earnings Per Share on the reverse split basis (2) (3) (5) | ($3.29)) | ($0.57) | N.M. | ($6.61) | ($3.33) | 98.4% |
| Recurring EPS on the reverse split basis (2) (5) | ($2.43) | $0.34 | N.M. | ($1.01) | ($0.71) | 42.2% |
| Cash Flow, Debt and Leverage | | | | | | |
| Net Cash Used in Operating Activities | 1.1 | 58.8 | | 42.3 | 127.0 | |
| Cash and Cash Equivalents | 128.8 | 209.0 | | | | |
| Net Debt (4) | 589.6 | 518.8 | | | | |
| Net Leverage (4) | 4.0x | 3.2x | | | | |
(1) Unless otherwise noted, all results are for Q4; all revenue growth rates are on a constant currency basis, year-over-year; (2) Recurring EBITDA, Recurring Net Income/Recurring Earnings per Share (EPS) are Non-GAAP measures adjusted only for the cyberattack impact; (3) Reported Net Income and Earnings per Share (EPS) include the impact of non-cash foreign exchange gains/losses on intercompany balances; (4) Includes IFRS 16 impact in Net Debt and Leverage; (5) Earnings per share and Recurring Earnings per share in the reverse split basis is calculated with weighted average number of ordinary shares outstanding. (6) The following selected financial information are unaudited.
| 2 | |
Message from CEO and CFO
Like so many companies in the current era, including some of the world’s technology leaders, we were struck by a cyberattack, which impacted our fourth quarter results. This impact proved to be far greater than we initially expected, due the complexities of these events and how the aftershocks manifest themselves.
Nevertheless, the fundamentals of our business remain strong, as our recurring results demonstrate, and we remain focused on our growth strategy, which has proven to be highly effective over the last two and a half years. We will overcome what we consider to be a temporary setback to our business, as we are an agile and resilient company. Throughout the pandemic, we consistently demonstrated these valuable traits.
Last year, we delivered three quarters of outperformance prior to the cyberattack and also outperformed on every key metric. We expanded in higher-growth, higher margin verticals in Latam and the US, while generating higher levels of hard currency revenues. At the same time, we delivered a greater proportion of higher value next-generation services to Telefónica, while expanding volumes and renewing agreements with this key client. During the year, we also continued to strengthen operationally, enhance our digital capabilities, and drive innovation to broaden our portfolio of CX and BPO services.
We expect to regain momentum in the second half of the year, although we have lowered slightly the ranges of our margin and leverage targets that we set under our Three Horizon Plan. We have ramped up our much-improved sales organization and expect to replenish and grow volumes during the year, volumes that also carry higher margins, consistent with our strategy. Additionally, we are accelerating ongoing efficiency initiatives to further reduce our cost structure as well as improve our effectiveness as an organization, in terms of methodologies, best practices and technologies. We are also moving aggressively to reduce our cost of debt capital.
In summary, Atento remains a far more agile company and is better positioned in the Americas’ growing CX market than when we launched our growth plan. We expect to perform at an even higher level this year than last, resuming the same profitable growth trajectory that we achieved and maintained most of last year.
| Carlos López-Abadía | | José Azevedo |
| Chief Executive Officer | | Chief Financial Officer |
Fourth Quarter and Full Year Consolidated Financial Results
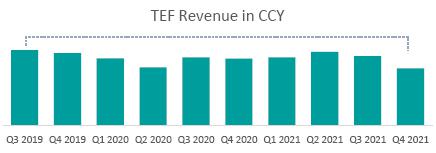
Atento’s fourth quarter revenue decreased 7.4% to $327.2 million, mainly due to disruptions caused by the previously announced cyberattack that affected the Company’s Brazil operations. This resulted in $34.8 million in lost revenue, with Multisector and TEF sales decreasing 6.0% and 10.4%, respectively, led by declines in Brazil. The consolidated revenue decrease was partially offset by a 7.5% increase in Americas revenue, with Multisector and TEF revenues increasing 7.3% and 8.0%, respectively, in this market. When excluding the non-recurring cyber event, total fourth quarter revenue would have increased 2.5% to $362.0 million, with Multisector sales increasing 1.7% and TEF revenue increasing 4.2%.
The Company’s annual revenue increased 5.3% to $1.45 billion, with Multisector sales increasing 5.4% and TEF sales rising 5.3%. Revenue growth was led by the Americas, which increased 11.7%, with Multisector and TEF revenue increasing 14.1% and 7.1%, respectively. When excluding the impact of the cyberattack, annual revenue increased 7.9%, with Multisector sales rising 7.3% and TEF sales increasing 9.1%.
Total Annual Value of Sales of new business increased 20% to $215 million, growing 59% in US, while New In-Year revenue rose 21%, increasing 69% in the US.
US revenues increased 34.1% to $114.8 million, with sales growth in EMEA also contributing to a 220 bps expansion in hard currency revenues, which represented 24% of Atento’s 2021 revenue on a recurring basis.
Atento won a total of 61 new clients in 2021, with fast-growing tech, healthcare and fintech clients accounting for 54% 16% and 11% of new wins, respectively, and representing 37% of total annual sales at December 31, 2021.
| 3 | |
Atento’s fourth quarter consolidated EBITDA decreased 90.8% to $4.7 million, with the margin decreasing 131 bps to 1.4%, mainly due to the aforementioned cyberattack that impacted the Company’s operations in Brazil and resulted in $34.8 million in lost revenue and $11.3 million in related protection, detection and remediation costs. Full-year EBITDA decreased 6.1% to $145.8 million, mainly due to a 36.5% decrease in Brazil, while Americas and EMEA EBITDA increased 15.5% and 72.7%, respectively. For the year, the EBITDA margin decreased 130 bps to 10.1%.
In the Americas, EBITDA decreased 8.7% to $14.3 million in the quarter, due to higher variable operating costs related to increased absentee rates in Argentina and Peru. For the year, Americas EBITDA rose 15.5% to $59.5 million, representing 40.8% of consolidated EBITDA at year-end. Atento’s hard currency EBITDA represented 26% of total Recurring EBITDA at year-end, up 600 bps, mainly due to sales growth in the US market.
On a recurring basis, fourth quarter EBITDA decreased 0.6% to $50.8 million, with Brazil EBITDA increasing 8.4% and Americas EBITDA decreasing 5.4%, due to the aforementioned absentee rates. The comparable EBITDA margin would have been 15.5%, up 110 bps, with the Brazil margin rising 90 bps to 19.6% and the Americas margin decreasing 100 bps to 9.1%. Comparable full-year EBITDA increased 23.7%, due to increases in Brazil, Americas and EMEA, which rose 26.2%, 5.5% and 72.7%, respectively. On the same recurring basis, the 2021 EBITDA margin expanded 150 bps to 12.9%, mainly due to margin expansion of 240 bps to 15.4% in Brazil, where the revenue mix continued to improve with a greater proportion of higher-value services delivered to TEF.
The Company reported a recurring Net Loss of -$1.6 million in the fourth quarter and -$46.3 million in 2021. Fourth quarter reported EPS was -$3.29, bringing full-year EPS to -$6.61, mainly due to the $46.1 million impact of cyberattack and to net financial expenses of $2.60 million and $45.7 million, respectively.
2021 free cash flow was negative $55.5 million, primarily due to cyberattack impact of $25.1 million, one-time refinance costs of $21 million and $20 million taxes postponed under 2020 Covid relief programs. When excluding these items, free cash flow was $10.5 million for the year, compared to $39.9 million in 2020.
On December 31, 2021, Atento held $129 million in cash, including $56 million in existing credit revolvers, with net debt totaling $589 million. Net debt-to-EBITDA was 4.0x, or 3.1x when excluding one-time EBITDA impact of the cyberattack.
On December 31, 2021, shareholders’ equity was negative $12.9 million, mainly due to $134 million in financial items and $42.8 million of balance sheet and P&L conversion. Of note, $85.1 million that impacted shareholders’ equity was non-cash items consisting of -$42.8 million of balance sheet and P&L conversion and -$42.3 million change in fair value of derivatives instruments.
Segment Reporting
Brazil
| ($ in millions) | Q4 2021 | Q4 2020 | CCY growth | 2021 | 2020 | CCY Growth |
| Brazil Region | | | | | | |
| Revenue | 111.5 | 148.5 | -22.2% | 568.8 | 600.9 | -0.2% |
| Recurring1 EBITDA | 28.7 | 27.8 | 8.4% | 92.8 | 78.2 | 26.2% |
| Recurring1 EBITDA Margin | 19.6% | 18.7% | 0.9 p.p. | 15.4% | 13.0% | 2.4 p.p. |
| | | | | | | |
| EBITDA | (17.4) | 27.8 | N.M | 46.7 | 78.2 | -36.5% |
| EBITDA Margin | (15.6%) | 18.7% | -34.3 p.p. | 8.2% | 13.0% | -4.8 p.p. |
| Profit/(loss) for the period | (34.2) | (0.3) | N.M. | (39.8) | (21.7) | 93.7% |
1 Excludes $46.1 million impact of cyberattack
| 4 | |
| Brazil Revenue Mix | 2021 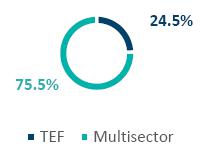 | 2020 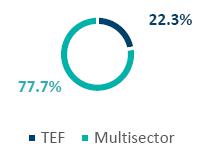
|
Fourth quarter revenue in Brazil decreased 22.2% to $111.5 million, due to the cyberattacks disruption of the Company’s operations in the country. Multisector and TEF sales declined 17.5% and 39.0%, respectively. When excluding the $34.8 million impact of the cyberattack, revenue increased 2.0% to $146.3 million, with Multisector sales decreasing 0.7% and TEF sales increasing 11.5%.
The Brazil operation’s EBITDA decreased to -$17.4 million in the fourth quarter, with the corresponding margin decreasing 343 bps to -15.6%, mainly due to $34.8 million in lost revenue and $11.3 million in costs related to the cyberattack. These costs included fees related to protection, detection, and remediation measures. When excluding the impact of the cyberattack, EBITDA increased 8.4% to $28.7 million, with the margin expanding 90 bps to 19.6%.
Annual revenue totaled $568.8 million in Brazil, down 0.2% compared to 2020. EBITDA decreased 36.5% to $46.7 million in 2021, with the margin contracting 480 bps to 8.2%. When excluding the impact of the cyberattack, 2021 revenue and EBITDA increased 5.9% and 26.2% to $603.6 million and $92.8 million, respectively, with the corresponding margin expanding 240 bps to 15.4%.
Americas Region
| ($ in millions) | Q4 2021 | Q4 2020 | CCY growth | 2021 | 2020 | CCY Growth |
| Americas Region | | | | | | |
| Revenue | 157.7 | 155.3 | 7.5% | 633.9 | 580.5 | 11.7% |
| EBITDA | 14.3 | 15.7 | -5.4% | 59.5 | 52.6 | 15.5% |
| EBITDA Margin | 9.1% | 10.1% | -1.0 p.p. | 9.4% | 9.1% | 0.3 p.p. |
| Profit/(loss) for the period | (5.3) | (2.0) | N.M. | (4.7) | (9.9) | -51.2% |
| Americas Revenue Mix | 2021 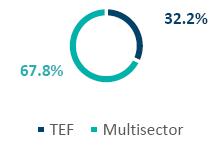 | 2020 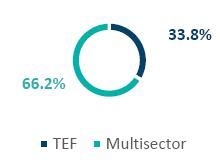 |
In the Americas, Atento’s fourth quarter revenue increased 7.5% to $157.7 million, with full year revenue increasing 11.7% to $633.9 million. During the quarter, Multisector and TEF sales increased 7.3% and 8.0%, respectively. US sales increased 20.4% to $31.0 million in the quarter and rose 34.1% to $114.8 million in 2021. For the year, Multisector and TEF sales increased 14.1% and 7.1%, respectively.
Fourth quarter EBITDA decreased 5.4% to $14.3 million, due to the aforementioned increase in absentee rates in Argentina and Peru, with the margin decreasing 100 bps to 9.1%. For the year, the Americas margin expanded 30 bps to 9.4%.
| 5 | |
EMEA Region
| ($ in millions) | Q4 2021 | Q4 2020 | CCY growth | 2021 | 2020 | CCY Growth |
| EMEA Region | | | | | | |
| Revenue | 57.9 | 66.2 | -8.8% | 250.1 | 234.7 | 3.1% |
| EBITDA | 7.7 | 7.5 | 2.9% | 26.6 | 15.3 | 72.7% |
| EBITDA Margin | 13.3% | 11.3% | 2.0 p.p. | 10.6% | 6.5% | 4.1 p.p. |
| Profit/(loss) for the period | 1.0 | 6.5 | -83.6% | 2.2 | 5.2 | -50.9% |
| EMEA Revenue Mix | 2021 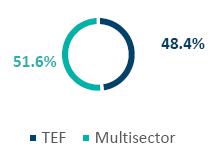
| 2020 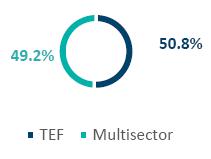
|
During the fourth quarter, EMEA revenue decreased 8.8% to $57.9 million, bringing full year revenue to $250.1 million, up 3.1% compared to 2020. During the year, Multisector sales increased 8.4%, while TEF sales decreased 2.0%.
Fourth quarter EBITDA increased 2.9% to $7.7 million, with the margin expanding 200 bps to 13.3%. For the year, EBITDA increased 72.7% to $26.6 million, with the margin increasing 410 bps to 10.6%, due to effective cost cutting and improved sales margins.
Cash Flow
| Cash Flow Statement ($ in millions) | Q4 2021 | Q4 2020 | 2021 | 2020 |
| Cash and cash equivalents at beginning of period | 145.7 | 196.6 | 209.0 | 124.7 |
| Net Cash from Operating activities | 1.5 | 58.8 | 42.3 | 127.0 |
| Net Cash used in Investing activities | (13.7) | (10.9) | (48.1) | (38.2) |
| Net Cash (used in)/ provided by Financing activities | (0.7) | (35.2) | (60.5) | 1.0 |
| Net (increase/decrease) in cash and cash equivalents | (12.9) | 12.7 | (66.3) | 89.8 |
| Effect of changes in exchanges rates | (4.0) | (0.4) | (13.8) | (5.5) |
| Cash and cash equivalents at end of period | 128.8 | 209.0 | 128.8 | 209.0 |
Indirect Cash Flow View – Q4 2021 ($ in millions)

| 6 | |
Free cash flow decreased during the fourth quarter to negative $25.2 million, mainly due to negative operating cash flow stemming from a $25.1 million impact of the cyberattack, to higher Capex that was postponed in 2020, and to changes in working capital.
Indirect Cash Flow View – FY 2021 ($ in millions)
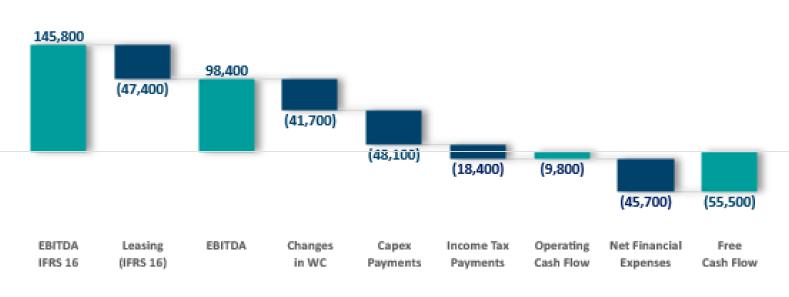
2021 free cash flow was negative $55.5 million, primarily due to cyberattack impact of $25.1 million, one-time refinance costs of $21 million and $20 million taxes postponed under 2020 Covid relief programs.
Normalized Cash Flow View – FY 2021 ($ in millions)
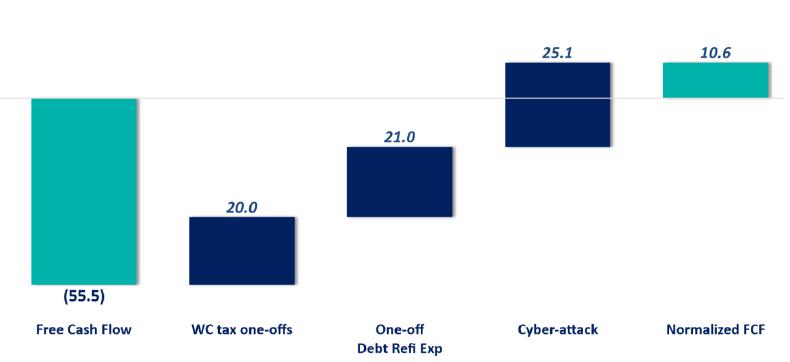
When excluding one-off tax expenses, costs related to the Company’s debt refinancing in February, and impact of cyberattack, free cash flow was $10.6 million for the year, compared to $39.9 million in 2020.
| 7 | |
Indebtedness & Capital Structure
| US$MM | Maturity | Interest Rate | Outstanding Balance Q4 2021 |
| SSN (1) (USD) | 2026 | 8.0% | 503.9 |
| Super Senior Credit Facility | 2021 | 4.5% | 25.0 |
| Other Borrowings and Leases | 2025 | Variable | 32.9 |
| BNDES (BRL) | 2022 | TJLP + 2.0% | 0.6 |
| Debt with Third Parties | | | 562.5 |
| Leasing (IFRS 16) | | | 155.8 |
| Gross Debt (Debt with Third Parties + IFRS 16) | | | 718.3 |
| Cash and Cash Equivalents | | | 128.8 |
| Net Debt | | | 589.5 |
| (1) | Notes are protected by certain hedging instruments, with the coupons hedged through maturity, while the principal is hedged for a period of 3 years. The instruments consist mainly of cross-currency swaps in BRL, PEN and Euro. |
At December 31, 2021, Gross debt totaled $718.3 million, or $562.5 million when excluding lease obligations under IFRS 16. With cash and cash equivalents of $128.8 million, net debt was $589.5 million at year-end. Approximately $79 million in revolving credit facilities were available at the end of 2021, of which $56 million was drawn down.
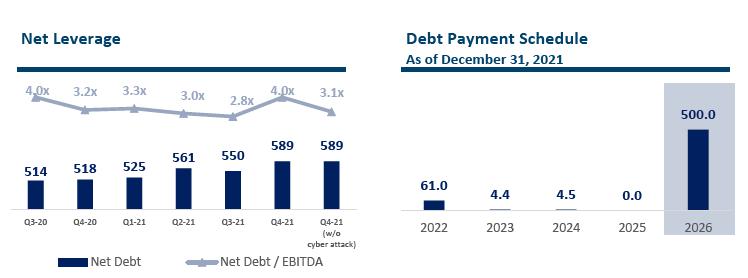
At the end of 2021, net debt-to-EBITDA was 4.0x, or 3.1x when excluding one-time EBITDA impact of the cyberattack. The Company finished the year with a comfortable maturity profile going out to 2026.
Fiscal 2021 and 2022 Guidance
| | 2021 Guidance | 2021 Reported | 2021 Recurring | 2022 Guidance |
| Revenue growth (in constant currency) | Mid-single digit | 5.3% | 7.9% | Mid-single digit |
| EBITDA margin | 12.5%-13.5% | 10.1% | 12.9% | 13%-14% |
| Leverage (x) | 2.5x-3.0x | 4.0x | 3.1x | 2.7x-3.0x |
Management is lowering 2022 EBITDA margin guidance to 13%-14% from 14%-15% and net debt-to-EBITDA to 2.7x-3.0x from 2.0x-2.5x, due to potential residual revenue and cost impacts of the cyberattack against the Company’s Brazil operations,
Share Repurchase Program
During the fourth quarter, Atento did not repurchase shares, bringing total buybacks to 43,708 shares in 2021, for a total cost of $878,000. During the year, the Company vested a total of 202,024 shares issued using treasury shares in relation to management compensation programs. At the end of December 2021, the Company held 850,808 Atento shares in treasury.
| 8 | |
Conference Call
The Company will host a conference call and webcast on Thursday, March 31, 2022 at 10:00 am ET to discuss its financial results. The conference call can be accessed by dialing: USA: +1 (866) 807-9684; UK: (+44) 20 3514 3188; Brazil: (+55) 11 4933-0682; Spain: (+34) 91 414 9260; or International: (+1) 412 317 5415. No passcode is required. Individuals who dial in will be asked to identify themselves and their affiliations The live webcast of the conference call will be available on Atento's Investor Relations website at investors.atento.com (Click here). A web-based archive of the conference call will also be available at the website.
About Atento
Atento is one of the five largest global providers for client relationship management and business process outsourcing services nearshoring for companies that carry out their activities in the United States. Since 1999, the company has developed its business model in 13 countries with a workforce of 150,000 employees. Atento has over 400 clients for which it provides a wide range of CRM/BPO services through multiple channels. Its clients are leading multinational companies in the technology, digital, telecommunications, finance, health, consumer and public administration sectors, amongst others. Atento trades under ATTO on the New York Stock Exchange. In 2019 Atento was recognized by Great Place to Work® as one of the 25 World’s Best Multinational Workplaces and as one of the Best Places to Work in Latin America. For more information www.atento.com
Media Relations
press@atento.com
Investor and analyst inquiries
Hernan van Waveren
+1 979-633-9539
hernan.vanwaveren@atento.com
Forward-Looking Statements
This press release contains forward-looking statements. Forward-looking statements can be identified by the use of words such as "may," "should," "expects," "plans," "anticipates," "believes," "estimates," "predicts," "intends," "continue" or similar terminology. These statements reflect only Atento’s current expectations and are not guarantees of future performance or results. These statements are subject to risks and uncertainties that could cause actual results to differ materially from those contained in the forward-looking statements. In particular, the COVID-19 pandemic, and governments’ extraordinary measures to limit the spread of the virus, are disrupting the global economy and Atento’s industry, and consequently adversely affecting the Company’s business, results of operation and cash flows and, as conditions are recent, uncertain and changing rapidly, it is difficult to predict the full extent of the impact that the pandemic will have. Risks and uncertainties include, but are not limited to, competition in Atento’s highly competitive industries; increases in the cost of voice and data services or significant interruptions in these services; Atento’s ability to keep pace with its clients' needs for rapid technological change and systems availability; the continued deployment and adoption of emerging technologies; the loss, financial difficulties or bankruptcy of any key clients; the effects of global economic trends on the businesses of Atento’s clients; the non-exclusive nature of Atento’s client contracts and the absence of revenue commitments; security and privacy breaches of the systems Atento uses to protect personal data; the cost of pending and future litigation; the cost of defending Atento against intellectual property infringement claims; extensive regulation affecting many of Atento’s businesses; Atento’s ability to protect its proprietary information or technology; service interruptions to Atento’s data and operation centers; Atento’s ability to retain key personnel and attract a sufficient number of qualified employees; increases in labor costs and turnover rates; the political, economic and other conditions in the countries where Atento operates; changes in foreign exchange rates; Atento’s ability to complete future acquisitions and integrate or achieve the objectives of its recent and future acquisitions; future impairments of our substantial goodwill, intangible assets, or other long-lived assets; and Atento’s ability to recover consumer receivables on behalf of its clients. In addition, Atento is subject to risks related to its level of indebtedness. Such risks include Atento’s ability to generate sufficient cash to service its indebtedness and fund its other liquidity needs; Atento’s ability to comply with covenants contained in its debt instruments; the ability to obtain additional financing; the incurrence of significant additional indebtedness by Atento and its subsidiaries; and the ability of Atento’s lenders to fulfill their lending commitments. Atento is also subject to other risk factors described in documents filed by the comp any with the United States Securities and Exchange Commission.
These forward-looking statements speak only as of the date on which the statements were made. Atento undertakes no obligation to update or revise publicly any forward-looking statements, whether as a result of new information, future events or otherwise.
| 9 | |
SELECTED FINANCIAL DATA:
The following selected financial information are based on management's review of operations for period ended December 31, 2021
Consolidated Statements of Operations for the Three and Twelve Months Ended December 31, 2020 and 2021
| | For the three months ended December 31 | | | For the twelve months ended December 31 | | |
($ million, except percentage changes) | 2021 | 2020 | Change (%) | Change excluding FX (%) | 2021 | 2020 | Change (%) | Change excluding FX (%) |
| | (unaudited) | | | (unaudited) | | |
| Revenue | 327.2 | 369.6 | (11.5) | (7.4) | 1,449.2 | 1,412.3 | 2.6 | 5.3 | |
| Other operating income | 5.4 | 2.5 | 112.1 | 124.3 | 10.5 | 5.6 | 89.1 | 93.9 | |
| Other gains and own work capitalized | 0.0 | 0.1 | N.M. | N.M. | 0.0 | 0.1 | (64.0) | (100.3) | |
| Operating expenses: | | | | | | | | | |
| Supplies | (38.0) | (21.1) | 80.2 | 87.9 | (109.8) | (72.3) | 51.9 | 55.4 | |
| Employee benefit expenses | (258.0) | (266.5) | (3.2) | (1.4) | (1,102.7) | (1,060.4) | 4.0 | 6.6 | |
| Depreciation | (19.0) | (17.9) | 6.0 | 10.3 | (73.2) | (73.9) | (0.9) | (1.6) | |
| Amortization | (24.5) | (12.8) | 90.9 | 99.2 | (60.1) | (47.0) | 27.9 | 31.4 | |
| Changes in trade provisions | (0.7) | (1.8) | (62.7) | (60.8) | 0.3 | (5.3) | (105.6) | (105.6) | |
| Impairment Charges | (2.0) | 0.0 | N.M. | N.M. | (2.0) | 0.0 | N.M. | N.M. | |
| Other operating expenses | (29.2) | (29.3) | (0.3) | (2.9) | (99.9) | (118.7) | (15.8) | (13.6) | |
| Total operating expenses | (371.4) | (349.4) | 6.3 | 11.2 | (1,447.3) | (1,377.6) | 5.1 | 7.7 | |
| | | | | | | | | | |
| Finance income | 4.0 | 2.7 | 50.0 | 71.5 | 15.5 | 15.7 | (1.1) | 8.0 | |
| Finance costs | (27.2) | (18.7) | 45.6 | 50.0 | (91.9) | (70.3) | 30.7 | 33.2 | |
| Change in fair value of financial instruments | (1.1) | 0.0 | N.M. | N.M. | (42.3) | 0.0 | N.M. | N.M. | |
| Net foreign exchange loss | 4.4 | (9.7) | (145.5) | (149.4) | 17.7 | (27.8) | N.M. | N.M. | |
| | | | | | | | | | |
| Profit/(loss) before income tax | (58.6) | (3.0) | N.M. | N.M. | (88.5) | (42.1) | 110.2 | 113.8 | |
| Income tax benefit/(expense) | 12.3 | (5.0) | N.M. | N.M. | (4.5) | (4.8) | (6.7) | (12.6) | |
| Profit/(loss) for the period | (46.3) | (8.0) | N.M. | N.M. | (93.0) | (46.9) | 98.3 | 100 | |
| Other financial data: | | | | | | | | | |
| EBITDA (1) (unaudited) | 4.7 | 53.5 | (91,3) | (90.8) | 145.8 | 161.2 | (9.6) | (6.1) | |
| | | | | | | | | | | | | | | | |
(1) In considering the financial performance of the business, our management analyzes the financial performance measure of EBITDA at a company and operating segment level, to facilitate decision-making. EBITDA is defined as profit/(loss) for the period from continuing operations before net finance expense, income taxes and depreciation and amortization. EBITDA is not a measure defined by IFRS. The most directly comparable IFRS measure to EBITDA is profit/(loss) for the year/period.
N.M. means not meaningful
| 10 | |
Consolidated Statements of Operations by Segment for the Three and Twelve Months Ended December 31, 2020 and 2021
| ($ in millions, except percentage changes) | For the three months ended December 31, | Change (%) | Change Excluding FX (%) | For the twelve months ended December 31, | Change (%) | Change Excluding FX (%) |
| 2021 | 2020 | 2021 | 2020 |
| Revenue: | (unaudited) | | | (unaudited) | | |
| Brazil | 111.5 | 148.5 | (24.9) | (22.2) | 568.8 | 609.4 | (6.7) | (0.2) |
| Americas | 157.7 | 155.3 | 1.6 | 7.5 | 633.9 | 582.0 | 8.9 | 11.7 |
| EMEA | 57.9 | 66.2 | (12.5) | (8.8) | 250.1 | 234.7 | 6.6 | 3.1 |
| Other and eliminations (1) | 0.1 | (0.4) | (127.9) | (127.1) | (3.6) | (13.8) | (74.1) | (4.5) |
| Total operation revenue | 327.2 | 369.6 | (11.5) | (7.4) | 1,449.2 | 1,412.3 | 2.6 | 5.3 |
| Operating expenses: | | | | | | | | |
| Brazil | (152.8) | (142.9) | 6.9 | 1.7 | (596.6) | (594.5) | 0.4 | 5.7 |
| Americas | (164.8) | (152.8) | 7.9 | 14.3 | (633.8) | (576.7) | 9.5 | 12.3 |
| EMEA | (57.1) | (63.8) | (10.5) | (6.5) | (244.4) | (235.1) | 3.7 | 0.3 |
| Other and eliminations (1) | 3.3 | 10.1 | (67.3) | (63.4) | 27.5 | 28.7 | (14.2) | (3.1) |
| Total operating expenses | (371.4) | (349.4) | 6.3 | 11.2 | (1,447.3) | (1,377.6) | 5.1 | 7.7 |
| EBITDA (2): | | | | | | | | |
| Brazil | (17.4) | 27.8 | N.M) | N.M. | 46.7 | 78.2 | (40.3) | (36.5) |
| Americas | 14.3 | 15.7 | (8.7) | (5.4) | 59.5 | 52.6 | 13.1 | 15.5 |
| EMEA | 7.7 | 7.5 | 2.9 | 5.5 | 26.6 | 15.3 | 73.4 | 72.7 |
| Other and eliminations (1) | 0.1 | 2.5 | (96.0) | (95.4) | 12.9 | 15.1 | (14.4) | (12.1) |
| Total EBITDA (unaudited) | 4.7 | 53.5 | (91.3) | (90.8) | 145.8 | 161.2 | (9.6) | (6.1) |
(1) Included revenue and expenses at the holding-company level (such as corporate expenses and acquisition related expenses), as applicable, as well as consolidation adjustments.
(2) In considering the financial performance of the business, our management analyzes the financial performance measure of EBITDA at a company and operating segment level, to facilitate decision-making. EBITDA is defined as profit/(loss) for the period from continuing operations before net finance expense, income taxes and depreciation and amortization. EBITDA is not a measure defined by IFRS. The most directly comparable IFRS measure to EBITDA is profit/(loss) for the year/period.
| 11 | |
Balance Sheet ($ Thousands)
| ASSETS | December 31, 2021 | December 31, 2020 |
| | (unaudited) | (audited) |
| NON-CURRENT ASSETS | 606,138 | 604,327 |
| | | |
| Intangible assets | 104,886 | 106,643 |
| Goodwill | 91,941 | 103,014 |
| Right-of-use assets | 142,705 | 137,842 |
| Property, plant and equipment | 81,395 | 90,888 |
| Deferred tax assets | 110,102 | 90,850 |
| Non-current financial assets | 57,847 | 59,187 |
| Derivative financial instruments | 12,757 | 11,088 |
| Other taxes receivable | 4,505 | 4,815 |
| | | |
| | | |
| CURRENT ASSETS | 501,638 | 571,796 |
| | | |
| Trade and other receivables | 326,208 | 324,850 |
| Cash and cash equivalents | 128,824 | 208,994 |
| Other taxes receivable | 42,627 | 36,794 |
| Derivative financial instruments | 3,235 | - |
| Other current financial assets | 744 | 1,158 |
| | | |
| | | |
| TOTAL ASSETS | 1,107,776 | 1,176,123 |
| 12 | |
| | | |
| LIABILITIES AND SHAREHOLDERS’ EQUITY | December 31, 2021 | December 31, 2020 |
| | (unaudited) | (audited) |
| | | |
| NON-CURRENT LIABILITIES | 683,543 | 651,662 |
| | | |
| Debt with third parties | 599,262 | 594,636 |
| Derivative financial instruments | 26,302 | 5,220 |
| Provisions and contingencies | 37,672 | 45,617 |
| Non-trade payables | 18,654 | 4,296 |
| Other taxes payable | 1,653 | 1,893 |
| | | |
| CURRENT LIABILITIES | 437,108 | 404,785 |
| | | |
| Debt with third parties | 119,017 | 133,187 |
| Derivative financial instruments | 29,646 | - |
| Trade and other payables | 271,429 | 249,723 |
| Provisions and contingencies | 17,016 | 21,875 |
| | | |
| TOTAL LIABILITIES | 1,120,651 | 1,056,447 |
| | | |
| TOTAL EQUITY | (12,875) | 119,676 |
| 13 | |
Cash Flow ($ million)
| | For the three months ended December 31, | For the twelve months ended December 31, |
| | 2021 | 2020 | 2021 | 2020 |
| | (unaudited) | (unaudited) |
| Operating activities | | | | |
| Loss before income tax | (58.6) | (3.0) | (88.4) | (42.1) |
| Adjustments to reconcile loss before income tax to net cash flows: | | | | |
| Amortization and depreciation | 43.5 | 30.7 | 133.2 | 120.9 |
| Impairment Losses | 2.0 | 0.0 | 2.0 | 0.0 |
| Changes in trade provisions | 0.7 | 1.8 | (0.3) | 5.3 |
| Share-based payment expense | 2.2 | 1.2 | 10.6 | 4.3 |
| Change in provisions | 4.0 | 5.9 | 18.1 | 28.0 |
| Grants released to income | (0.2) | (0.2) | (0.9) | (0.9) |
| Losses on disposal of property, plant and equipment | 0.2 | 0.2 | 0.4 | 0.3 |
| Finance income | (4.0) | (2.7) | (15.5) | (15.7) |
| Finance costs | 27.2 | 18.7 | 91.9 | 70.3 |
| Net foreign exchange differences | 38.2 | 9.7 | (17.7) | 27.8 |
| Change in fair value of financial instruments | (41.2) | 0.0 | 42.3 | 0.0 |
| Change in other (gains)/ losses and own work capitalized | (0.2) | (0.6) | (0.0) | (0.6) |
| | 72.4 | 64.7 | 264.1 | 239.7 |
| Changes in working capital: | | | | |
| Changes in trade and other receivables | 9.8 | 15.3 | (42.6) | 2.2 |
| Changes in trade and other payables | 16.5 | (5.9) | 62.3 | 1.6 |
| Other assets/(payables) | (28.5) | 1.3 | (62.5) | (14.5) |
| | (2.2) | 10.7 | (42.8) | (10.7) |
| | | | | |
| Interest paid | (3.2) | (3.8) | (58.0) | (46.2) |
| Interest received | 0.5 | 0.1 | 12.3 | 11.8 |
| Income tax paid | (1.3) | (3.9) | (18.4) | (11.2) |
| Other payments | (6.1) | (5.9) | (26.3) | (14.3) |
| | (10.1) | (13.5) | (90.5) | (59.9) |
| Net cash flows from operating activities | 1.5 | 58.8 | 42.3 | 127.0 |
| Investing activities | | | | |
| Payments for acquisition of intangible assets | (1.0) | (1.6) | (2.4) | (6.9) |
| Payments for acquisition of property, plant and equipment | (12.7) | (9.3) | (45.7) | (31.3) |
| | | | | |
| Net cash flows used in investing activities | (13.7) | (10.9) | (48.1) | (38.2) |
| Financing activities | | | | |
| Proceeds from borrowing from third parties | 11.0 | 12.1 | 512.7 | 121.8 |
| Repayment of borrowing from third parties | 0.2 | (29.5) | (524.4) | (70.5) |
| Payments of lease liabilities | (11.3) | (17.4) | (45.6) | (48.9) |
| Acquisition of treasury shares | 0.0 | (0.4) | (0.9) | (1.3) |
| Payments for financial instruments | (0.6) | 0.0 | (2.4) | 0.0 |
| Net cash flows provided by/ (used in) financing activities | (0.7) | (35.2) | (60.6) | 1.0 |
| Net (decrease)/increase in cash and cash equivalents | (12.9) | 12.8 | (66.4) | 89.8 |
| Foreign exchange differences | (4.0) | (0.4) | (13.8) | (5.5) |
| Cash and cash equivalents at beginning of period | 145.7 | 196.6 | 209.0 | 124.7 |
| Cash and cash equivalents at end of period | 128.8 | 209.0 | 128.8 | 209.0 |
| 14 | |
Financing Arrangements
Net debt with third parties as of December 31, 2020 and 2021 is as follow:
| ($ million, except Net Debt/ EBITDA)) | On December 31, 2021 | On December 31, 2020 |
| Cash and cash equivalents | 128.8 | 209.0 |
| Debt: | | |
| Senior Secured Notes | 503.9 | 505.6 |
| Super Senior Credit Facility | 25.0 | 30.0 |
| BNDES | 0.6 | 0.6 |
| Lease Liabilities | 155.8 | 151.5 |
| Other Borrowings | 32.9 | 38.9 |
| Total Debt | 718.3 | 726.6 |
| Net Debt with third parties (1) (unaudited) | 589.5 | 517.6 |
| Net Debt/ EBITDA (non-GAAP) (unaudited) | 4.0x | 3.2x |
| (1) | In considering our financial condition, our management analyzes Net debt with third parties, which is defined as total debt less cash and cash equivalents. Net debt with third parties is not a measure defined by IFRS and it has limitations as an analytical tool. Net debt with third parties is neither a measure defined by or presented in accordance with IFRS nor a measure of financial performance and should not be considered in isolation or as an alternative financial measure determined in accordance with IFRS. Net debt is not necessarily comparable to similarly titled measures used by other companies. |
Number of Workstations and Delivery Centers
| | Number of Workstations | Number of Service
Delivery Centers (1) | Headcount |
| | 2021 | 2020 | 2021 | 2020 | 2021 | 2020 |
| Brazil | 47,054 | 49,294 | 31 | 31 | 71,440 | 71,234 |
| Americas | 36,627 | 38,761 | 49 | 49 | 50,587 | 56,021 |
| Argentina (2) | 3,051 | 4,025 | 10 | 12 | 6,590 | 6,636 |
| Central America (3) | 2,896 | 2,842 | 3 | 3 | 5,397 | 5,290 |
| Chile | 1,329 | 2,310 | 3 | 4 | 4,757 | 5,246 |
| Colombia | 10,294 | 9,184 | 11 | 9 | 9,830 | 9,011 |
| Mexico | 11,554 | 10,179 | 15 | 15 | 14,029 | 17,656 |
| Peru | 5,613 | 8,918 | 2 | 3 | 8,134 | 11,084 |
| United States (4) | 1,890 | 1,303 | 5 | 3 | 1,850 | 1,098 |
| EMEA | 6,607 | 5,253 | 17 | 14 | 12,921 | 12,457 |
| Spain (5) | 6,607 | 5,253 | 17 | 14 | 12,921 | 12,457 |
| Corporate | - | - | - | - | 332 | 93 |
| Total | 90,288 | 93,308 | 97 | 94 | 135,280 | 139,805 |
(1) Includes service delivery centers at facilities operated by us and those owned by our clients where we provide operations personnel and workstations (2) Includes Uruguay (3) Includes Guatemala and El Salvador.(4) Includes Puerto Rico. (5) Includes Morroco.
FX Rates
| FX Assumptions (Average) | Q1 2020 | Q2 2020 | Q3 2020 | Q4 2020 | FY 2020 | Q1 2021 | Q2 2021 | Q3 2021 | Q4 2021 | FY 2021 |
| Euro (EUR) | 0.91 | 0.91 | 0.86 | 0.84 | 0.88 | 0.83 | 0.83 | 0.85 | 0.88 | 0.85 |
| Brazilian Real (BRL) | 4.46 | 5.38 | 5.38 | 5.40 | 5.15 | 5.47 | 5.30 | 5.23 | 5.58 | 5.39 |
| Mexican Peso (MXN) | 20.00 | 23.33 | 22.09 | 20.55 | 21.49 | 20.33 | 20.02 | 20.03 | 19.91 | 20.28 |
| Colombian Peso (COP) | 3,534.22 | 3,847.83 | 3,732.36 | 3,663.43 | 3,694.46 | 3,552.49 | 3,693.19 | 3,845.19 | 3,981.16 | 3,741.97 |
| Chilean Peso (CLP) | 802.78 | 823.43 | 780.80 | 761.68 | 792.17 | 723.99 | 716.30 | 771.23 | 850.25 | 759.14 |
| Peruvian Soles (PEN) | 3.40 | 3.43 | 3.55 | 3.60 | 3.50 | 3.66 | 3.80 | 4.05 | 4.00 | 3.88 |
| Argentinean Peso (ARS) | 61.55 | 67.64 | 73.31 | 80.06 | 70.64 | 88.55 | 94.06 | 97.24 | 102.72 | 95.08 |
| 15 | |
SIGNATURES
Pursuant to the requirements of the Securities Exchange Act of 1934, the registrant has duly caused this report to be signed on its behalf by the undersigned, thereunto duly authorized.
| | ATENTO S.A. |
| Date: May 3, 2022. | | |
| | By: | /s/ Carlos López-Abadía |
| | Name: Carlos López-Abadía |
| | Title: Chief Executive Officer |
| | | |
| | By: | /s/ José Antonio de Sousa Azevedo |
| | Name: José Antonio de Sousa Azevedo |
| | Title: Chief Financial Officer |