UNITED STATES
SECURITIES AND EXCHANGE COMMISSION
Washington, D.C. 20549
FORM 6-K
Report of Foreign Private Issuer
Pursuant to Rule 13a-16 or 15d-16 of the
Securities Exchange Act of 1934
For the month of September, 2022
Commission File Number 001-36671
Atento S.A.
(Translation of Registrant's name into English)
1 rue Hildegard Von Bingen
L-1282, Luxembourg
Grand Duchy of Luxembourg
(Address of principal executive office)
Indicate by check mark whether the registrant files or will file annual reports under cover of Form 20-F or Form 40-F.
Form 20-F: x Form 40-F: o
Indicate by check mark if the registrant is submitting the Form 6-K in paper as permitted by Regulation S-T Rule 101(b)(1):
Yes: o No: x
Note: Regulation S-T Rule 101(b)(1) only permits the submission in paper of a Form 6-K if submitted solely to provide an attached annual report to security holders.
Indicate by check mark if the registrant is submitting the Form 6-K in paper as permitted by Regulation S-T Rule 101(b)(7):
Yes: o No: x
Note: Regulation S-T Rule 101(b)(7) only permits the submission in paper of a Form 6-K if submitted to furnish a report or other document that the registrant foreign private issuer must furnish and make public under the laws of the jurisdiction in which the registrant is incorporated, domiciled or legally organized (the registrant’s “home country”), or under the rules of the home country exchange on which the registrant’s securities are traded, as long as the report or other document is not a press release, is not required to be and has not been distributed to the registrant’s security holders, and, if discussing a material event, has already been the subject of a Form 6-K submission or other Commission filing on EDGAR.
Atento Reports Fiscal 2022 Third Quarter and Nine Month Results
Revenue flat YoY, with sales record in 2Q compensating for current macroeconomic challenges
Total Contract Value of Sales up 10.3%, with strong pipeline, particularly in hard currencies, supporting revenue growth in Q4
EBITDA margin increased 3.3p.p. from previous quarter, reaching 11.1% in 3Q22 coming from 7.8% in 2Q22
Cost efficiency efforts accelerated, mainly encompassing indirect costs and as well as operational improvements, increasing EBITDA by $10m million. Expecting to keep on generating further efficiencies
Strong Operating Cash Flow of $8mm, building on the positive trend in 2Q22. Free Cash Flow of negative $38 million, mainly due to $19.6 million bond coupon payment, $22.5 million cross currency swap expenses and $4.0 million in other interest expenses
Ending cash balance of $66 million, with no other significant payments expected for remainder of 2022 and cash position forecasted to increase in Q4
Successfully renewed all revolving credit facilities in Brazil
Reached lock-up extension with major shareholders committed to growing the Company
Due to challenging macroeconomic conditions, management revising 2022 EBITDA margin guidance range to 10.5% to 11.0% from 11.5% to 12.5% and Leverage Ratio range to 4.0x to 4.5x from 3.0x to 3.5x
NEW YORK, November 15, 2022 – Atento S.A. (NYSE: ATTO) (“Atento” or the “Company”), the largest provider of customer relationship management and business process outsourcing ("CRM BPO") services in Latin America and among the top providers globally, announced today its third quarter operating and financial results for the period ending September 30, 2022. All comparisons in this announcement are year-over-year (YoY) and in constant-currency (CCY), unless otherwise noted.
On track for another great year in TCV sales
| • | Total Contract Value of sales (TCV) increased 10.3% YoY to $86.8 million |
| • | Revenue decreased 0.4% to $346.8 million, mainly due to lower-than-expected volumes related to deteriorating economic conditions in Brazil and Telefónica’s (TEF) cost-cutting program in these challenging macro-economic conditions; all partially offset by inflation pass-through |
| • | Multisector revenue decreased 1.4%, mainly due to a 6.0% decrease in Brazil on volumes below internal forecasts and corporate decision of terminating low margin contracts, partially offset by strong Multisector growth in EMEA |
| • | TEF revenue increased 1.7% on 11.9% and 7.6% increases in the Americas and EMEA, respectively, while decreasing 13.6% in Brazil |
EBITDA margin increased 3.3 p.p. sequentially on improved operational efficiency
| • | On a sequential basis, EBITDA increased 42.1% to $38.4 million in constant currency, mainly due to higher operating efficiencies related to Atento’s cost reduction program as well as to lower severance and ramp-up costs. Year-over-year (YoY), EBITDA decreased 22.7%, mainly due to aforementioned factors in Brazil, partially offset by Multisector growth in EMEA |
| • | EBITDA margin increased 3.3 p.p. sequentially to 11.1%, while contracting 2.8% YoY |
| • | Net profit improved $13.2 million YoY to $1.5 million, or EPS of $0.10, on operating profit of $7.9 million, a $32.4 million improvement in net financial expenses resulting from the appreciation of the US dollar against the Euro, and a $2.7 million change in fair value of currency hedges |
| • | Cash financial costs were $46.1 million, $19.6 million of which was a bond interest payment, $22.5 million in payments related to currency hedges and $4.0 million in other interest expenses |
| • | Operating cash flow was $8.1 million, up sequentially from $7.7 million on lower operating costs and down from $25.9 million in 3Q21 |
| • | Free cash flow was negative $38.0 million, down from $6.7 million in 3Q21, mostly due to aforementioned financial costs related to bond and currency hedges |
| | |
| 1 |  |
Renewed all revolving credit facilities and active cross currency management
| • | Quarter-end cash position of $66 million that includes $76 million drawn from existing credit facilities |
| • | At the end of 3Q22, LTM net debt-to-EBITDA was 6.1x, or 4.3x when excluding one-time impact of cyber costs on EBITDA. LTM leverage ration |
| • | Shareholders’ equity was negative $164.1 million at September 30, 2022, mainly due to $47.4 million in financial items consisting of $20.5 million in balance sheet and P&L conversion, $7.1 million in net financial costs, partially offset by a positive $2.7 million change in the fair value of currency hedges and $1.2 million related to accounting treatment of hedges |
| • | On July 27, 2022, Atento Luxco 1 S.A. unwound the full PEN/USD cross-currency swap entered with Morgan Stanley on March 10, 2021. The proceeds were used to decrease the % CDI with Morgan Stanley BRL swap. The floating leg was reduced from 142.25% to 133.45% CDI (Brazilian Interbank Market Rate). |
Planned annualized cost savings increased to $45 million from $25 million under expanded cost reduction program
| • | Year-to-date, achieved approximately $10 million of $15 million in targeted 2022 cost reductions, resulting from consolidation of service delivery centers, lower headcount, rationalization of third-party services and improved procurement efficiency |
| • | Targeting an additional $20 million in annualized cost savings by reducing additional corporate overhead and further increasing operational efficiency of service delivery |
| • | Inflation pass-through (IPT) at 88% year-to-date |
Opening new call center in Philippines
| • | Major contract won with a global fintech and payments company, following opening of new call center in Philippines |
Summarized Consolidated Financials
| ($ in millions except EPS) | Q3 2022 | Q3 2021 | CCY Growth YoY (1) | Q2 2022 | CCY Growth QoQ (1) | YTD 2022 | YTD 2021 | CCY Growth (1) |
| Income Statement | | | | | | | | |
| Revenue | 346.8 | 368.6 | -0.4% | 363.8 | 1.3% | 1067.2 | 1122.0 | -2.3% |
| EBITDA (2) | 38.4 | 51.3 | -22.7% | 28.5 | 42.1% | 101.9 | 141.1 | -27.0% |
| EBITDA Margin | 11.1% | 13.9% | -2.8 p.p. | 7.8% | 3.3 p.p. | 9.5% | 12.6% | -3.1 p.p. |
| Net Loss (3) | 1.5 | (11.7) | -113.3% | (12.1) | -112.3% | (81.5) | (46.6) | -75.3% |
| Earnings Per Share on the reverse split basis (2) (3) (5) | $0.10 | ($0.83) | N.M. | ($0.83) | N.M. | ($5.58) | ($3.31) | N.M. |
| Cash Flow, Debt and Leverage |
| Net Cash Used in Operating Activities | (13.6) | 26.7 | - | 27.5 | - | (16.9) | 41.1 | - |
| Cash and Cash Equivalents | 66.3 | 145.6 | - | 102.9 | - | 66.3 | 145.6 | - |
| Net Debt (4) | 649.2 | 589.5 | - | 633.1 | - | 649.2 | 589.5 | - |
| Net Leverage (4) | 6.1x | 4.0x | - | 5.3x | - | 6.1x | 4.0x | - |
| Net Leverage (w/o Cyber Q4-21) (4) | 4.3x | 4.0x | - | 3.8x | - | 4.3x | 4.0x | - |
(1) Unless otherwise noted, all results are for Q3; all revenue growth rates are on a constant currency basis, year-over-year; (2) Reported Net Loss and Earnings per Share (EPS) include the impact of non-cash foreign exchange gains/losses on intercompany balances; (3) Includes IFRS 16 impact in Net Debt and Leverage; (4) Earnings per share on the reverse split basis is calculated with weighted average number of ordinary shares outstanding. (5) The following selected financial information are unaudited.
Message from Management
In the face of a more challenging economic environment across the Americas, we have accelerated and expanded the scope of our revenue and cost initiatives to hasten the transformation of Atento’s operational core beyond what we had considered under our growth plan. In addition to another $20 million in annual cost savings that we are targeting, our new sales strategy continues gaining traction, driving high TCV growth in the third quarter that will support Atento’s top line going into 2023 as new clients are onboarded and volumes begin kicking in. And as revenues with existing clients pick up in the seasonally strong fourth quarter, we expect to see a strong sequential quarterly improvement in EBITDA and cash flow.
| | |
| 2 | |
Besides adopting a global account model that has greatly enhanced our ability to sell across markets and more of Atento’s expanding portfolio of solutions, we have become even more aggressive commercially in key growth sectors such as Tech, E-commerce, Healthcare and Travel. These businesses tend to grow faster than many of our traditional Blue-Chip clients, as they need to begin outsourcing many of their CX and back-office functions. Notably, 63% of 2022 sales through September came from new logos.
Our challenges are rooted in the LATAM markets that we serve, with some of these more in our control than others. We are mitigating the impact of inflation through significantly better IPT management, and price competition through a retooled offering. Even adverse political developments can be managed by creating a more agile organization. In the long-term, focusing on our developed market growth objective and particularly US Nearshore will be key to our success. Today, we are truly selling more, selling better and selling what we want. At the same time, we are further reducing Atento’s cost structure. 2022 has been a transformational year during which we have been evolving into a stronger and more resilient company, enabling us to resume our profitable growth trajectory next year as well as establishing a solid foundation for longer-term growth.
Carlos López-Abadía Chief Executive Officer | | Sergio Passos Chief Financial Officer |
Third Quarter Segment Reporting
Brazil
| ($ in millions) | Q3 2022 | Q3 2021 | CCY growth | YTD 2022 | YTD 2021 | CCY growth |
| Brazil Region | | | | | | |
| Revenue | 139.6 | 152.4 | -8.0% | 442.2 | 457.3 | -7.0% |
| EBITDA | 15.1 | 22.7 | -33.4% | 51.8 | 64.1 | -22.7% |
| EBITDA Margin | 10.8% | 14.9% | -4.1 p.p. | 11.7% | 14.0% | -3.3 p.p. |
| Profit/(loss) for the period | (10.4) | (1.2) | N.M. | (10.1) | 0.5 | N.M. |
| Brazil Revenue Mix | 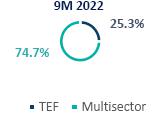
| 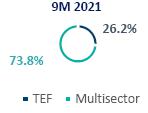 |
Third quarter Brazil revenue decreased 8.0% to $139.6 million, with Multisector and TEF revenues decreasing 6.0% and 13.6%, respectively. Multisector revenues declined on terminated low margin client contracts as well as volumes that were lower than internal projections and related to weakening economic conditions in this market. At the end of the quarter, Multisector revenue accounted for 74.7% of total revenue in Brazil, up 0.9 p.p. compared to the same nine-month period in 2021. The decrease in TEF revenues was mainly due to this client’s cost-cutting program in Brazil, which included renegotiated prices. The decrease in Brazil’s total revenue in the third quarter was partially offset by inflation pass-through.
The Company’s EBITDA in Brazil decreased 33.4% to $15.1 million, with the corresponding margin contracting 4.1 p.p. to 10.8%. The decrease was mainly due to i) lower volumes and pricing; and ii) terminated low margin client contracts.
| | |
| 3 | |
Americas Region
| ($ in millions) | Q3 2022 | Q3 2021 | CCY growth | YTD 2022 | YTD 2021 | CCY growth |
| Americas Region | | | | | | |
| Revenue | 151.7 | 157.8 | 3.4% | 448.1 | 476.2 | -0.2% |
| EBITDA | 14.7 | 15.9 | -3.8% | 31.4 | 45.2 | -27.5% |
| EBITDA Margin | 9.7% | 10.1% | -0.4 p.p. | 7.0% | 9.5% | -2.5 p.p. |
| Profit/(loss) for the period | (2.4) | 2.3 | N.M. | (3.3) | (0.1) | N.M. |
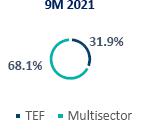
| Americas Revenue Mix | 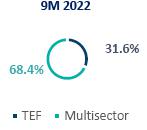
| 
|
In the Americas region, third quarter revenue increased 3.4% to $151.7 million, driven by an 11.9% increase in TEF revenues. The increase in TEF revenues was mainly due to strong volumes in Colombia and Peru, and reflects hyperinflation in Argentina. Despite challenging economic conditions in the region, Multisector revenues decreased only slightly, as reductions in client volumes were limited. Multisector revenues accounted for 68.4% of the region’s total revenue, 0.3 p.p. higher compared to the first nine months of 2021.
Americas EBITDA decreased 3.8% to $14.7 million, with the corresponding margin declining 0.4 p.p. to 9.7%. Although TEF accounted for a higher proportion of revenue in the third quarter, the effect of hyperinflation in Argentina would not translate into higher EBITDA. However, the EBITDA margin in the Argentina business became positive in the third quarter, due to improved operational efficiency.
EMEA Region
| ($ in millions) | Q3 2022 | Q3 2021 | CCY growth | YTD 2022 | YTD 2021 | CCY growth |
| EMEA Region | | | | | | |
| Revenue | 57.9 | 59.4 | 14.1% | 181.6 | 192.2 | 6.0% |
| EBITDA | 5.0 | 5.6 | 4.2% | 10.7 | 18.9 | -36.4% |
| EBITDA Margin | 8.6% | 9.4% | -0.8 p.p. | 5.9% | 9.8% | -3.9 p.p. |
| Profit/(loss) for the period | 2.4 | 2.3 | 25.5% | 1.9 | 0.9 | 146.4% |
| EMEA Revenue Mix | 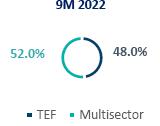 | 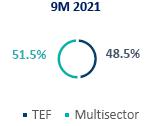
|
Revenue in EMEA increased 14.1% to $57.9 million on a 19.8% increase in Multisector revenues and a 7.6% rise in TEF revenues. Volumes related to new clients in the insurance and energy sectors primarily drove Multisector revenues. TEF volumes were higher, as Atento continued to benefit from this client’s consolidation of service providers earlier in the year. On a nine-month basis, Multisector revenue accounted for 52.0% of total revenue, an increase of 0.5 p.p. compared to the comparable nine-month period in 2021.
EMEA EBITDA increased 4.2% to $5.0 million, while the corresponding margin decreased 0.8 p.p. to 8.6% as a greater mix of onshore volumes in the TEF business, as compared to more profitable offshore business, remained during the quarter. The forecast for 4Q22 projects a greater mix of offshore revenue, which should increase EMEA’s margin.
| | |
| 4 | |
Cash Flow
| Cash Flow Statement ($ in millions) | Q3 2022 | Q3 2021 | YTD 2022 | YTD 2021 |
| Cash and cash equivalents at beginning of period | 102.9 | 153.8 | 128.9 | 209.0 |
| Net Cash from Operating activities | (13.6) | 26.7 | (16.9) | 41.1 |
| Net Cash used in Investing activities | (11.0) | (10.3) | (29.4) | (34.0) |
| Net Cash (used in)/ provided by Financing activities | (13.4) | (14.7) | (16.5) | (59.8) |
| Net (increase/decrease) in cash and cash equivalents | (38.0) | 1.7 | (62.8) | (52.7) |
| Effect of changes in exchanges rates | 1.4 | (9.9) | 0.4 | (10.6) |
| Cash and cash equivalents at end of period | 66.3 | 145.6 | 66.3 | 145.6 |
Indirect Cash Flow View – Q3 2022 ($ in millions)

Third quarter operating cash flow was $8.1 million, up sequentially from $7.7 million and reflecting capex expenditures during this period. Free cash flow was negative $38.0 million, down from $4.5 million in 2Q22, mostly due to a $19.5 million bond interest payment, $22.5 million in payments related to currency hedges, $3.5 million in other interest expenses primarily related to bank credit facilities.
| | |
| 5 | |
Indebtedness & Capital Structure
| US$MM | Maturity | Interest Rate | Outstanding Balance Q3 2022 |
| SSN (USD) | 2026 | 8.0% | 495.1 |
| Super Senior Credit Facilities | 2023 | LIBOR + 3.3% | 43.0 |
| Other borrowings | 2022-2023 | Variable | 45.7 |
| Debt with Third Parties | | | 583.8 |
| Leasing (IFRS 16) | | | 131.7 |
| Gross Debt (Debt with Third Parties + IFRS 16) | | | 715.6 |
| Cash and Cash Equivalents | | | 66.3 |
| Net Debt | | | 649.3 |
| (1) | Notes are protected by certain hedging instruments, with the coupons hedged through maturity, while the principal is hedged for a period of 3 years. The instruments consist mainly of cross-currency swaps in BRL. |
At September 30, 2022, Gross debt totaled $715.6 million, or $583.9 million when excluding lease obligations reported under IFRS 16. With cash and cash equivalents of $66.3 million, net debt was $649.3 million at the end of the quarter.
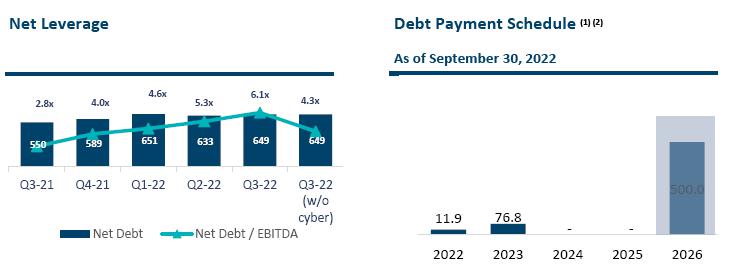
(1) As of September 30, 2022 including only Bank borrowings (Revolving, Senior Secured Notes, IDB) (2) Note: The value of $500 million is the value at maturity. The balance sheet shows the cost of debt minus the cost of issues that are being deferred to maturity |
At the end of the third quarter, LTM net debt-to-EBITDA was 6.1x, or 4.3x when excluding the one-time impact of cyber costs on EBITDA in 4Q21, which will not be reflected in 4Q22 LTM EBITDA.
Management regularly assesses the Company’s level of indebtedness and evaluates its liquidity profile as well as various financing, refinancing and other alternatives to enhance its capital structure and address maturities under existing debt arrangements. In addition, from time to time, management has explored opportunities to obtain financing from third parties, including through a receivables financing facility or other debt facilities permitted to be incurred under the terms of the documents governing Atento’s existing debt arrangements.
| | |
| 6 | |
Earnings /(Loss) Per Share
As of September 30, 2022, the Company’s shares outstanding represented a total amount of 15,451,667 shares. On September 30, 2022, Atento S.A. held a total of 951,957 own shares.
Basic earnings/(loss) per share is calculated by dividing the profit/(loss) attributable to equity owners of the Company by the weighted average number of ordinary shares outstanding during for the three and nine months ended September 30, 2021 and 2021 are as below:
| | For the three months | For the three months |
| Result attributable to equity owners of the Company | 2021 | 2022 | 2021 | 2022 |
| Atento’s Profit/(loss) attributable to equity owners of the parent (in thousands of U.S. dollars) | (11,676) | 1,486 | (46,602) | (81,512) |
| Weighted average number of ordinary shares | 14,103,757 | 14,600,859 | 14,090,577 | 14,600,859 |
| Basic Profit/(loss) per share (in U.S. dollars) | (0.83) | 0.10 | (3.31) | (5.58) |
Fiscal 2022 Guidance
| | YTD22 Reported | 2022 Guidance |
| Revenue growth (in constant currency) | (2.3%) | Flat |
| EBITDA margin | 9.5% | 10.5% - 11.0% |
| Leverage (x) | 6.1x | 4.0x - 4.5x |
Conference Call
Atento will host a conference call and webcast on Wednesday, November 16, 2022, at 8:30 am ET to discuss the Company’s fiscal third quarter 2022 operating and financial results. The conference call can be accessed by dialing: USA: +1 (866) 807-9684; UK: (+44) 20 3514 3188; Brazil: (+55) 11 4933-0682; Spain: (+34) 91 414-9260; or International: (+1) 412 317 5415. No passcode is required. Individuals who dial in will be asked to identify themselves and their affiliations. A live webcast of the conference call will be available on Atento's Investor Relations website at investors.atento.com (Click Here). A web-based archive of the conference call will also be available at the website.
About Atento
Atento is the largest provider of customer relationship management and business process outsourcing ("CRM BPO") services in Latin America and among the top providers globally. Since 1999, the company has developed its business model in 14 countries with a workforce of 131,000 employees. Atento has over 400 clients for which it provides a wide range of CRM/BPO services through multiple channels. Its clients are leading multinational companies in the technology, digital, telecommunications, finance, health, consumer and public administration sectors, amongst others. Atento trades under ATTO on the New York Stock Exchange. In 2019, Atento was recognized by Great Place to Work® as one of the 25 World’s Best Multinational Workplaces and as one of the Best Places to Work in Latin America. In 2021, Everest named Atento a Star Performer, while in 2022 Gartner named the Company a leader fin the Gartner Magic Quadrant for the second consecutive year. For more information www.atento.com
Media Relations
press@atento.com
Investor and analyst inquiries
Hernan van Waveren
+1 979-633-9539
hernan.vanwaveren@atento.com
| | |
| 7 | |
Forward-Looking Statements
This press release contains forward-looking statements. Forward-looking statements can be identified by the use of words such as "may," "should," "expects," "plans," "anticipates," "believes," "estimates," "predicts," "intends," "continue" or similar terminology. These statements reflect only Atento’s current expectations and are not guarantees of future performance or results. These statements are subject to risks and uncertainties that could cause actual results to differ materially from those contained in the forward-looking statements. In particular, the COVID-19 pandemic, and governments’ extraordinary measures to limit the spread of the virus, are disrupting the global economy and Atento’s industry, and consequently adversely affecting the Company’s business, results of operation and cash flows and, as conditions are recent, uncertain and changing rapidly, it is difficult to predict the full extent of the impact that the pandemic will have. Risks and uncertainties include, but are not limited to, competition in Atento’s highly competitive industries; increases in the cost of voice and data services or significant interruptions in these services; Atento’s ability to keep pace with its clients' needs for rapid technological change and systems availability; the continued deployment and adoption of emerging technologies; the loss, financial difficulties or bankruptcy of any key clients; the effects of global economic trends on the businesses of Atento’s clients; the non-exclusive nature of Atento’s client contracts and the absence of revenue commitments; security and privacy breaches of the systems Atento uses to protect personal data; the cost of pending and future litigation; the cost of defending Atento against intellectual property infringement claims; extensive regulation affecting many of Atento’s businesses; Atento’s ability to protect its proprietary information or technology; service interruptions to Atento’s data and operation centers; Atento’s ability to retain key personnel and attract a sufficient number of qualified employees; increases in labor costs and turnover rates; the political, economic and other conditions in the countries where Atento operates; changes in foreign exchange rates; Atento’s ability to complete future acquisitions and integrate or achieve the objectives of its recent and future acquisitions; future impairments of our substantial goodwill, intangible assets, or other long-lived assets; and Atento’s ability to recover consumer receivables on behalf of its clients. In addition, Atento is subject to risks related to its level of indebtedness. Such risks include Atento’s ability to generate sufficient cash to service its indebtedness and fund its other liquidity needs; Atento’s ability to comply with covenants contained in its debt instruments; the ability to obtain additional financing; the incurrence of significant additional indebtedness by Atento and its subsidiaries; and the ability of Atento��s lenders to fulfill their lending commitments. Atento is also subject to other risk factors described in documents filed by the comp any with the United States Securities and Exchange Commission.
These forward-looking statements speak only as of the date on which the statements were made. Atento undertakes no obligation to update or revise publicly any forward-looking statements, whether as a result of new information, future events or otherwise.
| | |
| 8 | |
Selected Financial Data:
The following selected financial information are preliminary, unaudited and are based on management's initial review of operations for the third quarter ended September 30, 2022 and remain subject to the completion of the Company's customary annual closing and review procedures.
Consolidated Statements of Operations for the Three and Nine Months Ended September 30, 2021 and 2022
| | For the three months ended September 30 | For the nine months ended September 30 |
($ million, except percentage changes) | 2022 | 2021 | Change (%) | Change excluding FX (%) | 2022 | 2021 | Change (%) | Change excluding FX (%) |
| | (unaudited) | | | (unaudited) | | |
| Revenue with third parties | 346.8 | 368.6 | (5.8) | (0.3) | 1.067.2 | 1.122.0 | (4.9) | (2.3) |
| Other operating income | 2.1 | 1.9 | 14.1 | 28.0 | 14.0 | 5.2 | N.M. | N.M. |
| Operating expenses: | | | | | | | | |
| Supplies | (35.3) | (22.0) | 60.0 | 69.2 | (92.8) | (71.7) | 29.4 | 31.8 |
| Employee benefit expenses | (255.5) | (271.8) | (6.0) | (0.0) | (818.5) | (844.6) | (3.1) | (0.2) |
| Depreciation | (18.1) | (18.9) | (4.3) | (0.6) | (54.5) | (54.1) | 0.7 | 1.7 |
| Amortization | (12.3) | (11.9) | 3.9 | 6.7 | (37.5) | (35.6) | 5.5 | 6.5 |
| Changes in trade provisions | (0.0) | (0.7) | (99.6) | (99.6) | (0.0) | 0.9 | (102.7) | (102.3) |
| Other operating expenses | (19.6) | (24.6) | (20.2) | (14.6) | (68.1) | (70.7) | (3.7) | (0.2) |
| Operating profit | 7.9 | 20.4 | (61.2) | (60.0) | 9.7 | 51.3 | (81.0) | (80.8) |
| Finance income | 5.7 | 1.9 | N.M | N.M | 10.0 | 11.5 | (12.5) | 1.9 |
| Finance costs | (13.4) | (18.0) | (25.5) | (24.3) | (52.0) | (64.6) | (19.5) | (19.5) |
| Change in fair value of financial instruments | 2.7 | (16.6) | 116.2 | 116.2 | (66.0) | (41.2) | 60.2 | 60.2 |
| Net foreign exchange loss | 12.0 | 7.4 | N.M. | N.M. | 22.1 | 13.2 | N.M. | N.M. |
| Net finance expense | 7.0 | (25.3) | 127.8 | 128.2 | (85.9) | (81.1) | 5.9 | 4.6 |
| Profit/(loss) before income tax | 15.0 | (4.9) | N.M. | N.M. | (76.2) | (29.9) | N.M. | (142.0) |
| Income tax benefit/(expense) | (13.5) | (6.7) | 99.9 | 125.6 | (5.3) | (16.7) | 68.2 | 64.5 |
| Profit/(loss) for the period | 1.5 | (11.7) | 112.7 | 113.2 | (81.5) | (46.6) | (74.7) | (75.3) |
| Other financial data: | | | | | | | | |
| EBITDA (1) (unaudited) | 38.4 | 51.2 | (25.1) | (22.7) | 101.8 | 141.0 | (27.8) | (27.0) |
| | | | | | | | | |
(1) In considering the financial performance of the business, our management analyzes the financial performance measure of EBITDA at a company and operating segment level, to facilitate decision-making. EBITDA is defined as profit/(loss) for the period from continuing operations before net finance expense, income taxes and depreciation and amortization. EBITDA is not a measure defined by IFRS. The most directly comparable IFRS measure to EBITDA is profit/(loss) for the year/period.
N.M. means not meaningful
| | |
| 9 | |
Consolidated Statements of Operations by Segment for the Three and Nine Months Ended September 30, 2021 and 2022
| ($ in millions, except percentage changes) | For the three months ended September 30 | Change (%) | Change Excluding FX (%) | For the nine months ended September 30 | Change (%) | Change Excluding FX (%) |
| 2022 | 2021 | 2022 | 2021 |
| Revenue: | (unaudited) | | | (unaudited) | | |
| Brazil | 139.6 | 152.4 | (8.4) | (8.0) | 442.2 | 457.3 | (3.3) | (7.0) |
| Americas | 151.7 | 157.8 | (3.8) | 3.4 | 448.1 | 476.2 | (5.9) | (0.2) |
| EMEA | 57.9 | 59.4 | (2.6) | 14.1 | 181.6 | 192.2 | (5.5) | 6.0 |
| Other and eliminations (1) | (2.4) | (1.0) | 149.0 | N.M | (4.8) | (3.7) | 30.0 | 38.4 |
| Total revenue | 346.8 | 368.6 | (5.9) | (0.4) | 1.067.2 | 1.122.0 | (4.9) | (2.3) |
| Operating expenses and Other Operation Income/Expenses: | | | | | | | | |
| Brazil | (124.4) | (129.6) | (4.0) | (3.5) | (390.4 | (393.2) | (0.7) | (4.4) |
| Americas | (137.0) | (141.9) | (3.4) | 4.3 | (416.7) | (431.0) | (3.3) | 2.7 |
| EMEA | (52.9) | (53.8) | (1.7) | 15.0 | (171.0) | (173.3) | (1.4) | 10.6 |
| Other and eliminations (1) | 6.0 | 8.0 | (25.4) | (22.4) | 12.7 | 16.5 | (23.3) | (20.1) |
| Total Operating expenses and Other Operation Income/Expenses | (317.4) | (308.4) | (2.8) | 3.3 | (965.3) | (981.0) | (1.6) | 1.3 |
| EBITDA (2): | | | | | | | | �� |
| Brazil | 15.1 | 22.7 | (33.3) | (33.4) | 51.8 | 64.1 | (19.2) | (22.7) |
| Americas | 14.7 | 15.9 | (7.4) | (3.8) | 31.4 | 45.2 | (30.4) | (27.5) |
| EMEA | 5.0 | 5.6 | (11.4) | 4.2 | 10.7 | 18.9 | (43.4) | (36.4) |
| Other and eliminations (1) | 3.6 | 7.1 | (49.3) | (47.6) | 7.9 | 12.9 | (38.6) | (36.5) |
| Total EBITDA (unaudited) | 38.4 | 51.3 | (25.1) | (22.7) | 101.9 | 141.1 | (27.8) | (27.0) |
(1) Included revenue and expenses at the holding-company level (such as corporate expenses and acquisition related expenses), as applicable, as well as consolidation adjustments.
(2) In considering the financial performance of the business, our management analyzes the financial performance measure of EBITDA at a company and operating segment level, to facilitate decision-making. EBITDA is defined as profit/(loss) for the period from continuing operations before net finance expense, income taxes and depreciation and amortization. EBITDA is not a measure defined by IFRS. The most directly comparable IFRS measure to EBITDA is profit/(loss) for the year/period.
IFRS 16 Effect ($ million)
The following table intends to represent the effect of EBITDA before and after IFRS 16 lease accounting standards.
| IFRS 16: Effect | Nine months ended September 30, 2022 | Nine months ended September 30, 2021 |
| EBITDA | 101.9 | 141,1 |
| Lease payments | (40.2) | (35.7) |
| EBITDA w/o IFRS 16 | 61.7 | 105.4 |
| Depreciation & Amortization | (31.0) | (31.8) |
| Finance costs | (9.9) | (9.6) |
| IFRS 16 total (loss)/expense | (40.9) | (41.4) |
| | |
| 10 | |
Balance Sheet ($ Thousands)
| ASSETS | September 30, | December 31, |
| 2022 | 2021 |
| | (unaudited) | (audited) |
| NON-CURRENT ASSETS | 533,851 | 606,138 |
| | | |
| Property, plant and equipment | 72,215 | 81,395 |
| Goodwill | 91,380 | 91,941 |
| Right-of-use assets | 114,958 | 142,705 |
| Intangible assets | 80,292 | 104,886 |
| Trade and other receivables | 26,458 | 22,240 |
| Other non-current assets | 32,949 | 35,607 |
| Derivative financial instruments | 0 | 12,757 |
| Other taxes receivable | 4,211 | 4,505 |
| Deferred tax assets | 111,387 | 110,102 |
| | | |
| CURRENT ASSETS | 458,612 | 501,638 |
| | | |
| Trade and other receivables | 322,243 | 295,309 |
| Current income tax receivable | 21,534 | 30,899 |
| Derivative financial instruments | 0 | 3,235 |
| Other taxes receivable | 47,073 | 42,627 |
| Other current financial assets | 1,454 | 744 |
| Cash and cash equivalents | 66,308 | 128,824 |
| | | |
| TOTAL ASSETS | 992,463 | 1,107,776 |
| | |
| 11 | |
| LIABILITIES AND SHAREHOLDERS’ EQUITY | September 30, | December 31, |
| 2022 | 2021 |
| | (unaudited) | (audited) |
| NON-CURRENT LIABILITIES | 671,306 | 683,542 |
| | | |
| Debt with third parties | 577,530 | 599,262 |
| Derivative financial instruments | 46,370 | 26,302 |
| Provisions and contingencies | 39,376 | 37,672 |
| Non-trade payables | 7,072 | 18,654 |
| Other taxes payable | 957 | 1,653 |
| | | |
| CURRENT LIABILITIES | 485,238 | 437,108 |
| | | |
| Debt with third parties | 138,028 | 119,017 |
| Derivative financial instruments | 45,382 | 29,646 |
| Trade payables | 83,814 | 85,274 |
| Income tax payables | 4,104 | 8,872 |
| Other taxes payable | 92,017 | 88,606 |
| Other non-trade payables | 111,667 | 84,608 |
| Provisions and contingencies | 10,226 | 17,016 |
| | | |
| TOTAL LIABILITIES | 1,156,543 | 1,120,651 |
| | | |
| TOTAL EQUITY | -164,077 | -12,875 |
| | |
| 12 | |
Cash Flow ($ million)
| | For the three months ended September 30, | For the nine months ended September 30, |
| | 2021 | 2022 | 2021 | 2022 |
| | (unaudited) | (unaudited) |
| Operating activities | | | | |
| Profit/(Loss) before income tax | (4.9) | 15.0 | (29.9) | (76.2) |
| Adjustments to reconcile loss before income tax to net cash flows: | | | | |
| Amortization and depreciation | 30.8 | 30.5 | 89.8 | 92.1 |
| Changes in trade provisions | 0.3 | (6.3) | 12.4 | 11.7 |
| Share-based payment expense | 2.2 | (1.8) | 8.4 | 1.4 |
| Finance income | (1.9) | (5.7) | (11.5) | (10.0) |
| Finance costs | 18.0 | 13.4 | 64.7 | 52.0 |
| Net foreign exchange differences | (7.4) | (13.7) | (13.2) | (22.1) |
| Change in fair value of financial instruments | 16.7 | (2.7) | 41.2 | 66.0 |
| | 58.7 | 13.7 | 191.8 | 191.1 |
| Changes in working capital: | | | | |
| Changes in trade and other receivables | (6.9) | (19.7) | (52.4) | (13.7) |
| Changes in trade and other payables | 3.9 | 24.4 | (8.2) | (32.9) |
| | (3.0) | 4.7 | (60.6) | (46.6) |
| | | | | |
| Interest paid | (23.2) | (46.3) | (54.9) | (75.7) |
| Interest received | 4.0 | 0.2 | 11.8 | 0.6 |
| Income tax paid | (4.9) | (0.9) | (17.1) | (10.1) |
| | (24.1) | (47.0) | (60.2) | (85.2) |
| Net cash flows from operating activities | 26.7 | (13.6) | 41.1 | (17.0) |
| Investing activities | | | | |
| Payments for acquisition of intangible assets | (0.5) | (2.0) | (1.0) | (4.4) |
| Payments for acquisition of property, plant and equipment | (9.8) | (9.0) | (33.0) | (25.0) |
| Net cash flows used in investing activities | (10.3) | (11.0) | (34.0) | (29.4) |
| Financing activities | | | | |
| Proceeds from borrowing from third parties | - | - | 501.8 | 183.4 |
| Repayment of borrowing from third parties | (4.8) | - | (523.2) | (159.7) |
| Payments of lease liabilities | (9.8) | (13.4) | (35.7) | (40.2) |
| Payments of financial instruments | - | - | (1.8) | - |
| Acquisition of treasury shares | (0.1) | - | (0.9) | - |
| Net cash flows provided by/ (used in) financing activities | (14.7) | (13.4) | (59.8) | (16.5) |
| Net (decrease)/increase in cash and cash equivalents | 1.7 | (38.0) | (52.7) | (62.8) |
| Effect of exchange rate changes on cash | (9.9) | 1.4 | (10.6) | 0.4 |
| Cash and cash equivalents at beginning of period | 153.8 | 102.9 | 209.0 | 128.8 |
| Cash and cash equivalents at end of period | 145.7 | 66.3 | 145.7 | 66.3 |
| | | | | |
| | |
| 13 | |
Financing Arrangements
Net debt with third parties as of December 31, 2021 and September 30, 2022 is as follow:
| ($ million, except Net Debt/EBITDA LTM) | On December 31, 2021 | On September 30, 2022 |
| Cash and cash equivalents | 128.8 | 66.3 |
| Debt: | | |
| Senior Secured Notes | 503.9 | 495.1 |
| Super Senior Credit Facility | 25 | 43.0 |
| Lease Liabilities | 155.8 | 131.7 |
| Other Borrowings | 33.5 | 45.7 |
| Total Debt | 718.3 | 715.6 |
| Net Debt with third parties (1) (unaudited) | 589.5 | 649.2 |
| Net Debt/ EBITDA LTM(2) (non-GAAP) (unaudited) | 4.0x | 6.1x |
| (1) | In considering our financial condition, our management analyzes Net debt with third parties, which is defined as total debt less cash and cash equivalents. Net debt with third parties is not a measure defined by IFRS and it has limitations as an analytical tool. Net debt with third parties is neither a measure defined by or presented in accordance with IFRS nor a measure of financial performance and should not be considered in isolation or as an alternative financial measure determined in accordance with IFRS. Net debt is not necessarily comparable to similarly titled measures used by other companies. |
| (2) | EBITDA LTM (Last Twelve Months) |
Number of Workstations and Delivery Centers
| | Number of Workstations | Number of Service | Headcount |
| Delivery Centers (1) |
| | 2021 | 2022 | 2021 | 2022 | 2021 | 2022 |
| Brazil | 47,409 | 39,331 | 30 | 27 | 76,969 | 66,916 |
| Americas | 34,555 | 34,756 | 46 | 44 | 54,549 | 48,892 |
| Argentina (2) | 3,132 | 3,133 | 10 | 10 | 6,851 | 6,256 |
| Central America (3) | 2,745 | 2,663 | 3 | 3 | 5,038 | 4,040 |
| Chile | 1,204 | 1,162 | 3 | 3 | 5,041 | 4,852 |
| Colombia | 9,798 | 10,681 | 9 | 8 | 9,807 | 10,076 |
| Mexico | 9,553 | 9,907 | 15 | 15 | 16,609 | 13,861 |
| Peru | 6,887 | 5,939 | 3 | 2 | 9,546 | 8,492 |
| United States (4) | 1,236 | 1,271 | 3 | 3 | 1,657 | 1,315 |
| EMEA | 5,268 | 5,175 | 14 | 14 | 12,870 | 12,456 |
| Spain | 5,268 | 5,175 | 14 | 14 | 12,870 | 12,456 |
| Corporate | - | - | - | - | 130 | 152 |
| Total | 87,232 | 79,262 | 90 | 85 | 144,518 | 128,416 |
| (1) | Includes service delivery centers at facilities operated by us and those owned by our clients where we provide operations personnel and workstations |
| (3) | Includes Guatemala and El Salvador. |
| | |
| 14 | |
FX Rates
| FX Assumptions (Average) | Q3 2021 | Q3 2022 |
| Euro (EUR) | 0.85 | 0.99 |
| Brazilian Real (BRL) | 5.23 | 5.25 |
| Mexican Peso (MXN) | 20.03 | 20.25 |
| Colombian Peso (COP) | 3,845.19 | 4,379.36 |
| Chilean Peso (CLP) | 771.23 | 925.92 |
| Peruvian Soles (PEN) | 4.05 | 3.90 |
| Argentinean Peso (ARS) | 97.24 | 135.72 |
| | |
| 15 | |
SIGNATURES
Pursuant to the requirements of the Securities Exchange Act of 1934, the registrant has duly caused this report to be signed on its behalf by the undersigned, thereunto duly authorized.
| | ATENTO S.A. |
| Date: November 15, 2022. | | |
| | By: | /s/ Carlos López-Abadía |
| | Name: Carlos López-Abadía |
| | Title: Chief Executive Officer |
| | | |
| | By: | /s/ Segio Ricardo Ribeiro Passos |
| | Name: Segio Ricardo Ribeiro Passos |
| | Title: Chief Financial Officer |