 Halyard Health Halyard Health Investor Presentation Exhibit 99.1 |
 2 Legal Disclaimer Legal Disclaimer PRELIMINARY FINANCIAL RESULTS This presentation contains Halyard Health’s preliminary financial results for the quarter ended September 30, 2014. This financial information is preliminary and subject to completion of quarter-end financial reporting processes and review. FORWARD-LOOKING INFORMATION Certain matters in this presentation and in today’s discussion constitute “forward-looking statements” regarding business strategies, market potential, future financial performance and other matters. Forward-looking statements include all statements that do not relate solely to historical or current facts, and can generally be identified by the use of words such as “may,” “believe,” “will,” “expect,” “project,” “estimate,” “anticipate,” “plan,” or “continue” and similar expressions, among others. These forward-looking statements address, among other things, the anticipated effects of Halyard Health’s separation from Kimberly-Clark and the distribution of Halyard Health’s common stock to the shareholders of Kimberly-Clark which is expected to occur on October 31, 2014 (the “spin-off”). The matters discussed in these forward-looking statements are based on the current plans and expectations of management and are subject to certain risks and uncertainties that could cause actual results to differ materially from those projected, anticipated or implied in the forward-looking statements. These risks include but are not limited to actions by governmental and regulatory authorities; delays, costs and difficulties related to the spin-off; and general economic and political conditions globally and in the markets in which Halyard Health does business. There can be no assurance that these future events will occur as anticipated or that Halyard Health’s results will be as estimated. For a description of additional factors that could cause Halyard Health’s future results to differ materially from those expressed in any such forward-looking statements, see “Risk Factors” under Item 1A of Halyard Health’s Registration Statement on Form 10 (as amended) filed with the Securities and Exchange Commission. The forward-looking statements contained in this presentation are made only as of October 21, 2014. We do not undertake, and specifically decline any obligation, to update any forward-looking statements or to publicly announce the results of any revisions to any of such statements to reflect future events or developments except as required by law, including the securities laws of the United States and the rules and regulations of the Securities and Exchange Commission. NOT AN OFFER Nothing contained in this presentation shall be deemed an offer to sell or the solicitation of an offer to buy any securities of Halyard Health, Inc. or Kimberly-Clark Corporation. |
 3 Legal Disclaimer (Continued) Legal Disclaimer (Continued) BASIS OF PRESENTATION The information included in this presentation about Halyard Health assumes the completion of the transfer by Kimberly-Clark of its health care business to the Company and the spin-off of Halyard Health. Halyard Health’s historical financial data presented herein is derived from the consolidated financial statements and accounting records of Kimberly-Clark using the historical results of operations and historical costs basis of the assets and liabilities that comprised its health care business and give effect to allocations of expenses from Kimberly-Clark. This historical financial data is not indicative of our future performance and does not reflect what Halyard Health’s financial position, results of operations and cash flows would have been had it been a separate stand-alone entity. In addition, pro forma financial data is presented herein that is derived by the application of pro forma adjustments to Halyard Health’s historical financial data to effect the spin-off and related transactions as if they had occurred on January 1, 2013. The pro forma adjustments are based on currently available information and certain assumptions that Halyard Health believes are reasonable, but actual results may differ from the pro forma adjustments. A reconciliation of pro forma net sales and pro forma net income to Halyard Health’s historical net sales and net income can be found in the Appendix to this presentation. STATEMENT REGARDING NON-GAAP FINANCIAL MEASURES This presentation contains “non-GAAP financial measures,” that are financial measures that either exclude or include amounts that are not excluded or included in the most directly comparable measures calculated and presented in accordance with generally accepted accounting principles. Specifically, we make use of the non- GAAP financial measures “EBITDA” and “Adjusted EBITDA” and “Pro Forma Adjusted EBITDA.” Management believes that EBITDA and Adjusted EBITDA are useful tools for investors and other users of our financial statements in assessing our ability to service or incur indebtedness, maintain current operating levels of capital assets and acquire additional operations and businesses. Management believes that the most directly comparable GAAP measure is net income (loss). These measures should be considered in addition to results prepared in accordance with GAAP, but are not a substitute for GAAP results. Certain adjustments used in calculating Adjusted EBITDA and Pro Forma Adjusted EBITDA are based on estimates and assumptions of management and do not purport to reflect actual historical results. In addition, you should be aware when evaluating Adjusted EBITDA and Pro Forma Adjusted EBITDA that in the future we may incur expenses similar to those excluded when calculating these measures. Our computation of Adjusted EBITDA may not be comparable to other similarly titled measures computed by other companies, because all companies do not calculate Adjusted EBITDA in the same fashion. A reconciliation of EBITDA and Adjusted EBITDA to our net income (loss) under GAAP for each of the periods presented can be found in the Appendix to this presentation. We also present financial data for the twelve months ended September 30, 2014 that is derived by subtracting the data for the nine months ended September 30, 2013 from our historical financial data for the year ended December 31, 2013 and then adding corresponding financial data for the nine months ended September 30, 2014. This financial data is for informational purposes only and the reconciliation can be found in the Appendix to this presentation. |
 4 Transaction Overview Transaction Overview Company Halyard Health, Inc. Ticker (When-Issued) HYH-WI Ticker (Regular Way) HYH When-Issued Trading Begins Tuesday, October 21 st Record Date Thursday, October 23 rd Spin Effective / Distribution Date Friday, October 31 st Distribution Ratio 8 to 1 (KMB to HYH) Ex-Dividend Date / First Regular Way Day of Trading Monday, November 3 rd Expected Shares Outstanding Approximately 46.5 MM Spin-off Overview and Timing Considerations |
 Today’s Presenters and Halyard Representatives Today’s Presenters and Halyard Representatives 5 Robert Abernathy Chairman & Chief Executive Officer Christopher Lowery SVP & Chief Operating Officer 20+ years of healthcare industry experience in Sales & Marketing, most recently at Covidien Former VP of Global Health Care Sales & Marketing at Kimberly- Clark Steven Voskuil SVP & Chief Financial Officer 20+ years of experience with Kimberly-Clark Former VP of Finance at Kimberly-Clark International Former Treasurer of Kimberly-Clark 20+ years in Kimberly-Clark senior management across all business units and geographies Former President of Global Health Care at Kimberly-Clark, 1997 - 2004 8+ years of experience with Kimberly-Clark Former Senior Finance Director of Health Care at Kimberly-Clark Former Assistant Treasurer of Kimberly- Clark David Crawford VP Treasurer, FP&A and Investor Relations |
 Compelling Investment Opportunity Compelling Investment Opportunity 6 Diverse Business with Leading Positions 1 Global Manufacturing and Sales Organization 2 Strategic Focus Shifts to Medical Devices 3 Proven and Experienced Management Team 5 Significant Cash Flow Generation to Fund Opportunistic Acquisitions and to Drive Total Shareholder Return 4 |
 7 Over 30 Years of Innovation in Medical Products Over 30 Years of Innovation in Medical Products Founded health care business in the late 1970s with a focus on products leveraging Kimberly-Clark’s patented, innovative nonwovens technology providing protection from liquids, while remaining breathable Introduced Kimguard Sterilization Wrap Launched international expansion strategy, leveraging existing regional headquarters in Belgium, Japan and Australia Expanded S&IP product portfolio with the acquisition of Tecnol Medical Products, a leading provider of facial protection and other disposable medical products Increased presence in medical devices with the acquisition of Ballard Medical Products, a disposable medical devices company focused on respiratory care and digestive health Acquired Safeskin Corporation, a market-leading exam glove provider, to deliver head-to-toe customer protection Kimberly-Clark Global Business Plan designates S&IP “run for cash” and emphasizes increased medical device focus Acquired Baylis Medical’s pain management device business and I-Flow Corporation, a provider of elastomeric infusion pumps used in surgical pain management and other infusion therapies Led change in exam glove market from latex to nitrile 1970 1976 1990 1997 1999 2000 2005 2009 2014 2007 |
 Spin-off Benefits and Rationale Spin-off Benefits and Rationale 8 Capital Flexibility Eliminates competition for capital with a larger consumer business Creates greater flexibility to invest in innovation and business development Strategic Health Care Focus Employee Incentives Enables Halyard to pursue its own distinct strategies and operating priorities, which have diverged over time from those of Kimberly-Clark Allows management to concentrate on Halyard’s specific product markets, customers and long-term strategies for value creation Improves ability to attract and retain key employees focused on healthcare Aligns executive incentive programs more directly to financial performance Spin-off Creates a Diversified, Global Med Tech Company with a Growing Medical Device Platform |
 Halyard’s Strategic Vision Halyard’s Strategic Vision 9 Traditional S&IP Focus Has Created a Stable and Reliable Platform with Significant Cash Flow... ...Which We Expect to Enable Halyard to Grow Medical Devices and Transform the Portfolio Over Time |
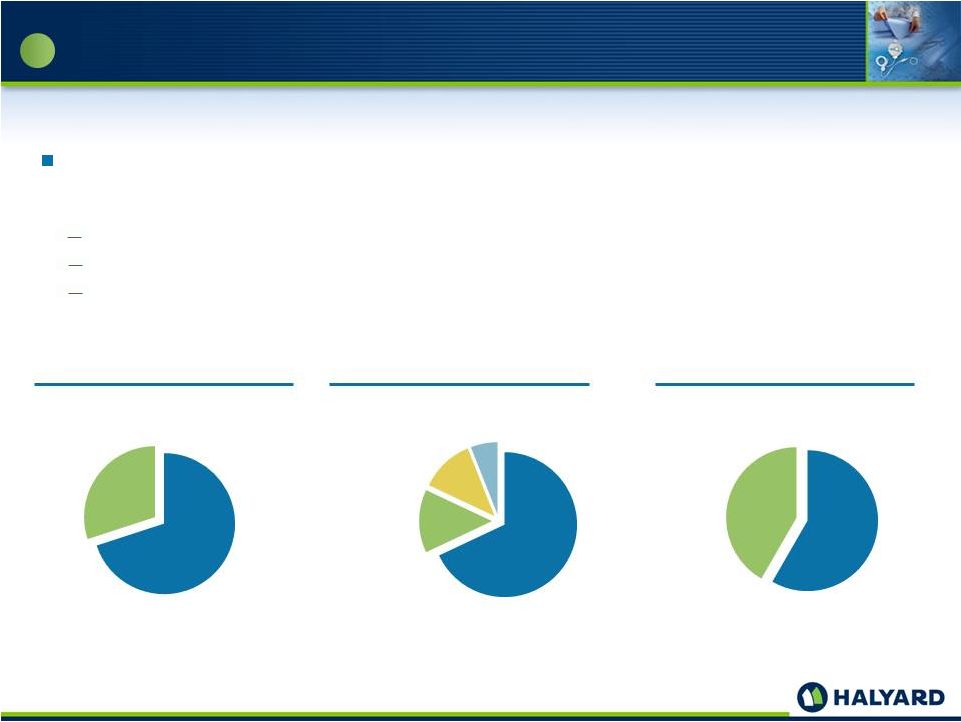 10 Halyard Health Overview – Diverse Business with Leading Positions Halyard Health Overview – Diverse Business with Leading Positions Halyard is a global, market-leading company that addresses some of today’s most important health and healthcare needs, offering products and solutions to prevent infection, eliminate pain and speed recovery across the healthcare continuum $1.7Bn of 2013 net sales 16,500 employees globally (1) Two segments: Surgical & Infection Prevention (S&IP) and Medical Devices North America Europe, Middle East & Africa Asia Pacific & Latin America Other (3) S&IP Medical Devices 1. As part of the previously announced closing of Halyard’s Exam Glove facility in Thailand, Halyard will reduce employee headcount by approximately 3,000 employees. 2. Excludes Corporate and other. 3. Includes related party sales to Kimberly-Clark. 4. Estimated global addressable market size based on industry data and internal marketing estimates. S&IP Medical Devices ($Bn) ~ ~ 1 Net Sales by Segment (2) Net Sales by Region 2013A 2013A Global Addressable Market Potential (4) 70% 30% 68% 14% 12% 6% $7.0 $5.0 |
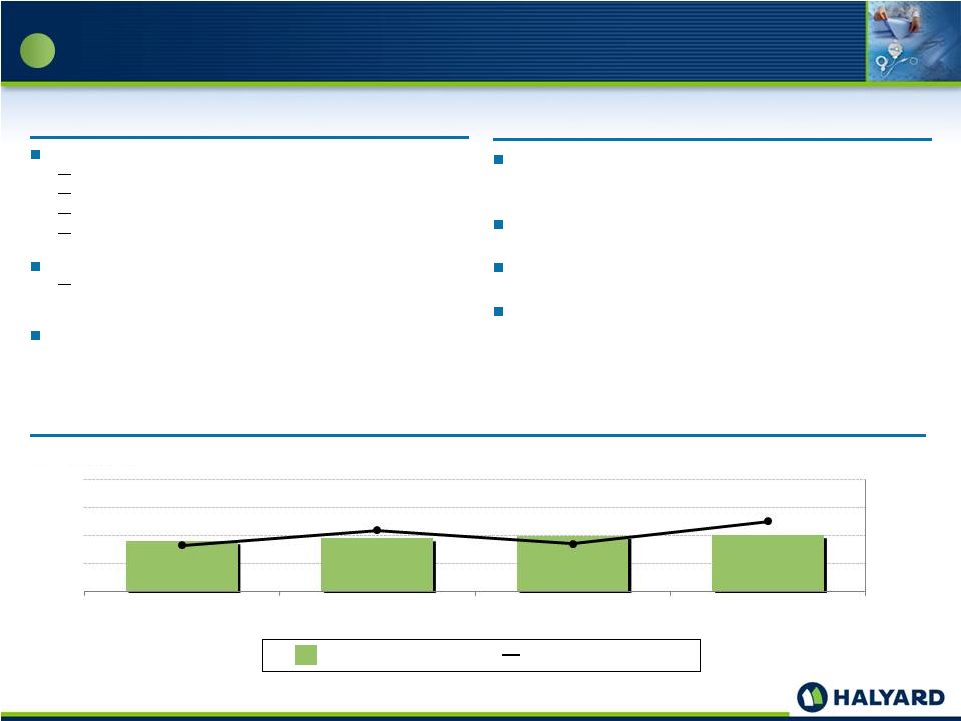
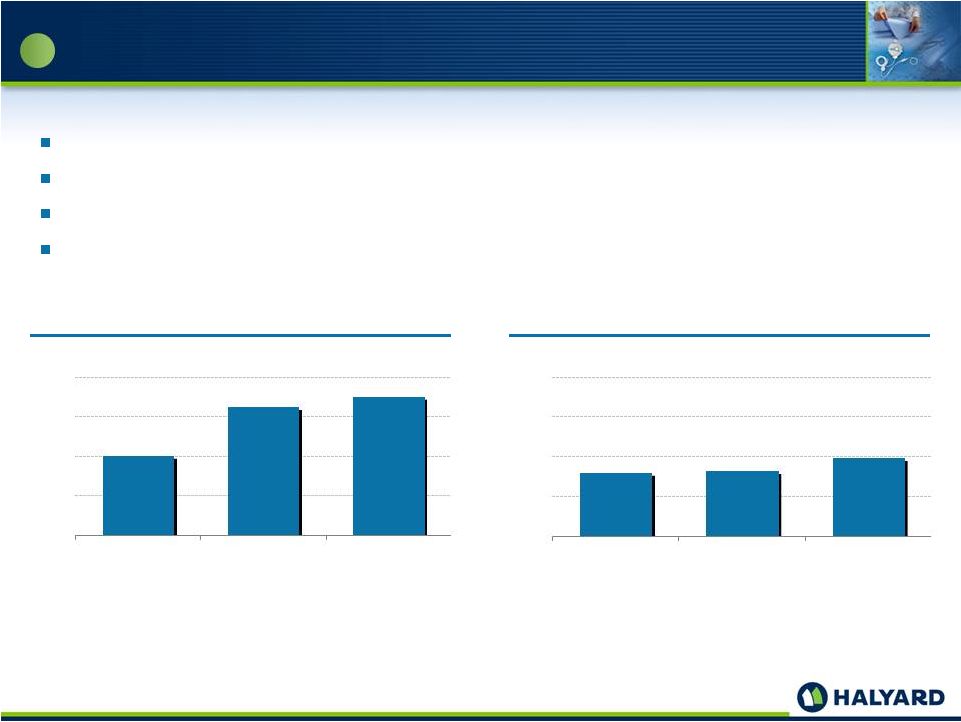
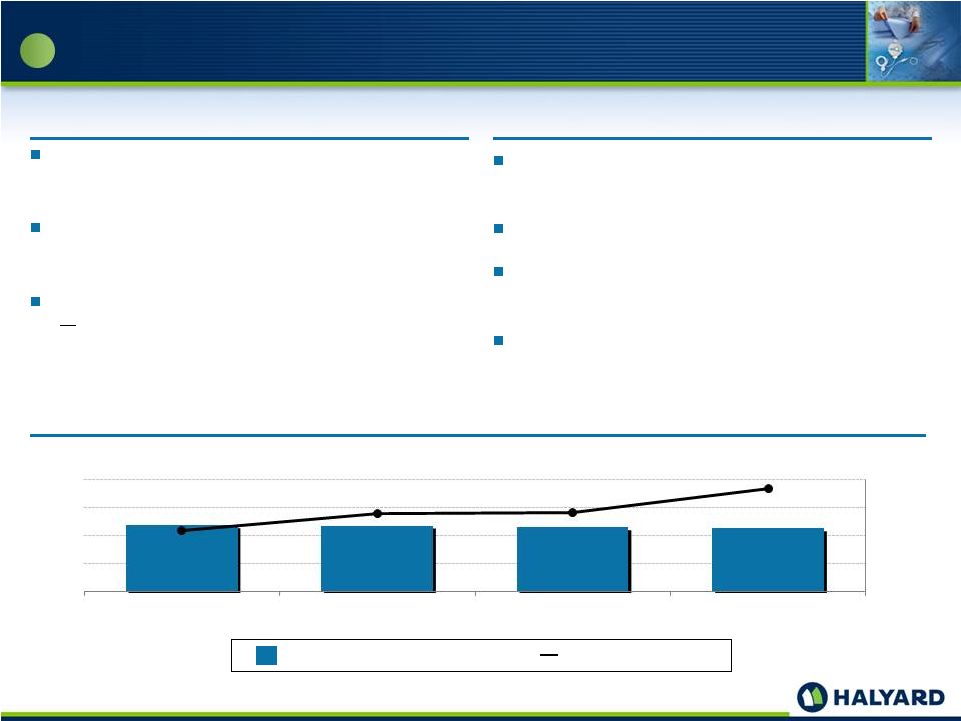 11 Surgical & Infection Prevention Overview Surgical & Infection Prevention Overview The S&IP segment offers products to help prevent health care-acquired infections (HAIs) and provide protection for both healthcare workers and patients Infection prevention is an important issue that affects both caregivers and patients and creates a significant burden / cost on the healthcare system Halyard seeks to reduce infections in healthcare settings Key Highlights and Strategy 1 Overview 30-year track record — market leadership positions across product portfolio Strong cash flow generation Build on history of differentiated innovation to maintain market leadership Ongoing focus on operational efficiencies and margin expansion Historical Financial Performance FYE 12/31 ($MM) Surgical & Infection Prevention Net Sales Operating Profit Margin One in 25 hospitalized patients, or approximately 700,000 incidents, acquires an infection in the U.S. per year 1,188 1,185 1,153 1,133 12.6% 13.1% 13.1% 13.8% 11.0% 12.0% 13.0% 14.0% 0 500 1,000 1,500 2,000 2011A 2012A 2013A LTM 9/30/14A |
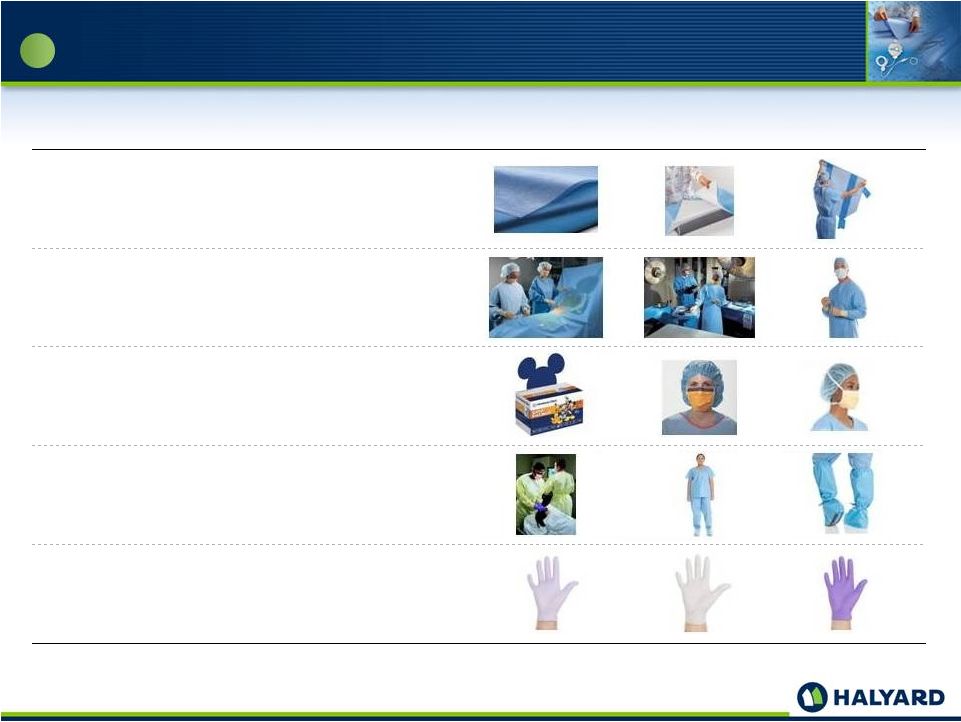 12 Diversified S&IP Product Portfolio with Leading Brands Diversified S&IP Product Portfolio with Leading Brands Sterilization Wraps KIMGUARD QUICK CHECK SMART-FOLD Surgical Drapes & Gowns AERO BLUE MICROCOOL Facial Protection TECNOL FLUIDSHIELD Protective Apparel CONTROL SPUNCARE Medical Exam Gloves SAFESKIN LAVENDER STERLING PURPLE NITRILE 1 |
 13 Medical Device Overview Medical Device Overview Medical Device segment focused on four therapeutic areas: Surgical Pain Management Interventional Pain Management Respiratory Health Digestive Health Large market opportunity to reduce narcotic-based pain control Currently less than 10% penetration in applicable surgical procedures Market driven by physician education and awareness, reimbursement, clinical evidence supporting outcomes and relative cost effectiveness Key Highlights and Strategy 1 Overview Leading market positions in pain, respiratory and digestive health Invest for growth – both organic and inorganic opportunities Leverage global sales and marketing infrastructure Aggressively move into category adjacencies to expand product portfolio Historical Financial Performance FYE 12/31 ($MM) Medical Device Net Sales Operating Profit Margin 452 478 499 506 17.0% 18.6% 17.2% 19.5% 12.0% 15.0% 18.0% 21.0% 24.0% 0 250 500 750 1,000 2011A 2012A 2013A LTM 9/30/14A |
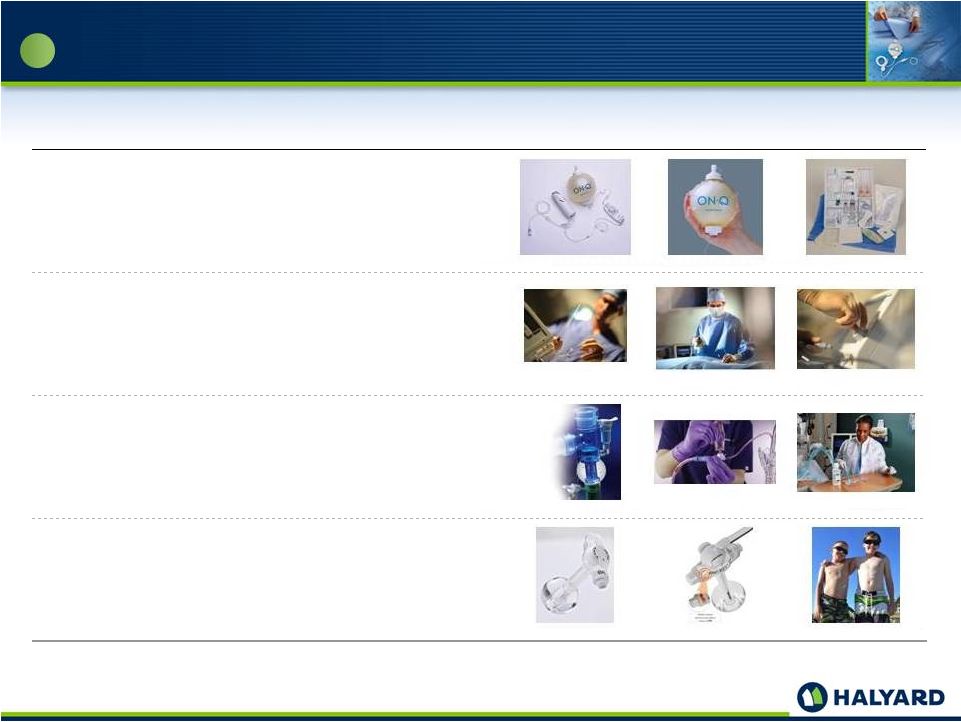 14 Portfolio of Innovative Medical Devices Portfolio of Innovative Medical Devices Surgical Pain Management ON-Q HOMEPUMP ECHOBRIGHT Interventional Pain Management COOLIEF TRANSDISCAL SINERGY Respiratory Health BALLARD MICROCUFF TRACH CARE Digestive Health MIC-KEY MIC MIC-KEY SF 1 |
 Global commercial infrastructure drives cost efficiencies, enables innovation and strategically positions Halyard for growth in new markets Products sold in 100+ countries Well-recognized sales force of approximately 600 representatives in 11 countries Sales force supports customers with robust product training and customer education programs Diversified manufacturing base and vertical integration in nonwovens manufacturing a significant differentiator from our key competitors Global Commercial Infrastructure with Efficient Footprint and Effective Direct Sales Force Global Commercial Infrastructure with Efficient Footprint and Effective Direct Sales Force 2 Other Direct Sales Geography North America Europe, Middle East and Africa Asia Pacific and Latin America Other Global Commercial Infrastructure 68% 14% 12% 6% 15 |
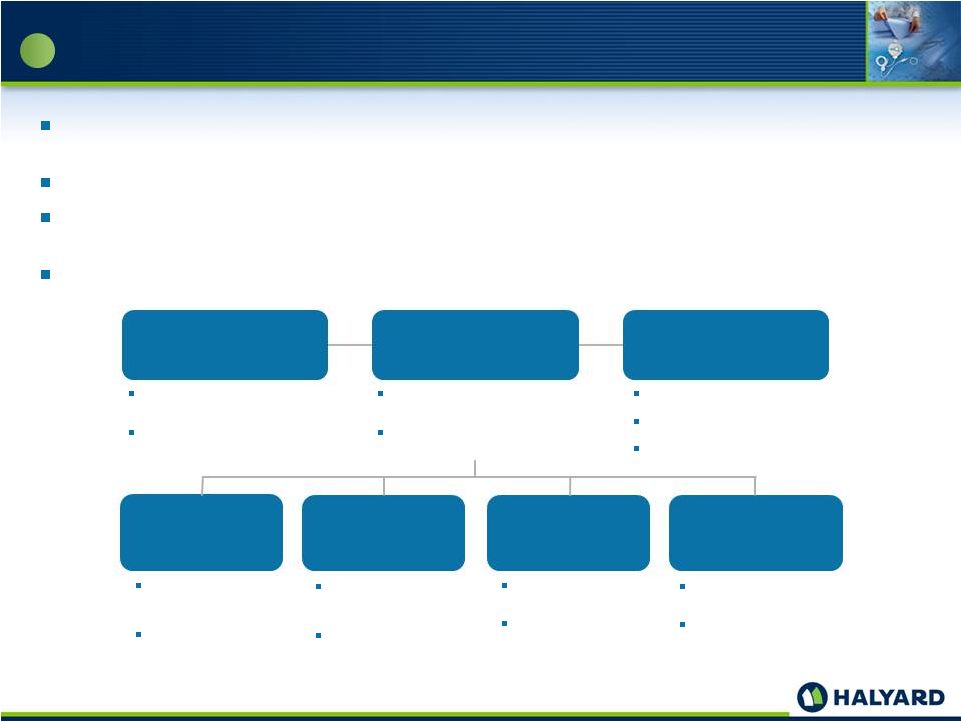
 16 Position For Success (spin through 2015) Successful spin execution and retirement of spin-related costs Focus on efficiency / effectiveness of stand-alone operations, including commercial footprint optimization Accelerate innovation engine Fuel Growth Pipeline (2016 - 2017) Invest in growth programs and aggressively move into category adjacencies to expand product portfolio Round out portfolio, employing a disciplined approach to opportunistic acquisitions and portfolio optimization Continue to drive margins Long-Term Device Focus (2018 and beyond) Strategic Focus – Shift Towards Medical Devices Portfolio Strategic Focus – Shift Towards Medical Devices Portfolio 3 Positioned as medical devices company with revenue growth and higher margins Natural portfolio evolution as the fastest growing part of the portfolio also has the highest margins Adjacency and / or Geographic Expansions for: Surgical Pain, Interventional Pain, Digestive Health and Respiratory Health Focused Execution to Accelerate Portfolio Growth of Medical Devices |
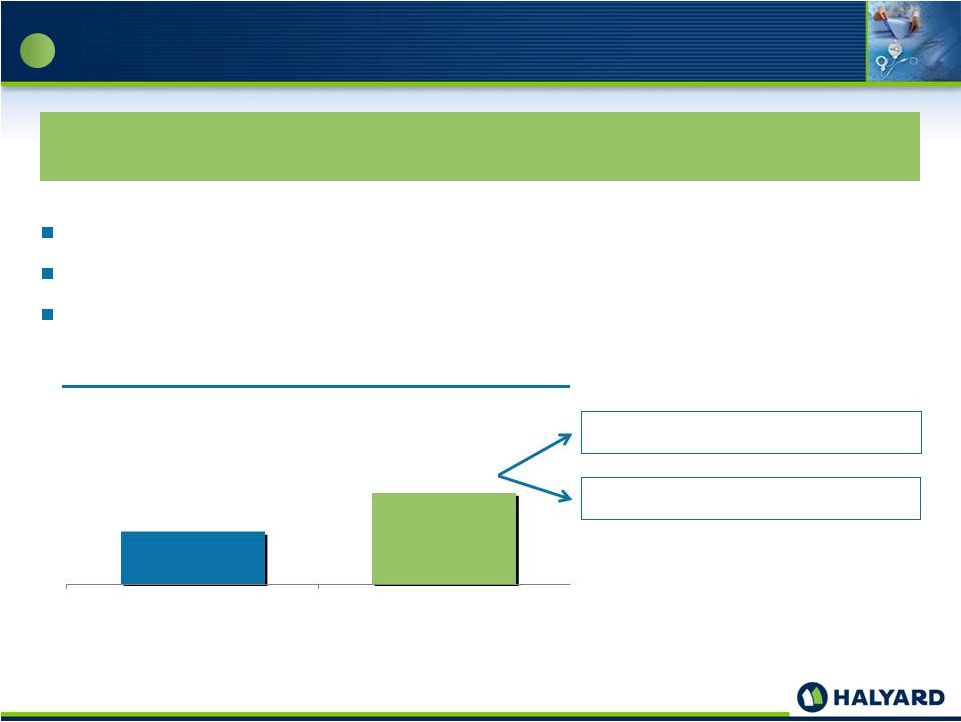 17 Increased R&D Investment Increased R&D Investment Incremental S&IP R&D to maintain current leadership Accelerated spending on R&D within our Medical Devices segment, particularly pain management Increased spending on new adjacent medical device products R&D as % of Net Sales < ~ 1% of Net Sales into S&IP ~ 5-6% of Net Sales into Medical Devices 3 ~ 3 – 4% Doubling R&D Investment over Time to Drive Profitable Growth and Margins 2% Today Long-Term Goal |
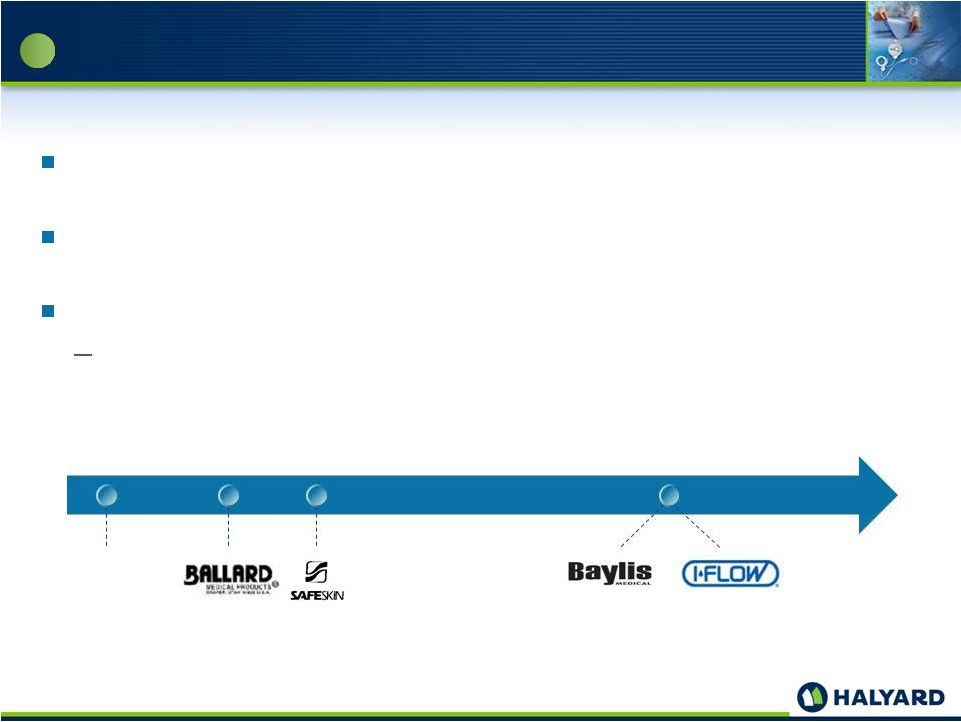 18 Disciplined Approach to Complementary Medical Devices M&A Disciplined Approach to Complementary Medical Devices M&A Focus on complementary acquisitions within adjacent therapeutic areas to our existing Medical Devices segment Viewed through disciplined lens with delineated growth, margin and return on invested capital targets As part of Kimberly-Clark, external growth opportunities were not a consistent focus Halyard expects to actively pursue acquisition opportunities that fit its strategic criteria (Pain Mgmt Segment) Tecnol Medical 1997 1999 2000 2009 2014 3 |
 19 Capex FYE 12/31 ($MM) Free Cash Flow (1) FYE 12/31 ($MM) Strong cash flow expected following retirement of spin-related costs and as Halyard efficiencies increase Capital spending post-spin expected to be less than 3% of net sales Cash available to fund opportunistic acquisitions Ability to utilize cash flow to drive Total Shareholder Return % Margin (2) 2.4 2.9 2.4 1. Defined as Cash Flow from Operations less Capex. 2. Calculated as a percentage of Net Sales. Significant Cash Flow Generation to Fund Opportunistic Acquisitions and Drive Total Shareholder Return Significant Cash Flow Generation to Fund Opportunistic Acquisitions and Drive Total Shareholder Return 4 100 162 175 0 50 100 150 200 2011A 2012A 2013A 40 41 49 0 25 50 75 100 2011A 2012A 2013A |
 20 Proven ability to drive value through growing global businesses, expanding into ancillary markets and integrating complementary platform acquisitions Years of leadership and operational experience from prior roles at Kimberly-Clark Supported by years of diverse healthcare experience across Research and Development, Sales and Marketing, Product Supply, Product Quality and Clinical Affairs Experienced healthcare-oriented Board with Ronald Dollens, former President and CEO of Guidant, as Lead Director Robert Abernathy Chairman & CEO Rhonda Gibby SVP & Chief Human Resources Officer Christopher Isenberg SVP, Global Supply Chain & Procurement Warren Machan SVP, Business Strategy John Wesley SVP, General Counsel and Chief Ethics & Compliance Officer Christopher Lowery SVP & COO Steven Voskuil SVP & CFO 20+ years in Kimberly-Clark senior management across all business units and geographies Former President of Global Health Care at Kimberly-Clark, 1997 - 2004 20+ years of healthcare industry experience in Sales & Marketing, most recently at Covidien Former VP of Global Health Care Sales & Marketing at Kimberly-Clark 20+ years of experience with Kimberly-Clark Former VP of Finance at Kimberly- Clark International Former Treasurer of Kimberly-Clark VP of Human Resources for Kimberly Clark’s global business-to-business units since 2010 Previous leadership roles at Covidien VP of Manufacturing and Supply Chain at Kimberly- Clark Global Health Care since 2012 Former Senior Manufacturing Director for K-C Professional Senior Director of Strategy at Kimberly-Clark Global Health Care since 2012 Former Senior Director of Finance at Kimberly-Clark Global Health Care VP, Deputy General Counsel and Corporate Secretary at Kimberly-Clark since 2009 Former Partner at Dallas-based Carrington, Coleman, Sloman & Blumenthal Proven and Experienced Management Team Proven and Experienced Management Team 5 |
 Compelling Investment Opportunity Compelling Investment Opportunity 21 Diverse Business with Leading Positions 1 Global Manufacturing and Sales Organization 2 Strategic Focus Shifts to Medical Devices 3 Proven and Experienced Management Team 5 Significant Cash Flow Generation to Fund Opportunistic Acquisitions and to Drive Total Shareholder Return 4 |
 FINANCIAL REVIEW |
 Financial Overview Financial Overview 23 Strong, Diversified Cash Flow Well-capitalized with Financial Flexibility Limited Need for Capital Expenditures Near-term Focus on Elimination of TSAs and Other Transactional Costs Disciplined Approach to Cash Deployment with a Focus on Total Shareholder Return Leverage Heritage of Cost Savings and Operational Efficiencies |
 Halyard expects $640MM of aggregate principal amount of debt at spin-off $390MM senior secured term loan facility due 2021 (L+325 floating rate, 0.75% LIBOR floor) $250MM senior unsecured notes due 2022 (6.250% coupon) closed on October 17, 2014 Halyard also expects to have a $250MM revolving credit facility (L+225 floating rate, no LIBOR floor) Net proceeds will be used to partially fund a cash distribution to Kimberly-Clark Long-term leverage target range of 2.0 – 2.5x; provides flexibility to increase leverage for opportunistic M&A 24 Halyard Capitalization Halyard Capitalization ($MM) Tranche Amount Multiple of LTM (9/30/2014) Pro Forma Adjusted EBITDA (x) $250MM Revolver due 2019 - - Term Loan due 2021 390 1.6 Senior Notes due 2022 250 1.0 Total Debt 640 2.6 Cash (40) Net Debt 600 2.5 Pro Forma Capitalization Capital Structure Assures Flexibility to Fund Growth |
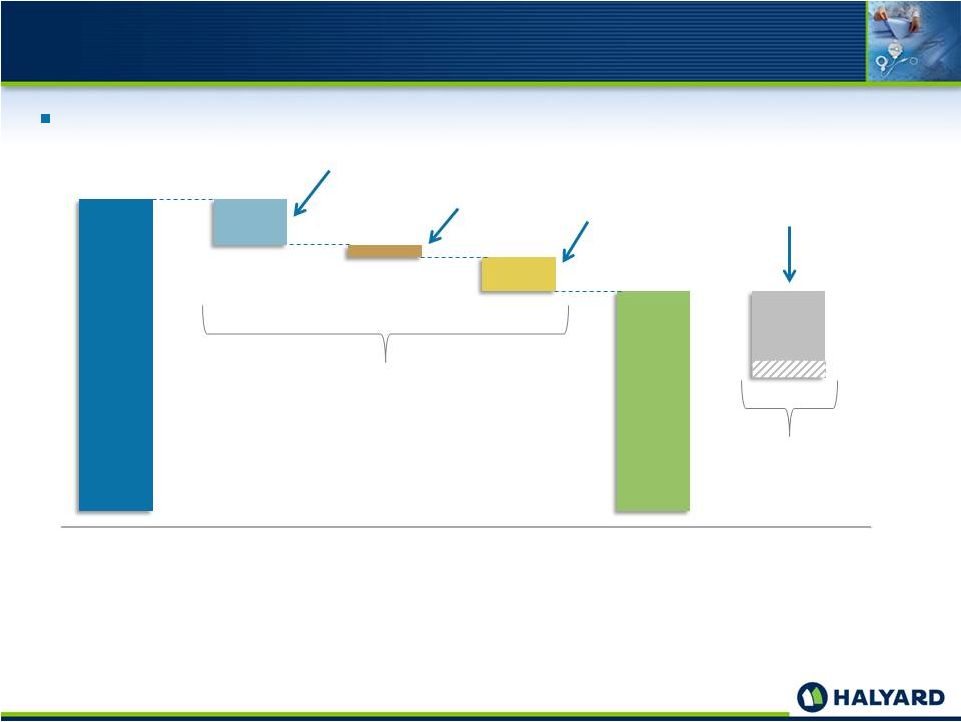 25 Halyard Stand-Alone and Transitional Costs Halyard Stand-Alone and Transitional Costs 1. During the twelve months ended September 30, 2014, Halyard incurred approximately $95.0 million in corporate cost allocation from Kimberly-Clark for these services. Halyard estimates that its aggregate annual incremental cash expense for these services will be approximately $40.0 million per year (for a combined total of $135.0 million of cash expense) 2. In addition to the $40.0 million incremental cash costs, Halyard estimates an incremental $11.0 million per year of additional depreciation and amortization expense. 3. As a result of the separation and distribution, Halyard expects to incur additional ongoing net expenses that it estimates will be approximately $29.2 million on an annual basis related primarily to (1) a decline of purchasing scale, (2) stranded facility costs as a result of excess manufacturing capacity in certain facilities, underutilization of certain of Halyard’s distribution facilities and inefficiencies in shipping costs and (3) a reduction in related party sales. 4. Halyard expects to incur a total of $60.0 million to $75.0 million of transitional costs after the distribution through 2016 to establish its own capabilities as a stand-alone entity. These costs are related primarily to the transition services Halyard expects to receive from Kimberly-Clark, as well as Halyard’s branding and other supply chain costs. 5. Additional adjustments are also made to Kimberly-Clark operating profit to account for transition costs, Thailand glove facility restructuring, corporate adjustments, pension allocations and other items. • Information Technology • Finance • Human Resources • Decreased Purchasing Scale • Stranded Facility Costs • Reduced Related Party Sales K-C Segment Operating Profit Incremental Corporate Costs IT Depreciation Transaction Dis-Synergies Total Transitional Costs Incurred 2014–2016 Only 80% Expected 2015 • Transition Service Agreements • Branding • Royalties • Start Up Ongoing Incremental Expenses As A Stand-Alone Company Stand-Alone Halyard Operating Profit • Incremental D&A Expense (1) (2) (3) (4) Excludes $100-$125MM of pre-spin costs (5) 40 11 29 60–75 |
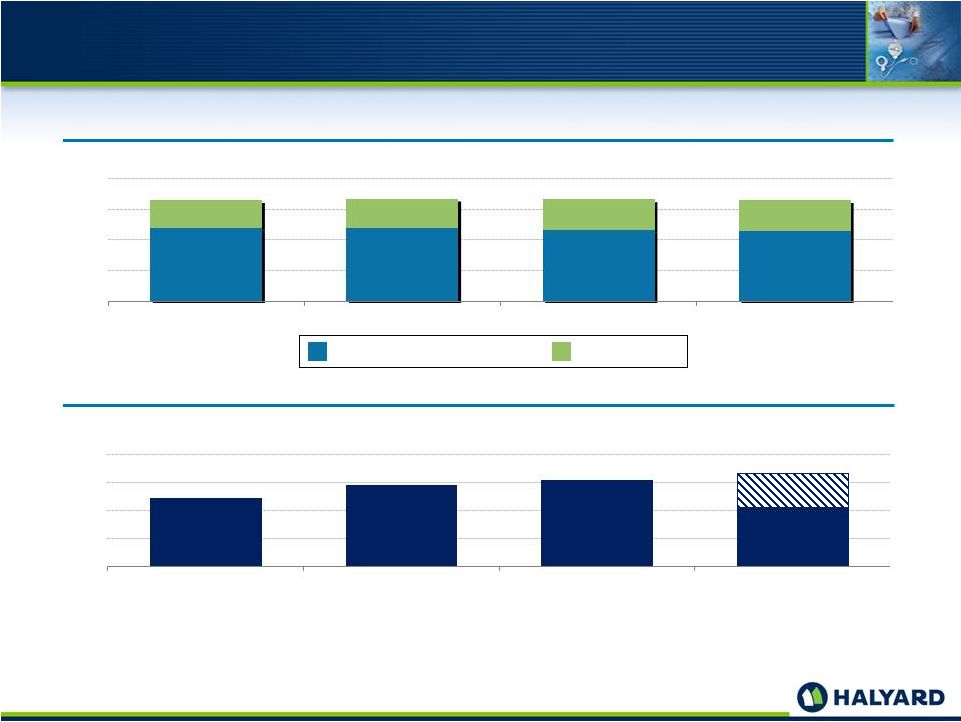 Historical Segment Performance Historical Segment Performance 26 Net Sales FYE 12/31 ($MM) (1) 1. Excludes Corporate & Other. 2. 2011 – 2013 actuals do not reflect the ongoing costs of separation. 3. Adjusted EBITDA for the twelve-months ended September 30, 2014 is $313.4 million; however, when presented on a pro forma basis to give effect to the spin-off and related transactions as if they had occurred on January 1, 2013, is approximately $244 million. Our pro forma Adjusted EBITDA includes approximately $69.2 million in cash expenses expected to be incurred on an annual basis as a result of the spin-off in order to operate as a stand-alone company. These expenses are not included in our actual Adjusted EBITDA for the same period. See the Appendix for more information regarding the calculation of Adjusted EBITDA for the actual and pro forma periods presented above. Adj. EBITDA FYE 12/31 ($MM) (3) (2) (2) (2) 1,188 1,185 1,153 1,133 452 478 499 506 1,640 1,663 1,652 1,639 0 500 1,000 1,500 2,000 2011A 2012A 2013A LTM 9/30/14A Surgical & Infection Prevention Medical Devices 262 286 295 244 140 190 240 290 340 2011A 2012A 2013A LTM 9/30/14 313 |
 27 September 30, 2014 YTD Pro Forma Financial Performance September 30, 2014 YTD Pro Forma Financial Performance Pro Forma (1) ($MM) Nine Months Ended 9/30/2013 9/30/2014 S&IP 860.1 840.2 Medical Devices 366.8 373.5 Net Sales 1,226.9 1,213.7 September 30, 2014 YTD Pro Forma Financial Performance and Commentary Pro Forma Adjusted EBITDA up 13% driven by: Reduced SG&A (on a normalized basis): Patent infringement settlement and lower litigation costs Benefit from strategic sales and marketing headcount reductions taken in Q4 2013 Lower sales incentive payments Implementation of manufacturing costs saving programs and productivity gains (on a normalized basis) Offsets from lower selling price in S&IP and unfavorable mix shift and flat overall volume growth in surgical pain Currency losses from translational exposure EBITDA (2) 210.6 175.0 Adjusted EBITDA (2) 166.6 188.0 Net Income 91.7 46.2 1. Pro forma financial data gives effect to the spin-off and related transactions as if they had occurred on January 1, 2013. A reconciliation of pro forma net sales and pro forma net income to Halyard Health’s historical net sales and net income can be found in the Appendix to this presentation. 2. A reconciliation of EBITDA and Adjusted EBITDA to our net income (loss) under GAAP for each of the periods presented can be found in the Appendix to this presentation. |
 28 Q3 2014 Pro Forma Financial Performance Q3 2014 Pro Forma Financial Performance Pro Forma (1) ($MM) Three Months Ended 9/30/2013 9/30/2014 S&IP 287.0 279.2 Medical Devices 126.2 122.5 Net Sales 413.2 401.7 Q3 2014 Pro Forma Financial Performance and Commentary Difficult comparison to prior year; second highest quarter ever Q3 2013 Pro Forma Adjusted EBITDA was $14 million above the quarterly average for the year Decline in Pro Forma Adjusted EBITDA approximately equal weightings between: Expected price loss in exam gloves and sterilization Device sales lower due to surgical pain volume related to competition in our category Negative currency impact EBITDA (2) 83.9 63.8 Adjusted EBITDA (2) 69.2 57.1 Net Income 40.2 7.9 1. Pro forma financial data gives effect to the spin-off and related transactions as if they had occurred on January 1, 2013. A reconciliation of pro forma net sales and pro forma net income to Halyard Health’s historical net sales and net income can be found in the Appendix to this presentation. 2. A reconciliation of EBITDA and Adjusted EBITDA to our net income (loss) under GAAP for each of the periods presented can be found in the Appendix to this presentation. |
 29 Halyard’s Long-Term Financial Objectives Halyard’s Long-Term Financial Objectives Organic Revenue Growth <1% Portfolio optimized for higher growth Improving growth rate especially in higher margin categories Organic Adjusted Earnings Growth <3% Earnings growth driven by margin expansion Growth in higher margin categories R&D Expense <2% Increased investment; ~3-4% of net sales Focused on organic innovation and new products for adjacency expansion Capital Expenditures <3% ~3% of net sales Funding growth and innovation initiatives Total Shareholder Return N/A Focus metric for Management 1. Organic Revenue and Earnings Growth based on 2013 2-year CAGR. 2. These goals are forward-looking, are subject to significant business, economic, regulatory and competitive uncertainties and contingencies, many of which are beyond the control of the Company and its management, and are based upon assumptions with respect to future decisions, which are subject to change. Actual results will vary and those variations may be material. For discussion of some of the important factors that could cause these variations, please consult “Risk Factors” under Item 1A of Halyard Health’s Registration Statement on Form 10 (as amended) filed with the Securities and Exchange Commission. Nothing in this presentation should be regarded as a representation by any person that these goals will be achieved. Halyard Health undertakes no obligation to update these goals and forward-looking statements to reflect events or circumstances occurring after the date of this presentation, except as required by law, including the securities laws of the United States and the rules and regulations of the SEC. You should not place undue reliance on these goals and forward-looking statements, which speak only as of October 21, 2014. Today Longer Term Goals (2) (1) |
 Focus on Total Shareholder Return 30 Maintain balance sheet flexibility and focus on working capital efficiency Disciplined growth funding Capital spending Research and development Mergers and acquisitions Infrastructure efficiency Continued focus on margin accretion Gross margin improvement from shift to increased medical device focus Operating margin efficiency by eliminating spin-related transaction costs Return excess cash to shareholders through potential share repurchases and dividends Focus on Key Long-Term Drivers of Total Shareholder Return |
 APPENDIX APPENDIX |
 32 Halyard Health Net Income to Pro Forma Adjusted EBITDA Reconciliation Halyard Health Net Income to Pro Forma Adjusted EBITDA Reconciliation Unaudited ($MM) Three Months Ended Nine Months Ended 9/30/2013 9/30/2014 9/30/2013 9/30/2014 Net Sales 419.5 408.5 1,246.2 1,232.7 Related Party Sales (1) (6.3) (6.8) (19.3) (19.0) Pro Forma Net Sales 413.2 401.7 1,226.9 1,213.7 Net Income (GAAP) 47.9 (7.4) 114.8 29.5 Related Party Sales (1) (0.6) (0.6) (1.8) (1.8) Transaction Costs (2) - 35.4 - 61.2 Royalties (3) (2.6) (2.6) (7.9) (7.9) Interest Expense (Income) (4) (8.6) (8.6) (25.8) (25.8) Provision for Income Taxes (5) 4.1 (8.3) 12.4 (9.0) Pro Forma Net Income 40.2 7.9 91.7 46.2 Provision for Income Taxes (Benefit) 19.0 29.8 42.1 52.7 Interest Expense (Income) 7.9 7.8 24.2 23.0 Depreciation and Amortization 16.8 18.3 52.6 53.1 Pro Forma EBITDA 83.9 63.8 210.6 175.0 Thailand Restructuring (6) - 5.7 - 54.7 Royalties (7) 2.6 2.6 7.9 7.9 Ongoing Separation and Distribution Impact (8) (17.3) (17.3) (51.9) (51.9) Unusual Items in the Period (9) - 2.3 - 2.3 Pro Forma Adjusted EBITDA 69.2 57.1 166.6 188.0 Note: Reference footnote disclosures on p. 34. Operating Profit 70.3 13.1 167.7 70.3 |
 33 Halyard Health Net Income to Pro Forma Adjusted EBITDA Reconciliation (Continued) Halyard Health Net Income to Pro Forma Adjusted EBITDA Reconciliation (Continued) Unaudited ($MM) FY 2011 FY 2012 FY 2013 Less 9 Months (2013) Add 9 Months (2014) Combined LTM Sept. 30, 2014 Pro Forma LTM Sept. 30, 2014 (11) Net Income 142.4 152.6 154.6 114.8 29.5 69.3 78.3 Provision for Income Taxes (Benefit) 72.2 77.2 73.2 54.5 43.6 62.3 67.2 Interest Expense (Income) (3.9) (1.8) (2.5) (1.6) (2.9) (3.8) 30.7 Depreciation and Amortization 51.1 57.6 69.2 52.6 53.1 69.7 69.7 EBITDA 261.8 285.6 294.5 220.3 123.3 197.5 245.9 Thailand Restructuring (6) 54.7 54.7 54.7 Transaction Costs (10) 61.2 61.2 - Ongoing Stand-Alone Charges (8) (69.2) Royalties (7) 10.6 Unusual Items in the Quarter (9) 2.3 Adjusted EBITDA 261.8 285.6 294.5 220.3 239.2 313.4 244.3 Note: Reference footnote disclosures on p. 34. |
 34 Halyard Health Net Income to Pro Forma Adjusted EBITDA Reconciliation (Supporting Footnotes) Halyard Health Net Income to Pro Forma Adjusted EBITDA Reconciliation (Supporting Footnotes) Reflects an adjustment to eliminate related party sales associated with certain feminine care products manufactured by Halyard for Kimberly-Clark that will not continue after the distribution. This adjustment applies only to Corporate & Other and does not affect our S&IP or Medical Devices segments. The net effect of the adjustment was a decrease in net sales of $6.8 million and $6.3 million and cost of products sold of $0.6 million and $0.6 million for the three months ended September 30, 2014 and 2013; a decrease in net sales of $19.0 million and $19.3 million and cost of products sold of $1.8 million and $1.8 million for the nine months ended September 30, 2014 and 2013. Transaction costs expected to be incurred in 2014 in connection with the distribution are estimated to be between $100.0 million and $125.0 million, which include costs related to legal, accounting, information technology services and consulting services. We expect all these costs to be expensed. Reflects an adjustment to remove $35.4 million and $61.2 million, respectively, of transaction costs directly related to the distribution that were incurred during the three and nine months ended September 30, 2014. We expect to enter into certain intellectual property agreements with Kimberly-Clark pursuant to which Halyard will pay Kimberly-Clark royalties for the use of certain Kimberly-Clark intellectual property for a transition period ending on the second anniversary of the distribution. The net effect of the agreements was an increase in selling and general expenses of $2.6 million for the three months ended September 30, 2014 and 2013; and $7.9 million for the nine months ended September 30, 2014 and 2013. On October 17, 2014 we issued $250.0 aggregate principal amount of 6.25% Senior Notes due 2022. Reflects an adjustment for the estimated interest expense and the amortization of deferred financing costs on our new borrowings of $250.0 million under our senior notes, anticipated borrowings under the secured term loan facility we expect to enter into at the time of the spin-off and the revolving credit facility of up to $250.0 million that we expect to enter into at the time of the spin-off. Pro forma interest expense reflects an assumed annual interest rate of 4.0% on indebtedness to be incurred in conjunction with the borrowings under the secured term loan facility. We expect borrowings under the secured term loan facility to bear interest at an adjusted LIBOR rate plus 3.25% or a base rate plus 2.25%, at our option, and the secured term loan facility is expected to mature in October 2021. Each one-eighth point change in our assumed interest rate on the borrowings under the secured term loan facility would result in a $0.5 million change in our aggregate annual interest expense. Reflects an income tax expense adjustment for the items noted above, calculated at the U.S. federal statutory rate of 35%. Consists of certain restructuring costs related to our plan to exit one of our disposable glove facilities in Thailand and outsource the related production. Adjusted to exclude transitional royalties expected to be paid to Kimberly-Clark for the use of certain Kimberly-Clark intellectual property for a transition period ending on the second anniversary of the distribution. See note (3) above. Upon the distribution, we will assume responsibility for all of our stand-alone public company costs, including the costs of corporate services currently provided by Kimberly-Clark. The corporate services currently provided to us include executive management, supply chain, information technology, legal, finance and accounting, investor relations, human resources, risk management, tax, treasury and other services. During three and nine months ended September 30, 2014 and 2013, and the twelve months ended September 30, 2014, and we incurred approximately $23.8 million, $47.5 million, and $95.0 million in corporate cost allocation from Kimberly-Clark for these services. We estimate that our aggregate annual incremental cash expense for these services will be approximately $40.0 million per year (for a combined total of $135.0 million of cash expense) and an incremental $11.0 million per year of additional depreciation and amortization expense (which is not reflected in the table above). In addition, as a result of the separation and distribution, we expect to incur additional ongoing net expenses that we estimate will be approximately $29.2 million on an annual basis related primarily to (1) a decline of purchasing scale, (2) stranded facility costs as a result of excess manufacturing capacity in certain facilities, underutilization of certain of our distribution facilities and inefficiencies in shipping costs and (3) a reduction in related party sales. In addition, as a result of the separation and distribution, we expect to incur $60.0 million to $75.0 million of transitional costs after the distribution through 2016 to establish our own capabilities as a stand-alone entity. These costs are related primarily to the transition services we expect to receive from Kimberly-Clark, as well as our branding and other supply chain transition costs. Our pro forma Adjusted EBITDA has not been adjusted to account for these transitional costs. These costs are estimates only and we may have to pay higher costs as a result of these transition services than currently expected. See “Risk Factors—Risks Related to the Distribution and Our Separation from Kimberly-Clark” contained in our Registration Statement on Form 10 (as amended) filed with the Securities and Exchange Commission. Adjusted to exclude the following one-time costs incurred during the three months ended September 30, 2014: (1) approximately $1.3 million associated with the collapse of the roof and a wall at our Southaven distribution facility due to severe weather and (2) approximately $1 million of Medical Devices inventory was written off in connection with an inventory review in preparation for the spin-off. During the nine and twelve months ended September 30, 2014, we incurred transaction costs directly relating to the separation and distribution in the amount of $61.2 million. Transaction costs associated with the separation and distribution are estimated to be between $100.0 million and $125.0 million for the full year 2014. See note (2) above. Reflects adjustments to give effect to the spin-off and related transactions as if they had occurred on January 1, 2013. Please see our Unaudited Pro Forma Condensed Combined Financial Statements included in our Registration Statement on Form 10 (as amended) filed with the Securities and Exchange Commission for a description of the adjustments to the items below for the year ended December 31, 2013. See page 32 of this presentation for adjustments for the nine months ended September 30, 2013 and 2014. 1. 2. 3. 4. 5. 6. 7. 8. 9. 10. 11. |