Q2 2023 Earnings Presentation August 9th, 2023 Getting patients back to the things that matter.

Chief Executive Officer 2 Joe Woody Michael Greiner Senior Vice President, CFO & Chief Transformation Officer Business Progress Against 2023 Priorities Q2 Results & 2023 Planning Environment
3 FORWARD-LOOKING INFORMATION NON-GAAP FINANCIAL MEASURES Certain matters in this presentation, including expectations and planning assumptions, any comments about our expected performance, and any estimates, projections, or statements relating to our business plans, objectives, acquisitions and transformation initiatives, constitute “forward-looking statements” within the meaning of the Private Securities Litigation Reform Act of 1995 and are based upon current plans and management’s expectations and beliefs concerning future events impacting the Company. These statements are subject to risks and uncertainties that could cause our actual results to differ materially from those expressed or implied in such statements, including risks related to the ongoing COVID-19 pandemic, competition, market demand, cost savings and reductions, raw material, energy, and other input costs, supply chain disruptions (including availability of drugs used in our Acute Pain products), inflation, the ongoing conflict between Russia and Ukraine, our ability to successfully execute on or achieve the expected benefits of our transformation initiative, the success of acquisitions and divestitures, the effects of the recent financial conditions affecting the banking system and the potential threats to the solvency of commercial banks, economic conditions, currency exchange risks, human capital risks, cyber risks, intellectual property risks, and legislative and regulatory actions. There can be no assurance that these future events will occur as anticipated or that the Company’s results will be as estimated. Forward-looking statements speak only as of the date they were made, and we undertake no obligation to publicly update them. For a more complete listing and description of these and other factors that could cause the Company’s future results to differ materially from those expressed in any forward-looking statements, see the Company’s most recent Annual Report on Form 10-K and Quarterly Reports on Form 10-Q. This presentation includes financial measures that have not been calculated in accordance with accounting principles generally accepted in the U.S., or GAAP. The company provides these non-GAAP financial measures as supplemental information to its GAAP financial measures. Management believes that such non-GAAP financial measures enhance investors’ understanding and analysis of the Company’s performance. As such, results and outlook have been adjusted to exclude certain items for relevant time periods as indicated in the non-GAAP reconciliations to the comparable GAAP financial measures included in this presentation and posted on our website (www.avanos.com/investors). These non-GAAP financial measures should not be considered in isolation or as a substitute for analysis of our results as reported under GAAP.

4 Reflections on Performance • Overall results exceeded our expectations • Continue to experience strong demand in our Digestive Health product portfolio • Improving supply chain environment • Remain focused on getting patients back to the things that matter as we meet customer needs
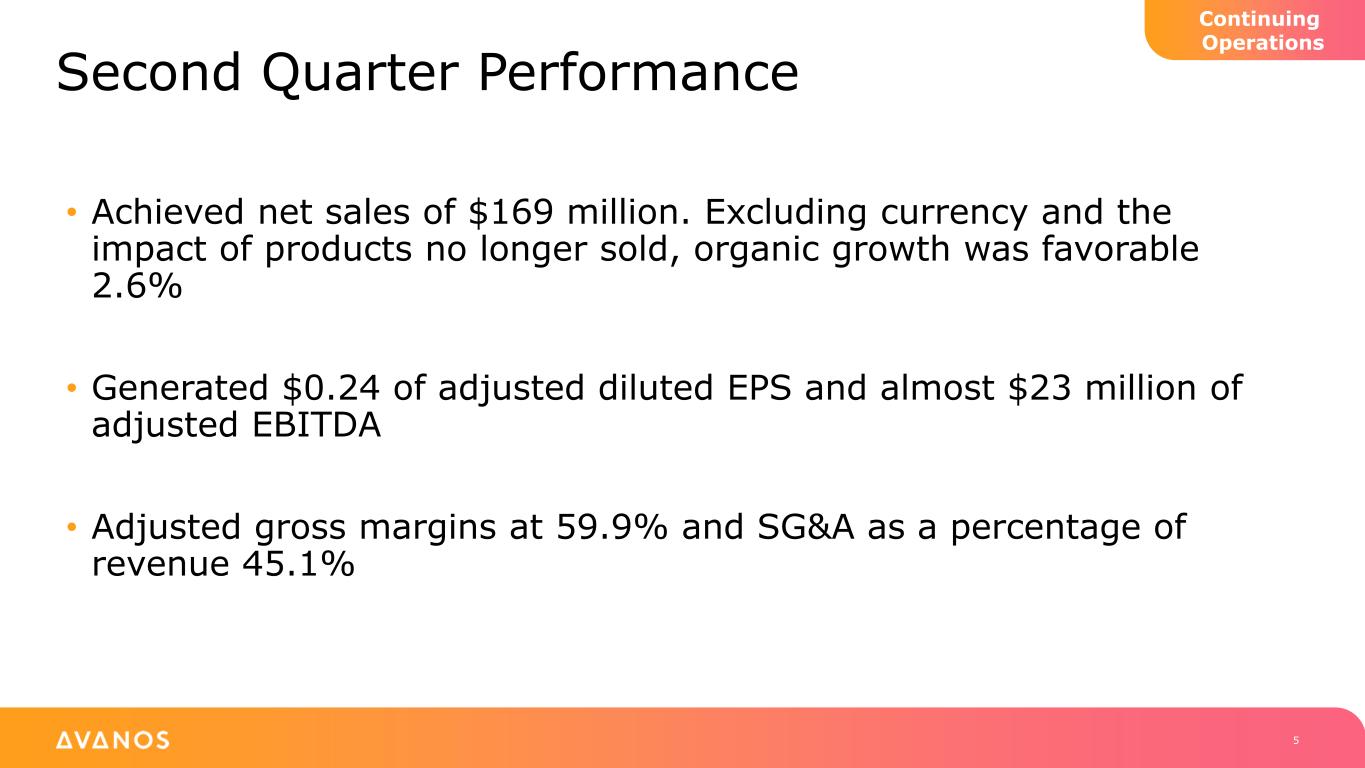
5 • Achieved net sales of $169 million. Excluding currency and the impact of products no longer sold, organic growth was favorable 2.6% • Generated $0.24 of adjusted diluted EPS and almost $23 million of adjusted EBITDA • Adjusted gross margins at 59.9% and SG&A as a percentage of revenue 45.1% Second Quarter Performance Continuing Operations

6 • Digestive Health revenue up close to 17% (constant currency sales) • Strong NeoMed execution contributed nearly 50% of total growth • Above market growth from CORTRAK guided tube placement; record quarter capital sales $80 $93 Q2 2022 Q2 2023 Strong Quarter for Digestive Health Digestive Health Sales Millions Continuing Operations
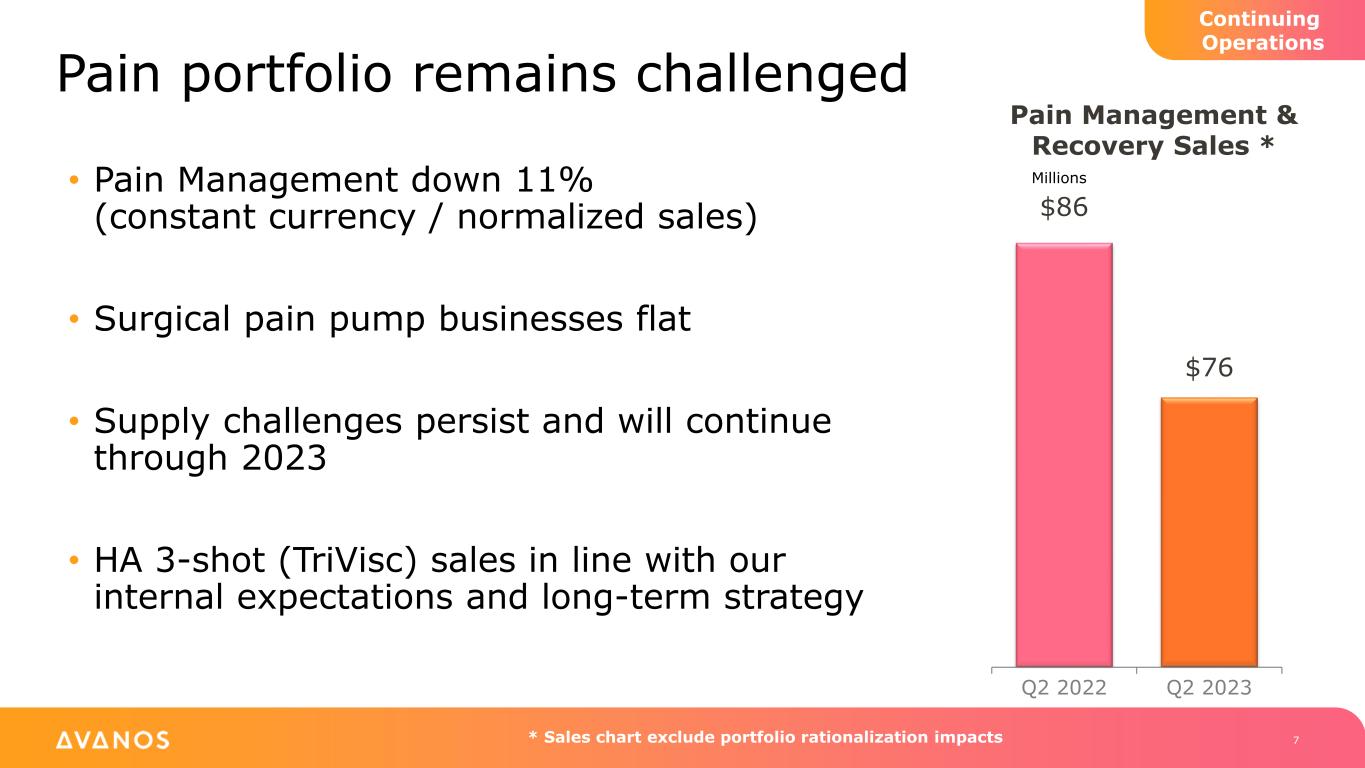
Pain portfolio remains challenged 7 • Pain Management down 11% (constant currency / normalized sales) • Surgical pain pump businesses flat • Supply challenges persist and will continue through 2023 • HA 3-shot (TriVisc) sales in line with our internal expectations and long-term strategy $86 $76 Q2 2022 Q2 2023 * Sales chart exclude portfolio rationalization impacts Pain Management & Recovery Sales * Millions Continuing Operations
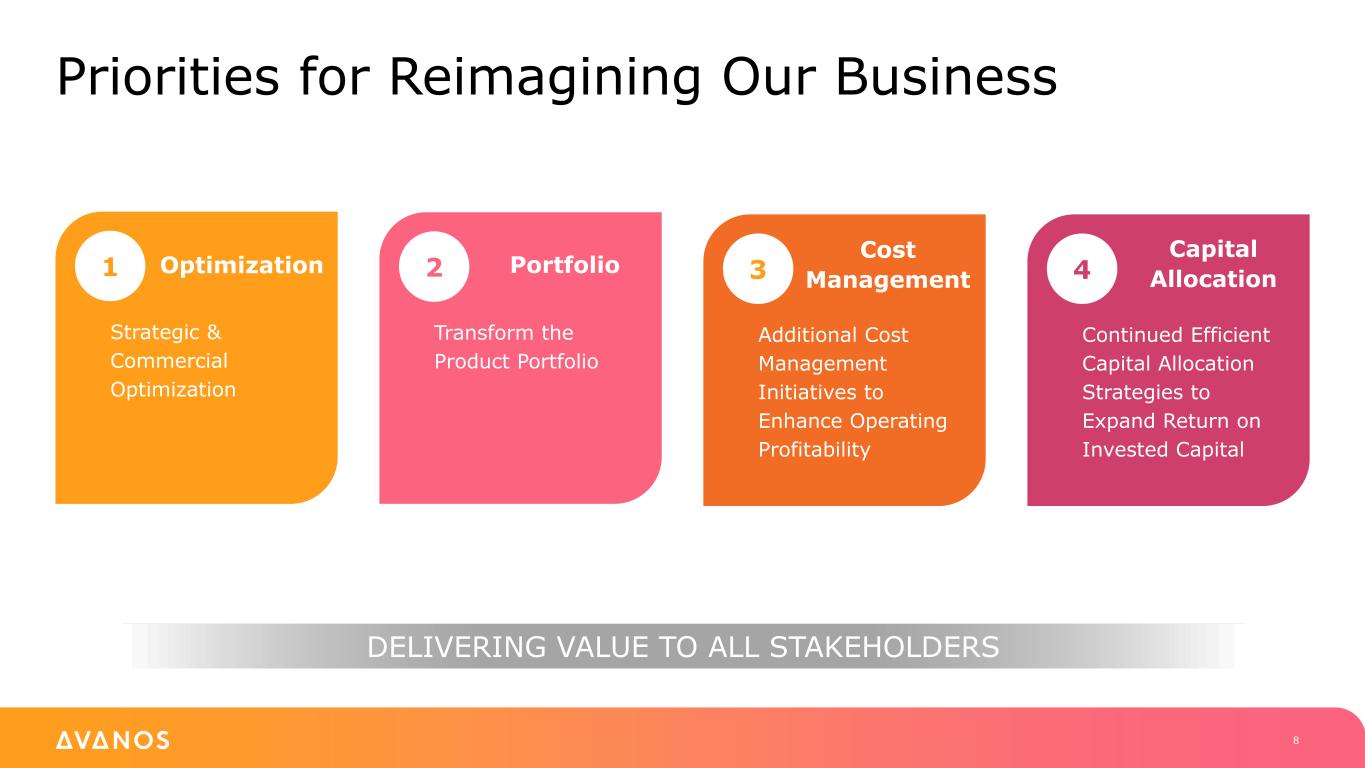
Strategic & Commercial Optimization 1 Transform the Product Portfolio 2 Additional Cost Management Initiatives to Enhance Operating Profitability 3 Continued Efficient Capital Allocation Strategies to Expand Return on Invested Capital 4 DELIVERING VALUE TO ALL STAKEHOLDERS 8 Optimization Portfolio Cost Management Capital Allocation Priorities for Reimagining Our Business
9 Priorities for Reimagining Our Business • Transformation agenda remains on track • Improved Pain Management & Recovery go-to-market strategy • Capital allocation priorities toward tuck-in M&A and share repurchase
Q2 2023 Results Michael Greiner Senior Vice President, CFO & Chief Transformation Officer
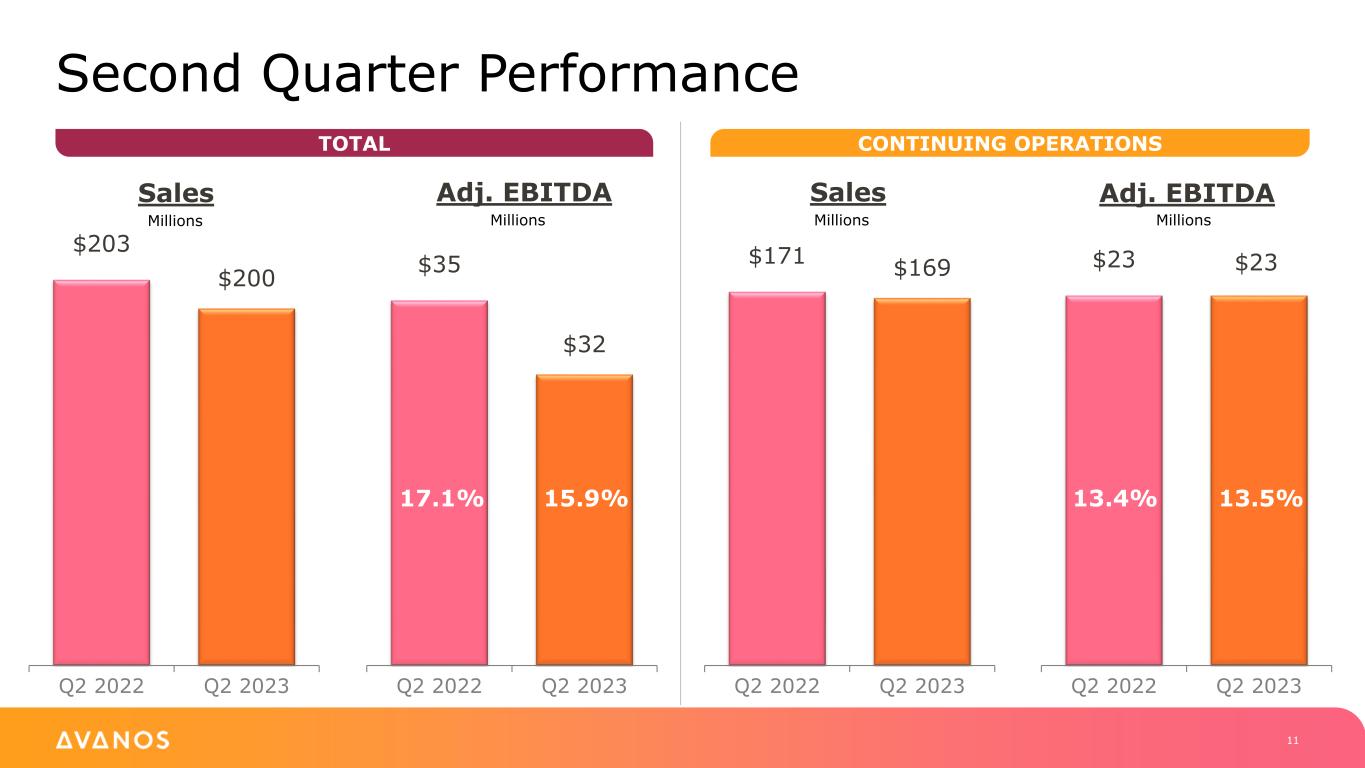
11 $203 $200 Q2 2022 Q2 2023 $35 $32 Q2 2022 Q2 2023 $171 $169 Q2 2022 Q2 2023 $23 $23 Q2 2022 Q2 2023 Second Quarter Performance 17.1% 15.9% TOTAL CONTINUING OPERATIONS Sales Adj. EBITDA Sales Adj. EBITDA Millions Millions Millions Millions 13.4% 13.5%
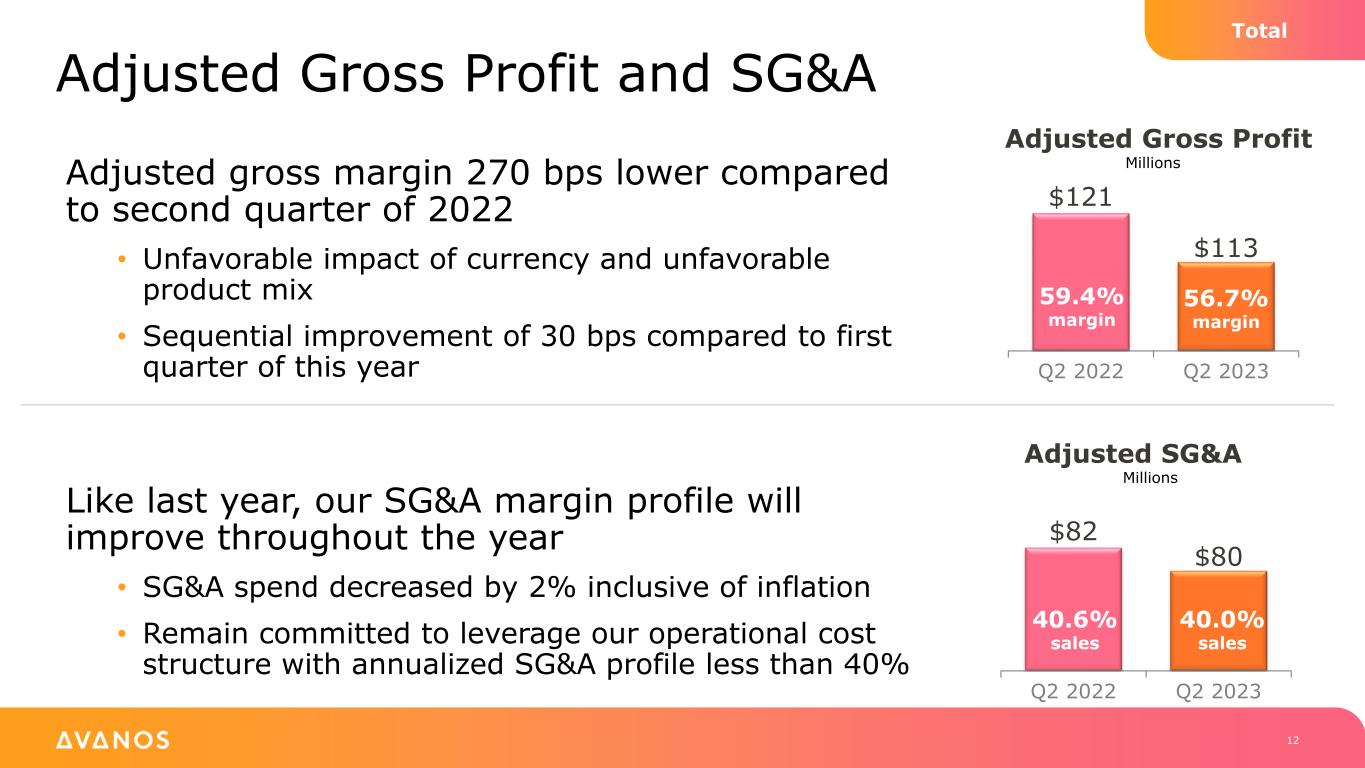
12 Adjusted gross margin 270 bps lower compared to second quarter of 2022 • Unfavorable impact of currency and unfavorable product mix • Sequential improvement of 30 bps compared to first quarter of this year Adjusted Gross Profit and SG&A $121 $113 Q2 2022 Q2 2023 Adjusted Gross Profit Millions 59.4% margin 56.7% margin $82 $80 Q2 2022 Q2 2023 Adjusted SG&A Millions 40.6% sales 40.0% sales Total Like last year, our SG&A margin profile will improve throughout the year • SG&A spend decreased by 2% inclusive of inflation • Remain committed to leverage our operational cost structure with annualized SG&A profile less than 40%
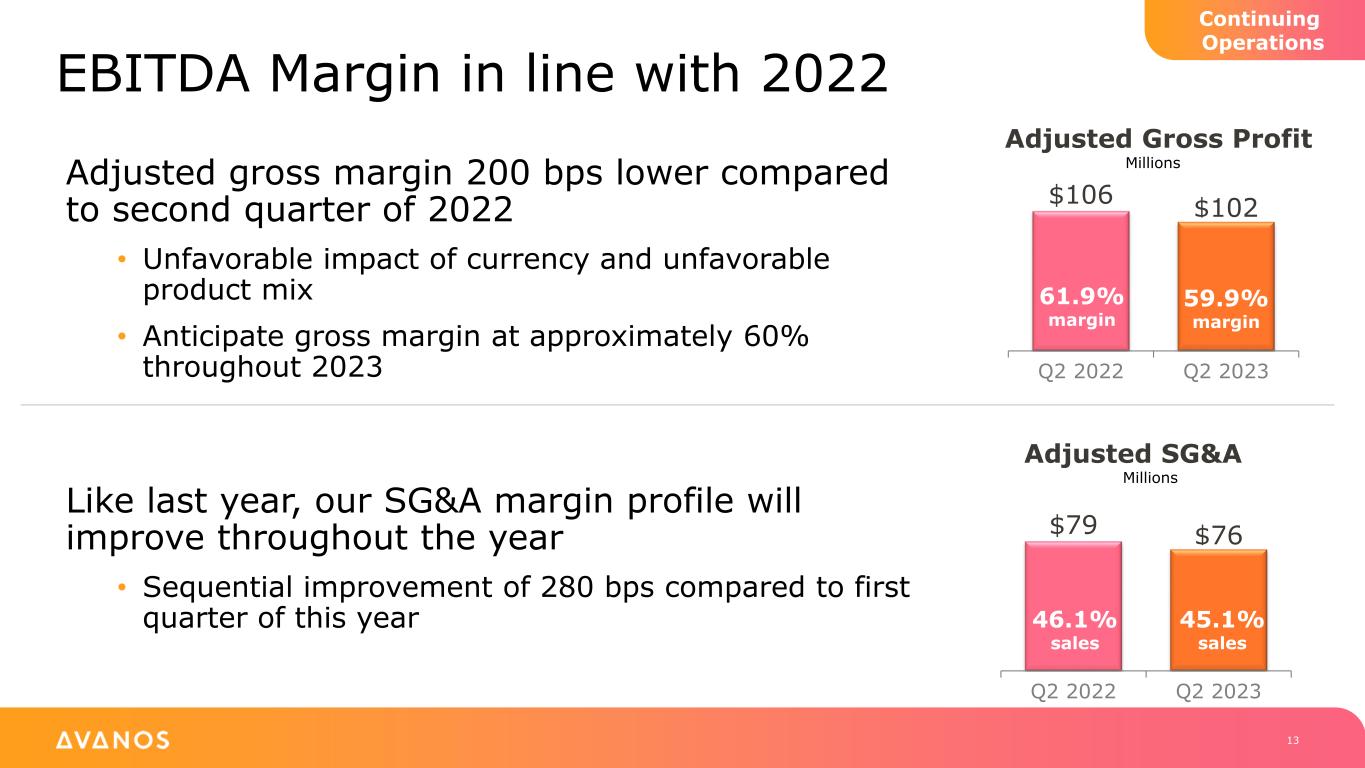
13 Adjusted gross margin 200 bps lower compared to second quarter of 2022 • Unfavorable impact of currency and unfavorable product mix • Anticipate gross margin at approximately 60% throughout 2023 EBITDA Margin in line with 2022 $106 $102 Q2 2022 Q2 2023 Adjusted Gross Profit Millions 61.9% margin 59.9% margin $79 $76 Q2 2022 Q2 2023 Adjusted SG&A Millions 46.1% sales 45.1% sales Continuing Operations Like last year, our SG&A margin profile will improve throughout the year • Sequential improvement of 280 bps compared to first quarter of this year
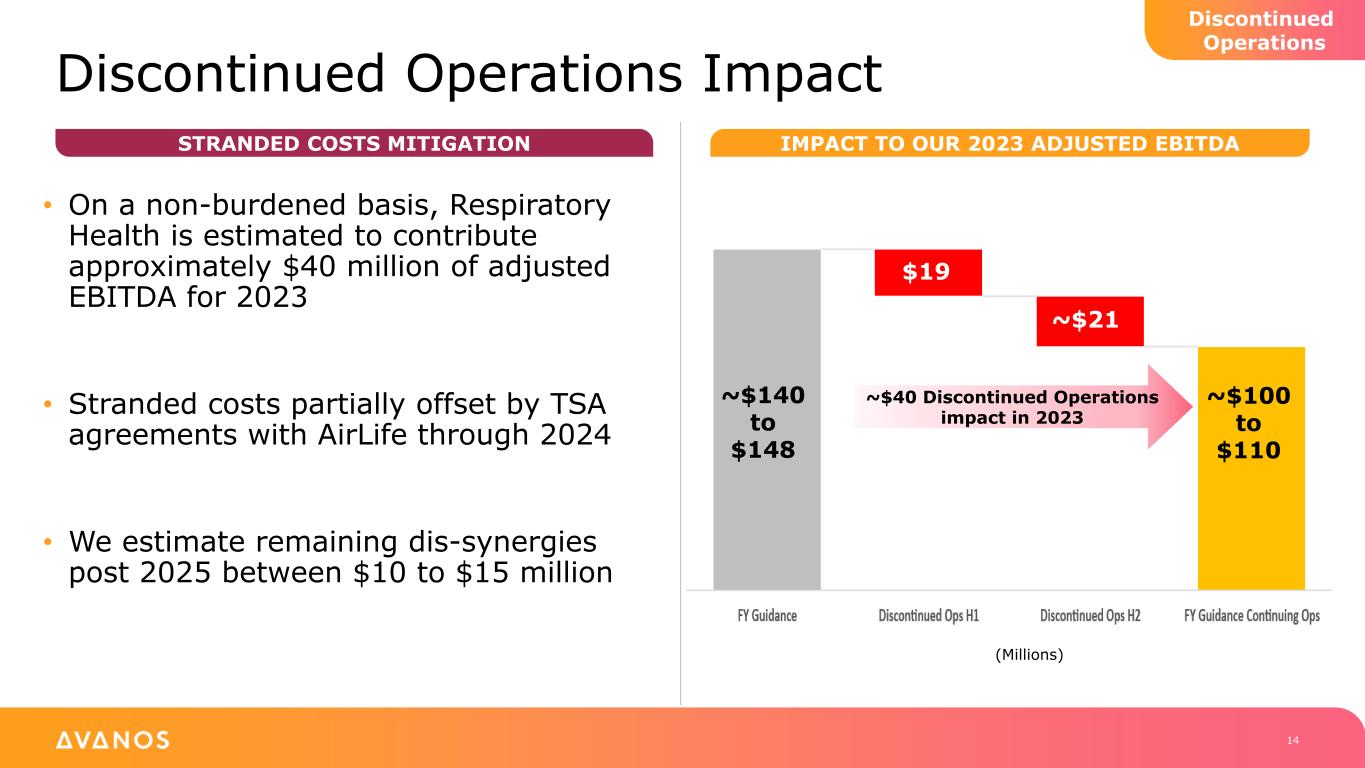
Discontinued Operations Impact 14 Discontinued Operations ~$140 to $148 ~$100 to $110 $19 ~$21 (Millions) ~$40 Discontinued Operations impact in 2023 STRANDED COSTS MITIGATION IMPACT TO OUR 2023 ADJUSTED EBITDA • On a non-burdened basis, Respiratory Health is estimated to contribute approximately $40 million of adjusted EBITDA for 2023 • Stranded costs partially offset by TSA agreements with AirLife through 2024 • We estimate remaining dis-synergies post 2025 between $10 to $15 million
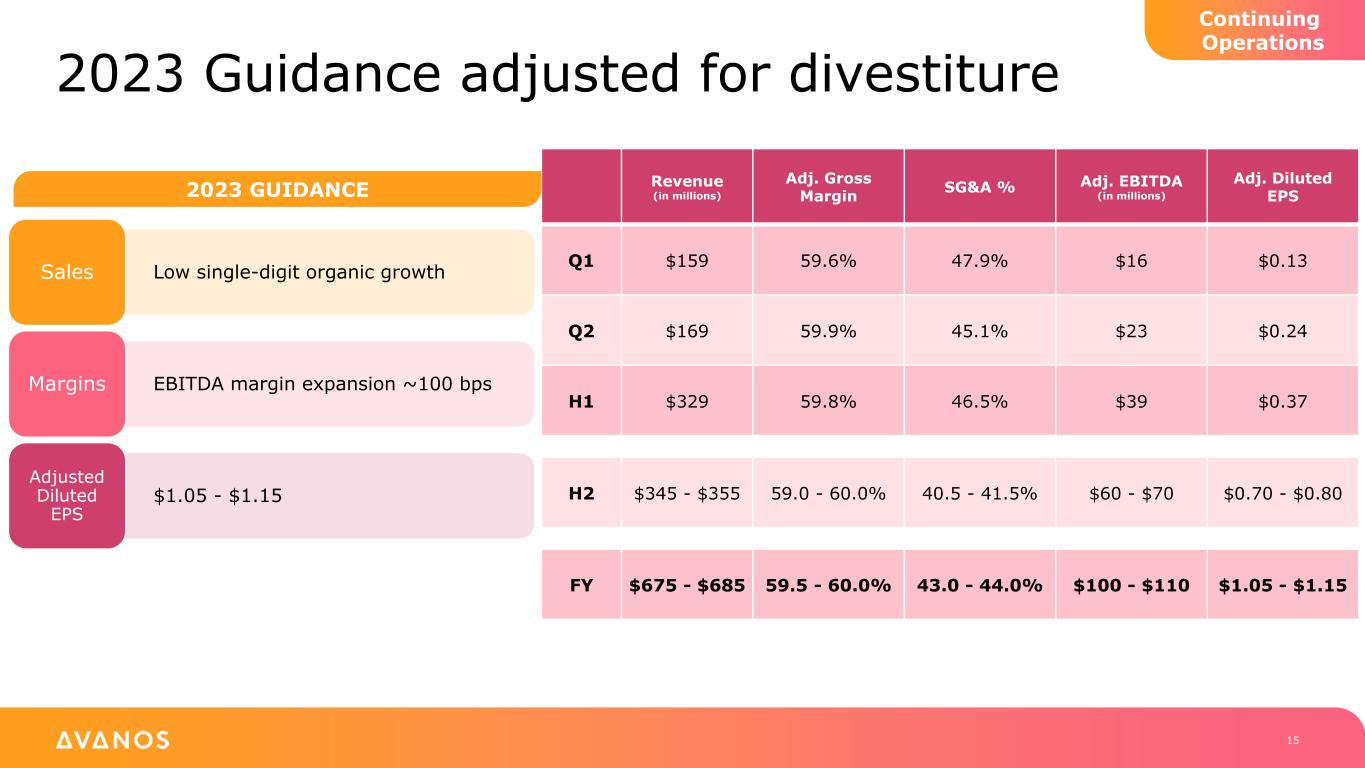
2023 Guidance adjusted for divestiture 15 Continuing Operations Revenue (in millions) Adj. Gross Margin SG&A % Adj. EBITDA (in millions) Adj. Diluted EPS Q1 $159 59.6% 47.9% $16 $0.13 Q2 $169 59.9% 45.1% $23 $0.24 H1 $329 59.8% 46.5% $39 $0.37 H2 $345 - $355 59.0 - 60.0% 40.5 - 41.5% $60 - $70 $0.70 - $0.80 FY $675 - $685 59.5 - 60.0% 43.0 - 44.0% $100 - $110 $1.05 - $1.15 Low single-digit organic growthSales EBITDA margin expansion ~100 bpsMargins $1.05 - $1.15 Adjusted Diluted EPS 2023 GUIDANCE
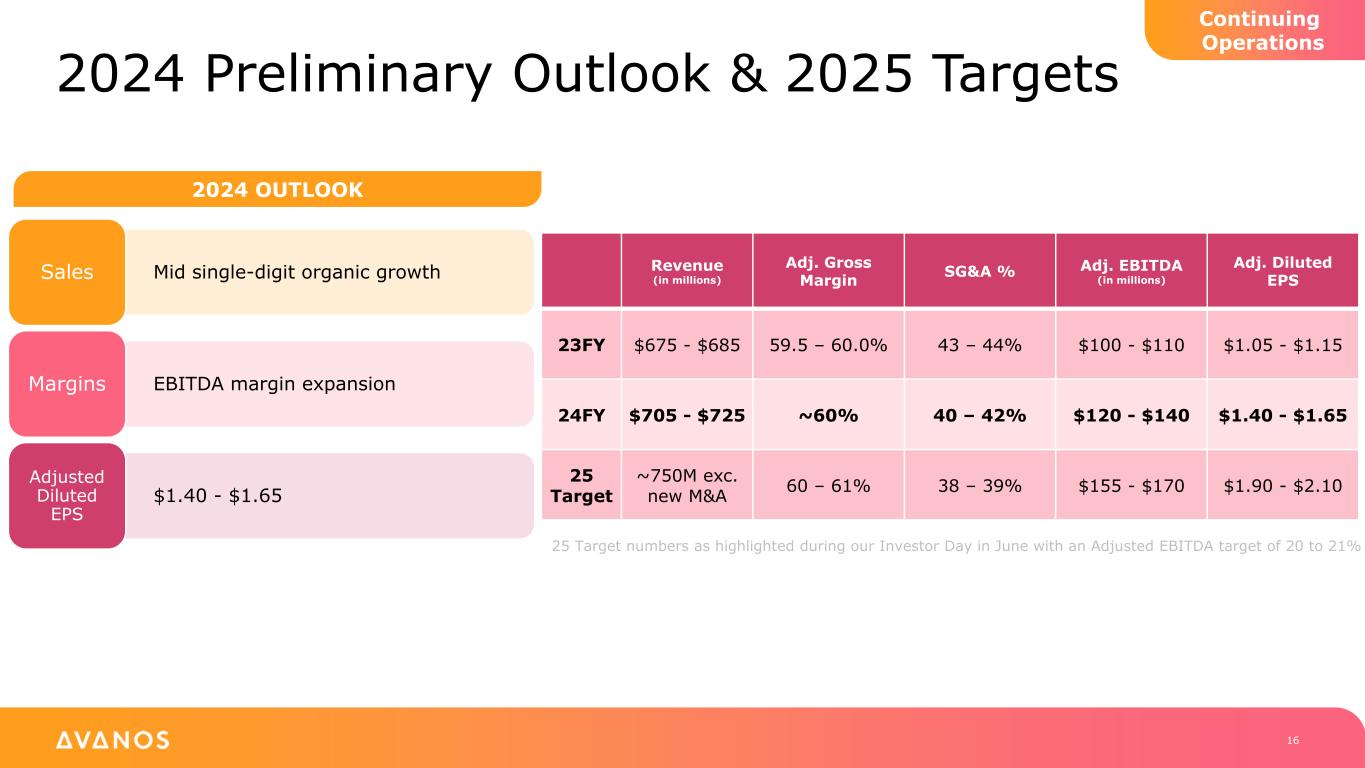
2024 Preliminary Outlook & 2025 Targets 16 Continuing Operations Mid single-digit organic growthSales EBITDA margin expansionMargins $1.40 - $1.65 Adjusted Diluted EPS Revenue (in millions) Adj. Gross Margin SG&A % Adj. EBITDA (in millions) Adj. Diluted EPS 23FY $675 - $685 59.5 – 60.0% 43 – 44% $100 - $110 $1.05 - $1.15 24FY $705 - $725 ~60% 40 – 42% $120 - $140 $1.40 - $1.65 25 Target ~750M exc. new M&A 60 – 61% 38 – 39% $155 - $170 $1.90 - $2.10 25 Target numbers as highlighted during our Investor Day in June with an Adjusted EBITDA target of 20 to 21% 2024 OUTLOOK
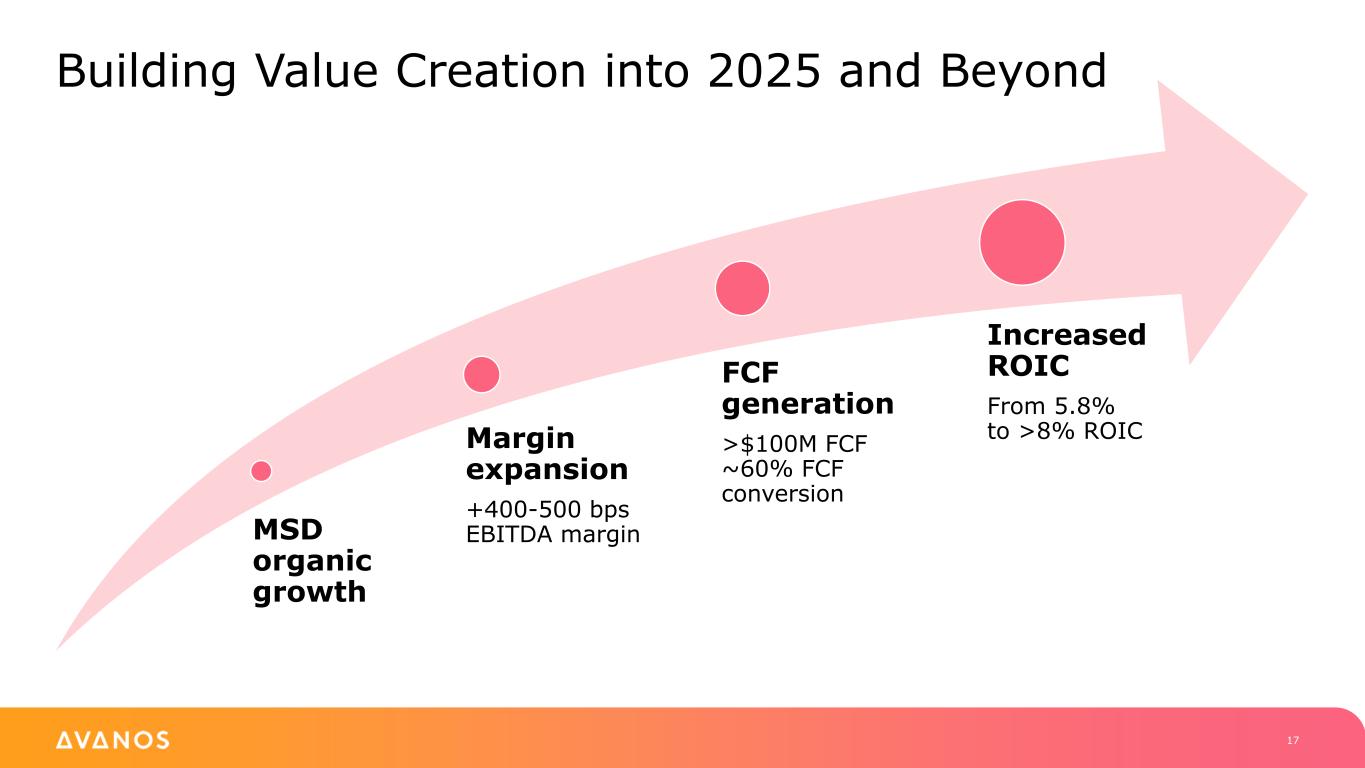
MSD organic growth Margin expansion +400-500 bps EBITDA margin FCF generation >$100M FCF ~60% FCF conversion Increased ROIC From 5.8% to >8% ROIC Building Value Creation into 2025 and Beyond 17

Thank You

APPENDICES Non-GAAP Reconciliations
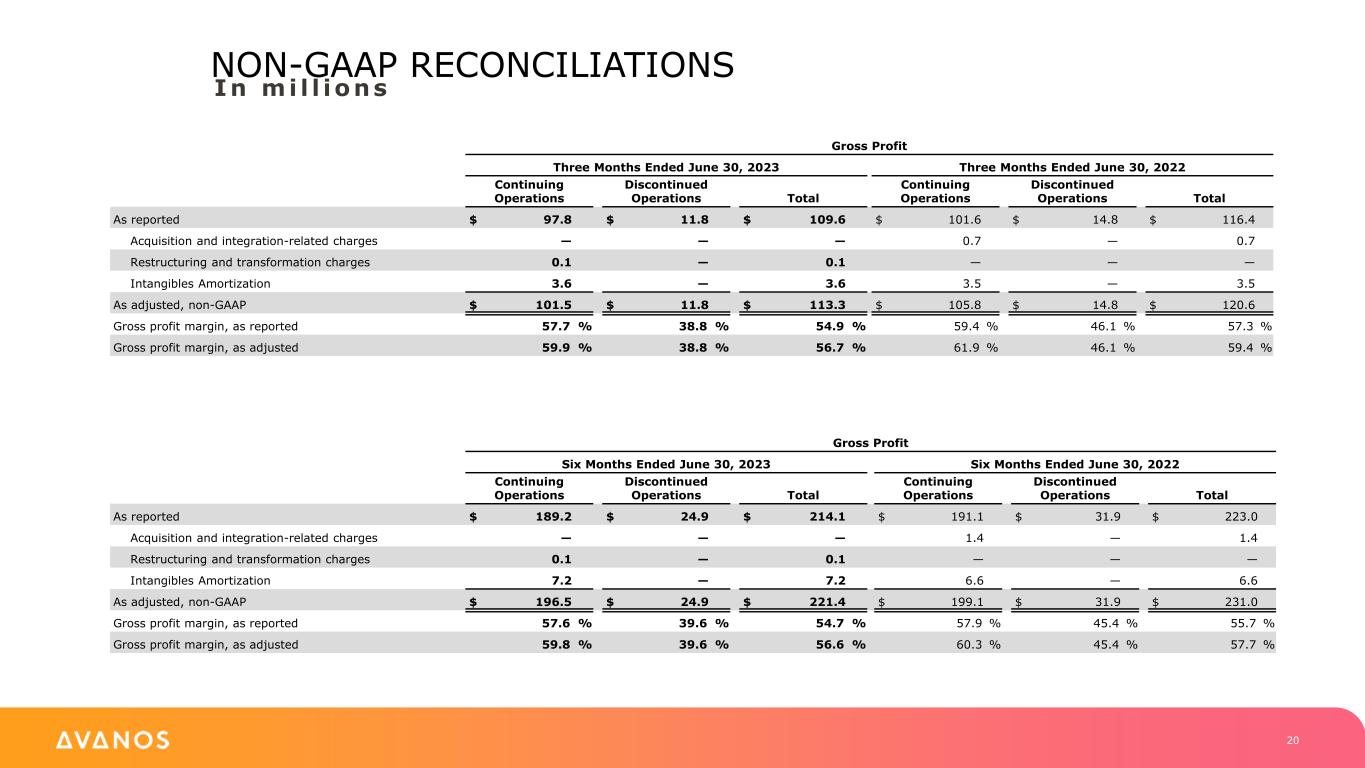
NON-GAAP RECONCILIATIONS In mi l l ions Gross Profit Three Months Ended June 30, 2023 Three Months Ended June 30, 2022 Continuing Operations Discontinued Operations Total Continuing Operations Discontinued Operations Total As reported $ 97.8 $ 11.8 $ 109.6 $ 101.6 $ 14.8 $ 116.4 Acquisition and integration-related charges — — — 0.7 — 0.7 Restructuring and transformation charges 0.1 — 0.1 — — — Intangibles Amortization 3.6 — 3.6 3.5 — 3.5 As adjusted, non-GAAP $ 101.5 $ 11.8 $ 113.3 $ 105.8 $ 14.8 $ 120.6 Gross profit margin, as reported 57.7 % 38.8 % 54.9 % 59.4 % 46.1 % 57.3 % Gross profit margin, as adjusted 59.9 % 38.8 % 56.7 % 61.9 % 46.1 % 59.4 % Gross Profit Six Months Ended June 30, 2023 Six Months Ended June 30, 2022 Continuing Operations Discontinued Operations Total Continuing Operations Discontinued Operations Total As reported $ 189.2 $ 24.9 $ 214.1 $ 191.1 $ 31.9 $ 223.0 Acquisition and integration-related charges — — — 1.4 — 1.4 Restructuring and transformation charges 0.1 — 0.1 — — — Intangibles Amortization 7.2 — 7.2 6.6 — 6.6 As adjusted, non-GAAP $ 196.5 $ 24.9 $ 221.4 $ 199.1 $ 31.9 $ 231.0 Gross profit margin, as reported 57.6 % 39.6 % 54.7 % 57.9 % 45.4 % 55.7 % Gross profit margin, as adjusted 59.8 % 39.6 % 56.6 % 60.3 % 45.4 % 57.7 % 20
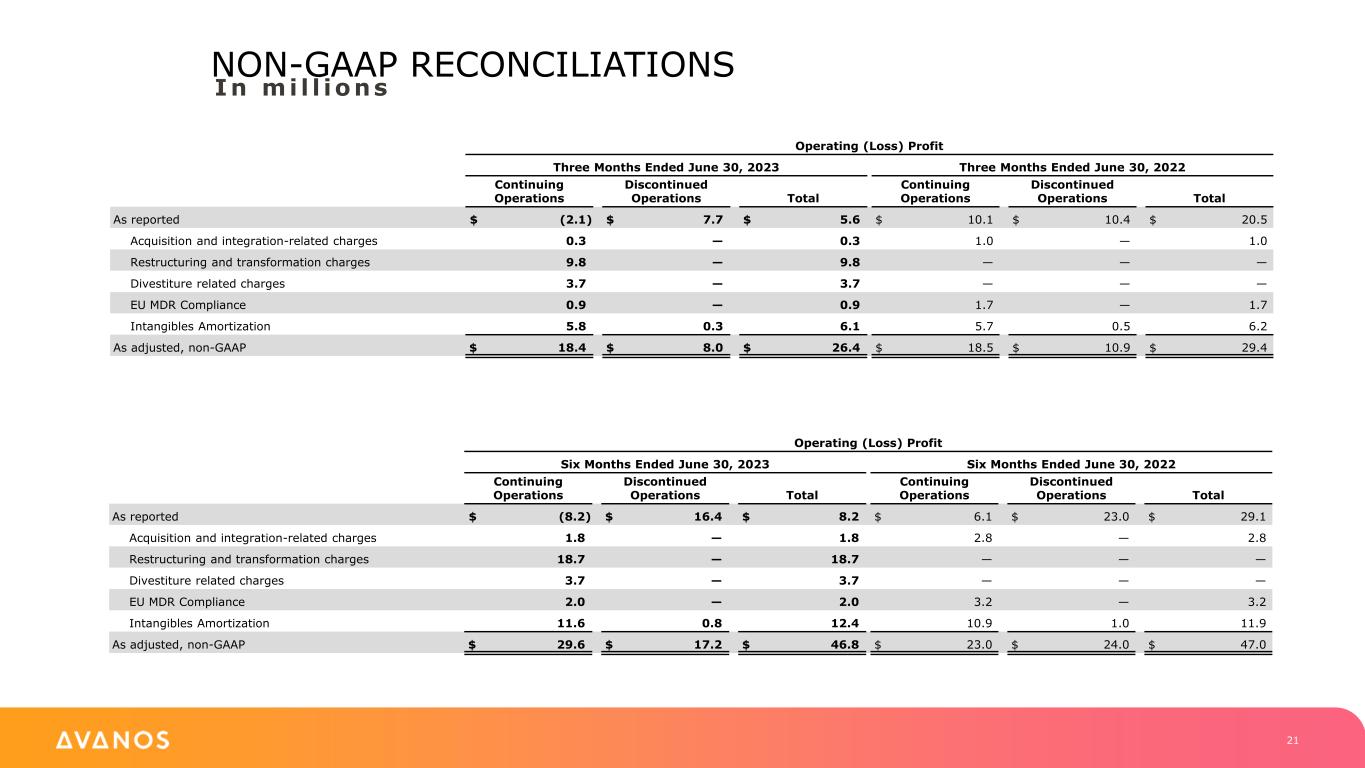
NON-GAAP RECONCILIATIONS In mi l l ions Operating (Loss) Profit Three Months Ended June 30, 2023 Three Months Ended June 30, 2022 Continuing Operations Discontinued Operations Total Continuing Operations Discontinued Operations Total As reported $ (2.1) $ 7.7 $ 5.6 $ 10.1 $ 10.4 $ 20.5 Acquisition and integration-related charges 0.3 — 0.3 1.0 — 1.0 Restructuring and transformation charges 9.8 — 9.8 — — — Divestiture related charges 3.7 — 3.7 — — — EU MDR Compliance 0.9 — 0.9 1.7 — 1.7 Intangibles Amortization 5.8 0.3 6.1 5.7 0.5 6.2 As adjusted, non-GAAP $ 18.4 $ 8.0 $ 26.4 $ 18.5 $ 10.9 $ 29.4 Operating (Loss) Profit Six Months Ended June 30, 2023 Six Months Ended June 30, 2022 Continuing Operations Discontinued Operations Total Continuing Operations Discontinued Operations Total As reported $ (8.2) $ 16.4 $ 8.2 $ 6.1 $ 23.0 $ 29.1 Acquisition and integration-related charges 1.8 — 1.8 2.8 — 2.8 Restructuring and transformation charges 18.7 — 18.7 — — — Divestiture related charges 3.7 — 3.7 — — — EU MDR Compliance 2.0 — 2.0 3.2 — 3.2 Intangibles Amortization 11.6 0.8 12.4 10.9 1.0 11.9 As adjusted, non-GAAP $ 29.6 $ 17.2 $ 46.8 $ 23.0 $ 24.0 $ 47.0 21
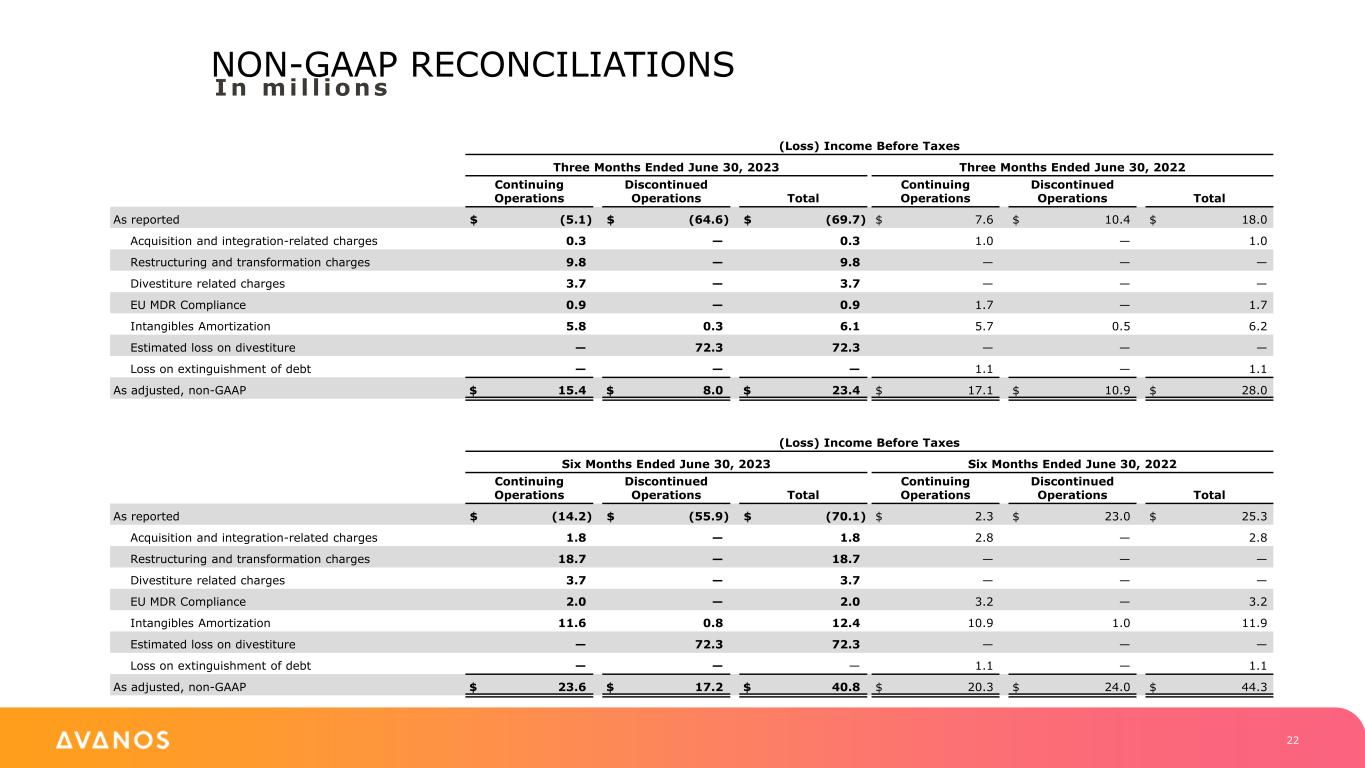
NON-GAAP RECONCILIATIONS In mi l l ions (Loss) Income Before Taxes Three Months Ended June 30, 2023 Three Months Ended June 30, 2022 Continuing Operations Discontinued Operations Total Continuing Operations Discontinued Operations Total As reported $ (5.1) $ (64.6) $ (69.7) $ 7.6 $ 10.4 $ 18.0 Acquisition and integration-related charges 0.3 — 0.3 1.0 — 1.0 Restructuring and transformation charges 9.8 — 9.8 — — — Divestiture related charges 3.7 — 3.7 — — — EU MDR Compliance 0.9 — 0.9 1.7 — 1.7 Intangibles Amortization 5.8 0.3 6.1 5.7 0.5 6.2 Estimated loss on divestiture — 72.3 72.3 — — — Loss on extinguishment of debt — — — 1.1 — 1.1 As adjusted, non-GAAP $ 15.4 $ 8.0 $ 23.4 $ 17.1 $ 10.9 $ 28.0 (Loss) Income Before Taxes Six Months Ended June 30, 2023 Six Months Ended June 30, 2022 Continuing Operations Discontinued Operations Total Continuing Operations Discontinued Operations Total As reported $ (14.2) $ (55.9) $ (70.1) $ 2.3 $ 23.0 $ 25.3 Acquisition and integration-related charges 1.8 — 1.8 2.8 — 2.8 Restructuring and transformation charges 18.7 — 18.7 — — — Divestiture related charges 3.7 — 3.7 — — — EU MDR Compliance 2.0 — 2.0 3.2 — 3.2 Intangibles Amortization 11.6 0.8 12.4 10.9 1.0 11.9 Estimated loss on divestiture — 72.3 72.3 — — — Loss on extinguishment of debt — — — 1.1 — 1.1 As adjusted, non-GAAP $ 23.6 $ 17.2 $ 40.8 $ 20.3 $ 24.0 $ 44.3 22
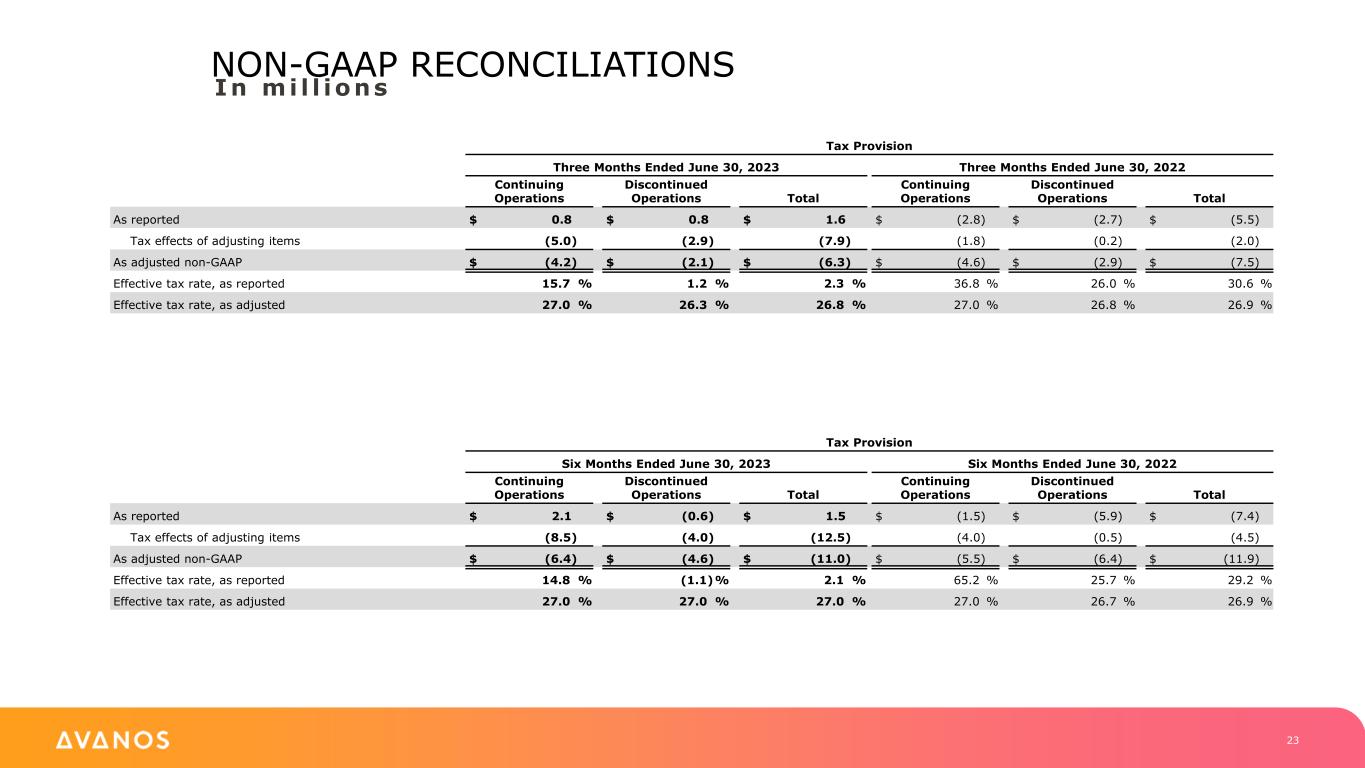
NON-GAAP RECONCILIATIONS In mi l l ions Tax Provision Six Months Ended June 30, 2023 Six Months Ended June 30, 2022 Continuing Operations Discontinued Operations Total Continuing Operations Discontinued Operations Total As reported $ 2.1 $ (0.6) $ 1.5 $ (1.5) $ (5.9) $ (7.4) Tax effects of adjusting items (8.5) (4.0) (12.5) (4.0) (0.5) (4.5) As adjusted non-GAAP $ (6.4) $ (4.6) $ (11.0) $ (5.5) $ (6.4) $ (11.9) Effective tax rate, as reported 14.8 % (1.1)% 2.1 % 65.2 % 25.7 % 29.2 % Effective tax rate, as adjusted 27.0 % 27.0 % 27.0 % 27.0 % 26.7 % 26.9 % Tax Provision Three Months Ended June 30, 2023 Three Months Ended June 30, 2022 Continuing Operations Discontinued Operations Total Continuing Operations Discontinued Operations Total As reported $ 0.8 $ 0.8 $ 1.6 $ (2.8) $ (2.7) $ (5.5) Tax effects of adjusting items (5.0) (2.9) (7.9) (1.8) (0.2) (2.0) As adjusted non-GAAP $ (4.2) $ (2.1) $ (6.3) $ (4.6) $ (2.9) $ (7.5) Effective tax rate, as reported 15.7 % 1.2 % 2.3 % 36.8 % 26.0 % 30.6 % Effective tax rate, as adjusted 27.0 % 26.3 % 26.8 % 27.0 % 26.8 % 26.9 % 23
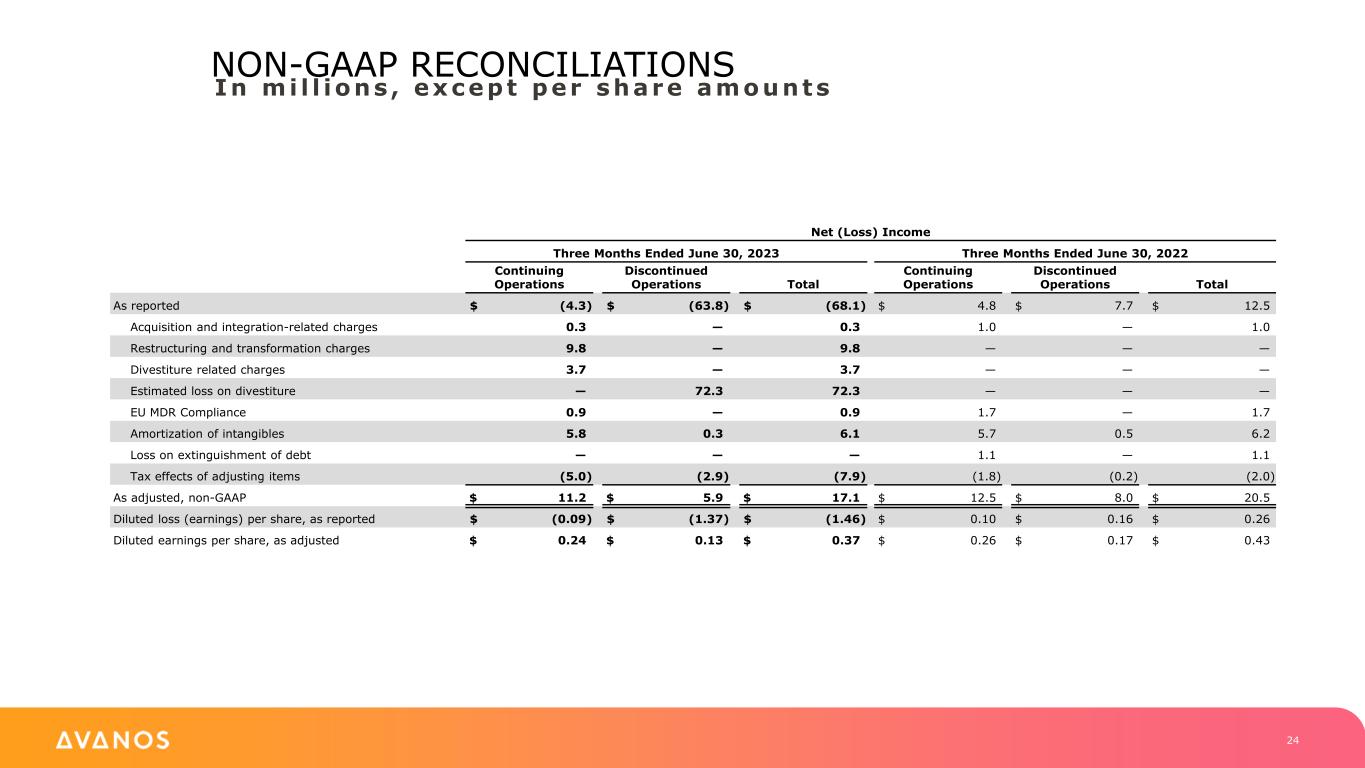
NON-GAAP RECONCILIATIONS In mi l l ions , except per share amounts Net (Loss) Income Three Months Ended June 30, 2023 Three Months Ended June 30, 2022 Continuing Operations Discontinued Operations Total Continuing Operations Discontinued Operations Total As reported $ (4.3) $ (63.8) $ (68.1) $ 4.8 $ 7.7 $ 12.5 Acquisition and integration-related charges 0.3 — 0.3 1.0 — 1.0 Restructuring and transformation charges 9.8 — 9.8 — — — Divestiture related charges 3.7 — 3.7 — — — Estimated loss on divestiture — 72.3 72.3 — — — EU MDR Compliance 0.9 — 0.9 1.7 — 1.7 Amortization of intangibles 5.8 0.3 6.1 5.7 0.5 6.2 Loss on extinguishment of debt — — — 1.1 — 1.1 Tax effects of adjusting items (5.0) (2.9) (7.9) (1.8) (0.2) (2.0) As adjusted, non-GAAP $ 11.2 $ 5.9 $ 17.1 $ 12.5 $ 8.0 $ 20.5 Diluted loss (earnings) per share, as reported $ (0.09) $ (1.37) $ (1.46) $ 0.10 $ 0.16 $ 0.26 Diluted earnings per share, as adjusted $ 0.24 $ 0.13 $ 0.37 $ 0.26 $ 0.17 $ 0.43 24
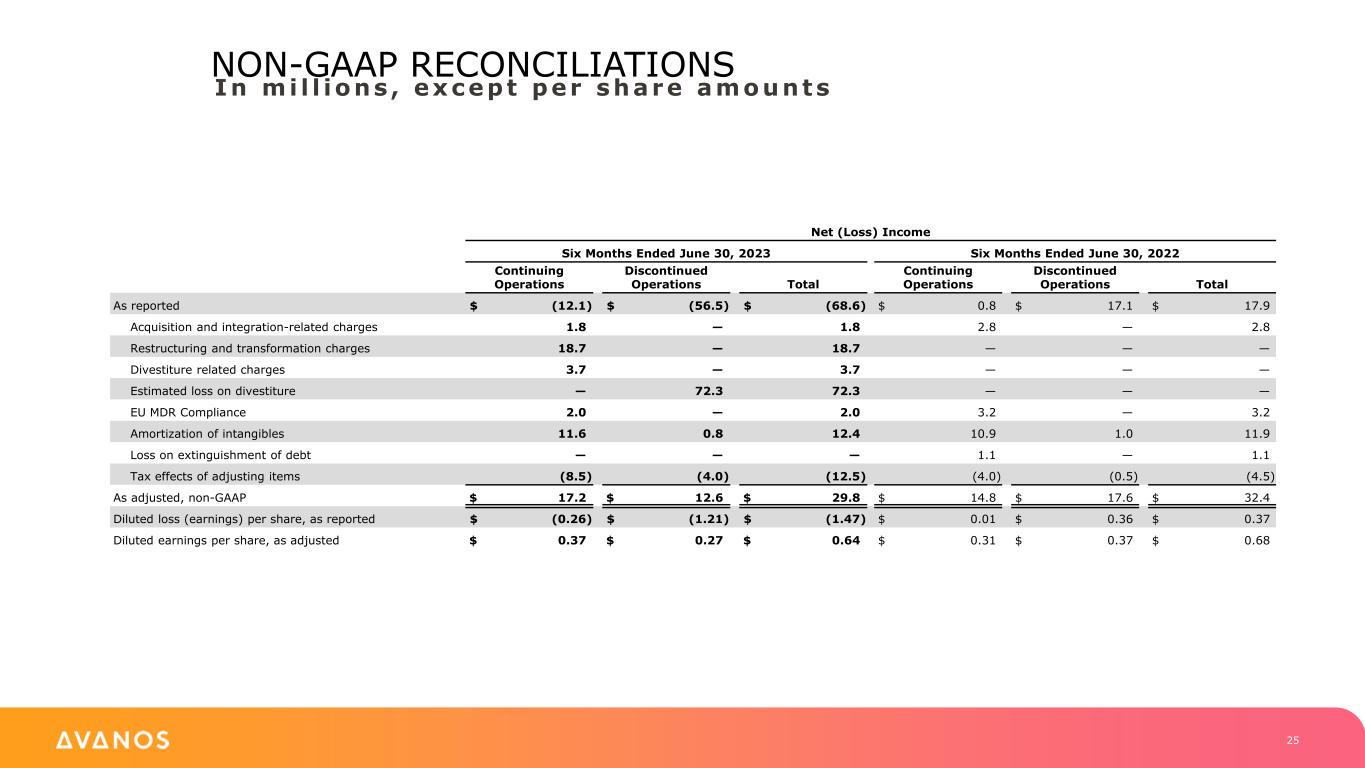
NON-GAAP RECONCILIATIONS In mi l l ions , except per share amounts Net (Loss) Income Six Months Ended June 30, 2023 Six Months Ended June 30, 2022 Continuing Operations Discontinued Operations Total Continuing Operations Discontinued Operations Total As reported $ (12.1) $ (56.5) $ (68.6) $ 0.8 $ 17.1 $ 17.9 Acquisition and integration-related charges 1.8 — 1.8 2.8 — 2.8 Restructuring and transformation charges 18.7 — 18.7 — — — Divestiture related charges 3.7 — 3.7 — — — Estimated loss on divestiture — 72.3 72.3 — — — EU MDR Compliance 2.0 — 2.0 3.2 — 3.2 Amortization of intangibles 11.6 0.8 12.4 10.9 1.0 11.9 Loss on extinguishment of debt — — — 1.1 — 1.1 Tax effects of adjusting items (8.5) (4.0) (12.5) (4.0) (0.5) (4.5) As adjusted, non-GAAP $ 17.2 $ 12.6 $ 29.8 $ 14.8 $ 17.6 $ 32.4 Diluted loss (earnings) per share, as reported $ (0.26) $ (1.21) $ (1.47) $ 0.01 $ 0.36 $ 0.37 Diluted earnings per share, as adjusted $ 0.37 $ 0.27 $ 0.64 $ 0.31 $ 0.37 $ 0.68 25
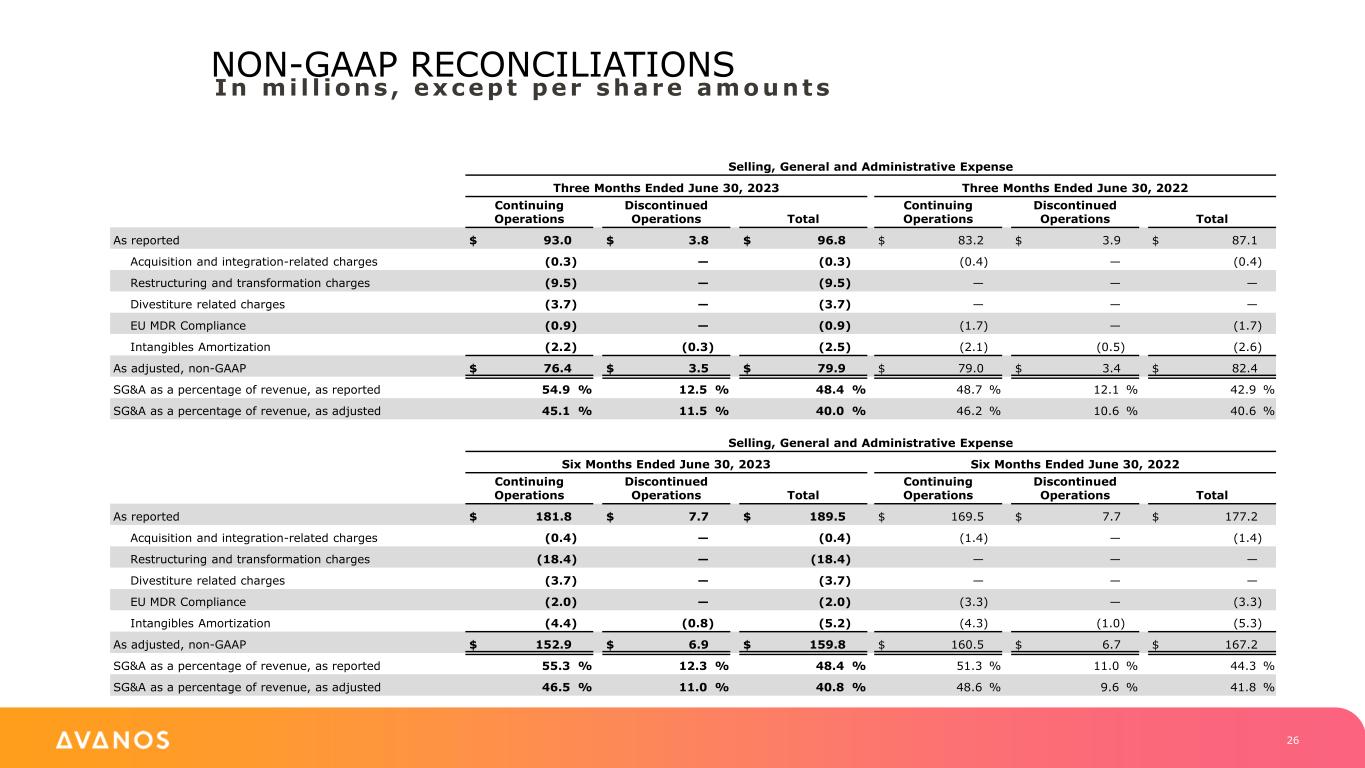
NON-GAAP RECONCILIATIONS In mi l l ions , except per share amounts Selling, General and Administrative Expense Three Months Ended June 30, 2023 Three Months Ended June 30, 2022 Continuing Operations Discontinued Operations Total Continuing Operations Discontinued Operations Total As reported $ 93.0 $ 3.8 $ 96.8 $ 83.2 $ 3.9 $ 87.1 Acquisition and integration-related charges (0.3) — (0.3) (0.4) — (0.4) Restructuring and transformation charges (9.5) — (9.5) — — — Divestiture related charges (3.7) — (3.7) — — — EU MDR Compliance (0.9) — (0.9) (1.7) — (1.7) Intangibles Amortization (2.2) (0.3) (2.5) (2.1) (0.5) (2.6) As adjusted, non-GAAP $ 76.4 $ 3.5 $ 79.9 $ 79.0 $ 3.4 $ 82.4 SG&A as a percentage of revenue, as reported 54.9 % 12.5 % 48.4 % 48.7 % 12.1 % 42.9 % SG&A as a percentage of revenue, as adjusted 45.1 % 11.5 % 40.0 % 46.2 % 10.6 % 40.6 % Selling, General and Administrative Expense Six Months Ended June 30, 2023 Six Months Ended June 30, 2022 Continuing Operations Discontinued Operations Total Continuing Operations Discontinued Operations Total As reported $ 181.8 $ 7.7 $ 189.5 $ 169.5 $ 7.7 $ 177.2 Acquisition and integration-related charges (0.4) — (0.4) (1.4) — (1.4) Restructuring and transformation charges (18.4) — (18.4) — — — Divestiture related charges (3.7) — (3.7) — — — EU MDR Compliance (2.0) — (2.0) (3.3) — (3.3) Intangibles Amortization (4.4) (0.8) (5.2) (4.3) (1.0) (5.3) As adjusted, non-GAAP $ 152.9 $ 6.9 $ 159.8 $ 160.5 $ 6.7 $ 167.2 SG&A as a percentage of revenue, as reported 55.3 % 12.3 % 48.4 % 51.3 % 11.0 % 44.3 % SG&A as a percentage of revenue, as adjusted 46.5 % 11.0 % 40.8 % 48.6 % 9.6 % 41.8 % 26
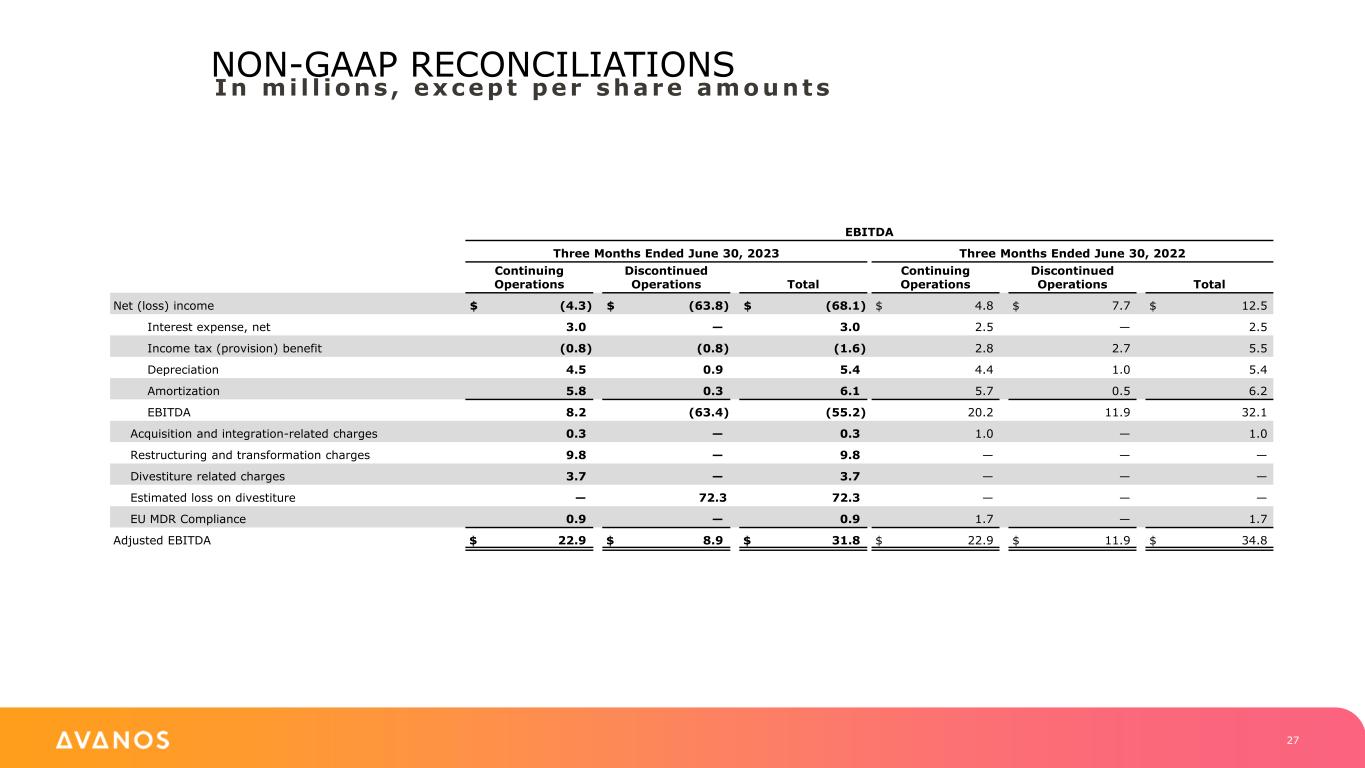
NON-GAAP RECONCILIATIONS In mi l l ions , except per share amounts EBITDA Three Months Ended June 30, 2023 Three Months Ended June 30, 2022 Continuing Operations Discontinued Operations Total Continuing Operations Discontinued Operations Total Net (loss) income $ (4.3) $ (63.8) $ (68.1) $ 4.8 $ 7.7 $ 12.5 Interest expense, net 3.0 — 3.0 2.5 — 2.5 Income tax (provision) benefit (0.8) (0.8) (1.6) 2.8 2.7 5.5 Depreciation 4.5 0.9 5.4 4.4 1.0 5.4 Amortization 5.8 0.3 6.1 5.7 0.5 6.2 EBITDA 8.2 (63.4) (55.2) 20.2 11.9 32.1 Acquisition and integration-related charges 0.3 — 0.3 1.0 — 1.0 Restructuring and transformation charges 9.8 — 9.8 — — — Divestiture related charges 3.7 — 3.7 — — — Estimated loss on divestiture — 72.3 72.3 — — — EU MDR Compliance 0.9 — 0.9 1.7 — 1.7 Adjusted EBITDA $ 22.9 $ 8.9 $ 31.8 $ 22.9 $ 11.9 $ 34.8 27
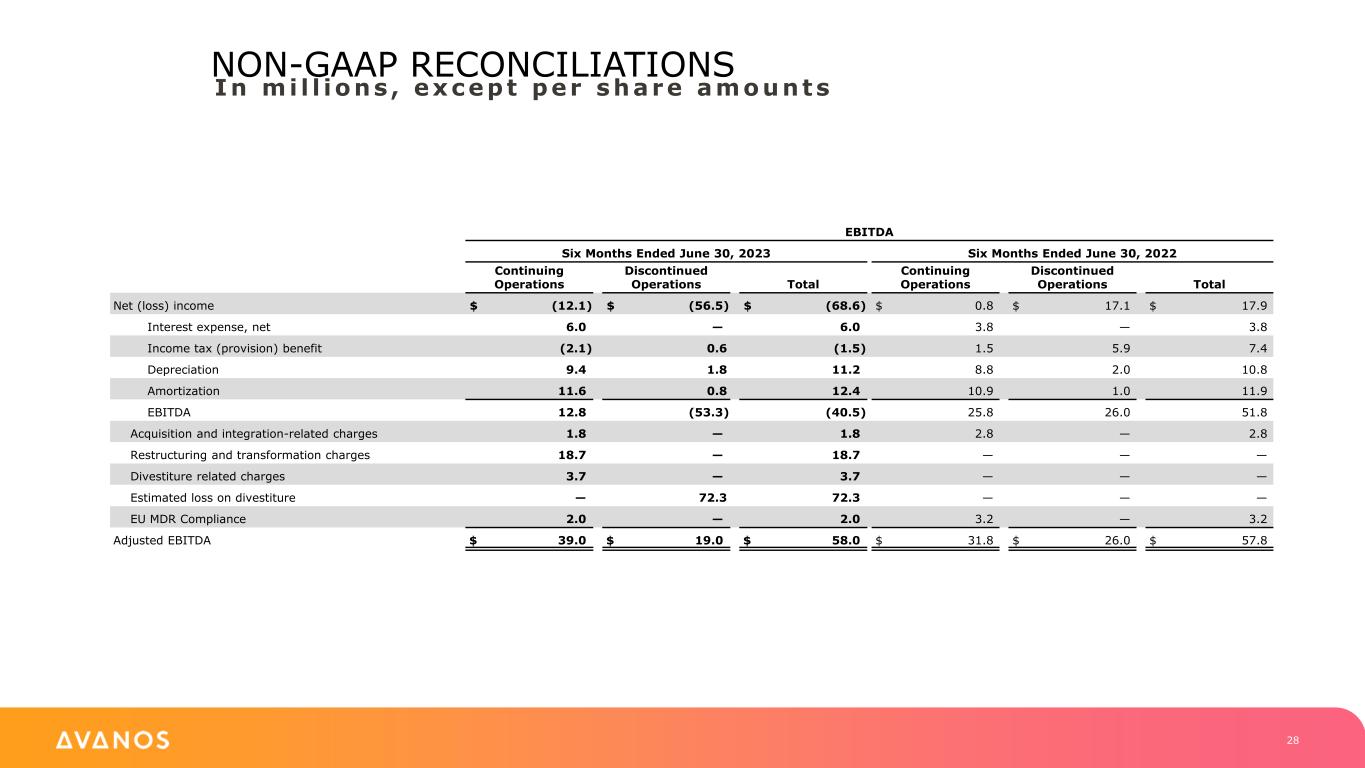
NON-GAAP RECONCILIATIONS In mi l l ions , except per share amounts EBITDA Six Months Ended June 30, 2023 Six Months Ended June 30, 2022 Continuing Operations Discontinued Operations Total Continuing Operations Discontinued Operations Total Net (loss) income $ (12.1) $ (56.5) $ (68.6) $ 0.8 $ 17.1 $ 17.9 Interest expense, net 6.0 — 6.0 3.8 — 3.8 Income tax (provision) benefit (2.1) 0.6 (1.5) 1.5 5.9 7.4 Depreciation 9.4 1.8 11.2 8.8 2.0 10.8 Amortization 11.6 0.8 12.4 10.9 1.0 11.9 EBITDA 12.8 (53.3) (40.5) 25.8 26.0 51.8 Acquisition and integration-related charges 1.8 — 1.8 2.8 — 2.8 Restructuring and transformation charges 18.7 — 18.7 — — — Divestiture related charges 3.7 — 3.7 — — — Estimated loss on divestiture — 72.3 72.3 — — — EU MDR Compliance 2.0 — 2.0 3.2 — 3.2 Adjusted EBITDA $ 39.0 $ 19.0 $ 58.0 $ 31.8 $ 26.0 $ 57.8 28

NON-GAAP RECONCILIATIONS In mi l l ions , except per share amounts Free Cash Flow Three Months Ended June 30, Six Months Ended June 30, 2023 2022 2023 2022 Cash provided by (used in) operating activities $ (2.6) $ 27.0 $ (9.4) $ 28.8 Capital expenditures (4.0) (4.1) (8.0) (9.1) Free Cash Flow $ (6.6) $ 22.9 $ (17.4) $ 19.7 2023 Outlook Estimated Range Diluted earnings per share (GAAP) $ (1.21) to $ (0.77) Intangibles amortization 0.37 to 0.37 Restructuring and transformation 0.42 to 0.35 EU Medical Device Regulation 0.16 to 0.13 Divestiture related charges 0.16 to 0.13 Estimated loss on divestiture 1.23 to 1.01 Other (0.08) to (0.07) Adjusted diluted earnings per share (non-GAAP) $ 1.05 to $ 1.15 Continuing Operations 29


