Exhibit 99.1
157 27 26 110 162 210 4 112 173 177 175 174 191 214 235 217 217 217 Introductory Presentation October 2014
157 27 26 110 162 210 4 112 173 177 175 174 191 214 235 217 217 217 Safe Harbor This presentation includes certain forward - looking statements within the meaning of the Private Securities Litigation Reform Act of 1995 , including statements regarding future financial performance, future growth and future acquisitions . These statements are based on Pangaea’s and managements ’ current expectations or beliefs and are subject to uncertainty and changes in circumstances . Actual results may vary materially from those expressed or implied by the statements herein due to changes in economic, business, competitive and/or regulatory factors, and other risks and uncertainties affecting the operation of Pangaea’s business . These risks, uncertainties and contingencies include : business conditions ; weather and natural disasters ; changing interpretations of GAAP ; outcomes of government reviews ; inquiries and investigations and related litigation ; continued compliance with government regulations ; legislation or regulatory environments ; requirements or changes adversely affecting the business in which Pangaea is engaged ; fluctuations in customer demand ; management of rapid growth ; intensity of competition from other providers of logistics and shipping services ; general economic conditions ; geopolitical events and regulatory changes ; the possibility that the merger does not close, including due to the failure to receive required security holder approvals or the failure of other closing conditions ; and other factors set forth in Pangaea’s filings with the Securities and Exchange Commission and the filings of its predecessors . The information set forth herein should be read in light of such risks . Further, investors should keep in mind that certain of Pangaea’s financial results are unaudited and do not conform to SEC Regulation S - X and as a result such information may fluctuate materially depending on many factors . Accordingly, Pangaea’s financial results in any particular period may not be indicative of future results . Pangaea is under any obligation to, and expressly disclaims any obligation to, update or alter its forward - looking statements, whether as a result of new information, future events, changes in assumptions or otherwise .
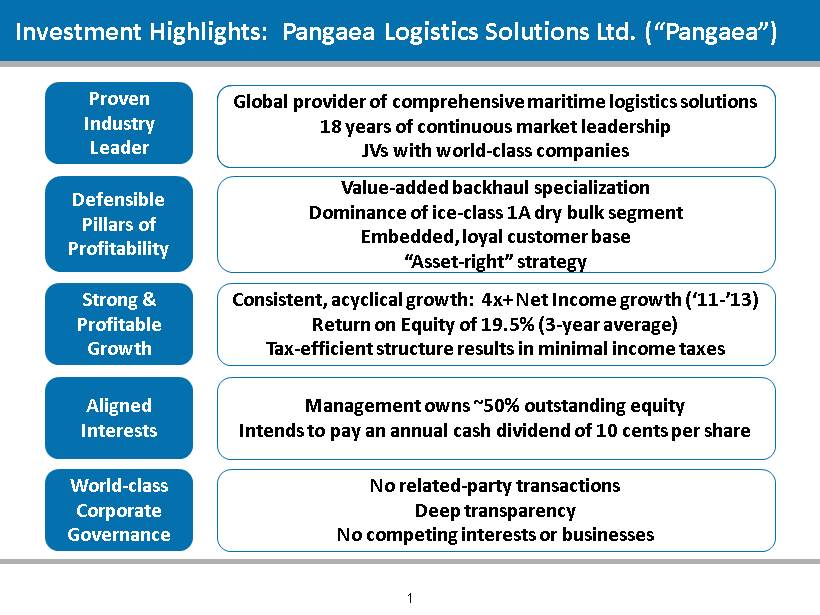
157 27 26 110 162 210 4 112 173 177 175 174 191 214 235 217 217 217 Investment Highlights: Pangaea Logistics Solutions Ltd. (“Pangaea”) Strong & Profitable Growth Proven Industry Leader Aligned Interests World - class Corporate Governance Defensible Pillars of Profitability Value - added backhaul specialization Dominance of ice - class 1A dry bulk segment Embedded, loyal customer base “Asset - right” strategy Consistent, acyclical growth: 4x+ Net Income growth (‘11 - ’13) Return on Equity of 19.5 % (3 - year average) Tax - efficient structure results in minimal income taxes Management owns ~50% outstanding equity Intends to pay an annual cash dividend of 10 cents per share No related - party transactions Deep transparency No competing interests or businesses Global provider of comprehensive maritime logistics solutions 18 years of continuous market leadership JVs with world - class companies 1
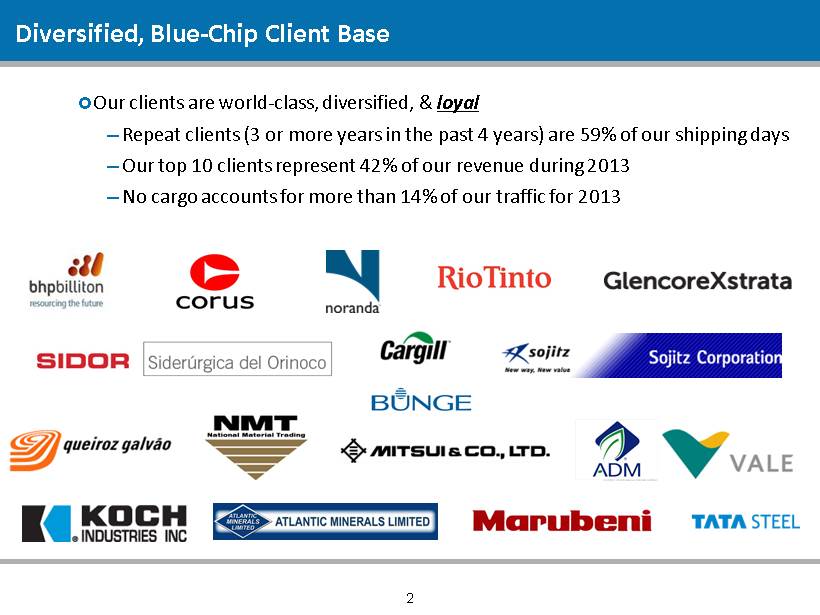
157 27 26 110 162 210 4 112 173 177 175 174 191 214 235 217 217 217 Diversified, Blue - Chip Client Base Our clients are world - class, diversified, & loyal ─ Repeat clients ( 3 or more years in the past 4 years) are 59% of our shipping days ─ Our top 10 clients represent 42% of our revenue during 2013 ─ No cargo accounts for more than 14% of our traffic for 2013 2

157 27 26 110 162 210 4 112 173 177 175 174 191 214 235 217 217 217 Pangaea’s Team 5 offices with 69 professionals, including 11 nationalities 18 years of operations: origins in grain fronthaul & pig iron backhaul Management team (10 members) possesses combined 250+ years of experience Operates fleet of 45 - 60 vessels (from handy to panamax ) Carriage of over 19.5m DWT of cargo in 2013 to more than 190 ports Headquarters 22 employees United States 5 employees Brazil Nordic Bulk Carriers 14 employees Denmark 25 employees Greece 3 employees Singapore 3
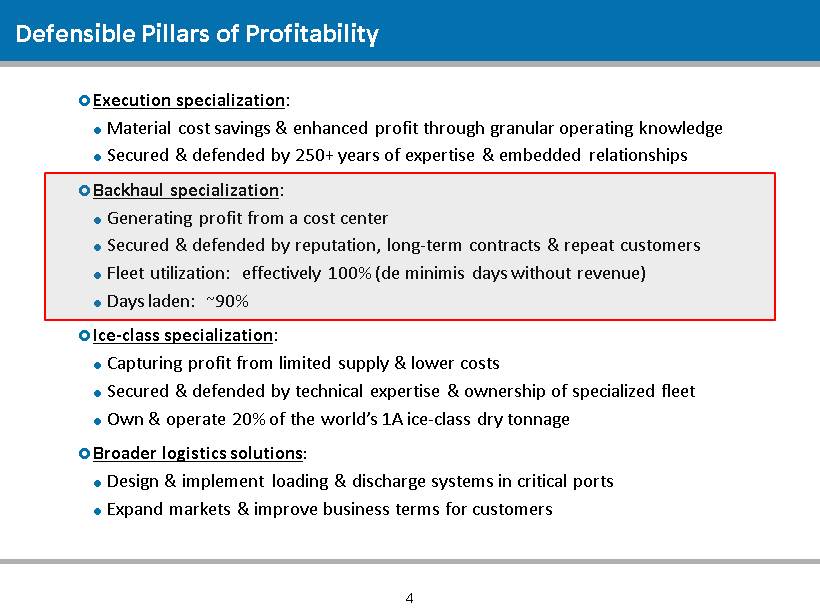
157 27 26 110 162 210 4 112 173 177 175 174 191 214 235 217 217 217 Defensible Pillars of Profitability Execution specialization : Material cost savings & enhanced profit through granular operating knowledge Secured & defended by 250+ years of expertise & embedded relationships Backhaul specialization : Generating profit from a cost center Secured & defended by reputation, long - term contracts & repeat customers Fleet utilization: effectively 100% (de minimis days without revenue ) Days laden: ~90% Ice - class specialization : Capturing profit from limited supply & lower costs Secured & defended by technical expertise & ownership of specialized fleet Own & operate 20 % of the world’s 1A ice - class dry tonnage Broader logistics solutions : Design & implement loading & discharge systems in critical ports Expand markets & improve business terms for customers 4
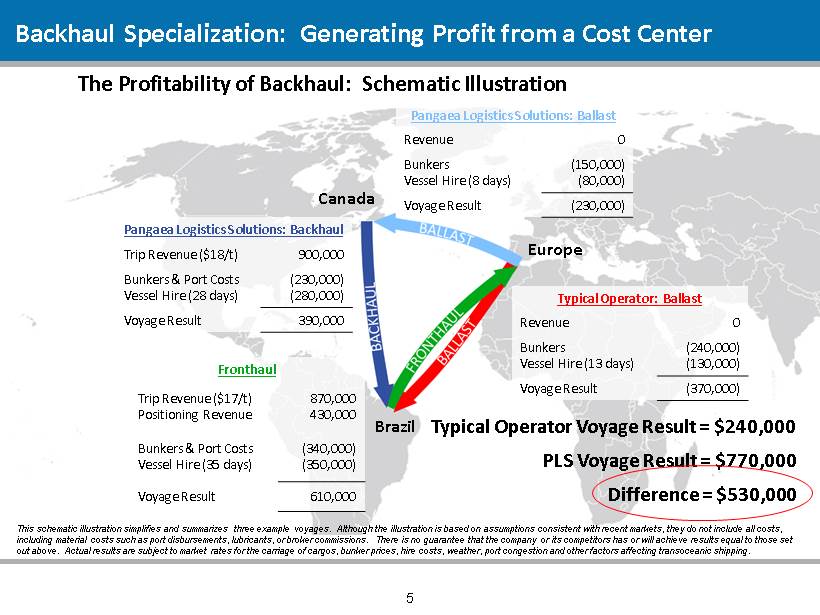
157 27 26 110 162 210 4 112 173 177 175 174 191 214 235 217 217 217 Backhaul Specialization: Generating Profit from a Cost Center 5 Europe Brazil Canada Fronthaul Trip Revenue ($17/t) Positioning Revenue 870,000 430,000 Bunkers & Port Costs Vessel Hire (35 days) (340,000) (350,000) Voyage Result 610,000 Typical Operator: Ballast Revenue 0 Bunkers Vessel Hire (13 days) (240,000) (130,000) Voyage Result (370,000) Typical Operator Voyage Result = $240,000 Pangaea Logistics Solutions: Ballast Revenue 0 Bunkers Vessel Hire (8 days) (150,000) (80,000) Voyage Result (230,000) Pangaea Logistics Solutions: Backhaul Trip Revenue ($18/t) 900,000 Bunkers & Port Costs Vessel Hire (28 days) (230,000) (280,000) Voyage Result 390,000 Difference = $530,000 PLS Voyage Result = $770,000 The Profitability of Backhaul: Schematic Illustration This schematic illustration simplifies and summarizes three example voyages. Although the illustration is based on assumptions co nsi stent with recent markets, they do not include all costs, including material costs such as port disbursements, lubricants, or broker commissions. There is no guarantee that the compa ny or its competitors has or will achieve results equal to those set out above. Actual results are subject to market rates for the carriage of cargos, bunker prices, hire costs, weather, port c ong estion and other factors affecting transoceanic shipping .
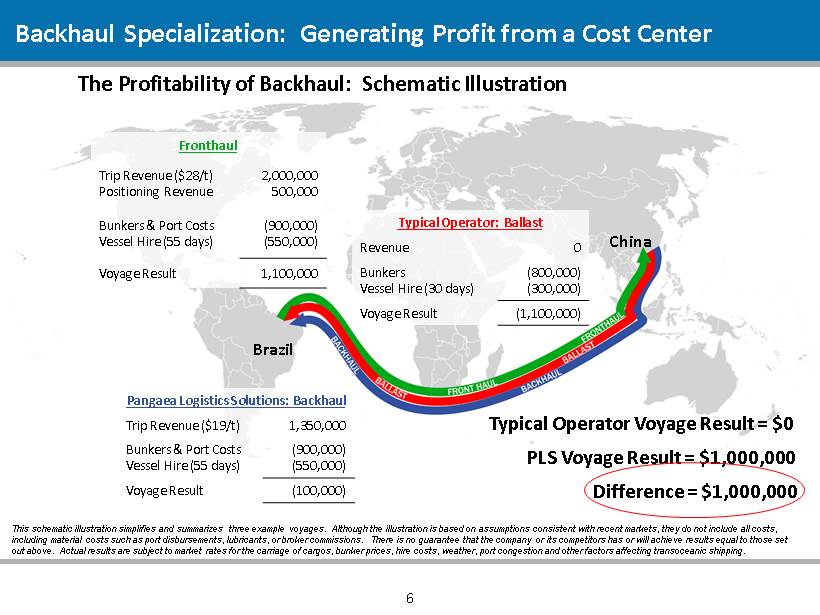
157 27 26 110 162 210 4 112 173 177 175 174 191 214 235 217 217 217 Backhaul Specialization: Generating Profit from a Cost Center The Profitability of Backhaul: Schematic Illustration 6 China Brazil Fronthaul Trip Revenue ($28/t) Positioning Revenue 2,000,000 500,000 Bunkers & Port Costs Vessel Hire (55 days) (900,000) (550,000) Voyage Result 1,100,000 Typical Operator: Ballast Revenue 0 Bunkers Vessel Hire (30 days) (800,000) (300,000) Voyage Result (1,100,000) Typical Operator Voyage Result = $0 Pangaea Logistics Solutions: Backhaul Trip Revenue ($19/t) 1,350,000 Bunkers & Port Costs Vessel Hire (55 days) (900,000) (550,000) Voyage Result (100,000) Difference = $1,000,000 PLS Voyage Result = $1,000,000 This schematic illustration simplifies and summarizes three example voyages. Although the illustration is based on assumptions co nsi stent with recent markets, they do not include all costs, including material costs such as port disbursements, lubricants, or broker commissions. There is no guarantee that the compa ny or its competitors has or will achieve results equal to those set out above. Actual results are subject to market rates for the carriage of cargos, bunker prices, hire costs, weather, port c ong estion and other factors affecting transoceanic shipping .

157 27 26 110 162 210 4 112 173 177 175 174 191 214 235 217 217 217 Backhaul Specialization: A Source of Profitability & Stability Deep client relationships & proven reputation drive our backhaul practice: Majority of backhaul days for repeat, longstanding customers Majority of backhaul days derived from Contracts of Affreightment (“CoA”s) 30% of backhaul days derived from new routes we created for customers Backhaul business is secured on expertise, not price High - quality, long - term COAs provide visibility: 10 - year CoA for bauxite from Caribbean to US 6 - year CoA for limestone from Canada to Brazil 3 - 5 year CoA for alumina from Brazil to Canada 2 - 3 year CoA for cement clinker from China to Brazil 1 - 2 year CoA for pig iron from Brazil to US 1 - year CoA for dolomite from Canada to Venezuela 7
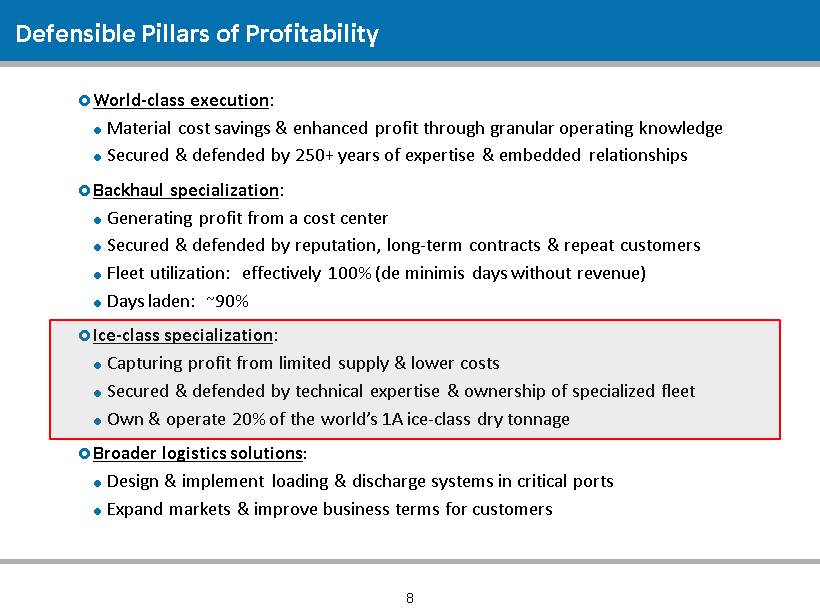
157 27 26 110 162 210 4 112 173 177 175 174 191 214 235 217 217 217 Defensible Pillars of Profitability World - class execution : Material cost savings & enhanced profit through granular operating knowledge Secured & defended by 250+ years of expertise & embedded relationships Backhaul specialization : Generating profit from a cost center Secured & defended by reputation, long - term contracts & repeat customers Fleet utilization: effectively 100% (de minimis days without revenue ) Days laden: ~90% Ice - class specialization : Capturing profit from limited supply & lower costs Secured & defended by technical expertise & ownership of specialized fleet Own & operate 20 % of the world’s 1A ice - class dry tonnage Broader logistics solutions : Design & implement loading & discharge systems in critical ports Expand markets & improve business terms for customers 8
157 27 26 110 162 210 4 112 173 177 175 174 191 214 235 217 217 217 A very attractive, low - competition, premium - rate trade Northern routes in winter: minimal choices for service at ice - bound ports Polar routes in summer: far more efficient routes improve profits significantly ─ Dramatically reduce time & fuel requirements ─ Significantly increase cargo capacity ─ All with notably lower CO 2 emissions We pioneered these routes: First non - Russian dry bulk vessel to transit the Northern Sea Route First dry bulk vessel to transit the Northwest Passage We dominate the 1A ice - class dry bulk ocean - going trade : Only 0.3% of all dry tonnage in the world is rated “1A ice - class” We expect to own a majority of the world’s 1A Panamax fleet for the foreseeable future Ice - Class Specialization: Premium Rates Generate Superior Profits We own & control 20% of the world’s 1A ice - class dry tonnage 9
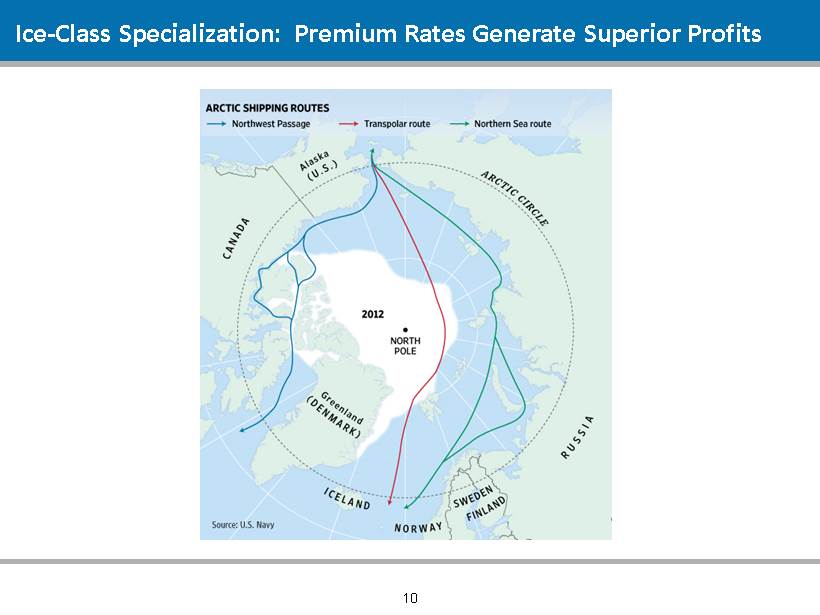
157 27 26 110 162 210 4 112 173 177 175 174 191 214 235 217 217 217 Ice - Class Specialization: Premium Rates Generate Superior Profits 10
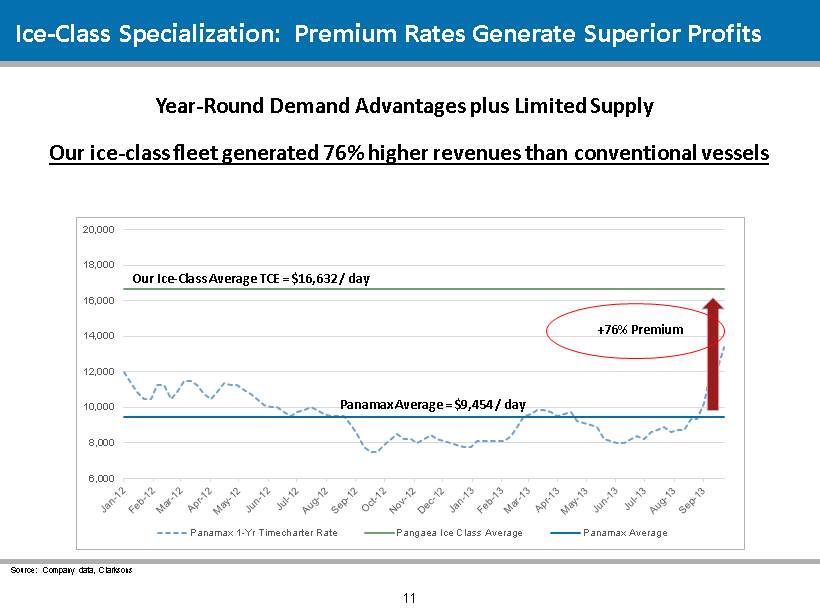
157 27 26 110 162 210 4 112 173 177 175 174 191 214 235 217 217 217 6,000 8,000 10,000 12,000 14,000 16,000 18,000 20,000 Panamax 1-Yr Timecharter Rate Pangaea Ice Class Average Panamax Average Ice - Class Specialization: Premium Rates Generate Superior Profits Our Ice - Class Average TCE = $16,632 / day Panamax Average = $9,454 / day +76% Premium Our ice - class fleet generated 76% higher revenues than conventional vessels Year - Round Demand Advantages plus Limited Supply 11 Source: Company data, Clarksons
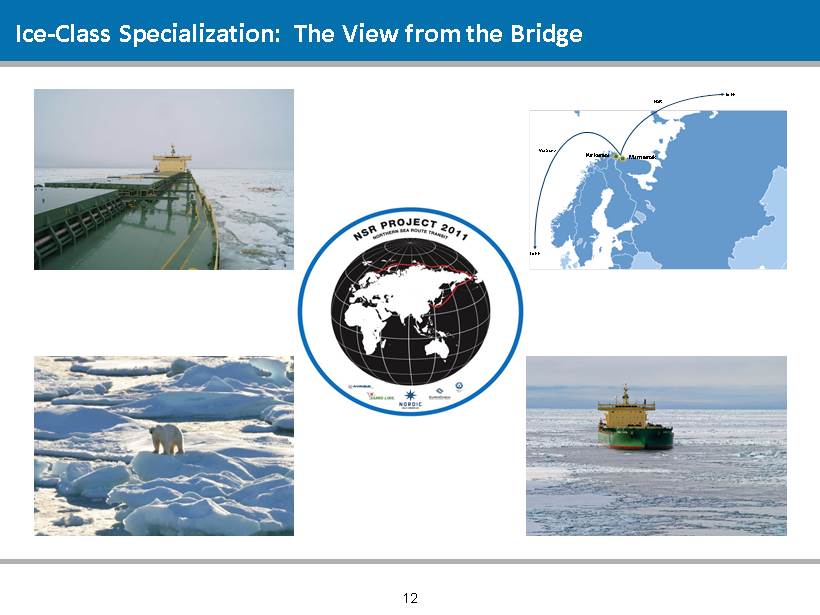
157 27 26 110 162 210 4 112 173 177 175 174 191 214 235 217 217 217 Ice - Class Specialization: The View from the Bridge NSR to FE Via Suez to FE Murmansk Kirkenes 12
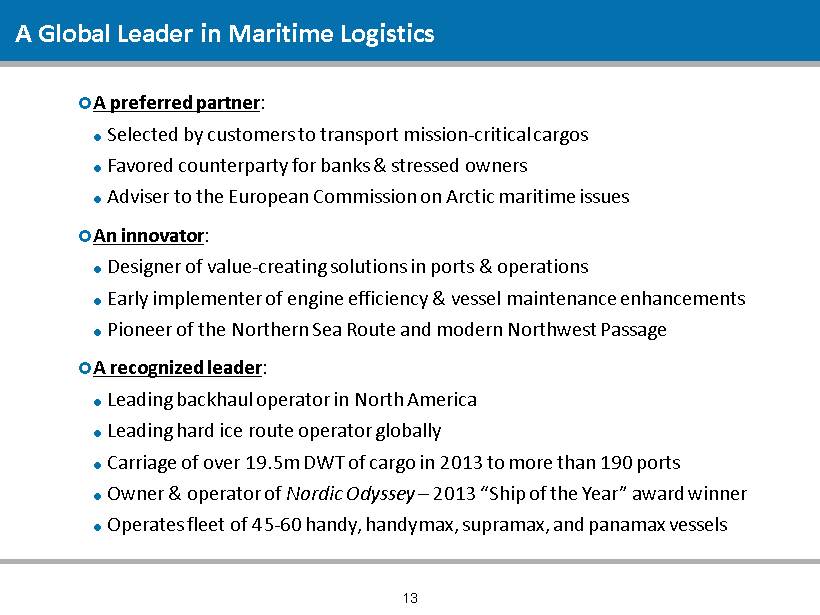
157 27 26 110 162 210 4 112 173 177 175 174 191 214 235 217 217 217 A Global Leader in Maritime Logistics A preferred partner : Selected by customers to transport mission - critical cargos Favored counterparty for banks & stressed owners Adviser to the European Commission on Arctic maritime issues An innovator : Designer of value - creating solutions in ports & operations Early implementer of engine efficiency & vessel maintenance enhancements Pioneer of the Northern Sea Route and modern Northwest Passage A recognized leader : Leading backhaul operator in North America Leading hard ice route operator globally Carriage of over 19.5m DWT of cargo in 2013 to more than 190 ports Owner & operator of Nordic Odyssey – 2013 “Ship of the Year” award winner Operates fleet of 45 - 60 handy, handymax , supramax , and panamax vessels 13

157 27 26 110 162 210 4 112 173 177 175 174 191 214 235 217 217 217 Selected Consolidated Financial Data 14 (U.S dollars in thousands) 2014 2013 2014 2013 2013 2012 2011 Income Statement Data: Revenue 89,779$ 90,668$ 203,992$ 185,802$ 392,471$ 387,058$ 409,644$ Direct operating expenses 83,609 82,476 182,634 165,602 349,873 349,206 389,621 Gross profit 6,170 8,192 21,358 20,200 42,598 37,852 20,023 Selling, general, and administrative expense 2,353 2,754 4,929 5,844 11,599 11,028 7,244 Depreciation and amortization 2,744 2,169 5,296 4,542 9,615 7,180 5,197 Loss of vessel sale (2,286) - (2,286) - - - 1,096 Income from operations 3,359 3,269 13,419 9,814 21,384 19,644 6,485 Interest and other expense, net (2,621) (3,344) (5,024) (4,462) (5,869) (3,731) (2,636) Income attributable to non-controlling interests 492 126 (572) (706) (62) (2,059) (83) Net income attributable to Pangaea 1,230$ 51$ 7,823$ 4,646$ 15,452$ 13,854$ 3,766$ Balance Sheet Data: Cash 21,502$ 26,989$ 21,502$ 26,989$ 18,928$ 19,696$ 18,738$ Total assets 316,945 294,536 316,945 294,536 330,373 231,137 126,556 Total third party debt (current and long-term) 100,086 94,894 100,086 94,894 102,368 84,876 31,963 As of and for the three months ended June 30, (Figures derived from unaudited statements) As of and for the years ended December 31, (Figures derived from audited statements) As of and for the six months ended June 30, (Figures derived from unaudited statements)
157 27 26 110 162 210 4 112 173 177 175 174 191 214 235 217 217 217 Conclusion: Long - term Competitive Advantages Enhanced utilization & profitability through strategic backhaul & triangulation Expertise in niche markets & less commoditized routes (particularly ice routes ) Consistent, acyclical growth : 4x+ Net Income growth (‘11 - ’13) Strong relationships with major industrial customers In - house commercial & technical management capability Experienced management team Strong alignment & transparency 15