First Quarter 2017 Results March 2017

2 Safe Harbor This presentation includes certain forward-looking statements within the meaning of the Private Securities Litigation Reform Act of 1995, including statements regarding future financial performance, future growth and future acquisitions. These statements are based on Pangaea’s and managements’ current expectations or beliefs and are subject to uncertainty and changes in circumstances. Actual results may vary materially from those expressed or implied by the statements herein due to changes in economic, business, competitive and/or regulatory factors, and other risks and uncertainties affecting the operation of Pangaea’s business. These risks, uncertainties and contingencies include: business conditions; weather and natural disasters; changing interpretations of GAAP; outcomes of government reviews; inquiries and investigations and related litigation; continued compliance with government regulations; legislation or regulatory environments; requirements or changes adversely affecting the business in which Pangaea is engaged; fluctuations in customer demand; management of rapid growth; intensity of competition from other providers of logistics and shipping services; general economic conditions; geopolitical events and regulatory changes; and other factors set forth in Pangaea’s filings with the Securities and Exchange Commission and the filings of its predecessors. The information set forth herein should be read in light of such risks. Further, investors should keep in mind that certain of Pangaea’s financial results are unaudited and do not conform to SEC Regulation S-X and as a result such information may fluctuate materially depending on many factors. Accordingly, Pangaea’s financial results in any particular period may not be indicative of future results. Pangaea is not under any obligation to, and expressly disclaims any obligation to, update or alter its forward-looking statements, whether as a result of new information, future events, changes in assumptions or otherwise.

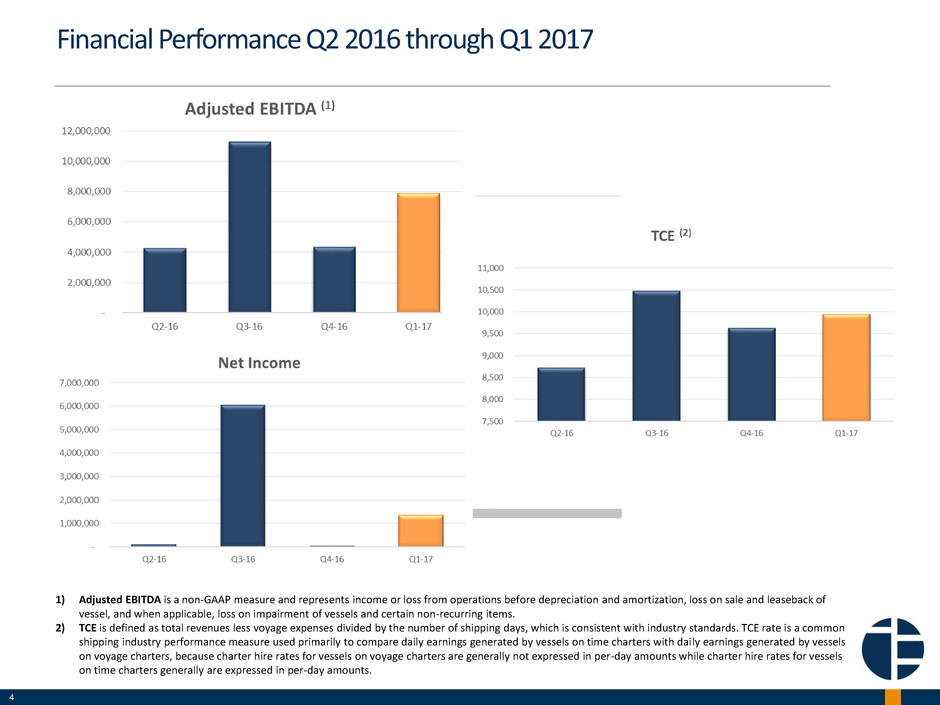
3 First Quarter 2017 Highlights • Net income attributable to Pangaea of $1.3 million for the quarter, even as the Company recorded a nonrecurring loss on the sale and simultaneous charterback of the m/v Bulk Destiny ("Bulk Destiny"). • Pangaea's TCE rates increased 12% and total shipping days increased 52% due to moderate growth in the drybulk market and an increase in drybulk market rates. • At the end of the quarter, Pangaea had $21.7 million in unrestricted cash and cash equivalents. • The Company’s fleet increased to 16 owned/leased vessels and two under five-year bareboat charters. The average number of operated vessels increased to 48, from 31 for Q1 2016.

4 Financial Performance Q2 2016 through Q1 2017 1) Adjusted EBITDA is a non-GAAP measure and represents income or loss from operations before depreciation and amortization, loss on sale and leaseback of vessel, and when applicable, loss on impairment of vessels and certain non-recurring items. 2) TCE is defined as total revenues less voyage expenses divided by the number of shipping days, which is consistent with industry standards. TCE rate is a common shipping industry performance measure used primarily to compare daily earnings generated by vessels on time charters with daily earnings generated by vessels on voyage charters, because charter hire rates for vessels on voyage charters are generally not expressed in per-day amounts while charter hire rates for vessels on time charters generally are expressed in per-day amounts.

5 • The Baltic Dry Index, a measure of dry bulk market performance, increased over 150% from Q1 2016 to Q1 2017. • The average number of operated vessels increased to 48, up from the Q1 2016 average of 31. • The Company’s unique business model means we are not limited to our owned fleet and allows us to increase our chartered-in profile in an improving market. Drivers of Q1 2017 Performance

6 Defensible Pillars of Profitability • Execution specialization: - Material cost savings & enhanced profit through granular operating knowledge & risk sensitive approach - Secured & defended by 200+ years of expertise & embedded relationships; key managers average over 20 years in the industry • Backhaul specialization: - Generating profit from a cost center - Secured & defended by reputation, long-term contracts & repeat customers - Minimal ballast time • Ice-class specialization: - Capturing profit from limited supply of tonnage & lower costs - Secured & defended by expertise & ownership of specialized fleet - Own & operate a significant portion of the world’s 1A ice-class dry tonnage as well as two 1C ice-class dry bulk carriers • Broader logistics solutions: - Design & implement loading & discharge efficiencies in critical ports - Expand markets & improve business terms for customers

7 Selected Income Statement Data 2017 2016 (unaudited) (unaudited) Revenues: Voyage revenue 77,688,449$ 41,974,319$ Charter revenue 6,766,671$ 1,963,200$ 84,455,120 43,937,519 Expenses: Voyage expense 41,271,919 18,500,882 Charter hire expense 23,201,155 8,503,174 Vessel operating expenses 8,591,243 6,889,082 General and administrative 3,514,764 3,036,371 Depreciation and amortization 3,941,795 3,515,456 Loss on sale and leaseback of vessels 4,289,998 - Total expenses 84,810,874 40,444,965 (Loss) income from operations (355,754) 3,492,554 Total other income (expense), net 352,070 (1,888,380) Net (loss) income (3,684) 1,604,174 Loss (income) attributable to noncontrolling interests 1,350,525 (407,070) Net income attributable to Pangaea Logistics Solutions Ltd. 1,346,841$ 1,197,104$ Three months ended

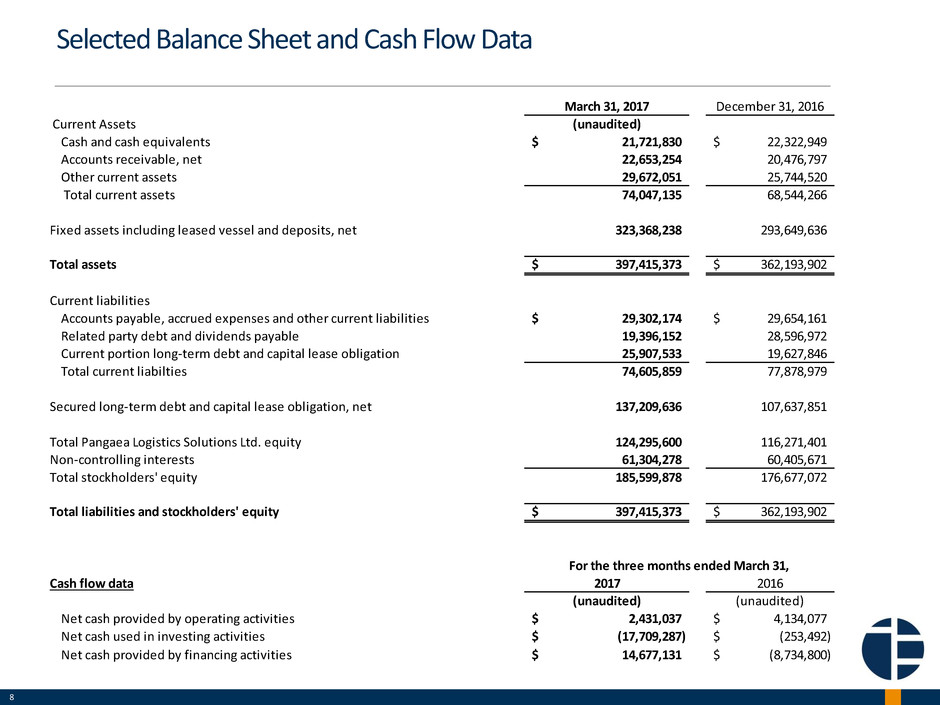
8 Selected Balance Sheet and Cash Flow Data March 31, 2017 December 31, 2016 Current Assets (unaudited) Cash and cash equivalents 21,721,830$ 22,322,949$ Accounts receivable, net 22,653,254 20,476,797 Other current assets 29,672,051 25,744,520 Total current assets 74,047,135 68,544,266 Fixed assets including leased vessel and deposits, net 323,368,238 293,649,636 Total assets 397,415,373$ 362,193,902$ Current liabilities Accounts payable, accrued expenses and other current liabilities 29,302,174$ 29,654,161$ Related party debt and dividends payable 19,396,152 28,596,972 Current portion long-term debt and capital lease obligation 25,907,533 19,627,846 Total current liabilties 74,605,859 77,878,979 Secured long-term debt and capital lease obligation, net 137,209,636 107,637,851 Total Pangaea Logistics Solutions Ltd. equity 124,295,600 116,271,401 Non-controlling interests 61,304,278 60,405,671 Total stockholders' equity 185,599,878 176,677,072 Total liabilities and stockholders' equity 397,415,373$ 362,193,902$ Cash flow data 2017 2016 (unaudited) (unaudited) Net cash provided by operating activities 2,431,037$ 4,134,077$ Net cash used in investing activities (17,709,287)$ (253,492)$ Net cash provided by financing activities 14,677,131$ (8,734,800)$ For the three months ended March 31,