
2Q23 Earnings Call Presentation
2 Safe Harbor 2Q23 Earnings Call Presentation This presentation may include certain forward-looking statements within the meaning of the Private Securities Litigation Reform Act of 1995, including statements regarding future financial performance, future growth and future acquisitions. These statements are based on Pangaea’s and managements’ current expectations or beliefs and are subject to uncertainty and changes in circumstances. Actual results may vary materially from those expressed or implied by the statements herein due to changes in economic, business, competitive and/or regulatory factors, and other risks and uncertainties affecting the operation of Pangaea’s business. These risks, uncertainties and contingencies include: business conditions; weather and natural disasters; changing interpretations of GAAP; outcomes of government reviews; inquiries and investigations and related litigation; continued compliance with government regulations; legislation or regulatory environments; requirements or changes adversely affecting the business in which Pangaea is engaged; fluctuations in customer demand; management of rapid growth; intensity of competition from other providers of logistics and shipping services; general economic conditions; geopolitical events and regulatory changes; and other factors set forth in Pangaea’s filings with the Securities and Exchange Commission and the filings of its predecessors. The information set forth herein should be read in light of such risks. Further, investors should keep in mind that certain of Pangaea’s financial results are unaudited and do not conform to SEC Regulation S-X and as a result such information may fluctuate materially depending on many factors. Accordingly, Pangaea’s financial results in any particular period may not be indicative of future results. Pangaea is not under any obligation to, and expressly disclaims any obligation to, update or alter its forward-looking statements, whether as a result of new information, future events, changes in assumptions or otherwise.

3 2Q23 Performance Summary Strong operating results highlight flexible, value-oriented business model Superior TCE rate driven by long-term COAs and cargo-focused strategy resulted in TCE rates exceeding the benchmark average Baltic Panamax and Supramax indices by 49%+ in 2Q23. Amid a 60% Y-o-Y decrease in market rates caused by normalizing supply conditions, delivered consistent operating cash flow generation of $2.0 million during 2Q23 and Adjusted EBITDA of $15.9 million compared to record quarterly profitability in 2Q22. Completed the purchase of the Bulk Prudence, a 61,00 dwt Ultramax vessel for $26.7 million of cash. The purchase takes the total number of owned vessels to 25. Completed the strategic acquisition of additional Port and Terminal operations in key U.S markets for $7.2 million. Continue to focus on opportunistic expansion of terminal and logistics business. Continue to execute on key capital allocation priorities, maintaining cash dividend of $0.10 per common share, paid on September 15th. Expect to continue to deliver premium market returns and consistent cash flow generation through the second half of the year, underpinned seasonal ice class demand in Q3. Through August 8, 2023, 3,500 days performed at an average of $16,700/day.
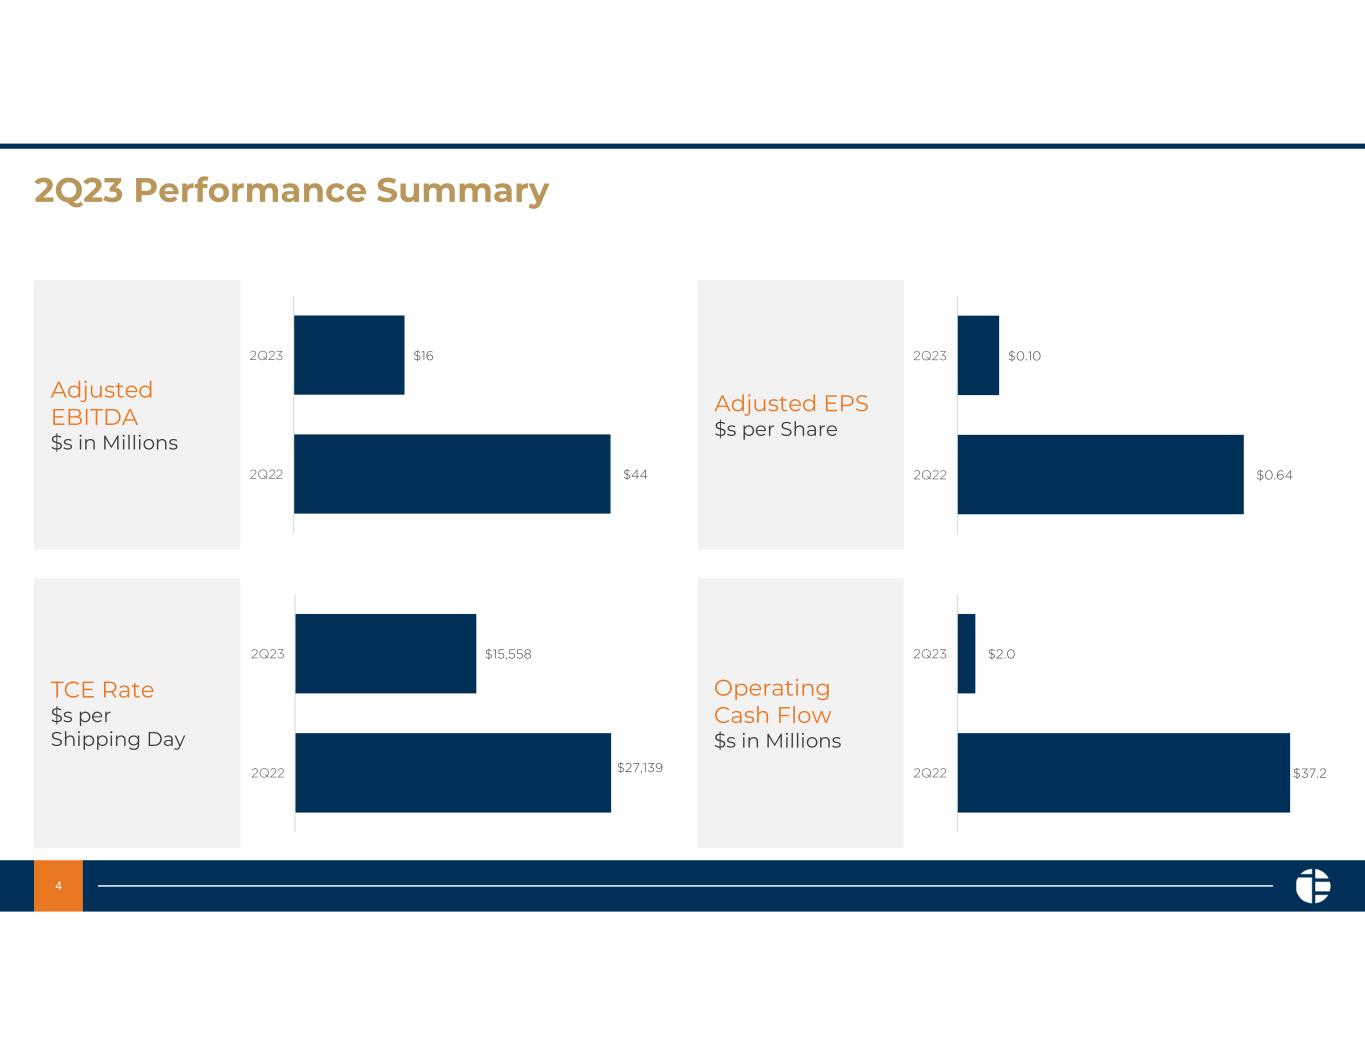
4 2Q23 Performance Summary Adjusted EBITDA $s in Millions Adjusted EPS $s per Share TCE Rate $s per Shipping Day Operating Cash Flow $s in Millions $16 $44 2Q23 2Q22 $0.10 $0.64 2Q23 2Q22 $15,558 $27,139 2Q23 2Q22 $2.0 $37.2 2Q23 2Q22
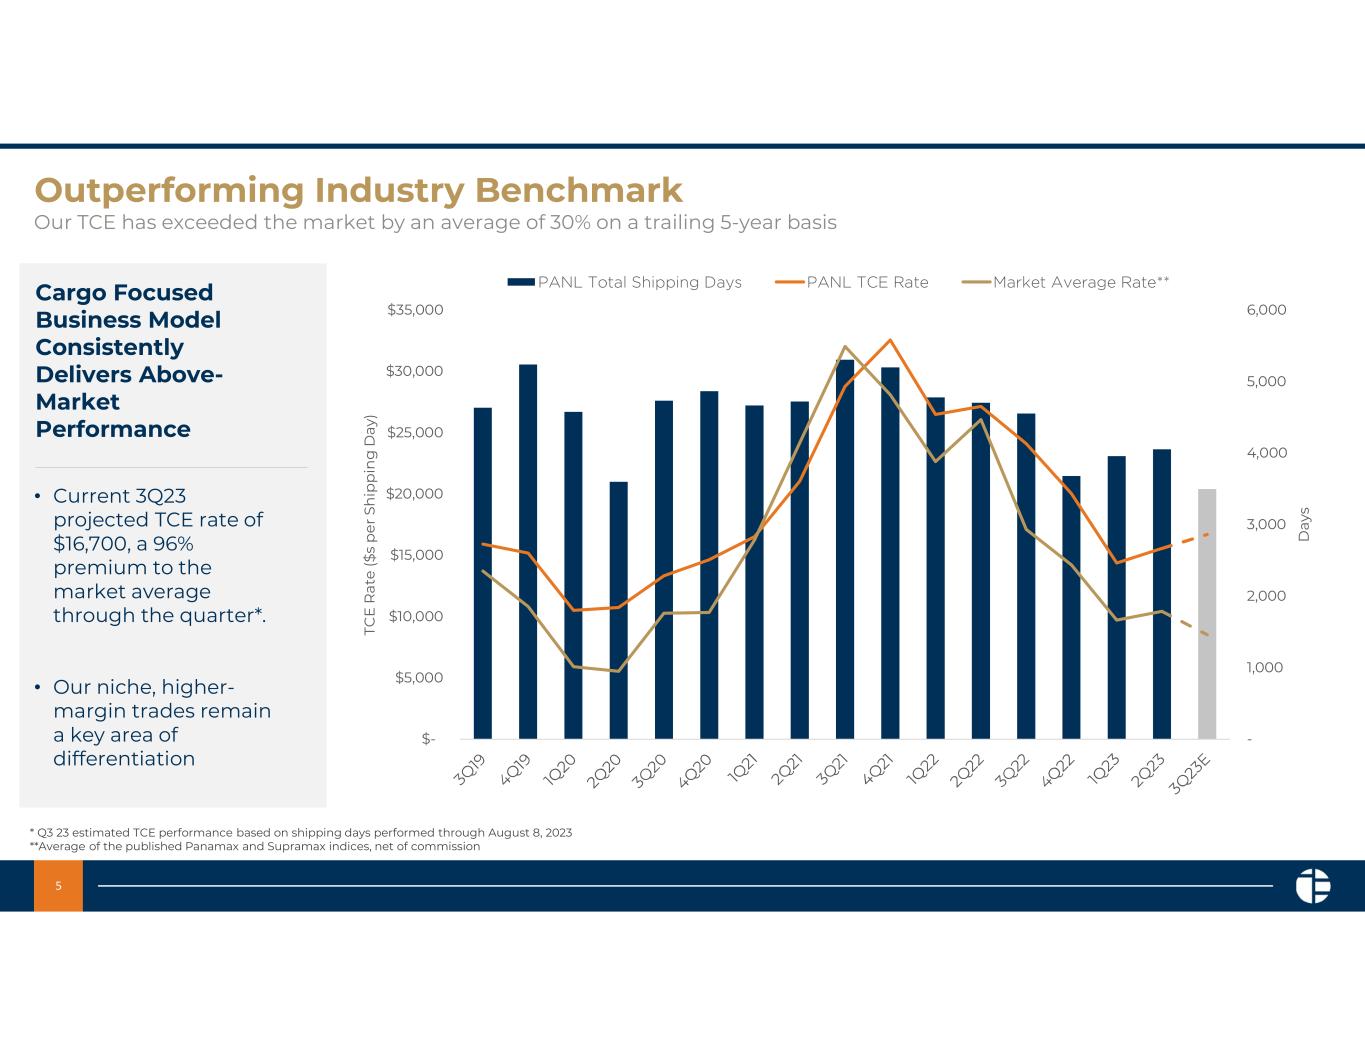
5 Outperforming Industry Benchmark Our TCE has exceeded the market by an average of 30% on a trailing 5-year basis Cargo Focused Business Model Consistently Delivers Above- Market Performance • Current 3Q23 projected TCE rate of $16,700, a 96% premium to the market average through the quarter*. • Our niche, higher- margin trades remain a key area of differentiation * Q3 23 estimated TCE performance based on shipping days performed through August 8, 2023 **Average of the published Panamax and Supramax indices, net of commission - 1,000 2,000 3,000 4,000 5,000 6,000 $- $5,000 $10,000 $15,000 $20,000 $25,000 $30,000 $35,000 D ay s TC E R at e ($ s p e r S h ip p in g D ay ) PANL Total Shipping Days PANL TCE Rate Market Average Rate**

6 Recent Vessel Acquisitions Disciplined acquiror of complementary assets MV Bulk Sachuest - Supramax MV Bulk Courageous - Ultramax MV Bulk Promise - Panamax MV Bulk Valor - Supramax MV Bulk Concord - Panamax MV Nordic Nuluujaak – Post Panamax(1) MV Nordic Qinnqua – Post Panamax(1) MV Nordic Sanngijug – Post Panamax(1) MV Nordic Siku – Post Panamax(1) (1) Vessels are owned through a Joint Venture, of which Pangaea owns 50%. 2021 Purchased 7 vessels for $205 million Purchased 3 vessels for $64 million 2022 & 2023 MV Bulk Prudence - Ultramax
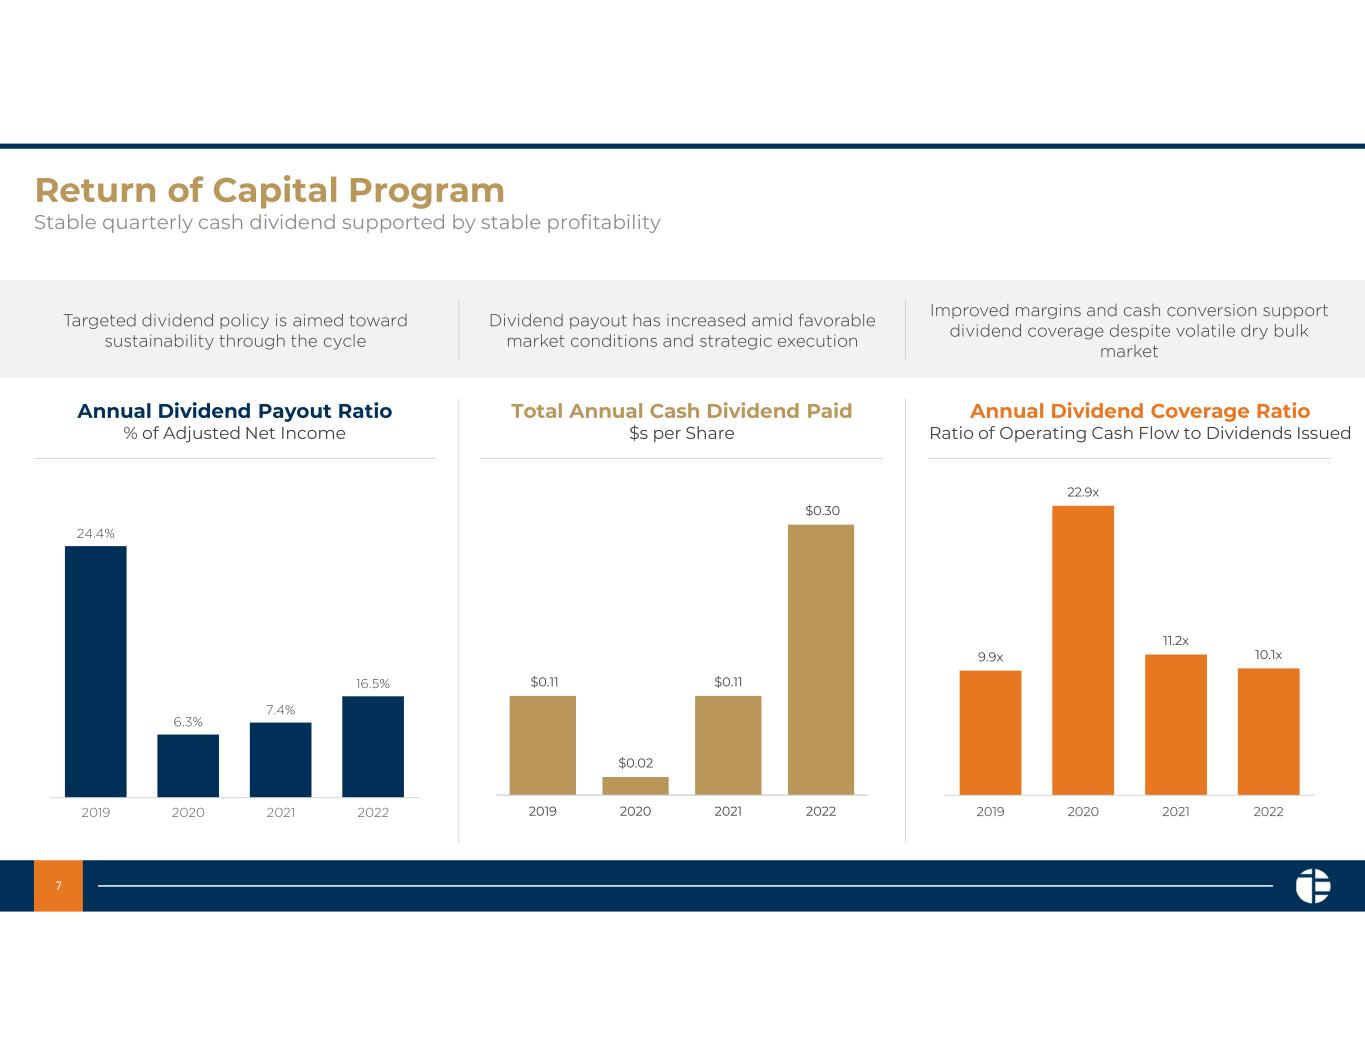
7 Return of Capital Program Stable quarterly cash dividend supported by stable profitability Annual Dividend Payout Ratio % of Adjusted Net Income Total Annual Cash Dividend Paid $s per Share Annual Dividend Coverage Ratio Ratio of Operating Cash Flow to Dividends Issued $0.11 $0.02 $0.11 $0.30 2019 2020 2021 2022 24.4% 6.3% 7.4% 16.5% 2019 2020 2021 2022 Targeted dividend policy is aimed toward sustainability through the cycle Dividend payout has increased amid favorable market conditions and strategic execution Improved margins and cash conversion support dividend coverage despite volatile dry bulk market 9.9x 22.9x 11.2x 10.1x 2019 2020 2021 2022

8 Balance Sheet Update Ample liquidity to support ongoing growth of business Opportunistically invested in owned ship fleet during 2021 amid attractive market dynamics Repaid over $30 million in debt during 2022 through free cash flow and vessel sales Capital allocation priorities will be balanced between debt repayment, fleet investment, opportunistic M&A and shareholder returns $127.8 $116.4 $255.5 $175.6 $202.4 $53.1 $46.9 $56.2 $128.4 $84.3 2.4x 2.7x 2.4x 1.3x 2.1x 0.0x 0.5x 1.0x 1.5x 2.0x 2.5x 3.0x $- $50.0 $100.0 $150.0 $200.0 $250.0 $300.0 $350.0 2019 2020 2021 2022 2Q23 TT M N et D eb t/ A d j. E B IT D A $ s in M ill io n s Total Net Debt Total Cash Net Leverage
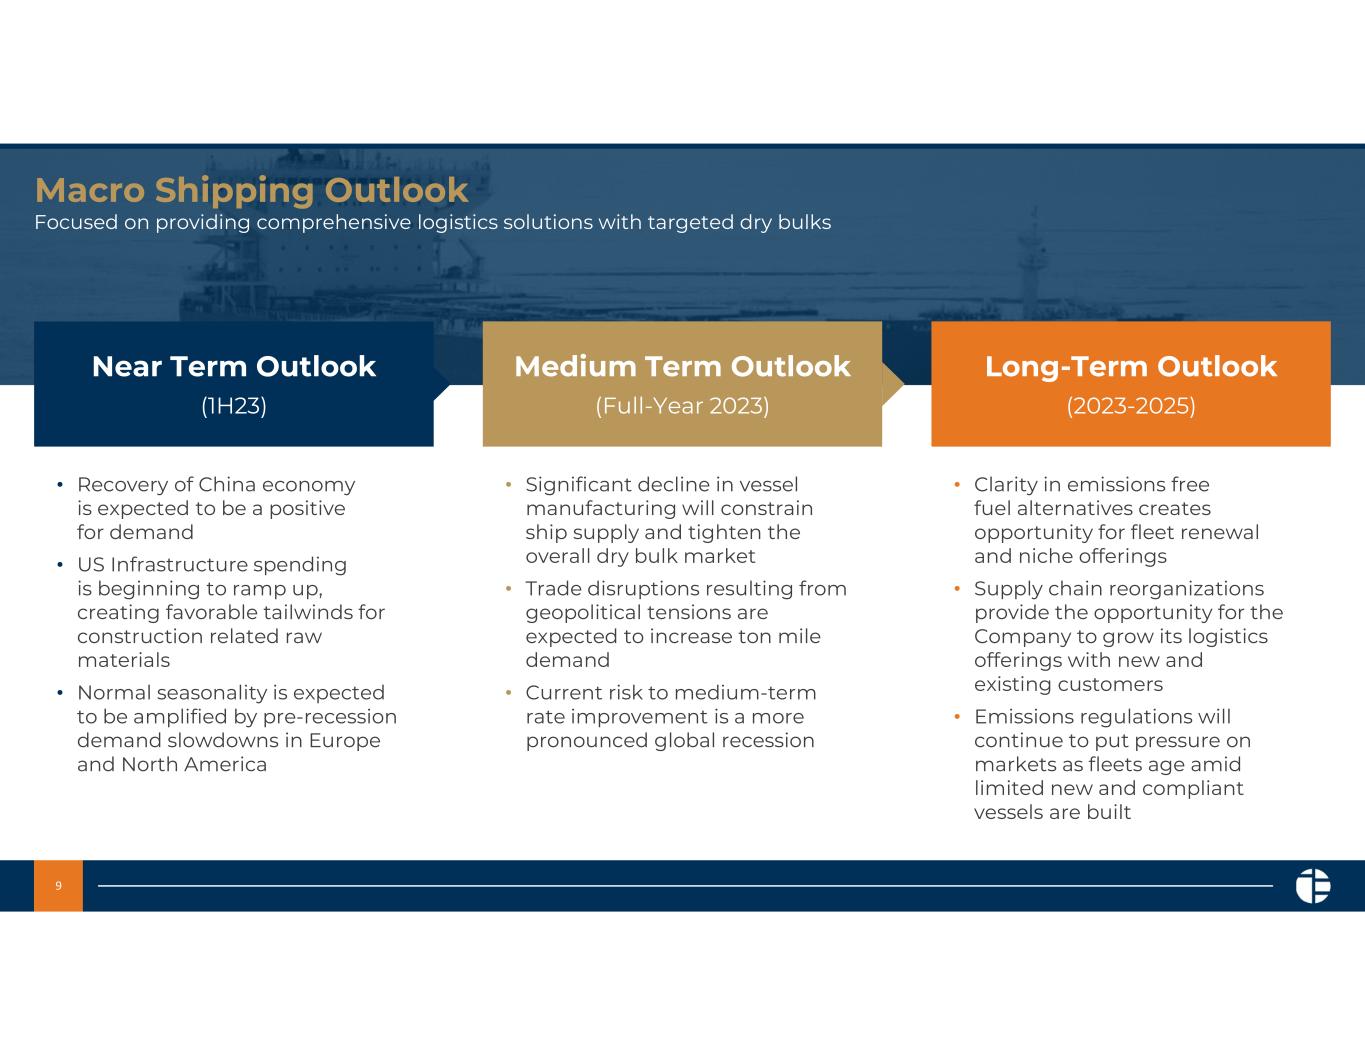
9 Macro Shipping Outlook Focused on providing comprehensive logistics solutions with targeted dry bulks Near Term Outlook (1H23) Medium Term Outlook (Full-Year 2023) Long-Term Outlook (2023-2025) • Recovery of China economy is expected to be a positive for demand • US Infrastructure spending is beginning to ramp up, creating favorable tailwinds for construction related raw materials • Normal seasonality is expected to be amplified by pre-recession demand slowdowns in Europe and North America • Significant decline in vessel manufacturing will constrain ship supply and tighten the overall dry bulk market • Trade disruptions resulting from geopolitical tensions are expected to increase ton mile demand • Current risk to medium-term rate improvement is a more pronounced global recession • Clarity in emissions free fuel alternatives creates opportunity for fleet renewal and niche offerings • Supply chain reorganizations provide the opportunity for the Company to grow its logistics offerings with new and existing customers • Emissions regulations will continue to put pressure on markets as fleets age amid limited new and compliant vessels are built
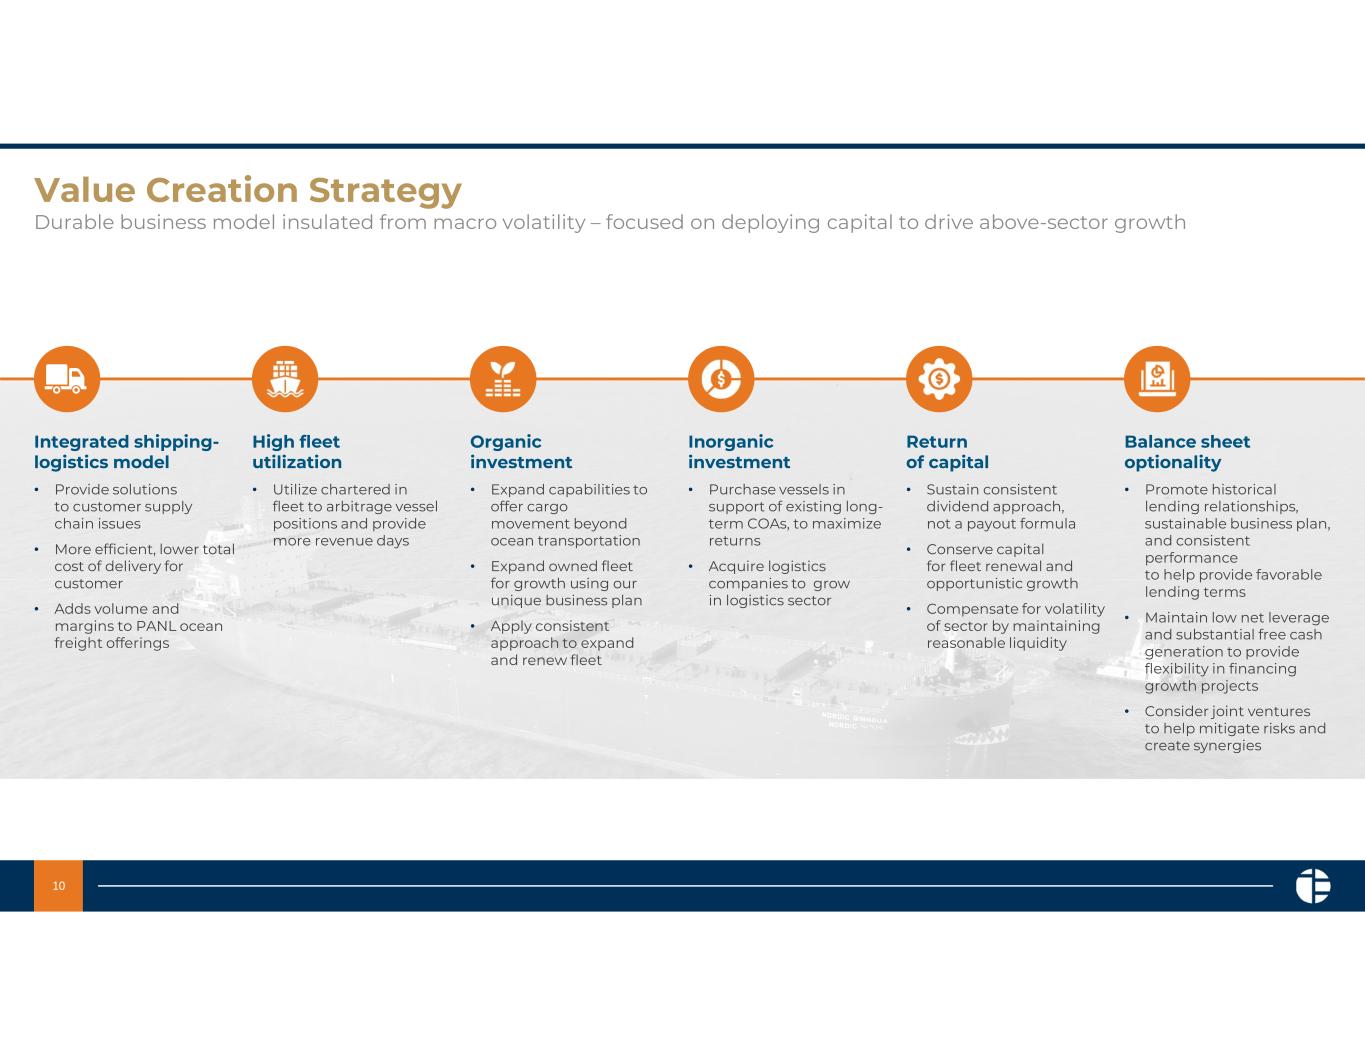
10 Value Creation Strategy Durable business model insulated from macro volatility – focused on deploying capital to drive above-sector growth Integrated shipping- logistics model • Provide solutions to customer supply chain issues • More efficient, lower total cost of delivery for customer • Adds volume and margins to PANL ocean freight offerings High fleet utilization • Utilize chartered in fleet to arbitrage vessel positions and provide more revenue days Organic investment • Expand capabilities to offer cargo movement beyond ocean transportation • Expand owned fleet for growth using our unique business plan • Apply consistent approach to expand and renew fleet Inorganic investment • Purchase vessels in support of existing long- term COAs, to maximize returns • Acquire logistics companies to grow in logistics sector Return of capital • Sustain consistent dividend approach, not a payout formula • Conserve capital for fleet renewal and opportunistic growth • Compensate for volatility of sector by maintaining reasonable liquidity Balance sheet optionality • Promote historical lending relationships, sustainable business plan, and consistent performance to help provide favorable lending terms • Maintain low net leverage and substantial free cash generation to provide flexibility in financing growth projects • Consider joint ventures to help mitigate risks and create synergies
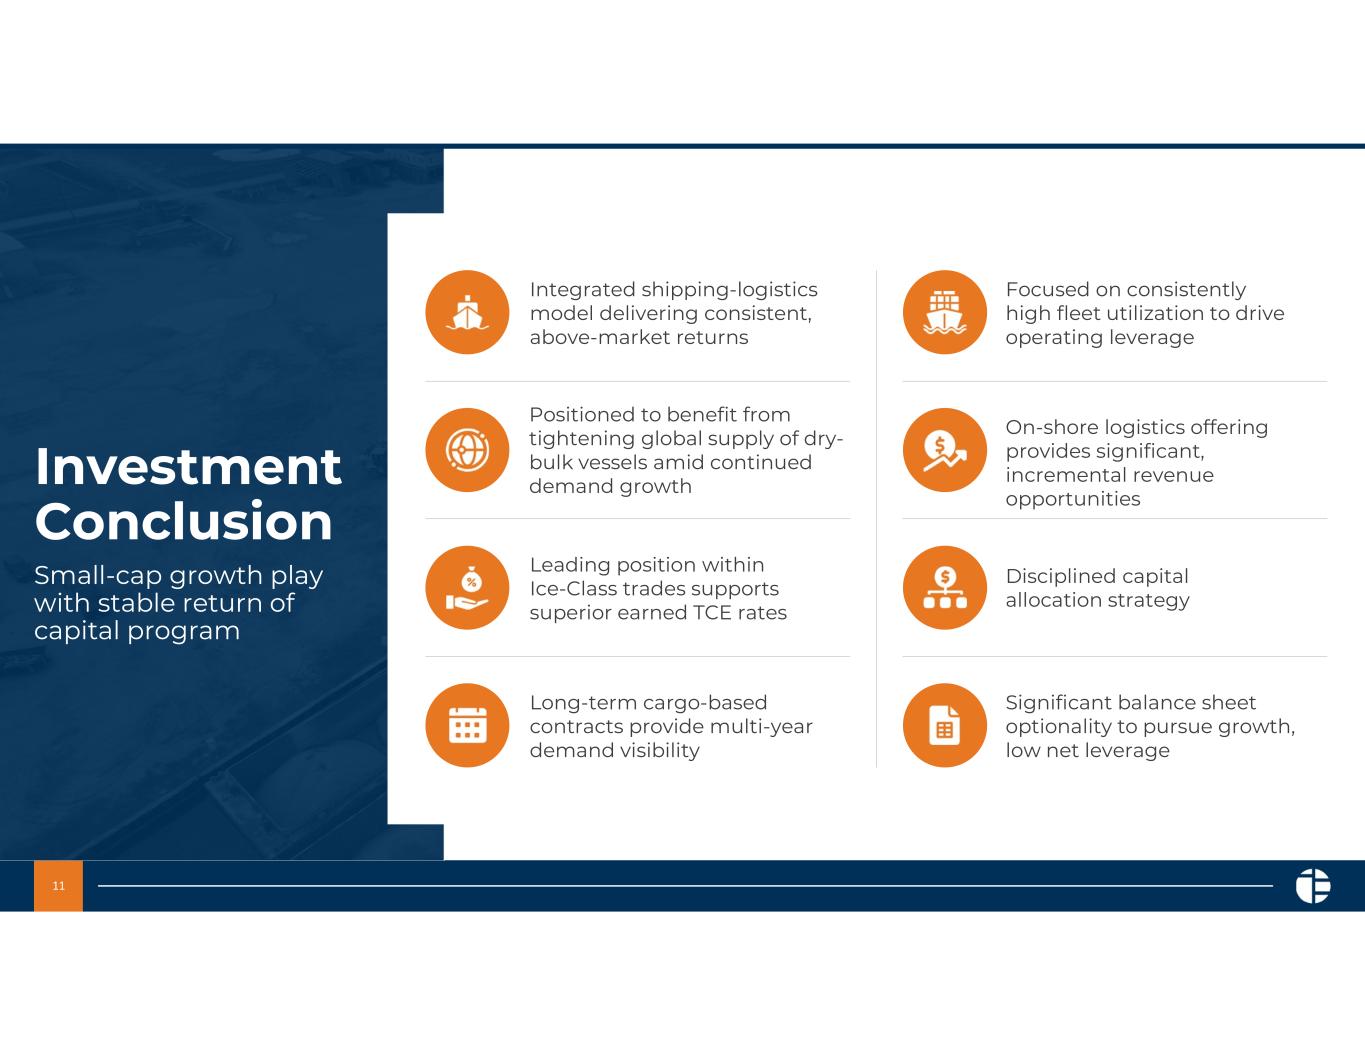
11 Investment Conclusion Small-cap growth play with stable return of capital program Integrated shipping-logistics model delivering consistent, above-market returns Focused on consistently high fleet utilization to drive operating leverage Positioned to benefit from tightening global supply of dry- bulk vessels amid continued demand growth On-shore logistics offering provides significant, incremental revenue opportunities Leading position within Ice-Class trades supports superior earned TCE rates Disciplined capital allocation strategy Long-term cargo-based contracts provide multi-year demand visibility Significant balance sheet optionality to pursue growth, low net leverage

Confidential: Pangaea Logistics Solutions Appendix
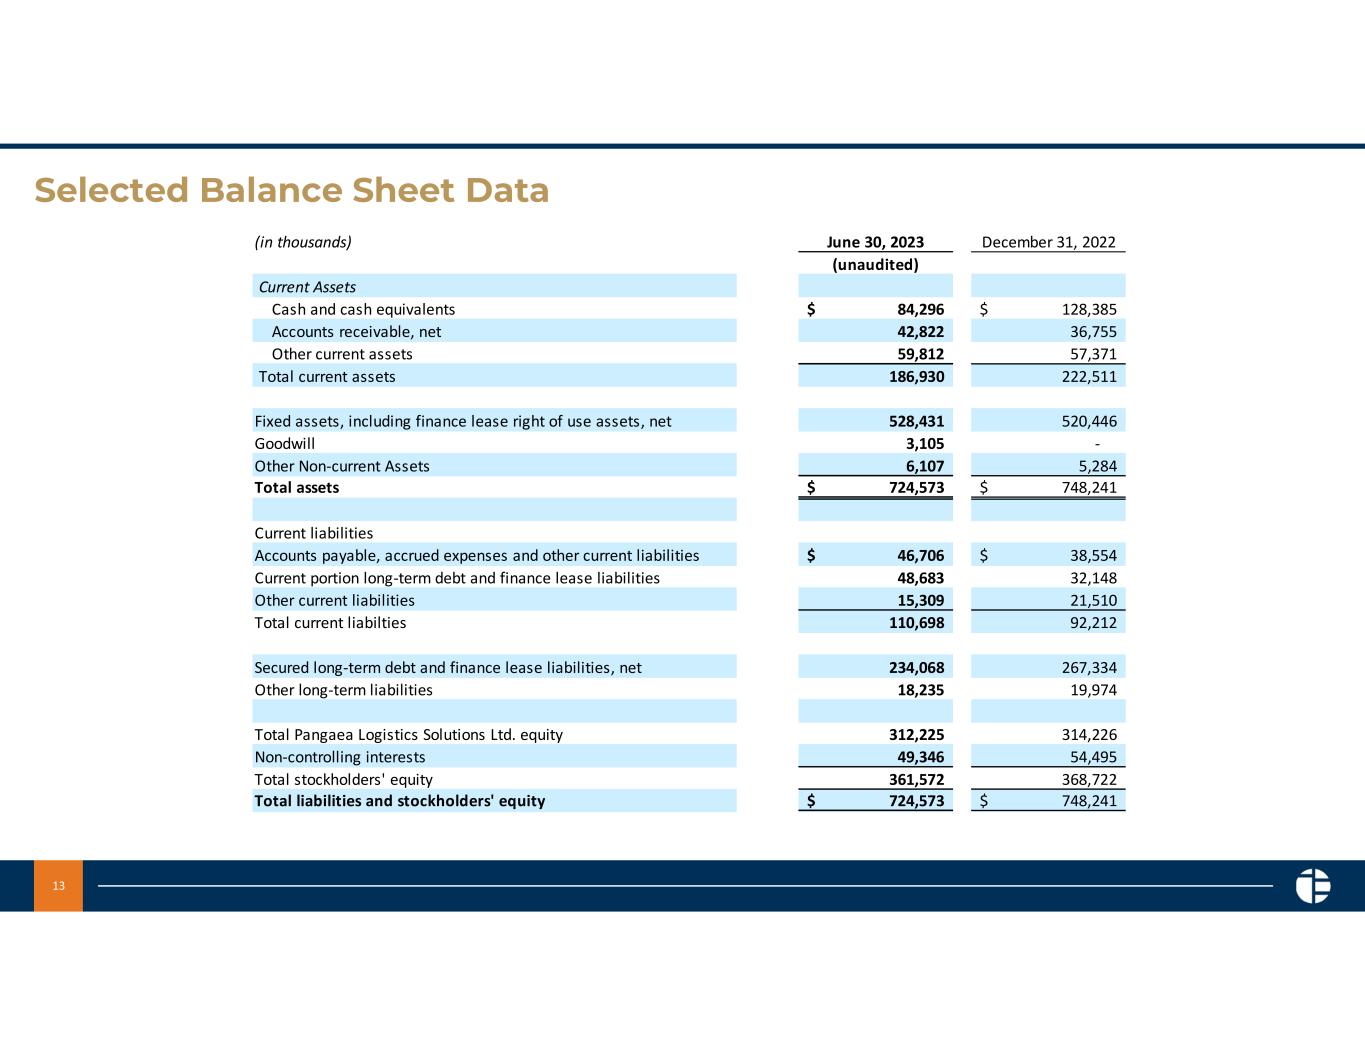
13 Selected Balance Sheet Data (in thousands) June 30, 2023 December 31, 2022 (unaudited) Current Assets Cash and cash equivalents 84,296$ 128,385$ Accounts receivable, net 42,822 36,755 Other current assets 59,812 57,371 Total current assets 186,930 222,511 Fixed assets, including finance lease right of use assets, net 528,431 520,446 Goodwill 3,105 - Other Non-current Assets 6,107 5,284 Total assets 724,573$ 748,241$ Current liabilities Accounts payable, accrued expenses and other current liabilities 46,706$ 38,554$ Current portion long-term debt and finance lease liabilities 48,683 32,148 Other current liabilities 15,309 21,510 Total current liabilties 110,698 92,212 Secured long-term debt and finance lease liabilities, net 234,068 267,334 Other long-term liabilities 18,235 19,974 Total Pangaea Logistics Solutions Ltd. equity 312,225 314,226 Non-controlling interests 49,346 54,495 Total stockholders' equity 361,572 368,722 Total liabilities and stockholders' equity 724,573$ 748,241$
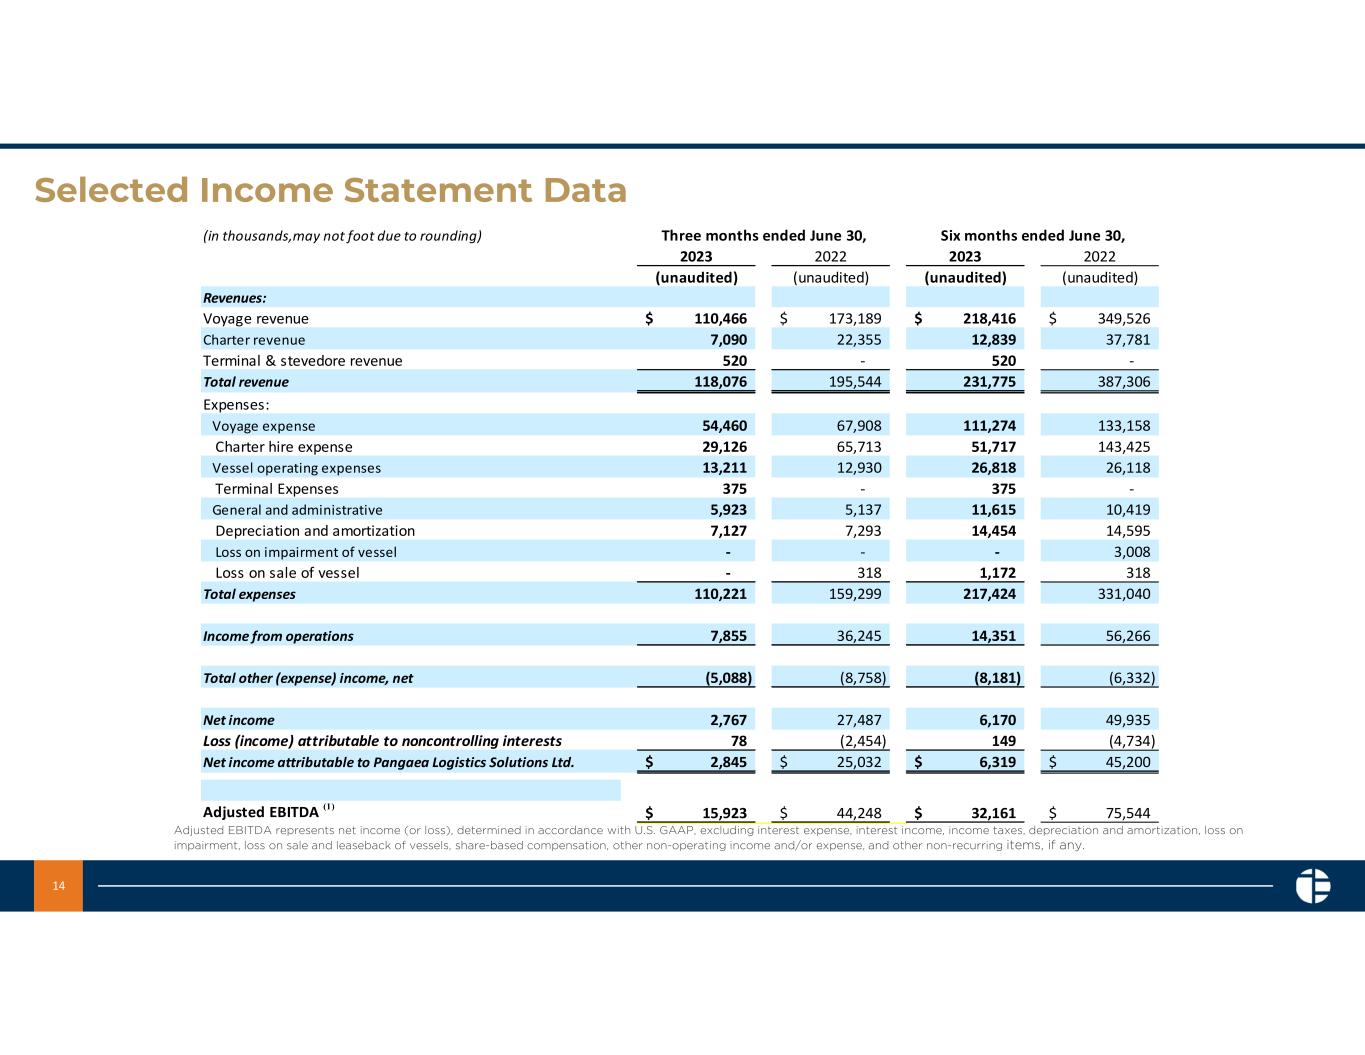
14 Selected Income Statement Data Adjusted EBITDA represents net income (or loss), determined in accordance with U.S. GAAP, excluding interest expense, interest income, income taxes, depreciation and amortization, loss on impairment, loss on sale and leaseback of vessels, share-based compensation, other non-operating income and/or expense, and other non-recurring items, if any. (in thousands,may not foot due to rounding) 2023 2022 2023 2022 (unaudited) (unaudited) (unaudited) (unaudited) Revenues: Voyage revenue 110,466$ 173,189$ 218,416$ 349,526$ Charter revenue 7,090 22,355 12,839 37,781 Terminal & stevedore revenue 520 - 520 - Total revenue 118,076 195,544 231,775 387,306 Expenses: Voyage expense 54,460 67,908 111,274 133,158 Charter hire expense 29,126 65,713 51,717 143,425 Vessel operating expenses 13,211 12,930 26,818 26,118 Terminal Expenses 375 - 375 - General and administrative 5,923 5,137 11,615 10,419 Depreciation and amortization 7,127 7,293 14,454 14,595 Loss on impairment of vessel - - - 3,008 Loss on sale of vessel - 318 1,172 318 Total expenses 110,221 159,299 217,424 331,040 Income from operations 7,855 36,245 14,351 56,266 Total other (expense) income, net (5,088) (8,758) (8,181) (6,332) Net income 2,767 27,487 6,170 49,935 Loss (income) attributable to noncontrolling interests 78 (2,454) 149 (4,734) Net income attributable to Pangaea Logistics Solutions Ltd. 2,845$ 25,032$ 6,319$ 45,200$ Adjusted EBITDA (1) 15,923$ 44,248$ 32,161$ 75,544$ Six months ended June 30,Three months ended June 30,
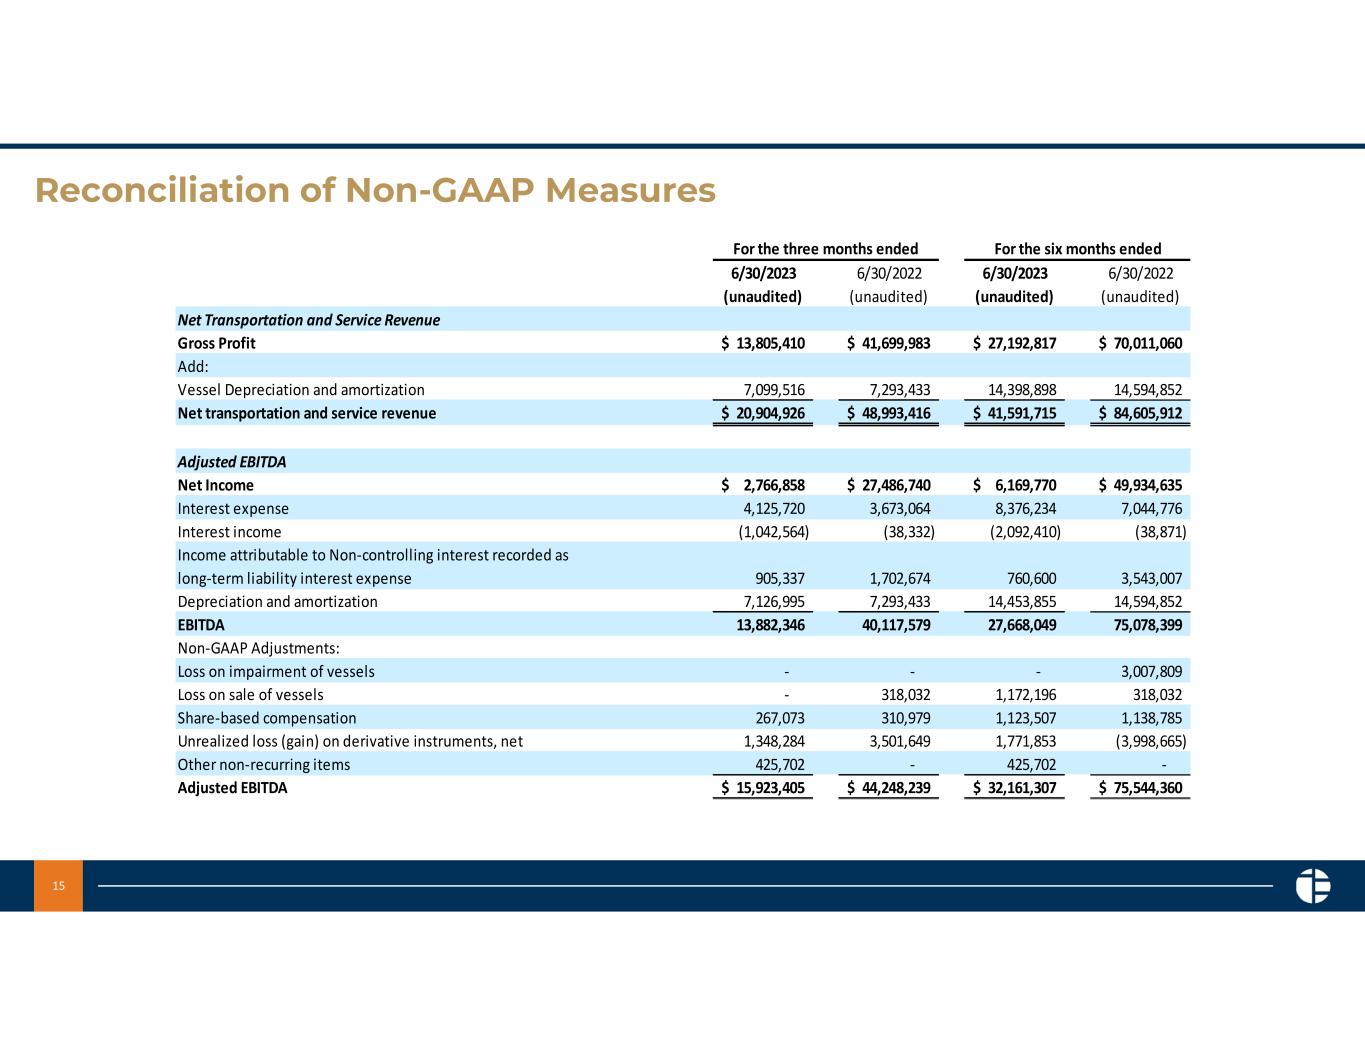
15 Reconciliation of Non-GAAP Measures 6/30/2023 6/30/2022 6/30/2023 6/30/2022 (unaudited) (unaudited) (unaudited) (unaudited) Net Transportation and Service Revenue Gross Profit 13,805,410$ 41,699,983$ 27,192,817$ 70,011,060$ Add: Vessel Depreciation and amortization 7,099,516 7,293,433 14,398,898 14,594,852 Net transportation and service revenue 20,904,926$ 48,993,416$ 41,591,715$ 84,605,912$ Adjusted EBITDA Net Income 2,766,858$ 27,486,740$ 6,169,770$ 49,934,635$ Interest expense 4,125,720 3,673,064 8,376,234 7,044,776 Interest income (1,042,564) (38,332) (2,092,410) (38,871) Income attributable to Non-controlling interest recorded as long-term liability interest expense 905,337 1,702,674 760,600 3,543,007 Depreciation and amortization 7,126,995 7,293,433 14,453,855 14,594,852 EBITDA 13,882,346 40,117,579 27,668,049 75,078,399 Non-GAAP Adjustments: Loss on impairment of vessels - - - 3,007,809 Loss on sale of vessels - 318,032 1,172,196 318,032 Share-based compensation 267,073 310,979 1,123,507 1,138,785 Unrealized loss (gain) on derivative instruments, net 1,348,284 3,501,649 1,771,853 (3,998,665) Other non-recurring items 425,702 - 425,702 - Adjusted EBITDA 15,923,405$ 44,248,239$ 32,161,307$ 75,544,360$ For the three months ended For the six months ended

16 Reconciliation of Non-GAAP Measures Earnings Per Common Share Net income attributable to Pangaea Logistics Solutions Ltd. 2,844,540$ 25,032,433$ 6,318,807$ 45,200,398$ Weighted average number of common shares - basic 44,744,039 44,430,487 44,744,039 44,411,025 Weighted average number of common shares - diluted 45,122,019 45,070,533 45,122,019 45,129,077 Earnings per common share - basic 0.06$ 0.56$ 0.14$ 1.02$ Earnings per common share - diluted 0.06$ 0.56$ 0.14$ 1.00$ Adjusted EPS Net income attributable to Pangaea Logistics Solutions Ltd. 2,844,540$ 25,032,433$ 6,318,807$ 45,200,398$ Non-GAAP Add: Loss on impairment of vessels - - - 3,007,809 Loss on sale of vessels - 318,032 1,172,196 318,032 Unrealized loss (gain) on derivative instruments, net 1,348,284 3,501,649 1,771,853 (3,998,665) Other non-recurring items 425,702 - 425,702 - Non-GAAP adjusted net income attributable to Pangaea Logistics Solutions Ltd. 4,618,526 28,852,114 9,688,558 44,527,574 Weighted average number of common shares - basic 44,775,438 44,430,487 44,744,039 44,411,025 Weighted average number of common shares - diluted 45,127,972 45,070,533 45,122,019 45,129,077 Adjusted EPS - basic 0.10$ 0.65$ 0.22$ 1.00$ Adjusted EPS - diluted 0.10$ 0.64$ 0.21$ 0.99$


