Washington, D.C. 20549
Kevin J. McCarthy
Form N-CSR is to be used by management investment companies to file reports with the Commission not later than 10 days after the transmission to stockholders of any report that is required to be transmitted to stockholders under Rule 30e-1 under the Investment Company Act of 1940 (17 CFR 270.30e-1). The Commission may use the information provided on Form N-CSR in its regulatory, disclosure review, inspection, and policymaking roles.
A registrant is required to disclose the information specified by Form N-CSR, and the Commission will make this information public. A registrant is not required to respond to the collection of information contained in Form N-CSR unless the Form displays a currently valid Office of Management and Budget (“OMB”) control number. Please direct comments concerning the accuracy of the information collection burden estimate and any suggestions for reducing the burden to Secretary, Securities and Exchange Commission, 450 Fifth Street, NW, Washington, DC 20549-0609. The OMB has reviewed this collection of information under the clearance requirements of 44 U.S.C. ss. 3507.
ITEM 1. REPORTS TO STOCKHOLDERS.
Life is Complex
Nuveen makes things e-simple.
It only takes a minute to sign up for e-Reports. Once enrolled, you'll receive an e-mail as soon as your Nuveen Fund information is ready—no more waiting for delivery by regular mail. Just click on the link within the e-mail to see the report and save it on your computer if you wish.
Free e-Reports right to your e-mail!
www.investordelivery.com
If you receive your Nuveen Fund dividends and statements from your financial advisor or brokerage account.
or
www.nuveen.com/accountaccess
If you receive your Nuveen Fund dividends and statements directly from Nuveen.
Table of Contents
| Chairman's Letter to Shareholders | 4 |
| | |
| Portfolio Managers' Comments | 5 |
| | |
| Fund Leverage | 12 |
| | |
| Common Share Information | 13 |
| | |
| Risk Considerations | 15 |
| | |
| Performance Overview and Holding Summaries | 17 |
| | |
| Shareholder Meeting Report | 23 |
| | |
| Report of Independent Registered Public Accounting Firm | 25 |
| | |
| Portfolios of Investments | 26 |
| | |
| Statement of Assets and Liabilities | 70 |
| | |
| Statement of Operations | 72 |
| | |
| Statement of Changes in Net Assets | 74 |
| | |
| Statement of Cash Flows | 77 |
| | |
| Financial Highlights | 80 |
| | |
| Notes to Financial Statements | 89 |
| | |
| Additional Fund Information | 104 |
| | |
| Glossary of Terms Used in this Report | 105 |
| | |
| Reinvest Automatically, Easily and Conveniently | 107 |
| | |
| Annual Investment Management Agreement Approval Process | 108 |
| | |
| Board Member & Officers | 116 |
Chairman's Letter to Shareholders
Dear Shareholders,
The U.S. economy is now seven years into the recovery, but its pace remains stubbornly subpar compared to past recoveries. Economic data continues to be a mixed bag, as it has been throughout this expansion period. While the unemployment rate fell below its pre-recession level and wages have grown slightly, a surprisingly weak jobs growth report in May cast doubt over the future strength of the labor market. The June employment report was much stronger, however, easing fears that a significant downtrend was emerging. The housing market has improved markedly but its contribution to the recovery has been lackluster. Deflationary pressures, including the dramatic slide in commodity prices, have kept inflation much lower for longer than many expected.
U.S. growth remains modest, while economic conditions elsewhere continue to appear vulnerable. On June 23, 2016, the U.K. voted to leave the European Union, known as "Brexit." The outcome surprised the global markets, leading to high levels of volatility across equities, fixed income and currencies in the days following the vote. Although the turbulence subsided not long after and many asset classes have largely recovered, uncertainties remain about the Brexit separation process and the economic and political impacts on the U.K., Europe and the rest of the world.
In the meantime, global central banks remain accommodative in efforts to bolster growth. The European Central Bank and Bank of Japan have been providing aggressive monetary stimulus, including adopting negative interest rates in both Europe and Japan, as their economies continue to lag the U.S.'s recovery. China's policy makers have also continued to manage its slowdown, but investors are still worried about where the world's second-largest economy might ultimately land.
Many of these ambiguities – both domestic and international – have kept the U.S. Federal Reserve (Fed) from raising short-term interest rates any further since December's first and only increase thus far. While markets rallied earlier in the year on the widely held expectation that the Fed would defer any increases until June, the unusually weak May jobs report and the Brexit concerns compelled the Fed to hold rates steady at its June meeting. Although labor market conditions improved in June, Britain's "leave" vote is expected to keep the Fed on hold until later in 2016.
With global economic growth still looking fairly fragile, financial markets have become more volatile over the past year. Although sentiment has improved and conditions have generally recovered from the intense volatility seen in early 2016 and following the Brexit vote in June, we expect that turbulence remains on the horizon for the time being. In this environment, Nuveen remains committed to both managing downside risks and seeking upside potential. If you're concerned about how resilient your investment portfolio might be, we encourage you to talk to your financial advisor.
On behalf of the other members of the Nuveen Fund Board, we look forward to continuing to earn your trust in the months and years ahead.
Sincerely,
William J. Schneider
Chairman of the Board
July 26, 2016
Portfolio Managers' Comments
Nuveen Georgia Dividend Advantage Municipal Fund 2 (NKG)
Nuveen Maryland Premium Income Municipal Fund (NMY)
Nuveen Minnesota Municipal Income Fund (NMS)
Nuveen Missouri Premium Income Municipal Fund (NOM)
Nuveen North Carolina Premium Income Municipal Fund (NNC)
Nuveen Virginia Premium Income Municipal Fund (NPV)
These Funds feature portfolio management by Nuveen Asset Management, LLC (NAM), an affiliate of Nuveen Investments, Inc. Portfolio managers Daniel J. Close, CFA, Thomas C. Spalding, CFA, Douglas J. White, CFA and Christopher L. Drahn, CFA, discuss U.S. economic and municipal market conditions, key investment strategies and the twelve-month performance of these six Nuveen Funds. Dan has managed the Nuveen Georgia and North Carolina Funds since 2007. Tom assumed portfolio management responsibility for the Maryland and Virginia Funds in 2011, Doug has managed the Minnesota Fund since 1993 and Chris has managed the Missouri Fund since 2011.
Effective May 31, 2016, Tom Spalding retired from NAM and Stephen J. Candido, CFA, has taken over portfolio management responsibilities for NMY and NPV.
What factors affected the U.S. economy and the national municipal market during the twelve-month reporting period ended May 31, 2016?
Over the twelve-month period, U.S. economic data continued to point to subdued growth, rising employment and tame inflation. Economic activity has continued to hover around a 2% annualized growth rate since the end of the Great Recession in 2009, as measured by real gross domestic product (GDP), which is the value of the goods and services produced by the nation's economy less the value of the goods and services used up in production, adjusted for price changes. For the first quarter of 2016, real GDP increased at an annual rate of 0.8%, as reported by the "second" estimate of the Bureau of Economic Analysis, down from 1.4% in the fourth quarter of 2015.
The labor and housing markets were among the bright spots in the economy during the reporting period, as both showed steady improvement. As reported by the Bureau of Labor Statistics, the unemployment rate fell to 4.7% in May 2016 from 5.5% in May 2015, and job gains averaged slightly above 200,000 per month for the past twelve months. The S&P/Case-Shiller U.S. National Home Price Index, which covers all nine U.S. census divisions, recorded a 5.0% annual gain in April 2016 (most recent data available at the time this report was prepared). The 10-City and 20-City Composites reported year-over-year increases of 4.7% and 5.4%, respectively.
Certain statements in this report are forward-looking statements. Discussions of specific investments are for illustration only and are not intended as recommendations of individual investments. The forward-looking statements and other views expressed herein are those of the portfolio managers as of the date of this report. Actual future results or occurrences may differ significantly from those anticipated in any forward-looking statements, and the views expressed herein are subject to change at any time, due to numerous market and other factors. The Funds disclaim any obligation to update publicly or revise any forward-looking statements or views expressed herein.
Ratings shown are the highest rating given by one of the following national rating agencies: Standard & Poor's (S&P), Moody's Investors Service, Inc. (Moody's) or Fitch, Inc. (Fitch). Credit ratings are subject to change. AAA, AA, A and BBB are investment grade ratings; BB, B, CCC, CC, C and D are below investment grade ratings. Certain bonds backed by U.S. government or agency securities are regarded as having an implied rating equal to the rating of such securities. Holdings designated N/R are not rated by these national rating agencies.
Bond insurance guarantees only the payment of principal and interest on the bond when due, and not the value of the bonds themselves, which will fluctuate with the bond market and the financial success of the issuer and the insurer. Insurance relates specifically to the bonds in the portfolio and not to the share prices of a Fund. No representation is made as to the insurers' ability to meet their commitments.
Refer to the Glossary of Terms Used in this Report for further definition of the terms used within this section.
Portfolio Managers' Comments (continued)
Consumers, whose purchases comprise the largest component of the U.S. economy, benefited from lower gasoline prices and an improving jobs market but didn't necessarily spend more. Pessimism about the economy's future and lackluster wage growth likely contributed to consumers' somewhat muted spending. Lower energy prices and tepid wage growth also weighed on inflation during this reporting period. The Consumer Price Index (CPI) rose 1.0% over the twelve-month period ended May 2016 on a seasonally adjusted basis, as reported by the U.S. Bureau of Labor Statistics. The core CPI (which excludes food and energy) increased 2.2% during the same period, slightly above the Fed's unofficial longer term inflation objective of 2.0%.
Business investment was also rather restrained. Corporate earnings growth slowed during 2015, reflecting an array of factors ranging from weakening demand amid sluggish U.S. and global growth to the impact of falling commodity prices and a strong U.S. dollar. Energy, materials and industrials companies were hit particularly hard by the downturn in natural resource prices, as well as the expectation of rising interest rates, which would make their debts more costly to service. With demand waning, companies, especially in the health care and technology sectors, looked to consolidate with rivals as a way to boost revenues. Merger and acquisition deals, both in the U.S. and globally, reached record levels in the calendar year 2015.
With the current expansion on solid footing, the U.S. Federal Reserve (Fed) prepared to raise one of its main interest rates, which had been held near zero since December 2008 to help stimulate the economy. After delaying the rate change for most of 2015 because of a weak global economic growth outlook, the Fed announced in December 2015 that it would raise the fed funds target rate by 0.25%. The news was widely expected and therefore had a relatively muted impact on the financial markets.
Although the Fed continued to emphasize future rate increases would be gradual, investors worried about the pace. This, along with uncertainties about the global macroeconomic backdrop, another downdraft in oil prices and a spike in stock market volatility triggered significant losses across assets that carry more risk and fueled demand for "safe haven" assets such as Treasury bonds and gold from January through mid-February. However, fear began to subside in March, propelling assets that carry more risk higher. The Fed held the rate steady at both the January and March policy meetings, as well as lowered its expectations to two rate increases in 2016 from four. Also boosting investor confidence were reassuring statements from the European Central Bank, some positive economic data in the U.S. and abroad, a retreat in the U.S. dollar and an oil price rally. At its April meeting, the Fed indicated its readiness to raise its benchmark rate at the next policy meeting in June. However, a very disappointing jobs growth report in May and the significant uncertainty surrounding the U.K.'s referendum on whether Britain should leave the European Union (EU), colloquially known as "Brexit," dampened the Fed's outlook. These concerns led the Fed to again hold rates steady at its June meeting (after the close of this reporting period). Subsequent to the close of this reporting period, on June 23, 2016, the U.K. voted in favor of leaving the EU. The event triggered considerable market volatility, with a steep drop in the U.K. sterling, turbulence in global equity markets and a rotation into safe-haven assets such as gold, the U.S. dollar and U.S. Treasuries.
The broad municipal bond market performed well in the twelve-month reporting period, supported by falling interest rates, a favorable supply-demand balance and generally improving credit fundamentals. Early in the reporting period, interest rates rose on the expectation that the Fed would begin to raise short-term interest rates in the latter half of 2015. However, with the Fed's first increase delayed until December and its indication of a more gradual path of increases in 2016, interest rates trended lower over the remainder of the reporting period. Municipal market yields moved in tandem with broader interest rates, ending the reporting period below where they started. However, while the yields on intermediate- and longer-dated bonds posted sizeable declines, the yields of short-dated bonds increased slightly over the reporting period. This caused the municipal yield curve to flatten over the reporting period.
The municipal market's supply-demand balance was generally favorable over this reporting period. Over the twelve months ended May 31, 2016, municipal bond gross issuance nationwide totaled $384.5 billion, a 5.2% drop from the issuance for the twelve-month period ended May 31, 2015. Despite the drop, gross issuance remains elevated as issuers continue to actively and aggressively refund their outstanding debt given the very low interest rate environment. In these transactions the issuers are issuing new bonds and taking the bond proceeds and redeeming (calling) old bonds. These refunding transactions have ranged from 40%-60% of total
issuance over the past few years. Thus, the net issuance (all bonds issued less bonds redeemed) is actually much lower than the gross issuance. In fact, the total municipal bonds outstanding has actually declined in each of the past four calendar years. So, the gap between gross and net issuance has been an overall positive technical factor on municipal bond investment performance.
While supply has tightened, investor demand for municipal bonds has risen. Municipal bond mutual funds reported net inflows in 2015, and the inflows for the first four months of 2016 has already exceeded 2015's total volume for the year. The bouts of heightened volatility across other risky assets, uncertainty about the Fed's rate increases and the low to negative yields of European and Asian bonds have bolstered the appeal of municipal bonds' risk-adjusted returns and tax-equivalent yields. The municipal bond market is less directly influenced by the Fed's rate adjustments and its demand base is largely comprised of U.S. investors, factors which have helped municipal bonds deliver relatively attractive returns with less volatility than other market segments.
The fundamental backdrop also remained supportive for municipal bonds. Despite the U.S. economy's rather sluggish recovery, improving state and local balance sheets have contributed to generally good credit fundamentals. Higher tax revenue growth, better expense management and a more cautious approach to new debt issuance have led to credit upgrades and stable credit outlooks for many state and local issuers. While some pockets of weakness continued to grab headlines, including Illinois, New Jersey and Puerto Rico, their problems were largely contained, with minimal spillover into the broader municipal market.
What were the economic and market conditions in Georgia, Maryland, Minnesota, Missouri, North Carolina and Virginia during the twelve-month reporting period ended May 31, 2016?
Georgia's economy continues to grow, with 3.1% year-over-year employment growth. As of May 2016, unemployment in Georgia was 5.3%, down from 6.3% in May 2015, but still above the national rate of 4.7%. Georgia's economy continues to be well diversified, although geographically concentrated around the Atlanta metropolitan area. Home prices in the Atlanta area, were up 6.5% year-over-year as of April 2016 (most recent data available at the time this report was prepared), ahead of the national average of 5.0%, according to the S&P/Case-Shiller Home Price Index. The state's revenues have been tracking above budget. Total net tax revenue collections were 9.9% higher through April 2016, as compared to April 2015. Georgia's Revenue Shortfall Reserve, or rainy day fund, stands at $1.4 billion in January 2016. That is the largest balance since before the great recession. For Fiscal 2017, Georgia adopted a $23.7 billion state budget, increasing state spending by $1.9 billion over the Fiscal 2016 budget. Much of the spending increase ($825 million) is to fund the transportation bill that was passed in the 2015 legislative session. The Fiscal 2017 budget also provides $300 million in additional funds for K-12 education in an effort to further reduce the austerity cuts from prior years. In November 2014, voters in Georgia approved a constitutional amendment to prevent the state from increasing the maximum individual income tax rate above 6%. The Georgia Senate has decided to let voters decide in the fall of calendar year 2016 whether to reduce the maximum state income tax from 6% to 5.2%. Individual income tax is Georgia's largest revenue source accounting for about half of the state's general fund budget. As of June 2016 (subsequent to the close of this reporting period), Georgia's general obligation debt continued to be rated Aaa/AAA/AAA with stable outlooks from Moody's, S&P and Fitch, respectively. For the twelve months ended May 31, 2016, municipal issuance in Georgia totaled $6.8 billion, a gross issuance decrease of 1.0% from the twelve months ended May 31, 2015.
In Maryland, the state's credit profile has remained relatively strong due to sound fiscal management and a diverse economy. While Maryland's economic growth in 2015 was below many of its peers at 1.5%, compared to 2.4% on average for the U.S., other economic indicators are more favorable. Private sector employment is expanding and the labor market is tightening, in some cases making it difficult to find qualified applicants. Growth in the health care and professional services sectors buoyed the state's job market and lowered statewide unemployment to 4.5% as of May 2016, down from 5.3% in the prior year. However, Maryland's proximity to Washington D.C. means a greater dependency on federal employment than in most states, leaving it vulnerable to future federal cost-cutting. Government employment accounts for nearly 19% of all state employment. Maryland has one of the nation's best educated workforces, which has facilitated the development of advanced technology and the growth of public and private research facilities.
Portfolio Managers' Comments (continued)
Combined with the influence of the government sector and the presence of 56 universities, this has made Maryland a center for national security and medical and biomedical research. Demographics in the state remain favorable: the state's population is growing, now up to 5.9 million, residents have above average incomes, and the median home value is 163% of the U.S. median. Maryland closed Fiscal Year 2015 with an operating surplus and Fiscal Year 2016 revenues (as of March) are ahead of budget. The Fiscal 2017 budget estimates a 4% increase in revenues over the prior year and increases the state's rainy day fund to over $1 billion. As of June 2016 (subsequent to the close of this reporting period), Moody's, S&P and Fitch rated Maryland general obligation debt at Aaa/AAA/AAA with stable outlooks. During the twelve months ended May 31, 2016, municipal gross issuance in the state totaled $5.8 billion, down 28% from the twelve-month period ended May 31, 2015.
Minnesota's economic growth matched the national growth rate in 2015 with Minnesota's GDP growing 2.4% and ranked as the 12th fastest growing state economy. Minnesota's GDP growth was recently driven by gains in the manufacturing, financial services and professional and business services sectors. As of May 2016, Minnesota's seasonally adjusted unemployment rate of 3.8% remained well below the national unemployment rate of 4.7% and increased slightly compared to the state's 3.6% unemployment rate as of May 2015. In 2015, Minnesota state exports declined by 6.6% with the largest declines in civilian aircraft engines and parts and electronic sectors. According to the S&P/Case-Shiller Index of 20 major metropolitan areas, housing prices in Minnesota rose a fairly modest 4.8% during the twelve months ended April 2016 (most recent data available at the time this report was prepared), compared with a 5.0% price increase nationally. Previously in June 2015, Minnesota passed a balanced $42 billion biennium budget for Fiscal 2016 and 2017. Strong tax collections since last June gave Governor Dayton and the Legislature the luxury of a $900 million budget surplus during the 2016 legislative session. However, the Governor and Legislature couldn't agree on how to distribute a portion of the surplus with the republican lead legislature favoring tax cuts and Governor Dayton pushing for one-time funding of transportation projects. The Governor is continuing to push for a special legislative session to solve transportation issues. As of June 2016, the state's S&P and Moody's ratings were AA+ and Aa1, respectively, and S&P maintains a positive outlook while Moody's outlook is stable. For the twelve months ended May 31, 2016, municipal issuance in Minnesota totaled $9.2 billion, representing a gross issuance 29.8% increase from the twelve months ended May 31, 2015.
Missouri's economic recovery continues to lag national economic growth. For 2015, national GDP grew 2.4% and outpaced Missouri's GDP growth rate of 1.3%, which ranked as the 35th slowest growing state. As of May 2016, Missouri's unemployment rate of 4.3% improved from the state's 5.1% unemployment rate as of May 2015 and Missouri's unemployment rate is now below the national unemployment rate of 4.7%. Job growth was driven by gains in professional and business services, financial activities, and education and health services sectors. Missouri's state exports declined in 2015, with exports declining 3.7% compared to 2014, export declines were driven by motor vehicles and trade declines with three of Missouri's four largest trading partners, Canada, China and Japan. The Fiscal 2017 state budget of $27.3 billion was signed into law by Governor Nixon in May and included increased K-12 education funding, 4% increase in university funding and a 2% raise for state employees. As of June 2016, Moody's, S&P and Fitch rated Missouri general obligation debt at Aaa/AAA/AAA with stable outlooks. For the twelve months ended May 31, 2016, municipal issuance in Missouri totaled $5.5 billion, representing a 9.7% gross issuance decrease from the twelve months ended May 31, 2015.
North Carolina's growth has picked up and is now outpacing most of its peers. In 2015, the gross state product for North Carolina grew 2.7% compared to 1.4% the prior year, moving its ranking up to 10th among all states. As of May 2016, the state's unemployment rate was 5.1%. North Carolina has worked to transition its economy away from old-line manufacturing into sectors oriented toward research, technology and services and the combination of experience and a focus on the future resulted in Raleigh being selected as the site for a new federally subsidized institute for technology-based manufacturing. Once a leader in textiles, furniture and tobacco, the state's manufacturing sector was not expected to resume its role as a major driver in the North Carolina economy but manufacturing has continued to represent a significant number of the state's jobs. Almost 11% of total employment is in manufacturing and the sector has added 9,500 jobs during the recovery. The federal government remained the largest employer in the
state due to the large military installments, including Fort Bragg and Camp Lejeune, which are the two largest employers in the state with more than 110,000 workers. According to the S&P/Case-Shiller Index of 20 major metropolitan areas, housing prices in Charlotte rose 5.0% during the twelve months ended April 2016 (most recent data available at the time this report was prepared). North Carolina closed Fiscal Year 2015 with an operating surplus and Fiscal Year 2016 revenue projections indicate another strong financial performance. As of May 2016, Moody's, S&P and Fitch rated North Carolina general obligation debt at Aaa/AAA/AAA with stable outlooks. During the twelve months ended May 31, 2016, municipal issuance in North Carolina totaled $6.4 billion, a gross issuance increase of 12% from the previous twelve months.
Virginia's economic recovery has been slower than its peers. In fact, in 2014 it came to a halt—the state posted no growth in GDP which put it in 48th place among all states. It picked up steam in 2015, with accelerating employment and positive GDP growth of 1.4%, placing it 31st among all states. As of May 2016, unemployment in the commonwealth was 3.8% and well below the national average of 4.7%. Job growth in Virginia was led by the transportation and business services industries as well as education and health services, though notably, government employment remained flat. Virginia has a relatively high percentage of government employment, at almost 19% of total employment; this is a result of its proximity to Washington D.C. in the north and large military presence in the Hampton Roads region. In recent months, home prices in the region have risen slightly, according to the S&P/Case-Shiller Index of 20 major metropolitan areas, with the Washington D.C. area posting a 1.9% gain for the twelve months ended April 2016 (most recent data available at the time this report was prepared). Virginia has closed the last five years with balanced or surplus operations. Fiscal Year 2016 is the first year of its biennium budget and revenues are coming in slightly below budget. The state has revised its budgeted revenues for Fiscal Year 2016 downward and plans to offset this with draws on its revenue stabilization fund and general fund reserves. As of June 2016 (subsequent to the close of this reporting period), Moody's, S&P and Fitch rated Virginia general obligation debt at Aaa/AAA/AAA with stable outlooks. During the twelve months ended May 31, 2016, issuance in Virginia totaled $7.2 billion, a gross issuance decrease of 18% from the previous twelve months.
What key strategies were used to manage these Funds during the twelve-month reporting period ended May 31, 2016?
Municipal bonds delivered a strong gain over the twelve-month reporting period in an environment of falling interest rates, stronger credit fundamentals and a tight supply-demand balance. In some states, higher yielding municipal bond issuance is relatively scarce. With high yield municipal bond mutual funds experiencing surging inflows lately, demand for higher income issues has been very strong. As a result of the increased competition not only among state-specific funds but also with large, national mutual funds, we may have bought less of a new issue than we might have otherwise preferred or chose not to participate because demand for the bonds narrowed their spreads to unattractive levels.
Nevertheless, our trading activity continued to focus on pursuing the Funds' investment objectives. We continued to seek bonds in areas of the market that we expected to perform well as the economy continued to improve. The Funds' positioning emphasized intermediate and longer maturities, lower-rated credits and sectors offering higher yields. To fund these purchases, we generally reinvested the proceeds from called and maturing bonds. In some cases, we sold bonds that we believed had deteriorating fundamentals or could be traded for a better relative value, as well as selling short-dated, higher quality issues that we tend to hold over short timeframes as a source of liquidity.
We've also continued to be more cautious in selecting individual securities. As investor demand for municipal securities has increased and created a slight supply-demand imbalance, we've started to see underwriters bring new issues to market that are structured with terms more favorable to the issuer and perhaps less advantageous to the investor than in the recent past. We believe this shift in the marketplace merits extra vigilance on our part to ensure that every credit considered for the portfolio offers adequate reward potential for the level of risk to the bondholder. In cases where our convictions have been less certain, we've sought compensation for the additional risk or have passed on the deal all together.
Portfolio Managers' Comments (continued)
Trading activity covered a range of sectors and remained consistent with our strategic emphasis on lower rated, longer maturity credits. NKG bought bonds generally from the 15- to 20-year maturity range, including three high grade local general obligation bonds (GOs), a single A rated public utility credit and a single A rated revenue bond issued for Atlanta's Robert W. Woodruff Arts Center. NNC also focused on the intermediate portion of the yield curve, adding two higher rated local GOs and two public higher education bonds. For both NKG and NNC, we found fewer opportunities to buy among the longest maturities because, in our view, the longer-term bonds were not offering sufficient compensation for their additional duration risk. NMY added both in-state bonds, including issues for Baltimore-area health care provider LifeBridge Health System and University of Maryland Student Housing, and out-of-state bonds (namely, Buckeye Tobacco credits), as well as U.S. territory bonds from the Virgin Islands and Guam Power Authority. NPV also bought Guam Power Authority credits and in-state bonds issued for Virginia Rental Housing and Winchester Valley Health System. In NMS, we added to the Fund's life care and charter schools allocations with the purchases of credits issued by St. Louis Park for Mount Olivet Careview Home, Columbus Richfield Senior Housing and Hugo Charter School for Noble Academy. NOM's buying activity remained muted over this reporting period, adding St. Louis University revenue bonds and the Missouri Joint Municipal Electric Plum Point Project.
For all the Funds, the cash for new purchases came mainly from called and maturing bonds. Selling activity was fairly subdued. NKG sold a local GO. NMS and NMY occasionally sold high grade GOs when an attractive longer-term opportunity was available. We tend to consider these higher quality GOs as temporary holdings that can provide a source of liquidity when we're looking to fund the purchase of a longer-term, buy-and-hold position. The Puerto Rico exposures in NMY and NPV continued to decline during this reporting period, due to maturing bonds and, in the case of NPV, selling activity.
Additionally, NKG and NNC invested in credit default swap contracts to manage credit risk by purchasing credit protection. These swap contracts were terminated before the end of the reporting period. During the reporting period, the swaps had a negligible impact on performance.
As of May 31, 2016, NKG, NMY, NOM and NPV continued to use inverse floating rate securities. We employ inverse floaters for a variety of reasons, including duration management, income enhancement and total return enhancement.
How did the Funds perform during the twelve-month reporting period ended May 31, 2016?
The tables in each Fund's Performance Overview and Holding Summaries section of this report provide the Funds' total returns for the one-year, five-year and ten-year periods ended May 31, 2016. Each Fund's total returns at common share net asset value (NAV) are compared with the performance of corresponding market indexes and a Lipper classification average.
For the reporting period ended May 31, 2016, the total return at common share NAV for the six Funds exceeded the return for their respective state's S&P Municipal Bond Index as well as the national S&P Municipal Bond Index. For the same period, NKG, NMY, NMS, NNC and NPV lagged the average return for the Lipper Other States Municipal Debt Funds Classification Average, while NOM outperformed the Lipper average. Shareholders should note that the performance of the Lipper Other States classification represents the overall average of returns for funds from ten states with a wide variety of municipal market conditions, making direct comparisons less meaningful.
For the six Funds, duration and yield curve positioning were among the main positive contributors to performance during this reporting period. Consistent with our long term strategy, these Funds tended to have longer durations than the benchmark, with overweightings in the longer parts of the yield curve that performed well and underweightings in the underperforming shorter end of the curve. However, NMY and NPV had overweight allocations to the very shortest maturities (zero- to two-year) that slightly detracted from the Funds' relative performance. NMY and NPV also benefited from favorable credit selection in zero coupon bonds, a segment that performed well during the reporting period due to their very long maturities and higher yields.
Credit ratings allocations also boosted performance for most of the Funds during this reporting period. The returns of lower quality bonds generally outpaced those of higher quality credits due to investor demand for higher yielding assets and a willingness to increase credit risk because of improving credit fundamentals. The Funds' overweight allocations to the lower quality, below investment grade and not rated categories, as well as underweight allocations to AAA and AA rated credits were generally advantageous to performance. NMS was an exception, however, as ratings allocations had a neutral effect on performance. NMS' overweight exposures and credit selection in both below investment grade and not rated bonds boosted relative returns but those gains were offset by an overweight and weak credit selection in BBB rated credits.
Sector positioning produced mixed results for the Funds during this reporting period. For NKG and NNC, sector strategies detracted from relative performance primarily due to NKG's allocation to the higher education sector and NNC's overweight allocation to pre-refunded bonds, a group which underperformed the broad municipal market. Conversely, NMY's and NPV's sector allocations added value. In NMY, overweight positions in health care and tobacco and an underweight to tax-supported sectors (e.g., state and local GOs) added the most value. NPV's overweight exposures to the health care, tobacco and transportation sectors and its underweight to tax supported sectors were advantageous to relative performance. For NMS, sector positioning delivered positive performance but were only a small contributor to relative results. NMS's overweight allocation to the health care sector contributed the most, with additional gains from our credit selection in local GOs and an overweight position in housing. However, NMS' overweight allocations to pre-refunded and corporate-backed sectors dampened relative performance, as did the Fund's lack of exposure to the strong-performing tobacco sector (because Minnesota does not offer tobacco securitization bonds) and credit selection in the utilities sector. NOM's sector allocations had a neutral impact on relative performance over this reporting period.
An Update Involving Puerto Rico
As noted in the Funds' previous shareholder reports, we continue to monitor situations in the broader municipal market for any impact on the Funds' holdings and performance: the ongoing economic problems of Puerto Rico is one such case. Puerto Rico's continued economic weakening, escalating debt service obligations, and long-standing inability to deliver a balanced budget led to multiple downgrades on its debt over the past two years. Puerto Rico has warned investors since 2014 that the island's debt burden may be unsustainable and the Commonwealth has been exploring various strategies to deal with this burden, including Chapter 9 bankruptcy, which is currently not available by law. On June 30, 2016 (subsequent to the end of the reporting period), President Obama signed the Puerto Rico Oversight, Management and Economic Stability Act (PROMESA) into law. The legislation creates a path for Puerto Rico to establish an independent oversight board responsible for managing the government's financial operations and restructure debt. Implementation is expected to take time, as the law focuses on developing a comprehensive five-year fiscal plan.
In terms of Puerto Rico holdings, shareholders should note that NMY, NOM and NPV had limited exposure to Puerto Rico debt, 5.35%, 0.57% and 4.62%, respectively, at the end of the reporting period, consisting of mostly insured bonds. NKG, NMS, NNC did not hold any Puerto Rico bonds. The Puerto Rico credits offered higher yields, added diversification and triple exemption (i.e., exemption from most federal, state and local taxes). Puerto Rico general obligation debt is currently rated Caa2/CC/CC (below investment grade) by Moody's, S&P and Fitch, respectively, with negative outlooks.
A Note About Investment Valuations
The municipal securities held by the Funds are valued by the Funds' pricing service using a range of market-based inputs and assumptions. A different municipal pricing service might incorporate different assumptions and inputs into its valuation methodology, potentially resulting in different values for the same securities. These differences could be significant, both as to such individual securities, and as to the value of a given Fund's portfolio in its entirety. Thus, the current net asset value of a Fund's shares may be impacted, higher or lower, if the Fund were to change pricing service, or if its pricing service were to materially change its valuation methodology. The Funds have received notification by their current municipal bond pricing service that such service has agreed to be acquired by the parent company of another pricing service, and that the transaction is under regulatory review. Thus there is an increased risk that each Fund's pricing service may change, or that the Funds' current pricing service may change its valuation methodology, either of which could have an impact on the net asset value of each Fund's shares.
Fund Leverage
IMPACT OF THE FUNDS' LEVERAGE STRATEGY ON PERFORMANCE
One important factor impacting the returns of the Funds relative to their comparative benchmarks was the Funds' use of leverage through their issuance of preferred shares and/or investments in inverse floating rate securities, which represent leveraged investments in underlying bonds. The Funds use leverage because our research has shown that, over time, leveraging provides opportunities for additional income, particularly in the recent market environment where short-term market rates are at or near historical lows, meaning that the short-term rates the Fund has been paying on its leveraging instruments have been much lower than the interest the Fund has been earning on its portfolio of long-term bonds that it has bought with the proceeds of that leverage. However, use of leverage can expose the Fund to additional price volatility. When a Fund uses leverage, the Fund will experience a greater increase in its net asset value if the municipal bonds acquired through the use of leverage increase in value, but it will also experience a correspondingly larger decline in its net asset value if the bonds acquired through leverage decline in value, which will make the Fund's net asset value more volatile, and its total return performance more variable over time. In addition, income in levered funds will typically decrease in comparison to unlevered funds when short-term interest rates increase and increase when short-term interest rates decrease. Leverage had a positive impact on the performance of the Funds over the reporting period.
As of May 31, 2016, the Funds' percentages of leverage are as shown in the accompanying table.
| | | | NKG | | | NMY | | | NMS | | | NOM | | | NNC | | | NPV | |
| Effective Leverage* | | | 35.58 | % | | 34.07 | % | | 33.40 | % | | 37.45 | % | | 32.85 | % | | 36.91 | % |
| Regulatory Leverage* | | | 33.06 | % | | 32.14 | % | | 33.40 | % | | 34.76 | % | | 32.85 | % | | 32.25 | % |
| * | Effective Leverage is a Fund's effective economic leverage, and includes both regulatory leverage and the leverage effects of certain derivative and other investments in a Fund's portfolio that increase the Fund's investment exposure. Currently, the leverage effects of Tender Option Bond (TOB) inverse floater holdings are included in effective leverage values, in addition to any regulatory leverage. Regulatory leverage consists of preferred shares issued or borrowings of a Fund. Both of these are part of a Fund's capital structure. Regulatory leverage is subject to asset coverage limits set forth in the Investment Company Act of 1940. |
THE FUNDS' REGULATORY LEVERAGE
As of May 31, 2016, the Funds have issued and outstanding Variable Rate MuniFund Term Preferred (VMTP) Shares and Variable Rate Demand Preferred (VRDP) Shares as shown in the accompanying table.
| | | | VMTP Shares | | | VRDP Shares | | | | |
| | | | | | | Shares Issued at | | | | | | Shares Issued at | | | | |
| | | | Series | | | Liquidation Preference | | | Series | | | Liquidation Preference | | | Total | |
| NKG | | | 2017 | | $ | 75,000,000 | | | — | | | — | | $ | 75,000,000 | |
| NMY | | | 2017 | | $ | 167,000,000 | | | — | | | — | | $ | 167,000,000 | |
| NMS | | | 2017 | | $ | 44,100,000 | | | — | | | — | | $ | 44,100,000 | |
| NOM | | | 2018 | | $ | 18,000,000 | | | — | | | — | | $ | 18,000,000 | |
| NNC | | | 2017 | | $ | 125,000,000 | | | — | | | — | | $ | 125,000,000 | |
| NPV | | | — | | | — | | | 1 | | $ | 128,000,000 | | $ | 128,000,000 | |
Refer to Notes to Financial Statements, Note 4 – Fund Shares, Preferred Shares for further details on VMTP and VRDP Shares and each Fund's respective transactions.
Subsequent to the close of this reporting period, NMY, NMS and NNC each refinanced all of its outstanding VMTP Shares with the issuance of new VMTP Shares. NMY, NMS and NNC also issued an additional $30,000,000, $8,700,000 and $29,000,000VMTP Shares at liquidation preference, respectively, to be invested in accordance with each Fund's investment policies.
Common Share Information
COMMON SHARE DISTRIBUTION INFORMATION
The following information regarding the Funds' distributions is current as of May 31, 2016. Each Fund's distribution levels may vary over time based on each Fund's investment activity and portfolio investments value changes.
During the current reporting period, each Fund's distributions to common shareholders were as shown in the accompanying table.
| | | Per Common Share Amounts |
| Monthly Distribution (Ex-Dividend Date) | | | NKG | | | NMY | | | NMS | | | NOM | | | NNC | | | NPV | |
| June 2015 | | $ | 0.0535 | | $ | 0.0555 | | $ | 0.0690 | | $ | 0.0610 | | $ | 0.0490 | | $ | 0.0610 | |
| July | | | 0.0535 | | | 0.0555 | | | 0.0690 | | | 0.0610 | | | 0.0490 | | | 0.0610 | |
| August | | | 0.0535 | | | 0.0555 | | | 0.0690 | | | 0.0610 | | | 0.0490 | | | 0.0610 | |
| September | | | 0.0535 | | | 0.0555 | | | 0.0665 | | | 0.0610 | | | 0.0490 | | | 0.0570 | |
| October | | | 0.0535 | | | 0.0555 | | | 0.0665 | | | 0.0610 | | | 0.0490 | | | 0.0570 | |
| November | | | 0.0535 | | | 0.0555 | | | 0.0665 | | | 0.0610 | | | 0.0490 | | | 0.0570 | |
| December | | | 0.0535 | | | 0.0555 | | | 0.0665 | | | 0.0610 | | | 0.0490 | | | 0.0545 | |
| January | | | 0.0535 | | | 0.0555 | | | 0.0665 | | | 0.0610 | | | 0.0490 | | | 0.0545 | |
| February | | | 0.0535 | | | 0.0555 | | | 0.0665 | | | 0.0610 | | | 0.0490 | | | 0.0545 | |
| March | | | 0.0535 | | | 0.0555 | | | 0.0665 | | | 0.0610 | | | 0.0490 | | | 0.0545 | |
| April | | | 0.0535 | | | 0.0555 | | | 0.0665 | | | 0.0610 | | | 0.0490 | | | 0.0545 | |
| May 2016 | | | 0.0535 | | | 0.0555 | | | 0.0665 | | | 0.0610 | | | 0.0490 | | | 0.0545 | |
| Total Monthly Per Share Distributions | | $ | 0.6420 | | $ | 0.6660 | | $ | 0.8055 | | $ | 0.7320 | | $ | 0.5880 | | $ | 0.6810 | |
| Ordinary Income Distribution* | | $ | 0.0023 | | $ | 0.0020 | | $ | — | | $ | — | | $ | 0.0099 | | $ | 0.0066 | |
| Total Distributions from Net Investment Income | | $ | 0.6443 | | $ | 0.6680 | | $ | 0.8055 | | | 0.7320 | | $ | 0.5979 | | $ | 0.6876 | |
| Total Distributions from Long-Term Capital Gains* | | $ | — | | $ | — | | $ | — | | $ | — | | $ | 0.0037 | | $ | — | |
| Total Distributions | | $ | 0.6443 | | $ | 0.6680 | | $ | 0.8055 | | $ | 0.7320 | | $ | 0.6016 | | $ | 0.6876 | |
| | | | | | | | | | | | | | | | | | | | |
| Yields | | | | | | | | | | | | | | | | | | | |
| Market Yield** | | | 4.50 | % | | 4.88 | % | | 4.99 | % | | 4.57 | % | | 4.14 | % | | 4.53 | % |
| Taxable-Equivalent Yield** | | | 6.65 | % | | 7.18 | % | | 7.69 | % | | 6.75 | % | | 6.10 | % | | 6.67 | % |
| * | Distribution paid in December 2015. |
| ** | Market Yield is based on the Fund's current annualized monthly dividend divided by the Fund's current market price as of the end of the reporting period. Taxable-Equivalent Yield represents the yield that must be earned on a fully taxable investment in order to equal the yield of the Fund on an after-tax basis. It is based on a combined federal and state income tax rate of 32.3%, 32.0%, 35.1%, 32.3%, 32.1% and 32.1% for Georgia, Maryland, Minnesota, Missouri, North Carolina and Virginia, respectively. When comparing a Fund to investments that generate qualified dividend income, the Taxable-Equivalent Yield would be lower. |
Each Fund in this report seeks to pay regular monthly dividends out of its net investment income at a rate that reflects its past and projected net income performance. To permit each Fund to maintain a more stable monthly dividend, the Fund may pay dividends at a rate that may be more or less than the amount of net income actually earned by the Fund during the period. If a Fund has cumulatively earned more than it has paid in dividends, it will hold the excess in reserve as undistributed net investment income (UNII) as part of the Fund's net asset value. Conversely, if a Fund has cumulatively paid in dividends more than it has earned, the excess will constitute a negative UNII that will likewise be reflected in the Fund's net asset value. Each Fund will, over time, pay all its net investment income as dividends to shareholders.
As of May 31, 2016, the Funds had positive UNII balances for tax purposes and positive UNII balances for financial reporting purposes.
Common Share Information (continued)
All monthly dividends paid by each Fund during the current reporting period were paid from net investment income. If a portion of the Fund's monthly distributions was sourced from or comprised of elements other than net investment income, including capital gains and/or a return of capital, shareholders would have received a notice to that effect. For financial reporting purposes, the composition and per share amounts of each Fund's dividends for the reporting period are presented in this report's Statement of Changes in Net Assets and Financial Highlights, respectively. For income tax purposes, distribution information for each Fund as of its most recent tax year end is presented in Note 6 — Income Tax Information within the Notes to Financial Statements of this report.
COMMON SHARE EQUITY SHELF PROGRAM
Subsequent to the close of this reporting period, NMS filed a registration statement with the Securities and Exchange Commission to issue additional common shares through an equity shelf program. Under this program NMS, subject to market conditions, may raise additional capital from time to time in varying amounts and offering methods at a net price at or above the Fund's NAV per common share.
COMMON SHARE REPURCHASES
During August 2015, the Funds' Board of Trustees reauthorized an open-market share repurchase program, allowing each Fund to repurchase an aggregate of up to approximately 10% of its outstanding shares.
As of May 31, 2016, and since the inception of the Funds' repurchase programs, the Funds have cumulatively repurchased and retired their outstanding common shares as shown in the accompanying table.
| | | | NKG | | | NMY | | | NMS | | | NOM | | | NNC | | | NPV | |
| Common shares cumulatively repurchased and retired | | | — | | | 730,000 | | | — | | | — | | | 130,000 | | | — | |
| Common shares authorized for repurchase | | | 1,055,000 | | | 2,350,000 | | | 555,000 | | | 235,000 | | | 1,645,000 | | | 1,795,000 | |
During the current reporting period, the following Funds repurchased and retired their common shares at a weighted average price per common share and a weighted average discount per common share as shown in the accompanying table.
| | | | NMY | | | NNC | |
| Common shares repurchased and retired | | | 225,902 | | | 22,501 | |
| Weighted average price per common share repurchased and retired | | $ | 12.34 | | $ | 12.75 | |
| Weighted average discount per common share repurchased and retired | | | 15.25 | % | | 15.01 | % |
OTHER COMMON SHARE INFORMATION
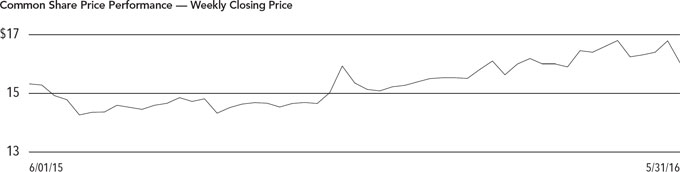
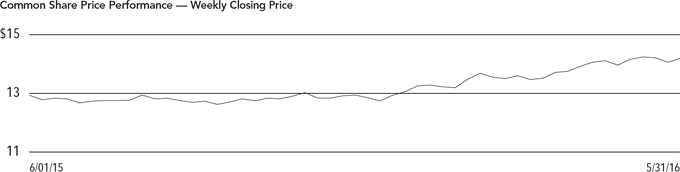
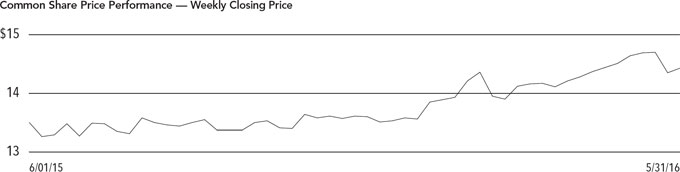
As of May 31, 2016, and during the current reporting period, the Funds' common share prices were trading at a premium/(discount) to their common share NAVs as shown in the accompanying table.
| | | | NKG | | | NMY | | | NMS | | | NOM | | | NNC | | | NPV | |
| Common share NAV | | $ | 14.40 | | $ | 15.08 | | $ | 15.78 | | $ | 14.45 | | $ | 15.56 | | $ | 15.00 | |
| Common share price | | $ | 14.28 | | $ | 13.65 | | $ | 15.99 | | $ | 16.03 | | $ | 14.19 | | $ | 14.43 | |
| Premium/(Discount) to NAV | | | (0.83 | )% | | (9.48 | )% | | 1.33 | % | | 10.93 | % | | (8.80 | )% | | (3.80 | )% |
| 12-month average premium/(discount) to NAV | | | (5.47 | )% | | (13.89 | )% | | (3.87 | )% | | 8.77 | % | | (13.17 | )% | | (5.74 | )% |
Risk Considerations
Fund shares are not guaranteed or endorsed by any bank or other insured depository institution, and are not federally insured by the Federal Deposit Insurance Corporation.
Nuveen Georgia Dividend Advantage Municipal Fund 2 (NKG)
Investing in closed-end funds involves risk; principal loss is possible. There is no guarantee the Fund's investment objectives will be achieved. Closed-end fund shares may frequently trade at a discount or premium to their net asset value. Debt or fixed income securities such as those held by the Fund, are subject to market risk, credit risk, interest rate risk, derivatives risk, liquidity risk, and income risk. As interest rates rise, bond prices fall. Leverage increases return volatility and magnifies the Fund's potential return and its risks; there is no guarantee a fund's leverage strategy will be successful. State concentration makes the Fund more susceptible to local adverse economic, political, or regulatory changes affecting municipal bond issuers. These and other risk considerations such as inverse floater risk and tax risk are described in more detail on the Fund's web page at www.nuveen.com/NKG.
Nuveen Maryland Premium Income Municipal Fund (NMY)
Investing in closed-end funds involves risk; principal loss is possible. There is no guarantee the Fund's investment objectives will be achieved. Closed-end fund shares may frequently trade at a discount or premium to their net asset value. Debt or fixed income securities such as those held by the Fund, are subject to market risk, credit risk, interest rate risk, derivatives risk, liquidity risk, and income risk. As interest rates rise, bond prices fall. Leverage increases return volatility and magnifies the Fund's potential return and its risks; there is no guarantee a fund's leverage strategy will be successful. State concentration makes the Fund more susceptible to local adverse economic, political, or regulatory changes affecting municipal bond issuers. These and other risk considerations such as inverse floater risk and tax risk are described in more detail on the Fund's web page at www.nuveen.com/NMY.
Nuveen Minnesota Municipal Income Fund (NMS)
Investing in closed-end funds involves risk; principal loss is possible. There is no guarantee the Fund's investment objectives will be achieved. Closed-end fund shares may frequently trade at a discount or premium to their net asset value. Debt or fixed income securities such as those held by the Fund, are subject to market risk, credit risk, interest rate risk, derivatives risk, liquidity risk, and income risk. As interest rates rise, bond prices fall. Leverage increases return volatility and magnifies the Fund's potential return and its risks; there is no guarantee a fund's leverage strategy will be successful. State concentration makes the Fund more susceptible to local adverse economic, political, or regulatory changes affecting municipal bond issuers. These and other risk considerations such as inverse floater risk and tax risk are described in more detail on the Fund's web page at www.nuveen.com/NMS.
Risk Considerations (continued)
Nuveen Missouri Premium Income Municipal Fund (NOM)
Investing in closed-end funds involves risk; principal loss is possible. There is no guarantee the Fund's investment objectives will be achieved. Closed-end fund shares may frequently trade at a discount or premium to their net asset value. Debt or fixed income securities such as those held by the Fund, are subject to market risk, credit risk, interest rate risk, derivatives risk, liquidity risk, and income risk. As interest rates rise, bond prices fall. Leverage increases return volatility and magnifies the Fund's potential return and its risks; there is no guarantee a fund's leverage strategy will be successful. State concentration makes the Fund more susceptible to local adverse economic, political, or regulatory changes affecting municipal bond issuers. These and other risk considerations such as inverse floater risk and tax risk are described in more detail on the Fund's web page at www.nuveen.com/NOM.
Nuveen North Carolina Premium Income Municipal Fund (NNC)
Investing in closed-end funds involves risk; principal loss is possible. There is no guarantee the Fund's investment objectives will be achieved. Closed-end fund shares may frequently trade at a discount or premium to their net asset value. Debt or fixed income securities such as those held by the Fund, are subject to market risk, credit risk, interest rate risk, derivatives risk, liquidity risk, and income risk. As interest rates rise, bond prices fall. Leverage increases return volatility and magnifies the Fund's potential return and its risks; there is no guarantee a fund's leverage strategy will be successful. State concentration makes the Fund more susceptible to local adverse economic, political, or regulatory changes affecting municipal bond issuers. These and other risk considerations such as inverse floater risk and tax risk are described in more detail on the Fund's web page at www.nuveen.com/NNC.
Nuveen Virginia Premium Income Municipal Fund (NPV)
Investing in closed-end funds involves risk; principal loss is possible. There is no guarantee the Fund's investment objectives will be achieved. Closed-end fund shares may frequently trade at a discount or premium to their net asset value. Debt or fixed income securities such as those held by the Fund, are subject to market risk, credit risk, interest rate risk, derivatives risk, liquidity risk, and income risk. As interest rates rise, bond prices fall. Leverage increases return volatility and magnifies the Fund's potential return and its risks; there is no guarantee a fund's leverage strategy will be successful. State concentration makes the Fund more susceptible to local adverse economic, political, or regulatory changes affecting municipal bond issuers. These and other risk considerations such as inverse floater risk and tax risk are described in more detail on the Fund's web page at www.nuveen.com/NPV.
| NKG | |
| | Nuveen Georgia Dividend Advantage Municipal Fund 2 |
| | Performance Overview and Holding Summaries as of May 31, 2016 |
Refer to the Glossary of Terms Used in this Report for further definition of the terms used within this section.
Average Annual Total Returns as of May 31, 2016
| | | | Average Annual | |
| | | | 1-Year | | 5-Year | | 10-Year | |
| NKG at Common Share NAV | | | 7.80 | % | | 5.67 | % | | 4.94 | % | |
| NKG at Common Share Price | | | 16.94 | % | | 5.56 | % | | 5.90 | % | |
| S&P Municipal Bond Georgia Index | | | 5.20 | % | | 4.64 | % | | 4.60 | % | |
| S&P Municipal Bond Index | | | 5.72 | % | | 5.23 | % | | 4.84 | % | |
| Lipper Other States Municipal Debt Funds Classification Average | | | 9.26 | % | | 7.66 | % | | 5.82 | % | |
Past performance is not predictive of future results. Current performance may be higher or lower than the data shown. Returns do not reflect the deduction of taxes that shareholders may have to pay on Fund distributions or upon the sale of Fund shares. Returns at NAV are net of Fund expenses, and assume reinvestment of distributions. Comparative index and Lipper return information is provided for the Fund's shares at NAV only. Indexes and Lipper averages are not available for direct investment.
This data relates to the securities held in the Fund's portfolio of investments as of the end of the reporting period. It should not be construed as a measure of performance for the Fund itself. Holdings are subject to change.
Ratings shown are the highest rating given by one of the following national rating agencies: Standard & Poor's Group, Moody's Investors Service, Inc. or Fitch, Inc. Credit ratings are subject to change. AAA, AA, A and BBB are investment grade ratings; BB, B, CCC, CC, C and D are below-investment grade ratings. Certain bonds backed by U.S. Government or agency securities are regarded as having an implied rating equal to the rating of such securities. Holdings designated N/R are not rated by these national rating agencies.
| Fund Allocation | |
| (% of net assets) | |
| Long-Term Municipal Bonds | 147.3% |
| Other Assets Less Liabilities | 4.2% |
| Net Assets Plus Floating Rate Obligations & VMTP Shares, at Liquidation Preference | 151.5% |
| Floating Rate Obligations | (2.1)% |
| VMTP Shares, at Liquidation Preference | (49.4)% |
| Net Assets | 100% |
| Portfolio Composition | |
| (% of total investments) | |
| Tax Obligation/General | 27.8% |
| U.S. Guaranteed | 15.6% |
| Tax Obligation/Limited | 11.0% |
| Education and Civic Organizations | 10.2% |
| Water and Sewer | 9.6% |
| Health Care | 8.2% |
| Utilities | 8.0% |
| Transportation | 7.6% |
| Other | 2.0% |
| Total | 100% |
| Credit Quality | |
| (% of total investment exposure) | |
| AAA/U.S. Guaranteed | 26.4% |
| AA | 51.6% |
| A | 14.0% |
| BBB | 4.2% |
| BB or Lower | 0.3% |
| N/R (not rated) | 3.5% |
| Total | 100% |
| NMY | |
| | Nuveen Maryland Premium Income Municipal Fund |
| | Performance Overview and Holding Summaries as of May 31, 2016 |
Refer to the Glossary of Terms Used in this Report for further definition of the terms used within this section.
Average Annual Total Returns as of May 31, 2016
| | Average Annual | |
| | 1-Year | 5-Year | 10-Year | |
| NMY at Common Share NAV | 8.13% | 5.87% | 5.34% | |
| NMY at Common Share Price | 14.77% | 4.82% | 4.64% | |
| S&P Municipal Bond Maryland Index | 4.69% | 4.20% | 4.41% | |
| S&P Municipal Bond Index | 5.72% | 5.23% | 4.84% | |
| Lipper Other States Municipal Debt Funds Classification Average | 9.26% | 7.66% | 5.82% | |
Past performance is not predictive of future results. Current performance may be higher or lower than the data shown. Returns do not reflect the deduction of taxes that shareholders may have to pay on Fund distributions or upon the sale of Fund shares. Returns at NAV are net of Fund expenses, and assume reinvestment of distributions. Comparative index and Lipper return information is provided for the Fund's shares at NAV only. Indexes and Lipper averages are not available for direct investment.
This data relates to the securities held in the Fund's portfolio of investments as of the end of the reporting period. It should not be construed as a measure of performance for the Fund itself. Holdings are subject to change.
Ratings shown are the highest rating given by one of the following national rating agencies: Standard & Poor's Group, Moody's Investors Service, Inc. or Fitch, Inc. Credit ratings are subject to change. AAA, AA, A and BBB are investment grade ratings; BB, B, CCC, CC, C and D are below-investment grade ratings. Certain bonds backed by U.S. Government or agency securities are regarded as having an implied rating equal to the rating of such securities. Holdings designated N/R are not rated by these national rating agencies.
| Fund Allocation | |
| (% of net assets) | |
| Long-Term Municipal Bonds | 146.7% |
| Common Stocks | 0.4% |
| Other Assets Less Liabilities | 4.6% |
| Net Assets Plus Floating Rate Obligations & VMTP Shares, at Liquidation Preference | 151.7% |
| Floating Rate Obligations | (4.3)% |
| VMTP Shares, at Liquidation Preference | (47.4)% |
| Net Assets | 100% |
| Portfolio Composition | |
| (% of total investments) | |
| Health Care | 23.2% |
| Tax Obligation/Limited | 13.7% |
| U.S. Guaranteed | 13.2% |
| Tax Obligation/General | 11.8% |
| Education and Civic Organizations | 8.7% |
| Housing/Single Family | 5.9% |
| Housing/Multifamily | 4.7% |
| Other | 18.8% |
| Total | 100% |
| Credit Quality | |
| (% of total investment exposure) | |
| AAA/U.S. Guaranteed | 22.3% |
| AA | 32.3% |
| A | 19.7% |
| BBB | 15.9% |
| BB or Lower | 6.1% |
| N/R (not rated) | 3.4% |
| N/A (not applicable) | 0.3% |
| Total | 100% |
| NMS | |
| | Nuveen Minnesota Municipal Income Fund |
| | Performance Overview and Holding Summaries as of May 31, 2016 |
Refer to the Glossary of Terms Used in this Report for further definition of the terms used within this section.
Average Annual Total Returns as of May 31, 2016
| | Average Annual | |
| | 1-Year | 5-Year | 10-Year | |
| NMS at Common Share NAV | 7.47% | 8.10% | 6.53% | |
| NMS at Common Share Price | 12.84% | 7.75% | 6.48% | |
| S&P Municipal Bond Minnesota Index | 4.77% | 4.62% | 4.72% | |
| S&P Municipal Bond Index | 5.72% | 5.23% | 4.84% | |
| Lipper Other States Municipal Debt Funds Classification Average | 9.26% | 7.66% | 5.82% | |
Past performance is not predictive of future results. Current performance may be higher or lower than the data shown. Returns do not reflect the deduction of taxes that shareholders may have to pay on Fund distributions or upon the sale of Fund shares. Returns at NAV are net of Fund expenses, and assume reinvestment of distributions. Comparative index and Lipper return information is provided for the Fund's shares at NAV only. Indexes and Lipper averages are not available for direct investment.
This data relates to the securities held in the Fund's portfolio of investments as of the end of the reporting period. It should not be construed as a measure of performance for the Fund itself. Holdings are subject to change.
Ratings shown are the highest rating given by one of the following national rating agencies: Standard & Poor's Group, Moody's Investors Service, Inc. or Fitch, Inc. Credit ratings are subject to change. AAA, AA, A and BBB are investment grade ratings; BB, B, CCC, CC, C and D are below-investment grade ratings. Certain bonds backed by U.S. Government or agency securities are regarded as having an implied rating equal to the rating of such securities. Holdings designated N/R are not rated by these national rating agencies.
| Fund Allocation | |
| (% of net assets) | |
| Long-Term Municipal Bonds | 148.8% |
| Other Assets Less Liabilities | 1.3% |
| Net Assets Plus VMTP Shares, at Liquidation Preference | 150.1% |
| VMTP Shares, at Liquidation Preference | (50.1)% |
| Net Assets | 100% |
| Portfolio Composition | |
| (% of total investments) | |
| Education and Civic Organizations | 17.9% |
| Health Care | 15.1% |
| Utilities | 12.2% |
| Long-Term Care | 11.3% |
| Tax Obligation/General | 11.1% |
| U.S. Guaranteed | 10.8% |
| Tax Obligation/Limited | 8.5% |
| Other | 13.1% |
| Total | 100% |
| Credit Quality | |
| (% of total investment exposure) | |
| AAA/U.S. Guaranteed | 14.8% |
| AA | 36.3% |
| A | 15.0% |
| BBB | 8.9% |
| BB or Lower | 7.8% |
| N/R (not rated) | 17.2% |
| Total | 100% |
| NOM | |
| | Nuveen Missouri Premium Income Municipal Fund |
| | Performance Overview and Holding Summaries as of May 31, 2016 |
Refer to the Glossary of Terms Used in this Report for further definition of the terms used within this section.
Average Annual Total Returns as of May 31, 2016
| | Average Annual | |
| | 1-Year | 5-Year | 10-Year | |
| NOM at Common Share NAV | 9.40% | 7.32% | 5.51% | |
| NOM at Common Share Price | 10.34% | 8.23% | 5.01% | |
| S&P Municipal Bond Missouri Index | 5.52% | 5.22% | 4.97% | |
| S&P Municipal Bond Index | 5.72% | 5.23% | 4.84% | |
| Lipper Other States Municipal Debt Funds Classification Average | 9.26% | 7.66% | 5.82% | |
Past performance is not predictive of future results. Current performance may be higher or lower than the data shown. Returns do not reflect the deduction of taxes that shareholders may have to pay on Fund distributions or upon the sale of Fund shares. Returns at NAV are net of Fund expenses, and assume reinvestment of distributions. Comparative index and Lipper return information is provided for the Fund's shares at NAV only. Indexes and Lipper averages are not available for direct investment.
This data relates to the securities held in the Fund's portfolio of investments as of the end of the reporting period. It should not be construed as a measure of performance for the Fund itself. Holdings are subject to change.
Ratings shown are the highest rating given by one of the following national rating agencies: Standard & Poor's Group, Moody's Investors Service, Inc. or Fitch, Inc. Credit ratings are subject to change. AAA, AA, A and BBB are investment grade ratings; BB, B, CCC, CC, C and D are below-investment grade ratings. Certain bonds backed by U.S. Government or agency securities are regarded as having an implied rating equal to the rating of such securities. Holdings designated N/R are not rated by these national rating agencies.
| Fund Allocation | |
| (% of net assets) | |
| Long-Term Municipal Bonds | 157.7% |
| Other Assets Less Liabilities | 2.2% |
| Net Assets Plus Floating Rate Obligations & VMTP Shares, at Liquidation Preference | 159.9% |
| Floating Rate Obligations | (6.6)% |
| VMTP Shares, at Liquidation Preference | (53.3)% |
| Net Assets | 100% |
| Portfolio Composition | |
| (% of total investments) | |
| Health Care | 23.5% |
| Education and Civic Organizations | 14.8% |
| Tax Obligation/Limited | 14.1% |
| Utilities | 9.2% |
| Long-Term Care | 9.2% |
| Transportation | 7.7% |
| Tax Obligation/General | 6.7% |
| U.S. Guaranteed | 6.4% |
| Water and Sewer | 5.5% |
| Other | 2.9% |
| Total | 100% |
| Credit Quality | |
| (% of total investment exposure) | |
| AAA/U.S. Guaranteed | 12.0% |
| AA | 36.1% |
| A | 27.4% |
| BBB | 14.3% |
| BB or Lower | 2.4% |
| N/R (not rated) | 7.8% |
| Total | 100% |
| NNC | |
| | Nuveen North Carolina Premium Income Municipal Fund |
| | Performance Overview and Holding Summaries as of May 31, 2016 |
Refer to the Glossary of Terms Used in this Report for further definition of the terms used within this section.
Average Annual Total Returns as of May 31, 2016
| | Average Annual | |
| | 1-Year | 5-Year | 10-Year | |
| NNC at Common Share NAV | 8.05% | 6.12% | 5.49% | |
| NNC at Common Share Price | 14.65% | 4.48% | 4.26% | |
| S&P Municipal Bond North Carolina Index | 4.73% | 4.36% | 4.66% | |
| S&P Municipal Bond Index | 5.72% | 5.23% | 4.84% | |
| Lipper Other States Municipal Debt Funds Classification Average | 9.26% | 7.66% | 5.82% | |
Past performance is not predictive of future results. Current performance may be higher or lower than the data shown. Returns do not reflect the deduction of taxes that shareholders may have to pay on Fund distributions or upon the sale of Fund shares. Returns at NAV are net of Fund expenses, and assume reinvestment of distributions. Comparative index and Lipper return information is provided for the Fund's shares at NAV only. Indexes and Lipper averages are not available for direct investment.
This data relates to the securities held in the Fund's portfolio of investments as of the end of the reporting period. It should not be construed as a measure of performance for the Fund itself. Holdings are subject to change.
Ratings shown are the highest rating given by one of the following national rating agencies: Standard & Poor's Group, Moody's Investors Service, Inc. or Fitch, Inc. Credit ratings are subject to change. AAA, AA, A and BBB are investment grade ratings; BB, B, CCC, CC, C and D are below-investment grade ratings. Certain bonds backed by U.S. Government or agency securities are regarded as having an implied rating equal to the rating of such securities. Holdings designated N/R are not rated by these national rating agencies.
| Fund Allocation | |
| (% of net assets) | |
| Long-Term Municipal Bonds | 148.8% |
| Other Assets Less Liabilities | 0.1% |
| Net Assets Plus VMTP Shares, at Liquidation Preference | 148.9% |
| VMTP Shares, at Liquidation Preference | (48.9)% |
| Net Assets | 100% |
| Portfolio Composition | |
| (% of total investments) | |
| U.S. Guaranteed | 21.6% |
| Health Care | 16.8% |
| Transportation | 15.6% |
| Education and Civic Organizations | 14.2% |
| Water and Sewer | 12.5% |
| Tax Obligation/Limited | 10.5% |
| Other | 8.8% |
| Total | 100% |
| Credit Quality | |
| (% of total investment exposure) | |
| AAA/U.S. Guaranteed | 31.8% |
| AA | 49.0% |
| A | 11.9% |
| BBB | 5.6% |
| N/R (not rated) | 1.7% |
| Total | 100% |
| NPV | |
| | Nuveen Virginia Premium Income Municipal Fund |
| | Performance Overview and Holding Summaries as of May 31, 2016 |
Refer to the Glossary of Terms Used in this Report for further definition of the terms used within this section.
Average Annual Total Returns as of May 31, 2016
| | Average Annual | |
| | 1-Year | 5-Year | 10-Year | |
| NPV at Common Share NAV | 8.41% | 6.06% | 5.38% | |
| NPV at Common Share Price | 13.22% | 4.77% | 5.11% | |
| S&P Municipal Bond Virginia Index | 5.67% | 4.57% | 4.46% | |
| S&P Municipal Bond Index | 5.72% | 5.23% | 4.84% | |
| Lipper Other States Municipal Debt Funds Classification Average | 9.26% | 7.66% | 5.82% | |
Past performance is not predictive of future results. Current performance may be higher or lower than the data shown. Returns do not reflect the deduction of taxes that shareholders may have to pay on Fund distributions or upon the sale of Fund shares. Returns at NAV are net of Fund expenses, and assume reinvestment of distributions. Comparative index and Lipper return information is provided for the Fund's shares at NAV only. Indexes and Lipper averages are not available for direct investment.
This data relates to the securities held in the Fund's portfolio of investments as of the end of the reporting period. It should not be construed as a measure of performance for the Fund itself. Holdings are subject to change.
Ratings shown are the highest rating given by one of the following national rating agencies: Standard & Poor's Group, Moody's Investors Service, Inc. or Fitch, Inc. Credit ratings are subject to change. AAA, AA, A and BBB are investment grade ratings; BB, B, CCC, CC, C and D are below-investment grade ratings. Certain bonds backed by U.S. Government or agency securities are regarded as having an implied rating equal to the rating of such securities. Holdings designated N/R are not rated by these national rating agencies.
| Fund Allocation | |
| (% of net assets) | |
| Long-Term Municipal Bonds | 142.2% |
| Other Assets Less Liabilities | 8.8% |
| Net Assets Plus Floating Rate Obligations & VRDP Shares, at Liquidation Preference | 151.0% |
| Floating Rate Obligations | (3.4)% |
| VRDP Shares, at Liquidation Preference | (47.6)% |
| Net Assets | 100% |
| Portfolio Composition | |
| (% of total investments) | |
| Tax Obligation/Limited | 19.6% |
| Health Care | 17.5% |
| Transportation | 16.3% |
| U.S. Guaranteed | 14.0% |
| Education and Civic Organizations | 5.9% |
| Water and Sewer | 5.5% |
| Long-Term Care | 4.6% |
| Other | 16.6% |
| Total | 100% |
| Credit Quality | |
| (% of total investment exposure) | |
| AAA/U.S. Guaranteed | 26.8% |
| AA | 40.6% |
| A | 9.9% |
| BBB | 12.8% |
| BB or Lower | 6.1% |
| N/R (not rated) | 3.8% |
| Total | 100% |
Shareholder Meeting Report
The annual meeting of shareholders was held in the offices of Nuveen Investments on April 22, 2016 for NKG, NMY, NMS, NOM, NNC and NPV; at this meeting the shareholders were asked to elect Board Members.
| | | | NKG | | | NMY | | | NMS | |
| | | | Common and | | | | | | Common and | | | | | | Common and | | | | |
| | | | Preferred | | | | | | Preferred | | | | | | Preferred | | | | |
| | | | Shares voting | | | | | | Shares voting | | | | | | Shares voting | | | | |
| | | | together | | | Preferred | | | together | | | Preferred | | | together | | | Preferred | |
| | | | as a class | | | Shares | | | as a class | | | Shares | | | as a class | | | Shares | |
| Approval of the Board Members was reached as follows: | | | | | | | | | | | | | | | | | | | |
| William C. Hunter | | | | | | | | | | | | | | | | | | | |
| For | | | — | | | 750 | | | — | | | 1,670 | | | — | | | 441 | |
| Withhold | | | — | | | — | | | — | | | — | | | — | | | — | |
| Total | | | — | | | 750 | | | — | | | 1,670 | | | — | | | 441 | |
| William J. Schneider | | | | | | | | | | | | | | | | | | | |
| For | | | — | | | 750 | | | — | | | 1,670 | | | — | | | 441 | |
| Withhold | | | — | | | — | | | — | | | — | | | — | | | — | |
| Total | | | — | | | 750 | | | — | | | 1,670 | | | — | | | 441 | |
| Judith M. Stockdale | | | | | | | | | | | | | | | | | | | |
| For | | | 9,283,414 | | | — | | | 18,862,537 | | | — | | | 4,260,196 | | | — | |
| Withhold | | | 373,337 | | | — | | | 669,156 | | | — | | | 130,890 | | | — | |
| Total | | | 9,656,751 | | | — | | | 19,531,693 | | | — | | | 4,391,086 | | | — | |
| Carole E. Stone | | | | | | | | | | | | | | | | | | | |
| For | | | 9,288,417 | | | — | | | 18,811,293 | | | — | | | 4,260,196 | | | — | |
| Withhold | | | 368,334 | | | — | | | 720,400 | | | — | | | 130,890 | | | — | |
| Total | | | 9,656,751 | | | — | | | 19,531,693 | | | — | | | 4,391,086 | | | — | |
| Margaret L. Wolff | | | | | | | | | | | | | | | | | | | |
| For | | | 9,281,072 | | | — | | | 18,895,399 | | | — | | | 4,260,063 | | | — | |
| Withhold | | | 375,679 | | | — | | | 636,294 | | | — | | | 131,023 | | | — | |
| Total | | | 9,656,751 | | | — | | | 19,531,693 | | | — | | | 4,391,086 | | | — | |
Shareholder Meeting Report (continued)
| | | | NOM | | | NNC | | | NPV | |
| | | | Common and | | | | | | Common and | | | | | | Common and | | | | |
| | | | Preferred | | | | | | Preferred | | | | | | Preferred | | | | |
| | | | Shares voting | | | | | | Shares voting | | | | | | Shares voting | | | | |
| | | | together | | | Preferred | | | together | | | Preferred | | | together | | | Preferred | |
| | | | as a class | | | Shares | | | as a class | | | Shares | | | as a class | | | Shares | |
| Approval of the Board Members was reached | | | | | | | | | | | | | | | | | | | |
| as follows: | | | | | | | | | | | | | | | | | | | |
| William C. Hunter | | | | | | | | | | | | | | | | | | | |
| For | | | — | | | 180 | | | ��� | | | 1,250 | | | — | | | 1,280 | |
| Withhold | | | — | | | — | | | — | | | — | | | — | | | — | |
| Total | | | — | | | 180 | | | — | | | 1,250 | | | — | | | 1,280 | |
| William J. Schneider | | | | | | | | | | | | | | | | | | | |
| For | | | — | | | 180 | | | — | | | 1,250 | | | — | | | 1,280 | |
| Withhold | | | — | | | — | | | — | | | — | | | — | | | — | |
| Total | | | — | | | 180 | | | — | | | 1,250 | | | — | | | 1,280 | |
| Judith M. Stockdale | | | | | | | | | | | | | | | | | | | |
| For | | | 1,836,546 | | | — | | | 13,789,091 | | | — | | | 14,900,387 | | | — | |
| Withhold | | | 64,371 | | | — | | | 555,924 | | | — | | | 369,068 | | | — | |
| Total | | | 1,900,917 | | | — | | | 14,345,015 | | | — | | | 15,269,455 | | | — | |
| Carole E. Stone | | | | | | | | | | | | | | | | | | | |
| For | | | 1,834,443 | | | — | | | 13,796,257 | | | — | | | 14,903,224 | | | — | |
| Withhold | | | 66,474 | | | — | | | 548,758 | | | — | | | 366,231 | | | — | |
| Total | | | 1,900,917 | | | — | | | 14,345,015 | | | — | | | 15,269,455 | | | — | |
| Margaret L. Wolff | | | | | | | | | | | | | | | | | | | |
| For | | | 1,844,679 | | | — | | | 13,784,537 | | | — | | | 14,939,995 | | | — | |
| Withhold | | | 56,238 | | | — | | | 560,478 | | | — | | | 329,460 | | | — | |
| Total | | | 1,900,917 | | | — | | | 14,345,015 | | | — | | | 15,269,455 | | | — | |
Report of Independent Registered Public Accounting Firm
To the Board of Trustees and Shareholders of
Nuveen Georgia Dividend Advantage Municipal Fund 2
Nuveen Maryland Premium Income Municipal Fund
Nuveen Minnesota Municipal Income Fund
Nuveen Missouri Premium Income Municipal Fund
Nuveen North Carolina Premium Income Municipal Fund
Nuveen Virginia Premium Income Municipal Fund:
We have audited the accompanying statements of assets and liabilities, including the portfolios of investments, of Nuveen Georgia Dividend Advantage Municipal Fund 2, Nuveen Maryland Premium Income Municipal Fund, Nuveen Minnesota Municipal Income Fund, Nuveen Missouri Premium Income Municipal Fund, Nuveen North Carolina Premium Income Municipal Fund and Nuveen Virginia Premium Income Municipal Fund (the "Funds") as of May 31, 2016, and the related statements of operations and cash flows for the year ended and the statements of changes in net assets and the financial highlights for each of the years or periods in the two-year period then ended. The financial highlights for the periods presented through May 31, 2014 (June 30, 2014 for Nuveen Minnesota Municipal Income Fund) were audited by other auditors whose reports dated July 28, 2014 (August 22, 2014 for Nuveen Minnesota Municipal Income Fund) expressed an unqualified an opinion on those financial highlights. These financial statements and financial highlights are the responsibility of the Funds' management. Our responsibility is to express an opinion on these financial statements and financial highlights based on our audits.
We conducted our audits in accordance with the standards of the Public Company Accounting Oversight Board (United States). Those standards require that we plan and perform the audits to obtain reasonable assurance about whether the financial statements and financial highlights are free of material misstatement. Our procedures included confirmation of securities owned as of May 31, 2016, by correspondence with the custodian and brokers or other appropriate auditing procedures. An audit also includes assessing the accounting principles used and significant estimates made by management, as well as evaluating the overall financial statement presentation. We believe that our audits provide a reasonable basis for our opinion.
In our opinion, the financial statements and financial highlights referred to above present fairly, in all material respects, the financial position of the Funds as of May 31, 2016, the results of their operations and their cash flows for the year then ended and the changes in their net assets and the financial highlights for each of the years or periods in the two-year period then ended, in conformity with U.S. generally accepted accounting principles.
/s/ KPMG LLP
Chicago, Illinois
July 28, 2016
| NKG | | |
| | Nuveen Georgia Dividend Advantage Municipal Fund 2 | |
| | Portfolio of Investments | May 31, 2016 |
| | Principal | | | Optional Call | | | | | | |
| | Amount (000) | | Description (1) | Provisions (2) | | Ratings (3) | | | Value | |
| | | | LONG-TERM INVESTMENTS – 147.3% (100.0% of Total Investments) | | | | | | | |
| | | | MUNICIPAL BONDS – 147.3% (100.0% of Total Investments) | | | | | | | |
| | | | Education and Civic Organizations – 15.0% (10.2% of Total Investments) | | | | | | | |
| $ | 1,760 | | Athens Housing Authority, Georgia, Student Housing Lease Revenue Bonds, UGAREF East Campus Housing LLC Project, Series 2009, 5.250%, 6/15/35 | 6/19 at 100.00 | | Aa2 | | $ | 1,963,139 | |
| | 700 | | Carrollton Payroll Development Authority, Georgia, Student Housing Revenue Bonds, University of West Georgia, Series 2004A, 5.000%,
9/01/21 – SYNCORA GTY Insured | 8/16 at 100.00 | | A1 | | | 702,765 | |
| | 1,600 | | Cobb County Development Authority, Georgia, Revenue Bonds, KSU University II Real Estate Foundation, LLC Project, Series 2011, 5.000%, 7/15/41 – AGM Insured | 7/21 at 100.00 | | AA | | | 1,828,960 | |
| | 1,340 | | Douglas County Development Authority, Georgia, Charter School Revenue Bonds, Brighten Academy Project, Series 2013B, 7.000%, 10/01/43 | 10/23 at 100.00 | | N/R | | | 1,480,231 | |
| | 625 | | Fulton County Development Authority, Georgia, Revenue Bonds, Georgia Tech Foundation Technology Square Project, Refunding Series 2012A, 5.000%, 11/01/31 | 5/22 at 100.00 | | AA+ | | | 739,475 | |
| | 3,000 | | Fulton County Development Authority, Georgia, Revenue Bonds, Robert W. Woodruff Arts Center, Inc. Project, Refunding Series 2015A, 5.000%, 3/15/36 | 3/26 at 100.00 | | A2 | | | 3,550,260 | |
| | 3,000 | | Private Colleges and Universities Authority, Georgia, Revenue Bonds, Emory University, Refunding Series 2013A, 5.000%, 10/01/43 | 10/23 at 100.00 | | AA+ | | | 3,537,000 | |
| | | | Private Colleges and Universities Authority, Georgia, Revenue Bonds, Emory University, Series 2009, Tender Option Bond Trust 2015-XF0073: | | | | | | | |
| | 730 | | 16.593%, 3/01/17 (IF) | No Opt. Call | | AA+ | | | 1,098,570 | |
| | 1,150 | | 16.620%, 3/01/17 (IF) | No Opt. Call | | AA+ | | | 1,704,898 | |
| | 1,325 | | Private Colleges and Universities Authority, Georgia, Revenue Bonds, Mercer University, Refunding Series 2012C, 5.250%, 10/01/30 | 10/22 at 100.00 | | Baa2 | | | 1,532,535 | |
| | 1,000 | | Private Colleges and Universities Authority, Georgia, Revenue Bonds, Mercer University, Series 2012A, 5.000%, 10/01/32 | 10/21 at 100.00 | | Baa2 | | | 1,132,610 | |
| | 3,000 | | Private Colleges and Universities Authority, Georgia, Revenue Bonds, Savannah College of Art & Design Projects, Series 2014, 5.000%, 4/01/44 | 4/24 at 100.00 | | Baa2 | | | 3,436,260 | |
| | 19,230 | | Total Education and Civic Organizations | | | | | | 22,706,703 | |
| | | | Health Care – 12.0% (8.2% of Total Investments) | | | | | | | |
| | | | Baldwin County Hospital Authority, Georgia, Revenue Bonds, Oconee Regional Medical Center, Series 1998: | | | | | | | |
| | 205 | | 5.250%, 12/01/22 (4) | 8/16 at 100.00 | | CC | | | 165,230 | |
| | 745 | | 5.375%, 12/01/28 (4) | 6/16 at 100.00 | | CC | | | 600,179 | |
| | 715 | | Coweta County Development Authority, Georgia, Revenue Bonds, Piedmont Healthcare, Inc. Project, Series 2010, 5.000%, 6/15/40 | 6/20 at 100.00 | | AA– | | | 813,012 | |
| | | | Gainesville and Hall County Hospital Authority, Georgia, Revenue Anticipation Certificates, Northeast Georgia Health Services Inc., Series 2010B: | | | | | | | |
| | 1,000 | | 5.000%, 2/15/33 | 2/20 at 100.00 | | AA– | | | 1,107,080 | |
| | 1,000 | | 5.125%, 2/15/40 | 2/20 at 100.00 | | AA– | | | 1,101,630 | |
| | 3,945 | | 5.250%, 2/15/45 | 2/41 at 100.00 | | AA– | | | 4,369,324 | |
| | 1,620 | | Greene County Development Authority, Georgia, Health System Revenue Bonds, Catholic Health East Issue, Series 2012, 5.000%, 11/15/37 | No Opt. Call | | AA | | | 1,851,741 | |
| | 2,540 | | Houston County Hospital Authority, Georgia, Revenue Bonds, Houston Healthcare Project, Series 2007, 5.250%, 10/01/35 | 10/17 at 100.00 | | A+ | | | 2,675,280 | |
| | Principal | | | Optional Call | | | | | | |
| | Amount (000) | | Description (1) | Provisions (2) | | Ratings (3) | | | Value | |
| | | | Health Care (continued) | | | | | | | |
| | | | Macon-Bibb County Hospital Authority, Georgia, Revenue Anticipation Certificates, Medical Center of Central Georgia Inc., Series 2009: | | | | | | | |
| $ | 425 | | 5.000%, 8/01/32 | 8/19 at 100.00 | | AA– | | $ | 469,158 | |
| | 975 | | 5.000%, 8/01/35 | 8/19 at 100.00 | | AA– | | | 1,071,545 | |
| | 1,470 | | Medical Center Hospital Authority, Georgia, Revenue Anticipation Certificates, Columbus Regional Healthcare System, Inc. Project, Series 2010, 5.000%, 8/01/21 – AGM Insured | No Opt. Call | | AA | | | 1,660,292 | |
| | 2,300 | | Valdosta and Lowndes County Hospital Authority, Georgia, Revenue Certificates, South Georgia Medical Center, Series 2007, 5.000%, 10/01/33 | 10/17 at 100.00 | | A2 | | | 2,391,057 | |
| | 16,940 | | Total Health Care | | | | | | 18,275,528 | |
| | | | Housing/Multifamily – 2.7% (1.8% of Total Investments) | | | | | | | |
| | 1,205 | | Atlanta Urban Residential Finance Authority, Georgia, Multifamily Housing Revenue Bonds, Trestletree Village Apartments, Series 2013A, 4.500%, 11/01/35 | 11/23 at 100.00 | | BBB+ | | | 1,240,957 | |
| | | | Savannah Economic Development Authority, Georgia, GNMA Collateralized Multifamily Housing Revenue Bonds, Snap I-II-III Apartments, Series 2002A: | | | | | | | |
| | 425 | | 5.150%, 11/20/22 (Alternative Minimum Tax) | 8/16 at 100.00 | | AA+ | | | 425,935 | |
| | 980 | | 5.200%, 11/20/27 (Alternative Minimum Tax) | 8/16 at 100.00 | | AA+ | | | 981,695 | |
| | 1,465 | | 5.250%, 11/20/32 (Alternative Minimum Tax) | 8/16 at 100.00 | | AA+ | | | 1,467,285 | |
| | 4,075 | | Total Housing/Multifamily | | | | | | 4,115,872 | |
| | | | Materials – 0.3% (0.2% of Total Investments) | | | | | | | |
| | 390 | | Savannah Economic Development Authority, Georgia, Pollution Control Revenue Bonds, Union Camp Corporation, Series 1995, 6.150%, 3/01/17 | No Opt. Call | | Baa2 | | | 402,301 | |
| | | | Tax Obligation/General – 41.0% (27.8% of Total Investments) | | | | | | | |
| | 2,000 | | Chatham County Hospital Authority, Georgia, Seven Mill Tax Pledge Refunding and Improvement Revenue Bonds, Memorial Health University Medical Center, Inc., Series 2012A, 5.000%, 1/01/31 | 1/22 at 100.00 | | AA | | | 2,328,080 | |
| | 1,500 | | Cherokee County Resource Recovery Development Authority, Georgia, Solid Waste Disposal Revenue Bonds, Ball Ground Recycling LLC Project, Series 2007A, 5.000%, 7/01/37 – AMBAC Insured (Alternative Minimum Tax) | 7/17 at 100.00 | | AA+ | | | 1,555,530 | |
| | 1,000 | | Clark County Hospital Authority, Georgia, Hospital Revenue Bonds, Athens Regional Medical Center, Series 2007, 5.000%, 1/01/27 – NPFG Insured | 1/17 at 100.00 | | Aa1 | | | 1,022,070 | |
| | 600 | | Clarke County Hospital Authority, Georgia, Hospital Revenue Certificates, Athens Regional Medical Center, Series 2012, 5.000%, 1/01/32 | 1/22 at 100.00 | | Aa1 | | | 687,126 | |
| | 1,725 | | Cobb-Marietta Coliseum and Exhibit Hall Authority, Georgia, Revenue Bonds, Performing Arts Center, Refunding Series 2013, 5.000%, 1/01/21 | No Opt. Call | | AAA | | | 2,027,410 | |
| | | | East Point Building Authority, Georgia, Revenue Bonds, Water & Sewer Project Series 2006A: | | | | | | | |
| | 3,000 | | 5.000%, 2/01/30 – SYNCORA GTY Insured | 8/16 at 100.00 | | N/R | | | 3,004,350 | |
| | 2,000 | | 5.000%, 2/01/34 – SYNCORA GTY Insured | 8/16 at 100.00 | | N/R | | | 2,002,780 | |
| | 1,135 | | Floyd County Hospital Authority, Georgia, Revenue Anticipation Certificates, Floyd Medical Center, Series 2012B, 5.000%, 7/01/23 | No Opt. Call | | Aa2 | | | 1,347,710 | |
| | 2,000 | | Floyd County Hospital Authority, Georgia, Revenue Anticipation Certificates, Floyd Medical Center, Series 2016, 5.000%, 7/01/35 | 7/26 at 100.00 | | Aa2 | | | 2,397,780 | |
| | 3,000 | | Forsyth County Water and Sewerage Authority, Georgia, Revenue Bonds, Refunding & Improvement Series 2015, 5.000%, 4/01/44 | 4/25 at 100.00 | | AAA | | | 3,609,510 | |
| | 3,000 | | Gainesville and Hall County Hospital Authority, Georgia, Revenue Anticipation Certificates, Northeast Georgia Health Services Inc., Series 2014A, 5.500%, 8/15/54 | 2/25 at 100.00 | | AA– | | | 3,655,260 | |
| | 20 | | Georgia Environmental Loan Acquisition Corporation, Local Government Loan Securitization Bonds, Loan Pool Series 2011, 5.125%, 3/15/31 | 3/21 at 100.00 | | Aaa | | | 21,043 | |
| NKG | Nuveen Georgia Dividend Advantage Municipal Fund 2 | |
| | Portfolio of Investments (continued) | May 31, 2016 |
| | Principal | | | Optional Call | | | | | | |
| | Amount (000) | | Description (1) | Provisions (2) | | Ratings (3) | | | Value | |
| | | | Tax Obligation/General (continued) | | | | | | | |
| $ | 3,500 | | Georgia State, General Obligation Bonds, Refunding Series 2009I, 5.000%, 7/01/19 | No Opt. Call | | AAA | | $ | 3,938,795 | |
| | 2,500 | | Georgia State, General Obligation Bonds, Series 2007E, 5.000%, 8/01/24 | 8/17 at 100.00 | | AAA | | | 2,626,775 | |
| | 1,000 | | Georgia State, General Obligation Bonds, Series 2009B, 5.000%, 1/01/26 | 1/19 at 100.00 | | AAA | | | 1,104,450 | |
| | 3,550 | | Georgia State, General Obligation Bonds, Series 2015A, 5.000%, 2/01/28 | 2/25 at 100.00 | | AAA | | | 4,459,581 | |
| | 3,500 | | Gwinnett County School District, Georgia, General Obligation Bonds, Series 2013, 5.000%, 2/01/36 | 2/23 at 100.00 | | AAA | | | 4,161,815 | |
| | 1,500 | | Habersham County Hospital Authority, Georgia, Revenue Anticipation Certificates, Series 2014B, 5.000%, 2/01/37 | No Opt. Call | | Aa3 | | | 1,735,740 | |
| | 3,000 | | Henry County School District, Georgia, General Obligation Bonds, Series 2016, 5.000%, 8/01/27 | 8/26 at 100.00 | | AA+ | | | 3,869,670 | |
| | 445 | | La Grange-Troup County Hospital Authority, Georgia, Revenue Anticipation Certificates, Series 2008A, 5.500%, 7/01/38 | 7/18 at 100.00 | | Aa2 | | | 480,702 | |
| | | | Liberty County Industrial Authority, Georgia, Revenue Bonds, Series 2014: | | | | | | | |
| | 302 | | 5.500%, 7/15/23 | 7/21 at 100.00 | | N/R | | | 311,627 | |
| | 601 | | 5.500%, 7/15/30 | 7/21 at 100.00 | | N/R | | | 619,198 | |
| | 659 | | 5.500%, 1/15/36 | 7/21 at 100.00 | | N/R | | | 679,566 | |
| | 3,000 | | Sandy Springs Public Facilities Authority, Georgia, Revenue Bonds, Sandy Springs City Center Project, Series 2015, 5.000%, 5/01/47 | 5/26 at 100.00 | | Aaa | | | 3,633,540 | |
| | 3,000 | | The Carroll City-County Hospital Authority, Georgia, Revenue Anticipation Certificates Tanner Medical Center, Inc. Project, Series 2015, 5.000%, 7/01/41 | 7/25 at 100.00 | | AA | | | 3,523,410 | |
| | 2,260 | | Valdosta and Lowndes County Hospital Authority, Georgia, Revenue Certificates, South Georgia Medical Center Project, Series 2011B, 5.000%, 10/01/41 | 10/21 at 100.00 | | Aa2 | | | 2,533,189 | |
| | | | Vidalia School District, Toombs County, Georgia, General Obligation Bonds, Series 2016: | | | | | | | |
| | 1,000 | | 5.000%, 8/01/30 | 2/26 at 100.00 | | Aa1 | | | 1,255,470 | |
| | 1,035 | | 5.000%, 8/01/31 | 2/26 at 100.00 | | Aa1 | | | 1,294,268 | |
| | 2,000 | | Winder-Barrow Industrial Building Authority, Georgia, Revenue Bonds, City of Winder Project, Refunding Series 2012, 5.000%, 12/01/29 – AGM Insured | 12/21 at 100.00 | | A1 | | | 2,304,640 | |
| | 53,832 | | Total Tax Obligation/General | | | | | | 62,191,085 | |
| | | | Tax Obligation/Limited – 16.2% (11.0% of Total Investments) | | | | | | | |
| | 3,250 | | Atlanta Development Authority, Georgia, Revenue Bonds, New Downtown Atlanta Stadium Project, Senior Lien Series 2015A-1, 5.250%, 7/01/44 | 7/25 at 100.00 | | Aa3 | | | 3,887,520 | |
| | | | Atlanta, Georgia, Tax Allocation Bonds Atlanta Station Project, Refunding Series 2007: | | | | | | | |
| | 110 | | 5.250%, 12/01/19 – AGC Insured | 12/17 at 100.00 | | AA | | | 116,283 | |
| | 50 | | 5.250%, 12/01/20 | No Opt. Call | | AA | | | 52,856 | |
| | 80 | | 5.250%, 12/01/21 – AGC Insured | 12/17 at 100.00 | | AA | | | 84,446 | |
| | 1,080 | | 5.000%, 12/01/23 – AGC Insured | 12/17 at 100.00 | | AA | | | 1,132,229 | |
| | 1,500 | | Atlanta, Georgia, Tax Allocation Bonds, Beltline Project Series 2008B. Remarketed, 7.375%, 1/01/31 | 1/19 at 100.00 | | A2 | | | 1,703,595 | |
| | 270 | | Atlanta, Georgia, Tax Allocation Bonds, Beltline Project Series 2008C. Remarketed, 7.500%, 1/01/31 | 1/19 at 100.00 | | A2 | | | 307,495 | |
| | 725 | | Atlanta, Georgia, Tax Allocation Bonds, Perry Bolton Project Series 2014, 5.000%, 7/01/41 | 7/23 at 100.00 | | A– | | | 810,514 | |
| | | | Cobb-Marietta Coliseum and Exhibit Hall Authority, Georgia, Revenue Bonds, Refunding Series 1993: | | | | | | | |
| | 250 | | 5.500%, 10/01/18 – NPFG Insured | No Opt. Call | | AA– | | | 258,343 | |
| | 5,745 | | 5.625%, 10/01/26 – NPFG Insured | 10/19 at 100.00 | | AA– | | | 6,758,878 | |
| | 405 | | Cobb-Marietta Coliseum and Exhibit Hall Authority, Georgia, Revenue Bonds, Refunding Series 2005, 5.500%, 10/01/26 – NPFG Insured | No Opt. Call | | AA– | | | 487,778 | |
| | 3,020 | | Georgia Local Governments, Certificates of Participation, Georgia Municipal Association, Series 1998A, 4.750%, 6/01/28 – NPFG Insured | No Opt. Call | | AA– | | | 3,455,846 | |
| | Principal | | | Optional Call | | | | | | |
| | Amount (000) | | Description (1) | Provisions (2) | | Ratings (3) | | | Value | |
| | | | Tax Obligation/Limited (continued) | | | | | | | |
| | | | Georgia Municipal Association Inc., Certificates of Participation, Riverdale Public Purpose Project, Series 2009: | | | | | | | |
| $ | 905 | | 5.375%, 5/01/32 – AGC Insured | 5/19 at 100.00 | | AA | | $ | 1,005,075 | |
| | 1,165 | | 5.500%, 5/01/38 – AGC Insured | 5/19 at 100.00 | | AA | | | 1,299,033 | |
| | 1,070 | | Metropolitan Atlanta Rapid Transit Authority, Georgia, Sales Tax Revenue Bonds, Refunding Series 1992P, 6.250%, 7/01/20 – AMBAC Insured | No Opt. Call | | Aa1 | | | 1,152,048 | |
| | 1,000 | | Metropolitan Atlanta Rapid Transit Authority, Georgia, Sales Tax Revenue Bonds, Third Indenture, Series 2015B, 5.000%, 7/01/41 | 7/26 at 100.00 | | AA+ | | | 1,213,630 | |
| | 810 | | Tift County Hospital Authority, Georgia, Revenue Anticipation Certificates Series 2012, 5.000%, 12/01/38 | No Opt. Call | | Aa2 | | | 940,807 | |
| | 21,435 | | Total Tax Obligation/Limited | | | | | | 24,666,376 | |
| | | | Transportation – 11.2% (7.6% of Total Investments) | | | | | | | |
| | 2,000 | | Atlanta, Georgia, Airport General Revenue Bonds, Refunding Series 2011B, 5.000%, 1/01/30 (Alternative Minimum Tax) | 1/21 at 100.00 | | AA– | | | 2,241,000 | |
| | 2,000 | | Atlanta, Georgia, Airport General Revenue Bonds, Refunding Series 2012B, 5.000%, 1/01/31 | No Opt. Call | | AA– | | | 2,339,640 | |
| | 2,810 | | Atlanta, Georgia, Airport General Revenue Bonds, Series 2012C, 5.000%, 1/01/42 (Alternative Minimum Tax) | 1/22 at 100.00 | | AA– | | | 3,124,355 | |
| | | | Atlanta, Georgia, Airport Passenger Facilities Charge and General Revenue Bonds, Refunding Subordinate Lien Series 2014A: | | | | | | | |
| | 2,575 | | 5.000%, 1/01/32 | 1/24 at 100.00 | | AA– | | | 3,068,087 | |
| | 3,750 | | 5.000%, 1/01/34 | 1/24 at 100.00 | | AA– | | | 4,439,363 | |
| | 1,500 | | Clayton County Development Authority, Georgia, Special Facilities Revenue Bonds, Delta Air Lines, Inc. Project, Series 2009A, 8.750%, 6/01/29 | 6/20 at 100.00 | | Baa3 | | | 1,849,095 | |
| | 14,635 | | Total Transportation | | | | | | 17,061,540 | |
| | | | U.S. Guaranteed – 23.0% (15.6% of Total Investments) (5) | | | | | | | |
| | 5,000 | | Atlanta Development Authority, Georgia, Educational Facilities Revenue Bonds, Science Park LLC Project, Series 2007, 5.000%, 7/01/39 (Pre-refunded 7/01/17) | 7/17 at 100.00 | | Aa3 (5) | | | 5,233,550 | |
| | 5,100 | | Cherokee County Water and Sewerage Authority, Georgia, Revenue Bonds, Series 2001, 5.000%, 8/01/35 (Pre-refunded 8/01/18) – AGM Insured | 8/18 at 100.00 | | AA (5) | | | 5,558,541 | |
| | 1,375 | | Cobb County Development Authority, Georgia, Student Housing Revenue Bonds, KSU Village II Real Estate Foundation LLC Project, Senior Series 2007A, 5.250%, 7/15/38 (Pre-refunded 7/15/17) – AMBAC Insured | 7/17 at 100.00 | | N/R (5) | | | 1,443,351 | |
| | | | Coweta County Water and Sewer Authority, Georgia, Revenue Bonds, Series 2007: | | | | | | | |
| | 1,000 | | 5.000%, 6/01/32 (Pre-refunded 6/01/18) | 6/18 at 100.00 | | Aa2 (5) | | | 1,083,410 | |
| | 275 | | 5.000%, 6/01/37 (Pre-refunded 6/01/18) | 6/18 at 100.00 | | N/R (5) | | | 297,938 | |
| | 1,725 | | 5.000%, 6/01/37 (Pre-refunded 6/01/18) | 6/18 at 100.00 | | Aa2 (5) | | | 1,868,882 | |
| | 3,315 | | Decatur, Georgia, General Obligation Bonds, Series 2007, 5.000%, 1/01/31 (Pre-refunded 1/01/17) – AGM Insured | 1/17 at 100.00 | | AA+ (5) | | | 3,400,494 | |
| | 2,225 | | Douglasville-Douglas County Water and Sewer Authority, Georgia, Water and Sewerage Revenue Bonds, Series 2007, 5.000%, 6/01/37 (Pre-refunded 6/01/17) – NPFG Insured | 6/17 at 100.00 | | AA– (5) | | | 2,320,631 | |
| | 1,500 | | Forsyth County Water and Sewerage Authority, Georgia, Revenue Bonds, Series 2007, 5.000%, 4/01/37 (Pre-refunded 4/01/17) – AGM Insured | 4/17 at 100.00 | | AAA | | | 1,554,645 | |
| | 750 | | Georgia Municipal Association Inc., Certificates of Participation, Atlanta Court Project, Series 2002, 5.125%, 12/01/21 (Pre-refunded 7/01/16) – AMBAC Insured | 7/16 at 100.00 | | N/R (5) | | | 752,850 | |
| | | | Georgia Higher Education Facilities Authority, Revenue Bonds, USG Real Estate Foundation I LLC Project, Series 2008: | | | | | | | |
| | 25 | | 6.000%, 6/15/28 (Pre-refunded 6/15/18) | 6/18 at 100.00 | | AA (5) | | | 27,596 | |
| | 125 | | 6.000%, 6/15/28 (Pre-refunded 6/15/18) | 6/18 at 100.00 | | AA (5) | | | 137,980 | |
| NKG | Nuveen Georgia Dividend Advantage Municipal Fund 2 | |
| | Portfolio of Investments (continued) | May 31, 2016 |
| | Principal | | | Optional Call | | | | | | |
| | Amount (000) | | Description (1) | Provisions (2) | | Ratings (3) | | | Value | |
| | | | U.S. Guaranteed (5) (continued) | | | | | | | |
| $ | 995 | | Georgia Municipal Electric Authority, General Power Revenue Bonds, Project 1, Series 2007A-2, 5.000%, 1/01/25 (Pre-refunded 1/01/17) | 1/17 at 100.00 | | AA– (5) | | $ | 1,020,542 | |
| | 4,900 | | Gwinnett County School District, Georgia, General Obligation Bonds, Series 2008, 5.000%, 2/01/36 (Pre-refunded 2/01/18) (UB) | 2/18 at 100.00 | | AAA | | | 5,244,911 | |
| | 2,475 | | Paulding County School District, Georgia, General Obligation Bonds, Series 2007, 5.000%, 2/01/33 (Pre-refunded 2/01/17) | 2/17 at 100.00 | | AA+ (5) | | | 2,547,666 | |
| | 1,000 | | Unified Government of Athens-Clarke County, Georgia, Water and Sewerage Revenue Bonds, Series 2008, 5.500%, 1/01/38 (Pre-refunded 1/01/19) | 1/19 at 100.00 | | Aa1 (5) | | | 1,117,880 | |
| | 1,280 | | Walton County Water and Sewerage Authority, Georgia, Revenue Bonds, The Oconee-Hard Creek Reservoir Project, Series 2008, 5.000%, 2/01/38 (Pre-refunded 2/01/18) – AGM Insured | 2/18 at 100.00 | | A2 (5) | | | 1,370,099 | |
| | 33,065 | | Total U.S. Guaranteed | | | | | | 34,980,966 | |
| | | | Utilities – 11.8% (8.0% of Total Investments) | | | | | | | |
| | 525 | | Burke County Development Authority, Georgia, Pollution Control Revenue Bonds, Georgia Power Company – Vogtle Plant, First Series 2012, 1.750%, 12/01/49 (Mandatory put 6/01/17) | No Opt. Call | | A+ | | | 528,880 | |
| | 1,005 | | Georgia Municipal Electric Authority, General Power Revenue Bonds, Project 1, Series 2007A-2, 5.000%, 1/01/25 | 1/17 at 100.00 | | AA– | | | 1,026,587 | |
| | 3,000 | | Georgia Municipal Electric Authority, General Power Revenue Bonds, Series 2012GG, 5.000%, 1/01/43 | 1/23 at 100.00 | | A+ | | | 3,434,970 | |
| | 130 | | Georgia Municipal Electric Authority, Senior Lien General Power Revenue Bonds, Series 1993Z, 5.500%, 1/01/20 – FGIC Insured | No Opt. Call | | A+ | | | 138,312 | |
| | | | Main Street Natural Gas Inc., Georgia, Gas Project Revenue Bonds, Series 2006B: | | | | | | | |
| | 1,055 | | 5.000%, 3/15/20 | No Opt. Call | | A | | | 1,171,124 | |
| | 1,300 | | 5.000%, 3/15/21 | No Opt. Call | | A | | | 1,472,770 | |
| | 1,500 | | 5.000%, 3/15/22 | No Opt. Call | | A | | | 1,724,430 | |
| | | | Main Street Natural Gas Inc., Georgia, Gas Project Revenue Bonds, Series 2007A: | | | | | | | |
| | 350 | | 5.125%, 9/15/17 | No Opt. Call | | A | | | 366,293 | |
| | 950 | | 5.000%, 3/15/18 | No Opt. Call | | A+ | | | 1,011,408 | |
| | 2,000 | | 5.000%, 3/15/22 | No Opt. Call | | A+ | | | 2,321,640 | |
| | 1,500 | | Municipal Electric Authority of Georgia, Project One Revenue Bonds, Subordinate Lien Series 2015A, 0.000%, 1/01/32 | No Opt. Call | | A+ | | | 932,610 | |
| | 3,000 | | Municipal Electric Authority of Georgia, Project One Revenue Bonds, Subordinate Lien Series 2016A, 5.000%, 1/01/28 (WI/DD, Settling 6/07/16) | 7/26 at 100.00 | | A+ | | | 3,733,290 | |
| | 16,315 | | Total Utilities | | | | | | 17,862,314 | |
| | | | Water and Sewer – 14.1% (9.6% of Total Investments) | | | | | | | |
| | 260 | | Atlanta, Georgia, Water and Wastewater Revenue Bonds, Series 2004, 5.750%, 11/01/30 – AGM Insured | No Opt. Call | | AA | | | 372,762 | |
| | 5 | | Cherokee County Water and Sewerage Authority, Georgia, Revenue Bonds, Series 2001, 5.000%, 8/01/35 – AGM Insured | 8/18 at 100.00 | | AA | | | 5,414 | |
| | 500 | | Columbus, Georgia, Water and Sewerage Revenue Bonds, Refunding Series 2014A, 5.000%, 5/01/31 | 5/24 at 100.00 | | AA+ | | | 607,275 | |
| | 500 | | Columbus, Georgia, Water and Sewerage Revenue Bonds, Series 2016, 5.000%, 5/01/36 | 5/26 at 100.00 | | AA+ | | | 617,090 | |
| | | | DeKalb County, Georgia, Water and Sewerage Revenue Bonds, Refunding Series 2006B: | | | | | | | |
| | 6,000 | | 5.250%, 10/01/32 – AGM Insured | 10/26 at 100.00 | | AA | | | 7,657,556 | |
| | 300 | | 5.000%, 10/01/35 – AGM Insured | No Opt. Call | | AA | | | 369,147 | |
| | 5,350 | | DeKalb County, Georgia, Water and Sewerage Revenue Bonds, Second Resolution Series 2011A, 5.250%, 10/01/41 | 10/21 at 100.00 | | Aa3 | | | 6,302,354 | |
| | 1,000 | | Fulton County, Georgia, Water and Sewerage Revenue Bonds, Refunding Series 2013, 5.000%, 1/01/33 | 1/23 at 100.00 | | AA– | | | 1,190,970 | |
| | Principal | | | Optional Call | | | | | | |
| | Amount (000) | | Description (1) | Provisions (2) | | Ratings (3) | | | Value | |
| | | | Water and Sewer (continued) | | | | | | | |
| $ | 1,000 | | Milledgeville, Georgia, Water and Sewerage Revenue Refunding Bonds, Series 1996, 6.000%, 12/01/21 – AGM Insured | No Opt. Call | | AA | | $ | 1,135,350 | |
| | 2,000 | | South Fulton Municipal Regional Water and Sewer Authority, Georgia, Revenue Bonds, Refunding Series 2014, 5.000%, 1/01/30 | 1/24 at 100.00 | | AA | | | 2,373,780 | |
| | 695 | | Walton County Water and Sewerage Authority, Georgia, Revenue Bonds, The Oconee-Hard Creek Reservoir Project, Series 2008, 5.000%, 2/01/38 – AGM Insured | 2/18 at 100.00 | | A2 | | | 737,784 | |
| | 17,610 | | Total Water and Sewer | | | | | | 21,369,482 | |
| $ | 197,527 | | Total Long-Term Investments (cost $207,641,968) | | | | | | 223,632,167 | |
| | | | Floating Rate Obligations – (2.1)% | | | | | | (3,245,000 | ) |
| | | | Variable Rate MuniFund Term Preferred Shares, at Liquidation Preference – (49.4)% (6) | | | | | | (75,000,000 | ) |
| | | | Other Assets Less Liabilities – 4.2% | | | | | | 6,472,808 | |
| | | | Net Assets Applicable to Common Shares – 100% | | | | | $ | 151,859,975 | |
| (1) | All percentages shown in the Portfolio of Investments are based on net assets applicable to common shares unless otherwise noted. |
| (2) | Optional Call Provisions (not covered by the report of independent registered public accounting firm): Dates (month and year) and prices of the earliest optional call or redemption. There may be other call provisions at varying prices at later dates. Certain mortgage-backed securities may be subject to periodic principal paydowns. |
| (3) | Ratings (not covered by the report of independent registered public accounting firm): Using the highest of Standard & Poor's Group ("Standard & Poor's"), Moody's Investors Service, Inc. ("Moody's") or Fitch, Inc. ("Fitch") rating. Ratings below BBB by Standard & Poor's, Baa by Moody's or BBB by Fitch are considered to be below investment grade. Holdings designated N/R are not rated by any of these national rating agencies. |
| (4) | As of, or subsequent to, the end of the reporting period this security is non-income producing. Non-income producing, in the case of a fixed-income security, generally denotes that the issuer has (1) defaulted on the payment of principal or interest, (2) is under the protection of the Federal Bankruptcy Court or (3) the Fund's Adviser has concluded that the issue is not likely to meet its future interest payment obligations and has ceased accruing additional income on the Fund's records. |
| (5) | Backed by an escrow or trust containing sufficient U.S. Government or U.S. Government agency securities, which ensure the timely payment of principal and interest. Certain bonds backed by U.S. Government or agency securities are regarded as having an implied rating equal to the rating of such securities. |
| (6) | Variable Rate MuniFund Term Preferred Shares, at Liquidation Preference as a percentage of Total Investments is 33.5%. |
| (IF) | Inverse floating rate investment. |
| (UB) | Underlying bond of an inverse floating rate trust reflected as a financing transaction. See Notes to Financial Statements, Note 3 – Portfolio Securities and Investments in Derivatives, Inverse Floating Rate Securities for more information. |
| (WI/DD) | Investment, or portion of investment, purchased on a when-issued or delayed delivery basis. |
See accompanying notes to financial statements.
| NMY | | |
| | Nuveen Maryland Premium Income Municipal Fund | |
| | Portfolio of Investments | May 31, 2016 |
| | Principal | | | Optional Call | | | | | | |
| | Amount (000) | | Description (1) | Provisions (2) | | Ratings (3) | | | Value | |
| | | | LONG-TERM INVESTMENTS – 147.1% (100.0% of Total Investments) | | | | | | | |
| | | | MUNICIPAL BONDS – 146.7% (99.7% of Total Investments) | | | | | | | |
| | | | Consumer Discretionary – 4.7% (3.2% of Total Investments) | | | | | | | |
| | | | Baltimore, Maryland, Senior Lien Convention Center Hotel Revenue Bonds, Series 2006A: | | | | | | | |
| $ | 540 | | 5.000%, 9/01/16 – SYNCORA GTY Insured | No Opt. Call | | Ba1 | | $ | 545,065 | |
| | 400 | | 5.250%, 9/01/19 – SYNCORA GTY Insured | 9/16 at 100.00 | | Ba1 | | | 403,596 | |
| | 330 | | 5.250%, 9/01/25 – SYNCORA GTY Insured | 9/16 at 100.00 | | Ba1 | | | 332,762 | |
| | 350 | | 5.250%, 9/01/27 – SYNCORA GTY Insured | 9/16 at 100.00 | | Ba1 | | | 352,930 | |
| | 535 | | 4.600%, 9/01/30 – SYNCORA GTY Insured | 9/16 at 100.00 | | Ba1 | | | 539,483 | |
| | 100 | | 5.000%, 9/01/32 – SYNCORA GTY Insured | 9/16 at 100.00 | | Ba1 | | | 100,837 | |
| | 12,165 | | 5.250%, 9/01/39 – SYNCORA GTY Insured | 9/16 at 100.00 | | Ba1 | | | 12,266,819 | |
| | 1,000 | | Baltimore, Maryland, Subordinate Lien Convention Center Hotel Revenue Bonds, Series 2006B, 5.875%, 9/01/39 | 9/16 at 100.00 | | BB | | | 1,007,060 | |
| | 2,000 | | Maryland Economic Development Corporation, Revenue Bonds, Chesapeake Bay Hyatt Conference Center, Series 2006A, 5.000%, 12/01/31 (4) | 12/16 at 100.00 | | N/R | | | 1,194,280 | |
| | 17,420 | | Total Consumer Discretionary | | | | | | 16,742,832 | |
| | | | Consumer Staples – 4.3% (2.9% of Total Investments) | | | | | | | |
| | | | Buckeye Tobacco Settlement Financing Authority, Ohio, Tobacco Settlement Asset-Backed Revenue Bonds, Senior Lien, Series 2007A-2: | | | | | | | |
| | 595 | | 5.125%, 6/01/24 | 6/17 at 100.00 | | B– | | | 579,816 | |
| | 1,695 | | 5.875%, 6/01/30 | 6/17 at 100.00 | | B– | | | 1,688,135 | |
| | 210 | | Buckeye Tobacco Settlement Financing Authority, Ohio, Tobacco Settlement Asset-Backed Revenue Bonds, Senior Lien, Series 2007A-3, 6.250%, 6/01/37 | 6/22 at 100.00 | | B– | | | 211,155 | |
| | | | Guam Economic Development & Commerce Authority, Tobacco Settlement Asset-Backed Bonds, Series 2007A: | | | | | | | |
| | 2,220 | | 5.250%, 6/01/32 | 6/17 at 100.00 | | CCC | | | 2,228,680 | |
| | 2,665 | | 5.625%, 6/01/47 | 6/17 at 100.00 | | CCC | | | 2,672,542 | |
| | 100 | | Northern Tobacco Securitization Corporation, Alaska, Tobacco Settlement Asset-Backed Bonds, Series 2006A, 5.000%, 6/01/46 | 8/16 at 100.00 | | B3 | | | 95,807 | |
| | 3,270 | | Puerto Rico, The Children's Trust Fund, Tobacco Settlement Asset-Backed Refunding Bonds, Series 2002, 5.500%, 5/15/39 | 8/16 at 100.00 | | BBB+ | | | 3,269,771 | |
| | 2,000 | | Tobacco Securitization Authority of Southern California, Tobacco Settlement Asset-Backed Bonds, San Diego County Tobacco Asset Securitization Corporation, Senior Series 2006A, 5.000%, 6/01/37 | 8/16 at 100.00 | | BB+ | | | 1,999,900 | |
| | 1,500 | | Tobacco Settlement Financing Corporation, New Jersey, Tobacco Settlement Asset-Backed Bonds, Series 2007-1A, 5.000%, 6/01/29 | 6/17 at 100.00 | | B | | | 1,515,285 | |
| | 780 | | Tobacco Settlement Financing Corporation, Virgin Islands, Tobacco Settlement Asset-Backed Bonds, Series 2001, 5.000%, 5/15/31 | 11/16 at 100.00 | | A3 | | | 780,289 | |
| | 15,035 | | Total Consumer Staples | | | | | | 15,041,380 | |
| | | | Education and Civic Organizations – 12.7% (8.7% of Total Investments) | | | | | | | |
| | 2,375 | | Frederick County, Maryland, Educational Facilities Revenue Bonds, Mount Saint Mary's University, Series 2006, 5.625%, 9/01/38 | 9/16 at 100.00 | | BB+ | | | 2,380,415 | |
| | 700 | | Maryland Health and Higher Educational Facilities Authority, Revenue Bonds, Goucher College, Series 2012A, 5.000%, 7/01/34 | 7/22 at 100.00 | | A– | | | 811,447 | |
| | | | Maryland Health and Higher Educational Facilities Authority, Revenue Bonds, Johns Hopkins University, Series 2008A: | | | | | | | |
| | 2,000 | | 5.000%, 7/01/18 | No Opt. Call | | AA+ | | | 2,176,680 | |
| | 530 | | 5.250%, 7/01/38 | No Opt. Call | | AA+ | | | 574,032 | |
| | Principal | | | Optional Call | | | | | | |
| | Amount (000) | | Description (1) | Provisions (2) | | Ratings (3) | | | Value | |
| | | | Education and Civic Organizations (continued) | | | | | | | |
| | | | Maryland Health and Higher Educational Facilities Authority, Revenue Bonds, Johns Hopkins University, Series 2012A: | | | | | | | |
| $ | 1,145 | | 5.000%, 7/01/30 | No Opt. Call | | AA+ | | $ | 1,354,512 | |
| | 1,050 | | 5.000%, 7/01/37 | No Opt. Call | | AA+ | | | 1,242,129 | |
| | | | Maryland Health and Higher Educational Facilities Authority, Revenue Bonds, Johns Hopkins University, Series 2013B: | | | | | | | |
| | 500 | | 5.000%, 7/01/38 | 7/23 at 100.00 | | AA+ | | | 594,965 | |
| | 4,375 | | 4.250%, 7/01/41 | 7/23 at 100.00 | | AA+ | | | 4,821,338 | |
| | 1,250 | | Maryland Health and Higher Educational Facilities Authority, Revenue Bonds, Loyola University Maryland, Series 2012A, 5.000%, 10/01/39 | 10/22 at 100.00 | | A | | | 1,442,238 | |
| | | | Maryland Health and Higher Educational Facilities Authority, Revenue Bonds, Loyola University Maryland, Series 2014: | | | | | | | |
| | 1,250 | | 5.000%, 10/01/45 | 10/24 at 100.00 | | A | | | 1,465,250 | |
| | 1,000 | | 4.000%, 10/01/45 | 10/24 at 100.00 | | A | | | 1,077,810 | |
| | 3,500 | | Maryland Health and Higher Educational Facilities Authority, Revenue Bonds, Maryland Institute College of Art, Series 2006, 5.000%, 6/01/30 | 6/16 at 100.00 | | Baa1 | | | 3,511,865 | |
| | 1,130 | | Maryland Health and Higher Educational Facilities Authority, Revenue Bonds, Maryland Institute College of Art, Series 2007, 5.000%, 6/01/36 | 6/17 at 100.00 | | Baa1 | | | 1,155,696 | |
| | | | Maryland Health and Higher Educational Facilities Authority, Revenue Bonds, Maryland Institute College of Art, Series 2012: | | | | | | | |
| | 1,500 | | 5.000%, 6/01/34 | No Opt. Call | | Baa1 | | | 1,690,815 | |
| | 3,000 | | 5.000%, 6/01/47 | 6/22 at 100.00 | | Baa1 | | | 3,330,930 | |
| | 745 | | Maryland Health and Higher Educational Facilities Authority, Revenue Bonds, Patterson Park Public Charter School Issue, Series 2010, 6.000%, 7/01/40 | 7/20 at 100.00 | | BBB– | | | 789,566 | |
| | 625 | | Morgan State University, Maryland, Student Tuition and Fee Revenue Bonds, Academic Fees and Auxiliary Facilities, Series 2012, 5.000%, 7/01/29 | 7/22 at 100.00 | | A+ | | | 732,281 | |
| | 9,445 | | Morgan State University, Maryland, Student Tuition and Fee Revenue Refunding Bonds, Academic Fees and Auxiliary Facilities, Series 1993, 6.100%, 7/01/20 – NPFG Insured | No Opt. Call | | AA– | | | 10,338,022 | |
| | 265 | | University of Puerto Rico, University System Revenue Bonds, Refunding Series 2006P, 5.000%, 6/01/23 | 6/16 at 100.00 | | CC | | | 104,773 | |
| | 1,145 | | University of Puerto Rico, University System Revenue Bonds, Series 2006Q, 5.000%, 6/01/19 | 6/16 at 100.00 | | CC | | | 474,110 | |
| | | | Westminster, Maryland, Educational Facilities Revenue Bonds, McDaniel College, Series 2006: | | | | | | | |
| | 2,000 | | 5.000%, 11/01/31 | 11/16 at 100.00 | | BBB+ | | | 2,019,120 | |
| | 2,750 | | 4.500%, 11/01/36 | 11/16 at 100.00 | | BBB+ | | | 2,764,438 | |
| | 42,280 | | Total Education and Civic Organizations | | | | | | 44,852,432 | |
| | | | Health Care – 34.1% (23.2% of Total Investments) | | | | | | | |
| | | | Maryland Health and Higher Educational Facilities Authority, Maryland, Hospital Revenue Bonds, Meritus Medical Center, Series 2015: | | | | | | | |
| | 990 | | 4.000%, 7/01/32 | 7/25 at 100.00 | | BBB | | | 1,045,975 | |
| | 2,470 | | 4.250%, 7/01/35 | 7/25 at 100.00 | | BBB | | | 2,631,834 | |
| | 1,375 | | 5.000%, 7/01/45 | 7/25 at 100.00 | | BBB | | | 1,575,131 | |
| | 2,445 | | Maryland Health and Higher Educational Facilities Authority, Revenue Bonds Doctors Community Hospital, Refunding Series 2010, 5.750%, 7/01/38 | 7/20 at 100.00 | | Baa3 | | | 2,721,921 | |
| | | | Maryland Health and Higher Educational Facilities Authority, Revenue Bonds, Adventist Healthcare, Series 2011A: | | | | | | | |
| | 1,350 | | 6.250%, 1/01/31 | 1/22 at 100.00 | | Baa2 | | | 1,619,649 | |
| | 375 | | 6.125%, 1/01/36 | 1/22 at 100.00 | | Baa2 | | | 440,824 | |
| | 1,355 | | Maryland Health and Higher Educational Facilities Authority, Revenue Bonds, Anne Arundel Health System Issue, Series 2012, 5.000%, 7/01/24 | No Opt. Call | | A | | | 1,593,101 | |
| | 2,500 | | Maryland Health and Higher Educational Facilities Authority, Revenue Bonds, Anne Arundel Health System, Series 2010, 5.000%, 7/01/40 | 7/19 at 100.00 | | A | | | 2,697,050 | |
| NMY | Nuveen Maryland Premium Income Municipal Fund | |
| | Portfolio of Investments (continued) | May 31, 2016 |
| | Principal | | | Optional Call | | | | | | |
| | Amount (000) | | Description (1) | Provisions (2) | | Ratings (3) | | | Value | |
| | | | Health Care (continued) | | | | | | | |
| $ | 2,000 | | Maryland Health and Higher Educational Facilities Authority, Revenue Bonds, Calvert Health System Issue, Refunding Series 2013, 5.000%, 7/01/38 | 7/23 at 100.00 | | A | | $ | 2,267,820 | |
| | | | Maryland Health and Higher Educational Facilities Authority, Revenue Bonds, Carroll Hospital Center, Series 2012A: | | | | | | | |
| | 1,000 | | 4.000%, 7/01/30 | 7/22 at 100.00 | | A1 | | | 1,062,360 | |
| | 1,775 | | 5.000%, 7/01/37 | 7/22 at 100.00 | | A1 | | | 1,960,115 | |
| | 4,050 | | Maryland Health and Higher Educational Facilities Authority, Revenue Bonds, Doctors Community Hospital, Series 2007A, 5.000%, 7/01/29 | 7/17 at 100.00 | | Baa3 | | | 4,165,587 | |
| | 4,335 | | Maryland Health and Higher Educational Facilities Authority, Revenue Bonds, Frederick Memorial Hospital Issue, Series 2012A, 4.250%, 7/01/32 | No Opt. Call | | Baa1 | | | 4,632,945 | |
| | 2,500 | | Maryland Health and Higher Educational Facilities Authority, Revenue Bonds, Johns Hopkins Health System Issue, Series 2015A, 4.000%, 5/15/40 | 5/25 at 100.00 | | AA– | | | 2,690,950 | |
| | 4,450 | | Maryland Health and Higher Educational Facilities Authority, Revenue Bonds, Johns Hopkins Health System Obligated Group Issue, Series 2010, 5.000%, 5/15/40 | 5/20 at 100.00 | | AA– | | | 4,973,231 | |
| | | | Maryland Health and Higher Educational Facilities Authority, Revenue Bonds, Johns Hopkins Health System Obligated Group Issue, Series 2011A: | | | | | | | |
| | 500 | | 5.000%, 5/15/25 | 5/21 at 100.00 | | AA– | | | 579,630 | |
| | 500 | | 5.000%, 5/15/26 | 5/21 at 100.00 | | AA– | | | 576,120 | |
| | 1,685 | | Maryland Health and Higher Educational Facilities Authority, Revenue Bonds, LifeBridge Health System, Series 2008, 5.000%, 7/01/28 – AGM Insured | 7/17 at 100.00 | | AA | | | 1,749,687 | |
| | | | Maryland Health and Higher Educational Facilities Authority, Revenue Bonds, LifeBridge Health System, Series 2011: | | | | | | | |
| | 500 | | 5.750%, 7/01/31 | No Opt. Call | | A+ | | | 589,395 | |
| | 1,000 | | 6.000%, 7/01/41 | 7/21 at 100.00 | | A+ | | | 1,190,540 | |
| | | | Maryland Health and Higher Educational Facilities Authority, Revenue Bonds, LifeBridge Health System, Series 2015: | | | | | | | |
| | 1,500 | | 4.000%, 7/01/35 | 7/25 at 100.00 | | A+ | | | 1,603,065 | |
| | 1,125 | | 5.000%, 7/01/40 | 7/25 at 100.00 | | A+ | | | 1,317,836 | |
| | 2,975 | | 4.125%, 7/01/47 | 7/25 at 100.00 | | A+ | | | 3,189,765 | |
| | 2,500 | | Maryland Health and Higher Educational Facilities Authority, Revenue Bonds, MedStar Health Issue, Series 2015, 5.000%, 8/15/38 | 2/25 at 100.00 | | A2 | | | 2,906,475 | |
| | 2,850 | | Maryland Health and Higher Educational Facilities Authority, Revenue Bonds, Mercy Medical Center, Series 2011, 5.000%, 7/01/31 | 7/22 at 100.00 | | BBB | | | 3,223,094 | |
| | | | Maryland Health and Higher Educational Facilities Authority, Revenue Bonds, Mercy Medical Center, Series 2016A: | | | | | | | |
| | 90 | | 5.000%, 7/01/36 | 7/26 at 100.00 | | BBB | | | 106,549 | |
| | 1,895 | | 5.000%, 7/01/38 | 7/26 at 100.00 | | BBB | | | 2,232,556 | |
| | 585 | | 4.000%, 7/01/42 | 7/26 at 100.00 | | BBB | | | 617,555 | |
| | | | Maryland Health and Higher Educational Facilities Authority, Revenue Bonds, Peninsula Regional Medical Center Issue, Series 2015: | | | | | | | |
| | 1,185 | | 5.000%, 7/01/39 | 7/24 at 100.00 | | A | | | 1,367,300 | |
| | 4,000 | | 5.000%, 7/01/45 | 7/24 at 100.00 | | A | | | 4,596,680 | |
| | | | Maryland Health and Higher Educational Facilities Authority, Revenue Bonds, University of Maryland Medical System Issue, Series 2013A: | | | | | | | |
| | 11,500 | | 5.000%, 7/01/43 | 7/22 at 100.00 | | A2 | | | 12,957,280 | |
| | 4,665 | | 4.000%, 7/01/43 | 7/22 at 100.00 | | A2 | | | 4,881,549 | |
| | 1,000 | | Maryland Health and Higher Educational Facilities Authority, Revenue Bonds, University of Maryland Medical System Issue, Series 2015, 5.000%, 7/01/35 | 7/25 at 100.00 | | A2 | | | 1,172,280 | |
| | 4,155 | | Maryland Health and Higher Educational Facilities Authority, Revenue Bonds, University of Maryland Medical System, Series 2010, 5.125%, 7/01/39 | 7/19 at 100.00 | | A2 | | | 4,499,782 | |
| | Principal | | | Optional Call | | | | | | |
| | Amount (000) | | Description (1) | Provisions (2) | | Ratings (3) | | | Value | |
| | | | Health Care (continued) | | | | | | | |
| $ | 12,250 | | Maryland Health and Higher Educational Facilities Authority, Revenue Bonds, Western Maryland Health, Series 2014, 5.250%, 7/01/34 | 7/24 at 100.00 | | BBB | | $ | 14,354,183 | |
| | 8,000 | | Montgomery County, Maryland, Revenue Bonds, Trinity Health Credit Group, Refunding Series 2011MD, 5.000%, 12/01/40 | 12/21 at 100.00 | | AA | | | 9,065,760 | |
| | | | Montgomery County, Maryland, Revenue Bonds, Trinity Health Credit Group, Series 2015: | | | | | | | |
| | 2,000 | | 5.000%, 12/01/44 | 6/25 at 100.00 | | AA | | | 2,363,620 | |
| | 6,000 | | 4.000%, 12/01/44 | 6/25 at 100.00 | | AA | | | 6,475,080 | |
| | 2,100 | | Montgomery County, Maryland, Revenue Bonds, Trinity Health Credit Group, Series 2016, 5.000%, 12/01/45 | 6/26 at 100.00 | | AA | | | 2,522,856 | |
| | 107,530 | | Total Health Care | | | | | | 120,217,130 | |
| | | | Housing/Multifamily – 7.0% (4.7% of Total Investments) | | | | | | | |
| | 1,990 | | Anne Arundel County, Maryland, FNMA Multifamily Housing Revenue Bonds, Glenview Gardens Apartments Project, Series 2009, 5.000%, 1/01/28 (Mandatory put 1/01/27) | 1/20 at 102.00 | | AA+ | | | 2,173,538 | |
| | | | Howard County Housing Commission, Maryland, Revenue Bonds, Columbia Commons Apartments, Series 2014A: | | | | | | | |
| | 1,500 | | 4.000%, 6/01/34 | 6/24 at 100.00 | | A+ | | | 1,590,630 | |
| | 1,550 | | 5.000%, 6/01/44 | 6/24 at 100.00 | | A+ | | | 1,725,879 | |
| | 1,860 | | Howard County Housing Commission, Maryland, Revenue Bonds, Gateway Village Apartments, Series 2016, 4.000%, 6/01/46 (WI/DD, Settling 7/08/16) | 6/26 at 100.00 | | A+ | | | 1,958,636 | |
| | | | Howard County Housing Commission, Maryland, Revenue Bonds, The Verona at Oakland Mills Project, Series 2013: | | | | | | | |
| | 3,000 | | 5.000%, 10/01/28 | 10/23 at 100.00 | | A+ | | | 3,464,790 | |
| | 2,000 | | 4.625%, 10/01/28 | 10/23 at 100.00 | | A+ | | | 2,246,020 | |
| | 2,110 | | Maryland Community Development Administration, Multifamily Housing Revenue Bonds, Princess Anne Apartments, Series 2001D, 5.450%, 12/15/33 (Alternative Minimum Tax) | 6/16 at 100.00 | | Aaa | | | 2,113,545 | |
| | | | Maryland Economic Development Corporation, Student Housing Revenue Bonds, Salisbury University Project, Refunding Series 2013: | | | | | | | |
| | 500 | | 5.000%, 6/01/27 | 6/23 at 100.00 | | Baa3 | | | 552,710 | |
| | 500 | | 5.000%, 6/01/34 | 6/23 at 100.00 | | Baa3 | | | 541,975 | |
| | 1,500 | | Maryland Economic Development Corporation, Student Housing Revenue Bonds, Sheppard Pratt University Village, Series 2012, 5.000%, 7/01/33 | No Opt. Call | | BBB– | | | 1,656,150 | |
| | 495 | | Maryland Economic Development Corporation, Student Housing Revenue Bonds, University of Maryland – Baltimore Project, Refunding Senior Lien Series 2015, 5.000%, 7/01/39 | 7/25 at 100.00 | | BBB– | | | 537,986 | |
| | 1,500 | | Maryland Economic Development Corporation, Student Housing Revenue Bonds, University of Maryland, Baltimore County Project, Refunding Series 2016, 3.600%, 7/01/35 – AGM Insured | 8/16 at 100.00 | | AA | | | 1,500,405 | |
| | | | Maryland Economic Development Corporation, Student Housing Revenue Bonds, University of Maryland, College Park Project, Refunding Series 2016: | | | | | | | |
| | 240 | | 5.000%, 6/01/31 – AGM Insured | 6/26 at 100.00 | | AA | | | 293,273 | |
| | 1,440 | | 5.000%, 6/01/35 – AGM Insured | 6/26 at 100.00 | | AA | | | 1,736,971 | |
| | 780 | | 5.000%, 6/01/43 – AGM Insured | 6/26 at 100.00 | | AA | | | 921,305 | |
| | 1,500 | | Montgomery County Housing Opportunities Commission, Maryland, Multifamily Housing Development Bonds, Series 2014A, 3.875%, 7/01/39 | 7/24 at 100.00 | | Aaa | | | 1,561,800 | |
| | 22,465 | | Total Housing/Multifamily | | | | | | 24,575,613 | |
| | | | Housing/Single Family – 8.7% (5.9% of Total Investments) | | | | | | | |
| | 3,000 | | Maryland Community Development Administration Department of Housing and Community Development, Residential Revenue Bonds, Series 2009B, 4.750%, 9/01/39 | 9/18 at 100.00 | | Aa2 | | | 3,094,110 | |
| | 2,385 | | Maryland Community Development Administration Department of Housing and Community Development, Residential Revenue Bonds, Series 2011B, 3.250%, 3/01/36 | 3/26 at 100.00 | | Aa2 | | | 2,457,432 | |
| | 2,365 | | Maryland Community Development Administration Department of Housing and Community Development, Residential Revenue Bonds, Series 2014A, 4.300%, 9/01/32 | 9/23 at 100.00 | | Aa2 | | | 2,573,546 | |
| NMY | Nuveen Maryland Premium Income Municipal Fund | |
| | Portfolio of Investments (continued) | May 31, 2016 |
| | Principal | | | Optional Call | | | | | | |
| | Amount (000) | | Description (1) | Provisions (2) | | Ratings (3) | | | Value | |
| | | | Housing/Single Family (continued) | | | | | | | |
| | | | Maryland Community Development Administration Department of Housing and Community Development, Residential Revenue Bonds, Series 2014C: | | | | | | | |
| $ | 3,000 | | 3.400%, 3/01/31 | 3/24 at 100.00 | | Aa2 | | $ | 3,133,050 | |
| | 1,165 | | 3.750%, 3/01/39 | 3/24 at 100.00 | | Aa2 | | | 1,209,445 | |
| | 1,000 | | Maryland Community Development Administration Department of Housing and Community Development, Residential Revenue Bonds, Series 2014I, 3.450%, 12/15/31 | 12/24 at 100.00 | | Aaa | | | 1,059,980 | |
| | 1,500 | | Maryland Community Development Administration Department of Housing and Community Development, Residential Revenue Bonds, Series 2015A, 3.800%, 9/01/35 | 9/25 at 100.00 | | Aa2 | | | 1,582,590 | |
| | 6,915 | | Maryland Community Development Administration, Department of Housing and Community Development, Residential Revenue Bonds, Series 2006I, 4.875%, 9/01/26 (Alternative Minimum Tax) (UB) (5) | 8/16 at 100.00 | | Aa2 | | | 6,926,410 | |
| | 1,500 | | Maryland Community Development Administration, Department of Housing and Community Development, Residential Revenue Bonds, Series 2007H, 5.000%, 9/01/27 (Alternative Minimum Tax) (UB) (5) | 3/17 at 100.00 | | Aa2 | | | 1,525,246 | |
| | 4,075 | | Maryland Community Development Administration, Department of Housing and Community Development, Residential Revenue Bonds, Series 2006L 4.900%, 9/01/31 (Alternative Minimum Tax) (UB) (5) | 9/16 at 100.00 | | Aa2 | | | 4,091,790 | |
| | 2,820 | | Maryland Community Development Administration, Department of Housing and Community Development, Residential Revenue Bonds, Series 2007D, 4.850%, 9/01/37 (Alternative Minimum Tax) (UB) (5) | 3/17 at 100.00 | | Aa2 | | | 2,849,358 | |
| | 29,725 | | Total Housing/Single Family | | | | | | 30,502,957 | |
| | | | Industrials – 1.8% (1.2% of Total Investments) | | | | | | | |
| | 5,895 | | Maryland Economic Development Corporation, Economic Development Revenue Bonds, Transportation Facilities Project, Series 2010A, 5.750%, 6/01/35 | 6/20 at 100.00 | | Baa3 | | | 6,464,929 | |
| | | | Long-Term Care – 5.9% (4.0% of Total Investments) | | | | | | | |
| | 5,215 | | Baltimore County, Maryland, Revenue Bonds, Oak Crest Village, Series 2007A, 5.000%, 1/01/37 | 1/17 at 100.00 | | A | | | 5,309,965 | |
| | 2,050 | | Gaithersburg, Maryland, Economic Development Revenue Bonds, Asbury Methodist Homes Inc., Series 2009B, 6.000%, 1/01/23 | 1/20 at 100.00 | | BBB | | | 2,302,273 | |
| | | | Maryland Health and Higher Educational Facilities Authority, Revenue Bonds, Charlestown Community Issue, Series 2010: | | | | | | | |
| | 1,685 | | 6.125%, 1/01/30 | 1/21 at 100.00 | | A | | | 1,955,443 | |
| | 5,060 | | 6.250%, 1/01/45 | 1/21 at 100.00 | | A | | | 5,835,293 | |
| | | | Maryland Health and Higher Educational Facilities Authority, Revenue Bonds, King Farm Presbyterian Community, Series 2007A: | | | | | | | |
| | 210 | | 5.000%, 1/01/17 | No Opt. Call | | N/R | | | 213,385 | |
| | 1,460 | | 5.250%, 1/01/27 | 1/17 at 100.00 | | N/R | | | 1,477,797 | |
| | 1,050 | | 5.300%, 1/01/37 | 1/17 at 100.00 | | N/R | | | 1,060,668 | |
| | 2,480 | | Maryland Health and Higher Educational Facilities Authority, Revenue Bonds, Mercy Ridge Retirement Community, Series 2007, 4.750%, 7/01/34 | 7/17 at 100.00 | | A– | | | 2,523,078 | |
| | 19,210 | | Total Long-Term Care | | | | | | 20,677,902 | |
| | | | Tax Obligation/General – 17.3% (11.8% of Total Investments) | | | | | | | |
| | | | Baltimore, Maryland, General Obligation Bonds, Consolidated Public Improvements, Series 2011A: | | | | | | | |
| | 1,000 | | 5.000%, 10/15/29 | 10/21 at 100.00 | | AA | | | 1,182,490 | |
| | 1,200 | | 5.000%, 10/15/30 | 10/21 at 100.00 | | AA | | | 1,399,584 | |
| | 3,100 | | Howard County, Maryland, General Obligation Consolidated Public Improvement Bonds, Refunding Series 2014A, 5.000%, 2/15/23 | 2/22 at 100.00 | | AAA | | | 3,730,168 | |
| | 5,240 | | Huntington Beach Union High School District, Orange County, California, General Obligation Bonds, Series 2005, 0.000%, 8/01/30 – AGM Insured | No Opt. Call | | AA | | | 3,431,414 | |
| | Principal | | | Optional Call | | | | | | |
| | Amount (000) | | Description (1) | Provisions (2) | | Ratings (3) | | | Value | |
| | | | Tax Obligation/General (continued) | | | | | | | |
| $ | 2,305 | | Maryland National Capital Park Planning Commission, Prince George's County, General Obligation Bonds, Park Acquisition and Development, Series 2004EE-2, 5.000%, 1/15/17 | 8/16 at 100.00 | | AAA | | $ | 2,314,174 | |
| | 1,000 | | Maryland State, General Obligation Bonds, State & Local Facilities Loan, First Series 2011B, 5.000%, 3/15/17 | No Opt. Call | | AAA | | | 1,034,860 | |
| | 1,125 | | Maryland State, General Obligation Bonds, State & Local Facilities Loan, Second Series 2006, 5.000%, 8/01/16 | No Opt. Call | | AAA | | | 1,133,528 | |
| | 2,200 | | Maryland State, General Obligation Bonds, State & Local Facilities Loan, Second Series 2007, 5.000%, 8/01/16 | No Opt. Call | | AAA | | | 2,216,676 | |
| | 1,895 | | Maryland State, General Obligation Bonds, State & Local Facilities Loan, Second Series 2009A, 3.000%, 8/15/17 | No Opt. Call | | AAA | | | 1,949,197 | |
| | | | Maryland State, General Obligation Bonds, State & Local Facilities Loan, Second Series 2009B: | | | | | | | |
| | 4,925 | | 5.250%, 8/15/16 | No Opt. Call | | AAA | | | 4,973,511 | |
| | 3,750 | | 5.250%, 8/15/17 | No Opt. Call | | AAA | | | 3,958,425 | |
| | 4,930 | | Patterson Joint Unified School District, Stanislaus County, California, General Obligation Bonds, 2008 Election Series 2009B, 0.000%, 8/01/42 – AGM Insured | No Opt. Call | | AA | | | 1,968,253 | |
| | | | Prince George's County, Maryland, General Obligation Consolidated Public Improvement Bonds, Series 2014A: | | | | | | | |
| | 3,000 | | 4.000%, 9/01/30 | 9/24 at 100.00 | | AAA | | | 3,441,870 | |
| | 3,000 | | 4.000%, 9/01/31 | 9/24 at 100.00 | | AAA | | | 3,422,310 | |
| | 3,000 | | Prince George's County, Maryland, General Obligation Consolidated Public Improvement Bonds, Series 2014B, 5.000%, 12/01/16 | No Opt. Call | | AAA | | | 3,067,650 | |
| | 2,155 | | Puerto Rico, General Obligation Bonds, Public Improvement Refunding Series 2007A, 5.500%, 7/01/20 – NPFG Insured | No Opt. Call | | AA– | | | 2,278,503 | |
| | 2,270 | | Puerto Rico, General Obligation Bonds, Public Improvement Series 2002A, 5.500%, 7/01/20 – NPFG Insured | No Opt. Call | | AA– | | | 2,400,094 | |
| | 14,985 | | San Ysidro School District, San Diego County, California, General Obligation Bonds, 1997 Election Series 2012G, 0.000%, 8/01/40 – AGM Insured | No Opt. Call | | AA | | | 6,012,132 | |
| | 1,025 | | Washington Suburban Sanitary District, Montgomery and Prince George's Counties, Maryland, General Obligation Bonds, Consolidated Public Improvement, Refunding Series 2009, 5.000%, 6/01/17 | No Opt. Call | | AAA | | | 1,070,008 | |
| | 2,700 | | Washington Suburban Sanitary District, Montgomery and Prince George's Counties, Maryland, General Obligation Bonds, Consolidated Public Improvement, Refunding Series 2013, 4.000%, 6/01/17 | No Opt. Call | | AAA | | | 2,791,665 | |
| | 2,500 | | Washington Suburban Sanitary District, Montgomery and Prince George's Counties, Maryland, General Obligation Bonds, Consolidated Public Improvement, Series 2010A, 5.000%, 6/01/16 | No Opt. Call | | AAA | | | 2,500,000 | |
| | 3,000 | | Washington Suburban Sanitary District, Montgomery and Prince George's Counties, Maryland, General Obligation Bonds, Consolidated Public Improvement, Series 2012, 5.000%, 6/01/16 | No Opt. Call | | AAA | | | 3,000,000 | |
| | 7,000 | | Wylie Independent School District, Collin County, Texas, General Obligation Bonds, Capital Appreciation Series 2015, 0.000%, 8/15/50 | 8/25 at 35.55 | | Aaa | | | 1,847,300 | |
| | 77,305 | | Total Tax Obligation/General | | | | | | 61,123,812 | |
| | | | Tax Obligation/Limited – 20.1% (13.7% of Total Investments) | | | | | | | |
| | 990 | | Anne Arundel County, Maryland, Special Obligation Bonds, National Business Park – North Project, Series 2010, 6.100%, 7/01/40 | 7/18 at 102.00 | | N/R | | | 1,047,925 | |
| | 1,200 | | Anne Arundel County, Maryland, Special Tax District Revenue Bonds, Villages of Dorchester & Farmington Village Projects, Series 2013, 5.000%, 7/01/32 | 7/23 at 100.00 | | A+ | | | 1,406,364 | |
| | 120 | | Baltimore, Maryland, Revenue Refunding Bonds, Convention Center, Series 1998, 5.000%, 9/01/19 – NPFG Insured | 9/16 at 100.00 | | AA– | | | 120,452 | |
| NMY | Nuveen Maryland Premium Income Municipal Fund | |
| | Portfolio of Investments (continued) | May 31, 2016 |
| | Principal | | | Optional Call | | | | | | |
| | Amount (000) | | Description (1) | Provisions (2) | | Ratings (3) | | | Value | |
| | | | Tax Obligation/Limited (continued) | | | | | | | |
| | | | Baltimore, Maryland, Special Obligation Bonds, Consolidated Tax Increment Financing, Series 2015: | | | | | | | |
| $ | 525 | | 5.000%, 6/15/30 | 6/24 at 100.00 | | BBB+ | | $ | 601,151 | |
| | 425 | | 5.000%, 6/15/33 | 6/24 at 100.00 | | BBB+ | | | 481,419 | |
| | | | Frederick County, Maryland, Lake Linganore Village Community Development Special Obligation Bonds, Series 2001A: | | | | | | | |
| | 85 | | 5.600%, 7/01/20 – RAAI Insured | 1/17 at 100.00 | | AA | | | 85,326 | |
| | 450 | | 5.700%, 7/01/29 – RAAI Insured | 1/17 at 100.00 | | AA | | | 451,760 | |
| | | | Fredrick County, Maryland, Special Obligation Bonds, Urbana Community Development Authority, Series 2010A: | | | | | | | |
| | 5,350 | | 5.000%, 7/01/30 | 7/20 at 100.00 | | A– | | | 6,076,421 | |
| | 2,355 | | 5.000%, 7/01/40 | 7/20 at 100.00 | | A– | | | 2,644,453 | |
| | 1,000 | | Government of Guam, Business Privilege Tax Bonds, Series 2011A, 5.250%, 1/01/36 | 1/22 at 100.00 | | A | | | 1,133,540 | |
| | 1,260 | | Huntington Beach Union High School District, Orange County, California, Certificates of Participation, Capital Project, Series 2007, 0.000%, 9/01/35 – AGM Insured | No Opt. Call | | AA | | | 634,586 | |
| | 2,050 | | Hyattsville, Maryland, Special Obligation Bonds, University Town Center Project, Series 2004, 5.750%, 7/01/34 | 7/16 at 100.00 | | N/R | | | 2,053,711 | |
| | 3,290 | | Maryland Economic Development Corporation, Lease Revenue Bonds, Maryland Public Health Laboratory Project, Series 2011, 5.000%, 6/01/17 | No Opt. Call | | AA+ | | | 3,432,753 | |
| | | | Maryland Stadium Authority, Lease Revenue Bonds, Baltimore City Public Schools Construction and Revitalization Program, Series 2016: | | | | | | | |
| | 4,500 | | 5.000%, 5/01/41 | 5/26 at 100.00 | | AA | | | 5,434,245 | |
| | 4,500 | | 5.000%, 5/01/46 | 5/26 at 100.00 | | AA | | | 5,412,465 | |
| | 2,000 | | New Jersey Transportation Trust Fund Authority, Transportation System Bonds, Series 2009A, 0.000%, 12/15/32 | No Opt. Call | | A– | | | 963,500 | |
| | 70 | | Prince George's County Revenue Authority, Maryland, Special Obligation Bonds, Suitland-Naylor Road Project, Series 2016, 5.000%, 7/01/46 | 1/26 at 100.00 | | N/R | | | 72,484 | |
| | 6,424 | | Prince George's County, Maryland, Special Obligation Bonds, National Harbor Project, Series 2005, 5.200%, 7/01/34 | 8/16 at 100.00 | | N/R | | | 6,430,681 | |
| | 1,406 | | Prince George's County, Maryland, Special Tax District Bonds, Victoria Falls Project, Series 2005, 5.250%, 7/01/35 | 1/17 at 100.00 | | N/R | | | 1,408,109 | |
| | 1,100 | | Puerto Rico Highway and Transportation Authority, Highway Revenue Bonds, Series 2007N, 5.500%, 7/01/29 – AMBAC Insured | No Opt. Call | | CC | | | 1,161,512 | |
| | 1,530 | | Puerto Rico Infrastructure Financing Authority, Special Tax Revenue Bonds, Series 2005A, 0.000%, 7/01/44 – AMBAC Insured | No Opt. Call | | Ca | | | 224,191 | |
| | 2,100 | | Puerto Rico Municipal Finance Agency, Series 2002A, 5.250%, 8/01/21 – AGM Insured | 8/16 at 100.00 | | AA | | | 2,131,605 | |
| | | | Puerto Rico Sales Tax Financing Corporation, Sales Tax Revenue Bonds, Series 2007A: | | | | | | | |
| | 7,000 | | 0.000%, 8/01/40 – NPFG Insured | No Opt. Call | | AA– | | | 1,497,160 | |
| | 8,000 | | 0.000%, 8/01/41 – NPFG Insured | No Opt. Call | | AA– | | | 1,605,280 | |
| | 210 | | 0.000%, 8/01/47 – AMBAC Insured | No Opt. Call | | Caa3 | | | 26,011 | |
| | | | Puerto Rico, Highway Revenue Bonds, Highway and Transportation Authority, Series 2007CC: | | | | | | | |
| | 765 | | 5.500%, 7/01/28 – NPFG Insured | No Opt. Call | | AA– | | | 798,989 | |
| | 2,300 | | 5.500%, 7/01/30 – AGM Insured | No Opt. Call | | AA | | | 2,474,340 | |
| | 1,500 | | Virgin Islands Public Finance Authority, Federal Highway Grant Anticipation Loan Note Revenue Bonds, Series 2015, 5.000%, 9/01/30 | 9/25 at 100.00 | | A | | | 1,770,345 | |
| | 2,000 | | Virgin Islands Public Finance Authority, Gross Receipts Taxes Loan Note, Refunding Series 2006, 5.000%, 10/01/27 – FGIC Insured | 10/16 at 100.00 | | AA– | | | 2,027,400 | |
| | Principal | | | Optional Call | | | | | | |
| | Amount (000) | | Description (1) | Provisions (2) | | Ratings (3) | | | Value | |
| | | | Tax Obligation/Limited (continued) | | | | | | | |
| | | | Virgin Islands Public Finance Authority, Gross Receipts Taxes Loan Note, Working Capital Series 2014A: | | | | | | | |
| $ | 2,580 | | 5.000%, 10/01/29 | 10/24 at 100.00 | | BBB+ | | $ | 2,867,360 | |
| | 300 | | 5.000%, 10/01/34 | 10/24 at 100.00 | | BBB+ | | | 327,957 | |
| | 2,240 | | 5.000%, 10/01/34 – AGM Insured | 10/24 at 100.00 | | AA | | | 2,573,402 | |
| | 1,035 | | Virgin Islands Public Finance Authority, Matching Fund Loan Notes Revenue Bonds, Senior Lien Series 2009A-1, 5.000%, 10/01/29 – AGM Insured | 10/19 at 100.00 | | AA | | | 1,159,511 | |
| | 3,500 | | Virgin Islands Public Finance Authority, Matching Fund Loan Notes Revenue Bonds, Senior Lien Series 2010A, 5.000%, 10/01/29 | 10/20 at 100.00 | | BBB | | | 3,834,495 | |
| | 2,000 | | Virgin Islands Public Finance Authority, Matching Fund Loan Notes Revenue Bonds, Senior Lien, Series 2013A, 5.000%, 10/01/24 – AGM Insured | No Opt. Call | | AA | | | 2,456,680 | |
| | 2,000 | | Virgin Islands Public Finance Authority, Matching Fund Loan Notes Revenue Bonds, Series 2012A, 5.000%, 10/01/32 | 10/22 at 100.00 | | BBB | | | 2,171,360 | |
| | 1,825 | | Virgin Islands Public Finance Authority, Matching Fund Loan Notes Revenue Bonds, Subordinate Lien Series 2010B, 5.250%, 10/01/29 | 10/20 at 100.00 | | Baa2 | | | 2,011,679 | |
| | 79,985 | | Total Tax Obligation/Limited | | | | | | 71,010,622 | |
| | | | Transportation – 4.0% (2.7% of Total Investments) | | | | | | | |
| | | | Baltimore, Maryland, Revenue Refunding Bonds, Parking System Facilities, Series 1998A: | | | | | | | |
| | 375 | | 5.250%, 7/01/17 – FGIC Insured | No Opt. Call | | AA– | | | 382,991 | |
| | 110 | | 5.250%, 7/01/21 – FGIC Insured | No Opt. Call | | AA– | | | 121,579 | |
| | 125 | | Guam International Airport Authority, Revenue Bonds, Series 2013C, 6.375%, 10/01/43 (Alternative Minimum Tax) | 10/23 at 100.00 | | BBB | | | 152,120 | |
| | | | Maryland Health and Higher Educational Facilities Authority, Parking Facilities Revenue Bonds, Johns Hopkins Hospital, Series 2001: | | | | | | | |
| | 1,300 | | 5.000%, 7/01/27 – AMBAC Insured | 7/16 at 100.00 | | N/R | | | 1,302,756 | |
| | 1,000 | | 5.000%, 7/01/34 – AMBAC Insured | 7/16 at 100.00 | | N/R | | | 1,001,780 | |
| | 460 | | Maryland Health and Higher Educational Facilities Authority, Parking Facilities Revenue Bonds, Johns Hopkins Medical Institutions, Series 1996, 5.500%, 7/01/26 – AMBAC Insured | 8/16 at 100.00 | | N/R | | | 461,118 | |
| | 10,110 | | Maryland Transportation Authority, Revenue Bonds, Transportation Facilities Projects, Series 2007, 5.000%, 7/01/30 – AGM Insured (UB) (5) | 7/17 at 100.00 | | AA | | | 10,588,506 | |
| | | | Port Authority of New York and New Jersey, Special Project Bonds, JFK International Air Terminal LLC, Sixth Series 1997: | | | | | | | |
| | 20 | | 5.750%, 12/01/22 – NPFG Insured (Alternative Minimum Tax) | 6/16 at 100.00 | | AA– | | | 20,441 | |
| | 70 | | 5.750%, 12/01/25 – NPFG Insured (Alternative Minimum Tax) | 6/16 at 100.00 | | AA– | | | 71,807 | |
| | 13,570 | | Total Transportation | | | | | | 14,103,098 | |
| | | | U.S. Guaranteed – 19.4% (13.2% of Total Investments) (6) | | | | | | | |
| | 500 | | Baltimore County, Maryland, Revenue Bonds, Catholic Health Initiatives, Series 2006A, 5.000%, 9/01/36 (Pre-refunded 9/01/16) | 9/16 at 100.00 | | A+ (6) | | | 505,485 | |
| | | | Baltimore, Maryland, Revenue Bonds, Wastewater Projects, Series 2006C: | | | | | | | |
| | 1,500 | | 5.000%, 7/01/31 (Pre-refunded 7/01/16) – AMBAC Insured | 7/16 at 100.00 | | AA (6) | | | 1,505,520 | |
| | 2,570 | | 5.000%, 7/01/31 (Pre-refunded 7/01/16) – AMBAC Insured | 7/16 at 100.00 | | AA (6) | | | 2,579,458 | |
| | 3,000 | | Baltimore, Maryland, Revenue Bonds, Wastewater Projects, Series 2007D, 5.000%, 7/01/32 (Pre-refunded 7/01/17) – AMBAC Insured | 7/17 at 100.00 | | AA (6) | | | 3,140,460 | |
| | 2,000 | | Baltimore, Maryland, Revenue Bonds, Water Projects, Refunding Series 1994A, 5.000%, 7/01/24 – FGIC Insured (ETM) | No Opt. Call | | AA (6) | | | 2,412,780 | |
| | 3,120 | | Baltimore, Maryland, Revenue Bonds, Water Projects, Refunding Series 1998A, 5.000%, 7/01/28 – FGIC Insured (ETM) | No Opt. Call | | AA (6) | | | 3,818,287 | |
| NMY | Nuveen Maryland Premium Income Municipal Fund | |
| | Portfolio of Investments (continued) | May 31, 2016 |
| | Principal | | | Optional Call | | | | | | |
| | Amount (000) | | Description (1) | Provisions (2) | | Ratings (3) | | | Value | |
| | | | U.S. Guaranteed (6) (continued) | | | | | | | |
| $ | 2,230 | | Maryland Department of Transportation, Consolidated Transportation Revenue Bonds, Second Issue Series 2008, 5.000%, 9/01/22 (Pre-refunded 9/01/18) | 9/18 at 100.00 | | AAA | | $ | 2,438,661 | |
| | 1,500 | | Maryland Health and Higher Educational Facilities Authority, Revenue Bonds, Anne Arundel Health System, Series 2009A, 6.750%, 7/01/39 (Pre-refunded 7/01/19) | 7/19 at 100.00 | | A (6) | | | 1,765,485 | |
| | | | Maryland Health and Higher Educational Facilities Authority, Revenue Bonds, Carroll Hospital Center, Series 2006: | | | | | | | |
| | 1,000 | | 4.500%, 7/01/26 (Pre-refunded 7/01/16) | 7/16 at 100.00 | | A1 (6) | | | 1,003,310 | |
| | 2,550 | | 5.000%, 7/01/40 (Pre-refunded 7/01/16) | 7/16 at 100.00 | | A1 (6) | | | 2,559,512 | |
| | 1,000 | | Maryland Health and Higher Educational Facilities Authority, Revenue Bonds, Edenwald, Series 2006A, 5.400%, 1/01/31 (Pre-refunded 7/01/16) | 7/16 at 100.00 | | N/R (6) | | | 1,004,060 | |
| | | | Maryland Health and Higher Educational Facilities Authority, Revenue Bonds, Helix Health, Series 1997: | | | | | | | |
| | 660 | | 5.000%, 7/01/17 – AMBAC Insured (ETM) | No Opt. Call | | N/R (6) | | | 676,177 | |
| | 3,240 | | 5.000%, 7/01/27 – AMBAC Insured (ETM) | No Opt. Call | | N/R (6) | | | 3,943,242 | |
| | 1,050 | | Maryland Health and Higher Educational Facilities Authority, Revenue Bonds, LifeBridge Health System, Series 2008, 5.000%, 7/01/28 (Pre-refunded 7/01/17) – AGM Insured | 7/17 at 100.00 | | AA (6) | | | 1,099,046 | |
| | | | Maryland Health and Higher Educational Facilities Authority, Revenue Bonds, Mercy Medical Center Project, Series 2007A: | | | | | | | |
| | 2,375 | | 5.000%, 7/01/37 (Pre-refunded 7/01/17) | 7/17 at 100.00 | | BBB (6) | | | 2,486,744 | |
| | 2,905 | | 5.500%, 7/01/42 (Pre-refunded 7/01/17) | 7/17 at 100.00 | | BBB (6) | | | 3,057,309 | |
| | 3,950 | | Maryland Health and Higher Educational Facilities Authority, Revenue Bonds, Peninsula Regional Medical Center, Series 2006, 5.000%, 7/01/36 (Pre-refunded 7/01/16) | 7/16 at 100.00 | | A (6) | | | 3,964,734 | |
| | | | Maryland Health and Higher Educational Facilities Authority, Revenue Bonds, University of Maryland Medical System, Series 2006: | | | | | | | |
| | 700 | | 5.000%, 7/01/31 (Pre-refunded 7/01/16) | 7/16 at 100.00 | | A2 (6) | | | 702,611 | |
| | 1,325 | | 5.000%, 7/01/36 (Pre-refunded 7/01/16) | 7/16 at 100.00 | | A2 (6) | | | 1,329,942 | |
| | | | Maryland Health and Higher Educational Facilities Authority, Revenue Bonds, Washington County Hospital, Series 2008: | | | | | | | |
| | 135 | | 5.750%, 1/01/33 (Pre-refunded 1/01/18) | 1/18 at 100.00 | | BBB (6) | | | 145,592 | |
| | 7,075 | | 5.750%, 1/01/38 (Pre-refunded 1/01/18) | 1/18 at 100.00 | | BBB (6) | | | 7,630,105 | |
| | 3,950 | | 6.000%, 1/01/43 (Pre-refunded 1/01/18) | 1/18 at 100.00 | | BBB (6) | | | 4,275,441 | |
| | 3,190 | | Maryland Health and Higher Educational Facilities Authority, Revenue Bonds, Western Maryland Health, Series 2006A, 5.000%, 7/01/34 (Pre-refunded 7/01/16) – NPFG Insured | 7/16 at 100.00 | | AA– (6) | | | 3,201,899 | |
| | 2,910 | | Maryland Health and Higher Educational Facilities Authority, Revenue Bonds, Western Maryland Health, Series 2006A, 4.500%, 1/01/22 (Pre-refunded 7/01/16) – NPFG Insured | 7/16 at 100.00 | | AA– (6) | | | 2,919,632 | |
| | 2,110 | | Maryland State, General Obligation Bonds, State & Local Facilities Loan, Second Series 2009B, 5.000%, 8/15/21 (Pre-refunded 8/15/19) | 8/19 at 100.00 | | AAA | | | 2,379,342 | |
| | 425 | | Maryland Transportation Authority, Revenue Refunding Bonds, Transportation Facilities Projects, First Series 1978, 6.800%, 7/01/16 – AMBAC Insured (ETM) | No Opt. Call | | Aaa | | | 426,959 | |
| | 1,100 | | Puerto Rico Public Finance Corporation, Commonwealth Appropriation Bonds, Series 1998A, 5.125%, 6/01/24 – AMBAC Insured (ETM) | No Opt. Call | | Aaa | | | 1,301,201 | |
| | 1,000 | | Puerto Rico, Highway Revenue Bonds, Highway and Transportation Authority, Series 1996Y, 5.500%, 7/01/36 (Pre-refunded 7/01/16) | 7/16 at 100.00 | | Aaa | | | 1,003,830 | |
| | Principal | | | Optional Call | | | | | | |
| | Amount (000) | | Description (1) | Provisions (2) | | Ratings (3) | | | Value | |
| | | | U.S. Guaranteed (6) (continued) | | | | | | | |
| $ | 1,610 | | Puerto Rico, Highway Revenue Bonds, Highway and Transportation Authority, Series 2003AA, 5.500%, 7/01/19 – NPFG Insured (ETM) | No Opt. Call | | A3 (6) | | $ | 1,810,831 | |
| | 3,135 | | University of Maryland, Auxiliary Facility and Tuition Revenue Bonds, Series 2006A, 5.000%, 10/01/22 (Pre-refunded 10/01/16) | 10/16 at 100.00 | | AA+ (6) | | | 3,181,743 | |
| | 63,815 | | Total U.S. Guaranteed | | | | | | 68,269,398 | |
| | | | Utilities – 2.5% (1.7% of Total Investments) | | | | | | | |
| | 1,300 | | Guam Power Authority, Revenue Bonds, Series 2012A, 5.000%,
10/01/30 – AGM Insured | 10/22 at 100.00 | | AA | | | 1,547,923 | |
| | | | Guam Power Authority, Revenue Bonds, Series 2014A: | | | | | | | |
| | 600 | | 5.000%, 10/01/39 | 10/24 at 100.00 | | AA | | | 705,282 | |
| | 575 | | 5.000%, 10/01/44 | 10/24 at 100.00 | | AA | | | 672,612 | |
| | 3,600 | | Puerto Rico Electric Power Authority, Power Revenue Bonds, Series 2004PP, 5.000%, 7/01/22 – NPFG Insured | 8/16 at 100.00 | | AA– | | | 3,599,964 | |
| | 1,570 | | Puerto Rico Electric Power Authority, Power Revenue Bonds, Series 2005RR, 5.000%, 7/01/22 – FGIC Insured | 8/16 at 100.00 | | AA– | | | 1,590,598 | |
| | 730 | | Virgin Islands Water and Power Authority, Electric System Revenue Bonds, Refunding Series 2007A, 5.000%, 7/01/24 | 7/17 at 100.00 | | BB+ | | | 730,358 | |
| | 8,375 | | Total Utilities | | | | | | 8,846,737 | |
| | | | Water and Sewer – 4.2% (2.8% of Total Investments) | | | | | | | |
| | 2,500 | | Baltimore, Maryland, Project and Revenue Refunding Bonds, Water Projects, Series 2013B, 5.000%, 7/01/38 | 1/24 at 100.00 | | AA | | | 2,951,973 | |
| | 2,000 | | Baltimore, Maryland, Revenue Bonds, Wastewater Projects, Series 2011A, 5.000%, 7/01/41 | 7/21 at 100.00 | | AA | | | 2,308,500 | |
| | 1,045 | | Baltimore, Maryland, Revenue Bonds, Water Projects, Refunding Series 1994A, 5.000%, 7/01/24 – FGIC Insured | No Opt. Call | | AA | | | 1,158,006 | |
| | 2,500 | | Baltimore, Maryland, Revenue Bonds, Water Projects, Subordinate Series 2014A, 5.000%, 7/01/44 | 1/25 at 100.00 | | AA– | | | 2,937,850 | |
| | 1,300 | | Guam Government Waterworks Authority, Water and Wastewater System Revenue Bonds, Refunding Series 2014A, 5.000%, 7/01/35 | 7/24 at 100.00 | | A– | | | 1,488,383 | |
| | 2,030 | | Guam Government Waterworks Authority, Water and Wastewater System Revenue Bonds, Series 2013, 5.500%, 7/01/43 | 7/23 at 100.00 | | A– | | | 2,379,891 | |
| | 1,240 | | Guam Government Waterworks Authority, Water and Wastewater System Revenue Bonds, Series 2016, 5.000%, 1/01/46 | 7/26 at 100.00 | | A– | | | 1,436,825 | |
| | 12,615 | | Total Water and Sewer | | | | | | 14,661,428 | |
| $ | 515,225 | | Total Municipal Bonds (cost $486,363,867) | | | | | | 517,090,270 | |
| NMY | Nuveen Maryland Premium Income Municipal Fund | |
| | Portfolio of Investments (continued) | May 31, 2016 |
| | Shares | | Description (1) | | | Value | |
| | | | COMMON STOCKS – 0.4% (0.3% of Total Investments) | | | | |
| | | | Airlines – 0.4% (0.3% of Total Investments) | | | | |
| | 44,607 | | American Airlines Group Inc., (7) | | $ | 1,423,409 | |
| | | | Total Common Stocks (cost $1,288,472) | | | 1,423,409 | |
| | | | Total Long-Term Investments (cost $487,652,339) | | | 518,513,679 | |
| | | | Floating Rate Obligations – (4.3)% | | | (15,215,000 | ) |
| | | | Variable Rate MuniFund Term Preferred Shares, at Liquidation Preference – (47.4)% (8) | | | (167,000,000 | ) |
| | | | Other Assets Less Liabilities – 4.6% | | | 16,282,514 | |
| | | | Net Assets Applicable to Common Shares – 100% | | $ | 352,581,193 | |
| (1) | All percentages shown in the Portfolio of Investments are based on net assets applicable to common shares unless otherwise noted. |
| (2) | Optional Call Provisions (not covered by the report of independent registered public accounting firm): Dates (month and year) and prices of the earliest optional call or redemption. There may be other call provisions at varying prices at later dates. Certain mortgage-backed securities may be subject to periodic principal paydowns. |
| (3) | Ratings (not covered by the report of independent registered public accounting firm): Using the highest of Standard & Poor's Group ("Standard & Poor's"), Moody's Investors Service, Inc. ("Moody's") or Fitch, Inc. ("Fitch") rating. Ratings below BBB by Standard & Poor's, Baa by Moody's or BBB by Fitch are considered to be below investment grade. Holdings designated N/R are not rated by any of these national rating agencies. |
| (4) | As of, or subsequent to, the end of the reporting period this security is non-income producing. Non-income producing, in the case of a fixed-income security, generally denotes that the issuer has (1) defaulted on the payment of principal or interest, (2) is under the protection of the Federal Bankruptcy Court or (3) the Fund's Adviser has concluded that the issue is not likely to meet its future interest payment obligations and has ceased accruing additional income on the Fund's records. |
| (5) | Investment, or portion of investment, has been pledged to collateralize the net payment obligations for investments in inverse floating rate transactions. |
| (6) | Backed by an escrow or trust containing sufficient U.S. Government or U.S. Government agency securities, which ensure the timely payment of principal and interest. Certain bonds backed by U.S. Government or agency securities are regarded as having an implied rating equal to the rating of such securities. |
| (7) | On November 28, 2011, AMR Corp. ("AMR"), the parent company of American Airlines Group, Inc. ("AAL") filed for federal bankruptcy protection. On December 9, 2013, AMR emerged from federal bankruptcy with the acceptance of its reorganization plan by the bankruptcy court. Under the settlement agreement established to meet AMR's unsecured bond obligations, the bondholders, including the Fund, received a distribution of AAL preferred stock which was converted to AAL common stock over a 120-day period. Every 30 days, a quarter of the preferred stock was converted to AAL common stock based on the 5-day volume-weighted average price and the amount of preferred shares tendered during the optional preferred conversion period. |
| (8) | Variable Rate MuniFund Term Preferred Shares, at Liquidation Preference as a percentage of Total Investments is 32.2%. |
| (ETM) | Escrowed to maturity. |
| (UB) | Underlying bond of an inverse floating rate trust reflected as a financing transaction. See Notes to Financial Statements, Note 3 – Portfolio Securities and Investments in Derivatives, Inverse Floating Rate Securities for more information. |
| (WI/DD) | Investment, or portion of investment, purchased on a when-issued or delayed delivery basis. |
See accompanying notes to financial statements.
| NMS | | |
| | Nuveen Minnesota Municipal Income Fund | |
| | Portfolio of Investments | May 31, 2016 |
| | Principal | | | Optional Call | | | | | | |
| | Amount (000) | | Description (1) | Provisions (2) | | Ratings (3) | | | Value | |
| | | | LONG-TERM INVESTMENTS – 148.8% (100.0% of Total Investments) | | | | | | | |
| | | | MUNICIPAL BONDS – 148.8% (100.0% of Total Investments) | | | | | | | |
| | | | Consumer Staples – 0.9% (0.6% of Total Investments) | | | | | | | |
| $ | 700 | | Moorhead, Minnesota, Recovery Zone Facility Revenue Bonds, American Crystal Sugar Company Project, Series 2010, 5.650%, 6/01/27 | 7/20 at 100.00 | | BBB+ | | $ | 782,740 | |
| | | | Education and Civic Organizations – 26.6% (17.9% of Total Investments) | | | | | | | |
| | 390 | | Anoka County, Minnesota, Charter School Lease Revenue Bonds, Spectrum Building Company, Series 2012A, 5.000%, 6/01/43 | No Opt. Call | | BBB– | | | 418,302 | |
| | 1,250 | | Baytown Township, Minnesota, Lease Revenue Bonds, Saint Croix Preparatory Academy Project, Series 2008A, 7.000%, 8/01/38 | 8/16 at 102.00 | | BB+ | | | 1,280,225 | |
| | 50 | | City of Ham Lake, Minnesota, Charter School Lease Revenue Bonds, DaVinci Academy Project, Series 2016A, 5.000%, 7/01/36 | 7/24 at 102.00 | | N/R | | | 52,213 | |
| | 830 | | City of Woodbury, Minnesota, Charter School Lease Revenue Bonds, Math and Science Academy Building Company, Series 2012A, 5.000%, 12/01/43 | No Opt. Call | | BBB– | | | 887,502 | |
| | 250 | | Deephaven, Minnesota, Charter School Lease Revenue Bonds, Eagle Ridge Academy Project, Series 2015A, 5.250%, 7/01/40 | 7/25 at 100.00 | | BB+ | | | 267,305 | |
| | 1,000 | | Duluth Housing & Redevelopment Authority, Minnesota, Lease Revenue Bonds, Duluth Public Schools Academy, Series 2010A, 5.600%, 11/01/30 | 11/18 at 102.00 | | BBB– | | | 1,064,210 | |
| | 570 | | Forest Lake, Minnesota, Charter School Lease Revenue Bonds, Lakes International Language Academy, Series 2014A, 5.750%, 8/01/44 | 8/22 at 100.00 | | BB+ | | | 626,624 | |
| | 2,200 | | Hugo, Minnesota, Charter School Lease Revenue Bonds, Noble Academy Project, Series 2014A, 5.000%, 7/01/44 | 7/24 at 100.00 | | BB+ | | | 2,247,696 | |
| | 1,425 | | Minneapolis, Minnesota, Charter School Lease Revenue Bonds, Yinghua Academy Project, Series 2013A, 6.000%, 7/01/43 | 7/23 at 100.00 | | BB | | | 1,540,796 | |
| | | | Minnesota Higher Education Facilities Authority, Revenue Bonds, Bethel University, Refunding Series 2007-6-R: | | | | | | | |
| | 500 | | 5.500%, 5/01/24 | 5/17 at 100.00 | | N/R | | | 510,795 | |
| | 1,000 | | 5.500%, 5/01/27 | 5/17 at 100.00 | | N/R | | | 1,019,310 | |
| | 200 | | 5.500%, 5/01/37 | 5/17 at 100.00 | | N/R | | | 203,480 | |
| | 305 | | Minnesota Higher Education Facilities Authority, Revenue Bonds, College of St. Benedict, Series 2016-8K, 4.000%, 3/01/43 | 3/26 at 100.00 | | Baa1 | | | 323,446 | |
| | 600 | | Minnesota Higher Education Facilities Authority, Revenue Bonds, Macalester College, Series 2012-7S, 3.250%, 5/01/36 | No Opt. Call | | Aa3 | | | 617,202 | |
| | 2,000 | | Minnesota Higher Education Facilities Authority, Revenue Bonds, University of Saint Thomas, Series 2009-7A, 5.000%, 10/01/39 | 10/19 at 100.00 | | A2 | | | 2,226,560 | |
| | 705 | | Otsego, Minnesota, Charter School Lease Revenue Bonds, Kaleidoscope Charter School Project, Series 2014A, 5.000%, 9/01/44 | 9/24 at 100.00 | | BB+ | | | 734,941 | |
| | 450 | | Ramsey, Anoka County, Minnesota, Lease Revenue Bonds, PACT Charter School Project, Series 2004A, 5.500%, 12/01/33 | 12/21 at 100.00 | | BBB– | | | 491,616 | |
| | 315 | | Rice County, Minnesota Educational Facility Revenue Bonds, Shattuck Saint Mary's School Project, Series 2015, 5.000%, 8/01/22 | No Opt. Call | | BB | | | 339,721 | |
| | 500 | | Saint Paul Housing and Redevelopment Authority, Minnesota, Charter School Lease Revenue Bonds, Hmong Education Reform Company, Series 2012A, 5.250%, 9/01/32 | No Opt. Call | | BB+ | | | 525,795 | |
| | 1,100 | | Saint Paul Housing and Redevelopment Authority, Minnesota, Charter School Lease Revenue Bonds, Nova Classical Academy, Series 2011A, 6.375%, 9/01/31 | 9/21 at 100.00 | | BBB– | | | 1,258,576 | |
| | | | Saint Paul Housing and Redevelopment Authority, Minnesota, Charter School Lease Revenue Bonds, Twin Cities Academy Project, Series 2015A: | | | | | | | |
| | 360 | | 5.300%, 7/01/45 | 7/25 at 100.00 | | BB | | | 372,359 | |
| | 510 | | 5.375%, 7/01/50 | 7/25 at 100.00 | | BB | | | 528,513 | |
| NMS | Nuveen Minnesota Municipal Income Fund | |
| | Portfolio of Investments (continued) | May 31, 2016 |
| | Principal | | | Optional Call | | | | | | |
| | Amount (000) | | Description (1) | Provisions (2) | | Ratings (3) | | | Value | |
| | | | Education and Civic Organizations (continued) | | | | | | | |
| $ | 1,680 | | Saint Paul Housing and Redevelopment Authority, Minnesota, Charter School Lease Revenue Bonds, Twin Cities German Immersion School, Series 2013A, 5.000%, 7/01/44 | No Opt. Call | | BB+ | | $ | 1,732,466 | |
| | 500 | | Saint Paul Housing and Redevelopment Authority, Minnesota, Educational Facility Revenue Refunding Bonds, Saint Paul Academy and Summit School Project, Series 2007, 5.000%, 10/01/24 | 10/17 at 100.00 | | A3 | | | 524,980 | |
| | 390 | | Saint Paul Housing and Redevelopment Authority, Minnesota, Lease Revenue Bonds, Saint Paul Conservatory for Performing Artists Charter School Project, Series 2013A, 4.625%, 3/01/43 | 3/23 at 100.00 | | BBB– | | | 397,562 | |
| | 800 | | St. Paul Housing and Redevelopment Authority, Minnesota, Charter School Revenue Bonds, Higher Ground Academy Charter School, Series 2013A, 5.000%, 12/01/33 | 12/22 at 100.00 | | BBB– | | | 852,960 | |
| | 2,000 | | University of Minnesota, General Revenue Bonds, Series 2011A, 5.250%, 12/01/29 | 12/20 at 100.00 | | Aa1 | | | 2,357,880 | |
| | 21,880 | | Total Education and Civic Organizations | | | | | | 23,403,035 | |
| | | | Health Care – 22.4% (15.1% of Total Investments) | | | | | | | |
| | 1,000 | | Cuyuna Range Hospital District, Minnesota, Health Care Facilities Gross Revenue Bonds, Refunding Series 2007, 5.000%, 6/01/29 | 6/17 at 100.00 | | N/R | | | 1,014,520 | |
| | | | Glencoe, Minnesota, Health Care Facilities Revenue Bonds, Glencoe Regional Health Services Project, Series 2013: | | | | | | | |
| | 400 | | 4.000%, 4/01/27 | 4/22 at 100.00 | | BBB | | | 426,380 | |
| | 230 | | 4.000%, 4/01/31 | 4/22 at 100.00 | | BBB | | | 243,418 | |
| | 3,000 | | Housing and Redevelopment Authority of the City of Saint Paul, Minnesota, Health Care Facilities Revenue Refunding Bonds, HealthPartners Obligated Group, Series 2015A, 4.000%, 7/01/35 | 7/25 at 100.00 | | A | | | 3,245,610 | |
| | | | Maple Grove, Minnesota, Health Care Facilities Revenue Bonds, Maple Grove Hospital Corporation, Series 2007: | | | | | | | |
| | 20 | | 5.000%, 5/01/20 | 5/17 at 100.00 | | Baa1 | | | 20,768 | |
| | 1,000 | | 5.250%, 5/01/25 | 5/17 at 100.00 | | Baa1 | | | 1,036,650 | |
| | 500 | | Maple Grove, Minnesota, Health Care Facilities Revenue Refunding Bonds, North Memorial Health Care, Series 2015, 4.000%, 9/01/35 | 9/25 at 100.00 | | Baa1 | | | 529,115 | |
| | 450 | | Minneapolis, Minnesota, Health Care System Revenue Bonds, Fairview Health Services, Series 2008B, 6.500%, 11/15/38 – AGC Insured | 11/18 at 100.00 | | AA | | | 505,058 | |
| | | | Minneapolis, Minnesota, Health Care System Revenue Bonds, Fairview Health Services, Series 2015A: | | | | | | | |
| | 265 | | 4.000%, 11/15/40 | 11/25 at 100.00 | | A+ | | | 281,843 | |
| | 1,000 | | 5.000%, 11/15/44 | 11/25 at 100.00 | | A+ | | | 1,162,240 | |
| | 3,750 | | Minnesota Agricultural and Economic Development Board, Health Care Facilities Revenue Bonds, Essentia Health Obligated Group, Series 2008E, 5.000%, 2/15/37 – AGC Insured | 2/18 at 100.00 | | AA | | | 3,936,300 | |
| | 710 | | Northern Itasca Hospital District, Minnesota, Health Facilities Gross Revenue Bonds, Refunding Series 2013A, 4.400%, 12/01/33 | 12/20 at 100.00 | | N/R | | | 725,407 | |
| | | | Northern Itasca Hospital District, Minnesota, Health Facilities Gross Revenue Bonds, Series 2013C: | | | | | | | |
| | 240 | | 4.500%, 12/01/25 | 12/20 at 100.00 | | N/R | | | 252,446 | |
| | 190 | | 4.750%, 12/01/27 | 12/20 at 100.00 | | N/R | | | 200,727 | |
| | 160 | | 5.000%, 12/01/28 | 12/20 at 100.00 | | N/R | | | 169,178 | |
| | 310 | | 5.400%, 12/01/33 | 12/20 at 100.00 | | N/R | | | 331,266 | |
| | 30 | | Saint Cloud, Minnesota, Health Care Revenue Bonds, CentraCare Health System Project, Series 2010A, 5.125%, 5/01/30 | 5/20 at 100.00 | | A1 | | | 33,932 | |
| | 500 | | Saint Cloud, Minnesota, Health Care Revenue Bonds, CentraCare Health System, Series 2016A, 4.000%, 5/01/37 | 5/26 at 100.00 | | A1 | | | 542,825 | |
| | 1,625 | | Saint Paul Housing and Redevelopment Authority, Minnesota, Health Care Revenue Bonds, Allina Health System, Series 2009A-1, 5.250%, 11/15/29 | 11/19 at 100.00 | | AA– | | | 1,846,813 | |
| | 1,000 | | Saint Paul Port Authority, Minnesota, Lease Revenue Bonds, Regions Hospital Parking Ramp Project, Series 2007-1, 5.000%, 8/01/36 | 8/16 at 100.00 | | N/R | | | 1,001,760 | |
| | Principal | | | Optional Call | | | | | | |
| | Amount (000) | | Description (1) | Provisions (2) | | Ratings (3) | | | Value | |
| | | | Health Care (continued) | | | | | | | |
| | | | Shakopee, Minnesota, Health Care Facilities Revenue Bonds, Saint Francis Regional Medical Center, Refunding Series 2014: | | | | | | | |
| $ | 765 | | 4.000%, 9/01/31 | 9/24 at 100.00 | | A | | $ | 831,884 | |
| | 630 | | 5.000%, 9/01/34 | 9/24 at 100.00 | | A | | | 734,215 | |
| | 580 | | St. Paul Housing and Redevelopment Authority, Minnesota, Hospital Revenue Bonds, HealthEast Inc., Series 2015A, 5.000%, 11/15/44 | 11/25 at 100.00 | | BBB– | | | 670,996 | |
| | 18,355 | | Total Health Care | | | | | | 19,743,351 | |
| | | | Housing/Multifamily – 4.7% (3.1% of Total Investments) | | | | | | | |
| | 1,700 | | Coon Rapids, Minnesota, Multifamily Housing Revenue Bonds, Tralee Terrace Apartments Project, Series 2010, 4.500%, 6/01/26 | 6/20 at 100.00 | | Aaa | | | 1,835,966 | |
| | | | Minnesota Housing Finance Agency, Rental Housing Revenue Bonds, Series 2011: | | | | | | | |
| | 355 | | 5.050%, 8/01/31 | 8/21 at 100.00 | | AA+ | | | 392,800 | |
| | 1,700 | | 5.450%, 8/01/41 | 8/21 at 100.00 | | AA+ | | | 1,873,077 | |
| | 3,755 | | Total Housing/Multifamily | | | | | | 4,101,843 | |
| | | | Housing/Single Family – 1.9% (1.3% of Total Investments) | | | | | | | |
| | 139 | | Minneapolis-Saint Paul Housing Finance Board, Minnesota, Single Family Mortgage Revenue Bonds, City Living Series 2006A-4, 5.000%, 11/01/38 (Alternative Minimum Tax) | 7/16 at 100.00 | | AA+ | | | 142,076 | |
| | 225 | | Minnesota Housing Finance Agency, Homeownership Finance Bonds, Mortgage-Backed Securities Program, Series 2011D, 4.700%, 1/01/31 | 7/21 at 100.00 | | Aaa | | | 246,125 | |
| | 180 | | Minnesota Housing Finance Agency, Residential Housing Finance Bonds, Series 2008B, 5.650%, 7/01/33 (Alternative Minimum Tax) | 1/18 at 100.00 | | AA+ | | | 186,926 | |
| | 625 | | Minnesota Housing Finance Agency, Residential Housing Finance Bonds, Series 2009E, 5.100%, 1/01/40 | 7/19 at 100.00 | | AA+ | | | 660,719 | |
| | 85 | | Minnesota Housing Finance Agency, Residential Housing Finance Bonds, Series 2013C, 3.900%, 7/01/43 | 1/23 at 100.00 | | AA+ | | | 87,892 | |
| | 70 | | Minnesota Housing Finance Agency, Residential Housing Finance Bonds, Series 2014C, 3.500%, 1/01/32 | 7/24 at 100.00 | | AA+ | | | 73,625 | |
| | 250 | | Minnesota Housing Finance Agency, Residential Housing Finance Bonds, Series 2015F, 3.300%, 7/01/29 | 7/25 at 100.00 | | AA+ | | | 262,423 | |
| | 1,574 | | Total Housing/Single Family | | | | | | 1,659,786 | |
| | | | Industrials – 2.5% (1.7% of Total Investments) | | | | | | | |
| | | | Minneapolis, Minnesota, Limited Tax Supported Development Revenue Bonds, Common Bond Fund Series 2013-1: | | | | | | | |
| | 1,400 | | 4.500%, 6/01/33 | 6/21 at 100.00 | | A+ | | | 1,519,182 | |
| | 600 | | 4.750%, 6/01/39 | 6/21 at 100.00 | | A+ | | | 655,116 | |
| | 2,000 | | Total Industrials | | | | | | 2,174,298 | |
| | | | Long-Term Care – 16.8% (11.3% of Total Investments) | | | | | | | |
| | 805 | | Anoka, Minnesota, Health Care and Housing Facility Revenue Bonds, The Homestead at Anoka, Inc. Project, Series 2014, 5.125%, 11/01/49 | 11/24 at 100.00 | | N/R | | | 835,775 | |
| | 380 | | Center City, Minnesota, Health Care Facilities Revenue Bonds, Hazelden Betty Ford Foundation Project, Series 2014, 4.000%, 11/01/39 | 11/24 at 100.00 | | A3 | | | 404,723 | |
| | 500 | | Center City, Minnesota, Health Care Facilities Revenue Bonds, Hazelden Foundation Project, Series 2011, 5.000%, 11/01/41 | 11/19 at 100.00 | | A3 | | | 536,015 | |
| | 875 | | Cold Spring, Minnesota, Health Care Facilities Revenue Bonds, Assumption Home, Inc., Refunding Series 2013, 5.200%, 3/01/43 | 7/20 at 100.00 | | N/R | | | 903,473 | |
| | | | Columbus, Minnesota, Senior Housing Revenue Bonds, Richfield Senior Housing, Inc., Refunding Series 2015: | | | | | | | |
| | 175 | | 5.250%, 1/01/40 | 1/23 at 100.00 | | N/R | | | 180,339 | |
| | 850 | | 5.250%, 1/01/46 | 1/23 at 100.00 | | N/R | | | 868,692 | |
| NMS | Nuveen Minnesota Municipal Income Fund | |
| | Portfolio of Investments (continued) | May 31, 2016 |
| | Principal | | | Optional Call | | | | | | |
| | Amount (000) | | Description (1) | Provisions (2) | | Ratings (3) | | | Value | |
| | | | Long-Term Care (continued) | | | | | | | |
| $ | 405 | | Cottage Grove, Minnesota, Senior Housing Revenue Bonds, PHS/Cottage Grove, Inc., Project, Series 2006A, 5.000%, 12/01/31 | 8/16 at 100.00 | | N/R | | $ | 405,369 | |
| | 700 | | Lake Crystal, Minnesota, Housing and Health Care Revenue Bonds, Ecumen Second Century & Owatonna Senior Living Project, Refunding Series 2014A, 4.500%, 9/01/44 (Mandatory put 9/01/24) | 9/18 at 100.00 | | N/R | | | 708,624 | |
| | 1,350 | | Minneapolis, Minnesota, Revenue Bonds, Walker Minneapolis Campus Project, Refunding Series 2012, 4.750%, 11/15/28 | 11/22 at 100.00 | | N/R | | | 1,408,644 | |
| | 750 | | Minneapolis, Minnesota, Senior Housing and Healthcare Revenue Bonds, Ecumen Abiitan Mill City Project, Series 2015, 5.250%, 11/01/45 | 5/23 at 100.00 | | N/R | | | 773,865 | |
| | 1,000 | | Moorhead Economic Development Authority, Minnesota, Multifamily Revenue Bonds, Eventide Senior Housing, Series 2006A, 5.150%, 6/01/29 | 8/16 at 100.00 | | N/R | | | 1,000,980 | |
| | 660 | | Owatonna, Minnesota, Housing and Health Care Revenue Bonds, Ecumen Second Century & Owatonna Senior Living Project, Refunding Series 2014B, 4.500%, 9/01/44 (Mandatory put 9/01/24) | 9/18 at 100.00 | | N/R | | | 668,131 | |
| | 1,300 | | Saint Louis Park, Minnesota, Health Care Facilities Revenue Bonds, Mount Olivet Careview Home Project, Series 2016B, 2.000%, 6/01/49 (4) | 6/26 at 100.00 | | N/R | | | 1,299,623 | |
| | 500 | | Saint Paul Housing and Redevelopment Authority Minnesota, Senior Housing and Health Care Revenue Bonds, Episcopal Homes Project, Series 2013, 5.125%, 5/01/48 | 5/23 at 100.00 | | N/R | | | 525,405 | |
| | 1,231 | | Saint Paul Housing and Redevelopment Authority, Minnesota, Nursing Home Revenue Bonds, Episcopal Homes of Minnesota, Series 2006, 5.630%, 10/01/33 | 4/17 at 100.00 | | N/R | | | 1,247,150 | |
| | 900 | | Saint Paul Housing and Redevelopment Authority, Minnesota, Revenue Bonds, Rossy & Richard Shaller Family Sholom East Campus, Series 2007A, 5.250%, 10/01/42 | 10/17 at 100.00 | | N/R | | | 912,366 | |
| | 100 | | Saint Paul Housing and Redevelopment Authority, Minnesota, Senior Housing and Health Care Revenue Bonds, Episcopal Homes Project, Refunding Series 2012A, 5.150%, 11/01/42 | No Opt. Call | | N/R | | | 103,663 | |
| | 585 | | Sauk Rapids, Minnesota, Health Care and Housing Facilities Revenue Bonds, Good Shepherd Lutheran Home, Refunding Series 2013, 5.125%, 1/01/39 | 1/23 at 100.00 | | N/R | | | 604,130 | |
| | 330 | | Wayzata, Minnesota, Senior Housing Revenue Bonds, Folkestone Senior Living Community, Series 2012A, 6.000%, 5/01/47 | 5/19 at 102.00 | | N/R | | | 357,743 | |
| | 1,000 | | West St. Paul, Minnesota, Health Care Facilities Revenue Bonds, Walker Thompson Hill LLC Project, Series 2011A, 7.000%, 9/01/46 | 9/19 at 100.00 | | N/R | | | 1,064,090 | |
| | 14,396 | | Total Long-Term Care | | | | | | 14,808,800 | |
| | | | Materials – 2.6% (1.8% of Total Investments) | | | | | | | |
| | 2,650 | | Saint Paul Port Authority, Minnesota, Solid Waste Disposal Revenue Bonds, Gerdau Saint Paul Steel Mill Project, Series 2012-7, 4.500%, 10/01/37 (Alternative Minimum Tax) | 10/22 at 100.00 | | BBB– | | | 2,304,414 | |
| | | | Tax Obligation/General – 16.5% (11.1% of Total Investments) | | | | | | | |
| | 300 | | Circle Pines Independent School District 12, Centennial, Minnesota, General Obligation Bonds, School Building Series 2015A, 0.000%, 2/01/35 | 2/25 at 67.23 | | AA+ | | | 159,168 | |
| | 1,000 | | Cloquet Independent School District 94, Carlton and Saint Louis Counties, Minnesota, General Obligation Bonds, School Building Series 2015B, 4.000%, 2/01/36 | 2/25 at 100.00 | | Aa2 | | | 1,090,140 | |
| | 1,000 | | Delano Independent School District 879, Minnesota, General Obligation Bonds, Refunding School Building Series 2016A, 3.000%, 2/01/35 | 2/26 at 100.00 | | Aa2 | | | 1,011,420 | |
| | 700 | | Forest Lake Independent School District 831, Washington County, Minnesota, General Obligation Bonds, School Building Series 2016A, 3.125%, 2/01/39 | 2/26 at 100.00 | | AA+ | | | 699,755 | |
| | 620 | | Fridley Independent School District 14, Anoka County, Minnesota, General Obligation Bonds, Alternative Facility, Series 2016B, 5.000%, 2/01/27 | 2/26 at 100.00 | | Aa2 | | | 785,069 | |
| | 1,000 | | Hennepin County, Minnesota, General Obligation Bonds, Refunding Series 2008D, 5.000%, 12/01/25 | 12/16 at 100.00 | | AAA | | | 1,022,860 | |
| | | | Hermantown Independent School District 700, Minnesota, General Obligation Bonds, School Building Series 2015A: | | | | | | | |
| | 940 | | 0.000%, 2/01/37 | No Opt. Call | | Aa2 | | | 397,329 | |
| | 1,075 | | 0.000%, 2/01/38 | No Opt. Call | | Aa2 | | | 433,752 | |
| | Principal | | | Optional Call | | | | | | |
| | Amount (000) | | Description (1) | Provisions (2) | | Ratings (3) | | | Value | |
| | | | Tax Obligation/General (continued) | | | | | | | |
| $ | 1,500 | | Independent School District 2310(Sibley East), Minnesota, General Obligation School Building Bonds, Series 2015A, 4.000%, 2/01/40 | 2/25 at 100.00 | | Aa2 | | $ | 1,623,210 | |
| | 1,500 | | Mankato Independent School District 77, Minnesota, General Obligation Bonds, School Building Series 2014A, 4.000%, 2/01/30 | 2/24 at 100.00 | | AA+ | | | 1,695,135 | |
| | 1,000 | | Minneapolis, Minnesota, Limited Tax Supported Development Revenue Bonds, Common Bond Fund Series 2007-2A, 5.125%, 6/01/22 (Alternative Minimum Tax) | 6/17 at 100.00 | | A+ | | | 1,030,500 | |
| | 1,000 | | Moorhead Independent School District 152, Clay County, Minnesota, General Obligation Bonds, Refunding School Building Series 2016A, 3.000%, 2/01/36 | 2/26 at 100.00 | | Aa2 | | | 1,008,690 | |
| | 350 | | Saint Cloud Independent School District 742, Stearns County, Minnesota, General Obligation Bonds, Series 2015A, 3.125%, 2/01/34 | 2/25 at 100.00 | | Aa2 | | | 362,026 | |
| | 1,000 | | Saint James Independent School District 840, Minnesota, General Obligation Bonds, School Building Series 2015B, 4.000%, 2/01/45 | 2/26 at 100.00 | | AA+ | | | 1,099,200 | |
| | 1,970 | | Wayzata Independent School District 284, Hennepin County, Minnesota, General Obligation Bonds, School Building Series 2014A, 3.500%, 2/01/31 | 2/23 at 100.00 | | AAA | | | 2,106,482 | |
| | 14,955 | | Total Tax Obligation/General | | | | | | 14,524,736 | |
| | | | Tax Obligation/Limited – 12.7% (8.5% of Total Investments) | | | | | | | |
| | 1,000 | | Anoka-Hennepin Independent School District 11, Minnesota, Certificates of Participation, Series 2015A, 4.000%, 2/01/41 | 2/23 at 100.00 | | A+ | | | 1,064,340 | |
| | 1,600 | | Duluth Independent School District 709, Minnesota, Certificates of Participation, Capital Appreciation Series 2012A, 0.000%, 2/01/28 – AGM Insured | 2/22 at 77.70 | | Aa2 | | | 1,075,184 | |
| | 125 | | Minneapolis, Minnesota, Tax Increment Revenue Bonds, Grant Park Project, Refunding Series 2015, 4.000%, 3/01/30 | 3/23 at 100.00 | | N/R | | | 127,815 | |
| | 500 | | Minneapolis, Minnesota, Tax Increment Revenue Bonds, Ivy Tower Project, Series 2015, 5.000%, 3/01/29 | 3/24 at 100.00 | | N/R | | | 540,855 | |
| | 2,230 | | Minnesota Housing Finance Agency, Nonprofit Housing Bonds, State Appropriation Series 2011, 5.000%, 8/01/31 | 8/21 at 100.00 | | AA | | | 2,561,512 | |
| | 520 | | Moorhead, Minnesota, Golf Course Revenue Refunding Bonds, Series 1998B, 5.875%, 12/01/21 | 8/16 at 100.00 | | N/R | | | 520,218 | |
| | 1,000 | | Northeast Metropolitan Intermediate School District 916, White Bear Lake, Minnesota, Certificates of Participation, Series 2015A, 3.750%, 2/01/36 | 2/25 at 100.00 | | A1 | | | 1,055,640 | |
| | 750 | | Northeast Metropolitan Intermediate School District 916, White Bear Lake, Minnesota, Certificates of Participation, Series 2015B, 4.000%, 2/01/42 | 2/25 at 100.00 | | A1 | | | 800,340 | |
| | | | Saint Paul Housing and Redevelopment Authority, Minnesota, Multifamily Housing Revenue Bonds, 2700 University at Westgate Station, Series 2015B: | | | | | | | |
| | 455 | | 4.875%, 4/01/30 | 4/23 at 100.00 | | N/R | | | 468,286 | |
| | 895 | | 5.250%, 4/01/43 | 4/23 at 100.00 | | N/R | | | 915,030 | |
| | 500 | | Saint Paul Housing and Redevelopment Authority, Minnesota, Recreational Facility Lease Revenue Bonds, Jimmy Lee Recreational Center, Series 2008, 5.000%, 12/01/32 | 12/17 at 100.00 | | AA+ | | | 529,510 | |
| | | | Saint Paul Housing and Redevelopment Authority, Minnesota, Upper Landing Project Tax Increment Revenue Refunding Bonds, Series 2012: | | | | | | | |
| | 450 | | 5.000%, 9/01/26 | No Opt. Call | | N/R | | | 480,141 | |
| | 130 | | 5.000%, 3/01/29 | No Opt. Call | | N/R | | | 137,998 | |
| | 800 | | Saint Paul, Minnesota, Sales Tax Revenue Bonds, Series 2014G, 3.750%, 11/01/33 | 11/24 at 100.00 | | A+ | | | 848,600 | |
| | 10,955 | | Total Tax Obligation/Limited | | | | | | 11,125,469 | |
| | | | Transportation – 1.3% (0.8% of Total Investments) | | | | | | | |
| | 225 | | Minneapolis-St. Paul Metropolitan Airports Commission, Minnesota, Airport Revenue Bonds, Subordinate Lien Series 2010D, 4.000%, 1/01/23 (Alternative Minimum Tax) | 1/20 at 100.00 | | A+ | | | 240,806 | |
| | 800 | | St Paul Housing and Redevelopment Authority, Minnesota, Parking Revenue Bonds, Parking Facilities Project, Refunding Series 2010A, 5.000%, 8/01/30 | 8/18 at 102.00 | | A+ | | | 876,384 | |
| | 1,025 | | Total Transportation | | | | | | 1,117,190 | |
| NMS | Nuveen Minnesota Municipal Income Fund | |
| | Portfolio of Investments (continued) | May 31, 2016 |
| | Principal | | | Optional Call | | | | | | |
| | Amount (000) | | Description (1) | Provisions (2) | | Ratings (3) | | | Value | |
| | | | U.S. Guaranteed – 16.1% (10.8% of Total Investments) (5) | | | | | | | |
| $ | 1,600 | | Burnsville Independent School District 191, Dakota and Scott Counties, Minnesota, General Obligation Bonds, Series 2008A, 4.750%, 2/01/24 (Pre-refunded 2/01/18) | 2/18 at 100.00 | | Aa2 (5) | | $ | 1,701,872 | |
| | 85 | | Minneapolis, Minnesota, Health Care System Revenue Bonds, Fairview Health Services, Series 2008B, 6.500%, 11/15/38 (Pre-refunded
11/15/18) – AGC Insured | 11/18 at 100.00 | | AA (5) | | | 96,624 | |
| | 2,675 | | Minneapolis, Minnesota, Health Care System Revenue Bonds, Fairview Hospital and Healthcare Services, Series 2008A, 6.625%, 11/15/28 (Pre-refunded 11/15/18) | 11/18 at 100.00 | | A+ (5) | | | 3,048,912 | |
| | 1,000 | | Minneapolis, Minnesota, Revenue Bonds, National Marrow Donor Program Project, Series 2010, 4.250%, 8/01/20 (Pre-refunded 8/01/18) | 8/18 at 100.00 | | BBB+ (5) | | | 1,073,390 | |
| | 1,000 | | Minnesota Higher Education Facilities Authority, Revenue Bonds, University of Saint Thomas, Series 2009-6X, 5.250%, 4/01/39 (Pre-refunded 4/01/17) | 4/17 at 100.00 | | A2 (5) | | | 1,038,370 | |
| | 2,630 | | Minnesota Housing Finance Agency, Residential Housing Finance Bonds, Series 2007D, 4.700%, 7/01/27 (Pre-refunded 7/01/16) (Alternative Minimum Tax) | 7/16 at 100.00 | | AA+ (5) | | | 2,633,629 | |
| | 10 | | Minnesota Housing Finance Agency, Residential Housing Finance Bonds, Series 2007-I, 4.850%, 7/01/38 (Pre-refunded 7/01/16) (Alternative Minimum Tax) | 7/16 at 100.00 | | AA+ (5) | | | 10,012 | |
| | 470 | | Saint Cloud, Minnesota, Health Care Revenue Bonds, CentraCare Health System Project, Series 2010A, 5.125%, 5/01/30 (Pre-refunded 5/01/20) | 5/20 at 100.00 | | N/R (5) | | | 542,878 | |
| | 2,215 | | Saint Louis Park, Minnesota, Health Care Facilities Revenue Bonds, Park Nicollet Health Services, Refunding Series 2009, 5.750%, 7/01/39 (Pre-refunded 7/01/19) | 7/19 at 100.00 | | Aaa | | | 2,541,314 | |
| | 1,430 | | Saint Paul Housing and Redevelopment Authority, Minnesota, Health Care Facility Revenue Bonds, HealthPartners Obligated Group, Series 2006, 5.250%, 5/15/36 (Pre-refunded 11/15/16) | 11/16 at 100.00 | | Aaa | | | 1,460,759 | |
| | 13,115 | | Total U.S. Guaranteed | | | | | | 14,147,760 | |
| | | | Utilities – 18.2% (12.2% of Total Investments) | | | | | | | |
| | 500 | | Minnesota Municipal Power Agency, Electric Revenue Bonds, Refunding Series 2014A, 4.000%, 10/01/33 | 10/24 at 100.00 | | A2 | | | 540,825 | |
| | | | Northern Municipal Power Agency, Minnesota, Electric System Revenue Bonds, Refunding Series 2008A: | | | | | | | |
| | 300 | | 5.000%, 1/01/18 – AGC Insured | No Opt. Call | | AA | | | 319,290 | |
| | 1,000 | | 5.000%, 1/01/20 – AGC Insured | 1/18 at 100.00 | | AA | | | 1,059,740 | |
| | 1,000 | | 5.000%, 1/01/21 – AGC Insured | 1/18 at 100.00 | | AA | | | 1,060,880 | |
| | | | Southern Minnesota Municipal Power Agency, Power Supply System Revenue Bonds, Series 1994A: | | | | | | | |
| | 8,600 | | 0.000%, 1/01/19 – NPFG Insured | No Opt. Call | | AA– | | | 8,273,284 | |
| | 1,100 | | 0.000%, 1/01/23 – NPFG Insured | No Opt. Call | | AA– | | | 965,866 | |
| | 3,070 | | 0.000%, 1/01/24 – NPFG Insured | No Opt. Call | | AA– | | | 2,629,087 | |
| | 135 | | 0.000%, 1/01/26 – NPFG Insured | No Opt. Call | | AA– | | | 108,895 | |
| | 1,000 | | Western Minnesota Municipal Power Agency, Power Supply Revenue Bonds, Series 2014A, 4.000%, 1/01/40 | 1/24 at 100.00 | | Aa3 | | | 1,085,730 | |
| | 16,705 | | Total Utilities | | | | | | 16,043,597 | |
| | Principal | | | Optional Call | | | | | | |
| | Amount (000) | | Description (1) | Provisions (2) | | Ratings (3) | | | Value | |
| | | | Water and Sewer – 5.6% (3.8% of Total Investments) | | | | | | | |
| | | | Buffalo, Minnesota, Water and Sewer Revenue Bonds, Series 2009B: | | | | | | | |
| $ | 1,800 | | 0.000%, 10/01/21 | 4/19 at 89.45 | | AA+ | | $ | 1,574,172 | |
| | 1,800 | | 0.000%, 10/01/22 | 4/19 at 85.14 | | AA+ | | | 1,494,306 | |
| | 1,800 | | 0.000%, 10/01/23 | 4/19 at 80.85 | | AA+ | | | 1,414,548 | |
| | 415 | | Guam Government Waterworks Authority, Water and Wastewater System Revenue Bonds, Series 2016, 5.000%, 1/01/46 | 7/26 at 100.00 | | A– | | | 480,873 | |
| | 5,815 | | Total Water and Sewer | | | | | | 4,963,899 | |
| $ | 127,880 | | Total Long-Term Investments (cost $120,710,667) | | | | | | 130,900,918 | |
| | | | Variable Rate MuniFund Term Preferred Shares, at Liquidation Preference – (50.1)% (6) | | | | | | (44,100,000 | ) |
| | | | Other Assets Less Liabilities – 1.3% | | | | | | 1,140,894 | |
| | | | Net Assets Applicable to Common Shares – 100% | | | | | $ | 87,941,812 | |
| (1) | All percentages shown in the Portfolio of Investments are based on net assets applicable to common shares unless otherwise noted. |
| (2) | Optional Call Provisions (not covered by the report of independent registered public accounting firm): Dates (month and year) and prices of the earliest optional call or redemption. There may be other call provisions at varying prices at later dates. Certain mortgage-backed securities may be subject to periodic principal paydowns. |
| (3) | Ratings (not covered by the report of independent registered public accounting firm): Using the highest of Standard & Poor's Group ("Standard & Poor's"), Moody's Investors Service, Inc. ("Moody's") or Fitch, Inc. ("Fitch") rating. Ratings below BBB by Standard & Poor's, Baa by Moody's or BBB by Fitch are considered to be below investment grade. Holdings designated N/R are not rated by any of these national rating agencies. |
| (4) | Step-up coupon. The rate shown is the coupon as of the end of the reporting period. |
| (5) | Backed by an escrow or trust containing sufficient U.S. Government or U.S. Government agency securities, which ensure the timely payment of principal and interest. Certain bonds backed by U.S. Government or agency securities are regarded as having an implied rating equal to the rating of such securities. |
| (6) | Variable Rate MuniFund Term Preferred Shares, at Liquidation Preference as a percentage of Total Investments is 33.7%. |
See accompanying notes to financial statements.
| NOM | | |
| | Nuveen Missouri Premium Income Municipal Fund | |
| | Portfolio of Investments | May 31, 2016 |
| | Principal | | | Optional Call | | | | | | |
| | Amount (000) | | Description (1) | Provisions (2) | | Ratings (3) | | | Value | |
| | | | LONG-TERM INVESTMENTS – 157.7% (100.0% of Total Investments) | | | | | | | |
| | | | MUNICIPAL BONDS – 157.7% (100.0% of Total Investments) | | | | | | | |
| | | | Consumer Staples – 4.0% (2.5% of Total Investments) | | | | | | | |
| $ | 1,055 | | Missouri Development Finance Board, Solid Waste Disposal Revenue Bonds, Procter and Gamble Inc., Series 1999, 5.200%, 3/15/29 (Alternative Minimum Tax) | No Opt. Call | | AA– | | $ | 1,346,475 | |
| | | | Education and Civic Organizations – 23.4% (14.8% of Total Investments) | | | | | | | |
| | 300 | | Curators of the University of Missouri, System Facilities Revenue Bonds, Refunding Series 2014A, 4.000%, 11/01/33 | 11/24 at 100.00 | | AA+ | | | 337,842 | |
| | 250 | | Lincoln University, Missouri, Auxiliary System Revenue Bonds, Series 2007, 5.125%, 6/01/37 – AGC Insured | 6/17 at 100.00 | | AA | | | 260,173 | |
| | 410 | | Missouri Health and Educational Facilities Authority, Educational Facilities Revenue Bonds, Kansas City University of Medicine and Biosciences, Series 2013A, 5.000%, 6/01/33 | 6/23 at 100.00 | | A1 | | | 463,362 | |
| | 750 | | Missouri Health and Educational Facilities Authority, Educational Facilities Revenue Bonds, Saint Louis College of Pharmacy, Series 2013, 5.500%, 5/01/43 | 5/23 at 100.00 | | BBB+ | | | 844,853 | |
| | 600 | | Missouri Health and Educational Facilities Authority, Educational Facilities Revenue Bonds, Southwest Baptist University Project, Series 2012, 5.000%, 10/01/33 | 10/22 at 100.00 | | BBB– | | | 651,090 | |
| | 725 | | Missouri Health and Educational Facilities Authority, Educational Facilities Revenue Bonds, University of Central Missouri, Series 2013C-2, 5.000%, 10/01/34 | 10/23 at 100.00 | | A+ | | | 846,264 | |
| | 630 | | Missouri Health and Educational Facilities Authority, Revenue Bonds, A.T. Still University of Health Sciences, Series 2011, 5.250%, 10/01/41 | 10/21 at 100.00 | | A– | | | 726,176 | |
| | 510 | | Missouri Health and Educational Facilities Authority, Revenue Bonds, A.T. Still University of Health Sciences, Series 2014, 5.000%, 10/01/39 | 10/23 at 100.00 | | A– | | | 588,280 | |
| | 700 | | Missouri Health and Educational Facilities Authority, Revenue Bonds, Rockhurst University, Series 2011A, 6.500%, 10/01/35 | 10/18 at 103.00 | | BBB– | | | 775,271 | |
| | 1,000 | | Missouri Health and Educational Facilities Authority, Revenue Bonds, Saint Louis University, Series 2015A, 4.000%, 10/01/42 | 10/25 at 100.00 | | AA– | | | 1,086,790 | |
| | 550 | | Missouri Health and Educational Facilities Authority, Revenue Bonds, Washington University, Series 2011B, 5.000%, 11/15/37 | 11/21 at 100.00 | | AAA | | | 639,507 | |
| | 600 | | Missouri Health and Educational Facilities Authority, Revenue Bonds, Webster University, Series 2011, 5.000%, 4/01/36 | 4/21 at 100.00 | | A2 | | | 674,862 | |
| | 7,025 | | Total Education and Civic Organizations | | | | | | 7,894,470 | |
| | | | Health Care – 37.0% (23.5% of Total Investments) | | | | | | | |
| | 525 | | Cape Girardeau County Industrial Development Authority, Missouri, Health Facilities Revenue Bonds, Saint Francis Medical Center, Series 2009A, 5.750%, 6/01/39 | 6/19 at 100.00 | | AA– | | | 585,953 | |
| | | | Cape Girardeau County Industrial Development Authority, Missouri, Health Facilities Revenue Bonds, Southeast Missouri Hospital Association, Series 2007: | | | | | | | |
| | 760 | | 5.000%, 6/01/27 | 6/17 at 100.00 | | B | | | 751,146 | |
| | 560 | | 5.000%, 6/01/36 | 6/17 at 100.00 | | B | | | 534,128 | |
| | 930 | | Cass County, Missouri, Hospital Revenue Bonds, Series 2007, 5.625%, 5/01/38 | 11/16 at 100.00 | | BBB– | | | 940,360 | |
| | 480 | | Clinton County Industrial Development Authority, Missouri, Revenue Bonds, Cameron Regional Medical Center, Series 2007, 5.000%, 12/01/37 | 12/17 at 100.00 | | N/R | | | 485,597 | |
| | 200 | | Joplin Industrial Development Authority, Missouri, Health Facilities Revenue Bonds, Freeman Health System, Series 2011, 5.500%, 2/15/31 | 2/21 at 100.00 | | A– | | | 226,234 | |
| | 315 | | Joplin Industrial Development Authority, Missouri, Health Facilities Revenue Bonds, Freeman Health System, Series 2015, 5.000%, 2/15/35 | 2/24 at 100.00 | | A– | | | 363,072 | |
| | Principal | | | Optional Call | | | | | | |
| | Amount (000) | | Description (1) | Provisions (2) | | Ratings (3) | | | Value | |
| | | | Health Care (continued) | | | | | | | |
| $ | 250 | | Missouri Health and Educational Facilities Authority, Health Facilities Revenue Bonds, BJC Health System, Series 2015A, 4.000%, 1/01/45 | No Opt. Call | | AA | | $ | 267,228 | |
| | 540 | | Missouri Health and Educational Facilities Authority, Health Facilities Revenue Bonds, Capital Region Medical Center, Series 2011, 5.000%, 11/01/27 | 11/20 at 100.00 | | A3 | | | 606,965 | |
| | 1,730 | | Missouri Health and Educational Facilities Authority, Health Facilities Revenue Bonds, CoxHealth, Series 2013A, 5.000%, 11/15/44 | 11/23 at 100.00 | | A2 | | | 1,970,124 | |
| | 415 | | Missouri Health and Educational Facilities Authority, Health Facilities Revenue Bonds, CoxHealth, Series 2015A, 5.000%, 11/15/32 | 11/25 at 100.00 | | A2 | | | 491,704 | |
| | 335 | | Missouri Health and Educational Facilities Authority, Health Facilities Revenue Bonds, Heartland Regional Medical Center, Series 2012, 5.000%, 2/15/37 | 2/22 at 100.00 | | A1 | | | 380,312 | |
| | 290 | | Missouri Health and Educational Facilities Authority, Health Facilities Revenue Bonds, Mercy Health, Series 2012, 4.000%, 11/15/42 | No Opt. Call | | AA– | | | 306,379 | |
| | 500 | | Missouri Health and Educational Facilities Authority, Health Facilities Revenue Bonds, Saint Luke's Episcopal and Presbyterian Hospitals, Series 2011, 5.000%, 12/01/25 | 12/21 at 100.00 | | A+ | | | 581,740 | |
| | 500 | | Missouri Health and Educational Facilities Authority, Health Facilities Revenue Bonds, SSM Health Care, Series 2014A, 5.000%, 6/01/31 | 6/24 at 100.00 | | AA– | | | 594,315 | |
| | 2,000 | | Missouri Health and Educational Facilities Authority, Health Facility Revenue Bonds, Saint Luke's Health System, Series 2010A, 5.000%, 11/15/30 | 11/20 at 100.00 | | A+ | | | 2,254,080 | |
| | 720 | | Saline County Industrial Development Authority, Missouri, Health Facilities Revenue Bonds, John Fitzgibbon Memorial Hospital Inc., Series 2010, 5.600%, 12/01/28 | 12/20 at 100.00 | | BBB– | | | 809,647 | |
| | 350 | | St. Louis County Industrial Development Authority, Missouri, Healthcare Facilities Revenue Bonds, Ranken-Jordan Project, Refunding Series 2007, 5.000%, 11/15/27 | 11/16 at 100.00 | | N/R | | | 351,180 | |
| | 11,400 | | Total Health Care | | | | | | 12,500,164 | |
| | | | Housing/Single Family – 0.6% (0.4% of Total Investments) | | | | | | | |
| | 155 | | Missouri Housing Development Commission, Single Family Mortgage Revenue Bonds, Homeownership Loan Program, Series 2007A-1, 4.700%, 9/01/27 (Alternative Minimum Tax) | 9/16 at 100.00 | | AA+ | | | 155,682 | |
| | 60 | | Missouri Housing Development Commission, Single Family Mortgage Revenue Bonds, Homeownership Loan Program, Series 2007C-1, 4.800%, 9/01/38 (Alternative Minimum Tax) | 3/17 at 100.00 | | AA+ | | | 60,003 | |
| | 215 | | Total Housing/Single Family | | | | | | 215,685 | |
| | | | Long-Term Care – 14.4% (9.2% of Total Investments) | | | | | | | |
| | 250 | | Bridgeton Industrial Development Authority, Missouri, Senior Housing Revenue Bonds, The Sarah Community Project, Series 2013, 4.500%, 5/01/28 | 5/18 at 100.00 | | N/R | | | 252,093 | |
| | 500 | | Joplin Industrial Development Authority, Missouri, Revenue Bonds, Christian Homes Inc., Series 2007F, 5.750%, 5/15/31 | 5/17 at 100.00 | | BBB– | | | 508,630 | |
| | 475 | | Lees Summit Industrial Development Authority, Missouri, Revenue Bonds, John Knox Village Obligated Group, Series 2007A, 5.125%, 8/15/32 | 8/17 at 100.00 | | BBB– | | | 486,756 | |
| | 250 | | Lees Summit Industrial Development Authority, Missouri, Revenue Bonds, John Knox Village Obligated Group, Series 2014A, 5.250%, 8/15/39 | No Opt. Call | | BBB– | | | 278,430 | |
| | 250 | | Missouri Health and Educational Facilities Authority, Revenue Bonds, Lutheran Senior Services Projects, Series 2011, 6.000%, 2/01/41 | 2/21 at 100.00 | | BBB+ | | | 279,475 | |
| | | | Missouri Health and Educational Facilities Authority, Revenue Bonds, Lutheran Senior Services Projects, Series 2014A: | | | | | | | |
| | 250 | | 5.000%, 2/01/35 | 2/24 at 100.00 | | BBB+ | | | 277,053 | |
| | 500 | | 5.000%, 2/01/44 | 2/24 at 100.00 | | BBB+ | | | 551,265 | |
| | 190 | | Missouri Health and Educational Facilities Authority, Revenue Bonds, Lutheran Senior Services Projects, Series 2016A, 5.000%, 2/01/46 | 2/26 at 100.00 | | BBB+ | | | 215,781 | |
| NOM | Nuveen Missouri Premium Income Municipal Fund | |
| | Portfolio of Investments (continued) | May 31, 2016 |
| | Principal | | | Optional Call | | | | | | |
| | Amount (000) | | Description (1) | Provisions (2) | | Ratings (3) | | | Value | |
| | | | Long-Term Care (continued) | | | | | | | |
| $ | 100 | | St. Louis County Industrial Development Authority, Missouri, Revenue Bonds, Friendship Village of Chesterfield, Series 2012, 5.000%, 9/01/42 | No Opt. Call | | BBB– | | $ | 105,844 | |
| | | | St. Louis County Industrial Development Authority, Missouri, Revenue Bonds, Friendship Village of Sunset Hills, Series 2012: | | | | | | | |
| | 250 | | 5.000%, 9/01/32 | No Opt. Call | | A– | | | 275,520 | |
| | 425 | | 5.000%, 9/01/42 | 9/22 at 100.00 | | A– | | | 462,353 | |
| | 430 | | St. Louis County Industrial Development Authority, Missouri, Revenue Bonds, Friendship Village of Sunset Hills, Series 2013A, 5.875%, 9/01/43 | 9/23 at 100.00 | | A– | | | 499,798 | |
| | 570 | | St. Louis County Industrial Development Authority, Missouri, Revenue Bonds, Friendship Village of West County, Series 2007A, 5.500%, 9/01/28 | 9/17 at 100.00 | | BBB– | | | 582,512 | |
| | 100 | | St. Louis County Industrial Development Authority, Missouri, Revenue Bonds, Saint Andrew's Resources for Seniors, Series 2015A, 5.125%, 12/01/45 | 12/25 at 100.00 | | N/R | | | 105,501 | |
| | 4,540 | | Total Long-Term Care | | | | | | 4,881,011 | |
| | | | Tax Obligation/General – 10.6% (6.7% of Total Investments) | | | | | | | |
| | 500 | | Branson Reorganized School District R-4, Taney County, Missouri, General Obligation Bonds, School Building Series 2012, 4.375%, 3/01/32 | 3/22 at 100.00 | | A+ | | | 546,540 | |
| | 500 | | Fort Zumwalt School District, Callaway County, Missouri, General Obligation Bonds, Refunding & Improvement Series 2015, 4.000%, 3/01/32 | 3/24 at 100.00 | | AA+ | | | 555,880 | |
| | 1,685 | | Independence School District, Jackson County, Missouri, General Obligation Bonds, Series 2010, 5.000%, 3/01/27 | 3/20 at 100.00 | | AA+ | | | 1,910,352 | |
| | 500 | | Jackson County Reorganized School District 4, Blue Springs, Missouri, General Obligation Bonds, School Building Series 2013A, 5.000%, 3/01/31 | 3/21 at 100.00 | | AA | | | 574,165 | |
| | 3,185 | | Total Tax Obligation/General | | | | | | 3,586,937 | |
| | | | Tax Obligation/Limited – 22.2% (14.1% of Total Investments) | | | | | | | |
| | 910 | | Bi-State Development Agency of the Missouri-Illinois Metropolitan District, Mass Transit Sales Tax Appropriation Bonds, Refunding Combined Lien Series 2013A, 5.000%, 10/01/33 | 10/22 at 100.00 | | AA+ | | | 1,060,541 | |
| | 350 | | Blue Springs, Missouri, Special Obligation Tax Increment Bonds, Adams Farm Project, Special Districts Refunding & Improvement Series 2015A, 4.750%, 6/01/30 | 6/24 at 100.00 | | N/R | | | 359,160 | |
| | 315 | | Fulton, Missouri, Tax Increment Revenue Bonds, Fulton Commons Redevelopment Project, Series 2006, 5.000%, 6/01/28 | 6/16 at 100.00 | | N/R | | | 282,571 | |
| | 430 | | Government of Guam, Business Privilege Tax Bonds, Series 2012B-1, 5.000%, 1/01/42 | 1/22 at 100.00 | | A | | | 476,698 | |
| | | | Howard Bend Levee District, St. Louis County, Missouri, Levee District Improvement Bonds, Series 2013B: | | | | | | | |
| | 180 | | 4.875%, 3/01/33 | 3/23 at 100.00 | | BBB+ | | | 192,744 | |
| | 115 | | 5.000%, 3/01/38 | 3/23 at 100.00 | | BBB+ | | | 123,001 | |
| | 485 | | Jackson County, Missouri, Special Obligation Bonds, Truman Medical Center Project, Series 2011B, 4.350%, 12/01/23 | 12/21 at 100.00 | | Aa3 | | | 549,146 | |
| | 300 | | Kansas City Industrial Development Authority, Missouri, Downtown Redevelopment District Revenue Bonds, Series 2011A, 5.000%, 9/01/32 | 9/21 at 100.00 | | AA– | | | 336,204 | |
| | 475 | | Kansas City Tax Increment Financing Commission, Missouri, Tax Increment Revenue Bonds, Briarcliff West Project, Series 2006A, 5.400%, 6/01/24 | 6/16 at 100.00 | | N/R | | | 475,822 | |
| | 100 | | Kansas City, Missouri, Special Obligation Bonds, Downtown Arena Project, Refunding & Improvement Series 2016E, 4.000%, 4/01/36 | 4/25 at 100.00 | | AA– | | | 107,465 | |
| | 325 | | Kansas City, Missouri, Special Obligation Bonds, Downtown Redevelopment District, Series 2014C, 5.000%, 9/01/33 | 9/23 at 100.00 | | AA– | | | 379,967 | |
| | Principal | | | Optional Call | | | | | | |
| | Amount (000) | | Description (1) | Provisions (2) | | Ratings (3) | | | Value | |
| | | | Tax Obligation/Limited (continued) | | | | | | | |
| $ | 245 | | Missouri Development Finance Board, Infrastructure Facilities Revenue Bonds, City of Branson – Branson Landing Project, Series 2015A, 4.000%, 6/01/34 | 6/23 at 100.00 | | A | | $ | 255,486 | |
| | 110 | | Monarch-Chesterfield Levee District, Saint Louis County, Missouri, Levee District Improvement Bonds, Series 1999, 5.750%, 3/01/19 – NPFG Insured | 9/16 at 100.00 | | AA– | | | 110,473 | |
| | 500 | | Osage Beach, Missouri, Tax Increment Revenue Bonds, Prewitts Point Transportation Development District, Series 2006, 5.000%, 5/01/23 | 8/16 at 100.00 | | N/R | | | 500,010 | |
| | 140 | | Plaza at Noah's Ark Community Improvement District, Saint Charles, Missouri, Tax Increment and Improvement District Revenue Bonds, Series 2015, 5.000%, 5/01/30 | 5/21 at 100.00 | | N/R | | | 146,593 | |
| | 1,500 | | Puerto Rico Sales Tax Financing Corporation, Sales Tax Revenue Bonds, Series 2007A, 0.000%, 8/01/41 – NPFG Insured | No Opt. Call | | AA– | | | 300,990 | |
| | 250 | | Saint Louis County Industrial Development Authority, Missouri, Sales Tax Revenue Bonds, Chesterfield Blue Valley Community Improvement District Project, Series 2014A, 5.250%, 7/01/44 | 7/24 at 100.00 | | N/R | | | 259,810 | |
| | 600 | | Springfield, Missouri, Special Obligation Bonds, Sewer System Improvements Project, Series 2015, 4.000%, 4/01/35 | 4/25 at 100.00 | | Aa2 | | | 653,532 | |
| | | | St. Joseph Industrial Development Authority, Missouri, Tax Increment Bonds, Shoppes at North Village Project, Series 2005A: | | | | | | | |
| | 340 | | 5.375%, 11/01/24 | 8/16 at 100.00 | | N/R | | | 340,316 | |
| | 400 | | 5.500%, 11/01/27 | 8/16 at 100.00 | | N/R | | | 400,368 | |
| | 200 | | St. Joseph Industrial Development Authority, Missouri, Tax Increment Bonds, Shoppes at North Village Project, Series 2005B, 5.500%, 11/01/27 | 8/16 at 100.00 | | N/R | | | 200,320 | |
| | 8,270 | | Total Tax Obligation/Limited | | | | | | 7,511,217 | |
| | | | Transportation – 12.2% (7.7% of Total Investments) | | | | | | | |
| | 335 | | Guam International Airport Authority, Revenue Bonds, Series 2013B, 5.500%, 10/01/33 – AGM Insured | 10/23 at 100.00 | | AA | | | 409,481 | |
| | 1,000 | | Saint Louis, Missouri, Airport Revenue Bonds, Lambert-St. Louis International Airport, Series 2005, 5.500%, 7/01/18 – NPFG Insured | No Opt. Call | | AA– | | | 1,094,070 | |
| | 2,500 | | Saint Louis, Missouri, Airport Revenue Bonds, Lambert-St. Louis International Airport, Series 2007A, 5.000%, 7/01/21 – AGM Insured | 7/17 at 100.00 | | AA | | | 2,609,696 | |
| | 3,835 | | Total Transportation | | | | | | 4,113,247 | |
| | | | U.S. Guaranteed – 10.1% (6.4% of Total Investments) (4) | | | | | | | |
| | 600 | | Carroll County Public Water Supply District 1, Missouri, Water System Revenue Bonds, Refunding Series 2009, 6.000%, 3/01/39 (Pre-refunded 3/01/18) | 3/18 at 100.00 | | A– (4) | | | 654,678 | |
| | 200 | | Metropolitan St. Louis Sewerage District, Missouri, Wastewater System Revenue Bonds, Series 2006C, 5.000%, 5/01/36 (Pre-refunded 5/01/17) – NPFG Insured | 5/17 at 100.00 | | AAA | | | 207,910 | |
| | 500 | | Missouri School Boards Association, Lease Participation Certificates, Clay County School District 53 Liberty, Series 2007, 5.250%, 3/01/27 (Pre-refunded 3/01/17) – AGM Insured | 3/17 at 100.00 | | AA (4) | | | 517,310 | |
| | 1,235 | | Springfield Public Building Corporation, Missouri, Lease Revenue Bonds, Jordan Valley Park Projects, Series 2000A, 6.125%, 6/01/21 – AMBAC Insured (ETM) | 8/16 at 100.00 | | N/R (4) | | | 1,437,824 | |
| | 500 | | St. Louis County, Missouri, GNMA Collateralized Mortgage Revenue Bonds, Series 1993D, 5.650%, 7/01/20 (Alternative Minimum Tax) (ETM) | No Opt. Call | | AA+ (4) | | | 580,480 | |
| | 3,035 | | Total U.S. Guaranteed | | | | | | 3,398,202 | |
| | | | Utilities – 14.5% (9.2% of Total Investments) | | | | | | | |
| | 2,965 | | Missouri Environmental Improvement and Energy Resources Authority, Water Facility Revenue Bonds, Missouri-American Water Company, Series 2006, 4.600%, 12/01/36 – BHAC Insured (Alternative Minimum Tax) (UB) (5) | 12/16 at 100.00 | | AA+ | | | 2,996,044 | |
| | 350 | | Missouri Joint Municipal Electric Utility Commission, Power Project Revenue Bonds, Plum Point Project, Refunding Series 2014A, 5.000%, 1/01/32 | 1/25 at 100.00 | | A | | | 413,945 | |
| NOM | Nuveen Missouri Premium Income Municipal Fund | |
| | Portfolio of Investments (continued) | May 31, 2016 |
| | Principal | | | Optional Call | | | | | | |
| | Amount (000) | | Description (1) | Provisions (2) | | Ratings (3) | | | Value | |
| | | | Utilities (continued) | | | | | | | |
| $ | 500 | | Missouri Joint Municipal Electric Utility Commission, Power Project Revenue Bonds, Plum Point Project, Refunding Series 2015A, 4.000%, 1/01/35 | 1/26 at 100.00 | | A | | $ | 550,560 | |
| | | | Missouri Joint Municipal Electric Utility Commission, Power Supply System Revenue Bonds, MoPEP Facilities, Series 2012: | | | | | | | |
| | 400 | | 5.000%, 1/01/32 | 1/21 at 100.00 | | A2 | | | 449,684 | |
| | 425 | | 5.000%, 1/01/37 | 1/21 at 100.00 | | A2 | | | 473,267 | |
| | 4,640 | | Total Utilities | | | | | | 4,883,500 | |
| | | | Water and Sewer – 8.7% (5.5% of Total Investments) | | | | | | | |
| | 2,000 | | Metropolitan St. Louis Sewerage District, Missouri, Wastewater System Revenue Bonds, Series 2012A, 5.000%, 5/01/42 | 5/22 at 100.00 | | AAA | | | 2,340,500 | |
| | 500 | | Missouri Environmental Improvement and Energy Resources Authority, Water Facility Revenue Bonds, Tri-County Water Authority, Series 2015, 5.000%, 1/01/40 | 1/25 at 100.00 | | Aa3 | | | 585,900 | |
| | 2,500 | | Total Water and Sewer | | | | | | 2,926,400 | |
| $ | 49,700 | | Total Long-Term Investments (cost $49,058,719) | | | | | | 53,257,308 | |
| | | | Floating Rate Obligations – (6.6)% | | | | | | (2,225,000 | ) |
| | | | Variable Rate MuniFund Term Preferred Shares, at Liquidation Preference – (53.3)% (6) | | | | | | (18,000,000 | ) |
| | | | Other Assets Less Liabilities – 2.2% | | | | | | 744,866 | |
| | | | Net Assets Applicable to Common Shares – 100% | | | | | $ | 33,777,174 | |
| (1) | All percentages shown in the Portfolio of Investments are based on net assets applicable to common shares unless otherwise noted. |
| (2) | Optional Call Provisions (not covered by the report of independent registered public accounting firm): Dates (month and year) and prices of the earliest optional call or redemption. There may be other call provisions at varying prices at later dates. Certain mortgage-backed securities may be subject to periodic principal paydowns. |
| (3) | Ratings (not covered by the report of independent registered public accounting firm): Using the highest of Standard & Poor's Group ("Standard & Poor's"), Moody's Investors Service, Inc. ("Moody's") or Fitch, Inc. ("Fitch") rating. Ratings below BBB by Standard & Poor's, Baa by Moody's or BBB by Fitch are considered to be below investment grade. Holdings designated N/R are not rated by any of these national rating agencies. |
| (4) | Backed by an escrow or trust containing sufficient U.S. Government or U.S. Government agency securities, which ensure the timely payment of principal and interest. Certain bonds backed by U.S. Government or agency securities are regarded as having an implied rating equal to the rating of such securities. |
| (5) | Investment, or portion of investment, has been pledged to collateralize the net payment obligations for investments in inverse floating rate transactions. |
| (6) | Variable Rate MuniFund Term Preferred Shares, at Liquidation Preference as a percentage of Total Investments is 33.8%. |
| (ETM) | Escrowed to maturity. |
| (UB) | Underlying bond of an inverse floating rate trust reflected as a financing transaction. See Notes to Financial Statements, Note 3 – Portfolio Securities and Investments in Derivatives, Inverse Floating Rate Securities for more information. |
See accompanying notes to financial statements.
| NNC | | |
| | Nuveen North Carolina Premium Income Municipal Fund | |
| | Portfolio of Investments | May 31, 2016 |
| | Principal | | | Optional Call | | | | | | |
| | Amount (000) | | Description (1) | Provisions (2) | | Ratings (3) | | | Value | |
| | | | LONG-TERM INVESTMENTS – 148.8% (100.0% of Total Investments) | | | | | | | |
| | | | MUNICIPAL BONDS – 148.8% (100.0% of Total Investments) | | | | | | | |
| | | | Education and Civic Organizations – 21.1% (14.2% of Total Investments) | | | | | | | |
| $ | 30 | | Appalachian State University, North Carolina, Revenue Bonds, Series 2005, 5.250%, 7/15/17 – NPFG Insured | No Opt. Call | | Aa3 | | $ | 31,531 | |
| | | | Board of Governors of the University of North Carolina, Winston-Salem State University General Revenue Bonds, Series 2013: | | | | | | | |
| | 2,950 | | 5.000%, 4/01/33 | 4/22 at 100.00 | | A– | | | 3,313,824 | |
| | 1,000 | | 5.125%, 4/01/43 | 4/22 at 100.00 | | A– | | | 1,114,030 | |
| | 5,000 | | East Carolina University, North Carolina, General Revenue Bonds, Series 2014A, 5.000%, 10/01/41 | 10/23 at 100.00 | | Aa2 | | | 5,954,400 | |
| | 2,310 | | East Carolina University, North Carolina, General Revenue Bonds, Series 2016A, 5.000%, 10/01/29 | 4/26 at 100.00 | | Aa2 | | | 2,898,796 | |
| | 1,500 | | Fayetteville State University, North Carolina, Limited Obligation Revenue Bonds, Student Housing Project, Series 2011, 5.000%, 4/01/43 – AGM Insured | 4/21 at 100.00 | | AA | | | 1,704,825 | |
| | 1,000 | | North Carolina Capital Facilities Finance Agency, General Revenue Bonds, Duke University, Series 2009B, 5.000%, 10/01/38 | 4/19 at 100.00 | | AA+ | | | 1,108,870 | |
| | | | North Carolina Capital Facilities Finance Agency, Revenue Bonds, Davidson College, Series 2014: | | | | | | | |
| | 500 | | 5.000%, 3/01/26 | 3/22 at 100.00 | | AA+ | | | 596,415 | |
| | 250 | | 5.000%, 3/01/28 | 3/22 at 100.00 | | AA+ | | | 296,165 | |
| | 500 | | 5.000%, 3/01/29 | 3/22 at 100.00 | | AA+ | | | 587,870 | |
| | 500 | | 5.000%, 3/01/32 | 3/22 at 100.00 | | AA+ | | | 588,525 | |
| | 1,230 | | 5.000%, 3/01/45 | 3/22 at 100.00 | | AA+ | | | 1,428,005 | |
| | 1,605 | | North Carolina Capital Facilities Finance Agency, Revenue Bonds, Duke University Project, Series 2015 A, 5.000%, 10/01/55 | 10/25 at 100.00 | | AA+ | | | 1,912,085 | |
| | | | North Carolina Capital Facilities Finance Agency, Revenue Bonds, Johnson & Wales University, Series 2013A: | | | | | | | |
| | 1,560 | | 5.000%, 4/01/32 | 4/23 at 100.00 | | A2 | | | 1,813,110 | |
| | 1,000 | | 5.000%, 4/01/33 | 4/23 at 100.00 | | A2 | | | 1,158,830 | |
| | 4,440 | | North Carolina Capital Facilities Finance Agency, Revenue Bonds, The Methodist University, Series 2012, 5.000%, 3/01/34 | 3/22 at 100.00 | | BBB | | | 4,915,480 | |
| | | | North Carolina Central University, General Revenue Bonds, Refunding Series 2016: | | | | | | | |
| | 2,915 | | 5.000%, 10/01/23 (WI/DD, Settling 6/01/16) | No Opt. Call | | A3 | | | 3,534,117 | |
| | 3,070 | | 5.000%, 10/01/24 (WI/DD, Settling 6/01/16) | No Opt. Call | | A3 | | | 3,770,973 | |
| | 1,360 | | 5.000%, 10/01/25 (WI/DD, Settling 6/01/16) | No Opt. Call | | A3 | | | 1,685,502 | |
| | 2,020 | | North Carolina State University at Raleigh, General Revenue Bonds, Series 2013A, 5.000%, 10/01/42 | 10/23 at 100.00 | | Aa1 | | | 2,381,580 | |
| | 290 | | University of North Carolina System, Pooled Revenue Bonds, Series 2005A, 5.000%, 4/01/22 – AMBAC Insured | 8/16 at 100.00 | | A | | | 291,111 | |
| | 800 | | University of North Carolina, Charlotte, General Revenue Bonds, Refunding Series 2015, 5.000%, 4/01/45 | 4/25 at 100.00 | | Aa3 | | | 949,944 | |
| | | | University of North Carolina, Charlotte, General Revenue Bonds, Series 2014: | | | | | | | |
| | 2,070 | | 5.000%, 4/01/32 | 4/24 at 100.00 | | Aa3 | | | 2,473,402 | |
| | 1,175 | | 5.000%, 4/01/33 | 4/24 at 100.00 | | Aa3 | | | 1,399,331 | |
| | 1,385 | | 5.000%, 4/01/35 | 4/24 at 100.00 | | Aa3 | | | 1,641,793 | |
| | | | University of North Carolina, Greensboro, General Revenue Bonds, Series 2014: | | | | | | | |
| | 1,000 | | 5.000%, 4/01/32 | 4/24 at 100.00 | | Aa3 | | | 1,196,460 | |
| | 3,065 | | 5.000%, 4/01/39 | 4/24 at 100.00 | | Aa3 | | | 3,595,030 | |
| | 1,250 | | Western Carolina University, North Carolina, General Revenue Bonds, Refunding Series 2015A, 5.000%, 10/01/45 | 10/25 at 100.00 | | Aa3 | | | 1,486,888 | |
| | 45,775 | | Total Education and Civic Organizations | | | | | | 53,828,892 | |
| NNC | Nuveen North Carolina Premium Income Municipal Fund | |
| | Portfolio of Investments (continued) | May 31, 2016 |
| | Principal | | | Optional Call | | | | | | |
| | Amount (000) | | Description (1) | Provisions (2) | | Ratings (3) | | | Value | |
| | | | Health Care – 25.0% (16.8% of Total Investments) | | | | | | | |
| $ | 2,750 | | Charlotte-Mecklenburg Hospital Authority, North Carolina, Health Care Revenue Bonds, DBA Carolinas HealthCare System, Refunding Series 2009A, 5.250%, 1/15/39 | 1/19 at 100.00 | | AA– | | $ | 3,019,060 | |
| | 5,250 | | Charlotte-Mecklenburg Hospital Authority, North Carolina, Health Care Revenue Bonds, DBA Carolinas HealthCare System, Refunding Series 2012A, 5.000%, 1/15/43 | 1/22 at 100.00 | | AA– | | | 5,972,663 | |
| | 4,950 | | Charlotte-Mecklenburg Hospital Authority, North Carolina, Health Care Revenue Bonds, DBA Carolinas HealthCare System, Series 2008A, 5.000%, 1/15/47 | 1/18 at 100.00 | | AA– | | | 5,167,157 | |
| | 2,000 | | Charlotte-Mecklenburg Hospital Authority, North Carolina, Health Care Revenue Bonds, DBA Carolinas HealthCare System, Series 2011A, 5.250%, 1/15/42 | 1/21 at 100.00 | | AA– | | | 2,282,720 | |
| | 4,295 | | Nash Health Care Systems, North Carolina, Health Care Facilities Revenue Bonds, Series 2012, 5.000%, 11/01/41 | 5/22 at 100.00 | | A– | | | 4,758,645 | |
| | 500 | | New Hanover County, North Carolina, Hospital Revenue Bonds, New Hanover Regional Medical Center, Refunding Series 2013, 5.000%, 10/01/26 | 10/23 at 100.00 | | A+ | | | 587,105 | |
| | 555 | | New Hanover County, North Carolina, Hospital Revenue Bonds, New Hanover Regional Medical Center, Series 2006B, 5.125%, 10/01/31 – AGM Insured | 10/19 at 100.00 | | AA | | | 614,618 | |
| | | | North Carolina Medical Care Commission Health Care Facilities Revenue Bonds Novant Health Inc., Series 2010A: | | | | | | | |
| | 4,750 | | 5.250%, 11/01/40 | 11/20 at 100.00 | | AA– | | | 5,363,985 | |
| | 5,000 | | 5.000%, 11/01/43 | 11/20 at 100.00 | | AA– | | | 5,548,250 | |
| | 2,680 | | North Carolina Medical Care Commission, Health Care Facilities Revenue Bonds, Appalachian Regional HealthCare System, Series 2011A, 6.500%, 7/01/31 | 7/21 at 100.00 | | BBB+ | | | 3,165,509 | |
| | 2,750 | | North Carolina Medical Care Commission, Health Care Facilities Revenue Bonds, Blue Ridge HealthCare, Refunding Series 2010A, 5.000%, 1/01/36 | 1/20 at 100.00 | | A | | | 3,000,965 | |
| | 2,000 | | North Carolina Medical Care Commission, Health Care Facilities Revenue Bonds, Duke University Health System, Series 2012A, 5.000%, 6/01/42 | 6/22 at 100.00 | | AA | | | 2,308,300 | |
| | 2,335 | | North Carolina Medical Care Commission, Health Care Facilities Revenue Bonds, FirstHealth of the Carolinas Project, Refunding Series 2012A, 4.000%, 10/01/39 | 10/17 at 100.00 | | AA | | | 2,367,363 | |
| | 2,000 | | North Carolina Medical Care Commission, Health Care Facilities Revenue Bonds, Rex Healthcare, Series 2015A, 5.000%, 7/01/44 | 7/25 at 100.00 | | AA– | | | 2,323,700 | |
| | 3,000 | | North Carolina Medical Care Commission, Health Care Facilities Revenue Bonds, Wake Forest Baptist Obligated Group, Series 2012A, 5.000%, 12/01/45 | No Opt. Call | | A | | | 3,473,700 | |
| | 2,375 | | North Carolina Medical Care Commission, Health Care Facilities Revenue Refunding Bonds, Cape Fear Valley Health System, Series 2012A, 5.000%, 10/01/27 | No Opt. Call | | A– | | | 2,703,938 | |
| | 2,000 | | North Carolina Medical Care Commission, Health Care Facilities Revenue Refunding Bonds, WakeMed, Series 2012A, 5.000%, 10/01/27 | 10/22 at 100.00 | | AA– | | | 2,348,380 | |
| | 2,930 | | North Carolina Medical Care Commission, Hospital Revenue Bonds, Southeastern Regional Medical Center, Refunding Series 2012, 5.000%, 6/01/32 | 6/22 at 100.00 | | A | | | 3,267,477 | |
| | 3,295 | | North Carolina Medical Care Commission, Revenue Bonds, Blue Ridge Healthcare System, Series 2005, 5.000%, 1/01/33 – FGIC Insured | 8/16 at 100.00 | | AA– | | | 3,304,160 | |
| | 750 | | Northern Hospital District Surry County, North Carolina, Health Care Facilities Revenue Bonds, Series 2008, 6.250%, 10/01/38 | 4/18 at 100.00 | | BBB | | | 804,750 | |
| | 1,565 | | Onslow County Hospital Authority, North Carolina, FHA Insured Mortgage Revenue Bonds, Onslow Memorial Hospital Project, Series 2006, 5.000%, 4/01/31 – NPFG Insured | 10/16 at 100.00 | | AA– | | | 1,585,971 | |
| | 57,730 | | Total Health Care | | | | | | 63,968,416 | |
| | | | Housing/Multifamily – 1.2% (0.8% of Total Investments) | | | | | | | |
| | | | Mecklenburg County, North Carolina, FNMA Multifamily Housing Revenue Bonds, Little Rock Apartments, Series 2003: | | | | | | | |
| | 685 | | 5.150%, 1/01/22 (Alternative Minimum Tax) | 7/18 at 100.00 | | N/R | | | 700,296 | |
| | 2,260 | | 5.375%, 1/01/36 (Alternative Minimum Tax) | 7/18 at 100.00 | | N/R | | | 2,307,754 | |
| | 2,945 | | Total Housing/Multifamily | | | | | | 3,008,050 | |
| | Principal | | | Optional Call | | | | | | |
| | Amount (000) | | Description (1) | Provisions (2) | | Ratings (3) | | | Value | |
| | | | Housing/Single Family – 1.8% (1.2% of Total Investments) | | | | | | | |
| $ | 1,095 | | North Carolina Housing Finance Agency, Home Ownership Revenue Bonds, Series 2007-29A, 4.800%, 7/01/33 (Alternative Minimum Tax) | 1/17 at 100.00 | | AA | | $ | 1,104,417 | |
| | 1,995 | | North Carolina Housing Finance Agency, Home Ownership Revenue Bonds, Series 2011-1, 4.500%, 1/01/28 | 1/21 at 100.00 | | AA | | | 2,149,692 | |
| | 1,345 | | North Carolina Housing Finance Agency, Home Ownership Revenue Bonds, Series 25-A, 4.900%, 7/01/37 (Alternative Minimum Tax) | 7/16 at 100.00 | | AA | | | 1,346,627 | |
| | 4,435 | | Total Housing/Single Family | | | | | | 4,600,736 | |
| | | | Long-Term Care – 1.0% (0.7% of Total Investments) | | | | | | | |
| | | | North Carolina Medical Care Commission, Healthcare Facilities Revenue Bonds, Presbyterian Homes, Series 2006: | | | | | | | |
| | 700 | | 5.400%, 10/01/27 | 10/16 at 100.00 | | N/R | | | 707,658 | |
| | 1,500 | | 5.500%, 10/01/31 | 10/16 at 100.00 | | N/R | | | 1,512,795 | |
| | 450 | | North Carolina Medical Care Commission, Revenue Bonds, United Methodist Retirement Homes Inc., Refunding Series 2013A, 5.000%, 10/01/33 | 10/23 at 100.00 | | N/R | | | 473,135 | |
| | 2,650 | | Total Long-Term Care | | | | | | 2,693,588 | |
| | | | Materials – 0.6% (0.4% of Total Investments) | | | | | | | |
| | 1,400 | | Columbus County Industrial Facilities and Pollution Control Financing Authority, North Carolina, Environmental Improvement Revenue Bonds, International Paper Company Project, Series 2007A, 4.625%, 3/01/27 (Alternative Minimum Tax) | 3/17 at 100.00 | | BBB | | | 1,412,530 | |
| | | | Tax Obligation/General – 5.1% (3.5% of Total Investments) | | | | | | | |
| | | | Catawba County, North Carolina, General Obligation Bonds, Limited Obligation Series 2014A: | | | | | | | |
| | 1,000 | | 5.000%, 6/01/30 | 6/24 at 100.00 | | Aa2 | | | 1,197,550 | |
| | 730 | | 5.000%, 6/01/31 | 6/24 at 100.00 | | Aa2 | | | 871,511 | |
| | | | Davidson County, North Carolina, General Obligation Bonds, Refunding Series 2016: | | | | | | | |
| | 300 | | 5.000%, 6/01/25 | No Opt. Call | | AA | | | 383,763 | |
| | 1,000 | | 5.000%, 6/01/27 | No Opt. Call | | AA | | | 1,307,290 | |
| | 835 | | Durham, North Carolina, General Obligation Bonds, Refunding Series 2015, 5.000%, 10/01/26 | No Opt. Call | | AAA | | | 1,093,942 | |
| | | | Durham, North Carolina, General Obligation Bonds, Series 2007: | | | | | | | |
| | 2,820 | | 5.000%, 4/01/21 | 4/17 at 100.00 | | AAA | | | 2,920,561 | |
| | 1,475 | | 5.000%, 4/01/22 | 4/17 at 100.00 | | AAA | | | 1,528,602 | |
| | 1,050 | | Forsyth County, North Carolina, General Obligation Bonds, Limited Obligation Series 2009, 5.000%, 4/01/30 | 4/20 at 100.00 | | AA+ | | | 1,197,872 | |
| | 2,020 | | Raleigh, North Carolina, General Obligation Bonds, Refunding Series 2016A, 5.000%, 9/01/26 | No Opt. Call | | AAA | | | 2,646,018 | |
| | 11,230 | | Total Tax Obligation/General | | | | | | 13,147,109 | |
| | | | Tax Obligation/Limited – 15.6% (10.5% of Total Investments) | | | | | | | |
| | | | Buncombe County, North Carolina, Limited Obligation Bonds, Series 2014A: | | | | | | | |
| | 1,085 | | 5.000%, 6/01/33 | 6/24 at 100.00 | | AA+ | | | 1,311,157 | |
| | 1,600 | | 5.000%, 6/01/34 | 6/24 at 100.00 | | AA+ | | | 1,926,992 | |
| | 2,405 | | Charlotte, North Carolina, Certificates of Participation, Transit Projects Phase 2, Refunding Series 2008A, 5.000%, 6/01/33 | 6/18 at 100.00 | | AA+ | | | 2,584,341 | |
| | 2,045 | | Charlotte, North Carolina, Storm Water Fee Revenue Bonds, Refunding Series 2014, 5.000%, 12/01/39 | 12/24 at 100.00 | | AAA | | | 2,483,182 | |
| | 2,085 | | Dare County, North Carolina, Installment Purchase Contract, Limited Obligation Series 2012B, 5.000%, 6/01/28 | 6/22 at 100.00 | | AA | | | 2,434,321 | |
| | 500 | | Henderson County, North Carolina, Limited Obligation Bonds, Series 2015, 5.000%, 10/01/31 | 10/25 at 100.00 | | AA | | | 616,580 | |
| | 868 | | Hillsborough, North Carolina, Special Assessment Revenue Bonds, Series 2013, 7.750%, 2/01/24 | 2/23 at 100.00 | | N/R | | | 938,976 | |
| NNC | Nuveen North Carolina Premium Income Municipal Fund | |
| | Portfolio of Investments (continued) | May 31, 2016 |
| | Principal | | | Optional Call | | | | | | |
| | Amount (000) | | Description (1) | Provisions (2) | | Ratings (3) | | | Value | |
| | | | Tax Obligation/Limited (continued) | | | | | | | |
| | | | Jacksonville Public Facilities Corporation, North Carolina, Limited Obligation Bonds, Series 2012: | | | | | | | |
| $ | 1,065 | | 5.000%, 4/01/29 | 4/22 at 100.00 | | A1 | | $ | 1,238,797 | |
| | 1,165 | | 5.000%, 4/01/30 | 4/22 at 100.00 | | A1 | | | 1,354,231 | |
| | 1,000 | | 5.000%, 4/01/31 | 4/22 at 100.00 | | A1 | | | 1,159,600 | |
| | 200 | | 5.000%, 4/01/32 | 4/22 at 100.00 | | A1 | | | 231,324 | |
| | | | North Carolina State, Limited Obligation Bonds, Refunding Series 2014C: | | | | | | | |
| | 3,000 | | 5.000%, 5/01/24 | No Opt. Call | | AA+ | | | 3,766,620 | |
| | 5,000 | | 5.000%, 5/01/25 | 5/24 at 100.00 | | AA+ | | | 6,232,750 | |
| | 8,065 | | North Carolina Turnpike Authority, Monroe Connector System State Appropriation Bonds, Series 2011, 5.000%, 7/01/41 | 7/21 at 100.00 | | AA | | | 9,292,089 | |
| | 1,000 | | Raleigh, North Carolina, Limited Obligation Bonds, Series 2013, 5.000%, 10/01/33 | 10/23 at 100.00 | | AA+ | | | 1,211,250 | |
| | | | Raleigh, North Carolina, Limited Obligation Bonds, Series 2014A: | | | | | | | |
| | 1,195 | | 5.000%, 10/01/25 | 10/24 at 100.00 | | AA+ | | | 1,503,083 | |
| | 1,305 | | 5.000%, 10/01/26 | 10/24 at 100.00 | | AA+ | | | 1,626,500 | |
| | 33,583 | | Total Tax Obligation/Limited | | | | | | 39,911,793 | |
| | | | Transportation – 23.2% (15.6% of Total Investments) | | | | | | | |
| | 5,000 | | Charlotte, North Carolina, Airport Revenue Bonds, Charlotte Douglas International Refunding Series 2010A, 5.000%, 7/01/39 | 7/20 at 100.00 | | Aa3 | | | 5,646,100 | |
| | 10 | | Charlotte, North Carolina, Airport Revenue Bonds, Charlotte Douglas International Refunding Series 2010B, 5.375%, 7/01/28 (Alternative Minimum Tax) | 7/20 at 100.00 | | Aa3 | | | 11,269 | |
| | | | Charlotte, North Carolina, Airport Revenue Bonds, Charlotte Douglas International, Refunding Series 2014A: | | | | | | | |
| | 2,865 | | 5.000%, 7/01/27 | 7/24 at 100.00 | | Aa3 | | | 3,501,173 | |
| | 3,000 | | 5.000%, 7/01/28 | 7/24 at 100.00 | | Aa3 | | | 3,641,190 | |
| | 1,400 | | Charlotte, North Carolina, Airport Revenue Bonds, Charlotte Douglas International, Series 2010B, 5.000%, 7/01/36 (Alternative Minimum Tax) | 7/21 at 100.00 | | Aa3 | | | 1,556,184 | |
| | 1,425 | | Charlotte, North Carolina, Airport Revenue Bonds, Refunding Series 2011A, 5.000%, 7/01/41 | No Opt. Call | | Aa3 | | | 1,629,901 | |
| | 10,000 | | North Carolina Department of Transportation, Private Activity Revenue Bonds, I-77 Hot Lanes Project, Series 2015, 5.000%, 6/30/54 (Alternative Minimum Tax) | 6/25 at 100.00 | | BBB– | | | 10,954,398 | |
| | 2,725 | | North Carolina State Ports Authority, Port Facilities Revenue Bonds, Senior Lien Series 2010A, 5.250%, 2/01/40 | 2/20 at 100.00 | | A3 | | | 3,065,135 | |
| | 515 | | North Carolina State Ports Authority, Port Facilities Revenue Bonds, Senior Lien Series 2010B, 5.000%, 2/01/29 | 2/20 at 100.00 | | A3 | | | 574,972 | |
| | | | North Carolina Turnpike Authority, Triangle Expressway System Revenue Bonds, Series 2009A: | | | | | | | |
| | 140 | | 5.000%, 1/01/21 – AGC Insured | 1/19 at 100.00 | | AA | | | 152,331 | |
| | 265 | | 5.375%, 1/01/26 – AGC Insured | 1/19 at 100.00 | | AA | | | 290,708 | |
| | 1,650 | | 5.500%, 1/01/29 – AGC Insured | 1/19 at 100.00 | | AA | | | 1,808,235 | |
| | 7,335 | | 5.750%, 1/01/39 – AGC Insured | 1/19 at 100.00 | | AA | | | 8,094,393 | |
| | | | North Carolina Turnpike Authority, Triangle Expressway System Senior Lien Revenue Bonds, Series 2009B: | | | | | | | |
| | 150 | | 0.000%, 1/01/31 – AGC Insured | No Opt. Call | | AA | | | 94,616 | |
| | 4,375 | | 0.000%, 1/01/33 – AGC Insured | No Opt. Call | | AA | | | 2,565,369 | |
| | 2,300 | | 0.000%, 1/01/34 – AGC Insured | No Opt. Call | | AA | | | 1,292,485 | |
| | 2,380 | | 0.000%, 1/01/35 – AGC Insured | No Opt. Call | | AA | | | 1,273,252 | |
| | 7,575 | | 0.000%, 1/01/37 – AGC Insured | No Opt. Call | | AA | | | 3,781,289 | |
| | 1,470 | | 0.000%, 1/01/38 – AGC Insured | No Opt. Call | | AA | | | 707,952 | |
| | | | Raleigh Durham Airport Authority, North Carolina, Airport Revenue Bonds, Refunding Series 2010A: | | | | | | | |
| | 2,490 | | 5.000%, 5/01/26 | No Opt. Call | | Aa3 | | | 2,850,950 | |
| | 4,125 | | 5.000%, 5/01/36 | 5/20 at 100.00 | | Aa3 | | | 4,667,685 | |
| | Principal | | | Optional Call | | | | | | |
| | Amount (000) | | Description (1) | Provisions (2) | | Ratings (3) | | | Value | |
| | | | Transportation (continued) | | | | | | | |
| $ | 1,000 | | Raleigh Durham Airport Authority, North Carolina, Airport Revenue Bonds, Series 2007, 5.000%, 5/01/37 – FGIC Insured (Alternative Minimum Tax) | 5/17 at 100.00 | | AA+ | | $ | 1,033,040 | |
| | 62,195 | | Total Transportation | | | | | | 59,192,627 | |
| | | | U.S. Guaranteed – 32.2% (21.6% of Total Investments) (4) | | | | | | | |
| | | | Albemarle Hospital Authority, North Carolina, Health Care Facilities Revenue Bonds, Series 2007: | | | | | | | |
| | 1,840 | | 5.250%, 10/01/27 (Pre-refunded 10/01/17) | 10/17 at 100.00 | | N/R (4) | | | 1,949,866 | |
| | 1,725 | | 5.250%, 10/01/38 (Pre-refunded 10/01/17) | 10/17 at 100.00 | | N/R (4) | | | 1,828,000 | |
| | 3,100 | | Brunswick County, North Carolina, Enterprise System Revenue Bonds, Series 2008A, 5.000%, 4/01/31 (Pre-refunded 4/01/18) – AGM Insured | 4/18 at 100.00 | | AA (4) | | | 3,338,235 | |
| | | | Cape Fear Public Utility Authority, North Carolina, Water & Sewer System Revenue Bonds, Series 2008: | | | | | | | |
| | 425 | | 5.000%, 8/01/28 (Pre-refunded 8/01/18) | 8/18 at 100.00 | | AA+ (4) | | | 463,518 | |
| | 1,005 | | 5.000%, 8/01/35 (Pre-refunded 8/01/18) | 8/18 at 100.00 | | AA+ (4) | | | 1,096,083 | |
| | | | Craven County, North Carolina, Certificates of Participation, Series 2007: | | | | | | | |
| | 160 | | 5.000%, 6/01/23 (Pre-refunded 6/01/17) – NPFG Insured | 6/17 at 100.00 | | AA– (4) | | | 166,957 | |
| | 3,000 | | 5.000%, 6/01/27 (Pre-refunded 6/01/17) – NPFG Insured | 6/17 at 100.00 | | AA– (4) | | | 3,130,440 | |
| | | | Harnett County, North Carolina, Certificates of Participation, Series 2009: | | | | | | | |
| | 1,000 | | 5.000%, 6/01/28 (Pre-refunded 6/01/19) – AGC Insured | 6/19 at 100.00 | | AA (4) | | | 1,120,400 | |
| | 500 | | 5.000%, 6/01/29 (Pre-refunded 6/01/19) – AGC Insured | 6/19 at 100.00 | | AA (4) | | | 560,200 | |
| | 2,225 | | Johnston Memorial Hospital Authority, North Carolina, Mortgage Revenue Bonds, Johnston Memorial Hospital Project, Series 2008A, 5.250%, 10/01/36 (Pre-refunded 4/01/18) – AGM Insured | 4/18 at 100.00 | | AA (4) | | | 2,405,247 | |
| | 400 | | Mecklenburg County, North Carolina, Certificates of Participation, Series 2009A, 5.000%, 2/01/27 (Pre-refunded 2/01/19) | 2/19 at 100.00 | | AA+ (4) | | | 443,576 | |
| | | | North Carolina Eastern Municipal Power Agency, Power System Revenue Bonds, Refunding Series 1993B: | | | | | | | |
| | 100 | | 6.000%, 1/01/22 (ETM) | No Opt. Call | | AAA | | | 125,692 | |
| | 180 | | 6.000%, 1/01/22 – NPFG Insured (ETM) | No Opt. Call | | A3 (4) | | | 218,826 | |
| | 1,400 | | North Carolina Eastern Municipal Power Agency, Power System Revenue Bonds, Series 2009B, 5.000%, 1/01/26 (Pre-refunded 1/01/19) | 1/19 at 100.00 | | AAA | | | 1,547,938 | |
| | 3,500 | | North Carolina Eastern Municipal Power Agency, Power System Revenue Bonds, Series 2012A, 5.000%, 1/01/25 (Pre-refunded 7/01/22) | 7/22 at 100.00 | | AAA | | | 4,267,690 | |
| | 1,680 | | North Carolina Medical Care Commission, Health Care Facilities Revenue Bonds, Cleveland County Healthcare System, Refunding Series 2011A, 5.750%, 1/01/35 (Pre-refunded 1/01/21) | 1/21 at 100.00 | | N/R (4) | | | 2,024,467 | |
| | | | North Carolina Medical Care Commission, Hospital Revenue Bonds, Wilson Medical Center, Series 2007: | | | | | | | |
| | 500 | | 5.000%, 11/01/20 (Pre-refunded 11/01/17) | 11/17 at 100.00 | | N/R (4) | | | 530,310 | |
| | 3,425 | | 5.000%, 11/01/27 (Pre-refunded 11/01/17) | 11/17 at 100.00 | | N/R (4) | | | 3,632,624 | |
| | 4,260 | | North Carolina Municipal Power Agency 1, Catawba Electric Revenue Bonds, Series 1986, 5.000%, 1/01/20 (ETM) | No Opt. Call | | Aaa | | | 4,766,897 | |
| | 785 | | North Carolina Municipal Power Agency 1, Catawba Electric Revenue Bonds, Refunding Series 2009A, 5.000%, 1/01/30 (Pre-refunded 1/01/19) | 1/19 at 100.00 | | AAA | | | 867,315 | |
| | 1,535 | | North Carolina Municipal Power Agency 1, Catawba Electric Revenue Bonds, Series 2012B, 5.000%, 1/01/21 (ETM) | No Opt. Call | | AAA | | | 1,798,467 | |
| | | | Oak Island, North Carolina, Enterprise System Revenue Bonds, Series 2009: | | | | | | | |
| | 2,020 | | 6.000%, 6/01/34 (Pre-refunded 6/01/19) – AGC Insured | 6/19 at 100.00 | | AA (4) | | | 2,324,798 | |
| | 1,020 | | 6.000%, 6/01/36 (Pre-refunded 6/01/19) – AGC Insured | 6/19 at 100.00 | | AA (4) | | | 1,173,908 | |
| | 1,135 | | Raleigh, North Carolina, Certificates of Participation, Series 2007, 5.000%, 2/01/27 (Pre-refunded 2/01/17) | 2/17 at 100.00 | | AA+ (4) | | | 1,168,256 | |
| NNC | Nuveen North Carolina Premium Income Municipal Fund | |
| | Portfolio of Investments (continued) | May 31, 2016 |
| | Principal | | | Optional Call | | | | | | |
| | Amount (000) | | Description (1) | Provisions (2) | | Ratings (3) | | | Value | |
| | | | U.S. Guaranteed (4) (continued) | | | | | | | |
| $ | 2,250 | | Rutherford County, North Carolina, Certificates of Participation, Series 2007, 5.000%, 12/01/27 (Pre-refunded 12/01/17) – AGM Insured | 12/17 at 100.00 | | AA (4) | | $ | 2,395,170 | |
| | 5,000 | | Sampson County, North Carolina, Certificates of Participation, Series 2006, 5.000%, 6/01/34 (Pre-refunded 6/01/17) – AGM Insured | 6/17 at 100.00 | | AA (4) | | | 5,216,350 | |
| | 10,200 | | University of North Carolina, Chapel Hill, System Net Revenue Bonds, Series 2007, 5.000%, 12/01/36 (Pre-refunded 12/01/17) | 12/17 at 100.00 | | AAA | | | 10,858,307 | |
| | | | University of North Carolina, System Pooled Revenue Bonds, Series 2009C: | | | | | | | |
| | 1,000 | | 5.250%, 10/01/28 (Pre-refunded 10/01/19) | 10/19 at 100.00 | | A3 (4) | | | 1,140,560 | |
| | 1,000 | | 5.375%, 10/01/29 (Pre-refunded 10/01/19) | 10/19 at 100.00 | | A3 (4) | | | 1,144,650 | |
| | 5,100 | | Wake County, North Carolina, Limited Obligation Bonds, Series 2010, 5.000%, 1/01/37 (Pre-refunded 1/01/20) | 1/20 at 100.00 | | AA+ (4) | | | 5,811,399 | |
| | 2,450 | | Wilmington, North Carolina, Certificates of Participation, Series 2008A, 5.000%, 6/01/29 (Pre-refunded 6/01/18) | 6/18 at 100.00 | | AA+ (4) | | | 2,654,771 | |
| | 1,750 | | Wilson County, North Carolina, Certificates of Participation, School Facilities Project, Series 2007, 5.000%, 4/01/25 (Pre-refunded 4/01/17) – AMBAC Insured | 4/17 at 100.00 | | Aa3 (4) | | | 1,813,683 | |
| | 9,900 | | Winston-Salem, North Carolina, Water and Sewer System Revenue Bonds, Series 2007A, 5.000%, 6/01/37 (Pre-refunded 6/01/17) | 6/17 at 100.00 | | AAA | | | 10,329,362 | |
| | 75,570 | | Total U.S. Guaranteed | | | | | | 82,313,962 | |
| | | | Utilities – 3.3% (2.2% of Total Investments) | | | | | | | |
| | 5,000 | | North Carolina Capital Facilities Financing Agency, Solid Waste Disposal Revenue Bond, Duke Energy Carolinas Project, Refunding Series 2008B, 4.625%, 11/01/40 | 11/20 at 100.00 | | Aa2 | | | 5,415,450 | |
| | 315 | | North Carolina Municipal Power Agency 1, Catawba Electric Revenue Bonds, Refunding Series 2009A, 5.000%, 1/01/30 | 1/19 at 100.00 | | A | | | 345,438 | |
| | 1,500 | | North Carolina Municipal Power Agency 1, Catawba Electric Revenue Bonds, Refunding Series 2015A, 5.000%, 1/01/32 | 1/26 at 100.00 | | A | | | 1,836,405 | |
| | 760 | | North Carolina Municipal Power Agency 1, Catawba Electric Revenue Bonds, Refunding Series 2016A, 5.000%, 1/01/30 | 7/26 at 100.00 | | A | | | 946,816 | |
| | 7,575 | | Total Utilities | | | | | | 8,544,109 | |
| | | | Water and Sewer – 18.7% (12.5% of Total Investments) | | | | | | | |
| | 1,145 | | Brunswick County, North Carolina, Enterprise System Revenue Bonds, Refunding Series 2012A, 5.000%, 4/01/25 | 4/22 at 100.00 | | AA– | | | 1,381,878 | |
| | 2,135 | | Cape Fear Public Utility Authority, North Carolina, Water & Sewer System Revenue Bonds, Refunding Series 2011, 5.000%, 8/01/31 | 8/21 at 100.00 | | AA+ | | | 2,494,619 | |
| | | | Charlotte, North Carolina, Water and Sewer System Revenue Bonds, Refunding Series 2015: | | | | | | | |
| | 940 | | 5.000%, 7/01/32 | 7/25 at 100.00 | | AAA | | | 1,169,623 | |
| | 2,325 | | 5.000%, 7/01/40 | 7/25 at 100.00 | | AAA | | | 2,822,015 | |
| | 1,000 | | Charlotte, North Carolina, Water and Sewerage System Revenue Bonds, Series 2008, 5.000%, 7/01/38 | 7/18 at 100.00 | | AAA | | | 1,082,260 | |
| | | | Dare County, North Carolina, Utilities System Revenue Bonds, Series 2011: | | | | | | | |
| | 3,860 | | 5.000%, 2/01/36 | 2/21 at 100.00 | | AA | | | 4,424,062 | |
| | 1,250 | | 5.000%, 2/01/41 | 2/21 at 100.00 | | AA | | | 1,430,850 | |
| | 8,600 | | Durham, North Carolina, Utility System Revenue Bonds, Refunding Series 2011, 5.000%, 6/01/41 | 6/21 at 100.00 | | AAA | | | 9,842,441 | |
| | 1,535 | | Mooresville, North Carolina, Enterprise System Revenue Bonds, Refunding Series 2012, 5.000%, 5/01/28 | 5/22 at 100.00 | | AA– | | | 1,838,393 | |
| | 3,040 | | Oak Island, North Carolina, Enterprise System Revenue Bonds, Refunding Series 2015, 5.000%, 6/01/33 – AGM Insured | 6/25 at 100.00 | | AA | | | 3,646,419 | |
| | 1,210 | | Oak Island, North Carolina, Enterprise System Revenue Bonds, Series 2008A, 5.000%, 6/01/23 – NPFG Insured | 6/18 at 100.00 | | AA– | | | 1,303,533 | |
| | Principal | | | Optional Call | | | | | | |
| | Amount (000) | | Description (1) | Provisions (2) | | Ratings (3) | | | Value | |
| | | | Water and Sewer (continued) | | | | | | | |
| | | | Oak Island, North Carolina, Enterprise System Revenue Bonds, Series 2011: | | | | | | | |
| $ | 600 | | 5.625%, 6/01/30 – AGC Insured | 6/21 at 100.00 | | AA | | $ | 695,088 | |
| | 2,100 | | 5.750%, 6/01/36 – AGC Insured | 6/21 at 100.00 | | AA | | | 2,435,643 | |
| | | | Raleigh, North Carolina, Combined Enterprise System Revenue Bonds, Refunding Series 2012A: | | | | | | | |
| | 550 | | 5.000%, 3/01/30 | 3/22 at 100.00 | | AAA | | | 651,563 | |
| | 1,600 | | 5.000%, 3/01/31 | 3/22 at 100.00 | | AAA | | | 1,892,896 | |
| | | | Raleigh, North Carolina, Combined Enterprise System Revenue Bonds, Refunding Series 2013A: | | | | | | | |
| | 5,000 | | 5.000%, 3/01/28 | 3/23 at 100.00 | | AAA | | | 6,105,600 | |
| | 3,785 | | 5.000%, 3/01/43 | 3/23 at 100.00 | | AAA | | | 4,469,707 | |
| | 40,675 | | Total Water and Sewer | | | | | | 47,686,590 | |
| $ | 345,763 | | Total Long-Term Investments (cost $348,977,771) | | | | | | 380,308,402 | |
| | | | Variable Rate MuniFund Term Preferred Shares, at Liquidation Preference – (48.9)% (5) | | | | | | (125,000,000 | ) |
| | | | Other Assets Less Liabilities – 0.1% | | | | | | 198,087 | |
| | | | Net Assets Applicable to Common Shares – 100% | | | | | $ | 255,506,489 | |
| (1) | All percentages shown in the Portfolio of Investments are based on net assets applicable to common shares unless otherwise noted. |
| (2) | Optional Call Provisions (not covered by the report of independent registered public accounting firm): Dates (month and year) and prices of the earliest optional call or redemption. There may be other call provisions at varying prices at later dates. Certain mortgage-backed securities may be subject to periodic principal paydowns. |
| (3) | Ratings (not covered by the report of independent registered public accounting firm): Using the highest of Standard & Poor's Group ("Standard & Poor's"), Moody's Investors Service, Inc. ("Moody's") or Fitch, Inc. ("Fitch") rating. Ratings below BBB by Standard & Poor's, Baa by Moody's or BBB by Fitch are considered to be below investment grade. Holdings designated N/R are not rated by any of these national rating agencies. |
| (4) | Backed by an escrow or trust containing sufficient U.S. Government or U.S. Government agency securities, which ensure the timely payment of principal and interest. Certain bonds backed by U.S. Government or agency securities are regarded as having an implied rating equal to the rating of such securities. |
| (5) | Variable Rate MuniFund Term Preferred Shares, at Liquidation Preference as a percentage of Total Investments is 32.9%. |
| (ETM) | Escrowed to maturity. |
| (WI/DD) | Investment, or portion of investment, purchased on a when-issued or delayed delivery basis. |
See accompanying notes to financial statements.
| NPV | | |
| | Nuveen Virginia Premium Income Municipal Fund | |
| | Portfolio of Investments | May 31, 2016 |
| | Principal | | | Optional Call | | | | | | |
| | Amount (000) | | Description (1) | Provisions (2) | | Ratings (3) | | | Value | |
| | | | LONG-TERM INVESTMENTS – 142.2% (100.0% of Total Investments) | | | | | | | |
| | | | MUNICIPAL BONDS – 142.2% (100.0% of Total Investments) | | | | | | | |
| | | | Consumer Staples – 6.2% (4.4% of Total Investments) | | | | | | | |
| | | | Guam Economic Development & Commerce Authority, Tobacco Settlement Asset-Backed Bonds, Series 2007A: | | | | | | | |
| $ | 630 | | 5.250%, 6/01/32 | 6/17 at 100.00 | | CCC | | $ | 632,463 | |
| | 700 | | 5.625%, 6/01/47 | 6/17 at 100.00 | | CCC | | | 701,981 | |
| | 73,500 | | Puerto Rico, The Children's Trust Fund, Tobacco Settlement Asset-Backed Bonds, Series 2005A, 0.000%, 5/15/50 | 11/16 at 100.00 | | BB | | | 6,732,600 | |
| | 325 | | Puerto Rico, The Children's Trust Fund, Tobacco Settlement Asset-Backed Refunding Bonds, Series 2002, 5.500%, 5/15/39 | 8/16 at 100.00 | | BBB+ | | | 324,977 | |
| | 6,425 | | Tobacco Settlement Financing Corporation of Virginia, Tobacco Settlement Asset Backed Bonds, Series 2007B1, 5.000%, 6/01/47 | 6/17 at 100.00 | | B– | | | 6,069,826 | |
| | 2,145 | | Tobacco Settlement Financing Corporation of Virginia, Tobacco Settlement Asset-Backed Bonds, Series 2007B2, 5.200%, 6/01/46 | 6/17 at 100.00 | | B– | | | 2,054,309 | |
| | 180 | | Tobacco Settlement Financing Corporation, Virgin Islands, Tobacco Settlement Asset-Backed Bonds, Series 2001, 5.000%, 5/15/31 | 11/16 at 100.00 | | A3 | | | 180,067 | |
| | 83,905 | | Total Consumer Staples | | | | | | 16,696,223 | |
| | | | Education and Civic Organizations – 8.5% (5.9% of Total Investments) | | | | | | | |
| | 1,615 | | Alexandria Industrial Development Authority, Virginia, Educational Facilities Revenue Bonds, Episcopal High School, Series 2012, 3.750%, 1/01/30 | No Opt. Call | | A1 | | | 1,704,891 | |
| | 580 | | Amherst Industrial Development Authority, Virginia, Revenue Bonds, Sweet Briar College, Series 2006, 5.000%, 9/01/26 | 9/16 at 100.00 | | CCC | | | 556,580 | |
| | 1,630 | | Prince William County Industrial Development Authority, Virginia, Student Housing Revenue Bonds, George Mason University Foundation Prince William Housing LLC Project, Series 2011A, 5.125%, 9/01/41 | 9/21 at 100.00 | | A | | | 1,886,709 | |
| | 2,500 | | The Rector and Visitors of the University of Virginia, General Pledge Revenue Bonds, Green Series 2015A-2, 5.000%, 4/01/45 | 4/25 at 100.00 | | AAA | | | 3,012,325 | |
| | 8,500 | | The Rector and Visitors of the University of Virginia, General Revenue Bonds, Series 2008, 5.000%, 6/01/40 | 6/18 at 100.00 | | AAA | | | 9,191,899 | |
| | 1,000 | | Virginia College Building Authority, Educational Facilities Revenue Bonds, Marymount University Project, Green Series 2015B, 5.000%, 7/01/45 | 7/25 at 100.00 | | BB+ | | | 1,077,300 | |
| | 2,700 | | Virginia College Building Authority, Educational Facilities Revenue Bonds, Washington and Lee University, Series 2001, 5.375%, 1/01/21 | No Opt. Call | | AA | | | 2,998,782 | |
| | 1,460 | | Virginia College Building Authority, Educational Facilities Revenue Bonds, Washington and Lee University, Series 2015A, 5.000%, 1/01/40 | 1/25 at 100.00 | | AA | | | 1,737,882 | |
| | 500 | | Virginia Small Business Finance Authority, Educational Facilities Revenue Bonds, Roanoke College, Series 2011, 5.750%, 4/01/41 | 4/20 at 100.00 | | A– | | | 573,930 | |
| | 20,485 | | Total Education and Civic Organizations | | | | | | 22,740,298 | |
| | | | Health Care – 24.8% (17.5% of Total Investments) | | | | | | | |
| | 5,000 | | Arlington County Industrial Development Authority, Virginia, Hospital Facility Revenue Bonds, Virginia Hospital Center Arlington Health System, Refunding Series 2010, 5.000%, 7/01/31 | 7/20 at 100.00 | | AA– | | | 5,564,500 | |
| | | | Charlotte County Industrial Development Authority, Virginia, Hospital Revenue Bonds, Halifax Regional Hospital Incorporated, Series 2007: | | | | | | | |
| | 1,545 | | 5.000%, 9/01/27 | 9/17 at 100.00 | | A | | | 1,606,506 | |
| | 250 | | 5.000%, 9/01/37 | 9/17 at 100.00 | | A | | | 258,795 | |
| | Principal | | | Optional Call | | | | | | |
| | Amount (000) | | Description (1) | Provisions (2) | | Ratings (3) | | | Value | |
| | | | Health Care (continued) | | | | | | | |
| $ | 2,145 | | Chesterfield County Economic Development Authority, Virginia, Revenue Bonds, Bon Secours Health, Series 2010C-2, 5.000%, 11/01/42 – AGC Insured | 11/20 at 100.00 | | AA | | $ | 2,386,870 | |
| | 3,375 | | Colorado Health Facilities Authority, Colorado, Revenue Bonds, Catholic Health Initiatives, Series 2013A, 5.250%, 1/01/40 | 1/23 at 100.00 | | A+ | | | 3,833,055 | |
| | 1,000 | | Fairfax County Industrial Development Authority, Virginia, Healthcare Revenue Bonds, Inova Health System, Series 2012A, 5.000%, 5/15/40 | 5/22 at 100.00 | | AA+ | | | 1,160,930 | |
| | 3,340 | | Fairfax County Industrial Development Authority, Virginia, Healthcare Revenue Bonds, Inova Health System, Tender Option Bond Trust 2016-XG0021, 14.144%, 11/15/29 (IF) | 5/19 at 100.00 | | AA+ | | | 4,642,834 | |
| | 4,950 | | Fairfax County Industrial Development Authority, Virginia, Hospital Revenue Refunding Bonds, Inova Health System, Series 1993A, 5.000%, 8/15/23 | No Opt. Call | | AA+ | | | 5,844,366 | |
| | | | Fredericksburg Economic Development Authority, Virginia, Hospital Facilities Revenue Bonds, MediCorp Health System, Series 2007: | | | | | | | |
| | 1,080 | | 5.250%, 6/15/18 | No Opt. Call | | Baa1 | | | 1,149,703 | |
| | 2,500 | | 5.250%, 6/15/23 | No Opt. Call | | Baa1 | | | 2,919,100 | |
| | 435 | | Hanover County Industrial Development Authority, Virginia, Hospital Revenue Bonds, Memorial Regional Medical Center, Series 1995, 6.375%,
8/15/18 – NPFG Insured | No Opt. Call | | AA– | | | 454,201 | |
| | 9,265 | | Harrisonburg Industrial Development Authority, Virginia, Hospital Facilities Revenue Bonds, Rockingham Memorial Hospital, Series 2006, 5.000%, 8/15/31 – AMBAC Insured | 8/16 at 100.00 | | AA | | | 9,346,621 | |
| | 1,500 | | Henrico County Industrial Development Authority, Virginia, Healthcare Revenue Bonds, Bon Secours Health System, Series 1996, 6.250%, 8/15/20 – NPFG Insured | No Opt. Call | | AA– | | | 1,672,110 | |
| | 3,500 | | Industrial Development Authority of the City of Newport News, Virginia, Health System Revenue Bonds, Riverside Health System, Series 2015A, 5.330%, 7/01/45 | 7/25 at 100.00 | | N/R | | | 3,710,140 | |
| | 3,155 | | Prince William County Industrial Development Authority, Virginia, Health Care Facilities Revenue Bonds, Novant Health Obligated Group-Prince William Hospital, Refunding Series 2013B, 5.000%, 11/01/46 | 11/22 at 100.00 | | AA– | | | 3,553,098 | |
| | 375 | | Stafford County Economic Development Authority, Virginia, Hospital Facilities Revenue Bonds, Mary Washington Healthcare Obligated Group, Refunding Series 2016, 4.000%, 6/15/37 | 6/26 at 100.00 | | Baa1 | | | 397,106 | |
| | 2,955 | | Virginia Small Business Finance Authority, Healthcare Facilities Revenue Bonds, Sentara Healthcare, Refunding Series 2010, 5.000%, 11/01/40 | 5/20 at 100.00 | | AA | | | 3,322,957 | |
| | 4,425 | | Virginia Small Business Financing Authority, Wellmont Health System Project Revenue Bonds, Series 2007A, 5.250%, 9/01/37 | 9/17 at 100.00 | | BBB+ | | | 4,591,734 | |
| | 2,335 | | Winchester Economic Development Authority, Virginia, Hospital Revenue Bonds, Valley Health System Obligated Group, Refunding Series 2014A, 5.000%, 1/01/44 | 1/24 at 100.00 | | A+ | | | 2,679,436 | |
| | | | Winchester Economic Development Authority, Virginia, Hospital Revenue Bonds, Valley Health System Obligated Group, Refunding Series 2015: | | | | | | | |
| | 1,500 | | 5.000%, 1/01/33 | 1/26 at 100.00 | | A+ | | | 1,790,265 | |
| | 1,000 | | 5.000%, 1/01/35 | 1/26 at 100.00 | | A+ | | | 1,185,160 | |
| | 2,000 | | 4.000%, 1/01/37 | 1/26 at 100.00 | | A+ | | | 2,175,020 | |
| | 1,215 | | 5.000%, 1/01/44 | 1/26 at 100.00 | | A+ | | | 1,419,922 | |
| | 1,020 | | Wisconsin Health and Educational Facilities Authority, Revenue Bonds, Aurora Health Care, Inc., Series 2010A, 5.625%, 4/15/39 | 4/20 at 100.00 | | A2 | | | 1,145,338 | |
| | 59,865 | | Total Health Care | | | | | | 66,809,767 | |
| | | | Housing/Multifamily – 4.9% (3.5% of Total Investments) | | | | | | | |
| | 865 | | Arlington County Industrial Development Authority, Virginia, Multifamily Housing Mortgage Revenue Bonds, Arlington View Terrace Apartments, Series 2001, 5.150%, 11/01/31 (Mandatory put 11/01/19) (Alternative Minimum Tax) | 9/16 at 100.00 | | AA | | | 867,526 | |
| | 400 | | Virginia Housing Development Authority, Rental Housing Bonds, Series 2010A, 5.000%, 4/01/45 | 10/19 at 100.00 | | AA+ | | | 421,024 | |
| | 530 | | Virginia Housing Development Authority, Rental Housing Bonds, Series 2010C, 4.550%, 8/01/32 | 2/20 at 100.00 | | AA+ | | | 561,519 | |
| | 1,000 | | Virginia Housing Development Authority, Rental Housing Bonds, Series 2012A, 3.625%, 3/01/32 | 3/21 at 100.00 | | AA+ | | | 1,037,330 | |
| NPV | Nuveen Virginia Premium Income Municipal Fund | |
| | Portfolio of Investments (continued) | May 31, 2016 |
| | Principal | | | Optional Call | | | | | | |
| | Amount (000) | | Description (1) | Provisions (2) | | Ratings (3) | | | Value | |
| | | | Housing/Multifamily (continued) | | | | | | | |
| | | | Virginia Housing Development Authority, Rental Housing Bonds, Series 2015A: | | | | | | | |
| $ | 1,000 | | 3.500%, 3/01/35 | 3/24 at 100.00 | | AA+ | | $ | 1,025,950 | |
| | 1,000 | | 3.625%, 3/01/39 | 3/24 at 100.00 | | AA+ | | | 1,031,010 | |
| | 900 | | Virginia Housing Development Authority, Rental Housing Bonds, Series 2015C, 4.000%, 8/01/45 | 8/24 at 100.00 | | AA+ | | | 940,806 | |
| | 2,750 | | Virginia Housing Development Authority, Rental Housing Bonds, Series 2015E, 3.750%, 12/01/40 | 12/24 at 100.00 | | AA+ | | | 2,880,570 | |
| | | | Virginia Housing Development Authority, Rental Housing Bonds, Series 2016B: | | | | | | | |
| | 1,500 | | 3.350%, 5/01/36 | 5/25 at 100.00 | | AA+ | | | 1,525,470 | |
| | 1,500 | | 3.550%, 5/01/41 | 5/25 at 100.00 | | AA+ | | | 1,526,415 | |
| | 1,390 | | Waynesboro Redevelopment and Housing Authority, Virginia, Multifamily Housing Revenue Bonds, Epworth Manor, GNMA Collateralized Series 2010, 5.000%, 10/20/51 | 4/20 at 100.00 | | AA+ | | | 1,473,386 | |
| | 12,835 | | Total Housing/Multifamily | | | | | | 13,291,006 | |
| | | | Housing/Single Family – 5.5% (3.9% of Total Investments) | | | | | | | |
| | 7,900 | | Virginia Housing Development Authority, Commonwealth Mortgage Bonds, Series 2007B, 4.750%, 7/01/32 (Alternative Minimum Tax) | 7/16 at 100.00 | | AAA | | | 7,910,664 | |
| | | | Virginia Housing Development Authority, Commonwealth Mortgage Bonds, Series 2012C-5: | | | | | | | |
| | 2,500 | | 4.550%, 7/01/31 | 10/22 at 100.00 | | AAA | | | 2,782,900 | |
| | 2,000 | | 4.800%, 7/01/38 | 10/22 at 100.00 | | AAA | | | 2,195,280 | |
| | | | Virginia Housing Development Authority, Commonwealth Mortgage Bonds, Series 2012C-8: | | | | | | | |
| | 715 | | 4.400%, 10/01/31 | 10/22 at 100.00 | | AAA | | | 783,118 | |
| | 1,000 | | 4.750%, 10/01/38 | 10/22 at 100.00 | | AAA | | | 1,091,780 | |
| | 14,115 | | Total Housing/Single Family | | | | | | 14,763,742 | |
| | | | Long-Term Care – 6.6% (4.6% of Total Investments) | | | | | | | |
| | 2,000 | | Albemarle County Industrial Development Authority, Virginia, Residential Care Facilities Mortgage Revenue Bonds, Westminster-Canterbury of the Blue Ridge, Series 2007, 5.000%, 1/01/31 | 1/17 at 100.00 | | N/R | | | 2,017,220 | |
| | 5,585 | | Fairfax County Economic Development Authority, Virginia, Residential Care Facilities Mortgage Revenue Bonds, Goodwin House, Inc., Series 2007A, 5.125%, 10/01/37 | 10/17 at 100.00 | | BBB | | | 5,784,496 | |
| | | | Fairfax County Economic Development Authority, Virginia, Retirement Center Revenue Bonds, Greenspring Village, Series 2006A: | | | | | | | |
| | 1,000 | | 4.750%, 10/01/26 | 10/16 at 100.00 | | A+ | | | 1,012,890 | |
| | 800 | | 4.875%, 10/01/36 | 10/16 at 100.00 | | A+ | | | 809,344 | |
| | 875 | | Henrico County Economic Development Authority, Virginia, Residential Care Facility Revenue Bonds, Westminster Canterbury of Richmond, Refunding Series 2015, 4.000%, 10/01/35 | 10/20 at 100.00 | | BBB+ | | | 897,199 | |
| | 3,590 | | Industrial Development Authority of the County of Prince William, Virginia, Residential Care Facility Revenue Bonds, Westminster at Lake, First Mortgage, Series 2006, 5.125%, 1/01/26 | 1/17 at 100.00 | | N/R | | | 3,603,247 | |
| | 1,000 | | Roanoke Economic Development Authority, Virginia, Residential Care Facility Mortgage Revenue Refunding Bonds, Virginia Lutheran Homes Brandon Oaks Project, Series 2012, 4.625%, 12/01/27 | 12/22 at 100.00 | | N/R | | | 1,018,260 | |
| | 1,500 | | Roanoke Industrial Development Authority, Virginia, Residential Revenue Bonds, Virginia Lutheran Homes Incorporated, Series 2006, 5.000%, 12/01/39 | 12/16 at 100.00 | | N/R | | | 1,501,755 | |
| | 1,000 | | Suffolk Industrial Development Authority, Virginia, Retirement Facilities First Mortgage Revenue Bonds, Lake Prince Center, Series 2006, 5.300%, 9/01/31 | 9/16 at 100.00 | | N/R | | | 1,002,310 | |
| | 17,350 | | Total Long-Term Care | | | | | | 17,646,721 | |
| | | | Tax Obligation/General – 4.1% (2.9% of Total Investments) | | | | | | | |
| | 2,000 | | Alexandria, Virginia, General Obligation Bonds, Capital Improvement Series 2013, 5.000%, 6/15/16 | No Opt. Call | | AAA | | | 2,003,620 | |
| | 1,440 | | Bristol, Virginia, General Obligation Bonds, Refunding & Improvement Series 2010, 5.000%, 7/15/25 | 7/20 at 100.00 | | A | | | 1,631,189 | |
| | Principal | | | Optional Call | | | | | | |
| | Amount (000) | | Description (1) | Provisions (2) | | Ratings (3) | | | Value | |
| | | | Tax Obligation/General (continued) | | | | | | | |
| $ | 2,000 | | Henrico County, Virginia, General Obligation Bonds, Public Improvement Series 2010A, 4.000%, 8/01/16 | No Opt. Call | | AAA | | $ | 2,011,840 | |
| | 2,340 | | Norfolk, Virginia, General Obligation Bonds, Capital Improvement Series 2012C, 4.000%, 10/01/16 | No Opt. Call | | AA+ | | | 2,367,589 | |
| | 150 | | Portsmouth, Virginia, General Obligation Bonds, Refunding Series 2010D, 5.000%, 7/15/34 | 7/20 at 100.00 | | AA | | | 171,845 | |
| | 1,250 | | Richmond, Virginia, General Obligation Bonds, Refunding Public Improvement Series 2014A, 5.000%, 3/01/19 | No Opt. Call | | AA+ | | | 1,388,900 | |
| | 1,500 | | Virginia Public School Authority, Special Obligation School Financing Bonds, Prince William County, Series 2014, 4.000%, 7/15/16 | No Opt. Call | | AAA | | | 1,506,525 | |
| | 10,680 | | Total Tax Obligation/General | | | | | | 11,081,508 | |
| | | | Tax Obligation/Limited – 27.9% (19.6% of Total Investments) | | | | | | | |
| | | | Buena Vista Public Recreational Facilities Authority, Virginia, Lease Revenue Bonds, Golf Course Project, Series 2005A: | | | | | | | |
| | 555 | | 5.250%, 7/15/25 – ACA Insured | 1/17 at 100.00 | | N/R | | | 509,784 | |
| | 520 | | 5.500%, 7/15/35 – ACA Insured | 1/17 at 100.00 | | N/R | | | 477,282 | |
| | 610 | | Cumberland County, Virginia, Certificates of Participation, Series 1997, 6.375%, 7/15/17 | No Opt. Call | | N/R | | | 634,675 | |
| | 600 | | Dulles Town Center Community Development Authority, Loudon County, Virginia Special Assessment Refunding Bonds, Dulles Town Center Project, Series 2012, 4.250%, 3/01/26 | No Opt. Call | | N/R | | | 622,362 | |
| | 100 | | Embrey Mill Community Development Authority, Virginia, Special Assessment Revenue Bonds, Series 2015, 5.600%, 3/01/45 | 3/25 at 100.00 | | N/R | | | 102,943 | |
| | | | Government of Guam, Business Privilege Tax Bonds, Refunding Series 2015D: | | | | | | | |
| | 3,000 | | 5.000%, 11/15/31 | 11/25 at 100.00 | | A | | | 3,547,650 | |
| | 3,000 | | 5.000%, 11/15/33 | 11/25 at 100.00 | | A | | | 3,520,410 | |
| | | | Government of Guam, Business Privilege Tax Bonds, Series 2011A: | | | | | | | |
| | 1,020 | | 5.000%, 1/01/31 | 1/22 at 100.00 | | A | | | 1,148,132 | |
| | 500 | | 5.250%, 1/01/36 | 1/22 at 100.00 | | A | | | 566,770 | |
| | 925 | | Greater Richmond Convention Center Authority, Virginia, Hotel Tax Revenue Bonds, Refunding Series 2015, 5.000%, 6/15/19 | No Opt. Call | | A+ | | | 1,033,216 | |
| | 645 | | Puerto Rico Highway and Transportation Authority, Highway Revenue Bonds, Series 2007N, 5.500%, 7/01/29 – AMBAC Insured | No Opt. Call | | CC | | | 681,068 | |
| | | | Puerto Rico Infrastructure Financing Authority, Special Tax Revenue Bonds, Series 2005A: | | | | | | | |
| | 5,085 | | 0.000%, 7/01/29 – AMBAC Insured | No Opt. Call | | Ca | | | 2,070,968 | |
| | 5,000 | | 0.000%, 7/01/43 – AMBAC Insured | No Opt. Call | | Ca | | | 782,850 | |
| | 5,875 | | Puerto Rico Infrastructure Financing Authority, Special Tax Revenue Bonds, Series 2005C, 0.000%, 7/01/28 – AMBAC Insured | No Opt. Call | | Ca | | | 2,568,785 | |
| | 10,000 | | Puerto Rico Sales Tax Financing Corporation, Sales Tax Revenue Bonds, Series 2007A, 0.000%, 8/01/41 – NPFG Insured | No Opt. Call | | AA– | | | 2,006,600 | |
| | 5 | | Puerto Rico, Highway Revenue Bonds, Highway and Transportation Authority, Series 2003AA, 5.500%, 7/01/18 – NPFG Insured | No Opt. Call | | AA– | | | 5,120 | |
| | 760 | | Puerto Rico, Highway Revenue Bonds, Highway and Transportation Authority, Series 2007CC, 5.500%, 7/01/28 – NPFG Insured | No Opt. Call | | AA– | | | 793,767 | |
| | 95 | | Stafford County and Staunton Industrial Development Authority, Virginia, Revenue Bonds, Virginia Municipal League and Virginia Association of Counties Finance Program, Series 2007C, 5.000%, 2/01/37 – SYNCORA GTY Insured | No Opt. Call | | N/R | | | 96,185 | |
| | 1,000 | | Stafford County Economic Development Authority, Virginia, Public Project Lease Revenue Bonds, Series 2008, 5.000%, 4/01/33 – AGC Insured (UB) | 4/18 at 100.00 | | AA+ | | | 1,067,460 | |
| | 1,500 | | Virgin Islands Public Finance Authority, Federal Highway Grant Anticipation Loan Note Revenue Bonds, Series 2015, 5.000%, 9/01/30 | 9/25 at 100.00 | | A | | | 1,770,345 | |
| NPV | Nuveen Virginia Premium Income Municipal Fund | |
| | Portfolio of Investments (continued) | May 31, 2016 |
| | Principal | | | Optional Call | | | | | | |
| | Amount (000) | | Description (1) | Provisions (2) | | Ratings (3) | | | Value | |
| | | | Tax Obligation/Limited (continued) | | | | | | | |
| $ | 2,240 | | Virgin Islands Public Finance Authority, Gross Receipts Taxes Loan Note, Working Capital Series 2014A, 5.000%, 10/01/34 – AGM Insured | 10/24 at 100.00 | | AA | | $ | 2,573,402 | |
| | 3,000 | | Virgin Islands Public Finance Authority, Matching Fund Loan Notes Revenue Bonds, Senior Lien Series 2010A, 5.000%, 10/01/29 | 10/20 at 100.00 | | BBB | | | 3,286,710 | |
| | 2,600 | | Virgin Islands Public Finance Authority, Matching Fund Loan Notes Revenue Bonds, Senior Lien, Refunding Series 2013B, 5.000%, 10/01/24 – AGM Insured | No Opt. Call | | AA | | | 3,043,586 | |
| | 1,000 | | Virgin Islands Public Finance Authority, Matching Fund Loan Notes Revenue Bonds, Senior Lien, Series 2013A, 5.000%, 10/01/24 – AGM Insured | No Opt. Call | | AA | | | 1,228,340 | |
| | 1,000 | | Virgin Islands Public Finance Authority, Matching Fund Loan Notes Revenue Bonds, Series 2009B, 5.000%, 10/01/25 | 10/19 at 100.00 | | BBB | | | 1,107,160 | |
| | | | Virgin Islands Public Finance Authority, Matching Fund Loan Notes Revenue Bonds, Series 2012A: | | | | | | | |
| | 600 | | 5.000%, 10/01/32 | 10/22 at 100.00 | | BBB | | | 651,408 | |
| | 1,725 | | 5.000%, 10/01/32 – AGM Insured | 10/22 at 100.00 | | AA | | | 1,926,584 | |
| | 1,950 | | Virgin Islands Public Finance Authority, Matching Fund Loan Notes Revenue Bonds, Subordinate Lien Series 2010B, 5.250%, 10/01/29 | 10/20 at 100.00 | | Baa2 | | | 2,149,466 | |
| | | | Virginia College Building Authority, Educational Facilities Revenue Bonds, 21st Century College Program, Series 2011A: | | | | | | | |
| | 500 | | 5.000%, 2/01/17 | No Opt. Call | | AA+ | | | 514,745 | |
| | 1,200 | | 4.000%, 2/01/29 | No Opt. Call | | AA+ | | | 1,328,364 | |
| | 1,665 | | Virginia College Building Authority, Educational Facilities Revenue Bonds, 21st Century College Program, Tender Option Bond Trust 4B, 12.536%, 2/01/28 (IF) (4) | 2/19 at 100.00 | | AA+ | | | 2,205,742 | |
| | 1,195 | | Virginia Commonwealth Transportation Board, Federal Transportation Grant Anticipation Revenue Notes, Series 2012A, 5.000%, 9/15/16 | No Opt. Call | | Aa1 | | | 1,210,607 | |
| | 8,510 | | Virginia Public Building Authority, Public Facilities Revenue Bonds, Refunding Series 2015B, 5.000%, 8/01/16 | No Opt. Call | | AA+ | | | 8,574,675 | |
| | 1,100 | | Virginia Public School Authority, School Financing Bonds, 1997 Resolution, Refunding Series 2012A, 5.000%, 8/01/24 | No Opt. Call | | AA+ | | | 1,341,263 | |
| | 1,615 | | Virginia Public School Authority, School Financing Bonds, 1997 Resolution, Series 2012C, 5.000%, 8/01/16 | No Opt. Call | | AA+ | | | 1,627,209 | |
| | 2,970 | | Virginia Public School Authority, School Financing Bonds, 1997 Resolution, Series 2016A, 5.000%, 8/01/17 | No Opt. Call | | AA+ | | | 3,120,787 | |
| | 5,260 | | Virginia Resources Authority, Infrastructure Revenue Bonds, Pooled Financing Program, Series 2012A, 5.000%, 11/01/42 | No Opt. Call | | AAA | | | 6,226,630 | |
| | 95 | | Virginia Resources Authority, Infrastructure Revenue Bonds, Pooled Loan Bond Program, Series 2002A, 5.000%, 5/01/19 | 11/16 at 100.00 | | AA | | | 95,377 | |
| | 2,325 | | Virginia Transportation Board, Transportation Revenue Bonds, Capital Projects, Series 2011, 5.000%, 5/15/17 | No Opt. Call | | AA+ | | | 2,422,906 | |
| | 4,500 | | Virginia Transportation Board, Transportation Revenue Bonds, Capital Projects, Series 2014, 4.000%, 5/15/31 | 5/24 at 100.00 | | AA+ | | | 5,039,325 | |
| | 1,220 | | Virginia Transportation Board, Transportation Revenue Bonds, U.S. Route 58 Corridor Development Program, Series 2007B, 5.000%, 5/15/17 | No Opt. Call | | AA+ | | | 1,271,374 | |
| | 87,065 | | Total Tax Obligation/Limited | | | | | | 74,952,032 | |
| | | | Transportation – 23.3% (16.3% of Total Investments) | | | | | | | |
| | 1,000 | | Chesapeake Bay Bridge and Tunnel Commission, Virginia, General Resolution Revenue Refunding Bonds, Series 1998, 5.500%, 7/01/25 – NPFG Insured | No Opt. Call | | AA– | | | 1,260,500 | |
| | | | Chesapeake, Virginia, Transportation System Senior Toll Road Revenue Bonds, Capital Appreciation Series 2012B: | | | | | | | |
| | 2,000 | | 0.000%, 7/15/32 (5) | 7/28 at 100.00 | | BBB | | | 1,637,040 | |
| | 4,125 | | 0.000%, 7/15/40 (5) | 7/28 at 100.00 | | BBB | | | 3,265,515 | |
| | 1,000 | | 0.000%, 7/15/40 – AGM Insured (5) | 7/28 at 100.00 | | AA | | | 809,880 | |
| | 750 | | Metropolitan Washington Airports Authority, Virginia, Airport System Revenue Bonds, Refunding Series 2010B, 5.000%, 10/01/26 (Alternative Minimum Tax) | 10/20 at 100.00 | | AA– | | | 853,800 | |
| | Principal | | | Optional Call | | | | | | |
| | Amount (000) | | Description (1) | Provisions (2) | | Ratings (3) | | | Value | |
| | | | Transportation (continued) | | | | | | | |
| $ | 3,550 | | Metropolitan Washington Airports Authority, Virginia, Airport System Revenue Bonds, Series 2006B, 5.000%, 10/01/36 – FGIC Insured (Alternative Minimum Tax) | 10/16 at 100.00 | | AA+ | | $ | 3,600,801 | |
| | 2,500 | | Metropolitan Washington Airports Authority, Virginia, Airport System Revenue Bonds, Series 2007B, 5.000%, 10/01/35 – AMBAC Insured (Alternative Minimum Tax) | 10/17 at 100.00 | | AA– | | | 2,613,150 | |
| | | | Metropolitan Washington Airports Authority, Virginia, Airport System Revenue Bonds, Series 2009C: | | | | | | | |
| | 1,380 | | 5.250%, 10/01/22 | No Opt. Call | | AA– | | | 1,511,128 | |
| | 1,200 | | 5.000%, 10/01/28 | 10/18 at 100.00 | | AA– | | | 1,302,780 | |
| | | | Metropolitan Washington Airports Authority, Virginia, Airport System Revenue Bonds, Series 2010A: | | | | | | | |
| | 3,400 | | 5.000%, 10/01/30 | 10/20 at 100.00 | | AA– | | | 3,913,978 | |
| | 420 | | 5.000%, 10/01/35 | 10/20 at 100.00 | | AA– | | | 480,207 | |
| | 6,700 | | Metropolitan Washington Airports Authority, Virginia, Dulles Toll Road Revenue Bonds, Dulles Metrorail Capital Appreciation, Second Senior Lien Series 2010B, 0.000%, 10/01/44 (5) | 10/28 at 100.00 | | BBB+ | | | 7,897,624 | |
| | | | Metropolitan Washington Airports Authority, Virginia, Dulles Toll Road Second Senior Lien Revenue Bonds, Series 2009B: | | | | | | | |
| | 4,000 | | 0.000%, 10/01/26 – AGC Insured | No Opt. Call | | AA | | | 2,896,000 | |
| | 11,825 | | 0.000%, 10/01/34 – AGC Insured | No Opt. Call | | AA | | | 6,066,107 | |
| | 1,135 | | 0.000%, 10/01/36 – AGC Insured | No Opt. Call | | AA | | | 539,239 | |
| | 5,010 | | 0.000%, 10/01/39 – AGC Insured | No Opt. Call | | AA | | | 2,137,817 | |
| | 3,000 | | Richmond Metropolitan Authority, Virginia, Revenue Refunding Bonds, Expressway System, Series 2002, 5.250%, 7/15/22 – FGIC Insured | No Opt. Call | | AA– | | | 3,441,900 | |
| | 3,195 | | Virginia Port Authority, Port Facilities Revenue Refunding Bonds Series 2010, 5.000%, 7/01/40 | 7/19 at 100.00 | | Aa3 | | | 3,540,411 | |
| | 1,500 | | Virginia Small Business Financing Authority, Senior Lien Revenue Bonds, 95 Express Lanes LLC Project, Series 2012, 5.000%, 1/01/40 (Alternative Minimum Tax) | 1/22 at 100.00 | | BBB– | | | 1,647,465 | |
| | | | Virginia Small Business Financing Authority, Senior Lien Revenue Bonds, Elizabeth River Crossing, Opco LLC Project, Series 2012: | | | | | | | |
| | 750 | | 5.250%, 1/01/32 (Alternative Minimum Tax) | 7/22 at 100.00 | | BBB– | | | 856,613 | |
| | 5,000 | | 6.000%, 1/01/37 (Alternative Minimum Tax) | 7/22 at 100.00 | | BBB– | | | 5,950,700 | |
| | 5,500 | | 5.500%, 1/01/42 (Alternative Minimum Tax) | 7/22 at 100.00 | | BBB– | | | 6,325,220 | |
| | 68,940 | | Total Transportation | | | | | | 62,547,875 | |
| | | | U.S. Guaranteed – 20.0% (14.0% of Total Investments) (6) | | | | | | | |
| | 1,750 | | Bristol, Virginia, General Obligation Utility System Revenue Bonds, Series 2002, 5.000%, 11/01/24 – AGM Insured (ETM) | No Opt. Call | | AA (6) | | | 2,079,945 | |
| | 1,000 | | Bristol, Virginia, Utility System Revenue Refunding Bonds, Series 2001, 5.000%, 7/15/21 – AGM Insured (ETM) | No Opt. Call | | AA (6) | | | 1,111,800 | |
| | 4,150 | | Fairfax County Economic Development Authority, Virginia, Transportation District Improvement Revenue Bonds, Silver Line Phase 1 Project, Series 2011, 5.000%, 4/01/27 (Pre-refunded 4/01/20) | 4/20 at 100.00 | | Aa1 (6) | | | 4,771,878 | |
| | 1,295 | | Hampton Roads Sanitation District, Virginia, Wastewater Revenue Bonds, Series 2012A, 5.000%, 1/01/39 (Pre-refunded 1/01/21) | 1/21 at 100.00 | | AA+ (6) | | | 1,522,985 | |
| | 1,000 | | Lexington Industrial Development Authority, Virginia, Educational Facilities Revenue Bonds, VMI Development Board Project, Series 2006C, 5.000%, 12/01/36 (Pre-refunded 6/01/19) | 6/19 at 100.00 | | Aa2 (6) | | | 1,121,300 | |
| | 1,700 | | Loudoun County, Virginia, General Obligation Bonds, Series 2006B, 5.000%, 12/01/25 (Pre-refunded 12/01/16) | 12/16 at 100.00 | | AAA | | | 1,737,944 | |
| | 890 | | Montgomery County Industrial Development Authority, Virginia, Public Facility Lease Revenue Bonds, Public Projects Series 2008, 5.000%, 2/01/29 (Pre-refunded 2/01/18) | 2/18 at 100.00 | | Aa2 (6) | | | 952,523 | |
| | 5,900 | | Portsmouth, Virginia, General Obligation Bonds, Refunding Series 2010D, 5.000%, 7/15/34 (Pre-refunded 7/15/20) | 7/20 at 100.00 | | N/R (6) | | | 6,843,174 | |
| | 145 | | Puerto Rico, Highway Revenue Bonds, Highway and Transportation Authority, Series 2003AA, 5.500%, 7/01/18 – NPFG Insured (ETM) | No Opt. Call | | A3 (6) | | | 157,711 | |
| | 710 | | Puerto Rico, Highway Revenue Bonds, Highway and Transportation Authority, Series 2005BB, 5.250%, 7/01/22 – AGM Insured (ETM) | No Opt. Call | | A2 (6) | | | 852,582 | |
| NPV | Nuveen Virginia Premium Income Municipal Fund | |
| | Portfolio of Investments (continued) | May 31, 2016 |
| | Principal | | | Optional Call | | | | | | |
| | Amount (000) | | Description (1) | Provisions (2) | | Ratings (3) | | | Value | |
| | | | U.S. Guaranteed (6) (continued) | | | | | | | |
| $ | 1,000 | | Richmond, Virginia, General Obligation Bonds, Public Improvement Series 2009A, 5.000%, 7/15/22 (Pre-refunded 7/15/19) | 7/19 at 100.00 | | AA+ (6) | | $ | 1,124,660 | |
| | | | Stafford County and Staunton Industrial Development Authority, Virginia, Revenue Bonds, Virginia Municipal League and Virginia Association of Counties Finance Program, Series 2006A: | | | | | | | |
| | 710 | | 5.000%, 8/01/23 (Pre-refunded 8/01/16) – NPFG Insured | 8/16 at 100.00 | | A3 (6) | | | 715,247 | |
| | 2,490 | | 5.000%, 8/01/23 (Pre-refunded 8/01/16) – NPFG Insured | 8/16 at 100.00 | | A3 (6) | | | 2,508,401 | |
| | | | Stafford County and Staunton Industrial Development Authority, Virginia, Revenue Bonds, Virginia Municipal League and Virginia Association of Counties Finance Program, Series 2007C: | | | | | | | |
| | 50 | | 5.000%, 2/01/37 (Pre-refunded 2/01/17) – SYNCORA GTY Insured | 2/17 at 100.00 | | N/R (6) | | | 51,458 | |
| | 60 | | 5.000%, 2/01/37 (Pre-refunded 2/01/17) – SYNCORA GTY Insured | 2/17 at 100.00 | | N/R (6) | | | 61,750 | |
| | 105 | | 5.000%, 2/01/37 (Pre-refunded 2/01/17) – SYNCORA GTY Insured | 2/17 at 100.00 | | N/R (6) | | | 108,084 | |
| | 190 | | 5.000%, 2/01/37 (Pre-refunded 2/01/17) – SYNCORA GTY Insured | 2/17 at 100.00 | | N/R (6) | | | 195,540 | |
| | 4,000 | | Stafford County Economic Development Authority, Virginia, Public Project Lease Revenue Bonds, Series 2008, 5.000%, 4/01/33 (Pre-refunded 4/01/18) – AGC Insured (UB) | 4/18 at 100.00 | | AA (6) | | | 4,303,600 | |
| | | | Virginia Beach, Virginia, General Obligation Bonds, Series 2008: | | | | | | | |
| | 4,500 | | 5.000%, 10/01/26 (Pre-refunded 10/01/17) (UB) | 10/17 at 100.00 | | AAA | | | 4,759,110 | |
| | 4,500 | | 5.000%, 10/01/27 (Pre-refunded 10/01/17) (UB) | 10/17 at 100.00 | | AAA | | | 4,759,110 | |
| | 1,820 | | Virginia College Building Authority, Educational Facilities Revenue Bonds, 21st Century College Program, Series 2009A, 5.000%, 2/01/22 (Pre-refunded 2/01/19) | 2/19 at 100.00 | | AA+ (6) | | | 2,018,362 | |
| | 1,665 | | Virginia College Building Authority, Educational Facilities Revenue Bonds, 21st Century College Program, Tender Option Bond Trust 3B, 12.536%, 2/01/27 (Pre-refunded 2/01/19) (IF) (4) | 2/19 at 100.00 | | AA+ (6) | | | 2,209,938 | |
| | | | Virginia College Building Authority, Educational Facilities Revenue Bonds, Public Higher Education Financing Program, Series 2009A: | | | | | | | |
| | 30 | | 5.000%, 9/01/28 (Pre-refunded 9/01/18) | 9/18 at 100.00 | | N/R (6) | | | 32,821 | |
| | 3,570 | | 5.000%, 9/01/28 (Pre-refunded 9/01/18) | 9/18 at 100.00 | | Aa1 (6) | | | 3,905,723 | |
| | 1,000 | | Virginia Resources Authority, Clean Water State Revolving Fund Revenue Bonds, Series 2008, 5.000%, 10/01/19 (Pre-refunded 10/01/18) | 10/18 at 100.00 | | AAA | | | 1,096,760 | |
| | 1,620 | | Winchester Industrial Development Authority, Virginia, Hospital Revenue Bonds Valley Health System Obligated Group, Series 2009E, 5.625%, 1/01/44 (Pre-refunded 1/01/19) | 1/19 at 100.00 | | A+ (6) | | | 1,814,789 | |
| | 2,855 | | Winchester Industrial Development Authority, Virginia, Hospital Revenue Bonds, Winchester Medical Center, Series 2007, 5.125%, 1/01/31 (Pre-refunded 1/01/17) | 1/17 at 100.00 | | A+ (6) | | | 2,930,343 | |
| | 48,705 | | Total U.S. Guaranteed | | | | | | 53,747,538 | |
| | | | Utilities – 2.6% (1.9% of Total Investments) | | | | | | | |
| | | | Guam Power Authority, Revenue Bonds, Series 2012A: | | | | | | | |
| | 1,550 | | 5.000%, 10/01/30 – AGM Insured | 10/22 at 100.00 | | AA | | | 1,845,601 | |
| | 495 | | 5.000%, 10/01/34 | 10/22 at 100.00 | | BBB | | | 549,589 | |
| | 655 | | Puerto Rico Electric Power Authority, Power Revenue Bonds, Series 2007UU, 5.000%, 7/01/19 – NPFG Insured | No Opt. Call | | AA– | | | 679,287 | |
| | 730 | | Virgin Islands Water and Power Authority, Electric System Revenue Bonds, Refunding Series 2007A, 5.000%, 7/01/24 | 7/17 at 100.00 | | BB+ | | | 730,358 | |
| | 3,250 | | York County Economic Development Authority, Virginia, Pollution Control Revenue Bonds, Virginia Electric and Power Company Project, Refunding Series 2009A, 1.875%, 5/01/33 (Mandatory put 5/16/19) | No Opt. Call | | A2 | | | 3,311,425 | |
| | 6,680 | | Total Utilities | | | | | | 7,116,260 | |
| | Principal | | | Optional Call | | | | | | |
| | Amount (000) | | Description (1) | Provisions (2) | | Ratings (3) | | | Value | |
| | | | Water and Sewer – 7.8% (5.5% of Total Investments) | | | | | | | |
| $ | 1,395 | | Fairfax County, Virginia, Sewer Revenue Bonds, Series 2012, 5.000%, 7/15/18 | No Opt. Call | | AAA | | $ | 1,519,434 | |
| | 810 | | Guam Government Waterworks Authority, Water and Wastewater System Revenue Bonds, Series 2013, 5.500%, 7/01/43 | 7/23 at 100.00 | | A– | | | 949,612 | |
| | 5,205 | | Hampton Roads Sanitation District, Virginia, Wastewater Revenue Bonds, Series 2012A, 5.000%, 1/01/39 | 1/21 at 100.00 | | AA+ | | | 5,932,086 | |
| | | | Henry County Public Service Authority, Virginia, Water and Sewerage Revenue Refunding Bonds, Series 2001: | | | | | | | |
| | 1,265 | | 5.500%, 11/15/17 – AGM Insured | No Opt. Call | | AA | | | 1,315,954 | |
| | 3,000 | | 5.500%, 11/15/19 – AGM Insured | No Opt. Call | | AA | | | 3,362,310 | |
| | 3,000 | | Norfolk, Virginia, Water Revenue Bonds, Series 2015A, 5.250%, 11/01/44 | 11/24 at 100.00 | | AA+ | | | 3,653,130 | |
| | 1,000 | | Virginia Resources Authority, Water and Sewerage System Revenue Bonds, Goochland County – Tuckahoe Creek Service District Project, Series 2012, 0.000%, 11/01/34 | 11/22 at 63.13 | | AA | | | 536,530 | |
| | 3,050 | | Virginia State Resources Authority, Clean Water Revenue Bonds, Series 2007, Trust 3036, 12.486%, 4/01/17 (IF) | No Opt. Call | | Aaa | | | 3,766,079 | |
| | 18,725 | | Total Water and Sewer | | | | | | 21,035,135 | |
| $ | 449,350 | | Total Long-Term Investments (cost $354,388,840) | | | | | | 382,428,105 | |
| | | | Floating Rate Obligations – (3.4)% | | | | | | (9,250,000 | ) |
| | | | Variable Rate Demand Preferred Shares, at Liquidation
Preference – (47.6)% (7) | | | | | | (128,000,000 | ) |
| | | | Other Assets Less Liabilities – 8.8% | | | | | | 23,781,594 | |
| | | | Net Assets Applicable to Common Shares – 100% | | | | | $ | 268,959,699 | |
| (1) | All percentages shown in the Portfolio of Investments are based on net assets applicable to common shares unless otherwise noted. |
| (2) | Optional Call Provisions (not covered by the report of independent registered public accounting firm): Dates (month and year) and prices of the earliest optional call or redemption. There may be other call provisions at varying prices at later dates. Certain mortgage-backed securities may be subject to periodic principal paydowns. |
| (3) | Ratings (not covered by the report of independent registered public accounting firm): Using the highest of Standard & Poor's Group ("Standard & Poor's"), Moody's Investors Service, Inc. ("Moody's") or Fitch, Inc. ("Fitch") rating. Ratings below BBB by Standard & Poor's, Baa by Moody's or BBB by Fitch are considered to be below investment grade. Holdings designated N/R are not rated by any of these national rating agencies. |
| (4) | Investment, or portion of investment, has been pledged to collateralize the net payment obligations for investments in inverse floating rate transactions. |
| (5) | Step-up coupon. The rate shown is the coupon as of the end of the reporting period. |
| (6) | Backed by an escrow or trust containing sufficient U.S. Government or U.S. Government agency securities, which ensure the timely payment of principal and interest. Certain bonds backed by U.S. Government or agency securities are regarded as having an implied rating equal to the rating of such securities. |
| (7) | Variable Rate Demand Preferred Shares, at Liquidation Preference as a percentage of Total Investments is 33.5%. |
| (ETM) | Escrowed to maturity. |
| (IF) | Inverse floating rate investment. |
| (UB) | Underlying bond of an inverse floating rate trust reflected as a financing transaction. See Notes to Financial Statements, Note 3 – Portfolio Securities and Investments in Derivatives, Inverse Floating Rate Securities for more information. |
See accompanying notes to financial statements.
| Statement of | |
| | Assets and Liabilities | May 31, 2016 |
| | | | Georgia | | | Maryland | | | Minnesota | |
| | | | Dividend | | | Premium | | | Municipal | |
| | | | Advantage 2 | | | Income | | | Income | |
| | | | (NKG | ) | | (NMY | ) | | (NMS | ) |
| Assets | | | | | | | | | | |
| Long-term investments, at value (cost $207,641,968, $487,652,339 and $120,710,667, respectively) | | $ | 223,632,167 | | $ | 518,513,679 | | $ | 130,900,918 | |
| Cash | | | 2,081,079 | | | 5,591,882 | | | — | |
| Receivable for: | | | | | | | | | | |
| Interest | | | 3,089,243 | | | 8,511,500 | | | 1,546,984 | |
| Investments sold | | | 5,836,823 | | | 5,946,000 | | | 1,930,213 | |
| Deferred offering costs | | | 26,891 | | | 38,387 | | | 69,832 | |
| Other assets | | | 4,790 | | | 20,930 | | | 4,726 | |
| Total assets | | | 234,670,993 | | | 538,622,378 | | | 134,452,673 | |
| Liabilities | | | | | | | | | | |
| Cash overdraft | | | — | | | — | | | 1,858,123 | |
| Floating rate obligations | | | 3,245,000 | | | 15,215,000 | | | — | |
| Payable for: | | | | | | | | | | |
| Dividends | | | 550,278 | | | 1,255,381 | | | 362,683 | |
| Interest | | | 84,282 | | | 190,499 | | | 50,305 | |
| Investments purchased | | | 3,748,590 | | | 1,956,255 | | | — | |
| Variable Rate MuniFund Term Preferred ("VMTP") Shares, at liquidation preference | | | 75,000,000 | | | 167,000,000 | | | 44,100,000 | |
| Variable Rate Demand Preferred ("VRDP") Shares, at liquidation preference | | | — | | | — | | | — | |
| Accrued expenses: | | | | | | | | | | |
| Management fees | | | 119,626 | | | 269,815 | | | 69,624 | |
| Trustees fees | | | 800 | | | 17,809 | | | 466 | |
| Other | | | 62,442 | | | 136,426 | | | 69,660 | |
| Total liabilities | | | 82,811,018 | | | 186,041,185 | | | 46,510,861 | |
| Net assets applicable to common shares | | $ | 151,859,975 | | $ | 352,581,193 | | $ | 87,941,812 | |
| Common shares outstanding | | | 10,549,313 | | | 23,374,664 | | | 5,571,686 | |
| Net asset value ("NAV") per common share outstanding | | $ | 14.40 | | $ | 15.08 | | $ | 15.78 | |
| Net assets applicable to common shares consist of: | | | | | | | | | | |
| Common shares, $0.01 par value per share | | $ | 105,493 | | $ | 233,747 | | $ | 55,717 | |
| Paid-in surplus | | | 141,902,844 | | | 328,520,349 | | | 78,324,446 | |
| Undistributed (Over-distribution of) net investment income | | | 367,014 | | | 1,589,758 | | | 356,496 | |
| Accumulated net realized gain (loss) | | | (6,505,575 | ) | | (8,624,001 | ) | | (985,098 | ) |
| Net unrealized appreciation (depreciation) | | | 15,990,199 | | | 30,861,340 | | | 10,190,251 | |
| Net assets applicable to common shares | | $ | 151,859,975 | | $ | 352,581,193 | | $ | 87,941,812 | |
| Authorized shares: | | | | | | | | | | |
| Common | | | Unlimited | | | Unlimited | | | Unlimited | |
| Preferred | | | Unlimited | | | Unlimited | | | Unlimited | |
See accompanying notes to financial statements.
| | | | | | | North | | | | |
| | | | Missouri | | | Carolina | | | Virginia | |
| | | | Premium | | | Premium | | | Premium | |
| | | | Income | | | Income | | | Income | |
| | | | (NOM | ) | | (NNC | ) | | (NPV | ) |
| Assets | | | | | | | | | | |
| Long-term investments, at value (cost $49,058,719, $348,977,771 and $354,388,840, respectively) | | $ | 53,257,308 | | $ | 380,308,402 | | $ | 382,428,105 | |
| Cash | | | 134,979 | | | 1,145,301 | | | 2,775,568 | |
| Receivable for: | | | | | | | | | | |
| Interest | | | 657,791 | | | 5,317,651 | | | 4,869,049 | |
| Investments sold | | | 85,000 | | | 3,935,000 | | | 16,820,710 | |
| Deferred offering costs | | | 69,225 | | | 37,336 | | | 412,534 | |
| Other assets | | | 414 | | | 16,399 | | | 116,384 | |
| Total assets | | | 54,204,717 | | | 390,760,089 | | | 407,422,350 | |
| Liabilities | | | | | | | | | | |
| Cash overdraft | | | — | | | — | | | — | |
| Floating rate obligations | | | 2,225,000 | | | — | | | 9,250,000 | |
| Payable for: | | | | | | | | | | |
| Dividends | | | 135,398 | | | 782,521 | | | 907,316 | |
| Interest | | | 19,771 | | | 142,589 | | | — | |
| Investments purchased | | | — | | | 9,048,955 | | | — | |
| Variable Rate MuniFund Term Preferred ("VMTP") Shares, at liquidation preference | | | 18,000,000 | | | 125,000,000 | | | — | |
| Variable Rate Demand Preferred ("VRDP") Shares, at liquidation preference | | | — | | | — | | | 128,000,000 | |
| Accrued expenses: | | | | | | | | | | |
| Management fees | | | 26,864 | | | 193,582 | | | 208,205 | |
| Trustees fees | | | 182 | | | 12,867 | | | 13,366 | |
| Other | | | 20,328 | | | 73,086 | | | 83,764 | |
| Total liabilities | | | 20,427,543 | | | 135,253,600 | | | 138,462,651 | |
| Net assets applicable to common shares | | $ | 33,777,174 | | $ | 255,506,489 | | $ | 268,959,699 | |
| Common shares outstanding | | | 2,337,597 | | | 16,418,508 | | | 17,933,247 | |
| Net asset value ("NAV") per common share outstanding | | $ | 14.45 | | $ | 15.56 | | $ | 15.00 | |
| Net assets applicable to common shares consist of: | | | | | | | | | | |
| Common shares, $0.01 par value per share | | $ | 23,376 | | $ | 164,185 | | $ | 179,332 | |
| Paid-in surplus | | | 30,781,664 | | | 223,988,737 | | | 251,024,302 | |
| Undistributed (Over-distribution of) net investment income | | | 154,960 | | | 4,103 | | | 552,510 | |
| Accumulated net realized gain (loss) | | | (1,381,415 | ) | | 18,833 | | | (10,835,710 | ) |
| Net unrealized appreciation (depreciation) | | | 4,198,589 | | | 31,330,631 | | | 28,039,265 | |
| Net assets applicable to common shares | | $ | 33,777,174 | | $ | 255,506,489 | | $ | 268,959,699 | |
| Authorized shares: | | | | | | | | | | |
| Common | | | Unlimited | | | Unlimited | | | Unlimited | |
| Preferred | | | Unlimited | | | Unlimited | | | Unlimited | |
See accompanying notes to financial statements.
| Statement of | | |
| | Operations | Year Ended May 31, 2016 |
| | | | Georgia | | | Maryland | | | Minnesota | |
| | | | Dividend | | | Premium | | | Municipal | |
| | | | Advantage 2 | | | Income | | | Income | |
| | | | (NKG | ) | | (NMY | ) | | (NMS | ) |
| Investment Income | | $ | 9,575,460 | | $ | 21,145,294 | | $ | 5,922,239 | |
| Expenses | | | | | | | | | | |
| Management fees | | | 1,396,028 | | | 3,158,455 | | | 802,616 | |
| Interest expense and amortization of offering costs | | | 824,149 | | | 1,904,193 | | | 541,899 | |
| Liquidity fees | | | — | | | — | | | — | |
| Remarketing fees | | | — | | | — | | | — | |
| Custodian fees | | | 32,241 | | | 63,050 | | | 26,051 | |
| Trustees fees | | | 6,028 | | | 13,769 | | | 1,508 | |
| Professional fees | | | 29,519 | | | 39,435 | | | 37,787 | |
| Shareholder reporting expenses | | | 21,274 | | | 28,356 | | | 12,424 | |
| Shareholder servicing agent fees | | | 19,615 | | | 29,681 | | | 9,430 | |
| Stock exchange listing fees | | | 7,912 | | | 7,912 | | | 5,905 | |
| Investor relations expenses | | | 18,112 | | | 38,770 | | | 13,958 | |
| Other | | | 27,605 | | | 82,808 | | | 15,184 | |
| Total expenses | | | 2,382,483 | | | 5,366,429 | | | 1,466,762 | |
| Net investment income (loss) | | | 7,192,977 | | | 15,778,865 | | | 4,455,477 | |
| Realized and Unrealized Gain (Loss) | | | | | | | | | | |
| Net realized gain (loss) from: | | | | | | | | | | |
| Investments | | | (1,581,813 | ) | | 491,125 | | | 191,048 | |
| Swaps | | | 30,033 | | | — | | | — | |
| Change in net unrealized appreciation (depreciation) of: | | | | | | | | | | |
| Investments | | | 5,592,582 | | | 10,451,731 | | | 1,618,757 | |
| Swaps | | | (25,771 | ) | | — | | | — | |
| Net realized and unrealized gain (loss) | | | 4,015,031 | | | 10,942,856 | | | 1,809,805 | |
| Net increase (decrease) in net assets applicable to common shares from operations | | $ | 11,208,008 | | $ | 26,721,721 | | $ | 6,265,282 | |
See accompanying notes to financial statements.
| | | | Missouri | | | Carolina | | | Virginia | |
| | | | Premium | | | Premium | | | Premium | |
| | | | Income | | | Income | | | Income | |
| | | | (NOM | ) | | (NNC | ) | | (NPV | ) |
| Investment Income | | $ | 2,327,888 | | $ | 13,744,371 | | $ | 16,121,352 | |
| Expenses | | | | | | | | | | |
| Management fees | | | 312,628 | | | 2,253,343 | | | 2,424,420 | |
| Interest expense and amortization of offering costs | | | 228,024 | | | 1,357,569 | | | 295,649 | |
| Liquidity fees | | | — | | | — | | | 1,192,867 | |
| Remarketing fees | | | — | | | — | | | 130,132 | |
| Custodian fees | | | 15,377 | | | 46,555 | | | 50,909 | |
| Trustees fees | | | 1,415 | | | 10,071 | | | 10,494 | |
| Professional fees | | | 25,328 | | | 31,024 | | | 39,202 | |
| Shareholder reporting expenses | | | 6,491 | | | 30,525 | | | 23,817 | |
| Shareholder servicing agent fees | | | 18,763 | | | 21,667 | | | 10,768 | |
| Stock exchange listing fees | | | 519 | | | 7,912 | | | 7,912 | |
| Investor relations expenses | | | 5,074 | | | 29,195 | | | 31,122 | |
| Other | | | 24,863 | | | 57,112 | | | 80,577 | |
| Total expenses | | | 638,482 | | | 3,844,973 | | | 4,297,869 | |
| Net investment income (loss) | | | 1,689,406 | | | 9,899,398 | | | 11,823,483 | |
| Realized and Unrealized Gain (Loss) | | | | | | | | | | |
| Net realized gain (loss) from: | | | | | | | | | | |
| Investments | | | 50,409 | | | 418,715 | | | 1,943,982 | |
| Swaps | | | — | | | 50,670 | | | — | |
| Change in net unrealized appreciation depreciation of: | | | | | | | | | | |
| Investments | | | 1,225,769 | | | 9,029,073 | | | 7,419,283 | |
| Swaps | | | — | | | (43,394 | ) | | — | |
| Net realized and unrealized gain (loss) | | | 1,276,178 | | | 9,455,064 | | | 9,363,265 | |
| Net increase (decrease) in net assets applicable to common shares from operations | | $ | 2,965,584 | | $ | 19,354,462 | | $ | 21,186,748 | |
See accompanying notes to financial statements.
| Statement of | |
| | Changes in Net Assets |
| | | Georgia Dividend Advantage 2 (NKG) | | Maryland Premium Income (NMY) | |
| | | | Year | | | Year | | | Year | | | Year | |
| | | | Ended | | | Ended | | | Ended | | | Ended | |
| | | | 5/31/16 | | | 5/31/15 | | | 5/31/16 | | | 5/31/15 | |
| Operations | | | | | | | | | | | | | |
| Net investment income (loss) | | $ | 7,192,977 | | $ | 7,079,663 | | $ | 15,778,865 | | $ | 16,259,712 | |
| Net realized gain (loss) from: | | | | | | | | | | | | | |
| Investments | | | (1,581,813 | ) | | (187,934 | ) | | 491,125 | | | (107,770 | ) |
| Swaps | | | 30,033 | | | (26,267 | ) | | — | | | — | |
| Change in net unrealized appreciation (depreciation) of: | | | | | | | | | | | | | |
| Investments | | | 5,592,582 | | | (178,872 | ) | | 10,451,731 | | | (2,597,396 | ) |
| Swaps | | | (25,771 | ) | | 25,771 | | | — | | | — | |
| Distributions to Preferred Shareholders: | | | | | | | | | | | | | |
| From net investment income | | | — | | | — | | | — | | | — | |
| Net increase (decrease) in net assets applicable to common shares from operations | | | 11,208,008 | | | 6,712,361 | | | 26,721,721 | | | 13,554,546 | |
| Distributions to Common Shareholders | | | | | | | | | | | | | |
| From net investment income | | | (6,796,613 | ) | | (6,778,652 | ) | | (15,649,344 | ) | | (15,914,760 | ) |
| From accumulated net realized gains | | | — | | | — | | | — | | | — | |
| Decrease in net assets applicable to common shares from distributions to common shareholders | | | (6,796,613 | ) | | (6,778,652 | ) | | (15,649,344 | ) | | (15,914,760 | ) |
| Capital Share Transactions | | | | | | | | | | | | | |
| Common shares: | | | | | | | | | | | | | |
| Issued in the mergers | | | — | | | — | | | — | | | — | |
| Net proceeds from shares issued to shareholders due to reinvestment of distributions | | | 7,528 | | | — | | | — | | | — | |
| Cost of shares repurchased and retired | | | — | | | — | | | (2,791,231 | ) | | (6,349,466 | ) |
| Net increase (decrease) in net assets applicable to common shares from capital share transactions | | | 7,528 | | | — | | | (2,791,231 | ) | | (6,349,466 | ) |
| Net increase (decrease) in net assets applicable to common shares | | | 4,418,923 | | | (66,291 | ) | | 8,281,146 | | | (8,709,680 | ) |
| Net assets applicable to common shares at the beginning of period | | | 147,441,052 | | | 147,507,343 | | | 344,300,047 | | | 353,009,727 | |
| Net assets applicable to common shares at the end of period | | $ | 151,859,975 | | $ | 147,441,052 | | $ | 352,581,193 | | $ | 344,300,047 | |
| Undistributed (Over-distribution of) net investment income at the end of period | | $ | 367,014 | | $ | (54,818 | ) | $ | 1,589,758 | | $ | 1,441,767 | |
See accompanying notes to financial statements.
| | | Minnesota Municipal Income (NMS) | | Missouri Premium Income (NOM) | |
| | | | Year | | | Eleven Months | | | Ten Months | | | Year | | | Year | |
| | | | Ended | | | Ended | | | Ended | | | Ended | | | Ended | |
| | | | 5/31/16 | | | 5/31/15 | | | 6/30/14 | | | 5/31/16 | | | 5/31/15 | |
| Net investment income (loss) | | $ | 4,455,477 | | $ | 3,821,718 | | $ | 2,950,251 | | $ | 1,689,406 | | $ | 1,444,405 | |
| Net realized gain (loss) from: | | | | | | | | | | | | | | | | |
| Investments | | | 191,048 | | | 461,955 | | | (616,939 | ) | | 50,409 | | | (503,022 | ) |
| Swaps | | | — | | | — | | | — | | | — | | | — | |
Change in net unrealized appreciation (depreciation) of: | | | | | | | | | | | | | | | | |
| Investments | | | 1,618,757 | | | (609,648 | ) | | 5,934,559 | | | 1,225,769 | | | 109,671 | |
| Swaps | | | — | | | — | | | — | | | — | | | — | |
| Distributions to Preferred Shareholders: | | | | | | | | | | | | | | | | |
| From net investment income | | | — | | | — | | | (22,615 | ) | | — | | | — | |
| Net increase (decrease) in net assets applicable to common shares from operations | | | 6,265,282 | | | 3,674,025 | | | 8,245,256 | | | 2,965,584 | | | 1,051,054 | |
| Distributions to Common Shareholders | | | | | | | | | | | | | | | | |
| From net investment income | | | (4,487,400 | ) | | (4,040,464 | ) | | (3,068,590 | ) | | (1,709,898 | ) | | (1,707,170 | ) |
| From accumulated net realized gains | | | — | | | — | | | — | | | — | | | — | |
| Decrease in net assets applicable to common shares from distributions to common shareholders | | | (4,487,400 | ) | | (4,040,464 | ) | | (3,068,590 | ) | | (1,709,898 | ) | | (1,707,170 | ) |
| Capital Share Transactions | | | | | | | | | | | | | | | | |
| Common shares: | | | | | | | | | | | | | | | | |
| Issued in the mergers | | | — | | | 22,239,676 | | | — | | | — | | | — | |
| Net proceeds from shares issued to shareholders due to reinvestment of distributions | | | 13,839 | | | — | | | — | | | 54,447 | | | 51,510 | |
| Cost of shares repurchased and retired | | | — | | | — | | | — | | | — | | | — | |
| Net increase (decrease) in net assets applicable to common shares from capital share transactions | | | 13,839 | | | 22,239,676 | | | — | | | 54,447 | | | 51,510 | |
| Net increase (decrease) in net assets applicable to common shares | | | 1,791,721 | | | 21,873,237 | | | 5,176,666 | | | 1,310,133 | | | (604,606 | ) |
| Net assets applicable to common shares at the beginning of period | | | 86,150,091 | | | 64,276,854 | | | 59,100,188 | | | 32,467,041 | | | 33,071,647 | |
| Net assets applicable to common shares at the end of period | | $ | 87,941,812 | | $ | 86,150,091 | | $ | 64,276,854 | | $ | 33,777,174 | | $ | 32,467,041 | |
| Undistributed (Over-distribution of) net investment income at the end of period | | $ | 356,496 | | $ | 310,849 | | $ | 456,615 | | $ | 154,960 | | $ | 135,841 | |
See accompanying notes to financial statements.
Statement of Changes in Net Assets (continued)
| | | North Carolina Premium Income (NNC) | | Virginia Premium Income (NPV) | |
| | | | Year | | | Year | | | Year | | | Year | |
| | | | Ended | | | Ended | | | Ended | | | Ended | |
| | | | 5/31/16 | | | 5/31/15 | | | 5/31/16 | | | 5/31/15 | |
| Operations | | | | | | | | | | | | | |
| Net investment income (loss) | | $ | 9,899,398 | | $ | 10,022,650 | | $ | 11,823,483 | | $ | 12,846,517 | |
| Net realized gain (loss) from: | | | | | | | | | | | | | |
| Investments | | | 418,715 | | | (264,727 | ) | | 1,943,982 | | | (5,277,985 | ) |
| Swaps | | | 50,670 | | | (46,000 | ) | | — | | | — | |
| Change in net unrealized appreciation (depreciation) of: | | | | | | | | | | | | | |
| Investments | | | 9,029,073 | | | 2,100,259 | | | 7,419,283 | | | 6,376,290 | |
| Swaps | | | (43,394 | ) | | 43,394 | | | — | | | — | |
| Distributions to Preferred Shareholders: | | | | | | | | | | | | | |
| From net investment income | | | — | | | — | | | — | | | — | |
| Net increase (decrease) in net assets applicable to common shares from operations | | | 19,354,462 | | | 11,855,576 | | | 21,186,748 | | | 13,944,822 | |
| Distributions to Common Shareholders | | | | | | | | | | | | | |
| From net investment income | | | (9,656,474 | ) | | (10,159,312 | ) | | (12,330,901 | ) | | (13,408,689 | ) |
| From accumulated net realized gains | | | (223,292 | ) | | (466,996 | ) | | — | | | — | |
| Decrease in net assets applicable to common shares from distributions to common shareholders | | | (9,879,766 | ) | | (10,626,308 | ) | | (12,330,901 | ) | | (13,408,689 | ) |
| Capital Share Transactions | | | | | | | | | | | | | |
| Common shares: | | | | | | | | | | | | | |
| Issued in the mergers | | | — | | | — | | | — | | | — | |
| Net proceeds from shares issued to shareholders due to reinvestment of distributions | | | — | | | — | | | — | | | — | |
| Cost of shares repurchased and retired | | | (287,244 | ) | | (1,401,812 | ) | | — | | | — | |
| Net increase (decrease) in net assets applicable to common shares from capital share transactions | | | (287,244 | ) | | (1,401,812 | ) | | — | | | — | |
| Net increase (decrease) in net assets applicable to common shares | | | 9,187,452 | | | (172,544 | ) | | 8,855,847 | | | 536,133 | |
| Net assets applicable to common shares at the beginning of period | | | 246,319,037 | | | 246,491,581 | | | 260,103,852 | | | 259,567,719 | |
| Net assets applicable to common shares at the end of period | | $ | 255,506,489 | | $ | 246,319,037 | | $ | 268,959,699 | | $ | 260,103,852 | |
| Undistributed (Over-distribution of) net investment income at the end of period | | $ | 4,103 | | $ | (306,611 | ) | $ | 552,510 | | $ | 1,017,493 | |
See accompanying notes to financial statements.
| Statement of | | |
| | Cash Flows | Year Ended May 31, 2016 |
| | | | Georgia | | | Maryland | | | Minnesota | |
| | | | Dividend | | | Premium | | | Municipal | |
| | | | Advantage 2 | | | Income | | | Income | |
| | | | (NKG | ) | | (NMY | ) | | (NMS | ) |
| Cash Flows from Operating Activities: | | | | | | | | | | |
| Net Increase (Decrease) in Net Assets Applicable to Common Shares from Operations | | $ | 11,208,008 | | $ | 26,721,721 | | $ | 6,265,282 | |
| Adjustments to reconcile the net increase (decrease) in net assets applicable to common shares from operations to net cash provided by (used in) operating activities: | | | | | | | | | | |
| Purchases of investments | | | (29,632,177 | ) | | (100,963,971 | ) | | (21,417,595 | ) |
| Proceeds from sales and maturities of investments | | | 31,287,857 | | | 106,340,252 | | | 24,576,156 | |
| Proceeds from (Payments for) swap contracts, net | | | 30,033 | | | — | | | — | |
| Taxes paid | | | — | | | — | | | (17,920 | ) |
| Amortization (Accretion) of premiums and discounts, net | | | 1,269,226 | | | 2,805,363 | | | (681,927 | ) |
| Amortization of deferred offering costs | | | 78,719 | | | 83,722 | | | 128,589 | |
| (Increase) Decrease in: | | | | | | | | | | |
| Credit default swaps premiums paid | | | 195,243 | | | — | | | — | |
| Receivable for interest | | | 239,235 | | | 330,382 | | | (82,083 | ) |
| Receivable for investments sold | | | (5,836,823 | ) | | 4,689,000 | | | (1,828,568 | ) |
| Other assets | | | 52 | | | (2,554 | ) | | (67 | ) |
| Increase (Decrease) in: | | | | | | | | | | |
| Payable for interest | | | 18,262 | | | 40,657 | | | 10,736 | |
| Payable for investments purchased | | | 3,748,590 | | | 929,600 | | | (4,917,858 | ) |
| Accrued management fees | | | 2,103 | | | 2,205 | | | (7,961 | ) |
| Accrued Trustees fees | | | (21 | ) | | 2,580 | | | (15 | ) |
| Accrued other expenses | | | (39,877 | ) | | (35,738 | ) | | (23,456 | ) |
| Net realized (gain) loss from: | | | | | | | | | | |
| Investments | | | 1,581,813 | | | (491,125 | ) | | (191,048 | ) |
| Swaps | | | (30,033 | ) | | — | | | — | |
| Change in net unrealized (appreciation) depreciation of: | | | | | | | | | | |
| Investments | | | (5,592,582 | ) | | (10,451,731 | ) | | (1,618,757 | ) |
| Swaps | | | 25,771 | | | — | | | — | |
| Net cash provided by (used in) operating activities | | | 8,553,399 | | | 30,000,363 | | | 193,508 | |
| Cash Flows from Financing Activities: | | | | | | | | | | |
| Increase (Decrease) in: | | | | | | | | | | |
| Cash overdraft | | | — | | | (4,278,239 | ) | | 1,858,123 | |
| Floating rate obligations | | | — | | | (1,595,000 | ) | | — | |
| Payable for offering costs | | | (47,791 | ) | | (41,803 | ) | | (48,530 | ) |
| Cash distributions paid to common shareholders | | | (6,782,242 | ) | | (15,658,563 | ) | | (4,482,731 | ) |
| Cost of common shares repurchased and retired | | | — | | | (2,834,876 | ) | | — | |
| Net cash provided by (used in) financing activities | | | (6,830,033 | ) | | (24,408,481 | ) | | (2,673,138 | ) |
| Net Increase (Decrease) in Cash | | | 1,723,366 | | | 5,591,882 | | | (2,479,630 | ) |
| Cash at the beginning of period | | | 357,713 | | | — | | | 2,479,630 | |
| Cash at the end of period | | $ | 2,081,079 | | $ | 5,591,882 | | $ | — | |
| | | | | | | | | | | |
| | | | Georgia | | | Maryland | | | Minnesota | |
| | | | Dividend | | | Premium | | | Municipal | |
| | | | Advantage 2 | | | Income | | | Income | |
| Supplemental Disclosure of Cash Flow Information | | | (NKG | ) | | (NMY | ) | | (NMS | ) |
| Cash paid for interest (excluding amortization of offering costs) | | $ | 774,958 | | $ | 1,821,616 | | $ | 450,618 | |
| Non-cash financing activities not included herein consists of reinvestments of common share distributions | | | 7,528 | | | — | | | 13,839 | |
See accompanying notes to financial statements.
Statement of Cash Flows (continued)
| | | | Missouri | | | North Carolina | | | Virginia | |
| | | | Premium | | | Premium | | | Premium | |
| | | | Income | | | Income | | | Income | |
| | | | (NOM | ) | | (NNC | ) | | (NPV | ) |
| Cash Flows from Operating Activities: | | | | | | | | | | |
| Net Increase (Decrease) in Net Assets Applicable to Common Shares from Operations | | $ | 2,965,584 | | $ | 19,354,462 | | $ | 21,186,748 | |
| Adjustments to reconcile the net increase (decrease) in net assets applicable to common shares from operations to net cash provided by (used in) operating activities: | | | | | | | | | | |
| Purchases of investments | | | (3,775,645 | ) | | (35,621,709 | ) | | (70,364,561 | ) |
| Proceeds from sales and maturities of investments | | | 2,359,093 | | | 27,421,776 | | | 82,444,018 | |
| Proceeds from (Payments for) swap contracts, net | | | — | | | 50,670 | | | — | |
| Taxes paid | | | — | | | (5,041 | ) | | — | |
| Amortization (Accretion) of premiums and discounts, net | | | 89,534 | | | 2,653,454 | | | 1,113,666 | |
| Amortization of deferred offering costs | | | 109,125 | | | 49,875 | | | 15,215 | |
| (Increase) Decrease in: | | | | | | | | | | |
| Credit default swaps premiums paid | | | — | | | 337,915 | | | — | |
| Receivable for interest | | | (7,503 | ) | | 26,481 | | | 506,230 | |
| Receivable for investments sold | | | 1,869,688 | | | 1,956,621 | | | (1,445,710 | ) |
| Other assets | | | (14 | ) | | (1,907 | ) | | (1,969 | ) |
| Increase (Decrease) in: | | | | | | | | | | |
| Payable for interest | | | 4,385 | | | 30,431 | | | — | |
| Payable for investments purchased | | | (460,727 | ) | | 9,048,955 | | | (8,957,155 | ) |
| Accrued management fees | | | 589 | | | 4,315 | | | 3,957 | |
| Accrued Trustees fees | | | (5 | ) | | 1,951 | | | 2,011 | |
| Accrued other expenses | | | (8,693 | ) | | (35,414 | ) | | (43,313 | ) |
| Net realized (gain) loss from: | | | | | | | | | | |
| Investments | | | (50,409 | ) | | (418,715 | ) | | (1,943,982 | ) |
| Swaps | | | — | | | (50,670 | ) | | — | |
| Change in net unrealized (appreciation) depreciation of: | | | | | | | | | | |
| Investments | | | (1,225,769 | ) | | (9,029,073 | ) | | (7,419,283 | ) |
| Swaps | | | — | | | 43,394 | | | — | |
| Net cash provided by (used in) operating activities | | | 1,869,233 | | | 15,817,771 | | | 15,095,872 | |
| Cash Flows from Financing Activities | | | | | | | | | | |
| Increase (Decrease) in: | | | | | | | | | | |
| Cash overdraft | | | — | | | (4,504,811 | ) | | — | |
| Floating rate obligations | | | — | | | — | | | — | |
| Payable for offering costs | | | (128,118 | ) | | — | | | — | |
| Cash distribution paid to common shareholders | | | (1,654,877 | ) | | (9,880,415 | ) | | (12,442,366 | ) |
| Cost of common shares repurchased and retired | | | — | | | (287,244 | ) | | — | |
| Net cash provided by (used in) financing activities | | | (1,782,995 | ) | | (14,672,470 | ) | | (12,442,366 | ) |
| Net Increase (Decrease) in Cash | | | 86,238 | | | 1,145,301 | | | 2,653,506 | |
| Cash at the beginning of period | | | 48,741 | | | — | | | 122,062 | |
| Cash at the end of period | | $ | 134,979 | | $ | 1,145,301 | | $ | 2,775,568 | |
| | | | | | | | | | | |
| | | | Missouri | | | North Carolina | | | Virginia | |
| | | | Premium | | | Premium | | | Premium | |
| | | | Income | | | Income | | | Income | |
| Supplemental Disclosure of Cash Flow Information | | | (NOM | ) | | (NNC | ) | | (NPV | ) |
| Cash paid for interest (excluding amortization of offering costs) | | $ | 181,112 | | $ | 1,277,263 | | $ | 280,435 | |
| Non-cash financing activities not included herein consists of reinvestments of common share distributions | | | 54,447 | | | — | | | — | |
See accompanying notes to financial statements.
THIS PAGE INTENTIONALLY LEFT BLANK
Selected data for a common share outstanding throughout each period:
| | | | | | | | | | | Less Distributions to | | | | | | | | | | |
| | | | | Investment Operations | | Common Shareholders | | Common Share |
| | | | | | | | | | | | | | | | | | From | | | | | | Discount | | | | | | | |
| | | Beginning | | | Net | | | Net | | | | | | From | | | Accumu- | | | | | | Per | | | | | | Ending | |
| | | Common | | | Investment | | | Realized/ | | | | | | Net | | lated Net | | | | | | Shares | | | | | | Net | |
| | | Share | | | Income | | | Unrealized | | | | | | Investment | | | Realized | | | | | Repurchased | | | Ending | | | Share | |
| | | NAV | | | (Loss | ) | | Gain (Loss | ) | | Total | | | Income | | | Gains | | | Total | | and Retired | | | NAV | | | Price | |
| Georgia Dividend Advantage 2 (NKG) | | | | | | | | | | | | | | | | | | | | | | | | | |
| Year Ended 5/31: | | | | | | | | | | | | | | | | | | | | | | | | | | | | | | |
| 2016 | | $ | 13.98 | | | $ | 0.68 | | | $ | 0.38 | | | $ | 1.06 | | | $ | (0.64 | ) | | $ | — | | | $ | (0.64 | ) | | $ | — | | | $ | 14.40 | | | $ | 14.28 | |
| 2015 | | | 13.98 | | | | 0.67 | | | | (0.03 | ) | | | 0.64 | | | | (0.64 | ) | | | — | | | | (0.64 | ) | | | — | | | | 13.98 | | | | 12.81 | |
| 2014 | | | 14.58 | | | | 0.54 | | | | (0.50 | ) | | | 0.04 | | | | (0.64 | ) | | | — | | | | (0.64 | ) | | | — | | | | 13.98 | | | | 12.98 | |
| 2013 | | | 14.71 | | | | 0.60 | | | | (0.06 | ) | | | 0.54 | | | | (0.67 | ) | | | — | | | | (0.67 | ) | | | — | | | | 14.58 | | | | 13.39 | |
| 2012 | | | 13.78 | | | | 0.61 | | | | 1.01 | | | | 1.62 | | | | (0.69 | ) | | | — | | | | (0.69 | ) | | | — | | | | 14.71 | | | | 14.73 | |
| | | | | | | | | | | | | | | | | | | | | | | | | | | | | | | | | | | | | | | | | |
| Maryland Premium Income (NMY) | | | | | | | | | | | | | | | | | | | | | | | | | | | | | | | | | |
| Year Ended 5/31: | | | | | | | | | | | | | | | | | | | | | | | | | | | | | | | | | | | | | | | | |
| 2016 | | | 14.59 | | | | 0.67 | | | | 0.47 | | | | 1.14 | | | | (0.67 | ) | | | — | | | | (0.67 | ) | | | 0.02 | | | | 15.08 | | | | 13.65 | |
| 2015 | | | 14.64 | | | | 0.68 | | | | (0.10 | ) | | | 0.58 | | | | (0.67 | ) | | | — | | | | (0.67 | ) | | | 0.04 | | | | 14.59 | | | | 12.53 | |
| 2014 | | | 15.56 | | | | 0.60 | | | | (0.85 | ) | | | (0.25 | ) | | | (0.67 | ) | | | — | | | | (0.67 | ) | | | — | | | | 14.64 | | | | 12.91 | |
| 2013 | | | 15.68 | | | | 0.58 | | | | 0.07 | | | | 0.65 | | | | (0.77 | ) | | | — | | | | (0.77 | ) | | | — | | | | 15.56 | | | | 13.82 | |
| 2012 | | | 14.37 | | | | 0.68 | | | | 1.40 | | | | 2.08 | | | | (0.77 | ) | | | — | | | | (0.77 | ) | | | — | | | | 15.68 | | | | 15.64 | |
| (a) | Total Return Based on Common Share NAV is the combination of changes in common share NAV, reinvested dividend income at NAV and reinvested capital gains distributions at NAV, if any. The last dividend declared in the period, which is typically paid on the first business day of the following month, is assumed to be reinvested at the ending NAV. The actual reinvest price for the last dividend declared in the period may often be based on the Fund's market price (and not its NAV), and therefore may be different from the price used in the calculation. Total returns are not annualized. |
| | |
| | Total Return Based on Common Share Price is the combination of changes in the market price per share and the effect of reinvested dividend income and reinvested capital gains distributions, if any, at the average price paid per share at the time of reinvestment. The last dividend declared in the period, which is typically paid on the first business day of the following month, is assumed to be reinvested at the ending market price. The actual reinvestment for the last dividend declared in the period may take place over several days, and in some instances may not be based on the market price, so the actual reinvestment price may be different from the price used in the calculation. Total returns are not annualized. |
| | | | | | | | | Common Share Supplemental Data/
Ratios Applicable to Common Shares | |
| | | Common Share
Total Returns | | | | | Ratios to Average Net Assets(b) | | | | |
| | | Based
on
NAV | (a) | Based
on
Share
Price | (a) | Ending
Net
Assets
(000 | ) | Expenses | (c) | Net
Investment
Income
(Loss | ) | Portfolio
Turnover
Rate | (d) |
| | | | | | | | | | | | | | | | | | | | |
| | | | | | | | | | | | | | | | | | | | |
| | | | 7.80 | % | | 16.94 | % | $ | 151,860 | | | 1.60 | % | | 4.83 | % | | 13 | % |
| | | | 4.65 | | | 3.76 | | | 147,441 | | | 1.62 | | | 4.77 | | | 7 | |
| | | | 0.56 | | | 2.17 | | | 147,507 | | | 3.03 | | | 4.04 | | | 20 | |
| | | | 3.68 | | | (4.83 | ) | | 153,832 | | | 2.66 | | | 4.09 | | | 18 | |
| | | | 12.04 | | | 11.12 | | | 67,039 | | | 2.95 | | | 4.30 | | | 11 | |
| | | | | | | | | | | | | | | | | | | | |
| | | | | | | | | | | | | | | | | | | | |
| | | | 8.13 | | | 14.77 | | | 352,581 | | | 1.55 | | | 4.56 | | | 19 | |
| | | | 4.28 | | | 2.29 | | | 344,300 | | | 1.55 | | | 4.65 | | | 23 | |
| | | | (1.38 | ) | | (1.43 | ) | | 353,010 | | | 2.87 | | | 4.25 | | | 20 | |
| | | | 4.18 | | | (7.10 | ) | | 375,162 | | | 2.58 | | | 4.12 | | | 17 | |
| | | | 14.82 | | | 17.69 | | | 167,208 | | | 2.91 | | | 4.54 | | | 7 | |
| (b) | Net Investment Income (Loss) ratios reflect income earned and expenses incurred on assets attributable to preferred shares issued by the Fund. |
| (c) | The expense ratios reflect, among other things, all interest expense and other costs related to preferred shares (as described in Note 4 – Fund Shares, Preferred Shares) and/or the interest expense deemed to have been paid by the Fund on the floating rate certificates issued by the special purpose trusts for the self-deposited inverse floaters held by the Fund (as described in Note 3 – Portfolio Securities and Investments in Derivatives, Inverse Floating Rate Securities), where applicable, as follows: |
| Georgia Dividend Advantage 2 (NKG) | | | | |
| Year Ended 5/31: | | | | |
| 2016 | | | 0.55 | % |
| 2015 | | | 0.54 | |
| 2014 | | | 1.89 | |
| 2013 | | | 1.51 | |
| 2012 | | | 1.56 | |
| Maryland Premium Income (NMY) | | | | |
| Year Ended 5/31: | | | | |
| 2016 | | | 0.55 | % |
| 2015 | | | 0.52 | |
| 2014 | | | 1.81 | |
| 2013 | | | 1.46 | |
| 2012 | | | 1.56 | |
| (d) | Portfolio Turnover Rate is calculated based on the lesser of long-term purchases or sales (as disclosed in Note 5 – Investment Transactions) divided by the average long-term market value during the period. |
See accompanying notes to financial statements.
Financial Highlights (continued)
Selected data for a common share outstanding throughout each period:
| | | | | | | | | | | | | | | | | | | | Less Distributions to | | | | | | | |
| | | | | Investment Operations | | Common Shareholders | | Common Share | |
| | | | | | | | | | | | | | | Distributions | | | | | | | | | | | | | | | | | | | |
| | | | | | | | | | | | Distributions | | | from | | | | | | | | | | | | | | | | | | | |
| | | | | | | | | | | | from Net | | | Accumulated | | | | | | | | | | | | | | | | | | | |
| | | | | | | | | | | | Investment | | | Net Realized | | | | | | | | | From | | | | | | | | | | |
| | | Beginning | | | Net | | | Net | | | Income to | | | Gains to | | | | | | From | | | Accumu- | | | | | | | | | | |
| | | Common | | | Investment | | | Realized/ | | | Preferred | | | Preferred | | | | | | Net | | lated Net | | | | | | | | | Ending | |
| | | Share | | | Income | | | Unrealized | | | Share- | | | Share- | | | | | | Investment | | | Realized | | | | | | Ending | | | Share | |
| | | NAV | | | (Loss | ) | | Gain (Loss | ) | | holders | (a) | | holders | (a) | | Total | | | Income | | | Gains | | | Total | | | NAV | | | Price | |
| Minnesota Municipal Income (NMS)R | | | | | | | | | | | | | | | | | | | | | | | | | | | | |
| Year Ended 5/31: | | | | | | | | | | | | | | | | | | | | | | | | | | | | | | | | | |
| 2016 | | $ | 15.46 | | | $ | 0.80 | | | $ | 0.33 | | | $ | — | | | $ | — | | | $ | 1.13 | | | $ | (0.81 | ) | | $ | — | | | $ | (0.81 | ) | | $ | 15.78 | | | $ | 15.99 | |
| 2015(f) | | | 15.50 | | | | 0.74 | | | | 0.03 | | | | — | | | | — | | | | 0.77 | | | | (0.81 | ) | | | — | | | | (0.81 | ) | | | 15.46 | | | | 14.95 | |
| Year Ended 6/30: | | | | | | | | | | | | | | | | | | | | | | | | | | | | | | | | | | | | | | | | | | | | |
| 2014(g) | | | 14.25 | | | | 0.71 | | | | 1.29 | | | | (0.01 | ) | | | — | | | | 1.99 | | | | (0.74 | ) | | | — | | | | (0.74 | ) | | | 15.50 | | | | 16.48 | |
| Year Ended 8/31: | | | | | | | | | | | | | | | | | | | | | | | | | | | | | | | | | | | | | | | | | | | | |
| 2013 | | | 16.16 | | | | 0.90 | | | | (1.90 | ) | | | (0.02 | ) | | | — | | | | (1.02 | ) | | | (0.89 | ) | | | — | | | | (0.89 | ) | | | 14.25 | | | | 14.82 | |
| 2012 | | | 14.56 | | | | 0.90 | | | | 1.56 | | | | (0.02 | ) | | | — | | | | 2.44 | | | | (0.84 | ) | | | — | | | | (0.84 | ) | | | 16.16 | | | | 17.52 | |
| 2011 | | | 15.28 | | | | 0.88 | | | | (0.71 | ) | | | (0.03 | ) | | | — | | | | 0.14 | | | | (0.86 | ) | | | — | | | | (0.86 | ) | | | 14.56 | | | | 15.37 | |
| 2010 | | | 13.39 | | | | 0.92 | | | | 1.91 | | | | (0.03 | ) | | | — | | | | 2.80 | | | | (0.91 | ) | | | — | | | | (0.91 | ) | | | 15.28 | | | | 15.70 | |
| | | | | | | | | | | | | | | | | | | | | | | | | | | | | | | | | | | | | | | | | | | | | |
| Missouri Premium Income (NOM) | | | | | | | | | | | | | | | | | | | | | | | | | | | | | | | | | | | | | |
| Year Ended 5/31: | | | | | | | | | | | | | | | | | | | | | | | | | | | | | | | | | | | | | | | | | | | | |
| 2016 | | | 13.91 | | | | 0.72 | | | | 0.55 | | | | — | | | | — | | | | 1.27 | | | | (0.73 | ) | | | — | | | | (0.73 | ) | | | 14.45 | | | | 16.03 | |
| 2015 | | | 14.19 | | | | 0.62 | | | | (0.17 | ) | | | — | | | | — | | | | 0.45 | | | | (0.73 | ) | | | — | | | | (0.73 | ) | | | 13.91 | | | | 15.27 | |
| 2014 | | | 14.61 | | | | 0.65 | | | | (0.34 | ) | | | — | | | | — | | | | 0.31 | | | | (0.73 | ) | | | — | | | | (0.73 | ) | | | 14.19 | | | | 15.08 | |
| 2013 | | | 14.62 | | | | 0.66 | | | | 0.06 | | | | — | | | | — | | | | 0.72 | | | | (0.73 | ) | | | — | | | | (0.73 | ) | | | 14.61 | | | | 16.04 | |
| 2012 | | | 13.19 | | | | 0.69 | | | | 1.52 | | | | — | | | | — | | | | 2.21 | | | | (0.78 | ) | | | — | | | | (0.78 | ) | | | 14.62 | | | | 16.90 | |
| (a) | The amounts shown are based on common share equivalents. Represents distributions paid on Remarketed Preferred Shares ("RPS") for Minnesota Municipal Income (NMS). |
| (b) | Total Return Based on Common Share NAV is the combination of changes in common share NAV, reinvested dividend income at NAV and reinvested capital gains distributions at NAV, if any. The last dividend declared in the period, which is typically paid on the first business day of the following month, is assumed to be reinvested at the ending NAV. The actual reinvest price for the last dividend declared in the period may often be based on the Fund's market price (and not its NAV), and therefore may be different from the price used in the calculation. Total returns are not annualized. |
| | |
| | Total Return Based on Common Share Price is the combination of changes in the market price per share and the effect of reinvested dividend income and reinvested capital gains distributions, if any, at the average price paid per share at the time of reinvestment. The last dividend declared in the period, which is typically paid on the first business day of the following month, is assumed to be reinvested at the ending market price. The actual reinvestment for the last dividend declared in the period may take place over several days, and in some instances may not be based on the market price, so the actual reinvestment price may be different from the price used in the calculation. Total returns are not annualized. |
| | | | | | Common Share Supplemental Data/
Ratios Applicable to Common Share | |
Common Share
Total Returns | | | | | | | | Ratios to Average Net Assets(c) | |
Based
on
NAV | (b) | Based
on
Share
Price | (b) | Ending
Net
Assets
(000 | ) | Expenses | (d) | Net
Investment
Income
(Loss | ) | Portfolio
Turnover
Rate | (e) |
| | | | | | | | | | | | | | | | | |
| | | | | | | | | | | | | | | | | |
| 7.47 | % | | 12.84 | % | $ | 87,942 | | | 1.69 | % | | 5.14 | % | | 17 | % |
| 5.02 | | | (4.37 | ) | | 86,150 | | | 1.80 | * | | 5.19 | * | | 14 | |
| | | | | | | | | | | | | | | | | |
| 14.33 | | | 16.61 | | | 64,277 | | | 1.64 | * | | 5.75 | * | | 8 | |
| | | | | | | | | | | | | | | | | |
| (6.77 | ) | | (10.99 | ) | | 59,100 | | | 1.35 | | | 5.68 | | | 11 | |
| 17.25 | | | 19.91 | | | 67,029 | | | 1.42 | | | 5.82 | | | 6 | |
| 1.30 | | | 3.73 | | | 60,408 | | | 1.46 | | | 6.25 | | | 10 | |
| 21.66 | | | 12.86 | | | 63,358 | | | 1.29 | | | 6.46 | | | 16 | |
| | | | | | | | | | | | | | | | | |
| | | | | | | | | | | | | | | | | |
| 9.40 | | | 10.34 | | | 33,777 | | | 1.94 | | | 5.13 | | | 5 | |
| 3.21 | | | 6.50 | | | 32,467 | | | 2.80 | | | 4.38 | | | 8 | |
| 2.52 | | | (0.83 | ) | | 33,072 | | | 2.86 | | | 4.85 | | | 21 | |
| 4.98 | | | (0.67 | ) | | 34,011 | | | 2.77 | | | 4.45 | | | 12 | |
| 17.16 | | | 28.21 | | | 33,979 | | | 2.95 | | | 4.93 | | | 13 | |
| (c) | Ratios do not reflect the effect of dividend payments to RPS shareholders, during periods when RPS were outstanding; Net Investment Income (Loss) ratios reflect income earned and expenses incurred on assets attributable to RPS and other subsequent forms of preferred shares issued by the Fund, where applicable. For the years ended June 30, 2014 and prior, Minnesota Municipal Income's (NMS) includes the RPS of Minnesota Municipal Income Portfolio (MXA). |
| (d) | The expense ratios reflect, among other things, all interest expense and other costs related to preferred shares (as described in Note 4 – Fund Shares, Preferred Shares) and/or the interest expense deemed to have been paid by the Fund on the floating rate certificates issued by the special purpose trusts for the self-deposited inverse floaters held by the Fund (as described in Note 3 – Portfolio Securities and Investments in Derivatives, Inverse Floating Rate Securities), where applicable, as follows: |
| Minnesota Municipal Income (NMS) | | | | |
| Year Ended 5/31: | | | | |
| 2016 | | | 0.62 | % |
| 2015(f) | | | 0.61 | * |
| Year Ended 6/30: | | | | |
| 2014(g) | | | 0.18 | * |
| Year Ended 8/31: | | | | |
| 2013 | | | — | |
| 2012 | | | — | |
| 2011 | | | — | |
| 2010 | | | — | |
| Missouri Premium Income (NOM) | | | | |
| Year Ended 5/31: | | | | |
| 2016 | | | 0.69 | % |
| 2015 | | | 1.44 | |
| 2014 | | | 1.51 | |
| 2013 | | | 1.45 | |
| 2012 | | | 1.55 | |
| (e) | Portfolio Turnover Rate is calculated based on the lesser of long-term purchases or sales (as disclosed in Note 5 – Investment Transactions) divided by the average long-term market value during the period. |
| (f) | For the eleven months ended May 31, 2015. |
| (g) | For the ten months ended June 30, 2014. |
| * | Annualized. |
See accompanying notes to financial statements.
Financial Highlights (continued)
Selected data for a common share outstanding throughout each period:
| | | | | | | | | | | | | | Less Distributions to | | | | | | | | | | |
| | | Investment Operations | | Common Shareholders | | Common Share |
| | | | | | | | | | | | | | | | | | From | | | | | | Discount | | | | | | | |
| | | Beginning | | | Net | | | Net | | | | | | From | | | Accumu- | | | | | | Per | | | | | | | |
| | | Common | | | Investment | | | Realized/ | | | | | | Net | | | lated Net | | | | | | Share | | | | | | Ending | |
| | | Share | | | Income | | | Unrealized | | | | | | Investment | | | Realized | | | | | | Repurchased | | | Ending | | | Share | |
| | | NAV | | | (Loss | ) | | Gain (Loss | ) | | Total | | | Income | | | Gains | | | Total | | | and Retired | | | NAV | | | Price | |
| North Carolina Premium Income (NNC) | | | | | | | | | | | | | | | | | | | | | | | | | |
| Year Ended 5/31: | | | | | | | | | | | | | | | | | | | | | | | | | | | | | | |
| 2016 | | $ | 14.98 | | | $ | 0.60 | | | $ | 0.58 | | | $ | 1.18 | | | $ | (0.60 | ) | | $ | — | * | | $ | (0.60 | ) | | $ | — | * | | $ | 15.56 | | | $ | 14.19 | |
| 2015 | | | 14.90 | | | | 0.61 | | | | 0.11 | | | | 0.72 | | | | (0.62 | ) | | | (0.03 | ) | | | (0.65 | ) | | | 0.01 | | | | 14.98 | | | | 12.95 | |
| 2014 | | | 15.02 | | | | 0.54 | | | | (0.06 | ) | | | 0.48 | | | | (0.60 | ) | | | — | | | | (0.60 | ) | | | — | | | | 14.90 | | | | 13.24 | |
| 2013 | | | 15.30 | | | | 0.56 | | | | (0.17 | ) | | | 0.39 | | | | (0.67 | ) | | | — | | | | (0.67 | ) | | | — | | | | 15.02 | | | | 13.88 | |
| 2012 | | | 14.34 | | | | 0.57 | | | | 1.10 | | | | 1.67 | | | | (0.71 | ) | | | — | | | | (0.71 | ) | | | — | | | | 15.30 | | | | 15.97 | |
| | | | | | | | | | | | | | | | | | | | | | | | | | | | | | | | | | | | | | | | | |
| Virginia Premium Income (NPV) | | | | | | | | | | | | | | | | | | | | | | | | | | | | | | | | | | | | | | | | |
| Year Ended 5/31: | | | | | | | | | | | | | | | | | | | | | | | | | | | | | | | | | | | | | | | | |
| 2016 | | | 14.50 | | | | 0.66 | | | | 0.53 | | | | 1.19 | | | | (0.69 | ) | | | — | | | | (0.69 | ) | | | — | | | | 15.00 | | | | 14.43 | |
| 2015 | | | 14.47 | | | | 0.72 | | | | 0.06 | | | | 0.78 | | | | (0.75 | ) | | | — | | | | (0.75 | ) | | | — | | | | 14.50 | | | | 13.39 | |
| 2014 | | | 15.38 | | | | 0.71 | | | | (0.89 | ) | | | (0.18 | ) | | | (0.72 | ) | | | (0.01 | ) | | | (0.73 | ) | | | — | | | | 14.47 | | | | 13.39 | |
| 2013 | | | 15.60 | | | | 0.66 | | | | (0.10 | ) | | | 0.56 | | | | (0.76 | ) | | | (0.02 | ) | | | (0.78 | ) | | | — | | | | 15.38 | | | | 14.32 | |
| 2012 | | | 14.42 | | | | 0.68 | | | | 1.32 | | | | 2.00 | | | | (0.80 | ) | | | (0.02 | ) | | | (0.82 | ) | | | — | | | | 15.60 | | | | 17.05 | |
| (a) | Total Return Based on Common Share NAV is the combination of changes in common share NAV, reinvested dividend income at NAV and reinvested capital gains distributions at NAV, if any. The last dividend declared in the period, which is typically paid on the first business day of the following month, is assumed to be reinvested at the ending NAV. The actual reinvest price for the last dividend declared in the period may often be based on the Fund's market price (and not its NAV), and therefore may be different from the price used in the calculation. Total returns are not annualized. |
| | |
| | Total Return Based on Common Share Price is the combination of changes in the market price per share and the effect of reinvested dividend income and reinvested capital gains distributions, if any, at the average price paid per share at the time of reinvestment. The last dividend declared in the period, which is typically paid on the first business day of the following month, is assumed to be reinvested at the ending market price. The actual reinvestment for the last dividend declared in the period may take place over several days, and in some instances may not be based on the market price, so the actual reinvestment price may be different from the price used in the calculation. Total returns are not annualized. |
| | | | | Common Share Supplemental Data/
Ratios Applicable to Common Shares | |
| | | Common Share
Total Returns | | | | Ratios to Average Net Assets(b) | | | |
| | | Based
on
NAV | (a) | Based
on
Share
Price | (a) | Ending
Net
Assets
(000 | ) | Expenses | (c) | Net
Investment
Income
(Loss | ) | Portfolio
Turnover
Rate | (e) |
| | | | | | | | | | | | | | | | | | | | |
| | | | | | | | | | | | | | | | | | | | |
| | | | 8.05 | % | | 14.65 | % | $ | 255,506 | | | 1.54 | % | | 3.97 | % | | 7 | % |
| | | | 4.91 | | | 2.72 | | | 246,319 | | | 1.54 | | | 4.03 | | | 12 | |
| | | | 3.54 | | | 0.10 | | | 246,492 | | | 2.81 | | | 3.85 | | | 17 | |
| | | | 2.50 | | | (9.16 | ) | | 248,601 | | | 2.72 | | | 3.88 | | | 17 | |
| | | | 11.88 | | | 16.23 | | | 97,497 | | | 3.28 | | | 3.85 | | | 18 | |
| | | | | | | | | | | | | | | | | | | | |
| | | | | | | | | | | | | | | | | | | | |
| | | | 8.41 | | | 13.22 | | | 268,960 | | | 1.64 | | | 4.51 | | | 18 | |
| | | | 5.45 | | | 5.72 | | | 260,104 | | | 1.67 | (d) | | 4.91 | (d) | | 17 | |
| | | | (0.79 | ) | | (0.93 | ) | | 259,568 | | | 2.25 | | | 5.15 | | | 19 | |
| | | | 3.56 | | | (11.76 | ) | | 275,865 | | | 2.57 | | | 4.19 | | | 21 | |
| | | | 14.26 | | | 20.61 | | | 141,099 | | | 2.78 | | | 4.49 | | | 12 | |
| (b) | Net Investment Income (Loss) ratios reflect income earned and expenses incurred on assets attributable to preferred shares issued by the Fund. |
| (c) | The expense ratios reflect, among other things, all interest expense and other costs related to preferred shares (as described in Note 4 – Fund Shares, Preferred Shares) and/or the interest expense deemed to have been paid by the Fund on the floating rate certificates issued by the special purpose trusts for the self-deposited inverse floaters held by the Fund, (as described in Note 3 – Portfolio Securities and Investments in Derivatives, Inverse Floating Rate Securities), where applicable, as follows: |
| North Carolina Premium Income (NNC) | | | | |
| Year Ended 5/31: | | | | |
| 2016 | | | 0.54 | % |
| 2015 | | | 0.52 | |
| 2014 | | | 1.70 | |
| 2013 | | | 1.60 | |
| 2012 | | | 1.71 | |
| Virginia Premium Income (NPV) | | | | |
| Year Ended 5/31: | | | | |
| 2016 | | | 0.62 | % |
| 2015 | | | 0.59 | |
| 2014 | | | 1.18 | |
| 2013 | | | 1.44 | |
| 2012 | | | 1.41 | |
| (d) | During the period ended May 31, 2015, the Adviser voluntarily reimbursed the Fund for certain expenses incurred in connection with a common shares equity shelf program. As a result, the Expenses and Net Investment Income (Loss) Ratios to Average Net Assets reflect this voluntary expense reimbursement from Adviser. The Expenses and Net Investment Income (Loss) Ratios to Average Net Assets excluding this expense reimbursement from Adviser were as follows: |
| Ratios to Average Net Assets |
| | | | | | | Net Investment | |
| Virginia Premium Income (NPV) | | | Expenses | | | Income (Loss | ) |
| Year Ended 5/31: | | | | | | | |
| 2015 | | | 1.70 | % | | 4.88 | % |
| (e) | Portfolio Turnover Rate is calculated based on the lesser of long-term purchases or sales (as disclosed in Note 5 – Investment Transactions) divided by the average long-term market value during the period. |
| * | Rounds to less than $0.01 per share. |
See accompanying notes to financial statements.
Financial Highlights (continued)
| | | | | | |
| | | MTP Shares at | | VMTP Shares | |
| | | the End of Period(a) | | at the End of Period | |
| | | | Aggregate | | | Asset | | | Aggregate | | | Asset | |
| | | | Amount | | | Coverage | | | Amount | | | Coverage | |
| | | | Outstanding | | | Per $10 | | | Outstanding | | | Per $100,000 | |
| | | | (000 | ) | | Share | | | (000 | ) | | Share | |
| Georgia Dividend Advantage 2 (NKG) | | | | | | | | | | | | | |
| Year Ended 5/31: | | | | | | | | | | | | | |
| 2016 | | $ | — | | $ | — | | $ | 75,000 | | $ | 302,480 | |
| 2015 | | | — | | | — | | | 75,000 | | | 296,588 | |
| 2014 | | | — | | | — | | | 75,000 | | | 296,676 | |
| 2013 | | | 74,945 | | | 30.53 | | | — | | | — | |
| 2012 | | | 32,265 | | | 30.78 | | | — | | | — | |
| | | | | | | | | | | | | | |
| Maryland Premium Income (NMY) | | | | | | | | | | | | | |
| Year Ended 5/31: | | | | | | | | | | | | | |
| 2016 | | | — | | | — | | | 167,000 | | | 311,126 | |
| 2015 | | | — | | | — | | | 167,000 | | | 306,168 | |
| 2014 | | | — | | | — | | | 167,000 | | | 311,383 | |
| 2013 | | | 166,144 | | | 32.58 | | | — | | | — | |
| 2012 | | | 74,593 | | | 32.42 | | | — | | | — | |
| (a) | The Ending and Average Market Value Per Share for each Series of the Fund's MTP Shares were as follows: |
| | | | 2014 | | | 2013 | | | 2012 | |
| Georgia Dividend Advantage 2 (NKG) | | | | | | | | | | |
| Series 2015 (NKG PRC) | | | | | | | | | | |
| Ending Market Value per Share | | $ | — | | $ | 10.08 | | $ | 10.10 | |
| Average Market Value per Share | | | 10.03 | ∆ | | 10.08 | | | 10.07 | |
| Series 2015-1 (NKG PRD)(b) | | | | | | | | | | |
| Ending Market Value per Share | | | — | | | 10.10 | | | — | |
| Average Market Value per Share | | | 10.04 | ∆ | | 10.07 | Ω | | — | |
| Series 2015-2 (NKG PRE)(b) | | | | | | | | | | |
| Ending Market Value per Share | | | — | | | 10.12 | | | — | |
| Average Market Value per Share | | | 10.03 | ∆ | | 10.07 | Ω | | — | |
| | | | | | | | | | | |
| Maryland Premium Income (NMY) | | | | | | | | | | |
| Series 2015 (NMY PRC) | | | | | | | | | | |
| Ending Market Value per Share | | | — | | | 10.06 | | | 10.06 | |
| Average Market Value per Share | | | 10.04 | ∆ | | 10.09 | | | 10.10 | |
| Series 2016 (NMY PRD) | | | | | | | | | | |
| Ending Market Value per Share | | | — | | | 10.16 | | | 10.11 | |
| Average Market Value per Share | | | 10.07 | ∆ | | 10.17 | | | 10.14 | |
| Series 2015 (NMY PRE)(b) | | | | | | | | | | |
| Ending Market Value per Share | | | — | | | 10.05 | | | — | |
| Average Market Value per Share | | | 10.03 | ∆ | | 10.07 | ΩΩ | | — | |
| Series 2015-1(NMY PRF)(b) | | | | | | | | | | |
| Ending Market Value per Share | | | — | | | 10.06 | | | — | |
| Average Market Value per Share | | | 10.03 | ∆ | | 10.07 | ΩΩ | | — | |
| Series 2015-1(NMY PRG)(b) | | | | | | | | | | |
| Ending Market Value per Share | | | — | | | 10.05 | | | — | |
| Average Market Value per Share | | | 10.04 | ∆ | | 10.08 | ΩΩ | | — | |
| Series 2016 (NMY PRH)(b) | | | | | | | | | | |
| Ending Market Value per Share | | | — | | | 10.13 | | | — | |
| Average Market Value per Share | | | 10.07 | ∆ | | 10.14 | ΩΩ | | — | |
| (b) | MTP Shares issued in connection with the reorganizations. |
| Ω | For the period July 9, 2012 (effective date of the reorganizations) through May 31, 2013. |
| ΩΩ | For the period August 6, 2012 (effective date of the reorganizations) through May 31, 2013. |
| ∆ | For the period June 1, 2013 through May 30, 2014. |
See accompanying notes to financial statements.
| | | RPS at the | | | MTP Shares at | | | VMTP Shares | |
| | | End of Period | | | the End of Period(a) | | | at the End of Period | |
| | | Aggregate | | | Asset | | | Aggregate | | | Asset | | | Aggregate | | | Asset | |
| | | Amount | | | Coverage | | | Amount | | | Coverage | | | Amount | | | Coverage | |
| | | Outstanding | | | Per $25,000 | | | Outstanding | | | Per $10 | | | Outstanding | | | Per $100,000 | |
| | | | (000 | ) | | Share | | | | (000 | ) | | Share | | | | (000 | ) | | Share | |
| Minnesota Municipal Income (NMS) | | | | | | | | | | | | | | | | | | | | | |
| Year Ended 5/31: | | | | | | | | | | | | | | | | | | | | | |
| 2016 | | $ | — | | | $ | — | | | $ | — | | | $ | — | | | $ | 44,100 | | | $ | 299,415 | |
| 2015(b) | | | — | | | | — | | | | — | | | | — | | | | 44,100 | | | | 295,352 | |
| Year Ended 6/30: | | | | | | | | | | | | | | | | | | | | | | | | |
| 2014(c) | | | — | | | | — | | | | — | | | | — | | | | 31,100 | | | | 307 | * |
| Year Ended 8/31: | | | | | | | | | | | | | | | | | | | | | | | | |
| 2013 | | | 31,100 | | | | 73 | * | | | — | | | | — | | | | — | | | | — | |
| 2012 | | | 31,100 | | | | 79 | * | | | — | | | | — | | | | — | | | | — | |
| 2011 | | | 31,100 | | | | 74 | * | | | — | | | | — | | | | — | | | | — | |
| 2010 | | | 31,100 | | | | 76 | * | | | — | | | | — | | | | — | | | | — | |
| | | | | | | | | | | | | | | | | | | | | | | | | |
| Missouri Premium Income (NOM) | | | | | | | | | | | | | | | | | | | | | | | | |
| Year Ended 5/31: | | | | | | | | | | | | | | | | | | | | | | | | |
| 2016 | | | — | | | | — | | | | — | | | | — | | | | 18,000 | | | | 287,651 | |
| 2015 | | | — | | | | — | | | | — | | | | — | | | | 18,000 | | | | 280,372 | |
| 2014 | | | — | | | | — | | | | 17,880 | | | | 28.50 | | | | — | | | | — | |
| 2013 | | | — | | | | — | | | | 17,880 | | | | 29.02 | | | | — | | | | | |
| 2012 | | | — | | | | — | | | | 17,880 | | | | 29.00 | | | | — | | | | — | |
| * | Rounded to the nearest thousand (000). |
| (a) | The Ending and Average Market Value Per Share for each Series of the Fund's MTP Shares were as follows: |
| | | | 2015 | | | 2014 | | | 2013 | | | 2012 | |
| Missouri Premium Income (NOM) | | | | | | | | | | | | | |
| Series 2015 (NOM PRC) | | | | | | | | | | | | | |
| Ending Market Value per Share | | $ | — | | $ | 10.06 | | $ | 10.03 | | $ | 10.40 | |
| Average Market Value per Share | | | 10.03 | ∆ | | 10.04 | | | 10.08 | | | 9.98 | |
| (b) | For the eleven months ended May 31, 2015. |
| (c) | For the ten months ended June 30, 2014. |
| ∆ | For the period June 1, 2014, through February 9, 2015. |
See accompanying notes to financial statements.
Financial Highlights (continued)
| | | MTP Shares at | | VMTP Shares | | VRDP Shares | |
| | | the End of Period(a) | | at the End of Period | | at the End of Period | |
| | | | Aggregate | | | Asset | | | Aggregate | | | Asset | | | Aggregate | | | Asset | |
| | | | Amount | | | Coverage | | | Amount | | | Coverage | | | Amount | | | Coverage | |
| | | | Outstanding | | | Per $10 | | | Outstanding | | | Per $100,000 | | | Outstanding | | | Per $100,000 | |
| | | | (000 | ) | | Share | | | (000 | ) | | Share | | | (000 | ) | | Share | |
| North Carolina Premium Income (NNC) | | | | | | | | | | | | | | | | |
| Year Ended 5/31: | | | | | | | | | | | | | | | | | | | |
| 2016 | | $ | — | | $ | — | | $ | 125,000 | | $ | 304,405 | | $ | — | | $ | — | |
| 2015 | | | — | | | — | | | 125,000 | | | 297,055 | | | — | | | — | |
| 2014 | | | — | | | — | | | 125,000 | | | 297,193 | | | — | | | — | |
| 2013 | | | 124,860 | | | 29.91 | | | — | | | — | | | — | | | — | |
| 2012 | | | 49,835 | | | 29.56 | | | — | | | — | | | — | | | — | |
| | | | | | | | | | | | | | | | | | | | |
| Virginia Premium Income (NPV) | | | | | | | | | | | | | | | | |
| Year Ended 5/31: | | | | | | | | | | | | | | | | | | | |
| 2016 | | | — | | | — | | | — | | | — | | | 128,000 | | | 310,125 | |
| 2015 | | | — | | | — | | | — | | | — | | | 128,000 | | | 303,206 | |
| 2014 | | | — | | | — | | | — | | | — | | | 128,000 | | | 302,787 | |
| 2013 | | | 127,408 | | | 31.65 | | | — | | | — | | | — | | | — | |
| 2012 | | | 61,408 | | | 32.98 | | | — | | | — | | | — | | | — | |
| (a) | The Ending and Average Market Value Per Share for each Series of the Fund's MTP Shares were as follows: |
| | | | 2014 | | | 2013 | | | 2012 | |
| North Carolina Premium Income (NNC) | | | | | | | | | | |
| Series 2015 (NNC PRC) | | | | | | | | | | |
| Ending Market Value per Share | | $ | — | | $ | 10.07 | | $ | 10.11 | |
| Average Market Value per Share | | | 10.03 | ^ | | 10.10 | | | 10.09 | |
| Series 2016 (NNC PRD) | | | | | | | | | | |
| Ending Market Value per Share | | | — | | | 10.08 | | | 10.10 | |
| Average Market Value per Share | | | 10.04 | ^ | | 10.09 | | | 10.07 | |
| Series 2015 (NNC PRE)(b) | | | | | | | | | | |
| Ending Market Value per Share | | | — | | | 10.06 | | | — | |
| Average Market Value per Share | | | 10.03 | ^ | | 10.07 | Ω | | — | |
| Series 2015-1 (NNC PRF)(b) | | | | | | | | | | |
| Ending Market Value per Share | | | — | | | 10.06 | | | — | |
| Average Market Value per Share | | | 10.03 | ^ | | 10.07 | Ω | | — | |
| Series 2015-1 (NNC PRG)(b) | | | | | | | | | | |
| Ending Market Value per Share | | | — | | | 10.06 | | | — | |
| Average Market Value per Share | | | 10.03 | ^ | | 10.07 | Ω | | — | |
| | | | | | | | | | | |
| Virginia Premium Income (NPV) | | | | | | | | | | |
| Series 2014 (NPV PRA) | | | | | | | | | | |
| Ending Market Value per Share | | | — | | | 10.03 | | | 10.12 | |
| Average Market Value per Share | | | 10.01 | ^^ | | 10.08 | | | 10.10 | |
| Series 2015 (NPV PRC) | | | | | | | | | | |
| Ending Market Value per Share | | | — | | | 10.09 | | | 10.13 | |
| Average Market Value per Share | | | 10.04 | ^^ | | 10.09 | | | 10.09 | |
| Series 2014 (NPV PRD)(b) | | | | | | | | | | |
| Ending Market Value per Share | | | — | | | 10.06 | | | — | |
| Average Market Value per Share | | | 10.04 | ^^ | | 10.09 | ΩΩ | | — | |
| Series 2014-1 (NPV PRE)(b) | | | | | | | | | | |
| Ending Market Value per Share | | | — | | | 10.09 | | | — | |
| Average Market Value per Share | | | 10.04 | ^^ | | 10.09 | ΩΩ | | — | |
| (b) | MTP Shares issued in connection with the reorganizations. |
| Ω | For the period July 9, 2012 (effective date of the reorganizations) through May 31, 2013. |
| ΩΩ | For the period August 6, 2012 (effective date of the reorganizations) through May 31, 2013. |
| ^ | For the period June 1, 2013 through March 3, 2014. |
| ^^ | For the period June 1, 2013 through September 9, 2013. |
See accompanying notes to financial statements.
| Notes to Financial Statements | |
1. General Information and Significant Accounting Policies
General Information
Fund Information
The state funds covered in this report and their corresponding New York Stock Exchange ("NYSE") or NYSE MKT symbols are as follows (each a "Fund" and collectively, the "Funds"):
| | • | Nuveen Georgia Dividend Advantage Municipal Fund 2 (NKG) ("Georgia Dividend Advantage 2 (NKG)") |
| | • | Nuveen Maryland Premium Income Municipal Fund (NMY) ("Maryland Premium Income (NMY)") |
| | • | Nuveen Minnesota Municipal Income Fund (NMS) ("Minnesota Municipal Income (NMS)") |
| | • | Nuveen Missouri Premium Income Municipal Fund (NOM) ("Missouri Premium Income (NOM)") |
| | • | Nuveen North Carolina Premium Income Municipal Fund (NNC) ("North Carolina Premium Income (NNC)") |
| | • | Nuveen Virginia Premium Income Municipal Fund (NPV) ("Virginia Premium Income (NPV)") |
The Funds are registered under the Investment Company Act of 1940, as amended, as diversified, closed-end management investment companies. Common shares of Georgia Dividend Advantage 2 (NKG), Maryland Premium Income (NMY), Minnesota Municipal Income (NMS), North Carolina Premium Income (NNC) and Virginia Premium Income (NPV) are traded on the NYSE while common shares of Missouri Premium Income (NOM) are traded on the NYSE MKT. Georgia Dividend Advantage 2 (NKG), Minnesota Municipal Income (NMS) and Missouri Premium Income (NOM) were organized as Massachusetts business trusts on October 26, 2001, April 28, 2014 and March 29, 1993, respectively. Maryland Premium Income (NMY), North Carolina Premium Income (NNC) and Virginia Premium Income (NPV) were organized as Massachusetts business trusts on January 12, 1993.
The end of the reporting period for the Funds is May 31, 2016, and the period covered by these Notes to Financial Statements is the fiscal year ended May 31, 2016 (the "current fiscal period").
Investment Adviser
The Funds' investment adviser is Nuveen Fund Advisors, LLC (the "Adviser"), a wholly-owned subsidiary of Nuveen Investments, Inc. ("Nuveen"). Nuveen is an operating division of TIAA Global Asset Management. The Adviser is responsible for each Fund's overall investment strategy and asset allocation decisions. The Adviser has entered into sub-advisory agreements with Nuveen Asset Management, LLC (the "Sub-Adviser"), a subsidiary of the Adviser, under which the Sub-Adviser manages the investment portfolios of the Funds.
Investment Objectives and Principal Investment Strategies
Each Fund seeks to provide current income exempt from both regular federal and designated state income taxes by investing primarily in a portfolio of municipal obligations issued by state and local government authorities within a single state or certain U.S. territories.
Significant Accounting Policies
Each Fund is an investment company and follows accounting and reporting guidance under Financial Accounting Standards Board (FASB) Accounting Standards Codification (ASC) Topic 946 "Financial Services – Investment Companies." The following is a summary of significant accounting policies followed by the Funds in the preparation of their financial statements in accordance with U.S. generally accepted accounting principles ("U.S. GAAP").
Investment Transactions
Investment transactions are recorded on a trade date basis. Realized gains and losses from investment transactions are determined on the specific identification method, which is the same basis used for federal income tax purposes. Investments purchased on a when-issued/delayed delivery basis may have extended settlement periods. Any investments so purchased are subject to market fluctuation during this period. The Funds have earmarked securities in their portfolios with a current value at least equal to the amount of the when-issued/delayed delivery purchase commitments.
Notes to Financial Statements (continued)
As of the end of the reporting period, the following Funds' outstanding when-issued/delayed delivery purchase commitments were as follows:
| | | | | | | | | | North | |
| | | | Georgia | | | Maryland | | | Carolina | |
| | | | Dividend | | | Premium | | | Premium | |
| | | | Advantage 2 | | | Income | | | Income | |
| | | | (NKG | ) | | (NMY | ) | | (NNC | ) |
| Outstanding when-issued/delayed delivery purchase commitments | | $ | 3,748,590 | | $ | 1,956,255 | | $ | 9,048,955 | |
Investment Income
Investment income, which reflects the amortization of premiums and accretion of discounts for financial reporting purposes, is recorded on an accrual basis. Investment income also reflects paydown gains and losses, if any.
Professional Fees
Professional fees presented on the Statement of Operations consist of legal fees incurred in the normal course of operations, audit fees, tax consulting fees and, in some cases, workout expenditures. Workout expenditures are incurred in an attempt to protect or enhance an investment or to pursue other claims or legal actions on behalf of Fund shareholders. If a refund is received for workout expenditures paid in a prior reporting period, such amounts will be recognized as "Legal fee refund" on the Statements of Operations.
Dividends and Distributions to Common Shareholders
Dividends from net investment income are declared monthly. Net realized capital gains and/or market discount from investment transactions, if any, are distributed to shareholders at least annually. Furthermore, capital gains are distributed only to the extent they exceed available capital loss carryforwards.
Distributions to common shareholders of net investment income, net realized capital gains and/or market discount, if any, are recorded on the ex-dividend date. The amount and timing of distributions are determined in accordance with federal income tax regulations, which may differ from U.S. GAAP.
Indemnifications
Under the Funds' organizational documents, their officers and trustees are indemnified against certain liabilities arising out of the performance of their duties to the Funds. In addition, in the normal course of business, the Funds enter into contracts that provide general indemnifications to other parties. The Funds' maximum exposure under these arrangements is unknown as this would involve future claims that may be made against the Funds that have not yet occurred. However, the Funds have not had prior claims or losses pursuant to these contracts and expect the risk of loss to be remote.
Netting Agreements
In the ordinary course of business, the Funds may enter into transactions subject to enforceable International Swaps and Derivative Association, Inc. ("ISDA") master agreements or other similar arrangements ("netting agreements"). Generally, the right to offset in netting agreements allows each Fund to offset certain securities and derivatives with a specific counterparty, when applicable, as well as any collateral received or delivered to that counterparty based on the terms of the agreements. Generally, each Fund manages its cash collateral and securities collateral on a counterparty basis.
The Funds' investments subject to netting agreements as of the end of the reporting period, if any, are further described in Note 3 – Portfolio Securities and Investments in Derivatives.
Use of Estimates
The preparation of financial statements in conformity with U.S. GAAP requires management to make estimates and assumptions that affect the reported amounts of assets and liabilities at the date of the financial statements and the reported amounts of increases and decreases in net assets applicable to common shares from operations during the reporting period. Actual results may differ from those estimates.
2. Investment Valuation and Fair Value Measurements
The fair valuation input levels as described below are for fair value measurement purposes.
Fair value is defined as the price that would be received upon selling an investment or transferring a liability in an orderly transaction to an independent buyer in the principal or most advantageous market for the investment. A three-tier hierarchy is used to maximize the use of observable market data and minimize the use of unobservable inputs and to establish classification of fair value measurements for disclosure purposes. Observable inputs reflect the assumptions market participants would use in pricing the asset or liability. Observable inputs are based on market data obtained from sources independent of the reporting entity. Unobservable inputs reflect the reporting entity's own assumptions about the assumptions market participants would use in pricing the asset or liability. Unobservable inputs are based on the best information available in the circumstances. The following is a summary of the three-tiered hierarchy of valuation input levels.
| | |
| Level 1 – | Inputs are unadjusted and prices are determined using quoted prices in active markets for identical securities. |
| Level 2 – | Prices are determined using other significant observable inputs (including quoted prices for similar securities, interest rates, prepayment speeds, credit risk, etc.). |
| Level 3 – | Prices are determined using significant unobservable inputs (including management's assumptions in determining the fair value of investments). |
Prices of fixed income securities are provided by an independent pricing service ("pricing service") approved by the Funds' Board of Trustees (the "Board"). The pricing service establishes a security's fair value using methods that may include consideration of the following: yields or prices of investments of comparable quality, type of issue, coupon, maturity and rating, market quotes or indications of value from security dealers, evaluations of anticipated cash flows or collateral, general market conditions and other information and analysis, including the obligor's credit characteristics considered relevant. These securities are generally classified as Level 2. In pricing certain securities, particularly less liquid and lower quality securities, the pricing service may consider information about a security, its issuer or market activity, provided by the Adviser. These securities are generally classified as Level 2 or Level 3 depending on the priority of the significant inputs.
Price of swaps contracts are also provided by an independent pricing service approved by the Board using the same methods as described above and are generally classified as Level 2.
Common stocks and other equity-type securities are valued at the last sales price on the securities exchange on which such securities are primarily traded and are generally classified as Level 1. Securities primarily traded on the NASDAQ National Market ("NASDAQ") are valued at the NASDAQ Official Closing Price and are generally classified as Level 1. However, securities traded on a securities exchange or NASDAQ for which there were no transactions on a given day or securities not listed on a securities exchange or NASDAQ are valued at the quoted bid price and are generally classified as Level 2.
Certain securities may not be able to be priced by the pre-established pricing methods as described above. Such securities may be valued by the Board and/or its appointee at fair value. These securities generally include, but are not limited to, restricted securities (securities which may not be publicly sold without registration under the Securities Act of 1933, as amended) for which a pricing service is unable to provide a market price; securities whose trading has been formally suspended; debt securities that have gone into default and for which there is no current market quotation; a security whose market price is not available from a pre-established pricing source; a security with respect to which an event has occurred that is likely to materially affect the value of the security after the market has closed but before the calculation of a Fund's net asset value ("NAV") (as may be the case in non-U.S. markets on which the security is primarily traded) or make it difficult or impossible to obtain a reliable market quotation; and a security whose price, as provided by the pricing service, is not deemed to reflect the security's fair value. As a general principle, the fair value of a security would appear to be the amount that the owner might reasonably expect to receive for it in a current sale. A variety of factors may be considered in determining the fair value of such securities, which may include consideration of the following: yields or prices of investments of comparable quality, type of issue, coupon, maturity and rating, market quotes or indications of value from security dealers, evaluations of anticipated cash flows or collateral, general market conditions and other information and analysis, including the obligor's credit characteristics considered relevant. These securities are generally classified as Level 2 or Level 3 depending on the priority of the significant inputs. Regardless of the method employed to value a particular security, all valuations are subject to review by the Board and/or its appointee.
The inputs or methodologies used for valuing securities are not an indication of the risks associated with investing in those securities. The following is a summary of each Fund's fair value measurements as of the end of the reporting period:
| Georgia Dividend Advantage 2 (NKG) | | | Level 1 | | | Level 2 | | | Level 3 | | | Total | |
| Long-Term Investments*: | | | | | | | | | | | | | |
| Municipal Bonds | | $ | — | | $ | 223,632,167 | | $ | — | | $ | 223,632,167 | |
| Maryland Premium Income (NMY) | | | | | | | | | | | | | |
| Long-Term Investments*: | | | | | | | | | | | | | |
| Municipal Bonds | | $ | — | | $ | 517,090,270 | | $ | — | | $ | 517,090,270 | |
| Common Stocks | | | 1,423,409 | | | — | | | — | | | 1,423,409 | |
| Total | | $ | 1,423,409 | | $ | 517,090,270 | | $ | — | | $ | 518,513,679 | |
| Minnesota Municipal Income (NMS) | | | | | | | | | | | | | |
| Long-Term Investments*: | | | | | | | | | | | | | |
| Municipal Bonds | | $ | — | | $ | 130,900,918 | | $ | — | | $ | 130,900,918 | |
| Missouri Premium Income (NOM) | | | | | | | | | | | | | |
| Long-Term Investments*: | | | | | | | | | | | | | |
| Municipal Bonds | | $ | — | | $ | 53,257,308 | | $ | — | | $ | 53,257,308 | |
| North Carolina Premium Income (NNC) | | | | | | | | | | | | | |
| Long-Term Investments*: | | | | | | | | | | | | | |
| Municipal Bonds | | $ | — | | $ | 380,308,402 | | $ | — | | $ | 380,308,402 | |
| Virginia Premium Income (NPV) | | | | | | | | | | | | | |
| Long-Term Investments*: | | | | | | | | | | | | | |
| Municipal Bonds | | $ | — | | $ | 382,428,105 | | $ | — | | $ | 382,428,105 | |
| * | Refer to the Fund's Portfolio of Investments for industry classifications. |
Notes to Financial Statements (continued)
The Board is responsible for the valuation process and has appointed the oversight of the daily valuation process to the Adviser's Valuation Committee. The Valuation Committee, pursuant to the valuation policies and procedures adopted by the Board is responsible for making fair value determinations, evaluating the effectiveness of the Funds' pricing policies and reporting to the Board. The Valuation Committee is aided in its efforts by the Adviser's dedicated Securities Valuation Team, which is responsible for administering the daily valuation process and applying fair value methodologies as approved by the Valuation Committee. When determining the reliability of independent pricing services for investments owned by the Funds, the Valuation Committee, among other things, conducts due diligence reviews of the pricing services and monitors the quality of security prices received through various testing reports conducted by the Securities Valuation Team.
The Valuation Committee will consider pricing methodologies it deems relevant and appropriate when making a fair value determination, based on the facts and circumstances specific to the portfolio instrument. Fair value determinations generally will be derived as follows, using public or private market information:
| | | |
| | (i) | If available, fair value determinations shall be derived by extrapolating from recent transactions or quoted prices for identical or comparable securities. |
| | | |
| | (ii) | If such information is not available, an analytical valuation methodology may be used based on other available information including, but not limited to: analyst appraisals, research reports, corporate action information, issuer financial statements and shelf registration statements. Such analytical valuation methodologies may include, but are not limited to: multiple of earnings, discount from market value of a similar freely-traded security, discounted cash flow analysis, book value or a multiple thereof, risk premium/yield analysis, yield to maturity and/or fundamental investment analysis. |
The purchase price of a portfolio instrument will be used to fair value the instrument only if no other valuation methodology is available or deemed appropriate, and it is determined that the purchase price fairly reflects the instrument's current value.
For each portfolio security that has been fair valued pursuant to the policies adopted by the Board, the fair value price is compared against the last available and next available market quotations. The Valuation Committee reviews the results of such testing and fair valuation occurrences are reported to the Board.
3. Portfolio Securities and Investments in Derivatives
Portfolio Securities
Inverse Floating Rate Securities
Each Fund is authorized to invest in inverse floating rate securities. An inverse floating rate security is created by depositing a municipal bond (referred to as an "Underlying Bond"), typically with a fixed interest rate, into a special purpose tender option bond ("TOB") trust (referred to as the "TOB Trust") created by or at the direction of one or more Funds. In turn, the TOB Trust issues (a) floating rate certificates (referred to as "Floaters") in face amounts equal to some fraction of the Underlying Bond's par amount or market value, and (b) an inverse floating rate certificate (referred to as an "Inverse Floater") that represents all remaining or residual interest in the TOB Trust. Floaters typically pay short-term tax-exempt interest rates to third parties who are also provided a right to tender their certificate and receive its par value, which may be paid from the proceeds of a remarketing of the Floaters, by a loan to the TOB Trust from a third party liquidity provider ("Liquidity Provider"), or by the sale of assets from the TOB Trust. The Inverse Floater is issued to a long term investor, such as one or more of the Funds. The income received by the Inverse Floater holder varies inversely with the short-term rate paid to holders of the Floaters, and in most circumstances the Inverse Floater holder bears substantially all of the Underlying Bond's downside investment risk and also benefits disproportionately from any potential appreciation of the Underlying Bond's value. The value of an Inverse Floater will be more volatile than that of the Underlying Bond because the interest rate is dependent on not only the fixed coupon rate of the Underlying Bond but also on the short-term interest paid on the Floaters, and because the Inverse Floater essentially bears the risk of loss (and possible gain) of the greater face value of the Underlying Bond.
The Inverse Floater held by a Fund gives the Fund the right to (a) cause the holders of the Floaters to tender their certificates at par (or slightly more than par in certain circumstances), and (b) have the trustee of the TOB Trust (the "Trustee") transfer the Underlying Bond held by the TOB Trust to the Fund, thereby collapsing the TOB Trust.
The Fund may acquire an Inverse Floater in a transaction where it (a) transfers an Underlying Bond that it owns to a TOB Trust created by a third party or (b) transfers an Underlying Bond that it owns, or that it has purchased in a secondary market transaction for the purpose of creating an Inverse Floater, to a TOB Trust created at its direction, and in return receives the Inverse Floater of the TOB Trust (referred to as a "self-deposited Inverse Floater"). A Fund may also purchase an Inverse Floater in a secondary market transaction from a third party creator of the TOB Trust without first owning the Underlying Bond (referred to as an "externally-deposited Inverse Floater").
An investment in a self-deposited Inverse Floater is accounted for as a "financing" transaction (i.e., a secured borrowing). For a self-deposited Inverse Floater, the Underlying Bond deposited into the TOB Trust is identified in the Fund's Portfolio of Investments as "(UB) – Underlying bond of an inverse floating rate trust reflected as a financing transaction," with the Fund recognizing as liabilities, labeled "Floating rate obligations" on the Statement of Assets and Liabilities, (a) the liquidation value of Floaters issued by the TOB Trust, and (b) the amount of any borrowings by the TOB Trust from a Liquidity Provider to enable the TOB Trust to purchase outstanding Floaters in lieu of a remarketing. In addition, the Fund recognizes in "Investment Income" the entire earnings of the Underlying Bond, and recognizes (a) the interest paid to the holders of the Floaters or on the TOB Trust's
borrowings, and (b) other expenses related to remarketing, administration, trustee, liquidity and other services to a TOB Trust, as a component of "Interest expense and amortization of offering costs" on the Statement of Operations.
In contrast, an investment in an externally-deposited Inverse Floater is accounted for as a purchase of the Inverse Floater and is identified in the Fund's Portfolio of Investments as "(IF) – Inverse floating rate investment." For an externally-deposited Inverse Floater, a Fund's Statement of Assets and Liabilities recognizes the Inverse Floater and not the Underlying Bond as an asset, and the Fund does not recognize the Floaters, or any related borrowings from a Liquidity Provider, as a liability. Additionally, the Fund reflects in "Investment Income" only the net amount of earnings on the Inverse Floater (net of the interest paid to the holders of the Floaters or the Liquidity Provider as lender, and the expenses of the Trust), and does not show the amount of that interest paid or the expenses of the TOB Trust as described above as interest expense on the Statement of Operations.
Fees paid upon the creation of a TOB Trust for self-deposited Inverse Floaters and externally-deposited Inverse Floaters are recognized as part of the cost basis of the Inverse Floater and are capitalized over the term of the TOB Trust.
As of the end of the reporting period, the aggregate value of Floaters issued by each Fund's TOB Trust for self-deposited Inverse Floaters and externally-deposited Inverse Floaters was as follows:
| | | | | | | | | | | | | | | | North | | | | |
| | | | Georgia | | | Maryland | | | Minnesota | | | Missouri | | | Carolina | | | Virginia | |
| | | | Dividend | | | Premium | | | Municipal | | | Premium | | | Premium | | | Premium | |
| | | Advantage 2 | | | Income | | | Income | | | Income | | | Income | | | Income | |
| Floating Rate Obligations Outstanding | | | (NKG | ) | | (NMY | ) | | (NMS | ) | | (NOM | ) | | (NNC | ) | | (NPV | ) |
| Floating rate obligations: self-deposited Inverse Floaters | | $ | 3,245,000 | | $ | 15,215,000 | | $ | — | | $ | 2,225,000 | | $ | — | | $ | 9,250,000 | |
| Floating rate obligations: externally-deposited Inverse Floaters | | | 5,635,000 | | | — | | | — | | | — | | | — | | | 20,070,000 | |
| Total | | $ | 8,880,000 | | $ | 15,215,000 | | $ | — | | $ | 2,225,000 | | $ | — | | $ | 29,320,000 | |
During the current fiscal period, the average amount of Floaters (including any borrowings from a Liquidity Provider) outstanding, and average annual interest rate and fees related to self-deposited Inverse Floaters, were as follows:
| | | | | | | | | | | | | | | | North | | | | |
| | | | Georgia | | | Maryland | | | Minnesota | | | Missouri | | | Carolina | | | Virginia | |
| | | | Dividend | | | Premium | | | Municipal | | | Premium | | | Premium | | | Premium | |
| | | Advantage 2 | | | Income | | | Income | | | Income | | | Income | | | Income | |
| Self-Deposited Inverse Floaters | | | (NKG | ) | | (NMY | ) | | (NMS | ) | | (NOM | ) | | (NNC | ) | | (NPV | ) |
| Average floating rate obligations outstanding | | $ | 3,245,000 | | $ | 16,125,683 | | $ | — | | $ | 2,225,000 | | $ | — | | $ | 9,250,000 | |
| Average annual interest rate and fees | | | 0.73 | % | | 0.71 | % | | — | % | | 0.28 | % | | — | % | | 0.37 | % |
TOB Trusts are supported by a liquidity facility provided by a Liquidity Provider pursuant to which the Liquidity Provider agrees, in the event that Floaters are (a) tendered to the Trustee for remarketing and the remarketing does not occur, or (b) subject to mandatory tender pursuant to the terms of the TOB Trust agreement, to either purchase Floaters or to provide the Trustee with an advance from a loan facility to fund the purchase of Floaters by the TOB Trust. In certain circumstances, the Liquidity Provider may otherwise elect to have the Trustee sell the Underlying Bond to retire the Floaters that were tendered and not remarketed prior to providing such a loan. In these circumstances, the Liquidity Provider remains obligated to provide a loan to the extent that the proceeds of the sale of the Underlying Bond is not sufficient to pay the purchase price of the Floaters.
The size of the commitment under the loan facility for a given TOB Trust is at least equal to the balance of that TOB Trust's outstanding Floaters plus any accrued interest. In consideration of the loan facility, fee schedules are in place and are charged by the Liquidity Provider(s). Any loans made by the Liquidity Provider will be secured by the purchased Floaters held by the TOB Trust. Interest paid on any outstanding loan balances will be effectively borne by the Fund that owns the Inverse Floaters of the TOB Trust that has incurred the borrowing and may be at a rate that is greater than the rate that would have been paid had the Floaters been successfully remarketed.
As described above, any amounts outstanding under a liquidity facility are recognized as a component of "Floating rate obligations" on the Statement of Assets and Liabilities by the Fund holding the corresponding Inverse Floaters issued by the borrowing TOB Trust. As of the end of the reporting period, there were no loans outstanding under any such facility.
Each Fund may also enter into shortfall and forbearance agreements (sometimes referred to as a "recourse arrangement" or "credit recovery swap") (TOB Trusts involving such agreements are referred to herein as "Recourse Trusts"), under which a Fund agrees to reimburse the Liquidity Provider for the Trust's Floaters, in certain circumstances, for the amount (if any) by which the liquidation value of the Underlying Bond held by the TOB Trust may fall short of the sum of the liquidation value of the Floaters issued by the TOB Trust plus any amounts borrowed by the TOB Trust from the Liquidity Provider, plus any shortfalls in interest cash flows. Under these agreements, a Fund's potential exposure to losses related to or on an Inverse Floater may increase beyond the value of the Inverse Floater as a Fund may potentially be liable to fulfill all amounts owed to holders of the Floaters or the Liquidity Provider. Any such shortfall amount in the aggregate is recognized as "Unrealized depreciation on Recourse Trusts" on the Statement of Assets and Liabilities.
Notes to Financial Statements (continued)
As of the end of the reporting period, each Fund's maximum exposure to the Floaters issued by Recourse Trusts for self-deposited Inverse Floaters and externally-deposited Inverse Floaters was as follows:
| | | | | | | | | | | | | | | | North | | | | |
| | | | Georgia | | | Maryland | | | Minnesota | | | Missouri | | | Carolina | | | Virginia | |
| | | | Dividend | | | Premium | | | Municipal | | | Premium | | | Premium | | | Premium | |
| | | Advantage 2 | | | Income | | | Income | | | Income | | | Income | | | Income | |
| Floating Rate Obligations – Recourse Trusts | | | (NKG | ) | | (NMY | ) | | (NMS | ) | | (NOM | ) | | (NNC | ) | | (NPV | ) |
| Maximum exposure to Recourse Trusts: self-deposted Inverse Floaters | | $ | — | | $ | 10,140,000 | | $ | — | | $ | — | | $ | — | | $ | — | |
| Maximum exposure to Recourse Trusts: externally-deposited Inverse Floaters | | | — | | | — | | | — | | | — | | | — | | | 13,330,000 | |
| Total | | $ | — | | $ | 10,140,000 | | $ | — | | $ | — | | $ | — | | $ | 13,330,000 | |
Zero Coupon Securities
A zero coupon security does not pay a regular interest coupon to its holders during the life of the security. Income to the holder of the security comes from accretion of the difference between the original purchase price of the security at issuance and the par value of the security at maturity and is effectively paid at maturity. The market prices of zero coupon securities generally are more volatile than the market prices of securities that pay interest periodically.
Investments in Derivatives
In addition to the inverse floating rate securities in which each Fund may invest, which are considered portfolio securities for financial reporting purposes, each Fund is authorized to invest in certain derivative investments such as futures, options and swap contracts. Each Fund limits its investments in futures, options on futures and swap contracts to the extent necessary for the Adviser to claim exclusion from registration by the Commodity Futures Trading Commission as a commodity pool operator with respect to the Fund. The Funds record derivative instruments at fair value, with changes in fair value recognized on the Statement of Operations, when applicable. Even though the Funds' investments in derivatives may represent economic hedges, they are not considered to be hedge transactions for financial reporting purposes.
Credit Default Swaps
A Fund may enter into a credit default swap contract to seek to maintain a total return on a particular investment or portion of its portfolio, or to take an active long or short position with respect to the likelihood of a particular issuer's default. Credit default swap contracts involve one party making a stream of payments to another party in exchange for the right to receive a specified return if/when there is a credit event by a third party. Generally, a credit event means bankruptcy, failure to pay, or restructuring. The specific credit events applicable for each credit default swap are stated in the terms of the particular swap agreement. Upon occurrence of a specific credit event with respect to the underlying referenced entity, the Fund will either (i) receive that security, or an equivalent amount of cash, from the counterparty in exchange for payment of the notional amount to the counterparty, or (ii) pay a net settlement amount of the credit default swap contract less the recovery value of the referenced obligation or underlying securities comprising the referenced index. The difference between the value of the security delivered and the notional amount received is recorded as a realized gain or loss. Payments received or made at the beginning of the measurement period are recognized as a component of "Credit default swaps premiums paid and/or received" on the Statement of Assets and Liabilities, when applicable.
Credit default swap contracts are valued daily. Changes in the value of a credit default swap during the fiscal period are recognized as a component of "Change in net unrealized appreciation (depreciation) of swaps" and realized gains and losses are recognized as a component of "Net realized gain (loss) from swaps" on the Statement of Operations.
For OTC swaps not cleared through a clearing house ("OTC Uncleared"), the daily change in the market value of the swap contract, along with any daily interest fees accrued, are recognized as components of "Unrealized appreciation or depreciation on credit default swaps (, net)" on the Statement of Assets and Liabilities.
Upon the execution of an OTC swap cleared through a clearing house ("OTC Cleared"), a Fund is obligated to deposit cash or eligible securities, also known as "initial margin," into an account at its clearing broker equal to a specified percentage of the contract amount. Cash held by the broker to cover initial margin requirements on open swap contracts, if any, is recognized as "Cash collateral at brokers" on the Statement of Assets and Liabilities. Investments in OTC Cleared swaps obligate a Fund and the clearing broker to settle monies on a daily basis representing changes in the prior day's "mark-to-market" of the swap. If a Fund has unrealized appreciation the clearing broker would credit the Fund's account with an amount equal to the appreciation and conversely if a Fund has unrealized depreciation the clearing broker would debit a Fund's account with an amount equal to the depreciation. These daily cash settlements are also known as "variation margin." Variation margin for OTC Cleared swaps is recognized as a receivable and/or payable for "Variation margin on swap contracts" on the Statement of Assets and Liabilities. Upon the execution of an OTC Uncleared swap, neither the Fund nor the counterparty is required to deposit initial margin as the trades are recorded bilaterally between both parties to the swap contract, and the terms of the variation margin are subject to a predetermined threshold negotiated by the Fund and the counterparty. Variation margin for OTC Uncleared swaps is recognized as a component of "Unrealized appreciation or depreciation on credit default swaps (, net)" as described in the preceding paragraph. The maximum potential amount of future payments the Fund could incur as a buyer or seller of protection in a credit default swap contract is limited to the notional amount of the contract. The maximum potential amount would be offset by the recovery value, if any, of the respective referenced entity.
During the current fiscal period, Georgia Dividend Advantage 2 (NKG) and North Carolina Premium Income (NNC) invested in credit default swaps to manage credit risk by purchasing credit protection. These swap contracts were terminated before the end of the reporting period.
The average notional amount of credit default swap contracts outstanding during the current fiscal period was as follows:
| | | | | | | North | |
| | | | Georgia | | | Carolina | |
| | | | Dividend | | | Premium | |
| | | Advantage 2 | | | Income | |
| | | | (NKG | ) | | (NNC | ) |
| Average notional amount of credit default swap contracts outstanding* | | $ | 182,000 | | $ | 314,000 | |
| * | The average notional amount is calculated based on the outstanding notional at the beginning of the fiscal period and at the end of each fiscal quarter within the current fiscal period. |
The following table presents the amount of net realized gain (loss) and change in net unrealized appreciation (depreciation) recognized on swap contracts on the Statement of Operations during the current fiscal period, and the primary underlying risk exposure.
| | | | | | | | | | Net Realized | | | Change in Net Unrealized | |
| | | | Underlying | | | Derivative | | Gain (Loss from | ) | | Appreciation (Depreciation of | ) |
| Fund | | | Risk Exposure | | | Instrument | | | Swaps | | | Swaps | |
| Georgia Dividend Advantage 2 (NKG) | | | Credit | | | Swaps | | $ | 30,033 | | $ | (25,771 | ) |
| North Carolina Premium Income (NNC) | | | Credit | | | Swaps | | | 50,670 | | | (43,394 | ) |
Market and Counterparty Credit Risk
In the normal course of business each Fund may invest in financial instruments and enter into financial transactions where risk of potential loss exists due to changes in the market (market risk) or failure of the other party to the transaction to perform (counterparty credit risk). The potential loss could exceed the value of the financial assets recorded on the financial statements. Financial assets, which potentially expose each Fund to counterparty credit risk, consist principally of cash due from counterparties on forward, option and swap transactions, when applicable. The extent of each Fund's exposure to counterparty credit risk in respect to these financial assets approximates their carrying value as recorded on the Statement of Assets and Liabilities.
Each Fund helps manage counterparty credit risk by entering into agreements only with counterparties the Adviser believes have the financial resources to honor their obligations and by having the Adviser monitor the financial stability of the counterparties. Additionally, counterparties may be required to pledge collateral daily (based on the daily valuation of the financial asset) on behalf of each Fund with a value approximately equal to the amount of any unrealized gain above a pre-determined threshold. Reciprocally, when each Fund has an unrealized loss, the Funds have instructed the custodian to pledge assets of the Funds as collateral with a value approximately equal to the amount of the unrealized loss above a pre-determined threshold. Collateral pledges are monitored and subsequently adjusted if and when the valuations fluctuate, either up or down, by at least the pre-determined threshold amount.
4. Fund Shares
Common Share Transactions
Transactions in common shares for the following Funds during the Funds' current and prior fiscal period, where applicable. were as follows:
| | | Georgia Dividend | | Maryland Premium | | Minnesota Municipal | |
| | | Advantage 2 (NKG) | | Income (NMY) | | Income (NMS) | |
| | | | Year | | | Year | | | Year | | | Year | | | Year | | | Eleven Months | | | Ten Months | |
| | | | Ended | | | Ended | | | Ended | | | Ended | | | Ended | | | Ended | | | Ended | |
| | | | 5/31/16 | | | 5/31/15 | | | 5/31/16 | | | 5/31/15 | | | 5/31/16 | | | 5/31/15 | | | 6/30/14 | |
| Common shares: | | | | | | | | | | | | | | | | | | | | | | |
| Shares sold | | | — | | | — | | | — | | | — | | | — | | | 2 | | | — | |
| Issued in the mergers | | | — | | | — | | | — | | | — | | | — | | | 1,424,061 | | | — | |
| Issued to shareholders due to reinvestment of distributions | | | 523 | | | — | | | — | | | — | | | 880 | | | — | | | — | |
| Repurchased and retired | | | — | | | — | | | (225,902 | ) | | (504,100 | ) | | — | | | — | | | — | |
| | | | | | | | | | | | | | | | | | | | | | | |
| Weighted average common share: | | | | | | | | | | | | | | | | | | | | | | |
| Price per share repurchased and retired | | | — | | | — | | $ | 12.34 | | $ | 12.58 | | | — | | | — | | | — | |
| Discount per share repurchased and retired | | | — | | | — | | | 15.25 | % | | 13.98 | % | | — | | | — | | | — | |
Notes to Financial Statements (continued)
| | | Missouri Premium | | North Carolina | |
| | | Income (NOM) | | Premium Income (NNC) | |
| | | | Year | | | Year | | | Year | | | Year | |
| | | | Ended | | | Ended | | | Ended | | | Ended | |
| | | | 5/31/16 | | | 5/31/15 | | | 5/31/16 | | | 5/31/15 | |
| Common shares: | | | | | | | | | | | | | |
| Issued to shareholders due to reinvestment of distributions | | | 3,736 | | | 3,566 | | | — | | | — | |
| Repurchased and retired | | | — | | | — | | | (22,501 | ) | | (107,500 | ) |
| | | | | | | | | | | | | | |
| Weighted average common share: | | | | | | | | | | | | | |
| Price per share repurchased and retired | | | — | | | — | | $ | 12.75 | | $ | 13.02 | |
| Discount per share repurchased and retired | | | — | | | — | | | 15.01 | % | | 13.79 | % |
Preferred Shares
Variable Rate MuniFund Term Preferred Shares
The following Funds have issued and have outstanding Variable Rate MuniFund Term Preferred ("VMTP") Shares, with a $100,000 liquidation preference per share. VMTP Shares are issued via private placement and are not publicly available.
As of the end of the reporting period, VMTP Shares outstanding, at liquidation preference, for each Fund was as follows:
| | | | | | | Shares | | | Liquidation | |
| Fund | | | Series | | | Outstanding | | | Preference | |
| Georgia Dividend Advantage 2 (NKG) | | | 2017 | | | 750 | | $ | 75,000,000 | |
| Maryland Premium Income (NMY) | | | 2017 | | | 1,670 | | $ | 167,000,000 | |
| Minnesota Municipal Income (NMS) | | | 2017 | | | 441 | | $ | 44,100,000 | |
| Missouri Premium Income (NOM) | | | 2018 | | | 180 | | $ | 18,000,000 | |
| North Carolina Premium Income (NNC) | | | 2017 | | | 1,250 | | $ | 125,000,000 | |
Each Fund is obligated to redeem its VMTP Shares by the date as specified in its offering document ("Term Redemption Date"), unless earlier redeemed by the Fund. VMTP Shares are subject to optional and mandatory redemption in certain circumstances. The VMTP Shares may be redeemed at the option of each Fund, subject to payment of premium for approximately one year following the date of issuance ("Premium Expiration Date"), and at the redemption price per share thereafter. The redemption price per share is equal to the sum of the liquidation preference per share plus any accumulated but unpaid dividends. Each Fund may be obligated to redeem a certain amount of the VMTP Shares if the Fund fails to maintain certain asset coverage and leverage ratio requirements and such failures are not cured by the applicable cure date. The Term Redemption Date and Premium Expiration Date for each Fund's VMTP Shares are as follows:
| | | | | | | Term | | | Premium | |
| Fund | | | Series | | | Redemption Date | | | Expiration Date | |
| Georgia Dividend Advantage 2 (NKG) | | | 2017 | | | June 1, 2017 | | | May 31, 2015 | |
| Maryland Premium Income (NMY) | | | 2017 | | | June 1, 2017 | | | May 31, 2015 | |
| Minnesota Municipal Income (NMS) | | | 2017 | | | May 1, 2017 | | | April 30, 2015 | |
| Missouri Premium Income (NOM) | | | 2018 | | | March 1, 2018 | | | January 31, 2016 | |
| North Carolina Premium Income (NNC) | | | 2017 | | | March 1, 2017 | | | April 30, 2015 | |
The average liquidation preference of VMTP Shares outstanding and annualized dividend rate for each Fund during the current fiscal period were as follows:
| | | | | | | | | | | | | | | | North | |
| | | | Georgia | | | Maryland | | | Minnesota | | | Missouri | | | Carolina | |
| | | | Dividend | | | Premium | | | Municipal | | | Premium | | | Premium | |
| | | | Advantage 2 | | | Income | | | Income | | | Income | | | Income | |
| | | | (NKG | ) | | (NMY | ) | | (NMS | ) | | (NOM | ) | | (NNC | ) |
| Average liquidation preference of VMTP Shares outstanding | | $ | 75,000,000 | | $ | 167,000,000 | | $ | 44,100,000 | | $ | 18,000,000 | | $ | 125,000,000 | |
| Annualized dividend rate | | | 1.03 | % | | 1.05 | % | | 1.05 | % | | 1.00 | % | | 1.05 | % |
VMTP Shares are subject to restrictions on transfer, generally do not trade, and market quotations are generally not available. VMTP Shares are short-term or short/intermediate-term instruments that pay a variable dividend rate tied to a short-term index, plus an additional fixed "spread" amount established at the time of issuance. The fair value of VMTP Shares is expected to be approximately their liquidation preference so long as the fixed "spread" on the VMTP Shares remains roughly in line with the "spread" being demanded by investors on instruments having similar terms in the current market environment. In present market conditions, the Fund's Adviser has determined that the fair value of VMTP Shares is approximately their liquidation preference, but their fair value could vary if market conditions change materially. For financial reporting purposes, the liquidation preference of VMTP Shares is a liability and is recognized as "Variable Rate MuniFund Term Preferred ("VMTP") Shares, at liquidation preference" on the Statement of Assets and Liabilities.
Dividends on the VMTP Shares (which are treated as interest payments for financial reporting purposes) are set weekly. Unpaid dividends on VMTP Shares are recognized as a component of "Interest payable" on the Statement of Assets and Liabilities. Dividends accrued on VMTP Shares are recognized as a component of "Interest expense and amortization of offering costs" on the Statement of Operations.
Costs incurred in connection with each Fund's offering of VMTP Shares were recorded as a deferred charges, which are amortized over the life of the shares and are recognized as components of "Deferred offering costs" on the Statement of Assets and Liabilities and "Interest expense and amortization of offering costs" on the Statement of Operations.
Variable Rate Demand Preferred Shares
The following Fund has issued and has outstanding Variable Rate Demand Preferred ("VRDP") Shares, with a $100,000 liquidation preference per share. VRDP Shares are issued via private placement and are not publicly available.
As of the end of the reporting period, details of the Fund's VRDP Shares outstanding were as follows:
| | | | | | | Shares | | | Liquidation | | | | |
| Fund | | | Series | | | Outstanding | | | Preference | | | Maturity | |
| Virginia Premium Income (NPV) | | | 1 | | | 1,280 | | $ | 128,000,000 | | | August 3, 2043 | |
VRDP Shares include a liquidity feature that allows VRDP shareholders to have their shares purchased by a liquidity provider with whom the Fund has contracted in the event that the VRDP Shares are not able to be successfully remarketed. The Fund is required to redeem any VRDP Shares that are still owned by the liquidity provider after six months of continuous, unsuccessful remarketing. The Fund pays an annual remarketing fee of 0.10% on the aggregate principal amount of all VRDP Shares outstanding. The Fund's VRDP Shares have successfully remarketed since issuance.
Dividends on the VRDP Shares (which are treated as interest payments for financial reporting purposes) are set at a rate established by a remarketing agent; therefore, the market value of the VRDP Shares is expected to approximate its liquidation preference. In the event that VRDP Shares are unable to be successfully remarketed, the dividend rate will be the maximum rate which is designed to escalate according to a specified schedule in order to enhance the remarketing agent's ability to successfully remarket the VRDP Shares.
Subject to certain conditions, VRDP Shares may be redeemed, in whole or in part, at any time at the option of the Fund. The Fund may also redeem certain of the VRDP Shares if the Fund fails to maintain certain asset coverage requirements and such failures are not cured by the applicable cure date. The redemption price per share is equal to the sum of the liquidation preference per share plus any accumulated but unpaid dividends.
The average liquidation preference of VRDP Shares outstanding and annualized dividend rate for the Fund during the current fiscal period were as follows:
| | | | Virginia | |
| | | | Premium | |
| | | | Income | |
| | | | (NPV | ) |
| Average liquidation preference of VRDP Shares outstanding | | $ | 128,000,000 | |
| Annualized dividend rate | | | 0.19 | % |
For financial reporting purposes, the liquidation preference of VRDP Shares is a liability and is recognized as "Variable Rate Demand Preferred ("VRDP") Shares, at liquidation preference" on the Statement of Assets and Liabilities. Unpaid dividends on VRDP Shares are recognized as a component of "Interest payable" on the Statement of Assets and Liabilities, when applicable. Dividends accrued on VRDP Shares are recognized as a component of "Interest expense and amortization of offering costs" on the Statement of Operations. Costs incurred by the Fund in connection with its offerings of VRDP Shares were recorded as a deferred charge, which are amortized over the life of the shares and are recognized as a component of "Deferred offering costs" on the Statement of Assets and Liabilities and "Interest expense and amortization of offering costs" on the Statement of Operations. In addition to interest expense, the Fund also pays a per annum liquidity fee to the liquidity provider, as well as a remarketing fee, which are recognized as "Liquidity fees" and "Remarketing fees," respectively, on the Statement of Operations.
Notes to Financial Statements (continued)
Preferred Share Transactions
Transactions in preferred shares for the Funds during the Funds' current and prior fiscal period, where applicable, are noted in the following tables.
Transactions in MTP Shares for the Funds, where applicable, were as follows:
| | | | | | Year Ended May 31, 2015 | |
| | | | | | | NYSE MKT | | | | | | | |
| | | | Series | | | Ticker | | | Shares | | | Amount | |
| Missouri Premium Income (NOM) | | | | | | | | | | | | | |
| MTP Shares redeemed | | | 2015 | | | NOM PRC | | | (1,788,000 | ) | $ | (17,880,000 | ) |
Transactions in Remarketed Preferred Shares for the Funds, where applicable, were as follows:
| | | Ten Months Ended | |
| | | June 30, 2014 | |
| Minnesota Municipal Income (NMS) | | | Shares | | | Amount | |
| Remarketed Preferred Shares redeemed: | | | | | | | |
| Series M | | | (622 | ) | $ | (15,550,000 | ) |
| Series W | | | (622 | ) | | (15,550,000 | ) |
| Total | | | (1,244 | ) | $ | (31,100,000 | ) |
Transactions in VMTP Shares for the Funds, where applicable, were as follows:
| | | Year Ended | |
| | | May 31, 2015 | |
| | | | Series | | | Shares | | | Amount | |
| Missouri Premium Income (NOM) | | | | | | | | | | |
| VMTP Shares issued | | | 2018 | | | 180 | | $ | 18,000,000 | |
| | | Eleven Months Ended | |
| | | May 31, 2015 | |
| | | | Series | | | Shares | | | Amount | |
| Minnesota Municipal Income (NMS) | | | | | | | | | | |
| VMTP Shares resulting from the mergers | | | 2017 | | | 130 | | $ | 13,000,000 | |
| | | Ten Months Ended | |
| | | June 30, 2014 | |
| | | | Series | | | Shares | | | Amount | |
| Minnesota Municipal Income (NMS) | | | | | | | | | | |
| VMTP Shares issued | | | 2017 | | | 311 | | $ | 31,100,000 | |
5. Investment Transactions
Long-term purchases and sales (including maturities but excluding derivative transactions, where applicable) during the current fiscal period were as follows:
| | | | | | | | | | | | | | | | North | | | | |
| | | | Georgia | | | Maryland | | | Minnesota | | | Missouri | | | Carolina | | | Virginia | |
| | | | Dividend | | | Premium | | | Municipal | | | Premium | | | Premium | | | Premium | |
| | | Advantage 2 | | | Income | | | Income | | | Income | | | Income | | | Income | |
| | | | (NKG | ) | | (NMY | ) | | (NMS | ) | | (NOM | ) | | (NNC | ) | | (NPV | ) |
| Purchases | | $ | 29,632,177 | | $ | 100,963,971 | | $ | 21,417,595 | | $ | 3,775,645 | | $ | 35,621,709 | | $ | 70,364,561 | |
| Sales and maturities | | | 31,287,857 | | | 106,340,252 | | | 24,576,156 | | | 2,359,093 | | | 27,421,776 | | | 82,444,018 | |
6. Income Tax Information
Each Fund is a separate taxpayer for federal income tax purposes. Each Fund intends to distribute substantially all of its net investment income and net capital gains to shareholders and to otherwise comply with the requirements of Subchapter M of the Internal Revenue Code applicable to regulated investment companies. Therefore, no federal income tax provision is required. Furthermore, each Fund intends to satisfy conditions that will enable interest from municipal securities, which is exempt from regular federal and designated state income taxes, to retain such tax-exempt status when distributed to shareholders of the Funds. Net realized capital gains and ordinary income distributions paid by the Funds are subject to federal taxation.
For all open tax years and all major taxing jurisdictions, management of the Funds has concluded that there are no significant uncertain tax positions that would require recognition in the financial statements. Open tax years are those that are open for examination by taxing authorities (i.e., generally the last four tax year ends and the interim tax period since then). Furthermore, management of the Funds is also not aware of any tax positions for which it is reasonably possible that the total amounts of unrecognized tax benefits will significantly change in the next twelve months.
The following information is presented on an income tax basis. Differences between amounts for financial statement and federal income tax purposes are primarily due to timing differences in recognizing taxable market discount, timing differences in recognizing certain gains and losses on investment transactions and the treatment of investments in inverse floating rate securities reflected as financing transactions, if any. To the extent that differences arise that are permanent in nature, such amounts are reclassified within the capital accounts as detailed below. Temporary differences do not require reclassification. Temporary and permanent differences do not impact the NAVs of the Funds.
As of May 31, 2016, the cost and unrealized appreciation (depreciation) of investments, as determined on a federal income tax basis, were as follows:
| | | | | | | North | | | | | | | | | North | | | | |
| | | | Georgia | | | Maryland | | | Minnesota | | | Missouri | | | Carolina | | | Virginia | |
| | | | Dividend | | | Premium | | | Municipal | | | Premium | | | Premium | | | Premium | |
| | | Advantage 2 | | | Income | | | Income | | | Income | | | Income | | | Income | |
| | | | (NKG | ) | | (NMY | ) | | (NMS | ) | | (NOM | ) | | (NNC | ) | | (NPV | ) |
| Cost of investments | | $ | 204,299,745 | | $ | 473,531,199 | | $ | 120,591,085 | | $ | 46,742,677 | | $ | 348,724,843 | | $ | 344,506,099 | |
| Gross unrealized: | | | | | | | | | | | | | | | | | | | |
| Appreciation | | $ | 16,225,744 | | $ | 33,909,961 | | $ | 10,677,309 | | $ | 4,468,579 | | $ | 31,667,222 | | $ | 31,410,438 | |
| Depreciation | | | (138,066 | ) | | (4,142,499 | ) | | (367,476 | ) | | (179,016 | ) | | (83,663 | ) | | (2,738,442 | ) |
| Net unrealized appreciation (depreciation) of investments | | $ | 16,087,678 | | $ | 29,767,462 | | $ | 10,309,833 | | $ | 4,289,563 | | $ | 31,583,559 | | $ | 28,671,996 | |
Permanent differences, primarily due to federal taxes paid, nondeductible offering costs, treatment of notional principal contracts, expiration of capital loss carryforwards, and nondeductible reorganization expenses resulted in reclassifications among the Funds' components of common share net assets as of May 31, 2016, the Funds' tax year end, as follows:
| | | | | | | | | | | | | | | | North | | | | |
| | | | Georgia | | | Maryland | | | Minnesota | | | Missouri | | | Carolina | | | Virginia | |
| | | | Dividend | | | Premium | | | Municipal | | | Premium | | | Premium | | | Premium | |
| | | Advantage 2 | | | Income | | | Income | | | Income | | | Income | | | Income | |
| | | | (NKG | ) | | (NMY | ) | | (NMS | ) | | (NOM | ) | | (NNC | ) | | (NPV | ) |
| Paid-in-surplus | | $ | (506,008 | ) | $ | (936,155 | ) | $ | (47,898 | ) | $ | (42,527 | ) | $ | (58,875 | ) | $ | (55,303 | ) |
| Undistributed (Over-distribution of) net investment income | | | 25,468 | | | 18,470 | | | 77,570 | | | 39,611 | | | 67,790 | | | 42,435 | |
| Accumulated net realized gain (loss) | | | 480,540 | | | 917,685 | | | (29,672 | ) | | 2,916 | | | (8,915 | ) | | 12,868 | |
The tax components of undistributed net tax-exempt income, net ordinary income and net long-term capital gains as of May 31, 2016, the Funds' tax year end, were as follows:
| | | | | | | | | | | | | | | | North | | | | |
| | | | Georgia | | | Maryland | | | Minnesota | | | Missouri | | | Carolina | | | Virginia | |
| | | | Dividend | | | Premium | | | Municipal | | | Premium | | | Premium | | | Premium | |
| | | Advantage 2 | | | Income | | | Income | | | Income | | | Income | | | Income | |
| | | | (NKG | ) | | (NMY | ) | | (NMS | ) | | (NOM | ) | | (NNC | ) | | (NPV | ) |
Undistributed net tax-exempt income1 | | $ | 893,077 | | $ | 2,192,312 | | $ | 645,646 | | $ | 226,350 | | $ | 698,271 | | $ | 897,141 | |
Undistributed net ordinary income2 | | | 25,128 | | | 50,455 | | | 12,090 | | | — | | | 7,635 | | | — | |
| Undistributed net long-term capital gains | | | — | | | — | | | — | | | — | | | 11,198 | | | — | |
1 | Undistributed net tax-exempt income (on a tax basis) has not been reduced for the dividend declared on May 2, 2016, paid on June 1, 2016. |
2 | Net ordinary income consists of taxable market discount income and net short-term capital gains, if any. |
Notes to Financial Statements (continued)
The tax character of distributions paid during the periods indicated below, was designated for purposes of the dividends paid deduction as follows:
| | | | | | | | | | | | | | | | North | | | | |
| | | | Georgia | | | Maryland | | | Minnesota | | | Missouri | | | Carolina | | | Virginia | |
| | | | Dividend | | | Premium | | | Municipal | | | Premium | | | Premium | | | Premium | |
| | | Advantage 2 | | | Income | | | Income | | | Income | | | Income | | | Income | |
| Year ended May 31, 2016 | | | (NKG | ) | | (NMY | ) | | (NMS | ) | | (NOM | ) | | (NNC | ) | | (NPV | ) |
Distributions from net tax-exempt income3 | | $ | 7,523,653 | | $ | 17,322,178 | | $ | 4,951,887 | | $ | 1,884,450 | | $ | 10,934,839 | | $ | 12,572,974 | |
Distributions from net ordinary income2 | | | 24,262 | | | 46,769 | | | — | | | 129 | | | 162,543 | | | 120,447 | |
Distributions from net long-term capital gains4 | | | — | | | — | | | — | | | — | | | 60,749 | | | — | |
| | | | | | | | | | | | | | | | North | | | | |
| | | | Georgia | | | Maryland | | | Minnesota | | | Missouri | | | Carolina | | | Virginia | |
| | | | Dividend | | | Premium | | | Municipal | | | Premium | | | Premium | | | Premium | |
| | | Advantage 2 | | | Income | | | Income | | | Income | | | Income | | | Income | |
| Year ended May 31, 2015 | | | (NKG | ) | | (NMY | ) | | (NMS | ) | | (NOM | ) | | (NNC | ) | | (NPV | ) |
| Distributions from net tax-exempt income | | $ | 7,462,118 | | $ | 17,450,455 | | $ | 3,963,984 | | $ | 2,038,437 | | $ | 11,317,326 | | $ | 13,595,233 | |
Distributions from net ordinary income2 | | | 6,329 | | | 59,243 | | | 9,225 | | | 77 | | | — | | | 3,587 | |
| Distributions from net long-term capital gains | | | — | | | — | | | — | | | — | | | 466,996 | | | — | |
| | | | | |
| | | | Minnesota | |
| | | | Municipal | |
| | | | Income | |
| Ten months ended June 30, 2014 | | | (NMS | ) |
| Distributions from net tax-exempt income | | $ | 3,146,563 | |
Distributions from net ordinary income2 | | | 24,601 | |
| Distributions from net long-term capital gains | | | — | |
2 | Net ordinary income consists of taxable market discount income and net short-term capital gains, if any. |
3 | The Funds hereby designate these amounts paid during the fiscal year ended May 31, 2016, as Exempt Interest Dividends. |
4 | The Funds designate as long-term capital gain dividend, pursuant to the Internal Revenue Code Section 852(b)(3), the amount necessary to reduce earnings and profits of the Funds related to net capital gain to zero for the tax year ended May 31, 2016. |
As of May 31, 2016, the Funds' tax year end, the following Funds had unused capital loss carryforwards available for federal income tax purposes to be applied against future capital gains, if any. If not applied, the carryforwards will expire as shown in the following table. The losses not subject to expiration will be utilized first by a Fund.
| | | | Georgia | | | Maryland | | | Minnesota | | | Missouri | | | Virginia | |
| | | | Dividend | | | Premium | | | Municipal | | | Premium | | | Premium | |
| | | | Advantage 2 | | | Income | | | Income | | | Income | | | Income | |
| | | | (NKG | ) | | (NMY | )5 | | (NMS | ) | | (NOM | ) | | (NPV | ) |
| Expiration: | | | | | | | | | | | | | | | | |
| May 31, 2017 | | $ | 1,635,823 | | $ | 172,377 | | $ | 452,405 | | $ | 77,824 | | $ | — | |
| May 31, 2018 | | | 1,329,548 | | | — | | | — | | | 91,539 | | | — | |
| May 31, 2019 | | | 48,370 | | | — | | | — | | | — | | | — | |
| Not subject to expiration | | | 3,491,834 | | | 6,491,362 | | | 532,693 | | | 1,212,052 | | | 10,835,710 | |
| Total | | $ | 6,505,575 | | $ | 6,663,739 | | $ | 985,098 | | $ | 1,381,415 | | $ | 10,835,710 | |
5 | A portion of Maryland Premium Income's (NMY) capital loss carryforward is subject to limitation under the Internal Revenue Code and related regulations. |
During the Funds' tax year ended May 31, 2016, the following Funds utilized capital loss carryforwards as follows:
| | | | Maryland | | | Minnesota | | | Missouri | | | Virginia | |
| | | | Premium | | | Municipal | | | Premium | | | Premium | |
| | | | Income | | | Income | | | Income | | | Income | |
| | | | (NMY | ) | | (NMS | ) | | (NOM | ) | | (NPV | ) |
| Utilized capital loss carryforwards | | $ | 239,690 | | $ | 211,943 | | $ | 53,325 | | $ | 1,956,850 | |
As of May 31, 2016, the Funds' tax year end, the following Funds' capital loss carryforwards expired as follows:
| | | | Georgia | | | Maryland | |
| | | | Dividend | | | Premium | |
| | | | Advantage 2 | | | Income | |
| | | | (NKG | ) | | (NMY | ) |
| Expired capital loss carryforwards | | $ | 462,549 | | $ | 851,610 | |
7. Management Fees and Other Transactions with Affiliates
Management Fees
Each Fund's management fee compensates the Adviser for overall investment advisory and administrative services and general office facilities. The Sub-Adviser is compensated for its services to the Funds from the management fees paid to the Adviser.
Each Fund's management fee consists of two components – a fund-level fee, based only on the amount of assets within each individual Fund, and a complex-level fee, based on the aggregate amount of all eligible fund assets managed by the Adviser. This pricing structure enables Fund shareholders to benefit from growth in the assets within their respective Fund as well as from growth in the amount of complex-wide assets managed by the Adviser.
The annual Fund-level fee, payable monthly, for each Fund is calculated according to the following schedules:
| | | | Georgia Dividend Advantage 2 (NKG | ) |
| Average Daily Managed Assets* | | | Fund-Level Fee | |
| For the first $125 million | | | 0.4500 | % |
| For the next $125 million | | | 0.4375 | |
| For the next $250 million | | | 0.4250 | |
| For the next $500 million | | | 0.4125 | |
| For the next $1 billion | | | 0.4000 | |
| For managed assets over $2 billion | | | 0.3750 | |
| | | | Minnesota Municipal Income (NMS | ) |
| Average Daily Managed Assets* | | | Fund-Level Fee | |
| For the first $125 million | | | 0.4500 | % |
| For the next $125 million | | | 0.4375 | |
| For the next $250 million | | | 0.4250 | |
| For the next $500 million | | | 0.4125 | |
| For managed assets over $1 billion | | | 0.4000 | |
| | | | | |
| | | | Maryland Premium Income (NMY | ) |
| | | | Missouri Premium Income (NOM | ) |
| | | | North Carolina Premium Income (NNC | ) |
| | | | Virginia Premium Income (NPV | ) |
| Average Daily Managed Assets* | | | Fund-Level Fee | |
| For the first $125 million | | | 0.4500 | % |
| For the next $125 million | | | 0.4375 | |
| For the next $250 million | | | 0.4250 | |
| For the next $500 million | | | 0.4125 | |
| For the next $1 billion | | | 0.4000 | |
| For the next $3 billion | | | 0.3875 | |
| For managed assets over $5 billion | | | 0.3750 | |
Notes to Financial Statements (continued)
The annual complex-level fee, payable monthly, for each Fund is calculated by multiplying the current complex-wide fee rated, determined according to the following schedule by the Fund's daily managed assets:
| Complex-Level Managed Asset Breakpoint Level* | | | Effective Rate at Breakpoint Level | |
| $55 billion | | | 0.2000 | % |
| $56 billion | | | 0.1996 | |
| $57 billion | | | 0.1989 | |
| $60 billion | | | 0.1961 | |
| $63 billion | | | 0.1931 | |
| $66 billion | | | 0.1900 | |
| $71 billion | | | 0.1851 | |
| $76 billion | | | 0.1806 | |
| $80 billion | | | 0.1773 | |
| $91 billion | | | 0.1691 | |
| $125 billion | | | 0.1599 | |
| $200 billion | | | 0.1505 | |
| $250 billion | | | 0.1469 | |
| $300 billion | | | 0.1445 | |
| * | For the complex-level fees, managed assets include closed-end fund assets managed by the Adviser that are attributable to certain types of leverage. For these purposes, leverage includes the funds' use of preferred stock and borrowings and certain investments in the residual interest certificates (also called inverse floating rate securities) in tender option bond (TOB) trusts, including the portion of assets held by a TOB trust that has been effectively financed by the trust's issuance of floating rate securities, subject to an agreement by the Adviser as to certain funds to limit the amount of such assets for determining managed assets in certain circumstances. The complex-level fee is calculated based upon the aggregate daily managed assets of all Nuveen Funds that constitute "eligible assets." Eligible assets do not include assets attributable to investments in other Nuveen Funds or assets in excess of a determined amount (originally $2 billion) added to the Nuveen fund complex in connection with the Adviser's assumption of the management of the former First American Funds effective January 1, 2011. As of May 31, 2016, the complex-level fee for each Fund was 0.1621%. |
Other Transactions with Affiliates
The Funds pay no compensation directly to those of its trustees who are affiliated with the Adviser or to its officers, all of whom receive remuneration for their services to the Funds from the Adviser or its affiliates. The Board has adopted a deferred compensation plan for independent trustees that enables trustees to elect to defer receipt of all or a portion of the annual compensation they are entitled to receive from certain Nuveen-advised funds. Under the plan, deferred amounts are treated as though equal dollar amounts had been invested in shares of select Nuveen-advised funds.
Each Fund is permitted to purchase or sell securities from or to certain other funds managed by the Adviser ("inter-fund trade") under specified conditions outlined in procedures adopted by the Board. These procedures have been designed to ensure that any inter-fund trade of securities by the Fund from or to another fund that is, or could be, considered an affiliate of the Fund under certain limited circumstances by virtue of having a common investment adviser (or affiliated investment adviser), common officer and/or common trustee complies with Rule 17a-7 of the 1940 Act. Further, as defined under these procedures, each inter-fund trade is effected at the current market price as provided by an independent pricing service. Unsettled inter-fund trades as of the end of the reporting period are recognized as a component of "Receivable for investments sold" and/or "Payable for investments purchased" on the Statement of Assets and Liabilities, when applicable.
During the current fiscal period, the following Fund engaged in inter-fund trades pursuant to these procedures as follows:
| | | | Minnesota | |
| | | | Municipal | |
| | | | Income | |
| Inter-Fund Trades | | | (NMS | ) |
| Purchases | | $ | 255,650 | |
| Sales | | | — | |
8. Borrowing Arrangements
Uncommitted Line of Credit
During the current fiscal period, the Funds participated in an unsecured bank line of credit ("Unsecured Credit Line") under which outstanding balances would bear interest at a variable rate. On December 31, 2015, (the only date utilized during the current fiscal period), the following Funds borrowed the following amounts from the Unsecured Credit Line, each at an annualized interest rate of 1.68% on their respective outstanding balance.
| | | | Georgia | | | Maryland | | | Minnesota | | | Virginia | |
| | | | Dividend | | | Premium | | | Municipal | | | Premium | |
| | | | Advantage 2 | | | Income | | | Income | | | Income | |
| | | | (NKG | ) | | (NMY | ) | | (NMS | ) | | (NPV | ) |
| Outstanding balance at December 31, 2015 | | $ | 2,742,627 | | $ | 350,028 | | $ | 396,683 | | $ | 59,467 | |
Committed Line of Credit
The Funds, along with certain other funds managed by the Adviser ("Participating Funds"), have established a 364-day, approximately $2.5 billion standby credit facility with a group of lenders, under which the Participating Funds may borrow for various purposes other than leveraging for investment purposes. A large portion of this facility's capacity (and its associated costs as described below) is currently dedicated for use by a small number of Participating Funds, which does not include any of the Funds covered by this shareholder report. The remaining capacity under the facility (and the corresponding portion of the facility's annual costs) is separately dedicated to most of the other open-end funds in the Nuveen fund family, along with a number of Nuveen closed-end funds, including all of the Funds covered by this shareholder report. The credit facility expires in July 2017 unless extended or renewed.
The credit facility has the following terms: a fee of 0.15% per annum on unused commitment amounts, and interest at a rate equal to the higher of (a) one-month LIBOR (London Inter-Bank Offered Rate) plus 1.25% per annum or (b) the Fed Funds rate plus 1.25% per annum on amounts borrowed. Participating Funds paid administration, legal and arrangement fees, which are recognized as a component of "Other expenses" on the Statement of Operations, and along with commitment fees, have been allocated among such Participating Funds based upon the relative proportions of the facility's aggregate capacity reserved for them and other factors deemed relevant by the Adviser and the Board of each Participating Fund.
During the current fiscal period, none of the Funds utilized this facility.
9. Subsequent Events
Common Shares Equity Shelf Programs
During June 2016, Minnesota Municipal Income (NMS) filed a registration statement with the Securities Exchange Commission to issue additional common shares through a Shelf Offering, which is not yet effective.
Variable Rate MuniFund Term Preferred Shares
During July 2016, Maryland Premium Income (NMY), Minnesota Municipal Income (NMS) and North Carolina Premium Income (NNC) refinanced all of their outstanding Series 2017, VMTP Shares with the issuance of new Series 2019, VMTP Shares. In conjunction with the refinancing the Funds also issued an additional $30,000,000, $8,700,000 and $29,000,000, respectively, Series 2019, VMTP Shares at liquidation preference, which will be invested in accordance with the Funds' investment policies.
Management Fees
Effective August 1, 2016, the annual fund-level fee for each Fund, payable monthly, will be calculated according to the following schedule:
| | Georgia Dividend Advantage 2 (NKG) | |
| | Maryland Premium Income (NMY) | |
| | Minnesota Municipal Income (NMS) | |
| | Missouri Premium Income (NOM) | |
| | North Carolina Premium Income (NNC) | |
| | Virginia Premium Income (NPV) | |
| Average Daily Managed Assets | Fund-Level Fee | |
| For the first $125 million | 0.4500 | % |
| For the next $125 million | 0.4375 | |
| For the next $250 million | 0.4250 | |
| For the next $500 million | 0.4125 | |
| For the next $1 billion | 0.4000 | |
| For the next $3 billion | 0.3750 | |
| For managed assets over $5 billion | 0.3625 | |
Additional Fund Information (Unaudited) | |
| Board of Trustees | | | | | | | | | | |
| William Adams IV* | | Margo Cook** | | Jack B. Evans | | William C. Hunter | | David J. Kundert | | Albin F. Moschner*** |
| John K. Nelson | | William J. Schneider | | Judith M. Stockdale | | Carole E. Stone | | Terence J. Toth | | Margaret L. Wolff |
| * | Interested Board Member. |
| ** | Interested Board Member effective July 1, 2016. |
| *** | Effective July 1, 2016. |
| | |
Fund Manager
Nuveen Fund Advisors, LLC
333 West Wacker Drive
Chicago, IL 60606 | | Custodian
State Street Bank & Trust Company
One Lincoln Stree Boston, MA 02111 | | Legal Counsel
Chapman and Cutler LLP
Chicago, IL 60603 | | Independent Registered
Public Accounting Firm KPMG LLP200 East Randolph Street Chicago, IL 60601 | | Transfer Agent and
Shareholder Services
State Street Bank & Trust Company Nuveen Funds P.O. Box 43071 Providence, RI 02940-3071 (800) 257-8787 |
Quarterly Form N-Q Portfolio of Investments Information
Each Fund is required to file its complete schedule of portfolio holdings with the Securities and Exchange Commission (SEC) for the first and third quarters of each fiscal year on Form N-Q. You may obtain this information directly from the SEC. Visit the SEC on-line at http://www.sec.gov or in person at the SEC's Public Reference Room in Washington, D.C. Call the SEC toll-free at (800) SEC-0330 for room hours and operation.
Nuveen Funds' Proxy Voting Information
You may obtain (i) information regarding how each fund voted proxies relating to portfolio securities held during the most recent twelve-month period ended June 30, without charge, upon request, by calling Nuveen toll-free at (800) 257-8787 or on Nuveen's website at www.nuveen.com and (ii) a description of the policies and procedures that each fund used to determine how to vote proxies relating to portfolio securities without charge, upon request, by calling Nuveen toll free at (800) 257-8787. You may also obtain this information directly from the SEC. Visit the SEC on-line at http://www.sec.gov.
CEO Certification Disclosure
Each Fund's Chief Executive Officer (CEO) has submitted to the New York Stock Exchange (NYSE) the annual CEO certification as required by Section 303A.12(a) of the NYSE Listed Company Manual. Each Fund has filed with the SEC the certification of its CEO and Chief Financial Officer required by Section 302 of the Sarbanes-Oxley Act.
Common Share Repurchases
Each Fund intends to repurchase, through its open-market share repurchase program, shares of its own common stock at such times and in such amounts as is deemed advisable. During the period covered by this report, each Fund repurchased shares of its common stock, as shown in the accompanying table. Any future repurchases will be reported to shareholders in the next annual or semi-annual report.
| | | | | | | | | | | | | | | | | | | | |
| | | | NKG | | | NMY | | | NMS | | | NOM | | | NNC | | | NPV | |
| Common shares repurchased | | | — | | | 225,902 | | | — | | | — | | | 22,501 | | | — | |
FINRA BrokerCheck
The Financial Industry Regulatory Authority (FINRA) provides information regarding the disciplinary history of FINRA member firms and associated investment professionals. This information as well as an investor brochure describing FINRA BrokerCheck is available to the public by calling the FINRA BrokerCheck Hotline number at (800) 289-9999 or by visiting www.FINRA.org.
Glossary of Terms Used in this Report (Unaudited) |
| ■ | Auction Rate Bond: An auction rate bond is a security whose interest payments are adjusted periodically through an auction process, which process typically also serves as a means for buying and selling the bond. Auctions that fail to attract enough buyers for all the shares offered for sale are deemed to have "failed," with current holders receiving a formula-based interest rate until the next scheduled auction. |
| | |
| ■ | Average Annual Total Return: This is a commonly used method to express an investment's performance over a particular, usually multi-year time period. It expresses the return that would have been necessary each year to equal the investment's actual cumulative performance (including change in NAV or market price and reinvested dividends and capital gains distributions, if any) over the time period being considered. |
| | |
| ■ | Duration: Duration is a measure of the expected period over which a bond's principal and interest will be paid, and consequently is a measure of the sensitivity of a bond's or bond fund's value to changes when market interest rates change. Generally, the longer a bond's or fund's duration, the more the price of the bond or fund will change as interest rates change. |
| | |
| ■ | Effective Leverage: Effective leverage is a fund's effective economic leverage, and includes both regulatory leverage (see leverage) and the leverage effects of certain derivative investments in the fund's portfolio. Currently, the leverage effects of Tender Option Bond (TOB) inverse floater holdings are included in effective leverage values, in addition to any regulatory leverage. |
| | |
| ■ | Escrowed to Maturity Bond: When proceeds of a refunding issue are deposited in an escrow account for investment in an amount sufficient to pay the principal and interest on the issue being refunded. In some cases, though, an issuer may expressly reserve its right to exercise an early call of bonds that have been escrowed to maturity. |
| | |
| ■ | Gross Domestic Product (GDP): The total market value of all final goods and services produced in a country/region in a given year, equal to total consumer, investment and government spending, plus the value of exports, minus the value of imports. |
| | |
| ■ | Inverse Floating Rate Securities: Inverse floating rate securities, also known as inverse floaters or tender option bonds (TOBs), are created by depositing a municipal bond, typically with a fixed interest rate, into a special purpose trust. This trust, in turn, (a) issues floating rate certificates typically paying short-term tax-exempt interest rates to third parties in amounts equal to some fraction of the deposited bond's par amount or market value, and (b) issues an inverse floating rate certificate (sometimes referred to as an "inverse floater") to an investor (such as a Fund) interested in gaining investment exposure to a long-term municipal bond. The income received by the holder of the inverse floater varies inversely with the short term rate paid to the floating rate certificates' holders, and in most circumstances the holder of the inverse floater bears substantially all of the underlying bond's downside investment risk. The holder of the inverse floater typically also benefits disproportionately from any potential appreciation of the underlying bond's value. Hence, an inverse floater essentially represents an investment in the underlying bond on a leveraged basis. |
| | |
| ■ | Leverage: Leverage is created whenever a fund has investment exposure (both reward and/or risk) equivalent to more than 100% of the investment capital. |
| | |
| ■ | Lipper Other States Municipal Debt Funds Classification Average: Calculated using the returns of all closed-end funds in this category. Lipper returns account for the effects of management fees and assume reinvestment of distributions, but do not reflect any applicable sales charges. |
| | |
| ■ | Net Asset Value (NAV) Per Share: A fund's Net Assets is equal to its total assets (securities, cash, accrued earnings and receivables) less its total liabilities. NAV per share is equal to the fund's Net Assets divided by its number of shares outstanding. |
Glossary of Terms Used in this Report (Unaudited) (continued)
| ■ | Pre-Refunding: Pre-Refunding, also known as advanced refundings or refinancings, is a procedure used by state and local governments to refinance municipal bonds to lower interest expenses. The issuer sells new bonds with a lower yield and uses the proceeds to buy U.S. Treasury securities, the interest from which is used to make payments on the higher-yielding bonds. Because of this collateral, pre-refunding generally raises a bond's credit rating and thus its value. |
| | |
| ■ | Regulatory Leverage: Regulatory Leverage consists of preferred shares issued by or borrowings of a fund. Both of these are part of a fund's capital structure. Regulatory leverage is subject to asset coverage limits set in the Investment Company Act of 1940. |
| | |
| ■ | S&P Municipal Bond Georgia Index: An unleveraged, market value-weighted index designed to measure the performance of the tax-exempt, investment-grade Georgia municipal bond market. Index returns assume reinvestment of distributions, but do not reflect any applicable sales charges or management fees. |
| | |
| ■ | S&P Municipal Bond Index: An unleveraged, market value-weighted index designed to measure the performance of the tax-exempt, investment-grade U.S. municipal bond market. Index returns assume reinvestment of distributions, but do not reflect any applicable sales charges or management fees. |
| | |
| ■ | S&P Municipal Bond Maryland Index: An unleveraged, market value-weighted index designed to measure the performance of the tax-exempt, investment-grade Maryland municipal bond market. Index returns assume reinvestment of distributions, but do not reflect any applicable sales charges or management fees. |
| | |
| ■ | S&P Municipal Bond Minnesota Index: An unleveraged, market value-weighted index designed to measure the performance of the tax-exempt, investment-grade Minnesota municipal bond market. Index returns assume reinvestment of distributions, but do not reflect any applicable sales charges or management fees. |
| | |
| ■ | S&P Municipal Bond Missouri Index: An unleveraged, market value-weighted index designed to measure the performance of the tax-exempt, investment-grade Missouri municipal bond market. Index returns assume reinvestment of distributions, but do not reflect any applicable sales charges or management fees. |
| | |
| ■ | S&P Municipal Bond North Carolina Index: An unleveraged, market value-weighted index designed to measure the performance of the tax-exempt, investment-grade North Carolina municipal bond market. Index returns assume reinvestment of distributions, but do not reflect any applicable sales charges or management fees. |
| | |
| ■ | S&P Municipal Bond Virginia Index: An unleveraged, market value-weighted index designed to measure the performance of the tax-exempt, investment-grade Virginia municipal bond market. Index returns assume reinvestment of distributions, but do not reflect any applicable sales charges or management fees. |
| | |
| ■ | Total Investment Exposure: Total investment exposure is a fund's assets managed by the Adviser that are attributable to financial leverage. For these purposes, financial leverage includes a fund's use of preferred stock and borrowings and investments in the residual interest certificates (also called inverse floating rate securities) in tender option bond (TOB) trusts, including the portion of assets held by a TOB trust that has been effectively financed by the trust's issuance of floating rate securities. |
| | |
| ■ | Zero Coupon Bond: A zero coupon bond does not pay a regular interest coupon to its holders during the life of the bond. Income to the holder of the bond comes from accretion of the difference between the original purchase price of the bond at issuance and the par value of the bond at maturity and is effectively paid at maturity. The market prices of zero coupon bonds generally are more volatile than the market prices of bonds that pay interest periodically. |
| Reinvest Automatically, Easily and Conveniently |
Nuveen makes reinvesting easy. A phone call is all it takes to set up your reinvestment account.
Nuveen Closed-End Funds Automatic Reinvestment Plan
Nuveen Closed-End Fund allows you to conveniently reinvest distributions in additional Fund shares. By choosing to reinvest, you'll be able to invest money regularly and automatically, and watch your investment grow through the power of compounding. Just like distributions in cash, there may be times when income or capital gains taxes may be payable on distributions that are reinvested. It is important to note that an automatic reinvestment plan does not ensure a profit, nor does it protect you against loss in a declining market.
Easy and convenient
To make recordkeeping easy and convenient, each month you'll receive a statement showing your total distributions, the date of investment, the shares acquired and the price per share, and the total number of shares you own.
How shares are purchased
The shares you acquire by reinvesting will either be purchased on the open market or newly issued by the Fund. If the shares are trading at or above net asset value at the time of valuation, the Fund will issue new shares at the greater of the net asset value or 95% of the then-current market price. If the shares are trading at less than net as -set value, shares for your account will be purchased on the open market. If the Plan Agent begins purchasing Fund shares on the open market while shares are trading below net asset value, but the Fund's shares subsequently trade at or above their net asset value before the Plan Agent is able to complete its purchases, the Plan Agent may cease open-market purchases and may invest the uninvested portion of the distribution in newly-issued Fund shares at a price equal to the greater of the shares' net asset value or 95% of the shares' market value on the last business day immediately prior to the purchase date. Distributions received to purchase shares in the open market will normally be invested shortly after the distribution payment date. No interest will be paid on distributions awaiting reinvestment. Because the market price of the shares may increase before purchases are completed, the average purchase price per share may exceed the market price at the time of valuation, resulting in the acquisition of fewer shares than if the distribution had been paid in shares issued by the Fund. A pro rata portion of any applicable brokerage commissions on open market purchases will be paid by Plan participants. These commissions usually will be lower than those charged on individual transactions.
Flexible
You may change your distribution option or withdraw from the Plan at any time, should your needs or situation change. You can reinvest whether your shares are registered in your name, or in the name of a brokerage firm, bank, or other nominee. Ask your investment advisor if his or her firm will participate on your behalf. Participants whose shares are registered in the name of one firm may not be able to transfer the shares to another firm and continue to participate in the Plan. The Fund reserves the right to amend or terminate the Plan at any time. Although the Fund reserves the right to amend the Plan to include a service charge payable by the participants, there is no direct service charge to participants in the Plan at this time.
Call today to start reinvesting distributions
For more information on the Nuveen Automatic Reinvestment Plan or to enroll in or withdraw from the Plan, speak with your financial advisor or call us at (800) 257-8787.
Annual Investment Management Agreement Approval Process (Unaudited) | |
The Board of Trustees of each Fund (the "Board," and each Trustee a "Board Member"), including the Board Members who are not parties to the Funds' advisory or sub-advisory agreements or "interested persons" of any such parties (the "Independent Board Members"), is responsible for overseeing the performance of the investment adviser and sub-adviser to the respective Fund and determining whether to continue such Fund's advisory agreement (the "Investment Management Agreement") between the Fund and Nuveen Fund Advisors, LLC (the "Adviser") and the sub-advisory agreement (the "Sub-Advisory Agreement" and, together with the Investment Management Agreement, the "Advisory Agreements") between the Adviser and Nuveen Asset Management, LLC (the "Sub-Adviser"). Following an initial term with respect to each Fund upon its commencement of operations, the Board reviews each Investment Management Agreement and Sub-Advisory Agreement on behalf of each Fund and votes to determine whether the respective Advisory Agreement should be renewed. Accordingly, at an in-person meeting held on May 24-26, 2016 (the "May Meeting"), the Board, including a majority of the Independent Board Members, considered and approved the existing Advisory Agreements for the Funds.
During the year, the Board and its Committees met regularly to receive materials and discuss a variety of topics impacting the Funds including, among other things, overall market conditions and market performance, Fund investment performance, brokerage execution, valuation of securities, compliance matters, securities lending, leverage matters, risk management and ongoing initiatives. The Board had established several standing Committees, including the Open-end Fund Committee and Closed-end Fund Committee which permit the Board Members to delve further into the topics particularly relevant to the respective product line and enhance the Board's effectiveness and oversight of the Funds. The Board also seeks to meet with the Sub-Adviser and its investment team at least once over a multiple year rotation through site visits. The information and knowledge the Board gained throughout the year from the Board and Committee meetings, site visits and the related materials were relevant to the Board's evaluation of the Advisory Agreements, and the Board took such information into account in its review of the Advisory Agreements.
In addition to the materials received throughout the year, the Board received additional materials prepared specifically for its annual review of the Advisory Agreements in response to a request by independent legal counsel on behalf of the Independent Board Members. The materials addressed a variety of topics, including a description of the services provided by the Adviser and the Sub-Adviser (each, a "Fund Adviser"); a review of fund performance with a detailed focus on any performance outliers; an analysis of the investment teams; an analysis of the fees and expense ratios of the Funds, including information comparing such fees and expenses to that of peer groups; an assessment of shareholder services for the Funds and of the performance of certain service providers; a review of initiatives instituted or continued during the past year; and a review of premium/discount trends and leverage management as well as information regarding the profitability of the Fund Advisers, the compensation of portfolio managers, and compliance and risk matters.
As part of its annual review, the Board held a separate meeting on April 12-13, 2016 to review the Funds' investment performance and consider an analysis by the Adviser of the Sub-Adviser examining, among other things, the team's assets under management, investment performance, investment approach, and the stability and structure of the Sub-Adviser's organization and investment team. During the review, the Independent Board Members requested and received additional information from management. Throughout the year and throughout their review of the Advisory Agreements, the Independent Board Members were assisted by independent legal counsel. The Independent Board Members met separately with independent legal counsel without management present and received a memorandum from such counsel outlining their fiduciary duties and legal standards in reviewing the Advisory Agreements. The Independent Board Members' review of the Advisory Agreements reflected an ongoing process that incorporated the information and considerations that occurred over the years, including the most recent year, as well as the information specifically furnished for the renewal process. In deciding to renew the Advisory Agreements, the Independent Board Members
did not identify a particular factor as controlling, but rather the decision reflected the comprehensive consideration of all the information presented. The following summarizes the principal factors, but not all the factors, the Board considered in its review of the Advisory Agreements and its conclusions.
A. Nature, Extent and Quality of Services
In evaluating the renewal of the Advisory Agreements, the Independent Board Members received and considered information regarding the nature, extent and quality of the applicable Fund Adviser's services provided to the respective Fund and the initiatives undertaken during the past year by the Adviser. The Board recognized the comprehensive set of services the Adviser provided to manage and operate the Nuveen funds, including (a) product management (such as setting dividends, positioning the product in the marketplace, maintaining and enhancing shareholder communications and reporting to the Board); (b) investment services (such as overseeing the Sub-Adviser and other service providers; analyzing investment performance and risks; overseeing risk management and disclosure; developing and interpreting investment policies; assisting in the development of products; helping to prepare financial statements and marketing disclosures; and overseeing trade execution); (c) fund administration (such as helping to prepare fund tax returns and complete other tax compliance matters; and helping to prepare regulatory filings and shareholder reports); (d) fund Board administration (such as preparing Board materials and organizing and providing assistance for Board meetings); (e) compliance (such as helping to devise and maintain the funds' compliance program and related testing); (f) legal support (such as helping to prepare registration statements and proxy statements, interpreting regulations and policies and overseeing fund activities); and (g) providing leverage management.
The Board reviewed the continued investment the Adviser had made in its business to continue to strengthen the breadth and quality of its services to the benefit of the Nuveen funds. The Board noted the Adviser's additional staffing in key areas that support the funds and the Board, including in investment services, operations, closed-end fund/structured products, fund governance, compliance, fund administration, product management, and information technology. Among the enhancements to its services, the Board recognized the Adviser's (a) expanded activities and support required as a result of regulatory developments, including in areas of compliance and reporting; (b) expanded efforts to support leverage management with a goal of seeking the most effective structure for fund shareholders given appropriate risk levels and regulatory constraints; (c) increased support for dividend management; (d) continued investment in its technical capabilities as the Adviser continued to build out a centralized fund data platform, enhance mobility and remote access capabilities, rationalize and upgrade software platforms, and automate certain regulatory liquidity determinations; (e) continued efforts to rationalize the product line through mergers, liquidations and re-positioning of Nuveen funds with the goal of increasing efficiencies, reducing costs, improving performance and addressing shareholder needs; (f) continued efforts to develop new lines of business designed to enhance the Nuveen product line and meet investor demands; and (g) continued commitment to enhance risk oversight, including the formation of the operational risk group to provide operational risk assessment, the access to platforms which provide better risk reporting to support investment teams, and the development of a new team to initially review new products and major product initiatives. The Board also recognized the Adviser's efforts to renegotiate certain fees of other service providers which culminated in reduced expenses for all funds for custody and accounting services without diminishing the breadth and quality of the services provided. The Board considered the Chief Compliance Officer's report regarding the Adviser's compliance programs, the Adviser's continued development, execution and management of its compliance program, and the additions to the compliance team to support the continued growth of the Nuveen fund family and address regulatory developments.
The Board also considered information highlighting the various initiatives that the Adviser had implemented or continued during the year to enhance or support the closed-end fund product line. The Board noted the Adviser's continued efforts during 2015 (a) to rationalize the product line through mergers designed to help reduce product overlap, offer shareholders the potential for lower fees and enhanced investor acceptance, and address persistent discounts in the secondary market; (b) to oversee and manage leverage as the Adviser facilitated the rollover of existing facilities and conducted negotiations for
Annual Investment Management Agreement Approval Process (Unaudited) (continued)
improved terms and pricing to reduce leverage costs; (c) to conduct capital management services including share repurchases and/or share issuances throughout the year and monitoring market conditions to capitalize on such opportunities for the closed-end funds; and (d) to implement data-driven market analytics which, among other things, provided a better analysis of the shareholder base, enhanced the ability to monitor the closed-end funds versus peers and helped to understand trading discounts. The Board also considered the quality and breadth of Nuveen's investment relations program through which Nuveen seeks to build awareness of, and educate investors and financial advisers with respect to, Nuveen closed-end funds which may help to build an active secondary market for the closed-end fund product line.
As noted, the Adviser also oversees the Sub Adviser who primarily provides the portfolio advisory services to the Funds. The Board recognized the skill and competency of the Adviser in monitoring and analyzing the performance of the Sub-Adviser and managing the sub advisory relationship. The Board noted that the Adviser recommended the renewal of each Sub-Advisory Agreement.
Based on their review, the Independent Board Members found that, overall, the nature, extent and quality of services provided to the respective Funds under each applicable Advisory Agreement were satisfactory.
B. The Investment Performance of the Funds and Fund Advisers
The Board considered the long-term and short-term performance history of each Fund. As noted above, the Board reviewed fund performance at its quarterly meetings throughout the year and took into account the information derived from the discussions with representatives of the Adviser about fund performance at these meetings. The Board also considered the Adviser's analysis of fund performance with particular focus on any performance outliers and the factors contributing to such performance and any steps the investment team had taken to address performance concerns. The Board reviewed, among other things, each Fund's investment performance both on an absolute basis and in comparison to peer funds (the "Performance Peer Group") and to recognized and/or customized benchmarks (i.e., generally benchmarks derived from multiple recognized benchmarks) for the quarter, one-, three- and five-year periods ending December 31, 2015, as well as performance information reflecting the first quarter of 2016.
In evaluating performance information, the Board recognized the following factors may impact the performance data as well as the consideration to be given to particular performance data:
| | |
| | • The performance data reflected a snapshot in time, in this case as of the end of the most recent calendar year or quarter. A different performance period, however, could generate significantly different results. |
| | | |
| | • Long-term performance can be adversely affected by even one period of significant underperformance so that a single investment decision or theme had the ability to disproportionately affect long-term performance. |
| | |
| | • Shareholders evaluate performance based on their own holding period which may differ from the performance period reviewed by the Board, leading to different performance results. |
| | |
| | • The Board recognized the difficulty in establishing appropriate peer groups and benchmarks for certain funds. The Board noted that management classified the Performance Peer Groups as low, medium and high in relevancy and took the relevancy of the Performance Peer Group into account when considering the comparative performance data. If the Performance Peer Group differed somewhat from a fund, the Board recognized that the comparative performance data may be of limited value. The Board also recognized that each fund operated pursuant to its own investment objective(s), parameters and restrictions which may differ from that of the Performance Peer Group or benchmark and that these variations lead to differences in performance results. Further, for funds that utilized leverage, the Board understood that leverage during different periods could provide both benefits and risks to a portfolio as compared to an unlevered benchmark. |
In addition to the foregoing, the Independent Board Members continued to recognize the importance of secondary market trading for the shares of closed-end funds. At the quarterly meetings as well as the May Meeting, the Independent Board Members (either at the Board level or through the Closed-end Fund Committee) reviewed, among other things, the premium or discount to net asset value of the Nuveen closed-end funds as of a specified date and over various periods as well as in comparison to the premium/discount average in their respective Lipper peer category. At the May Meeting and/or prior meetings, the Independent Board Members (either at the Board level or through the Closed-end Fund Committee) reviewed, among other things, an analysis by the Adviser of the key economic, market and competitive trends that affected the closed-end fund market and Nuveen closed-end funds and considered any actions proposed periodically by the Adviser to address trading discounts of certain closed-end funds, including, among other things, share repurchases, fund reorganizations, adjusting fund investment mandates and strategies, and increasing fund awareness to investors. The Independent Board Members considered the evaluation of the premium and discount levels of the closed-end funds to be a continuing priority in their oversight of the closed-end funds.
With respect to any Nuveen funds for which the Board has identified performance concerns, the Board monitors such funds closely until performance improves, discusses with the Adviser the reasons for such results, considers those steps necessary or appropriate to address such issues, and reviews the results of any efforts undertaken. The Board was aware, however, that shareholders chose to invest or remain invested in a fund knowing that the Adviser and the applicable sub-adviser manage the fund, knowing the fund's investment strategy and seeking exposure to that strategy (even if the strategy was "out of favor" in the marketplace) and knowing the fund's fee structure.
For Nuveen Georgia Dividend Advantage Municipal Fund 2 (the "Georgia Fund"), although the Fund ranked in its Performance Peer Group in the fourth quartile for the three- and five-year periods, the Fund ranked in the third quartile in the one-year period and outperformed its benchmark in the one-, three- and five-year periods. The Board also noted the Fund's positive absolute performance for the one-, three- and five-year periods. The Board determined that the Fund's performance had been satisfactory.
For Nuveen Maryland Premium Income Municipal Fund (the "Maryland Fund"), although the Fund ranked in its Performance Peer Group in the fourth quartile for the three- and five-year periods, the Fund performed in the third quartile for the one-year period and outperformed its benchmark in the one-, three- and five-year periods. The Board also recognized the Fund's positive absolute performance for the one-, three- and five-year periods. The Board determined that the Fund's performance had been satisfactory.
For Nuveen Minnesota Municipal Income Fund (the "Minnesota Fund"), the Board noted that, although the Fund ranked in its Performance Peer Group in the fourth quartile for the shorter one-year period, the Fund ranked in the second quartile in the longer three- and five-year periods. The Board also outperformed its benchmark in the one-, three- and five-year periods. The Board determined that the Fund's performance over time had been satisfactory.
For Nuveen Missouri Premium Income Municipal Fund (the "Missouri Fund"), the Board noted that, although the Fund ranked in the fourth quartile of its Performance Peer Group in the one-year period, the Fund ranked in the third quartile for the three- and five-year periods. The Fund also outperformed its benchmark in the one-, three- and five-year periods. The Board determined that the Fund's performance over time had been satisfactory.
For Nuveen North Carolina Premium Income Municipal Fund (the "North Carolina Fund"), the Board noted that, although the Fund ranked in its Performance Peer Group in the fourth quartile in the one- and five-year periods, the Fund ranked in the third quartile in the three-year period. In addition, the Fund outperformed its benchmark in the one-, three- and five-year periods. The Board also recognized the Fund's positive absolute performance for the one-, three- and five-year periods. The Board further recognized that the Fund's performance was in the second quartile and it outperformed its benchmark in the quarter ending March 31, 2016. The Board determined that the Fund's performance overall had been satisfactory.
Annual Investment Management Agreement Approval Process (Unaudited) (continued)
For Nuveen Virginia Premium Income Municipal Fund (the "Virginia Fund"), although the Fund ranked in its Performance Peer Group in the fourth quartile in the longer three- and five-year periods, the Fund ranked in the third quartile in the one-year period and outperformed its benchmark in the one-, three- and five-year periods. The Board also noted that the Fund ranked in the first quartile and outperformed its benchmark in the first quarter ending March 31, 2016. The Board determined that the Fund's performance had been satisfactory.
C. Fees, Expenses and Profitability
1. Fees and Expenses
The Board evaluated the management fees and other fees and expenses of each Fund. The Board reviewed, among other things, the gross and net management fees and net total expenses of each Fund (expressed as a percentage of average net assets) in absolute terms and also in comparison to the fee and expense levels of a comparable universe of funds (the "Peer Universe") selected by an independent third-party fund data provider. The Independent Board Members also reviewed the methodology regarding the construction of the applicable Peer Universe.
In their evaluation of the management fee schedule, the Independent Board Members considered the fund-level and complex-wide breakpoint schedules, as described in further detail below. In this regard, the Board considered that management recently reviewed the breakpoint schedules for the closed-end funds which resulted in reduced breakpoints and/or new breakpoints at certain asset thresholds for numerous closed-end funds, including the Funds.
In reviewing the comparative fee and expense information, the Independent Board Members recognized that various factors such as the limited size and particular composition of the Peer Universe (including the inclusion of other Nuveen funds in the peer set); expense anomalies; changes in the funds comprising the Peer Universe from year to year; levels of reimbursement or fee waivers; the timing of information used; the differences in the type and use of leverage; differences in services provided; and differences in the states reflected in the Peer Universe can impact the usefulness of the comparative data in helping to assess the appropriateness of a fund's fees and expenses. In addition, in reviewing a fund's fees and expenses compared to the fees and expenses of its peers (excluding leverage costs and leveraged assets), the Board generally considered a fund's expenses and fees to be higher if they were over 10 basis points higher, slightly higher if they were 6 to 10 basis points higher, in line if they were within approximately 5 basis points higher than the peer average and below if they were below the peer average of the Peer Universe. The Board reviewed the net expense ratio in recognition that the net expense ratio generally best represented the net experience of the shareholders of a fund as it directly reflected the costs of investing in the respective fund. The Board noted that the majority of the Nuveen funds had a net expense ratio near or below the average of the respective peers. For funds with a net expense ratio of 6 basis points or higher than their respective peer average, the Independent Board Members reviewed the reasons for the outlier status and were satisfied with the explanation for the difference or with any steps taken to address the difference.
The Independent Board Members noted that the Georgia Fund, the Maryland Fund, the North Carolina Fund and the Virginia Fund each had a net management fee in line with its peer average and a net expense ratio below the peer average; the Minnesota Fund had a net management fee and net expense ratio in line with the respective peer average; and the Missouri Fund had a net management fee slightly higher than its peer average and a net expense ratio higher than the peer average, generally due to the small size of the Fund compared to the peers in its Peer Universe.
Based on their review of the fee and expense information provided, the Independent Board Members determined that each Fund's management fees (as applicable) to a Fund Adviser were reasonable in light of the nature, extent and quality of services provided to the Fund.
2. Comparisons with the Fees of Other Clients
The Board also reviewed information regarding the fee rates for other types of clients advised or sub-advised by the respective Fund Adviser. For the Adviser and/or the Sub-Adviser, such other clients may include municipal separately managed accounts and passively managed exchange traded funds (ETFs).
The Board recognized that each Fund had an affiliated sub-adviser. With respect to affiliated sub-advisers, the Board reviewed, among other things, the range of advisory fee rates and average fee rate assessed for the different types of clients. The Board reviewed information regarding the different types of services provided to the Funds compared to that provided to these other clients which typically did not require the same breadth of day-to-day services required for registered funds. The Board further considered information regarding the differences in, among other things, investment policies, investor profiles, and account sizes between the Nuveen funds and the other types of clients. In addition, the Independent Board Members also recognized that the management fee rates of the foreign funds advised by the Adviser may also vary due to, among other things, differences in the client base, governing bodies, operational complexities and services covered by the management fee. The Independent Board Members recognized that the foregoing variations resulted in different economics among the product structures and culminated in varying management fees among the types of clients and funds.
The Board also was aware that, since all Funds had a sub-adviser, each Fund's management fee reflected two components, the fee retained by the Adviser for its services and the fee the Adviser paid to the Sub-Adviser. The Board noted that many of the administrative services provided to support the Funds by the Adviser may not be required to the same extent or at all for the institutional clients or other clients. In general, the Board noted that higher fee levels reflected higher levels of service provided by the Fund Adviser, increased investment management complexity, greater product management requirements and higher levels of business risk or some combination of the foregoing. Given the inherent differences in the various products, particularly the extensive services provided to the Funds, the Independent Board Members concluded such facts justify the different levels of fees.
3. Profitability of Fund Advisers
In conjunction with their review of fees, the Independent Board Members also considered the profitability of Nuveen for its advisory activities on an absolute basis and in comparison to other investment advisers. The Independent Board Members reviewed, among other things, Nuveen's adjusted operating margins, the gross and net revenue margins (pre-tax and after-tax) for advisory activities for the Nuveen funds, and the revenues, expenses, and net income (pre-tax and after-tax) of Nuveen for each of the last two calendar years. The Independent Board Members reviewed an analysis of the key drivers behind the changes in revenues and expenses that impacted profitability in 2015. The Independent Board Members also noted that the sub-advisory fees for the Funds are paid by the Adviser, however, the Board recognized that the Sub-Adviser is affiliated with Nuveen. In their review, the Independent Board Members recognized that profitability data is rather subjective as various allocation methodologies may be reasonable to employ but yet yield different results. The Board also reviewed the results of certain alternative methodologies. The Board considered the allocation methodology employed to prepare the profitability data as well as a summary of the refinements to the methodology that had been adopted over the years which may limit some of the comparability of Nuveen's revenue margins over time. Two Independent Board Members also served as point persons for the Board throughout the year to review and discuss the methodology employed to develop the profitability analysis and any proposed changes thereto and to keep the Board apprised of such changes during the year. In reviewing the profitability data, the Independent Board Members noted that Nuveen's operating margin as well as its margins for its advisory activities to the Nuveen funds for 2015 were consistent with such margins for 2014.
The Board also considered Nuveen's adjusted operating margins compared to that of other comparable investment advisers (based on asset size and composition) with publicly available data. The Independent Board Members recognized, however, the limitations of the comparative data as the other advisers may have a different business mix, employ different allocation
Annual Investment Management Agreement Approval Process (Unaudited) (continued)
methodologies, have different capital structure and costs, may not be representative of the industry or other factors that limit the comparability of the profitability information. Nevertheless, the Independent Board Members noted that Nuveen's adjusted operating margins appeared comparable to the adjusted margins of the peers.
Further, as the Adviser is a wholly-owned subsidiary of Nuveen which in turn is an operating division of TIAA Global Asset Management, the investment management arm of Teachers Insurance and Annuity Association of America ("TIAA-CREF"), the Board reviewed a balance sheet for TIAA-CREF reflecting its assets, liabilities and capital and contingency reserves for the last two calendar years to have a better understanding of the financial stability and strength of the TIAA-CREF complex, together with Nuveen.
Based on the information provided, the Independent Board Members noted that the Adviser appeared to be sufficiently profitable to operate as a viable investment management firm and to honor its obligations as a sponsor of the Nuveen funds.
With respect to the Sub-Adviser, the Independent Board Members also considered the profitability of the Sub-Adviser from its relationship with the Nuveen funds. The Independent Board Members reviewed the Sub-Adviser's revenues, expenses and revenue margins (pre- and post-tax) for its advisory activities for the calendar year ended December 31, 2015. The Independent Board Members also reviewed profitability analysis reflecting the revenues, expenses and revenue margin (pre- and post-tax) by asset type for the Sub-Adviser for the calendar year ending December 31, 2015.
In evaluating the reasonableness of the compensation, the Independent Board Members also considered other amounts paid to a Fund Adviser by the Funds as well as indirect benefits (such as soft dollar arrangements), if any, the Fund Adviser and its affiliates received or were expected to receive that were directly attributable to the management of a Fund. See Section E below for additional information on indirect benefits a Fund Adviser may receive as a result of its relationship with the Funds.
Based on their review, the Independent Board Members determined that the Adviser's and the Sub-Adviser's levels of profitability were reasonable in light of the respective services provided.
D. Economies of Scale and Whether Fee Levels Reflect These Economies of Scale
The Independent Board Members recognized that as the assets of a particular fund or the Nuveen complex in the aggregate increase over time, economies of scale may be realized with respect to the management of the funds, and the Independent Board Members considered the extent to which these economies are shared with the funds and their shareholders. Although the Independent Board Members recognized that economies of scale are difficult to measure with precision, the Board noted that there were several acceptable means to share economies of scale, including through breakpoints in the management fee schedule reducing the fee rates as asset levels grow, fee waiver and expense limitation agreements and the Adviser's investment in its business which can enhance the services provided to the funds. With respect to breakpoints, the Independent Board Members noted that, subject to certain exceptions, the funds in the Nuveen complex pay a management fee to the Adviser which is generally comprised of a fund-level component and complex-level component. The fund-level fee component declines as the assets of the particular fund grow and the complex-level fee component declines when eligible assets of all the funds in the Nuveen complex combined grow. With respect to closed-end funds, the Independent Board Members noted that, although such funds may from time-to-time make additional share offerings, the growth of their assets would occur primarily through the appreciation of such funds' investment portfolios. The complex-wide fee arrangement was designed to capture economies of scale achieved when total fund complex assets increase, even if the assets of a particular fund are unchanged or decrease. The approach reflected the notion that some of Nuveen's costs were attributable to services provided to all its funds in the complex, and therefore all funds should benefit if these costs were spread over a larger asset base.
The Independent Board Members reviewed the breakpoint and complex-wide schedules and the material savings achieved from fund-level breakpoints and complex-wide fee reductions for the 2015 calendar year.
In addition, the Independent Board Members recognized the Adviser's ongoing investment in its business to expand or enhance the services provided to the Nuveen funds. The Independent Board Members noted, among other things, the additions to groups who play a key role in supporting the funds including in closed-end funds/structured products, fund administration, operations, fund governance, investment services, compliance, product management, and technology. The Independent Board Members also recognized the investments in systems necessary to manage the funds including in areas of risk oversight, information technology and compliance.
Based on their review, the Independent Board Members concluded that the current fee structure was acceptable and reflected economies of scale to be shared with shareholders when assets under management increase.
E. Indirect Benefits
The Independent Board Members received and considered information regarding other additional benefits the respective Fund Adviser or its affiliates may receive as a result of their relationship with the Funds, including compensation paid to affiliates and research received in connection with brokerage transactions (i.e., soft dollar arrangements). In this regard, the Independent Board Members noted any revenues received by affiliates of the Adviser for serving as co-manager in initial public offerings of new closed-end funds and as underwriter on shelf offerings for certain existing funds.
In addition to the above, the Independent Board Members considered that the Funds' portfolio transactions are allocated by the Sub-Adviser and the Sub-Adviser may benefit from research received through soft-dollar arrangements. The Board noted, however, that with respect to transactions in fixed income securities, such securities generally trade on a principal basis and do not generate soft dollar credits. Although the Board recognized the Sub-Adviser may benefit from a soft dollar arrangement if it does not have to pay for this research out of its own assets, the Board also recognized that any such research may benefit the Funds to the extent it enhances the ability of the Sub-Adviser to manage the Funds.
Based on their review, the Independent Board Members concluded that any indirect benefits received by a Fund Adviser as a result of its relationship with the Funds were reasonable and within acceptable parameters.
F. Other Considerations
The Independent Board Members did not identify any single factor discussed previously as all-important or controlling. The Board Members, including the Independent Board Members, concluded that the terms of each Advisory Agreement were fair and reasonable, that the respective Fund Adviser's fees were reasonable in light of the services provided to each Fund and that the Advisory Agreements be renewed.
Board Members & Officers (Unaudited) |
The management of the Funds, including general supervision of the duties performed for the Funds by the Adviser, is the responsibility of the Board of Trustees of the Funds. The number of trustees of the Funds is set at twelve, effective July 1, 2016. None of the trustees who are not "interested" persons of the Funds (referred to herein as "independent trustees") has ever been a director or employee of, or consultant to, Nuveen or its affiliates. The names and business addresses of the trustees and officers of the Funds, their principal occupations and other affiliations during the past five years, the number of portfolios each oversees and other directorships they hold are set forth below.
| | Name, | | Position(s) Held | | Year First | | Principal | | Number |
| | Year of Birth | | with the Funds | | Elected or | | Occupation(s) | | of Portfolios |
| | & Address | | | | Appointed | | Including other | | in Fund Complex |
| | | | | | and Term(1) | | Directorships | | Overseen by |
| | | | | | | | During Past 5 Years | | Board Member |
| | | | | | | | | | |
| Independent Board Members: | | | | | | |
| | | | | | | | | | |
| ■ | WILLIAM J. SCHNEIDER
1944
333 W. Wacker Drive
Chicago, IL 6o6o6 | | Chairman and
Board Member | | 1996
Class III | | Chairman of Miller-Valentine Partners, a real estate investment company; Board Member of Med-America Health System and WDPR Public Radio station; formerly, Senior Partner and Chief Operating Officer (retired (2004) of Miller-Valentine Group; formerly, Board member, Business Advisory Council of the Cleveland Federal Reserve Bank and University of Dayton Business School Advisory Council; past Chair and Director, Dayton Development Coalition. | | 184 |
| | | | | | | | | | |
| ■ | JACK B. EVANS
1948
333 W. Wacker Drive
Chicago, IL 6o6o6 | | Board Member | | 1999
Class III | | President, The Hall-Perrine Foundation, a private philanthropic corporation (since 1996); Director and Chairman, United Fire Group, a publicly held company; Director, The Gazette Company; Life Trustee of Coe College and the Iowa College Foundation; formerly, President Pro-Tem of the Board of Regents for the State of Iowa University System; formerly, Director, Alliant Energy; formerly, Director, Federal Reserve Bank of Chicago; formerly, President and Chief Operating Officer, SCI Financial Group, Inc., a regional financial services firm. | | 184 |
| | | | | | | | | | |
| ■ | WILLIAM C. HUNTER
1948
333 W. Wacker Drive
Chicago, IL 6o6o6 | | Board Member | | 2004
Class I | | Dean Emeritus, formerly, Dean, Tippie College of Business, University of Iowa (2006-2012); Director (since 2004) of Xerox Corporation; Director (since 2005), and past President (2010-2014) Beta Gamma Sigma, Inc., The International Business Honor Society; Director of Wellmark, Inc. (since 2009); formerly, Dean and Distinguished Professor of Finance, School of Business at the University of Connecticut (2003-2006); previously, Senior Vice President and Director of Research at the Federal Reserve Bank of Chicago (1995-2003); formerly, Director (1997-2007), Credit Research Center at Georgetown University. | | 184 |
| | | | | | | | | | |
| ■ | DAVID J. KUNDERT
1942
333 W. Wacker Drive
Chicago, IL 6o6o6 | | Board Member | | 2005
Class II | | Formerly, Director, Northwestern Mutual Wealth Management Company (2006-2013), retired (since 2004) as Chairman, JPMorgan Fleming Asset Management, President and CEO, Banc One Investment Advisors Corporation, and President, One Group Mutual Funds; prior thereto, Executive Vice President, Banc One Corporation and Chairman and CEO, Banc One Investment Management Group; Regent Emeritus, Member of Investment Committee, Luther College; member of the Wisconsin Bar Association; member of Board of Directors and Chair of Investment Committee, Greater Milwaukee Foundation; member of the Board of Directors (Milwaukee), College Possible; Board member of Milwaukee Repertory Theatre (since 2016). | | 184 |
| | Name, | | Position(s) Held | | Year First | | Principal | | Number |
| | Year of Birth | | with the Funds | | Elected or | | Occupation(s) | | of Portfolios |
| | & Address | | | | Appointed | | Including other | | in Fund Complex |
| | | | | | and Term(1) | | Directorships | | Overseen by |
| | | | | | | | During Past 5 Years | | Board Member |
| Independent Board Members (continued): | | | | | | |
| | | | | | | | | | |
| ■ | ALBIN F. MOSCHNER(2)
1952
333 W. Wacker Drive
Chicago, IL 6o6o6 | | Board Member | | 2016
Class III | | Founder and Chief Executive Officer, Northcroft Partners, LLC, a management consulting firm (since 2012); previously, held positions at Leap Wireless International, Inc., including Consultant (2011-2012), Chief Operating Officer (2008-2011), and Chief Marketing Officer (2004-2008); formerly, President, Verizon Card Services division of Verizon Communications, Inc. (2000-2003); formerly, President, One Point Services at One Point Communications (1999-2000); formerly, Vice Chairman of the Board, Diba, Incorporated (1996-1997); formerly, various executive positions with Zenith Electronics Corporation (1991-1996). Director, USA Technologies, Inc., a provider of solutions and services to facilitate electronic payment transactions (since 2012); formerly, Director, Wintrust Financial Corporation (1996-2016). | | 184 |
| | | | | | | | | | |
| ■ | JOHN K. NELSON
1962
333 W. Wacker Drive
Chicago, IL 6o6o6 | | Board Member | | 2013
Class II | | Member of Board of Directors of Core12 LLC (since 2008), a private firm which develops branding, marketing and communications strategies for clients; Director of The Curran Center for Catholic American Studies (since 2009) and The President's Council, Fordham University (since 2010); formerly, senior external advisor to the financial services practice of Deloitte Consulting LLP (2012- 2014): formerly, Chairman of the Board of Trustees of Marian University (2010 as trustee, 2011-2014 as Chairman); formerly, Chief Executive Officer of ABN AMRO N.V. North America, and Global Head of its Financial Markets Division (2007-2008); prior senior positions held at ABN AMRO include Corporate Executive Vice President and Head of Global Markets-the Americas (2006- 2007), CEO of Wholesale Banking North America and Global Head of Foreign Exchange and Futures Markets (2001-2006), and Regional Commercial Treasurer and Senior Vice President Trading – North America (1996-2001); formerly, Trustee at St. Edmund Preparatory School in New York City. | | 184 |
| | | | | | | | | | |
| ■ | JUDITH M. STOCKDALE
1947
333 W. Wacker Drive
Chicago, IL 6o6o6 | | Board Member | | 1997
Class I | | Board Member, Land Trust Alliance (since 2013) and U.S. Endowment for Forestry and Communities (since 2013); formerly, Executive Director (1994-2012), Gaylord and Dorothy Donnelley Foundation; prior thereto, Executive Director, Great Lakes Protection Fund (1990-1994). | | 184 |
| | | | | | | | | | |
| ■ | CAROLE E. STONE
1947
333 W. Wacker Drive
Chicago, IL 6o6o6 | | Board Member | | 2007
Class I | | Director, Chicago Board Options Exchange, Inc. (since 2006); Director, C2 Options Exchange, Incorporated (since 2009); Director, CBOE Holdings, Inc. (since 2010); formerly, Commissioner, New York State Commission on Public Authority Reform (2005-2010). | | 184 |
| | | | | | | | | | |
| ■ | TERENCE J. TOTH
1959
333 W. Wacker Drive
Chicago, IL 6o6o6 | | Board Member | | 2008
Class II | | Managing Partner, Promus Capital (since 2008); Director, Fulcrum IT Service LLC (since 2010), Quality Control Corporation (since 2012) and LogicMark LLC (since 2012); member: Chicago Fellowship Board (since 2005), Catalyst Schools of Chicago Board (since 2008) and Mather Foundation Board (since 2012), and chair of its investment committee; formerly, Director, Legal & General Investment Management America, Inc. (2008-2013); formerly, CEO and President, Northern Trust Global Investments (2004-2007): Executive Vice President, Quantitative Management & Securities Lending (2000-2004); prior thereto, various positions with Northern Trust Company (since 1994); formerly, Member, Northern Trust Mutual Funds Board (2005-2007), Northern Trust Global Investments Board (2004-2007), Northern Trust Japan Board (2004-2007), Northern Trust Securities Inc. Board (2003-2007) and Northern Trust Hong Kong Board (1997-2004). | | 184 |
| Board Members & Officers (Unaudited) (continued) | |
| | Name, | | Position(s) Held | | Year First | | Principal | | Number |
| | Year of Birth | | with the Funds | | Elected or | | Occupation(s) | | of Portfolios |
| | & Address | | | | Appointed | | Including other | | in Fund Complex |
| | | | | | and Term(1) | | Directorships | | Overseen by |
| | | | | | | | During Past 5 Years | | Board Member |
| Independent Board Members (continued): | | | | | | |
| | | | | | | | | | |
| ■ | MARGARET L. WOLFF
1955
333 W. Wacker Drive
Chicago, IL 6o6o6 | | Board Member | | 2016
Class I | | Member of the Board of Directors (since 2013) of Travelers Insurance Company of Canada and The Dominion of Canada General Insurance Company (each, a part of Travelers Canada, the Canadian operation of The Travelers Companies, Inc.); formerly, Of Counsel, Skadden, Arps, Slate, Meagher & Flom LLP (Mergers & Acquisitions Group) (2005-2014); Member of the Board of Trustees of New York- Presbyterian Hospital (since 2005); Member (since 2004) and Chair (since 2015) of the Board of Trustees of The John A. Hartford Foundation (a philanthropy dedicated to improving the care of older adults); formerly, Member (2005-2015) and Vice Chair (2011-2015) of the Board of Trustees of Mt. Holyoke College. | | 184 |
| | | | | | | | | | |
| Interested Board Members: | | | | | | |
| | | | | | | | | | |
| ■ | WILLIAM ADAMS IV(3)
1955
333 W. Wacker Drive
Chicago, IL 6o6o6 | | Board Member | | 2013
Class II | | Co-Chief Executive Officer and Co-President (since March 2016), formerly, Senior Executive Vice President, Global Structured Products (2010-2016), prior thereto, Executive Vice President, U.S. Structured Products, (1999-2010) of Nuveen Investments, Inc.; Co-President of Nuveen Fund Advisors, LLC (since 2011); Co-Chief Executive Officer (since 2016), formerly, Senior Executive Vice President of Nuveen Securities, LLC; President (since 2011), of Nuveen Commodities Asset Management, LLC; Board Member of the Chicago Symphony Orchestra and of Gilda's Club Chicago. | | 184 |
| | | | | | | | | | |
| ■ | MARGO L. COOK(2)(3)
1964
333 W. Wacker Drive
Chicago, IL 6o6o6 | | Board Member | | 2016
Class III | | Co-Chief Executive Officer and Co-President (since March 2016), formerly, Senior Executive Vice President of Nuveen Investments, Inc; Co-Chief Executive Officer (since 2015), previously, Executive Vice President (2013-2015) of Nuveen Securities, LLC; Senior Executive Vice President (since 2015) of Nuveen Fund Advisors, LLC (Executive Vice President 2011-2015); formerly, Managing Director of Nuveen Commodities Asset Management, LLC (2011-2016); Chartered Financial Analyst. | | 184 |
| | Name, | | Position(s) Held | | Year First | | Principal | | Number |
| | Year of Birth | | with the Funds | | Elected or | | Occupation(s) | | of Portfolios |
| | & Address | | | | Appointed(4) | | During Past 5 Years | | in Fund Complex |
| | | | | | | | | | Overseen |
| | | | | | | | | | by Officer |
| Officers of the Funds: | | | | | | |
| | | | | | | | | | |
| ■ | GIFFORD R. ZIMMERMAN
1956
333 W. Wacker Drive
Chicago, IL 6o6o6 | | Chief
Administrative
Officer | | 1988 | | Managing Director (since 2002), and Assistant Secretary of Nuveen Securities, LLC; Managing Director (since 2004) and Assistant Secretary (since 1994) of Nuveen Investments, Inc.; Managing Director (since 2002), Assistant Secretary (since 1997) and Co-General Counsel (since 2011) of Nuveen Fund Advisors, LLC; Managing Director, Assistant Secretary and Associate General Counsel of Nuveen Asset Management, LLC (since 2011); Managing Director and Assistant Secretary of Nuveen Investments Advisers, LLC (since 2002) and Symphony Asset Management LLC (since 2003); Vice President and Assistant Secretary of NWQ Investment Management Company, LLC (since 2002), Santa Barbara Asset Management, LLC (since 2006), and of Winslow Capital Management, LLC, (since 2010); Vice President and Assistant Secretary (since 2013), formerly, Chief Administrative Officer and Chief Compliance Officer (2006-2013) of Nuveen Commodities Asset Management, LLC; Chartered Financial Analyst. | | 185 |
| | Name, | | Position(s) Held | | Year First | | Principal | | Number |
| | Year of Birth | | with the Funds | | Elected or | | Occupation(s) | | of Portfolios |
| | & Address | | | | Appointed(4) | | During Past 5 Years | | in Fund Complex |
| | | | | | | | | | Overseen |
| | | | | | | | | | by Officer |
| | | | | | | | | | |
| Officers of the Funds (continued): | | | | | | |
| | | | | | | | | | |
| ■ | CEDRIC H. ANTOSIEWICZ
1962
333 W. Wacker Drive
Chicago, IL 6o6o6 | | Vice President | | 2007 | | Managing Director of Nuveen Securities, LLC. (since 2004); Managing Director of Nuveen Fund Advisors, LLC (since 2014). | | 83 |
| | | | | | | | | | |
| ■ | LORNA C. FERGUSON
1945
333 W. Wacker Drive
Chicago, IL 6o6o6 | | Vice President | | 1998 | | Managing Director (since 2004) of Nuveen Investments Holdings, Inc. | | 185 |
| | | | | | | | | | |
| ■ | STEPHEN D. FOY
1954
333 W. Wacker Drive
Chicago, IL 6o6o6 | | Vice President
and Controller | | 1998 | | Managing Director (since 2014), formerly, Senior Vice President (2013-2014) and Vice President (2005-2013) of Nuveen Fund Advisors, LLC; Chief Financial Officer of Nuveen Commodities Asset Management, LLC (since 2010); Managing Director (since 2016) of Nuveen Securities, LLC; Certified Public Accountant. | | 185 |
| | | | | | | | | | |
| ■ | NATHANIEL T. JONES
1979
333 W. Wacker Drive
Chicago, IL 6o6o6 | | Vice President
and Treasurer | | 2016 | | Senior Vice President (since 2016), formerly, Vice President (2011-2016) of Nuveen Investments Holdings, Inc.; Chartered Financial Analyst. | | 184 |
| | | | | | | | | | |
| ■ | WALTER M. KELLY
197o
333 W. Wacker Drive
Chicago, IL 6o6o6 | | Chief Compliance
Officer and
Vice President | | 2003 | | Senior Vice President (since 2008) of Nuveen Investment Holdings, Inc. | | 185 |
| | | | | | | | | | |
| ■ | DAVID J. LAMB
1963
333 W. Wacker Drive
Chicago, IL 6o6o6 | | Vice President | | 2015 | | Senior Vice President of Nuveen Investments Holdings, Inc. (since 2006), Vice President prior to 2006. | | 83 |
| | | | | | | | | | |
| ■ | TINA M. LAZAR
1961
333 W. Wacker Drive
Chicago, IL 6o6o6 | | Vice President | | 2002 | | Senior Vice President of Nuveen Investments Holdings, Inc. and Nuveen Securities, LLC. | | 185 |
| | | | | | | | | | |
| ■ | KEVIN J. MCCARTHY
1966
333 W. Wacker Drive
Chicago, IL 6o6o6 | | Vice President
and Secretary | | 2007 | | Executive Vice President, Secretary and General Counsel (since March 2016), formerly, Managing Director and Assistant Secretary of Nuveen Investments, Inc.; Executive Vice President (since March 2016), formerly, Managing Director, and Assistant Secretary (since 2008) of Nuveen Securities, LLC; Executive Vice President and Secretary (since March 2016), formerly, Managing Director (2008-2016) and Assistant Secretary (2007-2016), and Co-General Counsel (since 2011) of Nuveen Fund Advisors, LLC; Executive Vice President and Secretary (since March 2016), formerly, Managing Director, Assistant Secretary (2011-2016), and Associate General Counsel (since 2011) of Nuveen Asset Management, LLC; Executive Vice President and Secretary of Nuveen Investments Advisers, LLC; Vice President (since 2007) and Secretary (since March 2016) of NWQ Investment Management Company, LLC, Symphony Asset Management LLC, Santa Barbara Asset Management, LLC, Winslow Capital Management, LLC (since 2010) and Tradewinds Global Investors, LLC (since 2016); Vice President (since 2010) and Secretary (since 2016), formerly, Assistant Secretary of Nuveen Commodities Asset Management, LLC. | | 185 |
Board Members & Officers (Unaudited) (continued) |
| | Name, | | Position(s) Held | | Year First | | Principal | | Number |
| | Year of Birth | | with the Funds | | Elected or | | Occupation(s) | | of Portfolios |
| | & Address | | | | Appointed(4) | | During Past 5 Years | | in Fund Complex |
| | | | | | | | | | Overseen |
| | | | | | | | | | by Officer |
| Officers of the Funds (continued): | | | | | | |
| | | | | | | | | | |
| ■ | KATHLEEN L. PRUDHOMME
1953
9o1 Marquette Avenue
Minneapolis, MN 554o2 | | Vice President and
Assistant Secretary | | 2011 | | Managing Director, Assistant Secretary and Co-General Counsel (since 2011) of Nuveen Fund Advisors, LLC; Managing Director, Assistant Secretary and Associate General Counsel (since 2011) of Nuveen Asset Management, LLC; Managing Director and Assistant Secretary (since 2011) of Nuveen Securities, LLC; formerly, Deputy General Counsel, FAF Advisors, Inc. (2004-2010). | | 185 |
| | | | | | | | | | |
| ■ | JOEL T. SLAGER
1978
333 W. Wacker Drive
Chicago, IL 6o6o6 | | Vice President and
Assistant Secretary | | 2013 | | Fund Tax Director for Nuveen Funds (since 2013); previously, Vice President of Morgan Stanley Investment Management, Inc., Assistant Treasurer of the Morgan Stanley Funds (from 2010 to 2013). | | 185 |
| (1) | The Board of Trustees is divided into three classes, Class I, Class II, and Class III, with each being elected to serve until the third succeeding annual shareholders' meeting subsequent to its election or thereafter in each case when its respective successors are duly elected or appointed, except two board members are elected by the holders of Preferred Shares, when applicable, to serve until the next annual shareholders' meeting subsequent to its election or thereafter in each case when its respective successors are duly elected or appointed. The year first elected or appointed represents the year in which the board member was first elected or appointed to any fund in the Nuveen Complex. |
| (2) | On June 22, 2016, Ms. Cook and Mr. Moschner were appointed as Board members, effective July 1, 2016. |
| (3) | "Interested person" as defined in the 1940 Act, by reason of his position with Nuveen Investments, Inc. and certain of its subsidiaries, which are affiliates of the Nuveen Funds. |
| (4) | Officers serve one year terms through August of each year. The year first elected or appointed represents the year in which the Officer was first elected or appointed to any fund in the Nuveen Complex. |
Notes
Notes
Notes
| Nuveen: | |
| | Serving Investors for Generations |
Since 1898, financial advisors and their clients have relied on Nuveen to provide dependable investment solutions through continued adherence to proven, long-term investing principles. Today, we offer a range of high quality equity and fixed-income solutions designed to be integral components of a well-diversified core portfolio.
Focused on meeting investor needs.
Nuveen helps secure the long-term goals of individual investors and the advisors who serve them. As an operating division of TIAA Global Asset Management, Nuveen provides access to investment expertise from leading asset managers and solutions across traditional and alternative asset classes. Built on more than a century of industry leadership, Nuveen's teams of experts align with clients' specific financial needs and goals, demonstrating commitment to advisors and investors through market perspectives and wealth management and portfolio advisory services. Nuveen manages more than $239 billion in assets as of June 30, 2016.
Find out how we can help you.
To learn more about how the products and services of Nuveen may be able to help you meet your financial goals, talk to your financial advisor, or call us at (800) 257-8787. Please read the information provided carefully before you invest. Investors should consider the investment objective and policies, risk considerations, charges and expenses of any investment carefully. Where applicable, be sure to obtain a prospectus, which contains this and other relevant information. To obtain a prospectus, please contact your securities representative or Nuveen, 333 W. Wacker Dr., Chicago, IL 60606. Please read the prospectus carefully before you invest or send money.
Learn more about Nuveen Funds at: www.nuveen.com/cef
Distributed by Nuveen Investments, LLC | 333 West Wacker Drive | Chicago, IL 60606 | www.nuveen.com | |
EAN-A-0516D 17348-INV-Y-07/17
ITEM 2. CODE OF ETHICS.
As of the end of the period covered by this report, the registrant has adopted a code of ethics that applies to the registrant’s principal executive officer, principal financial officer, principal accounting officer or controller, or persons performing similar functions. There were no amendments to or waivers from the Code during the period covered by this report. The registrant has posted the code of ethics on its website at www.nuveen.com/CEF/Shareholder/FundGovernance.aspx. (To view the code, click on Code of Conduct.)
ITEM 3. AUDIT COMMITTEE FINANCIAL EXPERT.
ITEM 4. PRINCIPAL ACCOUNTANT FEES AND SERVICES.
SERVICES THAT THE FUND’S AUDITOR BILLED TO THE ADVISER AND AFFILIATED FUND SERVICE PROVIDERS
Audit Committee Pre-Approval Policies and Procedures. Generally, the Audit Committee must approve (i) all non-audit services to be performed for the Fund by the Fund’s independent accountants and (ii) all audit and non-audit services to be performed by the Fund’s independent accountants for the Affiliated Fund Service Providers with respect to operations and financial reporting of the Fund. Regarding tax and research projects conducted by the independent accountants for the Fund and Affiliated Fund Service Providers (with respect to operations and financial reports of the Fund) such engagements will be (i) pre-approved by the Audit Committee if they are expected to be for amounts greater than $10,000; (ii) reported to the Audit Committee chairman for his verbal approval prior to engagement if they are expected to be for amounts under $10,000 but greater than $5,000; and (iii) reported to the Audit Committee at the next Audit Committee meeting if they are expected to be for an amount under $5,000.
ITEM 6. SCHEDULE OF INVESTMENTS.
a) See Portfolio of Investments in Item 1.
b) Not applicable.
ITEM 7. DISCLOSURE OF PROXY VOTING POLICIES AND PROCEDURES FOR CLOSED-END MANAGEMENT INVESTMENT COMPANIES.
ITEM 9. PURCHASES OF EQUITY SECURITIES BY CLOSED-END MANAGEMENT INVESTMENT COMPANY AND AFFILIATED PURCHASERS.
Not applicable.
ITEM 10. SUBMISSION OF MATTERS TO A VOTE OF SECURITY HOLDERS.
There have been no material changes to the procedures by which shareholders may recommend nominees to the registrant’s Board implemented after the registrant last provided disclosure in response to this Item.
ITEM 11. CONTROLS AND PROCEDURES.
ITEM 12. EXHIBITS.
File the exhibits listed below as part of this Form.
Pursuant to the requirements of the Securities Exchange Act of 1934 and the Investment Company Act of 1940, the registrant has duly caused this report to be signed on its behalf by the undersigned, thereunto duly authorized.
Kevin J. McCarthy
Pursuant to the requirements of the Securities Exchange Act of 1934 and the Investment Company Act of 1940, this report has been signed below by the following persons on behalf of the registrant and in the capacities and on the dates indicated.
Gifford R. Zimmerman
Stephen D. Foy