Life is Complex.
Nuveen makes things e-simple.
It only takes a minute to sign up for e-Reports. Once enrolled, you’ll receive an e-mail as soon as your Nuveen Fund information is ready—no more waiting for delivery by regular mail. Just click on the link within the e-mail to see the report and save it on your computer if you wish.
Free e-Reports
right to your e-mail!
www.investordelivery.com
If you receive your Nuveen Fund
dividends and statements from your
financial professional or brokerage account.
or
www.nuveen.com/client-access
If you receive your Nuveen Fund
dividends and statements directly from
Nuveen.
NOT FDIC INSURED MAY LOSE
VALUE NO BANK GUARANTEE
3
Chair’s Letterto Shareholders Dear Shareholders,
The COVID-19 crisis is taking an unprecedented toll on our health, societies, economies and financial markets. Our thoughts are with you during this time of significant disruption caused by the disease and its economic fallout. With many regions of the world suppressing the initial spread of the virus, governments and public health officials face the extraordinary challenge of balancing the resumption of economic activity with public safety, particularly as new clusters of infection have emerged in the U.S. and other countries following their reopening. Markets have turned their focus to the potential for an economic recovery, although the timing and magnitude are highly uncertain. Elevated market volatility is likely to continue, with economic data, coronavirus infection rates and the upcoming U.S. presidential election under scrutiny.
While we do not want to understate the dampening effect on the global economy, it is important to differentiate short-term interruptions from the longer-lasting implications to the economy. Prior to the COVID-19 crisis, some areas of the global economy were showing signs of improvement after trade tensions had weighed on economic activity for much of 2019. More recently, countries that have reopened have seen marked improvement in some near-term economic indicators. Central banks and governments around the world have announced economic stimulus measures and pledged to continue doing what it takes to support their economies. In the U.S., the Federal Reserve has cut its benchmark interest rate to near zero and introduced similar programs that helped revive the U.S. economy after the 2008 financial crisis. The U.S. Government has approved three relief packages, including a $2 trillion-dollar package directly supporting businesses and individuals. The Coronavirus Aid, Relief and Economic Security Act, called the CARES Act, provides direct payments and expanded unemployment benefits to individuals, loans and grants to small businesses, loans and other money to large corporations and funding for hospitals, public health, education and state and local governments.
In the meantime, patience and a long-term perspective are key for investors. When market fluctuations are the leading headlines day after day, it’s tempting to “do something.” However, your long-term goals can’t be met with short-term thinking. We encourage you to talk to your financial professional, who can review your time horizon, risk tolerance and investment goals. On behalf of the other members of the Nuveen Fund Board, we look forward to continuing to earn your trust in the months and years ahead.
Sincerely,
Terence J. Toth
Chair of the Board
July 22, 2020
4
Portfolio Managers’ CommentsNuveen Georgia Quality Municipal Income Fund (NKG)Nuveen Maryland Quality Municipal Income Fund (NMY)Nuveen Massachusetts Quality Municipal Income Fund (NMT)Nuveen Minnesota Quality Municipal Income Fund (NMS)Nuveen Missouri Quality Municipal Income Fund (NOM)Nuveen Virginia Quality Municipal Income Fund (NPV) These Funds feature portfolio management by Nuveen Asset Management, LLC (NAM), an affiliate of Nuveen Fund Advisors, LLC, the Funds’ investment adviser. Portfolio managers Daniel J. Close, CFA, Stephen J. Candido, CFA, Christopher L. Drahn, CFA, and Michael S. Hamilton discuss U.S. economic and market conditions, key investment strategies and the twelve-month performance of these six Nuveen Funds. Dan has managed the Nuveen Georgia Fund since 2007. Steve assumed portfolio management responsibility for the Maryland and Virginia Funds in 2016. Chris has managed the Missouri Fund since 2011 and assumed responsibility for the Minnesota Fund in 2016. Michael assumed portfolio management responsibility for the Massachusetts Fund in 2011.
What factors affected the U.S. economy and the national municipal market during the twelve-month reporting period ended May 31, 2020?
The longest economic expansion in U.S. history came to an abrupt halt in early 2020 amid the COVID-19 coronavirus pandemic. To slow the spread of the virus, large portions of the economy were shut down, with companies closing either temporarily or permanently and most of the U.S. population under stay-at-home orders during March and April 2020. A phased reopening began toward the end of May and continued after the close of the reporting period. The disruption has been swift and severe, and has tipped the economy into recession, a several months’ long contraction across the broad economy. (Subsequent to the close of this reporting period, in June 2020, the National Bureau of Economic Research announced that the economic expansion that began in June 2009 officially ended in February 2020, marking the start of a recession.) For the first quarter of 2020, the Bureau of Economic Analysis reported that annualized gross domestic product (GDP) shrank 5.0%, according to its “second” estimate. GDP measures the value of goods and services produced by the nation’s economy less the value of the goods and services used up in
This material is not intended to be a recommendation or investment advice, does not constitute a solicitation to buy, sell or hold a security or an investment strategy and is not provided in a fiduciary capacity. The information provided does not take into account the specific objectives or circumstances of any particular investor, or suggest any specific course of action. Investment decisions should be made based on an investor’s objectives and circumstances and in consultation with his or her advisors.Certain statements in this report are forward-looking statements. Discussions of specific investments are for illustration only and are not intended as recommendations of individual investments. The forward-looking statements and other views expressed herein are those of the portfolio managers as of the date of this report. Actual future results or occurrences may differ significantly from those anticipated in any forward-looking statements, and the views expressed herein are subject to change at any time, due to numerous market and other factors. The Funds disclaim any obligation to update publicly or revise any forward-looking statements or views expressed herein.
For financial reporting purposes, the ratings disclosed are the highest rating given by one of the following national rating agencies: Standard & Poor’s Group (S&P), Moody’s Investors Service, Inc. (Moody’s) or Fitch, Inc. (Fitch). This treatment of split-rated securities may differ from that used for other purposes, such as for Fund investment policies. Credit ratings are subject to change. AAA, AA, A and BBB are investment grade ratings, while BB, B, CCC, CC, C and D are below investment grade ratings. Holdings designated N/R are not rated by these national rating agencies.
Bond insurance guarantees only the payment of principal and interest on the bond when due, and not the value of the bonds themselves, which will fluctuate with the bond market and the financial success of the issuer and the insurer. Insurance relates specifically to the bonds in the portfolio and not to the share prices of a Fund. No representation is made as to the insurers’ ability to meet their commitments.
Refer to the Glossary of Terms Used in this Report for further definition of the terms used within this section.
5
Portfolio Managers’ Comments (continued)
production, adjusted for price changes. Previously, the economy had been expanding at a moderate clip. GDP grew at an annualized rate of 2.1% in the fourth quarter of 2019 and grew 2.3% in 2019 overall.
Consumer spending, the largest driver of the economy, was well supported earlier in this reporting period by low unemployment, wage gains and tax cuts. However, the COVID-19 crisis containment measures drove a significant drop in consumer spending and a sharp rise in unemployment in March and April 2020. The Bureau of Labor Statistics said the unemployment rate rose to 13.3% in May 2020 from 3.6% in May 2019. Although May saw a surprise addition of 2.7 million jobs during the month as economies began to reopen, the combined job losses in March and April exceeded 22 million. The average hourly earnings rate appeared to soar, growing at an annualized rate of 6.5% in May 2020, despite the spike in unemployment. Earnings data were skewed by the concentration of job losses in lower wage work, which effectively eliminated most of the low data, resulting in an average of mostly higher numbers. The overall trend of inflation weakened considerably, which was attributed to large decreases in gasoline, apparel, air travel and lodging prices offsetting an increase in food prices. The Bureau of Labor Statistics said the Consumer Price Index (CPI) increased 0.1% over the twelve-month reporting period ended May 31, 2020 before seasonal adjustment.
Low mortgage rates and low inventory drove home prices moderately higher in this reporting period, although the most recent data do not fully reflect the shutdown. The S&P CoreLogic Case-Shiller U.S. National Home Price Index, which covers all nine U.S. census divisions, was up 4.7% year-over-year in April 2020 (most recent data available at the time this report was prepared). The 10-City and 20-City Composites reported year-over-year increases of 3.4% and 4.0%, respectively.
With economic momentum slowing in 2019 from 2018’s stronger pace, the U.S. Federal Reserve (Fed) left rates unchanged throughout the first half of 2019 then cut rates by 0.25% at each of the July 2019, September 2019 and October 2019 policy committee meetings. Markets registered disappointment with the Fed’s explanation that the rate cuts were a “mid-cycle adjustment,” rather than a prolonged easing period, and its signal that there would be no additional rate cuts in 2019. Also in the latter half of 2019, the Fed announced it would stop shrinking its bond portfolio sooner than scheduled, as well as began buying short-term Treasury bills to help money markets operate smoothly and maintain short-term borrowing rates at low levels. Fed Chairman Powell emphasized that the Treasury bill purchases were not a form of quantitative easing. The Fed continued its Treasury bill buying in January 2020, as well as left its benchmark interest rate unchanged, while noting the emerging coronavirus risks.
As the outbreak spread to the U.S. and significant restrictions on social and economic activity were imposed starting in March 2020, the Fed enacted an array of emergency measures to stabilize the financial system and support the markets, including cutting its main interest rate to near zero, offering lending programs to aid small and large companies and allowing unlimited bond purchases, known as quantitative easing. There were no policy changes at the Fed’s April 2020 meeting, where Chairman Powell reiterated a commitment to keep rates near zero until the economy recovers, and the meeting minutes released during May 2020 underscored the Fed’s concerns about a potentially prolonged economic recovery.
Meanwhile, the U.S. government approved three aid packages, totaling more than $100 billion in funding to health agencies and employers offering paid leave and $2 trillion allocated across direct payments to Americans, an expansion of unemployment insurance, loans to large and small businesses, funding to hospitals and health agencies and support to state and local governments.
While trade and tariff policy drove market sentiment for most of the twelve-month reporting period, the outbreak of the novel coronavirus and its associated disease COVID-19 rapidly dwarfed all other market concerns starting in late February 2020. Equity and commodity markets sold-off and safe-haven assets rallied in March as China, other countries and then the United States initiated quarantines, restricted travel and shuttered factories and businesses. The potential economic shock was particularly difficult to
6
assess, which amplified market volatility. An ill-timed oil price war between the Organization of the Petroleum Exporting Countries (OPEC) and non-OPEC member Russia, which caused oil prices to plunge in March 2020, exacerbated the market sell-off.
Outside the U.S., many countries implemented lockdowns and restrictions on business activity to reduce infection rates, with a deep impact to their economies. Pandemic responses included central bank monetary easing and quantitative easing, fiscal relief programs, the loosening of fiscal rules and, in the case of emerging markets, emergency financing and debt relief from bilateral creditors and international organizations such as the International Monetary Fund and World Bank. The U.K. formally exited the European Union (EU) at the end of January 2020, triggering the one-year transition period, but Brexit talks were temporarily paused during the virus lockdown. When negotiations resumed, the U.K. continued to indicate it would not seek an extension. Italy’s prime minister unexpectedly resigned in August 2019, and the newly formed coalition government appeared to take a less antagonistic stance towards the EU. To help relieve the coronavirus impact on Italy and other more indebted Southern European countries, the European Commission proposed a €750 billion aid program to be funded by all member states, although it is expected to face a bumpy approval process. In Asia, northern countries were among the first to successfully reduce infection rates and relax coronavirus restrictions, but pockets of the disease re-emerged. The widespread anti-government protests roiling Hong Kong throughout 2019 had dissipated amid the lockdown, but tensions flared in late May 2020 when China unexpectedly announced a national security law perceived as a threat to Hong Kong’s sovereignty. India took stringent lockdown steps in March but still saw a rapid increase in cases. Latin American countries entered the health crisis in already weakened positions, with high government debt and widespread civil unrest. Venezuela’s economic and political crisis continued to deepen. Argentina surprised the market with the return of a less market-friendly administration but continued to pursue a restructuring of its debt. Brazil’s Bolsonaro administration achieved a legislative win on pension reform but had not fully delivered on reviving economic growth. As the pandemic spread to Latin America, the inconsistent government responses, reduced testing capabilities, weaker health care systems, food shortages and public protests contributed to accelerating infection and death rates, while the Southern Hemisphere winter is set to begin.
Prior to the virus outbreak, global markets had become more bullish on the outlook for 2020 as trade policy and Brexit appeared to make progress at the end of 2019. The U.S. and China agreed on a partial trade deal, which included rolling back some tariffs, increasing China’s purchases of U.S. agriculture products and the consideration of intellectual property, technology and financial services rights. The “phase one” deal was signed on January 15, 2020. While much of the focus remained on the U.S.-China relationship, trade spats between the U.S. and Mexico, the EU, Brazil and Argentina also arose throughout the reporting period. In January 2020, the U.S. Congress fully approved the U.S., Mexico and Canada Agreement (USMCA), which replaces the North American Free Trade Agreement. With more clarity on trade deals, the trade-related deterioration in global manufacturing and export data was expected to improve. However, the COVID-19 crisis has since upended those assumptions. Furthermore, tensions between the U.S. and China escalated amid the pandemic, with both sides stoking resentment about the management of the health crisis, Hong Kong’s political protests and trade policy.
Despite the severe sell-off in March 2020, municipal bonds managed positive performance over the twelve-month reporting period. For most of the reporting period, a significant decline in interest rates drove municipal bond prices higher, with positive technical and fundamental conditions also supporting credit spread tightening. Prior to the emergence of the novel coronavirus, interest rates had been pressured lower by signs that the economy’s momentum was slowing, a more dovish central bank policy, geopolitical tensions (especially regarding trade) and bouts of equity market volatility. Then, from late February through March 2020, coronavirus risks permeated the markets, sending U.S. Treasury yields to historic lows. Rate volatility increased sharply in that six-week period. As liquidity became stressed, investors began to liquidate any asset possible, including municipal bonds.
7
Portfolio Managers’ Comments (continued)
Municipal bond prices declined rapidly (and yields spiked higher), amid rampant selling across both the high grade and high yield segments that was exacerbated in some cases by exchange-traded fund and closed-end fund selling. Municipal bond prices became severely dislocated from Treasury prices. Credit spreads widened significantly during the March 2020 sell-off, ending the month above their long-term average. Monetary and fiscal interventions from the Fed and U.S. government helped the market recover in April and May, although spreads remain wider than average as of the end of the reporting period. The municipal yield curve steepened over this reporting period, with a pronounced drop in yields at the short end of the curve spearheading the steepening.
Prior to the market turmoil in March 2020, municipal bond gross issuance nationwide had been robust. The overall low level of interest rates encouraged issuers to continue to actively refund their outstanding debt. In these transactions the issuers are issuing new bonds and taking the bond proceeds and redeeming (calling) old bonds. These refunding transactions have ranged from 30% to 60% of total issuance over the past few years. Thus, the net issuance (all bonds issued less bonds redeemed) is actually much lower than the gross issuance. So, while gross issuance volume has been adequate, the net has not and this was an overall positive technical factor on municipal bond investment performance in recent years. Notably, taxable municipal bond issuance has increased meaningfully since the advent of the Tax Cut and Jobs Act of 2017, which prohibits municipal issuers from issuing new tax-exempt bonds to pre-refund existing tax-exempt bonds. However, municipalities have taken advantage of the low interest rate environment and the strong demand for yield to issue taxable municipal debt, enabling them to save on net interest costs while adding to the scarcity value of tax-exempt issues.
Municipal bond funds saw consistently positive cash flows throughout 2019, but demand has been uneven in 2020 so far. Positive flows continued into early 2020, then municipal bond funds suffered significant outflows in March, particularly from high yield municipal bond funds. After the market stabilized in April, fund flows turned positive again in May. With interest rates in the U.S. and globally remaining near all-time lows, the appetite for yield has continued to drive investors toward higher after-tax yielding assets, including U.S. municipal bonds. Additionally, as tax payers have adjusted to the 2017 tax law, which caps the state and local tax (SALT) deduction for individuals, there has been increased demand for tax-exempt municipal bonds, especially in states with high income taxes and/or property taxes.
What were the economic and market conditions in Georgia, Maryland, Massachusetts, Minnesota, Missouri and Virginia during the twelve-month reporting period ended May 31, 2020?
Georgia is the eighth most populous state, with a population of 10.5 million. Population growth has been around 1% annually for more than a decade. Its GDP totaled $616 billion in 2019, ranking ninth among states. Georgia’s economic growth has been robust since 2014, outpacing that of the nation, but has slowed a bit in 2018 and 2019. The state’s GDP growth slowed to 2.0% in 2019 from 2.4% in 2018. Because of the coronavirus pandemic, the economy has already slowed considerably in 2020. As of May 2020, the state’s unemployment rate was 9.7%, compared to 13.3% nationally. The governor declared a public health state of emergency on March 14, 2020 and a shelter in place order on March 23, 2020, which was extended until April 30, 2020 and then allowed to expire. Georgia’s economy began to slowly reopen, but will likely remain weak through the remainder of 2020. The state’s primary economic engine is the Atlanta metropolitan area, which has been adding jobs and attracting businesses in a diverse range of industries. Before the pandemic, construction and the education and health services sectors were among the fastest growing in the state’s economy. Georgia’s per capita personal income is below average and was 85.1% of the U.S. average in 2019. Home prices in the Atlanta region rose 4.5% year-over-year, as of April 2020 (most recent data available at the time this report was prepared), below the national average of 4.7%, according to the S&P CoreLogic Case-Shiller Index. Georgia is the
8
eleventh-largest export state and seventh-largest import state. Because Georgia has a substantial trade and distribution network and is home to large manufacturing and agriculture industries, its economy is at greater risk from ongoing trade tensions or a full-blown trade war. Before the COVID-19 crisis, strong economic growth drove robust revenue growth for Georgia. Net revenue collections of $23.8 billion for fiscal year 2019 were 4.8% higher than for fiscal year 2018. General fund revenue grew 2.1% in the first nine months of fiscal year 2020. After the COVID-19 crisis shutdown, net tax revenues were down 4% (or $858 million), year-over-year, through May 2020. Income taxes are the largest general fund revenue source for Georgia, followed by net sales taxes. They constituted 51% and 26% of total general fund revenue in fiscal year 2019, respectively. The robust revenue growth allowed the state to shore up its rainy day fund, or Revenue Shortfall Reserve (RSR). The RSR grew to $2.8 billion in 2019, or 10.2% of own-source revenue. This, along with expenditure cuts, provides the state with a substantial buffer to help weather the current downturn. The state has yet to finalize its Fiscal Year 2021 budget (Georgia State Fiscal Year End is June 30), but the Georgia Constitution requires the state to maintain a balanced budget. The state’s Senate Appropriations Committee unanimously passed its budget proposal in mid-June, calling for spending cuts of 11%, or $2.6 billion. The deepest proposed spending cut is for more than $1 billion from K-12 public education. Georgia has $10.3 billion of net tax-supported debt outstanding, which represents 2.0% of personal income, and placing it in line with the 2019 Moody’s 50-state median of 2.0% of personal income. Georgia’s pension liabilities are below average, so the state’s combined net debt and net pension liabilities are lower than the majority of states. As of June 2020, Georgia’s general obligation debt continued to be rated Aaa/AAA/AAA with stable outlooks from Moody’s, S&P and Fitch, respectively.
In 2019, Maryland’s gross state product grew 1.5% compared to 2.5% the prior year, dropping its ranking to 35th among all states. Maryland’s economy has historically benefited from its proximity to the nation’s capital through job growth and drawing high income earners as residents. However, the state’s proximity to Washington D.C. means a greater dependency on federal employment than in most states, leaving it vulnerable to future federal cost-cutting. Government employment accounts for 19% of all state employment. Maryland has one of the nation’s best educated workforces, which has facilitated the development of advanced technology and the growth of public and private research facilities. The influence of the government sector and presence of over 50 universities have made Maryland a center for national security and medical and biomedical research. Per capita income within the state is 124% of the U.S. average, and the median home value of $305,000 is 149% of the U.S. median. As of May 2020, the state’s unemployment rate registered 9.9%, which is below the national rate of 13.3%. The state has implemented various financial controls which add stability to its overall financial profile. Among them are five-year budget forecasts, constraining debt maturities to no more than 15 years and restricting debt to no more than 4% of personal income and debt service to within 8% of revenues. The Maryland Constitution also requires the governor to include debt service in annual budget appropriations and the general assembly is prohibited from amending the budget to affect that debt service. Operating results were positive in Fiscal Year 2019 with a net general fund balance increase of $960 million, bringing the general fund balance up to $2.7 billion, and the rainy day balance accounted for $876 million of the balance. Positive performance in Fiscal Year 2019 was largely driven by the increase in personal income tax collections, which were up 6.8% year-over-year. Unfortunately, structural budget gaps persist, and while the state has a strong history of enacting mid-year expenditure cuts to address budgetary shortfalls, it will likely become more challenging in the near future given the impending COVID-19 crisis impact. Recent estimates project the state’s tax revenues could fall between $990 million and $1.1 billion in the current Fiscal Year (Maryland State Fiscal Year End is June 30) and general fund revenues falling by $2.1 billion to $2.6 billion in Fiscal Year 2021. Moody’s May 2020 state debt median report notes that Maryland ranked ninth for net tax-supported debt per capita ($2,323) and fourteenth as a percent of personal income (3.5%). While these figures are above average, the strength of the tax base can support this level of debt. As of May 2020, Moody’s, S&P and Fitch rated Maryland general obligation debt at Aaa/AAA/AAA with stable outlooks.
9
Portfolio Managers’ Comments (continued)
Massachusetts continues to benefit from a highly diverse economy. Biotechnology, pharmaceuticals, finance and software development are increasingly driving the Massachusetts economy, aided by the Commonwealth’s extensive education and health care sectors. Among the 50 states, Massachusetts has the highest percentage of population over 25 with a bachelor’s degree, approximately 43.5%. This compares with the national average of 32.6%. Job growth in Massachusetts is steady, though it does lag the national average. Unemployment in the Commonwealth was 16.3% in May 2020, well above the national average of 13.3%. According to the U.S. Department of Commerce, Bureau of Economic Analysis, Massachusetts’ per capita income is second highest among the 50 states. At $71,683 for calendar year 2018, it is 131.7% of the national average. The Commonwealth’s $43.3 billion Fiscal Year 2020 budget represents a 3.3% increase over the adopted Fiscal Year 2019 budget. The 2020 budget calls for no hikes in sales or income taxes and includes a $476 million deposit into the Commonwealth’s rainy day fund. For the state of Massachusetts, its Fiscal Year end is June 30, 2020. Due to the COVID-19 crisis, the state’s budget will be impacted to a varying degree, as tax receipts are reduced and the expense to fight the virus increases. According to Moody’s, Massachusetts’ debt burden is second highest in the nation (after Connecticut) on a per capita basis ($6,113 versus the median of $1,068) and third highest as a percentage of the state gross domestic product (7.8% versus the median of 2.1%). As of February 2020, Moody’s rated Massachusetts Aa1 with a stable outlook and S&P rated the Commonwealth AA with a stable outlook. S&P downgraded its rating from AA+ to AA on June 9, 2017, citing a reduction in the Commonwealth’s reserve levels.
Minnesota continues to benefit from a highly diverse economy and educated workforce. However, economic growth continues to lag the nation, with Minnesota’s GDP growing 1.4%, ranking it 37th for 2019. Minnesota’s GDP growth was driven by gains in management, finance and professional/technical services. Like the rest of the nation, the state’s unemployment rate increased due to the COVID-19 crisis and was 9.9% as of May 2020. However, it continues to trend lower than the national rate, which was 13.3% for the same time frame. Home prices in the Minneapolis area were up 6.4% year-over-year as of April 2020 (most recent data available at the time this report was prepared), according to the S&P CoreLogic Case-Shiller Index. Minnesota’s budget is on a two-year (biennium) cycle (ending June 30). Prior to the pandemic, the state was expecting a Fiscal Year 2020-2021 biennium budget surplus of $1.5 billion. Due to lower revenues from the COVID-19 crisis, the state is now forecasting a $2.4 billion deficit. Notably, the state’s rainy day funds are at the highest levels ever, approaching $2.8 billion, which provides a sufficient cushion. In addition, the state has received $2.2 billion in federal stimulus funds and also anticipates implementing some expenditure reductions to help balance the budget. Moody’s recently affirmed the state’s Aa1 rating and stable outlook on May 20, 2020. S&P affirmed the state’s AAA rating with stable outlook on July 24, 2019.
Missouri’s economic growth is outpacing its Midwestern peers but continues to lag the nation. After ranking 37th lowest amongst states for GDP growth, the state’s 2019 ranking improved to 25th. The state’s GDP grew 2.1% compared to national GDP growth of 2.3%. The state’s unemployment rate increased to 10.6% due to the COVID-19 crisis, but remains lower than the national rate of 13.3% for May 2020. The state saw growth in the finance and insurance, management, health care and real estate sectors. The Missouri Constitution requires the state to pass a balanced budget. For the remainder of Fiscal Year 2020, the governor cut over $400 million including funding to secondary and higher education, due to revenue declines resulting from the COVID-19 crisis. The Fiscal Year 2021 budget is not yet finalized (its Fiscal Year End is June 30), but the state is preparing to make about $700 million in cuts. Moody’s, S&P and Fitch rate Missouri general obligation debt at Aaa/AAA/AAA and all have stable outlooks.
Virginia’s economy is led by government, professional and business services and its proximity to the Washington D.C. area has historically provided stability in the northern portion of the state. In 2019, the state’s GDP grew 1.9% compared to 2.6% the prior year, moving its ranking down from 13th to 28th among all states. Government employment represents 18.6% of the Commonwealth’s job base (compared to the national average of 15.6%). The defense industry in particular plays an important role
10
in Virginia’s economy, with the Commonwealth’s Hampton Roads area home to the nation’s largest concentration of military installations. As of May 2020, the state’s unemployment rate was 9.4%, which is below the national average of 13.3%. The state continues to benefit from good socioeconomic demographics with per capita income at 116% of the national average, and the median home value of $265,000 is 129% of the U.S. median. According to the S&P/Case-Shiller Index of 20 major metropolitan areas, housing prices in the Washington D.C. area rose 3.8% during the twelve months ended April 2020 (most recent data available at the time this report was prepared). Virginia’s history of both proactive and conservative fiscal management will aid in mitigating the potential magnitude of budgetary pressure stemming from the pandemic. The Commonwealth’s operating revenues are primarily dependent upon income taxes, followed by sales tax collections. With regard to expenditures, education accounts for the greatest amount of operating expenses, followed by health and human services. Operating performance was favorable in Fiscal Year 2019 with general fund revenue growth exceeding projections leading to an approximately $798 million budgetary-basis surplus. Revenue outperformance was largely attributable to growth in collections of non-withholding individual income taxes because of federal tax changes. Strong operating performance continued into Fiscal Year 2020, as revenue collections through March 2020 were up 6.6% over the prior year. Like most states, the positive revenue growth trajectory reversed in May due to the pandemic. May 2020 month-end results indicate revenue collections are down 1.2%, and to reach forecast, June 2020 collections would have to come in at $3.3 billion (versus June 2019 collections of $2.4 billion). Lawmakers plan to reconvene in August 2020 to assess/amend the Fiscal Years 2021 and 2022 revenue projections (its Fiscal Year End is June 30). The Commonwealth’s overall debt metrics are in line with U.S. state averages. Moody’s May 2020 state debt median report notes that Virginia ranked 16th in net tax-supported debt per capita ($1,677) and ranked 19th as a percent of personal income (2.8%). This compares to the U.S. state average net-tax supported debt per capita of $1,506 and average net tax-supported debt as a percentage of personal income at 2.6%. The Commonwealth’s ability to issue debt is controlled through a very complex debt capacity model that is revised on an annual basis. The majority of the Commonwealth’s outstanding debt is subject to appropriation, and only about 9% of outstanding debt carries the general obligation pledge. As of May 2020, Moody’s, S&P and Fitch rated Virginia general obligation debt at Aaa/AAA/AAA with stable outlooks.
What key strategies were used to manage the Funds during the twelve-month reporting period ended May 31, 2020?
Each Fund seeks to provide current income exempt from both regular federal and designated state income taxes by investing primarily in a portfolio of municipal obligations issued by state and local government authorities within a single state or certain U.S. territories. Under normal market conditions, each Fund invests at least 80% of the sum of its net assets and the amount of any borrowings for investment purposes in municipal bonds that pay interest that is exempt from regular federal personal income tax and a single state’s personal income tax. The Funds may invest up to 20% in municipal securities that are exempt from regular federal income tax, but not from that single state’s income tax if, in the portfolio manager’s judgement, such purchases are expected to enhance the Fund’s after-tax total return potential. The Nuveen Minnesota Quality Municipal Income Fund (NMS) may invest only to a lesser extent in bonds not exempt from Minnesota income tax, in order to conform to a requirement imposed by the State of Minnesota that a fund derive at least 95% of its exempt-interest dividends from bonds of issuers located in Minnesota in order for the fund’s dividends to be exempt from those Minnesota income taxes. To the extent that the Fund invests in bonds of municipal issuers located in other states, the Fund’s dividends may not be exempt from state personal income tax.
For most of the reporting period, a favorable macroeconomic backdrop, strong demand, narrowing credit spreads and falling interest rates supported municipal bond performance. However, the COVID-19 crisis and the shutdown of the economy introduced significant uncertainty about the future of economic growth and impact to municipal credit fundamentals. As the nearer-term impacts began to materialize, we looked for relative value and income enhancement opportunities among credits we believe may demonstrate resilience over the long term.
11
Portfolio Managers’ Comments (continued)
The state municipal markets of Maryland, Massachusetts, Minnesota and Virginia outperformed the national market, while the Missouri and Georgia state markets trailed performance of the national market.
We continued to take a bottom-up approach to discovering sectors that appeared undervalued as well as individual credits that we believed had the potential to perform well over the long term. After the market sell-off in March 2020, credit spreads for mid and lower grade bonds widened considerably. Focus shifted to gauging the economic disruptions to municipal issuers over the nearer and longer terms while still attempting to take advantage of potential opportunities. As is often the case when yields rise, a primary emphasis for the Funds since March 2020 involved selling depreciated bonds with lower embedded yields to buy replacement positions at the higher yields now available in the marketplace. This exchanging strategy allows the Funds to take advantage of tax efficiencies and enhances the Funds’ income earnings capability to support the dividend.
NKG’s trading activity was mainly driven by reinvesting the proceeds of called and maturing bonds. In addition to the purchases in the first half of the reporting period (as detailed in the Fund’s November 30, 2019 shareholder report), the Georgia Fund added three high grade local general obligation (GO) bonds, Piedmont Healthcare revenue bonds and marginally added to Puerto Rico sales tax revenue bonds known as COFINAs. Like all debt issued by U.S. territories, COFINA bonds may include exemptions from federal, state and local taxes. There were no notable sales during the reporting period. Toward the end of the reporting period, when credit spreads widened significantly, we pursued opportunities to replace positions one-for-one to embed higher yields in the portfolio and capture tax efficiencies.
In NMY, the Fund bought both high grade and high yield bonds. The majority of Maryland-issued paper is high credit quality, so we took the opportunity to add to the Puerto Rico COFINA bonds on price weakness after the March 2020 sell-off. Prior to that, we bought non-rated credits for Baltimore Harbor Point Project, a mixed use development, and Brunswick Crossing, a residential development. We have been adding to Maryland housing bonds throughout the reporting period. In the health care sector, we bought a new issue for UPMC Health and a BBB rated credit for Adventist Healthcare, where we took advantage of the wide spreads offered on BBB rated bonds. Maryland’s hospital sector has tended to offer incrementally higher yield, which has led to NMY’s heavier exposure there. In the high grade segment, NMY added two longer duration GOs, Anne Arundel County and Washington Sanitation District. Early in the reporting period, we bought Washington D.C. Metropolitan Transit Authority, which are issued in Washington D.C. and tax exempt in Maryland and Virginia. In the final months of the reporting period, we exchanged positions in Mount Saint Mary’s College, Purple Line Transit, Guam Waterworks and COFINA for the same names offering higher yields. NMY’s portfolio duration drifted slightly longer over this reporting period, as bonds matured and we rolled the proceeds into longer dated credits.
NMT bought credits from a number of sectors, including charter schools, local GOs and higher education, with a preference for destination schools such as Worcester Polytechnic and Emerson College. The Fund also added to the Massachusetts Fund’s COFINA position when prices fell to attractive levels later in the reporting period. Buying activity was mainly driven by reinvesting maturity and call proceeds. We also sold some shorter dated paper (maturing in one year or less) to invest in new opportunities.
After Minnesota saw a brief surge in issuance in the first half of the reporting period, our trading by necessity focused for a time on more plain vanilla general obligation credits. However, we did seek to take advantage of higher prevailing yields in the marketplace by engaging in tax loss swaps in a number of lower grade revenue bond credits after the March 2020 volatility in an attempt to capture tax efficiencies and enhance the Fund’s income earnings capability. This involved selling bonds at a loss and reinvesting the proceeds in new positions offering higher yields than the “book” yields on the Fund’s existing holdings, thus harvesting a tax loss we can apply against capital gains in the future. NMS maintained its overweight allocations to health care and higher education and underweight allocations to state GOs.
12
Trading was also relatively light for NOM. In the first half of the reporting period, the purchase of COFINA bonds was the most notable trade, while the second half of the reporting period (other than several insured bond purchases) mainly involved rotating COFINA and several senior living positions into higher yielding, similarly structured bonds of the same name to improve the Fund’s income earnings capability and gain tax advantages.
We added bonds to NPV from a range of sectors and credit qualities. In transportation, we bought a new issue for Metropolitan Washington D.C. Airports Dulles Toll Road and Norfolk Airport Authority revenue bonds. We added a high grade, longer duration, state appropriation credit for Virginia Transportation Board. We looked to increase the Fund’s hospital exposure, especially given the prevailing higher yields on offer. Additions included a new issue for Carilion Clinic Hospital System, a Mercy Health new issue and Arlington Health System revenue bonds. Early in the reporting period, we bought Puerto Rico Aqueduct and Sewer Authority (PRASA) bonds because we liked the prospects for recovery for the Commonwealth generally and for PRASA specifically. To fund our buying, we used the proceeds from maturing and called bonds, and sold some high grade, short dated bonds. The reinvestment of maturing bonds into longer dated securities contributed to a marginal lengthening in the portfolio’s duration. We also sold and bought replacement bonds of the same name for the Dulles Toll Road, COFINA, Guam Waterworks and I-66 Express Mobility Partners positions to rebook them at higher yields, which helps support the Fund’s dividend capability.
As of May 31, 2020, NKG, NMY, NMT, NOM and NPV continued to use inverse floating rate securities. We employ inverse floaters for a variety of reasons, including duration management, income enhancement and total return enhancement.
How did the Funds perform during the twelve-month reporting period ended May 31, 2020?
The tables in each Fund’s Performance Overview and Holding Summaries section of this report provide the Funds’ total returns for the one-year, five-year and ten-year periods ended May 31, 2020. Each Fund’s total returns at common share net asset value (NAV) are compared with the performance of corresponding market indexes.
For the twelve-month reporting period ended May 31, 2020, the total return at common share NAV for NMY, NMT, NMS, NOM and NPV underperformed their respective state’s S&P Municipal Bond Index and the national S&P Municipal Bond Index, while NKG outperformed the S&P Municipal Bond Georgia Index and performed in line with the national index.
The Funds’ performance was affected by duration and yield curve positioning, credit ratings allocations, sector allocations and credit selection. In addition, the use of regulatory leverage was a factor affecting performance of the Funds. Leverage is discussed in more detail later in the Fund Leverage section of this report.
Municipal bond yields ended the reporting period lower than where they began, despite a dramatic increase in March. Longer duration bonds generally outperformed in this reporting period, providing a tailwind to the Funds’ overweight positioning in the longer end of the spectrum. NKG was most helped by overweight allocations to durations of 12 years and longer and to 6- to 8-year durations. In NMY, an overweight allocation to the 8- to 12-year duration segment detracted, but yield curve and duration positioning had a minimal impact on performance overall. NMT benefited from an underweight position in 6 years and shorter durations and an overweight to 8 years and longer, despite an unfavorable overweight allocation to the 6- to 8-year duration segment. Yield curve and duration positioning in NMS and NOM was not a meaningful performance driver in this reporting period. NPV’s overweight to longer duration bonds was a positive contributor overall. However, gains were tempered by the credit sensitivity of NPV’s longer duration holdings, which were negatively impacted by the spread widening during the coronavirus sell-off.
13
Portfolio Managers’ Comments (continued)
From a credit ratings perspective, the disproportionate credit spread widening among mid and lower rated (including high yield and non-rated) bonds in March contributed to their underperformance over the reporting period as a whole, while high grade (AAA and AA rated) paper outperformed. NKG’s credit quality positioning was a small positive contributor. The Georgia Fund’s overweight to AA rated credits was advantageous, but the gain was partially offset by an underweight to AAA rated bonds, the stronger performing of the two highest grades. NKG also benefited from an underweight to the BB rated segment, which under-performed. NMY’s overweight allocations to BBB rated bonds and its high yield allocation, which included overweights to BB rated and non-rated credits, were disadvantageous in this reporting period. The Maryland Fund’s underweight to high grade (AAA and AA rated) bonds also detracted. NMT’s credit ratings allocation was a large detractor from performance due to an underweight allocation to AAA rated paper and overweight allocations to single A and lower rated bonds. However, the Massachusetts Fund did hold an overweight to AA rated bonds that contributed positively. For NMS and NOM, credit quality positioning was the main driver of relative underperformance, with overweight allocations to single A, BBB and BB rated bonds and underweights to high grade bonds detracting. The Minnesota and Missouri Funds’ overweight to non-rated credits also weighed on performance, largely due to the underperformance of non-rated senior living bonds. NPV’s overweight to BBB rated bonds was detrimental to performance, as was its high yield allocation, where it held a significant overweight to BB rated credits. The Virginia Fund’s underweight to AAA rated bonds also detracted from performance.
Sector performance was strongly influenced by the March 2020 disruption in the markets. Although spreads began to narrow again in April and May 2020, the recovery was uneven. Sectors with a greater concentration of high grade bonds, such as the state and local GO and pre-refunded sectors, rebounded to a greater degree than lower rated, higher yielding sectors. In particular, sectors perceived to have more exposure to coronavirus impacts such as hospitals, senior living/life care facilities, higher education and those with exposure to hospitality, leisure and sales taxes, were among the weakest performing areas in this reporting period.
NKG’s sector allocations were a positive contributor overall. An underweight to New York Metropolitan Transportation Authority bonds, was advantageous, as the sector underperformed. An overweight to the public power sector also added to relative gains.
In NMY, an overweight to the health care sector was a large detractor from relative performance, due to the weak performance of hospital credits. An underweight to the tax supported sector also dampened performance, and some of the Fund’s land-backed project finance bonds came under increased selling pressure. However, NMY’s exposure to the tobacco settlement sector (where it owns out of state tobacco bonds because Maryland does not offer any) contributed positively to performance.
NMT’s sector positioning detracted from performance. Although the Fund was less exposed (via an underweight allocation) to the sector’s relatively strong performance compared to the benchmark, our selection of longer duration state GOs outperformed, as high quality, long duration bonds generally performed better than the market in this reporting period. Among the other tax supported subsectors, the Fund’s underweight to local GOs detracted and an equal weight in dedicated tax bonds had a neutral impact on relative performance. Elsewhere, the overweight allocations to the higher education and health care sectors dampened relative performance, while an underweight to the transportation sector, especially airports, was beneficial.
NMS’s overweight allocation to hospitals detracted, and our security selection within the sector emphasized mid- and lower grade, higher yielding hospital credits, which underperformed. An underweight exposure to GOs and an overweight to charter schools also detracted. However, the underweight to the transportation sector, including airports, helped performance.
14
The main sector detractors for NOM included an underweight allocation to state and local GOs and overweight allocations to hospitals and senior living/life care facilities. NOM also held several special tax district bonds that suffered credit spread widening on concerns about diminishing retail sales activity and the longer-term impacts of the COVID-19 crisis. Missouri issues these special tax district bonds to finance infrastructure for commercial development districts, which are backed by taxes or payments based on the economic activity generated by the development, e.g. sales taxes, property taxes or payments in lieu of taxes.
NPV holds a large overweight in the transportation sector, which was unfavorable to performance in this reporting period. Virginia is a heavy issuer of toll road bonds, and NPV holds several large toll road positions that offer incremental yield for their lower credit ratings. Toll road bonds’ performance suffered along with the transportation sector broadly. However, while airports were granted access to federal aid, which helped their bonds stabilize, toll roads have not yet been recipients of federal relief. An overweight to hospitals and underweight to tax supported bonds also detracted from performance.
On an individual credit selection basis, NKG benefited from its tender option bond (TOB) positions, as well as bonds with higher credit quality and longer durations. Conversely, positions in dedicated tax bonds supported by narrow revenue streams, especially those with exposure to the hospitality and leisure industries and sales taxes, performed poorly. NMY’s largest contributor was Western Maryland Health System, a large position that was advance refunded during the reporting period. NMY’s holdings in out of state tobacco settlement bonds were also positive contributors, as were its TOB positions. However, the Maryland Purple Line, a public-private partnership connecting Maryland’s Washington D.C. suburbs to the capital’s rail system, was among the weaker performing holdings in NMY. The project is dealing with legal issues, cost overruns and funding questions, as well as the coron-avirus impact on public transportation and a credit ratings downgrade to below investment grade. NMY also saw weak performance from Baltimore Convention Center, which was under near-term stress because the bonds are partly backed by hotel usage taxes and were also downgraded to below investment grade. Although NMY has a small weighting in senior living/life care facility bonds, near-term coronavirus risks weighed on the group. However, we believe the long-term story remains intact and the fundamentals of the positions held in the Fund continue to look strong. NPV’s top contributing securities included Hampton Roads Sanitation Waste (which was advance refunded during the reporting period), TOBs (including Hampton Roads Transportation Accountability Commission and University of Virginia) and Virginia tobacco settlement bonds.
15
IMPACT OF THE FUNDS’ LEVERAGE STRATEGIES ON PERFORMANCE
One important factor impacting the returns of the Funds’ common shares relative to their comparative benchmarks was the Funds’ use of leverage. The Funds obtain leverage through the issuance of preferred shares and/or investments in inverse floating rate securities, which represent a leveraged investment in an underlying bond.
The Funds primarily utilize leverage in order to generate incremental income. The Funds are able to do so by earning a greater amount of interest on additional higher yielding long-term bond investments than its associated leverage expense, which is typically based upon short-term rates. This has been particularly true in recent market environments where short-term rates have been low by historical standards. Common share income in leveraged funds will typically decrease in comparison to unleveraged funds when short-term rates increase and increase when short-term rates decrease.
In return for the opportunity of higher incremental income, the Funds’ common shareholders assume additional price variability, so their net asset value will be more volatile. Common shareholders will experience a greater increase in their net asset value due to leverage if the municipal bonds acquired through the use of leverage increase in value, but correspondingly will have a greater decline in their net asset value if the bonds acquired through leverage decline in price.
Management believes that the potential benefit from leverage continues to outweigh the associated risk of loss from increased price variability as previously described. Historically, over almost all longer periods of time, incremental income derived from leverage has more than offset any negative impact on net asset value due to the added price variability caused by leverage, in which cases leverage has resulted in higher total returns. However, during shorter time periods, increased losses due to this added price variability can equal or exceed any incremental income so that, when compared to an unleveraged fund, leverage may reduce total returns during the period.
During the recent reporting period, leverage had a positive impact on the total return performance of NKG. Leverage had a negative impact on the total return performance of NMY, NMS and NOM and a negligible impact on the total return performance of NMT and NPV. Over the first nine months of the reporting period the total return performance for each Fund was aided by not only the incremental income from leverage, but also an amplification of the modest price appreciation of its underlying bond portfolio. However, beginning of the second week of March, the overall municipal market experienced a severe sell-off due to the COVID-19 economic shutdown. The Funds’ leverage amplified these market declines, and in the case of NMY, NMS and NOM, those amplified declines more than offset leverage’s favorable impact on the prior months’ net asset value appreciation and incremental income.
During this period of sharp portfolio value decline, each Fund’s effective leverage ratio increased. None of the Funds were forced to reduce leverage during this period, however, and as markets began to somewhat recover, albeit in fits and starts, starting in the last days of March and through May, leverage again worked in each Fund’s favor. That recovery also caused the Funds’ respective leverage ratios to decline.
Despite the significant negative impact of leverage toward the end of the reporting period, management continues to believe that over the longer term leverage for each Fund will continue to enhance both net income and total return prospects. We point to the strong since inception returns of the Funds compared to their unlevered benchmark index, shown on ensuing pages, which results encompass the negative impact of leverage during March and April of 2020.
16
As of May 31, 2020, the Funds’ percentages of leverage are as shown in the accompanying table.
| | | | | | | |
| NKG | NMY | NMT | NMS | NOM | NPV |
Effective Leverage* | 34.99% | 38.80% | 37.32% | 38.14% | 36.76% | 36.39% |
Regulatory Leverage* | 28.73% | 35.42% | 35.14% | 38.14% | 36.00% | 33.05% |
* Effective Leverage is a Fund’s effective economic leverage, and includes both regulatory leverage and the leverage effects of certain derivative and other investments in a Fund’s portfolio that increase the Fund’s investment exposure. Currently, the leverage effects of Tender Option Bond (TOB) inverse floater holdings are included in effective leverage values, in addition to any regulatory leverage. Regulatory leverage consists of preferred shares issued or borrowings of a Fund. Both of these are part of a Fund’s capital structure. A Fund, however, may from time to time borrow on a typically transient basis in connection with its day-to-day operations, primarily in connection with the need to settle portfolio trades. Such incidental borrowings are excluded from the calculation of a Fund’s effective leverage ratio. Regulatory leverage is subject to asset coverage limits set forth in the Investment Company Act of 1940.
THE FUNDS’ REGULATORY LEVERAGE
As of May 31, 2020, the Funds have issued and outstanding preferred shares as shown in the accompanying table.
| | | | | | | | | | |
| | | | | Variable Rate | | | | |
| | Variable Rate | | | Remarketed | | | | |
| | Preferred* | | | Preferred** | | | | |
| | Shares Issued at | | | Shares Issued at | | | | |
| | Liquidation Preference | | | Liquidation Preference | | | Total | |
NKG | | $ | 58,500,000 | | | $ | — | | | $ | 58,500,000 | |
NMY | | $ | 182,000,000 | | | $ | — | | | $ | 182,000,000 | |
NMT | | $ | 74,000,000 | | | $ | — | | | $ | 74,000,000 | |
NMS | | $ | 52,800,000 | | | $ | — | | | $ | 52,800,000 | |
NOM | | $ | 18,000,000 | | | $ | — | | | $ | 18,000,000 | |
NPV | | $ | 128,000,000 | | | $ | — | | | $ | 128,000,000 | |
* Preferred shares of the Fund featuring a floating rate dividend based on a predetermined formula or spread to an index rate. Includes the following preferred shares AMTP, iMTP, MFP-VRM and VRDP in Special Rate Mode, where applicable. See Notes to Financial Statements, Note 5 – Fund Shares for further details.
** Preferred shares of the Fund featuring floating rate dividends set by a remarketing agent via a regular remarketing. Includes the following preferred shares VRDP not in Special Rate Mode, MFP-VRRM and MFP-VRDM, where applicable. See Notes to Financial Statements, Note 5 – Fund Shares for further details.
Refer to Notes to Financial Statements, Note 5 – Fund Shares for further details on preferred shares and each Fund’s respective transactions.
17
COMMON SHARE DISTRIBUTION INFORMATION
The following information regarding the Funds’ distributions is current as of May 31, 2020. Each Fund’s distribution levels may vary over time based on each Fund’s investment activity and portfolio investments value changes.
During the current reporting period, each Fund’s distributions to common shareholders were as shown in the accompanying table.
| | | | | | | |
| | Per Common Share Amounts |
| Month Distributions (Ex-Dividend Date) | NKG | NMY | NMT | NMS | NOM | NPV |
June 2019 | $0.0370 | $0.0440 | $0.0410 | $0.0490 | $0.0430 | $0.0435 |
July | 0.0370 | 0.0440 | 0.0410 | 0.0490 | 0.0430 | 0.0435 |
August | 0.0370 | 0.0440 | 0.0410 | 0.0490 | 0.0430 | 0.0435 |
September | 0.0370 | 0.0440 | 0.0410 | 0.0490 | 0.0430 | 0.0435 |
October | 0.0370 | 0.0440 | 0.0410 | 0.0490 | 0.0430 | 0.0435 |
November | 0.0370 | 0.0440 | 0.0410 | 0.0490 | 0.0430 | 0.0435 |
December | 0.0370 | 0.0440 | 0.0410 | 0.0490 | 0.0405 | 0.0435 |
January | 0.0370 | 0.0440 | 0.0410 | 0.0490 | 0.0405 | 0.0435 |
February | 0.0370 | 0.0440 | 0.0410 | 0.0490 | 0.0405 | 0.0435 |
March | 0.0370 | 0.0440 | 0.0410 | 0.0445 | 0.0360 | 0.0435 |
April | 0.0370 | 0.0440 | 0.0410 | 0.0445 | 0.0360 | 0.0435 |
May 2020 | 0.0400 | 0.0485 | 0.0445 | 0.0445 | 0.0360 | 0.0470 |
| Total Distributions from Net Investment Income | $0.4470 | $0.5325 | $0.4955 | $0.5745 | $0.4875 | $0.5255 |
| |
| Yields | | | | | | |
Market Yield* | 4.01% | 4.61% | 4.06% | 3.94% | 2.97% | 4.21% |
Taxable-Equivalent Yield* | 7.44% | 8.56% | 7.47% | 7.99% | 5.49% | 7.85% |
* Market Yield is based on the Fund’s current annualized monthly dividend divided by the Fund’s current market price as of the end of the reporting period. Taxable-Equivalent Yield represents the yield that must be earned on a fully taxable investment in order to equal the yield of the Fund on an after-tax basis. It is based on a combined federal and state income tax rate of 46.6%, 46.6%, 45.8%, 50.7%, 46.2% and 46.6% for NKG, NMY, NMT, NMS, NOM and NPV, respectively. Your actual combined federal and state income tax rate may differ from the assumed rate. The Taxable-Equivalent Yield also takes into account the percentage of the Fund’s income generated and paid by the Fund (based on payments made during the previous calendar year) that was either exempt from federal income tax but not from state income tax (e.g., income from an out-of-state municipal bond), or was exempt from neither federal nor state income tax. Separately, if the comparison were instead to investments that generate qualified dividend income, which is taxable at a rate lower than an individual’s ordinary graduated tax rate, the fund’s Taxable-Equivalent Yield would be lower.
Each Fund seeks to pay regular monthly dividends out of its net investment income at a rate that reflects its past and projected net income performance. To permit each Fund to maintain a more stable monthly dividend, the Fund may pay dividends at a rate that may be more or less than the amount of net income actually earned by the Fund during the period. Distributions to common shareholders are determined on a tax basis, which may differ from amounts recorded in the accounting records. In instances where the monthly dividend exceeds the earned net investment income, the Fund would report a negative undistributed net ordinary income. Refer to Note 6 – Income Tax Information for additional information regarding the amounts of undistributed net ordinary income and undistributed net long-term capital gains and the character of the actual distributions paid by the Fund during the period.
All monthly dividends paid by each Fund during the current reporting period were paid from net investment income. If a portion of the Fund’s monthly distributions is sourced or comprised of elements other than net investment income, including capital gains and/or a return of capital, shareholders will be notified of those sources. For financial reporting purposes, the per share amounts of each Fund’s distributions for the reporting period are presented in this report’s Financial Highlights. For income tax purposes, distribution information for each Fund as of its most recent tax year end is presented in Note 6 – Income Tax Information within the Notes to Financial Statements of this report.
18
NUVEEN CLOSED-END FUND DISTRIBUTION AMOUNTS
The Nuveen Closed-End Funds’ monthly and quarterly periodic distributions to shareholders are posted on www.nuveen.com and can be found on Nuveen’s enhanced closed-end fund resource page, which is at https://www.nuveen.com/resource-center-closed-end-funds, along with other Nuveen closed-end fund product updates. To ensure timely access to the latest information, shareholders may use a subscribe function, which can be activated at this web page (https://www.nuveen.com/subscriptions).
COMMON SHARE REPURCHASES
During August 2019, the Funds’ Board of Trustees reauthorized an open-market share repurchase program, allowing each Fund to repurchase an aggregate of up to approximately 10% of its outstanding shares.
As of May 31, 2020, and since the inception of the Funds’ repurchase programs, the Funds have cumulatively repurchased and retired their outstanding common shares as shown in the accompanying table.
| | | | | | | |
| NKG | NMY | NMT | NMS | NOM | NPV |
Common shares cumulatively repurchased and retired | 149,500 | 1,005,000 | 26,148 | 10,000 | — | 55,000 |
Common shares authorized for repurchase | 1,040,000 | 2,310,000 | 930,000 | 580,000 | 235,000 | 1,790,000 |
During the current reporting period, the Funds did not repurchase any of their outstanding common shares.
OTHER COMMON SHARE INFORMATION
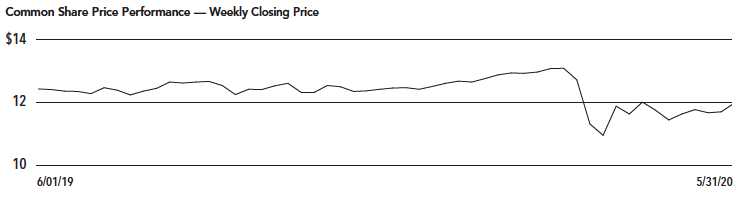
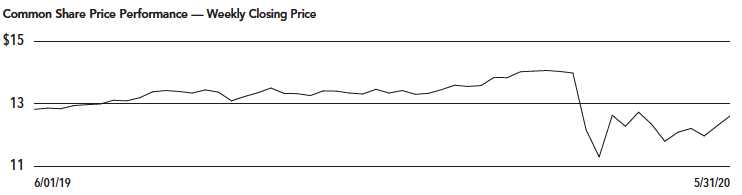
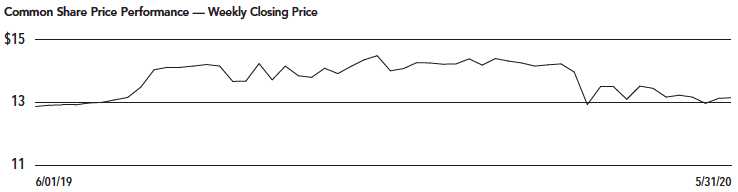
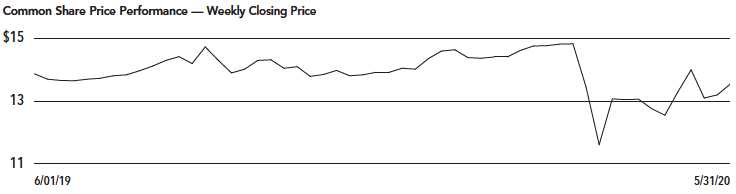
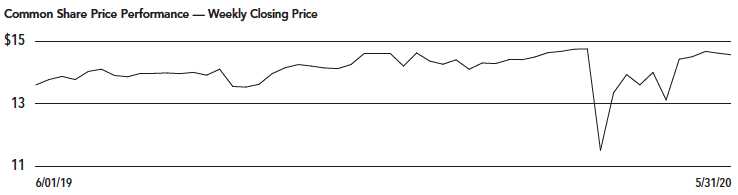
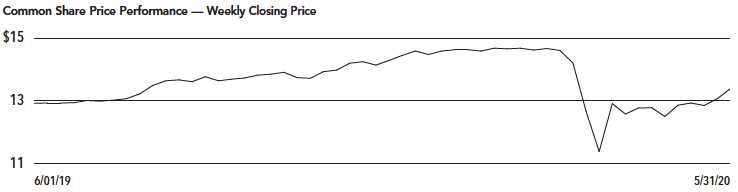
As of May 31, 2020, and during the current reporting period, the Funds’ common share prices were trading at a premium/(discount) to their common share NAVs as shown in the accompanying table.
| | | | | | | | | | | | | | | | | | | |
| | NKG | | | NMY | | | NMT | | | NMS | | | NOM | | | NPV | |
Common share NAV | | $ | 13.95 | | | $ | 14.37 | | | $ | 14.65 | | | $ | 14.81 | | | $ | 13.64 | | | $ | 14.51 | |
Common share price | | $ | 11.98 | | | $ | 12.62 | | | $ | 13.15 | | | $ | 13.55 | | | $ | 14.56 | | | $ | 13.40 | |
Premium/(Discount) to NAV | | | (14.12 | )% | | | (12.18 | )% | | | (10.24 | )% | | | (8.51 | )% | | | 6.74 | % | | | (7.65 | )% |
12-month average premium/(discount) to NAV | | | (12.05 | )% | | | (12.06 | )% | | | (7.54 | )% | | | (8.66 | )% | | | 1.51 | % | | | (7.85 | )% |
19
Risk Considerations
Fund shares are not guaranteed or endorsed by any bank or other insured depository institution, and are not federally insured by the Federal Deposit Insurance Corporation.
Nuveen Georgia Quality Municipal Income Fund (NKG)
Investing in closed-end funds involves risk; principal loss is possible. There is no guarantee the Fund’s investment objectives will be achieved. Closed-end fund shares may frequently trade at a discount or premium to their net asset value. Debt or fixed income securities such as those held by the Fund, are subject to market risk, credit risk, interest rate risk, derivatives risk, liquidity risk, and income risk. As interest rates rise, bond prices fall. Leverage increases return volatility and magnifies the Fund’s potential return and its risks; there is no guarantee a fund’s leverage strategy will be successful. State concentration makes the Fund more susceptible to local adverse economic, political, or regulatory changes affecting municipal bond issuers. These and other risk considerations such as inverse floater risk and tax risk are described in more detail on the Fund’s web page at www.nuveen.com/NKG.
Nuveen Maryland Quality Municipal Income Fund (NMY)
Investing in closed-end funds involves risk; principal loss is possible. There is no guarantee the Fund’s investment objectives will be achieved. Closed-end fund shares may frequently trade at a discount or premium to their net asset value. Debt or fixed income securities such as those held by the Fund, are subject to market risk, credit risk, interest rate risk, derivatives risk, liquidity risk, and income risk. As interest rates rise, bond prices fall. Leverage increases return volatility and magnifies the Fund’s potential return and its risks; there is no guarantee a fund’s leverage strategy will be successful. State concentration makes the Fund more susceptible to local adverse economic, political, or regulatory changes affecting municipal bond issuers. These and other risk considerations such as inverse floater risk and tax risk are described in more detail on the Fund’s web page at www.nuveen.com/NMY.
Nuveen Massachusetts Quality Municipal Income Fund (NMT)
Investing in closed-end funds involves risk; principal loss is possible. There is no guarantee the Fund’s investment objectives will be achieved. Closed-end fund shares may frequently trade at a discount or premium to their net asset value. Debt or fixed income securities such as those held by the Fund, are subject to market risk, credit risk, interest rate risk, derivatives risk, liquidity risk, and income risk. As interest rates rise, bond prices fall. Leverage increases return volatility and magnifies the Fund’s potential return and its risks; there is no guarantee a fund’s leverage strategy will be successful. State concentration makes the Fund more susceptible to local adverse economic, political, or regulatory changes affecting municipal bond issuers. These and other risk considerations such as inverse floater risk and tax risk are described in more detail on the Fund’s web page at www.nuveen.com/NMT.
Nuveen Minnesota Quality Municipal Income Fund (NMS)
Investing in closed-end funds involves risk; principal loss is possible. There is no guarantee the Fund’s investment objectives will be achieved. Closed-end fund shares may frequently trade at a discount or premium to their net asset value. Debt or fixed income securities such as those held by the Fund, are subject to market risk, credit risk, interest rate risk, derivatives risk, liquidity risk, and income risk. As interest rates rise, bond prices fall. Leverage increases return volatility and magnifies the Fund’s potential return
20
and its risks; there is no guarantee a fund’s leverage strategy will be successful. State concentration makes the Fund more susceptible to local adverse economic, political, or regulatory changes affecting municipal bond issuers. These and other risk considerations such as inverse floater risk and tax risk are described in more detail on the Fund’s web page at www.nuveen.com/NMS.
Nuveen Missouri Quality Municipal Income Fund (NOM)
Investing in closed-end funds involves risk; principal loss is possible. There is no guarantee the Fund’s investment objectives will be achieved. Closed-end fund shares may frequently trade at a discount or premium to their net asset value. Debt or fixed income securities such as those held by the Fund, are subject to market risk, credit risk, interest rate risk, derivatives risk, liquidity risk, and income risk. As interest rates rise, bond prices fall. Leverage increases return volatility and magnifies the Fund’s potential return and its risks; there is no guarantee a fund’s leverage strategy will be successful. State concentration makes the Fund more susceptible to local adverse economic, political, or regulatory changes affecting municipal bond issuers. These and other risk considerations such as inverse floater risk and tax risk are described in more detail on the Fund’s web page at www.nuveen.com/NOM.
Nuveen Virginia Quality Municipal Income Fund (NPV)
Investing in closed-end funds involves risk; principal loss is possible. There is no guarantee the Fund’s investment objectives will be achieved. Closed-end fund shares may frequently trade at a discount or premium to their net asset value. Debt or fixed income securities such as those held by the Fund, are subject to market risk, credit risk, interest rate risk, derivatives risk, liquidity risk, and income risk. As interest rates rise, bond prices fall. Leverage increases return volatility and magnifies the Fund’s potential return and its risks; there is no guarantee a fund’s leverage strategy will be successful. State concentration makes the Fund more susceptible to local adverse economic, political or regulatory changes affecting municipal bond issuers. These and other risk considerations such as inverse floater risk and tax risk are described in more detail on the Fund’s web page at www.nuveen.com/NPV.
21
| | |
| NKG | Nuveen Georgia Quality Municipal Income Fund Performance Overview and Holding Summaries as of May 31, 2020 |
| | | | |
Refer to the Glossary of Terms Used in this Report for further definition of the terms used within this section.
|
| Average Annual Total Returns as of May 31, 2020 |
|
| Average Annual |
| 1-Year | 5-Year | 10-Year |
NKG at Common Share NAV | 3.90% | 3.84% | 4.19% |
NKG at Common Share Price | (0.33)% | 2.84% | 3.06% |
S&P Municipal Bond Georgia Index | 3.75% | 3.29% | 3.82% |
S&P Municipal Bond Index | 3.87% | 3.68% | 4.20% |
Past performance is not predictive of future results. Current performance may be higher or lower than the data shown. Returns do not reflect the deduction of taxes that shareholders may have to pay on Fund distributions or upon the sale of Fund shares. Returns at NAV are net of Fund expenses, and assume reinvestment of distributions. Comparative index return information is provided for the Fund’s shares at NAV only. Indexes are not available for direct investment.
22
This data relates to the securities held in the Fund’s portfolio of investments as of the end of the reporting period. It should not be construed as a measure of performance for the Fund itself. Holdings are subject to change.
For financial reporting purposes, the ratings disclosed are the highest rating given by one of the following national rating agencies: Standard & Poor’s Group, Moody’s Investors Service, Inc. or Fitch, Inc. This treatment of split-rated securities may differ from that used for other purposes, such as for Fund investment policies. Credit ratings are subject to change. AAA, AA, A and BBB are investment grade ratings; BB, B, CCC, CC, C and D are below-investment grade ratings. Holdings designated N/R are not rated by these national rating agencies.
| | |
| Fund Allocation | |
| (% of net assets) | |
Long-Term Municipal Bonds | 151.3% |
Short-Term Municipal Bonds | 0.1% |
Other Assets Less Liabilities | 2.4% |
| Net Assets Plus Floating Rate Obligations | |
| & AMTP Shares, net of deferred | |
| offering costs | 153.8% |
Floating Rate Obligations | (13.5)% |
AMTP Shares, net of deferred | |
offering costs | (40.3)% |
| Net Assets | 100% |
| | |
| States and Territories | |
| (% of total municipal bonds) | |
Georgia | 89.9% |
Florida | 2.5% |
West Virginia | 1.8% |
Colorado | 1.5% |
Puerto Rico | 1.4% |
Illinois | 1.2% |
Nevada | 1.0% |
Washington | 0.7% |
| Total | 100% |
| | |
| Portfolio Composition | |
| (% of total investments) | |
Tax Obligation/General | 21.2% |
Tax Obligation/Limited | 16.9% |
Water and Sewer | 14.9% |
Health Care | 11.7% |
Utilities | 10.8% |
Education and Civic Organizations | 10.4% |
Transportation | 7.1% |
U.S. Guaranteed | 6.4% |
Other | 0.6% |
| Total | 100% |
| | |
| Portfolio Credit Quality | |
| (% of total investment exposure) | |
U.S. Guaranteed | 4.6% |
AAA | 8.2% |
AA | 60.8% |
A | 16.7% |
BBB | 7.6% |
N/R (not rated) | 2.1% |
| Total | 100% |
23
| | |
| NMY | Nuveen Maryland Quality Municipal Income Fund Performance Overview and Holding Summaries as of May 31, 2020 |
| | | | |
Refer to the Glossary of Terms Used in this Report for further definition of the terms used within this section.
|
| Average Annual Total Returns as of May 31, 2020 |
|
| Average Annual |
| 1-Year | 5-Year | 10-Year |
NMY at Common Share NAV | 0.55% | 3.85% | 4.30% |
NMY at Common Share Price | 2.73% | 4.92% | 3.67% |
S&P Municipal Bond Maryland Index | 4.31% | 3.29% | 3.59% |
S&P Municipal Bond Index | 3.87% | 3.68% | 4.20% |
Past performance is not predictive of future results. Current performance may be higher or lower than the data shown. Returns do not reflect the deduction of taxes that shareholders may have to pay on Fund distributions or upon the sale of Fund shares. Returns at NAV are net of Fund expenses, and assume reinvestment of distributions. Comparative index return information is provided for the Fund’s shares at NAV only. Indexes are not available for direct investment.
24
This data relates to the securities held in the Fund’s portfolio of investments as of the end of the reporting period. It should not be construed as a measure of performance for the Fund itself. Holdings are subject to change.
For financial reporting purposes, the ratings disclosed are the highest rating given by one of the following national rating agencies: Standard & Poor’s Group, Moody’s Investors Service, Inc. or Fitch, Inc. This treatment of split-rated securities may differ from that used for other purposes, such as for Fund investment policies. Credit ratings are subject to change. AAA, AA, A and BBB are investment grade ratings; BB, B, CCC, CC, C and D are below-investment grade ratings. Holdings designated N/R are not rated by these national rating agencies.
| | |
| Fund Allocation | |
| (% of net assets) | |
Long-Term Municipal Bonds | 158.8% |
Other Assets Less Liabilities | 4.6% |
| Net Assets Plus Floating Rate Obligations | |
| & AMTP Shares, net of deferred | |
| offering costs | 163.4% |
Floating Rate Obligations | (8.6)% |
AMTP Shares, net of deferred | |
offering costs | (54.8)% |
| Net Assets | 100% |
| | |
| States and Territories | |
| (% of total municipal bonds) | |
Maryland | 80.9% |
Guam | 4.5% |
Puerto Rico | 3.8% |
California | 3.1% |
Virgin Islands | 2.0% |
District of Columbia | 1.9% |
New York | 1.6% |
Texas | 0.5% |
New Jersey | 0.5% |
Virginia | 0.4% |
Pennsylvania | 0.4% |
Ohio | 0.4% |
Alaska | 0.0% |
| Total | 100% |
| | |
| Portfolio Composition | |
| (% of total investments) | |
Tax Obligation/Limited | 21.5% |
Health Care | 19.6% |
U.S. Guaranteed | 9.6% |
Transportation | 8.1% |
Tax Obligation/General | 6.9% |
Education and Civic Organizations | 5.6% |
Housing/Multifamily | 5.6% |
Water and Sewer | 5.6% |
Long-Term Care | 5.4% |
Other | 12.1% |
| Total | 100% |
| | |
| Portfolio Credit Quality | |
| (% of total investment exposure) | |
U.S. Guaranteed | 9.7% |
AAA | 5.0% |
AA | 28.9% |
A | 24.1% |
BBB | 11.6% |
BB or Lower | 9.4% |
N/R (not rated) | 11.3% |
| Total | 100% |
25
| | |
| NMT | Nuveen Massachusetts Quality Municipal Income Fund Performance Overview and Holding Summaries as of May 31, 2020 |
| | | | |
Refer to the Glossary of Terms Used in this Report for further definition of the terms used within this section.
|
| Average Annual Total Returns as of May 31, 2020 |
|
| Average Annual |
| 1-Year | 5-Year | 10-Year |
NMT at Common Share NAV | 2.83% | 4.15% | 4.83% |
NMT at Common Share Price | 6.14% | 4.51% | 3.68% |
S&P Municipal Bond Massachusetts Index | 4.58% | 3.58% | 3.92% |
S&P Municipal Bond Index | 3.87% | 3.68% | 4.20% |
Past performance is not predictive of future results. Current performance may be higher or lower than the data shown. Returns do not reflect the deduction of taxes that shareholders may have to pay on Fund distributions or upon the sale of Fund shares. Returns at NAV are net of Fund expenses, and assume reinvestment of distributions. Comparative index return information is provided for the Fund’s shares at NAV only. Indexes are not available for direct investment.
26
This data relates to the securities held in the Fund’s portfolio of investments as of the end of the reporting period. It should not be construed as a measure of performance for the Fund itself. Holdings are subject to change.
For financial reporting purposes, the ratings disclosed are the highest rating given by one of the following national rating agencies: Standard & Poor’s Group, Moody’s Investors Service, Inc. or Fitch, Inc. This treatment of split-rated securities may differ from that used for other purposes, such as for Fund investment policies. Credit ratings are subject to change. AAA, AA, A and BBB are investment grade ratings; BB, B, CCC, CC, C and D are below investment grade ratings. Holdings designated N/R are not rated by these national rating agencies.
| | |
| Fund Allocation | |
| (% of net assets) | |
Long-Term Municipal Bonds | 150.8% |
Other Assets Less Liabilities | 3.2% |
| Net Assets Plus VRDP Shares, | |
| net of deferred offering costs | 154.0% |
VRDP Shares, net of deferred | |
| offering costs | (54.0)% |
| Net Assets | 100% |
| | |
| States and Territories | |
| (% of total municipal bonds) | |
Massachusetts | 93.8% |
Guam | 3.5% |
Puerto Rico | 1.9% |
Virgin Islands | 0.8% |
| Total | 100% |
| | |
| Portfolio Composition | |
| (% of total investments) | |
Education and Civic Organizations | 30.4% |
Health Care | 20.9% |
Tax Obligation/Limited | 12.9% |
Tax Obligation/General | 12.8% |
U.S. Guaranteed | 8.4% |
Transportation | 6.1% |
Water and Sewer | 5.3% |
Other | 3.2% |
| Total | 100% |
| | |
| Portfolio Credit Quality | |
| (% of total investment exposure) | |
U.S. Guaranteed | 7.6% |
AAA | 5.0% |
AA | 52.4% |
A | 20.5% |
BBB | 8.5% |
BB or Lower | 4.1% |
N/R (not rated) | 1.9% |
| Total | 100% |
27
| | |
| NMS | Nuveen Minnesota Quality Municipal Income Fund Performance Overview and Holding Summaries as of May 31, 2020 |
| | | | |
Refer to the Glossary of Terms Used in this Report for further definition of the terms used within this section.
|
| Average Annual Total Returns as of May 31, 2020 |
|
| Average Annual |
| 1-Year | 5-Year | 10-Year |
NMS at Common Share NAV | 1.24% | 3.88% | 5.55% |
NMS at Common Share Price | 2.57% | 2.95% | 4.10% |
S&P Municipal Bond Minnesota Index | 3.98% | 3.37% | 3.86% |
S&P Municipal Bond Index | 3.87% | 3.68% | 4.20% |
Past performance is not predictive of future results. Current performance may be higher or lower than the data shown. Returns do not reflect the deduction of taxes that shareholders may have to pay on Fund distributions or upon the sale of Fund shares. Returns at NAV are net of Fund expenses, and assume reinvestment of distributions. Comparative index return information is provided for the Fund’s shares at NAV only. Indexes are not available for direct investment.
28
This data relates to the securities held in the Fund’s portfolio of investments as of the end of the reporting period. It should not be construed as a measure of performance for the Fund itself. Holdings are subject to change.
For financial reporting purposes, the ratings disclosed are the highest rating given by one of the following national rating agencies: Standard & Poor’s Group, Moody’s Investors Service, Inc. or Fitch, Inc. This treatment of split-rated securities may differ from that used for other purposes, such as for Fund investment policies. Credit ratings are subject to change. AAA, AA, A and BBB are investment grade ratings; BB, B, CCC, CC, C and D are below-investment grade ratings. Holdings designated N/R are not rated by these national rating agencies.
| | |
| Fund Allocation | |
| (% of net assets) | |
Long-Term Municipal Bonds | 155.5% |
Short-Term Municipal Bonds | 3.1% |
Other Assets Less Liabilities | 3.0% |
| Net Assets Plus AMTP Shares, | |
| net of deferred offering costs | 161.6% |
AMTP Shares, net of deferred | |
offering costs | (61.6)% |
| Net Assets | 100% |
| | |
| States and Territories | |
| (% of total municipal bonds) | |
Minnesota | 99.6% |
Guam | 0.4% |
| Total | 100% |
| | |
| Portfolio Composition | |
| (% of total investments) | |
Health Care | 22.6% |
Tax Obligation/General | 19.1% |
Education and Civic Organizations | 19.0% |
Tax Obligation/Limited | 9.3% |
Utilities | 9.0% |
Long-Term Care | 7.6% |
Other | 13.4% |
| Total | 100% |
| | |
| Portfolio Credit Quality | |
| (% of total investment exposure) | |
U.S. Guaranteed | 3.9% |
AAA | 17.1% |
AA | 21.6% |
A | 26.6% |
BBB | 10.3% |
BB or Lower | 7.4% |
N/R (not rated) | 13.1% |
| Total | 100% |
29
| | |
| NOM | Nuveen Missouri Quality Municipal Income Fund Performance Overview and Holding Summaries as of May 31, 2020 |
| | | | |
Refer to the Glossary of Terms Used in this Report for further definition of the terms used within this section. |
| Average Annual Total Returns as of May 31, 2020 |
|
| Average Annual |
| 1-Year | 5-Year | 10-Year |
NOM at Common Share NAV | 2.07% | 4.12% | 5.10% |
NOM at Common Share Price | 7.93% | 3.42% | 3.52% |
S&P Municipal Bond Missouri Index | 3.48% | 3.60% | 4.26% |
S&P Municipal Bond Index | 3.87% | 3.68% | 4.20% |
Past performance is not predictive of future results. Current performance may be higher or lower than the data shown. Returns do not reflect the deduction of taxes that shareholders may have to pay on Fund distributions or upon the sale of Fund shares. Returns at NAV are net of Fund expenses, and assume reinvestment of distributions. Comparative index return information is provided for the Fund’s shares at NAV only. Indexes are not available for direct investment.
30
This data relates to the securities held in the Fund’s portfolio of investments as of the end of the reporting period. It should not be construed as a measure of performance for the Fund itself. Holdings are subject to change.
For financial reporting purposes, the ratings disclosed are the highest rating given by one of the following national rating agencies: Standard & Poor’s Group, Moody’s Investors Service, Inc. or Fitch, Inc. This treatment of split-rated securities may differ from that used for other purposes, such as for Fund investment policies. Credit ratings are subject to change. AAA, AA, A and BBB are investment grade ratings; BB, B, CCC, CC, C and D are below-investment grade ratings. Holdings designated N/R are not rated by these national rating agencies.
| | |
| Fund Allocation | |
| (% of net assets) | |
Long-Term Municipal Bonds | 156.3% |
Other Assets Less Liabilities | 1.1% |
| Net Assets Plus Floating Rate Obligations | |
| & MFP Shares, net of deferred | |
| offering costs | 157.4% |
Floating Rate Obligations | (1.9)% |
MFP Shares, net of deferred | |
offering costs | (55.5)% |
| Net Assets | 100% |
| | |
| States and Territories | |
| (% of total municipal bonds) | |
Missouri | 97.0% |
Guam | 1.6% |
Puerto Rico | 1.4% |
| Total | 100% |
| | |
| Portfolio Composition | |
| (% of total investments) | |
Health Care | 22.8% |
Tax Obligation/Limited | 16.9% |
U.S. Guaranteed | 15.6% |
Tax Obligation/General | 15.1% |
Education and Civic Organizations | 10.3% |
Water and Sewer | 6.4% |
Long-Term Care | 5.9% |
Other | 7.0% |
| Total | 100% |
| | |
| Portfolio Credit Quality | |
| (% of total investment exposure) | |
U.S. Guaranteed | 11.2% |
AAA | 5.8% |
AA | 42.9% |
A | 19.8% |
BBB | 9.4% |
BB or Lower | 3.7% |
N/R (not rated) | 7.2% |
| Total | 100% |
31
| | |
| NPV | Nuveen Virginia Quality Municipal Income Fund Performance Overview and Holding Summaries as of May 31, 2020 |
| | | | |
Refer to the Glossary of Terms Used in this Report for further definition of the terms used within this section.
|
| Average Annual Total Returns as of May 31, 2020 |
|
| Average Annual |
| 1-Year | 5-Year | 10-Year |
NPV at Common Share NAV | 2.48% | 4.09% | 4.58% |
NPV at Common Share Price | 7.74% | 4.46% | 3.27% |
S&P Municipal Bond Virginia Index | 4.78% | 3.70% | 3.89% |
S&P Municipal Bond Index | 3.87% | 3.68% | 4.20% |
Past performance is not predictive of future results. Current performance may be higher or lower than the data shown. Returns do not reflect the deduction of taxes that shareholders may have to pay on Fund distributions or upon the sale of Fund shares. Returns at NAV are net of Fund expenses, and assume reinvestment of distributions. Comparative index return information is provided for the Fund’s shares at NAV only. Indexes are not available for direct investment.
32
This data relates to the securities held in the Fund’s portfolio of investments as of the end of the reporting period. It should not be construed as a measure of performance for the Fund itself. Holdings are subject to change.
For financial reporting purposes, the ratings disclosed are the highest rating given by one of the following national rating agencies: Standard & Poor’s Group, Moody’s Investors Service, Inc. or Fitch, Inc. This treatment of split-rated securities may differ from that used for other purposes, such as for Fund investment policies. Credit ratings are subject to change. AAA, AA, A and BBB are investment grade ratings; BB, B, CCC, CC, C and D are below-investment grade ratings. Holdings designated N/R are not rated by these national rating agencies.
| | |
| Fund Allocation | |
| (% of net assets) | |
Long-Term Municipal Bonds | 155.0% |
Other Assets Less Liabilities | 2.1% |
| Net Assets Plus Floating Rate Obligations | |
| & VRDP Shares, net of deferred | |
| offering costs | 157.1% |
Floating Rate Obligations | (7.9)% |
VRDP Shares, net of deferred | |
offering costs | (49.2)% |
| Net Assets | 100% |
| | |
| States and Territories | |
| (% of total municipal bonds) | |
Virginia | 77.7% |
District of Columbia | 9.1% |
Puerto Rico | 4.7% |
Guam | 3.2% |
Virgin Islands | 2.5% |
Colorado | 1.4% |
Washington | 0.7% |
Pennsylvania | 0.5% |
New York | 0.2% |
| Total | 100% |
| | |
| Portfolio Composition | |
| (% of total investments) | |
Transportation | 29.0% |
Tax Obligation/Limited | 21.2% |
Health Care | 15.6% |
U.S. Guaranteed | 8.6% |
Education and Civic Organizations | 7.9% |
Other | 17.7% |
| Total | 100% |
| | |
| Portfolio Credit Quality | |
| (% of total investment exposure) | |
U.S. Guaranteed | 8.1% |
AAA | 5.0% |
AA | 43.5% |
A | 12.8% |
BBB | 14.2% |
BB or Lower | 8.7% |
N/R (not rated) | 7.7% |
| Total | 100% |
33
Shareholder Meeting Report
The annual meeting of shareholders was held in the offices of Nuveen on April 22, 2020 for NKG, NMY, NMS, NOM and NPV; at this meeting the shareholders were asked to elect Board Members.
| | | | | | | |
| NKG | NMY | NMS |
| Common and | | Common and | | Common and | |
| Preferred | | Preferred | | Preferred | |
| shares voting | | shares voting | | shares voting | |
| together | Preferred | together | Preferred | together | Preferred |
| as a class | Shares | as a class | Shares | as a class | Shares |
| Approval of the Board Members was reached | | | | | | |
| as follows: | | | | | | |
John K. Nelson | | | | | | |
| For | 8,270,297 | — | 17,966,969 | — | 4,590,572 | — |
| Withhold | 1,090,677 | — | 2,240,788 | — | 238,289 | — |
| Total | 9,360,974 | — | 20,207,757 | — | 4,828,861 | — |
Terence J. Toth | | | | | | |
| For | 8,115,390 | — | 17,982,173 | — | 4,552,360 | — |
| Withhold | 1,245,584 | — | 2,225,584 | — | 276,501 | — |
| Total | 9,360,974 | — | 20,207,757 | — | 4,828,861 | — |
Robert L. Young | | | | | | |
| For | 8,270,297 | — | 17,942,938 | — | 4,591,257 | — |
| Withhold | 1,090,677 | — | 2,264,819 | — | 237,604 | — |
| Total | 9,360,974 | — | 20,207,757 | — | 4,828,861 | — |
William C. Hunter | | | | | | |
| For | — | 585 | — | 1,820 | — | 528 |
| Withhold | — | — | — | — | — | — |
| Total | — | 585 | — | 1,820 | — | 528 |
Albin F. Moschner | | | | | | |
| For | — | 585 | — | 1,820 | — | 528 |
| Withhold | — | — | — | — | — | — |
| Total | — | 585 | — | 1,820 | — | 528 |
34
| | | | | |
| NOM | NPV |
| Common and | | Common and | |
| Preferred | | Preferred | |
| shares voting | | shares voting | |
| together | Preferred | together | Preferred |
| as a class | Shares | as a class | Shares |
| Approval of the Board Members was reached | | | | |
| as follows: | | | | |
John K. Nelson | | | | |
| For | 1,924,087 | — | 14,676,059 | — |
| Withhold | 104,452 | — | 416,378 | — |
| Total | 2,028,539 | — | 15,092,437 | — |
Terence J. Toth | | | | |
| For | 1,923,412 | — | 14,657,330 | — |
| Withhold | 105,127 | — | 435,107 | — |
| Total | 2,028,539 | — | 15,092,437 | — |
Robert L. Young | | | | |
| For | 1,923,548 | — | 14,679,417 | — |
| Withhold | 104,991 | — | 413,020 | — |
| Total | 2,028,539 | — | 15,092,437 | — |
William C. Hunter | | | | |
| For | — | 180 | — | 1,280 |
| Withhold | — | — | — | — |
| Total | — | 180 | — | 1,280 |
Albin F. Moschner | | | | |
| For | — | 180 | — | 1,280 |
| Withhold | — | — | — | — |
| Total | — | 180 | — | 1,280 |
35
Report of Independent Registered Public Accounting Firm
To the Shareholders and Board of Trustees
Nuveen Georgia Quality Municipal Income Fund
Nuveen Maryland Quality Municipal Income Fund
Nuveen Massachusetts Quality Municipal Income Fund
Nuveen Minnesota Quality Municipal Income Fund
Nuveen Missouri Quality Municipal Income Fund
Nuveen Virginia Quality Municipal Income Fund:
Opinion on the Financial Statements
We have audited the accompanying statements of assets and liabilities of Nuveen Georgia Quality Municipal Income Fund, Nuveen Maryland Quality Municipal Income Fund, Nuveen Massachusetts Quality Municipal Income Fund, Nuveen Minnesota Quality Municipal Income Fund, Nuveen Missouri Quality Municipal Income Fund, and Nuveen Virginia Quality Municipal Income Fund (the Funds), including the portfolios of investments, as of May 31, 2020, the related statements of operations and cash flows for the year then ended, the statements of changes in net assets for each of the years in the two-year period then ended, and the related notes (collectively, the financial statements) and the financial highlights for each of the years in the five-year period then ended. In our opinion, the financial statements and financial highlights present fairly, in all material respects, the financial position of the Funds as of May 31, 2020, the results of their operations and cash flows for the year then ended, the changes in their net assets for each of the years in the two-year period then ended, and the financial highlights for each of the years in the five-year period then ended, in conformity with U.S. generally accepted accounting principles.
Basis for Opinion
These financial statements and financial highlights are the responsibility of the Funds’ management. Our responsibility is to express an opinion on these financial statements and financial highlights based on our audits. We are a public accounting firm registered with the Public Company Accounting Oversight Board (United States) (PCAOB) and are required to be independent with respect to the Funds in accordance with the U.S. federal securities laws and the applicable rules and regulations of the Securities and Exchange Commission and the PCAOB.
We conducted our audits in accordance with the standards of the PCAOB. Those standards require that we plan and perform the audit to obtain reasonable assurance about whether the financial statements and financial highlights are free of material misstatement, whether due to error or fraud. Our audits included performing procedures to assess the risks of material misstatement of the financial statements and financial highlights, whether due to error or fraud, and performing procedures that respond to those risks. Such procedures included examining, on a test basis, evidence regarding the amounts and disclosures in the financial statements and financial highlights. Such procedures also included confirmation of securities owned as of May 31, 2020, by correspondence with custodians and brokers or other appropriate auditing procedures. Our audits also included evaluating the accounting principles used and significant estimates made by management, as well as evaluating the overall presentation of the financial statements and financial highlights. We believe that our audits provide a reasonable basis for our opinion.
/s/ KPMG LLP
We have served as the auditor of one or more Nuveen investment companies since 2014.
Chicago, Illinois
July 29, 2020
36
| | |
| NKG | Nuveen Georgia Quality Municipal Income Fund Portfolio of Investments May 31, 2020 |
| | | | | | |
| Principal | | | Optional Call | | |
| Amount (000) | | Description (1) | Provisions (2) | Ratings (3) | Value |
| | LONG-TERM INVESTMENTS – 151.3% (99.9% of Total Investments) | | | |
| | MUNICIPAL BONDS – 151.3% (99.9% of Total Investments) | | | |
| | Education and Civic Organizations – 15.8% (10.4% of Total Investments) | | | |
| $ 1,600 | | Cobb County Development Authority, Georgia, Revenue Bonds, KSU University II Real Estate | 7/21 at 100.00 | AA | $ 1,649,312 |
| | Foundation, LLC Project, Series 2011, 5.000%, 7/15/41 – AGM Insured | | | |
| 3,000 | | Colorado State Board of Governors, Colorado State University Auxiliary Enterprise System | 3/28 at 100.00 | AA | 3,416,580 |
| | Revenue Bonds, Refunding Series 2017E, 4.000%, 3/01/43 | | | |
| 1,340 | | Douglas County Development Authority, Georgia, Charter School Revenue Bonds, Brighten | 10/23 at 100.00 | N/R | 1,391,201 |
| | Academy Project, Series 2013B, 7.000%, 10/01/43 | | | |
| 3,000 | | Fulton County Development Authority, Georgia, Revenue Bonds, Robert W Woodruff Arts | 3/26 at 100.00 | A2 | 3,315,750 |
| | Center, Inc Project, Refunding Series 2015A, 5.000%, 3/15/36 | | | |
| 1,530 | | Gwinnett County Development Authority, Georgia, Revenue Bonds, Georgia Gwinnett College | 7/27 at 100.00 | A+ | 1,771,740 |
| | Student Housing Project, Refunding Series 2017B, 5.000%, 7/01/37 | | | |
| 3,000 | | Private Colleges and Universities Authority, Georgia, Revenue Bonds, Emory University, | 10/23 at 100.00 | AA | 3,357,540 |
| | Refunding Series 2013A, 5.000%, 10/01/43 | | | |
| 2,000 | | Private Colleges and Universities Authority, Georgia, Revenue Bonds, Emory University, | 10/26 at 100.00 | AA | 2,361,400 |
| | Refunding Series 2016A, 5.000%, 10/01/46 (UB) (4) | | | |
| 1,325 | | Private Colleges and Universities Authority, Georgia, Revenue Bonds, Mercer University, | 10/22 at 100.00 | Baa1 | 1,379,762 |
| | Refunding Series 2012C, 5.250%, 10/01/30 | | | |
| 1,000 | | Private Colleges and Universities Authority, Georgia, Revenue Bonds, Mercer University, | 10/21 at 100.00 | Baa1 | 1,019,790 |
| | Series 2012A, 5.000%, 10/01/32 | | | |
| 3,000 | | Private Colleges and Universities Authority, Georgia, Revenue Bonds, Savannah College of | 4/24 at 100.00 | A+ | 3,215,700 |
| | Art & Design Projects, Series 2014, 5.000%, 4/01/44 | | | |
| 20,795 | | Total Education and Civic Organizations | | | 22,878,775 |
| | Health Care – 17.5% (11.6% of Total Investments) | | | |
| | Baldwin County Hospital Authority, Georgia, Revenue Bonds, Oconee Regional Medical | | | |
| | Center, Series 1998: | | | |
| 205 | | 5.250%, 12/01/22 (5), (6) | 6/20 at 100.00 | N/R | 16,824 |
| 745 | | 5.375%, 12/01/28 (5), (6) | 6/20 at 100.00 | N/R | 61,142 |
| 3,245 | | Brookhaven Development Authority, Georgia, Revenue Bonds, Children’s Healthcare of | 7/29 at 100.00 | AA+ | 3,642,156 |
| | Atlanta, Inc Project, Series 2019A, 4.000%, 7/01/44 | | | |
| 3,485 | | Development Authority of Fulton County Revenue Bonds, Georgia, Piedmont Healthcare, Inc | 7/26 at 100.00 | AA– | 3,948,435 |
| | Project, Series 2016A, 5.000%, 7/01/46 | | | |
| | Fulton County Development Authority, Georgia, Hospital Revenue Bonds, Wellstar Health | | | |
| | System, Inc Project, Series 2017A: | | | |
| 1,780 | | 5.000%, 4/01/36 | 4/27 at 100.00 | A | 2,010,457 |
| 1,000 | | 5.000%, 4/01/37 | 4/27 at 100.00 | A | 1,126,240 |
| 2,500 | | Fulton County Development Authority, Georgia, Revenue Bonds, Piedmont Healthcare, Inc | 7/29 at 100.00 | AA– | 2,682,875 |
| | Project, Series 2019A, 4.000%, 7/01/49 | | | |
| | Gainesville and Hall County Hospital Authority, Georgia, Revenue Anticipation | | | |
| | Certificates, Northeast Georgia Health Services Inc, Series 2017B: | | | |
| 3,000 | | 5.500%, 2/15/42 (UB) (4) | 2/27 at 100.00 | AA | 3,652,770 |
| 5,500 | | 5.250%, 2/15/45 (UB) (4) | 2/27 at 100.00 | AA | 6,539,775 |
| 1,620 | | Greene County Development Authority, Georgia, Health System Revenue Bonds, Catholic | 11/22 at 100.00 | AA– | 1,735,231 |
| | Health East Issue, Series 2012, 5.000%, 11/15/37 | | | |
| 23,080 | | Total Health Care | | | 25,415,905 |
| | Housing/Multifamily – 0.9% (0.6% of Total Investments) | | | |
| 1,205 | | Atlanta Urban Residential Finance Authority, Georgia, Multifamily Housing Revenue Bonds, | 11/23 at 100.00 | BBB | 1,257,984 |
| | Testletree Village Apartments, Series 2013A, 4.500%, 11/01/35 | | | |
37
| | |
| NKG | Nuveen Georgia Quality Municipal Income Fund Portfolio of Investments (continued) May 31, 2020 |
| | | | | | |
| Principal | | | Optional Call | | |
| Amount (000) | | Description (1) | Provisions (2) | Ratings (3) | Value |
| | Tax Obligation/General – 32.1% (21.2% of Total Investments) | | | |
| $ 4,000 | | Bryan County School District, Georgia, General Obligation Bonds, Series 2018, 5.000%, | 8/26 at 100.00 | AA+ | $ 4,767,680 |
| | 8/01/42 (UB) (4) | | | |
| 3,000 | | Carroll City-County Hospital Authority, Georgia, Revenue Anticipation Certificates, | 7/25 at 100.00 | AA | 3,425,760 |
| | Tanner Medical Center, Inc Project, Series 2015, 5.000%, 7/01/41 | | | |
| 2,000 | | Clark County School District, Nevada, General Obligation Bonds, Limited Tax Building | 6/28 at 100.00 | A+ | 2,214,860 |
| | Series 2018A, 4.000%, 6/15/37 | | | |
| | East Point Building Authority, Georgia, Revenue Bonds, Water & Sewer Project, Refunding | | | |
| | Series 2017: | | | |
| 1,000 | | 5.000%, 2/01/29 – AGM Insured | 2/27 at 100.00 | AA | 1,253,920 |
| 650 | | 5.000%, 2/01/35 – AGM Insured | 2/27 at 100.00 | AA | 789,392 |
| 2,350 | | Evanston, Illinois, General Obligation Bonds, Corporate Purpose Series 2016A, | 6/28 at 100.00 | AA+ | 2,640,977 |
| | 4.000%, 12/01/43 | | | |
| 2,000 | | Floyd County Hospital Authority, Georgia, Revenue Anticipation Certificates, Floyd | 7/26 at 100.00 | Aa2 | 2,368,160 |
| | Medical Center, Series 2016, 5.000%, 7/01/35 | | | |
| 2,000 | | Forsyth County School District, Georgia, General Obligation Bonds, Series 2020, | 2/30 at 100.00 | AAA | 2,652,500 |
| | 5.000%, 2/01/38 | | | |
| 3,000 | | Forsyth County Water and Sewerage Authority, Georgia, Revenue Bonds, Refunding & | 4/25 at 100.00 | AAA | 3,529,440 |
| | Improvement Series 2015, 5.000%, 4/01/44 | | | |
| 3,000 | | Gainesville and Hall County Hospital Authority, Georgia, Revenue Anticipation | 2/25 at 100.00 | AA | 3,473,670 |
| | Certificates, Northeast Georgia Health Services Inc, Series 2014A, 5.500%, 8/15/54 | | | |
| 5 | | Georgia Environmental Loan Acquisition Corporation, Local Government Loan Securitization | 3/21 at 100.00 | Aaa | 5,016 |
| | Bonds, Loan Pool Series 2011, 5.125%, 3/15/31 | | | |
| 3,550 | | Georgia State, General Obligation Bonds, Series 2015A, 5.000%, 2/01/28 | 2/25 at 100.00 | AAA | 4,264,224 |
| 170 | | Jackson County School District, Georgia, General Obligation Bonds, School Series 2019, | 3/29 at 100.00 | AA+ | 223,715 |
| | 5.000%, 3/01/32 | | | |
| 345 | | Lamar County School District, Georgia, General Obligation Bonds, Series 2017, | 9/27 at 100.00 | Aa1 | 433,323 |
| | 5.000%, 3/01/33 | | | |
| 500 | | Paulding County, Georgia, General Obligation Bonds, Series 2017, 5.000%, 2/01/31 | 2/28 at 100.00 | Aa1 | 643,875 |
| 3,000 | | Sandy Springs Public Facilities Authority, Georgia, Revenue Bonds, Sandy Springs City | 5/26 at 100.00 | Aaa | 3,574,200 |
| | Center Project, Series 2015, 5.000%, 5/01/47 | | | |
| | Valdosta and Lowndes County Hospital Authority, Georgia, Revenue Anticipation | | | |
| | Certificates, Refunding Series 2019A: | | | |
| 500 | | 5.000%, 10/01/34 | 10/29 at 100.00 | Aa2 | 628,845 |
| 370 | | 5.000%, 10/01/36 | 10/29 at 100.00 | Aa2 | 461,113 |
| 195 | | 5.000%, 10/01/37 | 10/29 at 100.00 | Aa2 | 242,171 |
| | Vidalia School District, Toombs County, Georgia, General Obligation Bonds, Series 2016: | | | |
| 500 | | 5.000%, 8/01/30 | 2/26 at 100.00 | Aa1 | 608,825 |
| 400 | | 5.000%, 8/01/31 | 2/26 at 100.00 | Aa1 | 484,812 |
| 3,500 | | West Virginia State, General Obligation Bonds, State Road Competitive Series 2018B, | 6/28 at 100.00 | Aa2 | 3,956,505 |
| | 4.000%, 6/01/42 | | | |
| 1,500 | | Wheeler County School District, Georgia, General Obligation Bonds, Series 2020, | 2/30 at 100.00 | Aa1 | 1,882,035 |
| | 5.000%, 8/01/50 | | | |
| 2,000 | | Winder-Barrow Industrial Building Authority, Revenue Bonds, Georgia, City of Winder Project, | 12/21 at 100.00 | A1 | 2,131,080 |
| | Refunding Series 2012, 5.000%, 12/01/29 – AGM Insured | | | |
| 39,535 | | Total Tax Obligation/General | | | 46,656,098 |
| | Tax Obligation/Limited – 25.6% (16.9% of Total Investments) | | | |
| | Atlanta and Fulton County Recreation Authority, Georgia, Revenue Bonds, Zoo Atlanta | | | |
| | Parking Facility Project, Series 2017: | | | |
| 1,180 | | 5.000%, 12/01/34 | 12/27 at 100.00 | AA+ | 1,482,847 |
| 1,260 | | 5.000%, 12/01/36 | 12/27 at 100.00 | AA+ | 1,571,623 |
| 3,250 | | Atlanta Development Authority, Georgia, Revenue Bonds, New Downtown Atlanta Stadium | 7/25 at 100.00 | Aa3 | 3,471,065 |
| | Project, Senior Lien Series 2015A-1, 5.250%, 7/01/44 | | | |
38
| | | | | | |
| Principal | | | Optional Call | | |
| Amount (000) | | Description (1) | Provisions (2) | Ratings (3) | Value |
| | Tax Obligation/Limited (continued) | | | |
| $ 575 | | Atlanta, Georgia, Tax Allocation Bonds Atlanta Station Project, Refunding Series 2017, | No Opt. Call | A3 | $ 675,769 |
| | 5.000%, 12/01/24 | | | |
| | Atlanta, Georgia, Tax Allocation Bonds, Beltline Project, Series 2016D: | | | |
| 1,200 | | 5.000%, 1/01/30 | 1/27 at 100.00 | A2 | 1,437,960 |
| 1,525 | | 5.000%, 1/01/31 | 1/27 at 100.00 | A2 | 1,818,135 |
| 725 | | Atlanta, Georgia, Tax Allocation Bonds, Perry Bolton Project Series 2014, | 7/23 at 100.00 | A– | 807,345 |
| | 5.000%, 7/01/41 | | | |
| 5,160 | | Cobb-Marietta Coliseum and Exhibit Hall Authority, Georgia, Revenue Bonds, Refunding | No Opt. Call | Baa2 | 5,504,172 |
| | Series 1993, 5.625%, 10/01/26 – NPFG Insured | | | |
| 405 | | Cobb-Marietta Coliseum and Exhibit Hall Authority, Georgia, Revenue Bonds, Refunding | No Opt. Call | AA– | 467,811 |
| | Series 2005, 5.500%, 10/01/26 – NPFG Insured | | | |
| 3,020 | | Georgia Local Governments, Certificates of Participation, Georgia Municipal Association, | No Opt. Call | Baa2 | 3,465,933 |
| | Series 1998A, 4.750%, 6/01/28 – NPFG Insured | | | |
| 700 | | Georgia State Road and Tollway Authority, Federal Highway Grant Anticipation Revenue | 6/27 at 100.00 | AA | 881,762 |
| | Bonds, Series 2017A, 5.000%, 6/01/29 | | | |
| | Metropolitan Atlanta Rapid Transit Authority, Georgia, Sales Tax Revenue Bonds, Third | | | |
| | Indenture, Series 2015B: | | | |
| 1,000 | | 5.000%, 7/01/41 | 7/26 at 100.00 | AA+ | 1,188,930 |
| 3,000 | | 5.000%, 7/01/42 | 7/26 at 100.00 | AA+ | 3,561,210 |
| 5,000 | | Miami-Dade County, Florida, Transit System Sales Surtax Revenue Bonds, Series 2018, | 7/28 at 100.00 | AA | 5,410,800 |
| | 4.000%, 7/01/48 | | | |
| | Puerto Rico Sales Tax Financing Corporation, Sales Tax Revenue Bonds, Restructured 2018A-1: | | | |
| 710 | | 4.500%, 7/01/34 | 7/25 at 100.00 | N/R | 718,158 |
| 2,312 | | 4.550%, 7/01/40 | 7/28 at 100.00 | N/R | 2,291,793 |
| 810 | | Tift County Hospital Authority, Georgia, Revenue Anticipation Certificates Series 2012, | 12/22 at 100.00 | Aa2 | 869,819 |
| | 5.000%, 12/01/38 | | | |
| 1,500 | | Washington State Convention Center Public Facilities District, Lodging Tax Revenue | 7/28 at 100.00 | A1 | 1,472,460 |
| | Bonds, Series 2018, 4.000%, 7/01/58 | | | |
| 33,332 | | Total Tax Obligation/Limited | | | 37,097,592 |
| | Transportation – 10.8% (7.1% of Total Investments) | | | |
| 2,000 | | Atlanta, Georgia, Airport General Revenue Bonds, Refunding Series 2011B, | 1/21 at 100.00 | AA– | 2,042,520 |
| | 5.000%, 1/01/30 (AMT) | | | |
| 2,000 | | Atlanta, Georgia, Airport General Revenue Bonds, Refunding Series 2012B, 5.000%, 1/01/31 | 1/22 at 100.00 | AA– | 2,115,400 |
| 2,810 | | Atlanta, Georgia, Airport General Revenue Bonds, Series 2012C, 5.000%, 1/01/42 (AMT) | 1/22 at 100.00 | AA– | 2,929,762 |
| | Atlanta, Georgia, Airport Passenger Facilities Charge and General Revenue Bonds, | | | |
| | Refunding Subordinate Lien Series 2014A: | | | |
| 2,575 | | 5.000%, 1/01/32 | 1/24 at 100.00 | AA– | 2,883,459 |
| 3,750 | | 5.000%, 1/01/34 | 1/24 at 100.00 | AA– | 4,178,400 |
| 1,500 | | Clayton County Development Authority, Georgia, Special Facilities Revenue Bonds, Delta | 6/20 at 100.00 | Baa3 | 1,505,205 |
| | Air Lines, Inc Project, Series 2009A, 8.750%, 6/01/29 | | | |
| 14,635 | | Total Transportation | | | 15,654,746 |
| | U.S. Guaranteed – 9.7% (6.4% of Total Investments) (7) | | | |
| 2,000 | | Chatham County Hospital Authority, Georgia, Seven Mill Tax Pledge Revenue Bonds, | 1/22 at 100.00 | N/R | 2,149,100 |
| | Memorial Health University Medical Center, Inc, Refunding & Improvement Series 2012A, 5.000%, | | | |
| | 1/01/31 (Pre-refunded 1/01/22) | | | |
| 600 | | Clarke County Hospital Authority, Georgia, Hospital Revenue Certificates, Athens | 1/22 at 100.00 | AA | 645,228 |
| | Regional Medical Center, Series 2012, 5.000%, 1/01/32 (Pre-refunded 1/01/22) | | | |
| 500 | | Columbus, Georgia, Water and Sewerage Revenue Bonds, Refunding Series 2014A, 5.000%, | 5/24 at 100.00 | AA+ | 590,940 |
| | 5/01/31 (Pre-refunded 5/01/24) | | | |
| 625 | | Fulton County Development Authority, Georgia, Revenue Bonds, Georgia Tech Foundation | 5/22 at 100.00 | AA+ | 681,394 |
| | Technology Square Project, Refunding Series 2012A, 5.000%, 11/01/31 (Pre-refunded 5/01/22) | | | |
39
| | |
| NKG | Nuveen Georgia Quality Municipal Income Fund Portfolio of Investments (continued) May 31, 2020 |
| | | | | | |
| Principal | | | Optional Call | | |
| Amount (000) | | Description (1) | Provisions (2) | Ratings (3) | Value |
| | U.S. Guaranteed (7) (continued) | | | |
| $ 3,500 | | Gwinnett County School District, Georgia, General Obligation Bonds, Series 2013, 5.000%, | 2/23 at 100.00 | AAA | $ 3,944,115 |
| | 2/01/36 (Pre-refunded 2/01/23) | | | |
| 1,500 | | Habersham County Hospital Authority, Georgia, Revenue Anticipation Certificates, Series | 2/24 at 100.00 | Aa3 | 1,740,585 |
| | 2014B, 5.000%, 2/01/37 (Pre-refunded 2/01/24) | | | |
| | Liberty County Industrial Authority, Georgia, Revenue Bonds, Series 2014: | | | |
| 222 | | 5.500%, 7/15/23 (Pre-refunded 7/15/21) | 7/21 at 100.00 | N/R | 232,009 |
| 600 | | 5.500%, 7/15/30 (Pre-refunded 7/15/21) | 7/21 at 100.00 | N/R | 635,996 |
| 660 | | 5.500%, 1/15/36 (Pre-refunded 7/15/21) | 7/21 at 100.00 | N/R | 698,001 |
| 290 | | Metropolitan Atlanta Rapid Transit Authority, Georgia, Sales Tax Revenue Bonds, | No Opt. Call | N/R | 291,328 |
| | Refunding Series 1992P, 6.250%, 7/01/20 – AMBAC Insured (ETM) | | | |
| 2,260 | | Valdosta and Lowndes County Hospital Authority, Georgia, Revenue Certificates, South | 10/21 at 100.00 | Aa2 | 2,402,493 |
| | Georgia Medical Center Project, Series 2011B, 5.000%, 10/01/41 (Pre-refunded 10/01/21) | | | |
| 12,757 | | Total U.S. Guaranteed | | | 14,011,189 |
| | Utilities – 16.3% (10.8% of Total Investments) | | | |
| 1,975 | | Burke County Development Authority, Georgia, Pollution Control Revenue Bonds, Georgia | No Opt. Call | A– | 2,021,274 |
| | Power Company, Fourth Series 1994, 2.250%, 10/01/32 (Mandatory Put 5/25/23) | | | |
| 1,250 | | Burke County Development Authority, Georgia, Pollution Control Revenue Bonds, Oglethorpe | 2/28 at 100.00 | BBB+ | 1,268,250 |
| | Power Corporation Vogtle Project, Series 2017C, 4.125%, 11/01/45 | | | |
| 1,250 | | Burke County Development Authority, Georgia, Pollution Control Revenue Bonds, Oglethorpe | 2/28 at 100.00 | BBB+ | 1,268,250 |
| | Power Corporation Vogtle Project, Series 2017D, 4.125%, 11/01/45 | | | |
| 1,750 | | Dalton, Georgia, Combined Utilities Revenue Bonds, Series 2017, 5.000%, 3/01/33 | 3/27 at 100.00 | A2 | 2,100,770 |
| 3,000 | | Georgia Municipal Electric Authority, General Power Revenue Bonds, Series 2012GG, | 1/23 at 100.00 | A1 | 3,154,170 |
| | 5.000%, 1/01/43 | | | |
| | Main Street Natural Gas Inc, Georgia, Gas Project Revenue Bonds, Series 2006B: | | | |
| 1,300 | | 5.000%, 3/15/21 | No Opt. Call | A+ | 1,336,127 |
| 1,500 | | 5.000%, 3/15/22 | No Opt. Call | A+ | 1,593,090 |
| 2,000 | | Main Street Natural Gas Inc, Georgia, Gas Project Revenue Bonds, Series 2007A, | No Opt. Call | A+ | 2,137,700 |
| | 5.000%, 3/15/22 | | | |
| 1,000 | | Main Street Natural Gas Inc, Georgia, Gas Supply Revenue Bonds, Series 2019A, | No Opt. Call | A3 | 1,268,650 |
| | 5.000%, 5/15/49 | | | |
| 1,525 | | Main Street Natural Gas Inc, Georgia, Gas Supply Revenue Bonds, Series 2019B, 4.000%, | 9/24 at 100.43 | Aa1 | 1,700,634 |
| | 8/01/49 (Mandatory Put 12/02/24) | | | |
| 2,000 | | Main Street Natural Gas Inc, Georgia, Gas Supply Revenue Bonds, Variable Rate Demand | 6/23 at 100.40 | Aa2 | 2,166,480 |
| | Bonds Series 2018A, 4.000%, 4/01/48 (Mandatory Put 9/01/23) | | | |
| 1,500 | | Municipal Electric Authority of Georgia, Project One Revenue Bonds, Subordinate Lien | No Opt. Call | A2 | 1,100,940 |
| | Series 2015A, 0.000%, 1/01/32 | | | |
| 2,260 | | Municipal Electric Authority of Georgia, Project One Revenue Bonds, Subordinate Lien | 7/26 at 100.00 | AA | 2,595,836 |
| | Series 2016A, 5.000%, 1/01/30 – BAM Insured | | | |
| 22,310 | | Total Utilities | | | 23,712,171 |
| | Water and Sewer – 22.6% (14.9% of Total Investments) | | | |
| 4,000 | | Atlanta, Georgia, Water and Wastewater Revenue Bonds, Refunding Series 2018A, 5.000%, | 11/27 at 100.00 | Aa2 | 4,961,320 |
| | 11/01/39 (UB) (4) | | | |
| 5,000 | | Atlanta, Georgia, Water and Wastewater Revenue Bonds, Refunding Series 2018B, | 11/27 at 100.00 | Aa2 | 6,124,050 |
| | 5.000%, 11/01/47 | | | |
| 260 | | Atlanta, Georgia, Water and Wastewater Revenue Bonds, Series 2004, 5.750%, 11/01/30 – | No Opt. Call | AA | 378,469 |
| | AGM Insured | | | |
| 5 | | Cherokee County Water and Sewerage Authority, Georgia, Revenue Bonds, Series 2001, | 6/20 at 100.00 | Aa1 | 5,016 |
| | 5.000%, 8/01/35 – AGM Insured | | | |
| 500 | | Columbus, Georgia, Water and Sewerage Revenue Bonds, Series 2016, 5.000%, 5/01/36 | 5/26 at 100.00 | AA+ | 601,450 |
40
| | | | | | |
| Principal | | | Optional Call | | |
| Amount (000) | | Description (1) | Provisions (2) | Ratings (3) | Value |
| | Water and Sewer (continued) | | | |
| | DeKalb County, Georgia, Water and Sewerage Revenue Bonds, Refunding Series 2006B: | | | |
| $ 6,000 | | 5.250%, 10/01/32 – AGM Insured (UB) (4) | 10/26 at 100.00 | AA | $ 7,439,100 |
| 300 | | 5.000%, 10/01/35 – AGM Insured | 10/26 at 100.00 | AA | 363,663 |
| 5,350 | | DeKalb County, Georgia, Water and Sewerage Revenue Bonds, Second Resolution Series | 10/21 at 100.00 | Aa3 | 5,639,381 |
| | 2011A, 5.250%, 10/01/41 | | | |
| 1,000 | | Fulton County, Georgia, Water and Sewerage Revenue Bonds, Refunding Series 2013, | 1/23 at 100.00 | AA | 1,101,270 |
| | 5.000%, 1/01/33 | | | |
| 435 | | Midgeville, Georgia, Water and Sewerage Revenue Refunding Bonds, Series 1996, 6.000%, | No Opt. Call | AA | 456,933 |
| | 12/01/21 – AGM Insured | | | |
| | Oconee County, Georgia, Water and Sewer Revenue Bonds, Series 2017A: | | | |
| 155 | | 5.000%, 9/01/35 | 9/27 at 100.00 | AA | 192,467 |
| 535 | | 5.000%, 9/01/37 | 9/27 at 100.00 | AA | 660,062 |
| 2,000 | | South Fulton Municipal Regional Water and Sewer Authority, Georgia, Revenue Bonds, | 1/24 at 100.00 | AA | 2,278,260 |
| | Refunding Series 2014, 5.000%, 1/01/30 | | | |
| 2,315 | | Walton County Water and Sewerage Authority, Georgia, Revenue Bonds, Oconee-Hard Creek | 2/26 at 100.00 | Aa2 | 2,589,119 |
| | Reservoir Project, Series 2016, 4.000%, 2/01/38 | | | |
| 27,855 | | Total Water and Sewer | | | 32,790,560 |
| $ 195,504 | | Total Long-Term Investments (cost $207,021,553) | | | 219,475,020 |
|
| Principal | | | Optional Call | | |
| Amount (000) | | Description (1) | Provisions (2) | Ratings (3) | Value |
| | SHORT-TERM INVESTMENTS – 0.1% (0.1% of Total Investments) | | | |
| | MUNICIPAL BONDS – 0.1% (0.1% of Total Investments) | | | |
| | Health Care – 0.1% (0.1% of Total Investments) | | | |
| $ 142 | | Baldwin County Hospital Authority, Georgia, Revenue Bonds, Variable Rate Demand Obligation, | No Opt. Call | N/R | $ 147,195 |
| | Oconee Regional Medical Center, Series 2016, 6.500%, 3/31/17 (5), (6) | | | |
| $ 142 | | Total Short-Term Investments (cost $142,192) | | | 147,195 |
| | Total Investments (cost $207,163,745) – 151.4% | | | 219,622,215 |
| | Floating Rate Obligations – (13.5)% | | | (19,600,000) |
| | Adjustable Rate MuniFund Term Preferred Shares, net of deferred offering costs – (40.3)% (8) | | | (58,436,706) |
| | Other Assets Less Liabilities – 2.4% | | | 3,528,214 |
| | Net Asset Applicable to Common Shares – 100% | | | $ 145,113,723 |
41
| | |
| NKG | Nuveen Georgia Quality Municipal Income Fund Portfolio of Investments (continued) May 31, 2020 |
| | |
(1) | All percentages shown in the Portfolio of Investments are based on net assets applicable to common shares unless otherwise noted. |
(2) | Optional Call Provisions: Dates (month and year) and prices of the earliest optional call or redemption. There may be other call provisions at varying prices at later dates. Certain mortgage-backed securities may be subject to periodic principal paydowns. Optional Call Provisions are not covered by the report of independent registered public accounting firm. |
(3) | For financial reporting purposes, the ratings disclosed are the highest of Standard & Poor’s Group (“Standard & Poor’s”), Moody’s Investors Service, Inc. (“Moody’s”) or Fitch, Inc. (“Fitch”) rating. This treatment of split-rated securities may differ from that used for other purposes, such as for Fund investment policies. Ratings below BBB by Standard Poor’s, Baa by Moody’s or BBB by Fitch are considered to be below investment grade. Holdings designated N/R are not rated by any of these national rating agencies. Ratings are not covered by the report of independent registered public accounting firm. |
(4) | Investment, or portion of investment, has been pledged to collateralize the net payment obligations for investments in inverse floating rate transactions. |
(5) | Defaulted security. A security whose issuer has failed to fully pay principal and/or interest when due, or is under the protection of bankruptcy. |
(6) | Investment valued at fair value using methods determined in good faith by, or at the discretion of, the Board. For fair value measurement disclosure purposes, investment classified as Level 3. See Notes to Financial Statements, Note 3 – Investment Valuation and Fair Value Measurements for more information. |
(7) | Backed by an escrow or trust containing sufficient U.S. Government or U.S. Government agency securities, which ensure the timely payment of principal and interest. |
(8) | Adjustable Rate MuniFund Term Preferred Shares, net of deferred offering cost as a percentage of Total Investments is 26.6%. |
AMT | Alternative Minimum Tax |
ETM | Escrowed to maturity |
UB | Underlying bond of an inverse floating rate trust reflected as a financing transaction. See Notes to Financial Statements, Note 4 – Portfolio Securities and Investments in Derivatives for more information. |
| See accompanying notes to financial statements. |
42
| | |
| NMY | Nuveen Maryland Quality Municipal Income Fund Portfolio of Investments May 31, 2020 |
| | | | | | |
| Principal | | | Optional Call | | |
| Amount (000) | | Description (1) | Provisions (2) | Ratings (3) | Value |
| | LONG-TERM INVESTMENTS – 158.8% (100.0% of Total Investments) | | | |
| | MUNICIPAL BONDS – 158.8% (100.0% of Total Investments) | | | |
| | Consumer Discretionary – 2.8% (1.8% of Total Investments) | | | |
| $ 9,215 | | Baltimore, Maryland, Convention Center Hotel Revenue Bonds, Refunding Series 2017, | 9/27 at 100.00 | BB | $ 8,185,316 |
| | 5.000%, 9/01/42 | | | |
| 2,000 | | Maryland Economic Development Corporation, Revenue Bonds, Chesapeake Bay Hyatt | 6/20 at 100.00 | N/R | 1,200,000 |
| | Conference Center, Series 2006A, 0.000%, 12/01/31 (4) | | | |
| 11,215 | | Total Consumer Discretionary | | | 9,385,316 |
| | Consumer Staples – 5.5% (3.5% of Total Investments) | | | |
| 1,885 | | Buckeye Tobacco Settlement Financing Authority, Ohio, Tobacco Settlement Asset-Backed | 6/30 at 100.00 | N/R | 1,905,113 |
| | Revenue Bonds, Refunding Senior Lien Series 2020B-2 Class 2, 5.000%, 6/01/55 | | | |
| 3,270 | | Children’s Trust Fund, Puerto Rico, Tobacco Settlement Asset-Backed Bonds, Refunding | 6/20 at 100.00 | Ba1 | 3,287,004 |
| | Series 2002, 5.500%, 5/15/39 | | | |
| 13,000 | | District of Columbia Tobacco Settlement Corporation, Tobacco Settlement Asset-Backed | 6/20 at 20.24 | N/R | 2,368,210 |
| | Bonds, Series 2006A, 0.000%, 6/15/46 | | | |
| | Guam Economic Development & Commerce Authority, Tobacco Settlement Asset-Backed Bonds, | | | |
| | Series 2007A: | | | |
| 1,920 | | 5.250%, 6/01/32 | 6/20 at 100.00 | N/R | 1,804,051 |
| 2,915 | | 5.625%, 6/01/47 | 6/20 at 100.00 | N/R | 2,559,632 |
| 1,660 | | New York Counties Tobacco Trust VI, New York, Tobacco Settlement Pass-Through Bonds, | No Opt. Call | BBB | 1,736,393 |
| | Series 2016A-1, 5.625%, 6/01/35 | | | |
| 100 | | Northern Tobacco Securitization Corporation, Alaska, Tobacco Settlement Asset-Backed | 6/20 at 100.00 | B3 | 100,003 |
| | Bonds, Series 2006A, 5.000%, 6/01/46 | | | |
| 1,405 | | Tobacco Settlement Financing Corporation, New Jersey, Tobacco Settlement Asset-Backed | 6/28 at 100.00 | BBB+ | 1,543,702 |
| | Bonds, Series 2018A, 5.000%, 6/01/46 | | | |
| 345 | | Tobacco Settlement Financing Corporation, Virgin Islands, Tobacco Settlement | 6/20 at 100.00 | A3 | 345,483 |
| | Asset-Backed Bonds, Series 2001, 5.000%, 5/15/31 | | | |
| 2,850 | | TSASC Inc, New York, Tobacco Asset-Backed Bonds, Series 2006, 5.000%, 6/01/48 | 6/27 at 100.00 | N/R | 2,658,394 |
| 29,350 | | Total Consumer Staples | | | 18,307,985 |
| | Education and Civic Organizations – 8.9% (5.6% of Total Investments) | | | |
| | Frederick County, Maryland, Educational Facilities Revenue Bonds, Mount Saint Mary’s | | | |
| | University Inc, Series 2017A: | | | |
| 3,000 | | 5.000%, 9/01/37, 144A | 9/27 at 100.00 | BB+ | 2,986,050 |
| 1,750 | | 5.000%, 9/01/45, 144A | 9/27 at 100.00 | BB+ | 1,671,863 |
| 700 | | Maryland Health and Higher Educational Facilities Authority, Revenue Bonds, Goucher | 7/22 at 100.00 | A– | 732,956 |
| | College, Series 2012A, 5.000%, 7/01/34 | | | |
| | Maryland Health and Higher Educational Facilities Authority, Revenue Bonds, Goucher | | | |
| | College, Series 2017A: | | | |
| 1,100 | | 5.000%, 7/01/37 | 7/27 at 100.00 | A– | 1,233,650 |
| 1,200 | | 5.000%, 7/01/44 | 7/27 at 100.00 | A– | 1,326,588 |
| | Maryland Health and Higher Educational Facilities Authority, Revenue Bonds, Green Street | | | |
| | Academy, Series 2017A: | | | |
| 265 | | 5.125%, 7/01/37, 144A | 7/27 at 100.00 | N/R | 257,501 |
| 500 | | 5.250%, 7/01/47, 144A | 7/27 at 100.00 | N/R | 474,375 |
| | Maryland Health and Higher Educational Facilities Authority, Revenue Bonds, Johns | | | |
| | Hopkins University, Series 2013B: | | | |
| 500 | | 5.000%, 7/01/38 | 7/23 at 100.00 | AA+ | 554,865 |
| 4,375 | | 4.250%, 7/01/41 | 7/23 at 100.00 | AA+ | 4,699,581 |
43
| | |
| NMY | Nuveen Maryland Quality Municipal Income Fund Portfolio of Investments (continued) May 31, 2020 |
| | | | | | |
| Principal | | | Optional Call | | |
| Amount (000) | | Description (1) | Provisions (2) | Ratings (3) | Value |
| | Education and Civic Organizations (continued) | | | |
| | Maryland Health and Higher Educational Facilities Authority, Revenue Bonds, Loyola | | | |
| | University Maryland, Series 2014: | | | |
| $ 1,000 | | 4.000%, 10/01/45 | 10/24 at 100.00 | A | $ 1,023,490 |
| 1,250 | | 5.000%, 10/01/45 | 10/24 at 100.00 | A | 1,334,462 |
| 1,210 | | Maryland Health and Higher Educational Facilities Authority, Revenue Bonds, Loyola | 10/29 at 100.00 | A | 1,366,247 |
| | University Maryland, Series 2019A, 5.000%, 10/01/49 | | | |
| | Maryland Health and Higher Educational Facilities Authority, Revenue Bonds, Maryland | | | |
| | Institute College of Art, Series 2012: | | | |
| 1,500 | | 5.000%, 6/01/34 | 6/22 at 100.00 | Baa1 | 1,566,570 |
| 3,000 | | 5.000%, 6/01/47 | 6/22 at 100.00 | Baa1 | 3,105,090 |
| | Maryland Health and Higher Educational Facilities Authority, Revenue Bonds, Maryland | | | |
| | Institute College of Art, Series 2016: | | | |
| 175 | | 5.000%, 6/01/36 | 6/26 at 100.00 | Baa1 | 192,803 |
| 2,500 | | 4.000%, 6/01/42 | 6/26 at 100.00 | Baa1 | 2,556,000 |
| | Maryland Health and Higher Educational Facilities Authority, Revenue Bonds, Maryland | | | |
| | Institute College of Art, Series 2017: | | | |
| 525 | | 5.000%, 6/01/35 | 6/26 at 100.00 | Baa1 | 580,844 |
| 1,000 | | 5.000%, 6/01/42 | 6/26 at 100.00 | Baa1 | 1,088,320 |
| 625 | | Morgan State University, Maryland, Student Tuition and Fee Revenue Bonds, Academic Fees | 7/22 at 100.00 | A+ | 682,487 |
| | and Auxiliary Facilities, Refunding Series 2012, 5.000%, 7/01/29 | | | |
| 2,115 | | Morgan State University, Maryland, Student Tuition and Fee Revenue Refunding Bonds, | No Opt. Call | A+ | 2,124,496 |
| | Academic Fees and Auxiliary Facilities, Series 1993, 6.100%, 7/01/20 – NPFG Insured | | | |
| 28,290 | | Total Education and Civic Organizations | | | 29,558,238 |
| | Energy – 1.4% (0.9% of Total Investments) | | | |
| 4,560 | | Maryland Economic Development Corporation, Port Facilities Revenue Bonds, CNX Marine | 9/20 at 100.00 | BB– | 4,579,334 |
| | Terminals Inc Port of Baltimore Facility, Refunding Series 2010, 5.750%, 9/01/25 | | | |
| | Health Care – 31.2% (19.6% of Total Investments) | | | |
| | Maryland Health and Higher Educational Facilities Authority, Maryland, Hospital Revenue | | | |
| | Bonds, Meritus Medical Center, Series 2015: | | | |
| 990 | | 4.000%, 7/01/32 | 7/25 at 100.00 | A– | 1,057,993 |
| 2,470 | | 4.250%, 7/01/35 | 7/25 at 100.00 | A– | 2,633,514 |
| 1,740 | | 5.000%, 7/01/45 | 7/25 at 100.00 | A– | 1,876,590 |
| | Maryland Health and Higher Educational Facilities Authority, Revenue Bonds Doctors | | | |
| | Community Hospital, Series 2017B: | | | |
| 250 | | 5.000%, 7/01/34 | 7/27 at 100.00 | Baa3 | 279,515 |
| 4,820 | | 5.000%, 7/01/38 | 7/27 at 100.00 | Baa3 | 5,241,702 |
| | Maryland Health and Higher Educational Facilities Authority, Revenue Bonds, Mercy | | | |
| | Medical Center, Series 2016A: | | | |
| 90 | | 5.000%, 7/01/36 | 7/26 at 100.00 | BBB+ | 99,669 |
| 1,450 | | 5.000%, 7/01/38 | 7/26 at 100.00 | BBB+ | 1,598,262 |
| 585 | | 4.000%, 7/01/42 | 7/26 at 100.00 | BBB+ | 606,604 |
| | Maryland Health and Higher Educational Facilities Authority, Revenue Bonds, Adventist | | | |
| | Healthcare, Series 2011A: | | | |
| 1,350 | | 6.250%, 1/01/31 | 1/22 at 100.00 | Baa3 | 1,425,775 |
| 375 | | 6.125%, 1/01/36 | 1/22 at 100.00 | Baa3 | 392,524 |
| 3,770 | | Maryland Health and Higher Educational Facilities Authority, Revenue Bonds, Adventist | 1/27 at 100.00 | Baa3 | 4,054,937 |
| | Healthcare, Series 2016A, 5.500%, 1/01/46 | | | |
| 1,355 | | Maryland Health and Higher Educational Facilities Authority, Revenue Bonds, Anne Arundel | 7/22 at 100.00 | A | 1,457,980 |
| | Health System Issue, Series 2012, 5.000%, 7/01/24 | | | |
| 2,000 | | Maryland Health and Higher Educational Facilities Authority, Revenue Bonds, Calvert | 7/23 at 100.00 | AA– | 2,141,840 |
| | Health System Issue, Refunding Series 2013, 5.000%, 7/01/38 | | | |
| 4,335 | | Maryland Health and Higher Educational Facilities Authority, Revenue Bonds, Frederick | 7/22 at 100.00 | A– | 4,478,922 |
| | Memorial Hospital Issue, Series 2012A, 4.250%, 7/01/32 | | | |
44
| | | | | | |
| Principal | | | Optional Call | | |
| Amount (000) | | Description (1) | Provisions (2) | Ratings (3) | Value |
| | Health Care (continued) | | | |
| $ 2,500 | | Maryland Health and Higher Educational Facilities Authority, Revenue Bonds, Johns | 5/25 at 100.00 | Aa2 | $ 2,722,450 |
| | Hopkins Health System Issue, Series 2015A, 4.000%, 5/15/40 | | | |
| 2,000 | | Maryland Health and Higher Educational Facilities Authority, Revenue Bonds, LifeBridge | 7/26 at 100.00 | A+ | 2,259,040 |
| | Health Issue, Series 2016, 5.000%, 7/01/47 | | | |
| | Maryland Health and Higher Educational Facilities Authority, Revenue Bonds, LifeBridge | | | |
| | Health Issue, Series 2017: | | | |
| 1,000 | | 5.000%, 7/01/33 | 7/27 at 100.00 | A+ | 1,191,040 |
| 500 | | 4.000%, 7/01/42 | 7/27 at 100.00 | A+ | 544,190 |
| 1,000 | | 5.000%, 7/01/44 | 7/27 at 100.00 | A+ | 1,151,780 |
| | Maryland Health and Higher Educational Facilities Authority, Revenue Bonds, LifeBridge | | | |
| | Health System, Series 2015: | | | |
| 1,500 | | 4.000%, 7/01/35 | 7/25 at 100.00 | A+ | 1,629,780 |
| 1,125 | | 5.000%, 7/01/40 | 7/25 at 100.00 | A+ | 1,261,035 |
| 2,975 | | 4.125%, 7/01/47 | 7/25 at 100.00 | A+ | 3,163,704 |
| 2,500 | | Maryland Health and Higher Educational Facilities Authority, Revenue Bonds, MedStar | 2/25 at 100.00 | A | 2,754,125 |
| | Health Issue, Series 2015, 5.000%, 8/15/38 | | | |
| 6,000 | | Maryland Health and Higher Educational Facilities Authority, Revenue Bonds, MedStar | 5/27 at 100.00 | A | 6,820,380 |
| | Health Issue, Series 2017A, 5.000%, 5/15/42 | | | |
| 2,850 | | Maryland Health and Higher Educational Facilities Authority, Revenue Bonds, Mercy | 7/22 at 100.00 | BBB+ | 3,005,610 |
| | Medical Cente, Series 2011, 5.000%, 7/01/31 | | | |
| | Maryland Health and Higher Educational Facilities Authority, Revenue Bonds, Peninsula | | | |
| | Regional Medical Center Issue, Refunding Series 2015: | | | |
| 1,000 | | 5.000%, 7/01/39 | 7/24 at 100.00 | A | 1,091,240 |
| 5,500 | | 5.000%, 7/01/45 | 7/24 at 100.00 | A | 5,950,560 |
| | Maryland Health and Higher Educational Facilities Authority, Revenue Bonds, Trinity | | | |
| | Health Credit Group, Series 2017MD: | | | |
| 1,000 | | 5.000%, 12/01/46 | 6/27 at 100.00 | AA– | 1,164,990 |
| 3,260 | | 5.000%, 12/01/46 (UB) (5) | 6/27 at 100.00 | AA– | 3,797,867 |
| | Maryland Health and Higher Educational Facilities Authority, Revenue Bonds, University | | | |
| | of Maryland Medical System Issue, Series 2013A: | | | |
| 4,665 | | 4.000%, 7/01/43 | 7/22 at 100.00 | A | 4,767,630 |
| 11,500 | | 5.000%, 7/01/43 | 7/22 at 100.00 | A | 12,042,915 |
| 1,000 | | Maryland Health and Higher Educational Facilities Authority, Revenue Bonds, University | 7/25 at 100.00 | A | 1,134,350 |
| | of Maryland Medical System Issue, Series 2015, 5.000%, 7/01/35 | | | |
| 5,500 | | Maryland Health and Higher Educational Facilities Authority, Revenue Bonds, University | 7/27 at 100.00 | A | 6,376,755 |
| | of Maryland Medical System Issue, Series 2017B, 5.000%, 7/01/39 | | | |
| 2,000 | | Maryland Health and Higher Educational Facilities Authority, Revenue Bonds, University | 1/28 at 100.00 | A | 2,134,100 |
| | of Maryland Medical System Issue, Taxable Series 2017D, 4.000%, 7/01/48 | | | |
| 2,500 | | Maryland Health and Higher Educational Facilities Authority, Revenue Bonds, University | 4/30 at 100.00 | A | 2,654,225 |
| | of Pittsburgh Medical Center, Series 2020B, 4.000%, 4/15/50 | | | |
| | Montgomery County, Maryland, Revenue Bonds, Trinity Health Credit Group, Series 2015: | | | |
| 6,000 | | 4.000%, 12/01/44 | 6/25 at 100.00 | AA– | 6,349,260 |
| 2,000 | | 5.000%, 12/01/44 (UB) (5) | 6/25 at 100.00 | AA– | 2,254,000 |
| 95,455 | | Total Health Care | | | 103,566,853 |
| | Housing/Multifamily – 8.9% (5.6% of Total Investments) | | | |
| 1,905 | | Anne Arundel County, Maryland, FNMA Multifamily Housing Revenue Bonds, Glenview Gardens | 8/20 at 102.00 | AA+ | 1,948,339 |
| | Apartments Project, Series 2009, 5.000%, 1/01/28 (Mandatory Put 1/01/27) | | | |
| | Howard County Housing Commission, Maryland, Revenue Bonds, Columbia Commons Apartments, | | | |
| | Series 2014A: | | | |
| 1,500 | | 4.000%, 6/01/34 | 6/24 at 100.00 | A+ | 1,600,245 |
| 1,550 | | 5.000%, 6/01/44 | 6/24 at 100.00 | A+ | 1,687,051 |
| 1,860 | | Howard County Housing Commission, Maryland, Revenue Bonds, Gateway Village Apartments, | 6/26 at 100.00 | A+ | 2,004,913 |
| | Series 2016, 4.000%, 6/01/46 | | | |
45
| | |
| NMY | Nuveen Maryland Quality Municipal Income Fund Portfolio of Investments (continued) May 31, 2020 |
| | | | | | |
| Principal | | | Optional Call | | |
| Amount (000) | | Description (1) | Provisions (2) | Ratings (3) | Value |
| | Housing/Multifamily (continued) | | | |
| | Howard County Housing Commission, Maryland, Revenue Bonds, The Verona at Oakland Mills | | | |
| | Project, Series 2013: | | | |
| $ 3,000 | | 5.000%, 10/01/28 | 10/23 at 100.00 | A+ | $ 3,353,250 |
| 2,000 | | 4.625%, 10/01/28 | 10/23 at 100.00 | A+ | 2,207,040 |
| 1,000 | | Howard County Housing Commission, Maryland, Revenue Bonds, Woodfield Oxford Square | 12/27 at 100.00 | A+ | 1,177,040 |
| | Apartments, Series 2017, 5.000%, 12/01/42 | | | |
| 1,195 | | Maryland Community Development Administration Department of Housing and Community | 1/24 at 100.00 | AA+ | 1,255,144 |
| | Development, Housing Revenue Bonds, Series 2014D, 3.900%, 7/01/40 | | | |
| 680 | | Maryland Community Development Administration Department of Housing and Community | 1/27 at 100.00 | AA+ | 725,458 |
| | Development, Housing Revenue Bonds, Series 2017C, 3.550%, 7/01/42 | | | |
| 1,000 | | Maryland Community Development Administration, Department of Housing and Community | 12/24 at 100.00 | Aaa | 1,075,440 |
| | Development, Multifamily Development Revenue Bonds, Marlborough Apartments, Series 2014I, | | | |
| | 3.450%, 12/15/31 | | | |
| | Maryland Economic Development Corporation, Senior Student Housing Revenue Bonds, Towson | | | |
| | University Project, Refunding Series 2017: | | | |
| 1,100 | | 5.000%, 7/01/36 | 7/27 at 100.00 | BBB | 1,188,055 |
| 470 | | 5.000%, 7/01/37 | 7/21 at 100.00 | BBB | 478,968 |
| | Maryland Economic Development Corporation, Student Housing Revenue Bonds, Salisbury | | | |
| | University Project, Refunding Series 2013: | | | |
| 500 | | 5.000%, 6/01/27 | 6/23 at 100.00 | Baa3 | 531,485 |
| 500 | | 5.000%, 6/01/34 | 6/23 at 100.00 | Baa3 | 522,835 |
| 1,510 | | Maryland Economic Development Corporation, Student Housing Revenue Bonds, Sheppard Pratt | 7/22 at 100.00 | BBB– | 1,563,076 |
| | University Village, Series 2012, 5.000%, 7/01/33 | | | |
| 495 | | Maryland Economic Development Corporation, Student Housing Revenue Bonds, University of | 7/25 at 100.00 | BBB– | 515,171 |
| | Maryland – Baltimore Project, Refunding Senior Lien Series 2015, 5.000%, 7/01/39 | | | |
| 1,110 | | Maryland Economic Development Corporation, Student Housing Revenue Bonds, University of | 6/20 at 100.00 | AA | 1,110,744 |
| | Maryland, Baltimore County Project, Refunding Series 2016, 3.600%, 7/01/35 – AGM Insured | | | |
| | Maryland Economic Development Corporation, Student Housing Revenue Bonds, University of | | | |
| | Maryland, College Park Project, Refunding Series 2016: | | | |
| 875 | | 5.000%, 6/01/30 – AGM Insured | 6/26 at 100.00 | AA | 1,021,116 |
| 240 | | 5.000%, 6/01/31 – AGM Insured | 6/26 at 100.00 | AA | 278,770 |
| 2,405 | | 5.000%, 6/01/35 – AGM Insured | 6/26 at 100.00 | AA | 2,750,045 |
| 780 | | 5.000%, 6/01/43 – AGM Insured | 6/26 at 100.00 | AA | 875,566 |
| 1,500 | | Montgomery County Housing Opportunities Commission, Maryland, Multifamily Housing | 7/24 at 100.00 | Aaa | 1,591,695 |
| | Development Bonds, Series 2014A, 3.875%, 7/01/39 | | | |
| 27,175 | | Total Housing/Multifamily | | | 29,461,446 |
| | Housing/Single Family – 7.7% (4.9% of Total Investments) | | | |
| 2,385 | | Maryland Community Development Administration Department of Housing and Community | 3/26 at 100.00 | Aa1 | 2,545,868 |
| | Development, Residential Revenue Bonds, Series 2011B, 3.250%, 3/01/36 | | | |
| 2,280 | | Maryland Community Development Administration Department of Housing and Community | 9/23 at 100.00 | Aa1 | 2,454,124 |
| | Development, Residential Revenue Bonds, Series 2014A, 4.300%, 9/01/32 | | | |
| | Maryland Community Development Administration Department of Housing and Community | | | |
| | Development, Residential Revenue Bonds, Series 2014C: | | | |
| 3,000 | | 3.400%, 3/01/31 | 3/24 at 100.00 | Aa1 | 3,197,250 |
| 1,130 | | 3.750%, 3/01/39 | 3/24 at 100.00 | Aa1 | 1,191,178 |
| 1,500 | | Maryland Community Development Administration Department of Housing and Community | 9/25 at 100.00 | Aa1 | 1,615,110 |
| | Development, Residential Revenue Bonds, Series 2015A, 3.800%, 9/01/35 | | | |
| 4,900 | | Maryland Community Development Administration Department of Housing and Community | 9/27 at 100.00 | Aa1 | 5,462,814 |
| | Development, Residential Revenue Bonds, Series 2018A, 4.100%, 9/01/38 (UB) (5) | | | |
| 1,865 | | Maryland Community Development Administration Department of Housing and Community | 3/28 at 100.00 | Aa1 | 2,048,777 |
| | Development, Residential Revenue Bonds, Series 2019A, 3.750%, 9/01/39 | | | |
| 1,280 | | Maryland Community Development Administration Department of Housing and Community | 9/28 at 100.00 | Aa1 | 1,380,582 |
| | Development, Residential Revenue Bonds, Series 2019B, 3.350%, 9/01/42 | | | |
46
| | | | | | |
| Principal | | | Optional Call | | |
| Amount (000) | | Description (1) | Provisions (2) | Ratings (3) | Value |
| | Housing/Single Family (continued) | | | |
| $ 2,000 | | Maryland Community Development Administration Department of Housing and Community | 3/29 at 100.00 | Aa1 | $ 2,093,460 |
| | Development, Residential Revenue Bonds, Series 2019C, 3.000%, 3/01/42 | | | |
| 2,000 | | Maryland Community Development Administration Department of Housing and Community | 7/29 at 100.00 | AA+ | 2,137,220 |
| | Development, Residential Revenue Bonds, Taxable Series 2019D, 3.350%, 7/01/49 | | | |
| 1,410 | | Montgomery County Housing Opportunities Commission, Maryland, Single Family Mortgage | 7/26 at 100.00 | Aa2 | 1,518,514 |
| | Revenue Bonds, Series 2017A, 3.650%, 7/01/37 | | | |
| 23,750 | | Total Housing/Single Family | | | 25,644,897 |
| | Long-Term Care – 8.7% (5.4% of Total Investments) | | | |
| | Baltimore County, Maryland, Revenue Bonds, Oak Crest Village, Series 2016: | | | |
| 2,220 | | 5.000%, 1/01/37 | 1/26 at 100.00 | A | 2,376,954 |
| 1,000 | | 3.625%, 1/01/37 | 1/26 at 100.00 | A | 1,001,730 |
| 2,500 | | Baltimore County, Maryland, Revenue Bonds, Oak Crest Village, Series 2020, | 1/27 at 103.00 | A | 2,515,775 |
| | 4.000%, 1/01/50 | | | |
| 635 | | Baltimore County, Maryland, Revenue Bonds, Riderwood Village Inc Facility, Series 2020, | 1/27 at 103.00 | A | 659,594 |
| | 4.000%, 1/01/50 | | | |
| 3,000 | | Gaithersburg, Maryland, Economic Development Revenue Bonds, Asbury Methodist Obligated | 1/24 at 104.00 | BBB | 3,162,300 |
| | Group Project, Refunding Series 2018A, 5.000%, 1/01/36 | | | |
| 1,290 | | Howard County, Maryland, Retirement Community Revenue Bonds, Vantage House, Refunding | 4/27 at 100.00 | N/R | 1,123,113 |
| | Series 2016, 5.000%, 4/01/46 | | | |
| 1,710 | | Howard County, Maryland, Retirement Community Revenue Bonds, Vantage House, Refunding | 4/27 at 100.00 | N/R | 1,584,452 |
| | Series 2017, 5.000%, 4/01/36 | | | |
| | Maryland Health and Higher Educational Facilities Authority, Revenue Bonds, Charlestown | | | |
| | Community Issue, Series 2016A: | | | |
| 2,125 | | 5.000%, 1/01/36 | 7/26 at 100.00 | A | 2,318,821 |
| 4,090 | | 5.000%, 1/01/45 | 7/26 at 100.00 | A | 4,388,529 |
| 2,480 | | Maryland Health and Higher Educational Facilities Authority, Revenue Bonds, Mercy Ridge | 6/20 at 100.00 | A | 2,481,190 |
| | Retirement Community, Series 2007, 4.750%, 7/01/34 | | | |
| 1,050 | | Prince George’s County, Maryland, Revenue Bonds, Collington Episcopal Life Care | 4/27 at 100.00 | N/R | 979,829 |
| | Community Inc, Series 2017, 5.250%, 4/01/37 | | | |
| 1,340 | | Rockville Mayor and Council, Maryland, Economic Development Revenue Bonds, Ingleside | 11/24 at 103.00 | BB– | 1,311,766 |
| | King Farm Project, Refunding Series 2017, 5.000%, 11/01/35 | | | |
| 795 | | Rockville Mayor and Council, Maryland, Economic Development Revenue Bonds, Ingleside | 11/24 at 103.00 | BB– | 797,409 |
| | King Farm Project, Refunding Series 2017A-2, 5.000%, 11/01/31 | | | |
| 1,000 | | Rockville Mayor and Council, Maryland, Economic Development Revenue Bonds, Ingleside | 11/24 at 103.00 | BB– | 962,810 |
| | King Farm Project, Series 2017A-1, 5.000%, 11/01/37 | | | |
| | Rockville Mayor and Council, Maryland, Economic Development Revenue Bonds, Series 2017B: | | | |
| 500 | | 5.000%, 11/01/42 | 11/24 at 103.00 | BB– | 466,165 |
| 1,000 | | 5.000%, 11/01/47 | 11/24 at 103.00 | BB– | 912,470 |
| | Washington County Commissioners, Maryland, Revenue Bonds, Diakon Lutheran Social | | | |
| | Ministries Project, Series 2019B: | | | |
| 1,000 | | 5.000%, 1/01/29 | No Opt. Call | BBB+ | 1,107,330 |
| 500 | | 5.000%, 1/01/32 | 1/29 at 100.00 | BBB+ | 546,020 |
| 28,235 | | Total Long-Term Care | | | 28,696,257 |
| | Tax Obligation/General – 11.0% (6.9% of Total Investments) | | | |
| 5,240 | | Huntington Beach Union High School District, Orange County, California, General | No Opt. Call | AA | 4,379,173 |
| | Obligation Bonds, Series 2005, 0.000%, 8/01/30 – AGM Insured | | | |
| 3,510 | | Montgomery County, Maryland, General Obligation Bonds, Refunding Consolidated Public | No Opt. Call | AAA | 3,737,167 |
| | Improvement Series 2017C, 5.000%, 10/01/21 | | | |
| 4,930 | | Patterson Joint Unified School District, Stanislaus County, California, General | No Opt. Call | AA | 2,729,100 |
| | Obligation Bonds, 2008 Election Series 2009B, 0.000%, 8/01/42 – AGM Insured | | | |
47
| | |
| NMY | Nuveen Maryland Quality Municipal Income Fund Portfolio of Investments (continued) May 31, 2020 |
| | | | | | |
| Principal | | | Optional Call | | |
| Amount (000) | | Description (1) | Provisions (2) | Ratings (3) | Value |
| | Tax Obligation/General (continued) | | | |
| | Prince George’s County, Maryland, General Obligation Consolidated Public Improvement | | | |
| | Bonds, Series 2014A: | | | |
| $ 3,000 | | 4.000%, 9/01/30 | 9/24 at 100.00 | AAA | $ 3,378,510 |
| 3,000 | | 4.000%, 9/01/31 | 9/24 at 100.00 | AAA | 3,366,150 |
| 14,985 | | San Ysidro School District, San Diego County, California, General Obligation Bonds, 1997 | No Opt. Call | AA | 8,241,750 |
| | Election Series 2012G, 0.000%, 8/01/40 – AGM Insured | | | |
| 2,000 | | Washington Suburban Sanitary District, Montgomery and Prince George’s Counties, | 6/26 at 100.00 | AAA | 2,439,040 |
| | Maryland, General Obligation Bonds, Consolidated Public Improvement, Second Series 2016, | | | |
| | 5.000%, 6/01/35 | | | |
| 2,500 | | Washington Suburban Sanitary District, Montgomery and Prince George’s Counties, | No Opt. Call | AAA | 3,073,225 |
| | Maryland, General Obligation Bonds, Consolidated Public Improvement, Series 2017, | | | |
| | 5.000%, 6/15/25 | | | |
| 2,500 | | Washington Suburban Sanitary District, Montgomery and Prince George’s Counties, | 6/28 at 100.00 | AAA | 2,939,575 |
| | Maryland, General Obligation Bonds, Consolidated Public Improvement, Series 2018, | | | |
| | 4.000%, 6/01/39 | | | |
| 7,000 | | Wylie Independent School District, Collin County, Texas, General Obligation Bonds, | 8/25 at 35.55 | Aaa | 2,296,630 |
| | Capital Appreciation Series 2015, 0.000%, 8/15/50 | | | |
| 48,665 | | Total Tax Obligation/General | | | 36,580,320 |
| | Tax Obligation/Limited – 34.1% (21.5% of Total Investments) | | | |
| 1,000 | | Anne Arundel County, Maryland, General Obligation Bonds, Consolidated General | 10/29 at 100.00 | AAA | 1,291,420 |
| | Improvement, Series 2019, 5.000%, 10/01/44 | | | |
| 1,200 | | Anne Arundel County, Maryland, Special Tax District Revenue Bonds, Villages of | 7/23 at 100.00 | AA | 1,357,332 |
| | Dorchester & Farmington Village Projects, Series 2013, 5.000%, 7/01/32 | | | |
| 1,450 | | Baltimore, Maryland, Special Obligation Bonds, Center/West Development Project, Series | 6/26 at 100.00 | N/R | 1,379,255 |
| | 2017A, 5.500%, 6/01/43 | | | |
| | Baltimore, Maryland, Special Obligation Bonds, Consolidated Tax Increment Financing, | | | |
| | Series 2015: | | | |
| 525 | | 5.000%, 6/15/30 | 6/24 at 100.00 | BBB+ | 590,499 |
| 425 | | 5.000%, 6/15/33 | 6/24 at 100.00 | BBB+ | 471,376 |
| | Baltimore, Maryland, Special Obligation Bonds, East Baltimore Research Park Project, | | | |
| | Series 2017A: | | | |
| 1,270 | | 4.500%, 9/01/33 | 9/27 at 100.00 | N/R | 1,232,891 |
| 240 | | 5.000%, 9/01/38 | 9/27 at 100.00 | N/R | 240,014 |
| | Baltimore, Maryland, Special Obligation Bonds, Harbor Point Project, Refunding | | | |
| | Series 2016: | | | |
| 1,895 | | 5.000%, 6/01/36 | 6/26 at 100.00 | N/R | 1,822,327 |
| 250 | | 5.125%, 6/01/43 | 6/26 at 100.00 | N/R | 240,370 |
| 2,000 | | Baltimore, Maryland, Special Obligation Bonds, Harbor Point Project, Refunding Series | 6/29 at 100.00 | N/R | 1,626,160 |
| | 2019A, 3.625%, 6/01/46, 144A | | | |
| 350 | | Baltimore, Maryland, Special Obligation Bonds, Harbor Point Project, Refunding Series | 6/23 at 100.00 | N/R | 288,414 |
| | 2019B, 3.875%, 6/01/46, 144A | | | |
| | Brunswick, Frederick County, Maryland, Special Obligation Bonds, Brunswick Crossing | | | |
| | Special Taxing District, Refunding Series 2019: | | | |
| 450 | | 4.000%, 7/01/29 | 1/29 at 100.00 | N/R | 437,616 |
| 740 | | 5.000%, 7/01/36 | 1/29 at 100.00 | N/R | 743,041 |
| | Frederick County, Maryland, Lake Linganore Village Community Development Special | | | |
| | Obligation Bonds, Series 2001A: | | | |
| 21 | | 5.600%, 7/01/20 – RAAI Insured | 6/20 at 100.00 | AA | 21,087 |
| 450 | | 5.700%, 7/01/29 – RAAI Insured | 6/20 at 100.00 | AA | 451,777 |
| 370 | | Frederick County, Maryland, Tax Increment and Special Tax B Limited Obligation Bonds, | 7/29 at 100.00 | N/R | 315,166 |
| | Oakdale-Lake Linganore Project, Series 2019, 3.750%, 7/01/39 | | | |
48
| | | | | | |
| Principal | | | Optional Call | | |
| Amount (000) | | Description (1) | Provisions (2) | Ratings (3) | Value |
| | Tax Obligation/Limited (continued) | | | |
| | Fredrick County, Maryland, Special Obligation Bonds, Urbana Community Development | | | |
| | Authority, Series 2010A: | | | |
| $ 5,335 | | 5.000%, 7/01/30 | 7/20 at 100.00 | A– | $ 5,352,179 |
| 2,345 | | 5.000%, 7/01/40 | 7/20 at 100.00 | A– | 2,351,566 |
| 2,000 | | Government of Guam, Business Privilege Tax Bonds, Refunding Series 2015D, | 11/25 at 100.00 | BB | 2,103,920 |
| | 5.000%, 11/15/34 | | | |
| | Government of Guam, Business Privilege Tax Bonds, Series 2011A: | | | |
| 500 | | 5.000%, 1/01/31 | 1/22 at 100.00 | BB | 509,410 |
| 1,000 | | 5.250%, 1/01/36 | 1/22 at 100.00 | BB | 1,019,680 |
| | Guam Government, Limited Obligation Section 30 Revenue Bonds, Series 2016A: | | | |
| 1,000 | | 5.000%, 12/01/23 | No Opt. Call | BB | 1,057,020 |
| 2,000 | | 5.000%, 12/01/33 | 12/26 at 100.00 | BB | 2,122,680 |
| 2,260 | | 5.000%, 12/01/34 | 12/26 at 100.00 | BB | 2,396,911 |
| 1,175 | | 5.000%, 12/01/46 | 12/26 at 100.00 | BB | 1,225,760 |
| 1,420 | | Howard County, Maryland, Special Obligation Bonds, Annapolis Junction Town Center | 2/24 at 100.00 | N/R | 1,291,234 |
| | Project, Series 2014, 6.100%, 2/15/44 | | | |
| | Howard County, Maryland, Special Obligation Bonds, Downtown Columbia Project, | | | |
| | Series 2017A: | | | |
| 1,500 | | 4.125%, 2/15/34, 144A | 2/26 at 100.00 | N/R | 1,419,315 |
| 1,550 | | 4.375%, 2/15/39, 144A | 2/26 at 100.00 | N/R | 1,463,696 |
| 850 | | 4.500%, 2/15/47, 144A | 2/26 at 100.00 | N/R | 786,497 |
| 1,260 | | Huntington Beach Union High School District, Orange County, California, Certificates of | No Opt. Call | AA | 867,762 |
| | Participation, Capital Project, Series 2007, 0.000%, 9/01/35 – AGM Insured | | | |
| | Hyattsville, Maryland, Special Obligation Bonds, University Town Center Project, Series 2016: | | | |
| 2,125 | | 5.000%, 7/01/31 | 7/25 at 100.00 | N/R | 2,084,200 |
| 1,640 | | 5.000%, 7/01/34 | 7/25 at 100.00 | N/R | 1,561,821 |
| 720 | | Maryland Community Development Administration, Local Government Infrastructure Bonds, | 6/29 at 100.00 | Aa3 | 823,421 |
| | Subordinate Obligation Series 2019B-2, 4.000%, 6/01/49 | | | |
| | Maryland Economic Development Corporation, Special Obligation Bonds, Metro Centre Owings | | | |
| | Mills Project, Series 2017: | | | |
| 585 | | 4.375%, 7/01/36 | 1/27 at 100.00 | N/R | 528,080 |
| 355 | | 4.500%, 7/01/44 | 1/27 at 100.00 | N/R | 313,089 |
| | Maryland Stadium Authority, Lease Revenue Bonds, Baltimore City Public Schools | | | |
| | Construction & Revitalization Program, Series 2016: | | | |
| 4,395 | | 5.000%, 5/01/33 | 5/26 at 100.00 | AA | 5,112,747 |
| 3,650 | | 5.000%, 5/01/35 | 5/26 at 100.00 | AA | 4,222,393 |
| 5,100 | | 5.000%, 5/01/46 (UB) (5) | 5/26 at 100.00 | AA | 5,782,380 |
| | Maryland Stadium Authority, Lease Revenue Bonds, Baltimore City Public Schools | | | |
| | Construction & Revitalization Program, Series 2018A: | | | |
| 2,000 | | 5.000%, 5/01/35 | 5/28 at 100.00 | AA | 2,402,960 |
| 2,000 | | 5.000%, 5/01/36 (UB) (5) | 5/28 at 100.00 | AA | 2,393,180 |
| 6,250 | | 5.000%, 5/01/42 (UB) (5) | 5/28 at 100.00 | AA | 7,365,938 |
| 2,000 | | New Jersey Transportation Trust Fund Authority, Transportation System Bonds, Series | No Opt. Call | BBB+ | 1,139,260 |
| | 2009A, 0.000%, 12/15/32 | | | |
| 320 | | Prince George’s County Revenue Authority, Maryland, Special Obligation Bonds, | 1/26 at 100.00 | N/R | 311,901 |
| | Suitland-Naylor Road Project, Series 2016, 5.000%, 7/01/46, 144A | | | |
| 4,500 | | Prince George’s County, Maryland, Certificates of Participation, University of Maryland | 10/28 at 100.00 | AA+ | 5,605,155 |
| | Capital Region Medical Center, Series 2018, 5.000%, 10/01/43 (UB) (5) | | | |
| 5,711 | | Prince George’s County, Maryland, Special Obligation Bonds, National Harbor Project, | 6/20 at 100.00 | N/R | 5,726,934 |
| | Series 2005, 5.200%, 7/01/34 | | | |
| | Prince George’s County, Maryland, Special Obligation Bonds, Westphalia Town Center | | | |
| | Project, Series 2018: | | | |
| 1,300 | | 5.125%, 7/01/39, 144A | 7/28 at 100.00 | N/R | 1,302,080 |
| 2,200 | | 5.250%, 7/01/48, 144A | 7/28 at 100.00 | N/R | 2,201,474 |
49
| | |
| NMY | Nuveen Maryland Quality Municipal Income Fund Portfolio of Investments (continued) May 31, 2020 |
| | | | | | |
| Principal | | | Optional Call | | |
| Amount (000) | | Description (1) | Provisions (2) | Ratings (3) | Value |
| | Tax Obligation/Limited (continued) | | | |
| $ 2,214 | | Prince George’s County, Maryland, Special Tax District Bonds, Victoria Falls Project, | 6/20 at 100.00 | N/R | $ 2,216,214 |
| | Series 2005, 5.250%, 7/01/35 | | | |
| 1,100 | | Puerto Rico Highway and Transportation Authority, Highway Revenue Bonds, Series 2007N, | No Opt. Call | C | 1,210,836 |
| | 5.500%, 7/01/29 – AMBAC Insured | | | |
| 2,100 | | Puerto Rico Municipal Finance Agency, Series 2002A, 5.250%, 8/01/21 – AGM Insured | 6/20 at 100.00 | AA | 2,113,965 |
| 1,035 | | Puerto Rico Public Finance Corporation, Commonwealth Appropriation Bonds, Series 1998A, | No Opt. Call | Aaa | 1,119,694 |
| | 5.125%, 6/01/24 – AMBAC Insured | | | |
| | Puerto Rico Sales Tax Financing Corporation, Sales Tax Revenue Bonds, Restructured 2018A-1: | | | |
| 53 | | 0.000%, 7/01/24 | No Opt. Call | N/R | 46,678 |
| 90 | | 0.000%, 7/01/27 | No Opt. Call | N/R | 71,087 |
| 88 | | 0.000%, 7/01/29 | 7/28 at 98.64 | N/R | 63,764 |
| 114 | | 0.000%, 7/01/31 | 7/28 at 91.88 | N/R | 75,038 |
| 128 | | 0.000%, 7/01/33 | 7/28 at 86.06 | N/R | 76,856 |
| 1,093 | | 4.500%, 7/01/34 | 7/25 at 100.00 | N/R | 1,105,559 |
| 3,495 | | 0.000%, 7/01/51 | 7/28 at 30.01 | N/R | 663,001 |
| 4,365 | | 5.000%, 7/01/58 | 7/28 at 100.00 | N/R | 4,379,230 |
| | Puerto Rico Sales Tax Financing Corporation, Sales Tax Revenue Bonds, Taxable | | | |
| | Restructured COFINA Project Series 2019A-2: | | | |
| 1,875 | | 4.329%, 7/01/40 | 7/28 at 100.00 | N/R | 1,804,687 |
| 3 | | 4.536%, 7/01/53 | 7/28 at 100.00 | N/R | 2,822 |
| 50 | | 4.784%, 7/01/58 | 7/28 at 100.00 | N/R | 48,582 |
| | Puerto Rico, Highway Revenue Bonds, Highway and Transportation Authority, Refunding | | | |
| | Series 2007CC: | | | |
| 765 | | 5.500%, 7/01/28 – NPFG Insured | No Opt. Call | Baa2 | 782,825 |
| 2,300 | | 5.500%, 7/01/30 – AGM Insured | No Opt. Call | AA | 2,500,008 |
| 1,800 | | Virgin Islands Public Finance Authority, Federal Highway Grant Anticipation Loan Note | 9/25 at 100.00 | A | 2,006,748 |
| | Revenue Bonds, Series 2015, 5.000%, 9/01/33, 144A | | | |
| 2,000 | | Virgin Islands Public Finance Authority, Gross Receipts Taxes Loan Note, Refunding | 6/20 at 100.00 | Baa2 | 2,031,320 |
| | Series 2006, 5.000%, 10/01/27 – FGIC Insured | | | |
| 2,240 | | Virgin Islands Public Finance Authority, Gross Receipts Taxes Loan Note, Working Capital | 10/24 at 100.00 | AA | 2,522,957 |
| | Series 2014A, 5.000%, 10/01/34 – AGM Insured, 144A | | | |
| 1,035 | | Virgin Islands Public Finance Authority, Matching Fund Loan Notes Revenue Bonds, Senior | 6/20 at 100.00 | AA | 1,071,918 |
| | Lien Series 2009A-1, 5.000%, 10/01/29 – AGM Insured | | | |
| 1,730 | | Virgin Islands Public Finance Authority, Matching Fund Loan Notes Revenue Bonds, Senior | No Opt. Call | AA | 1,890,094 |
| | Lien, Refunding Series 2013B, 5.000%, 10/01/24 – AGM Insured | | | |
| 111,355 | | Total Tax Obligation/Limited | | | 113,157,271 |
| | Transportation – 12.8% (8.1% of Total Investments) | | | |
| 60 | | Baltimore, Maryland, Revenue Refunding Bonds, Parking System Facilities, Series 1998A, | No Opt. Call | A1 | 61,741 |
| | 5.250%, 7/01/21 – FGIC Insured | | | |
| 125 | | Guam International Airport Authority, Revenue Bonds, Series 2013C, 6.375%, 10/01/43 (AMT) | 10/23 at 100.00 | BBB+ | 128,121 |
| | Guam Port Authority, Port Revenue Bonds, Private Activity Series 2018B: | | | |
| 510 | | 5.000%, 7/01/32 (AMT) | 7/28 at 100.00 | A | 563,815 |
| 355 | | 5.000%, 7/01/33 (AMT) | 7/28 at 100.00 | A | 389,733 |
| 600 | | Maryland Economic Development Corporation Economic Development Revenue Bonds, Terminal | 6/29 at 100.00 | Baa3 | 605,664 |
| | Project, Series 2019A, 5.000%, 6/01/49 (AMT) | | | |
| | Maryland Economic Development Corporation Economic Development Revenue Bonds, | | | |
| | Transportation Facilities Project, Refunding Series 2017A: | | | |
| 1,000 | | 5.000%, 6/01/31 | 6/28 at 100.00 | Baa3 | 1,063,810 |
| 1,125 | | 5.000%, 6/01/32 | 6/28 at 100.00 | Baa3 | 1,183,849 |
| 3,360 | | 5.000%, 6/01/35 | 6/28 at 100.00 | Baa3 | 3,486,437 |
50
| | | | | | |
| Principal | | | Optional Call | | |
| Amount (000) | | Description (1) | Provisions (2) | Ratings (3) | Value |
| | Transportation (continued) | | | |
| $ 1,500 | | Maryland Economic Development Corporation, Air Cargo Obligated Group Revenue Bonds, AFCO | 7/29 at 100.00 | BBB | $ 1,533,735 |
| | Airport Real Estate Group, Series 2019, 4.000%, 7/01/44 (AMT) | | | |
| | Maryland Economic Development Corporation, Parking Facilities Revenue Bonds Baltimore | | | |
| | City Project, Subordinate Parking Facilities Revenue Bonds, Series 2018C: | | | |
| 1,250 | | 4.000%, 6/01/48 | 6/28 at 100.00 | BBB– | 998,825 |
| 1,115 | | 4.000%, 6/01/58 | 6/28 at 100.00 | BBB– | 849,597 |
| 3,725 | | Maryland Economic Development Corporation, Parking Facilities Revenue Bonds, Baltimore | 6/28 at 100.00 | BBB | 3,748,058 |
| | City Project, Senior Parking Facilities Revenue Bonds, Series 2018A, 5.000%, 6/01/58 | | | |
| | Maryland Economic Development Corporation, Private Activity Revenue Bonds AP, Purple | | | |
| | Line Light Rail Project, Green Bonds, Series 2016D: | | | |
| 2,000 | | 5.000%, 9/30/28 (AMT) | 9/26 at 100.00 | BB | 1,978,420 |
| 1,000 | | 5.000%, 9/30/31 (AMT) | 9/26 at 100.00 | BB | 986,330 |
| 5,825 | | 5.000%, 3/31/46 (AMT) | 9/26 at 100.00 | BB | 5,692,423 |
| 2,200 | | 5.000%, 3/31/51 (AMT) | 9/26 at 100.00 | BB | 2,145,814 |
| | Maryland Health and Higher Educational Facilities Authority, Parking Facilities Revenue | | | |
| | Bonds, Johns Hopkins Hospital, Series 2001: | | | |
| 1,300 | | 5.000%, 7/01/27 – AMBAC Insured | 6/20 at 100.00 | N/R | 1,311,115 |
| 1,000 | | 5.000%, 7/01/34 – AMBAC Insured | 6/20 at 100.00 | N/R | 1,008,600 |
| 405 | | Maryland Health and Higher Educational Facilities Authority, Parking Facilities Revenue | 6/20 at 100.00 | N/R | 405,381 |
| | Bonds, Johns Hopkins Medical Institutions, Series 1996, 5.500%, 7/01/26 – AMBAC Insured | | | |
| 2,000 | | Metropolitan Washington Airports Authority, Virginia, Dulles Toll Road Revenue Bonds, | 10/29 at 100.00 | A– | 2,044,380 |
| | Dulles Metrorail & Capital improvement Projects, Refunding & Subordinate Lien Series 2019B, | | | |
| | 4.000%, 10/01/44 | | | |
| 3,000 | | New York Transportation Development Corporation, New York, Special Facilities Bonds, | 7/24 at 100.00 | BBB | 3,133,710 |
| | LaGuardia Airport Terminal B Redevelopment Project, Series 2016A, 5.000%, 7/01/46 (AMT) | | | |
| | New York Transportation Development Corporation, New York, Special Facility Revenue | | | |
| | Bonds, American Airlines, Inc John F Kennedy International Airport Project, Refunding Series 2016: | | | |
| 175 | | 5.000%, 8/01/26 (AMT) | 8/21 at 100.00 | BB– | 168,966 |
| 680 | | 5.000%, 8/01/31 (AMT) | 8/21 at 100.00 | BB– | 655,710 |
| | Port Authority of New York and New Jersey, Special Project Bonds, JFK International Air | | | |
| | Terminal LLC, Sixth Series 1997: | | | |
| 10 | | 5.750%, 12/01/22 – NPFG Insured (AMT) | 6/20 at 100.00 | BBB+ | 10,055 |
| 70 | | 5.750%, 12/01/25 – NPFG Insured (AMT) | 6/20 at 100.00 | BBB+ | 70,381 |
| 530 | | Texas Private Activity Bond Surface Transportation Corporation, Revenue Bonds, NTE | 12/29 at 100.00 | Baa2 | 541,904 |
| | Mobility Partners LLC North Tarrant Express Managed Lanes Project, Refunding Senior Lien | | | |
| | Series 2019A, 4.000%, 12/31/39 | | | |
| 1,000 | | Washington Metropolitan Area Transit Authority, District of Columbia, Gross Revenue | 7/27 at 100.00 | AA | 1,200,520 |
| | Bonds, Refunding Crossover Series 2017A-2, 5.000%, 7/01/33 | | | |
| | Washington Metropolitan Area Transit Authority, District of Columbia, Gross Revenue | | | |
| | Bonds, Series 2017B: | | | |
| 1,500 | | 5.000%, 7/01/29 | 7/27 at 100.00 | AA | 1,858,530 |
| 3,000 | | 5.000%, 7/01/42 | 7/27 at 100.00 | AA | 3,512,790 |
| 1,000 | | Washington Metropolitan Area Transit Authority, District of Columbia, Gross Revenue | 7/27 at 100.00 | AA– | 1,180,550 |
| | Bonds, Series 2018, 5.000%, 7/01/38 | | | |
| 41,420 | | Total Transportation | | | 42,518,964 |
| | U.S. Guaranteed – 15.3% (9.6% of Total Investments) (6) | | | |
| | Baltimore, Maryland, General Obligation Bonds, Consolidated Public Improvements, Series 2011A: | | | |
| 1,000 | | 5.000%, 10/15/29 (Pre-refunded 10/15/21) | 10/21 at 100.00 | AA | 1,066,320 |
| 1,200 | | 5.000%, 10/15/30 (Pre-refunded 10/15/21) | 10/21 at 100.00 | AA | 1,279,584 |
| 2,000 | | Baltimore, Maryland, Revenue Bonds, Water Projects, Refunding Series 1994A, 5.000%, | No Opt. Call | AA– | 2,233,840 |
| | 7/01/24 – FGIC Insured (ETM) | | | |
| 2,875 | | Baltimore, Maryland, Revenue Bonds, Water Projects, Refunding Series 1998A, 5.000%, | No Opt. Call | AA | 3,374,847 |
| | 7/01/28 – FGIC Insured (ETM) | | | |
51
| | |
| NMY | Nuveen Maryland Quality Municipal Income Fund Portfolio of Investments (continued) May 31, 2020 |
| | | | | | |
| Principal | | | Optional Call | | |
| Amount (000) | | Description (1) | Provisions (2) | Ratings (3) | Value |
| | U.S. Guaranteed (6) (continued) | | | |
| | Maryland Health and Higher Educational Facilities Authority, Revenue Bonds, Carroll | | | |
| | Hospital Center, Series 2012A: | | | |
| $ 1,000 | | 4.000%, 7/01/30 (Pre-refunded 7/01/22) | 7/22 at 100.00 | A1 | $ 1,075,160 |
| 1,775 | | 5.000%, 7/01/37 (Pre-refunded 7/01/22) | 7/22 at 100.00 | A1 | 1,945,169 |
| | Maryland Health and Higher Educational Facilities Authority, Revenue Bonds, Charlestown | | | |
| | Community Issue, Series 2010: | | | |
| 1,695 | | 6.125%, 1/01/30 (Pre-refunded 1/01/21) | 1/21 at 100.00 | N/R | 1,750,494 |
| 5,070 | | 6.250%, 1/01/45 (Pre-refunded 1/01/21) | 1/21 at 100.00 | N/R | 5,239,693 |
| 2,845 | | Maryland Health and Higher Educational Facilities Authority, Revenue Bonds, Helix | No Opt. Call | N/R | 3,314,539 |
| | Health, Series 1997, 5.000%, 7/01/27 – AMBAC Insured (ETM) | | | |
| | Maryland Health and Higher Educational Facilities Authority, Revenue Bonds, Johns | | | |
| | Hopkins Health System Obligated Group Issue, Series 2011A: | | | |
| 500 | | 5.000%, 5/15/25 (Pre-refunded 5/15/21) | 5/21 at 100.00 | Aa2 | 523,080 |
| 500 | | 5.000%, 5/15/26 (Pre-refunded 5/15/21) | 5/21 at 100.00 | Aa2 | 523,080 |
| | Maryland Health and Higher Educational Facilities Authority, Revenue Bonds, Johns | | | |
| | Hopkins University, Series 2012A: | | | |
| 1,145 | | 5.000%, 7/01/30 (Pre-refunded 7/01/22) | 7/22 at 100.00 | AA+ | 1,256,031 |
| 1,050 | | 5.000%, 7/01/37 (Pre-refunded 7/01/22) | 7/22 at 100.00 | AA+ | 1,151,818 |
| | Maryland Health and Higher Educational Facilities Authority, Revenue Bonds, LifeBridge | | | |
| | Health System, Series 2011: | | | |
| 500 | | 5.750%, 7/01/31 (Pre-refunded 7/01/21) | 7/21 at 100.00 | A+ | 529,655 |
| 1,000 | | 6.000%, 7/01/41 (Pre-refunded 7/01/21) | 7/21 at 100.00 | A+ | 1,061,780 |
| 1,250 | | Maryland Health and Higher Educational Facilities Authority, Revenue Bonds, Loyola | 10/22 at 100.00 | A | 1,385,712 |
| | University Maryland, Series 2012A, 5.000%, 10/01/39 (Pre-refunded 10/01/22) | | | |
| 12,250 | | Maryland Health and Higher Educational Facilities Authority, Revenue Bonds, Western | 7/24 at 100.00 | N/R | 14,586,442 |
| | Maryland Health, Series 2014, 5.250%, 7/01/34 (Pre-refunded 7/01/24) | | | |
| 8,000 | | Montgomery County, Maryland, Revenue Bonds, Trinity Health Credit Group, Refunding | 12/21 at 100.00 | AA– | 8,561,280 |
| | Series 2011MD, 5.000%, 12/01/40 (Pre-refunded 12/01/21) | | | |
| 45,655 | | Total U.S. Guaranteed | | | 50,858,524 |
| | Utilities – 1.6% (1.0% of Total Investments) | | | |
| 2,000 | | Beaver County Industrial Development Authority, Pennsylvania, Pollution Control Revenue | No Opt. Call | N/R | 2,000,000 |
| | Bonds, FirstEnergy Generation Project, Refunding Series 2006A, 4.375%, 1/01/35 (Mandatory | | | |
| | Put 7/01/22) (4) | | | |
| 1,250 | | Guam Power Authority, Revenue Bonds, Series 2012A, 5.000%, 10/01/30 – AGM Insured | 10/22 at 100.00 | AA | 1,339,425 |
| | Guam Power Authority, Revenue Bonds, Series 2014A: | | | |
| 600 | | 5.000%, 10/01/39 | 10/24 at 100.00 | AA | 650,832 |
| 575 | | 5.000%, 10/01/44 | 10/24 at 100.00 | AA | 619,861 |
| 730 | | Virgin Islands Water and Power Authority, Electric System Revenue Bonds, Refunding | 6/20 at 100.00 | CCC | 679,681 |
| | Series 2007A, 5.000%, 7/01/24 | | | |
| 5,155 | | Total Utilities | | | 5,289,799 |
| | Water and Sewer – 8.9% (5.6% of Total Investments) | | | |
| 2,480 | | Baltimore, Maryland, Project and Revenue Refunding Bonds, Water Projects, Series 2013B, | 1/24 at 100.00 | AA– | 2,766,837 |
| | 5.000%, 7/01/38 | | | |
| 1,000 | | Baltimore, Maryland, Revenue Bonds, Storm Water Projects, Series 2019A, 5.000%, 7/01/49 | 7/29 at 100.00 | Aa2 | 1,254,520 |
| 2,000 | | Baltimore, Maryland, Revenue Bonds, Wastewater Projects, Series 2011A, 5.000%, 7/01/41 | 7/21 at 100.00 | AA | 2,086,340 |
| 2,000 | | Baltimore, Maryland, Revenue Bonds, Wastewater Projects, Series 2019A, 5.000%, 7/01/49 | 7/29 at 100.00 | AA | 2,509,040 |
| | Baltimore, Maryland, Revenue Bonds, Wastewater Projects, Subordinate Series 2017A: | | | |
| 2,000 | | 5.000%, 7/01/46 | 1/27 at 100.00 | AA– | 2,349,400 |
| 2,000 | | 5.000%, 7/01/46 (UB) | 1/27 at 100.00 | AA– | 2,349,400 |
| 490 | | Baltimore, Maryland, Revenue Bonds, Water Projects, Refunding Series 1994A, 5.000%, | No Opt. Call | AA– | 514,147 |
| | 7/01/24 – FGIC Insured | | | |
52
| | | | | | |
| Principal | | | Optional Call | | |
| Amount (000) | | Description (1) | Provisions (2) | Ratings (3) | Value |
| | Water and Sewer (continued) | | | |
| $ 2,500 | | Baltimore, Maryland, Revenue Bonds, Water Projects, Subordinate Series 2014A, | 1/25 at 100.00 | A+ | $ 2,802,725 |
| | 5.000%, 7/01/44 | | | |
| 6,000 | | Baltimore, Maryland, Revenue Bonds, Water Projects, Subordinate Series 2017A, | 1/27 at 100.00 | AA– | 7,098,720 |
| | 5.000%, 7/01/41 (UB) | | | |
| 1,300 | | Guam Government Waterworks Authority, Water and Wastewater System Revenue Bonds, | 7/24 at 100.00 | A– | 1,369,927 |
| | Refunding Series 2014A, 5.000%, 7/01/35 | | | |
| 2,030 | | Guam Government Waterworks Authority, Water and Wastewater System Revenue Bonds, Series | 7/23 at 100.00 | A– | 2,138,321 |
| | 2013, 5.500%, 7/01/43 | | | |
| | Guam Government Waterworks Authority, Water and Wastewater System Revenue Bonds, | | | |
| | Series 2016: | | | |
| 245 | | 5.000%, 7/01/27 | 7/26 at 100.00 | A– | 272,562 |
| 1,240 | | 5.000%, 1/01/46 | 7/26 at 100.00 | A– | 1,326,044 |
| 500 | | Puerto Rico Aqueduct and Sewerage Authority, Revenue Bonds, Senior Lien Series 2012A, | 7/22 at 100.00 | CC | 508,750 |
| | 6.000%, 7/01/47 | | | |
| 25,785 | | Total Water and Sewer | | | 29,346,733 |
| $ 526,065 | | Total Long-Term Investments (cost $505,401,414) | | | 526,951,937 |
| | Floating Rate Obligations – (8.6)% | | | (28,405,000) |
| | Adjustable Rate MuniFund Term Preferred Shares, net of deferred offering costs – (54.8)% (7) | | | (181,896,908) |
| | Other Assets Less Liabilities – 4.6% | | | 15,262,733 |
| | Net Asset Applicable to Common Shares – 100% | | | $ 331,912,762 |
| | |
(1) | All percentages shown in the Portfolio of Investments are based on net assets applicable to common shares unless otherwise noted. |
(2) | Optional Call Provisions: Dates (month and year) and prices of the earliest optional call or redemption. There may be other call provisions at varying prices at later dates. Certain mortgage-backed securities may be subject to periodic principal paydowns. Optional Call Provisions are not covered by the report of independent registered public accounting firm. |
(3) | For financial reporting purposes, the ratings disclosed are the highest of Standard & Poor’s Group (“Standard & Poor’s”), Moody’s Investors Service, Inc. (“Moody’s”) or Fitch, Inc. (“Fitch”) rating. This treatment of split-rated securities may differ from that used for other purposes, such as for Fund investment policies. Ratings below BBB by Standard Poor’s, Baa by Moody’s or BBB by Fitch are considered to be below investment grade. Holdings designated N/R are not rated by any of these national rating agencies. Ratings are not covered by the report of independent registered public accounting firm. |
(4) | Defaulted security. A security whose issuer has failed to fully pay principal and/or interest when due, or is under the protection of bankruptcy. |
(5) | Investment, or portion of investment, has been pledged to collateralize the net payment obligations for investments in inverse floating rate transactions. |
(6) | Backed by an escrow or trust containing sufficient U.S. Government or U.S. Government agency securities, which ensure the timely payment of principal and interest. |
(7) | Adjustable Rate MuniFund Term Preferred Shares, net of deferred offering cost as a percentage of Total Investments is 34.5%. |
144A | Investment is exempt from registration under Rule 144A of the Securities Act of 1933, as amended. These investments may only be resold in transactions exempt from registration, which are normally those transactions with qualified institutional buyers. |
AMT | Alternative Minimum Tax |
ETM | Escrowed to maturity |
UB | Underlying bond of an inverse floating rate trust reflected as a financing transaction. See Notes to Financial Statements, Note 4 – Portfolio Securities and Investments in Derivatives for more information. |
| See accompanying notes to financial statements. |
53
| | |
| NMT | Nuveen Massachusetts Quality Municipal Income Fund Portfolio of Investments May 31, 2020 |
| | | | | | |
| Principal | | | Optional Call | | |
| Amount (000) | | Description (1) | Provisions (2) | Ratings (3) | Value |
| | LONG-TERM INVESTMENTS – 150.8% (100.0% of Total Investments) | | | |
| | MUNICIPAL BONDS – 150.8% (100.0% of Total Investments) | | | |
| | Education and Civic Organizations – 45.9% (30.4% of Total Investments) | | | |
| $ 210 | | Lowell, Massachusetts, Collegiate Charter School Revenue Bonds, Series 2019, | 6/26 at 100.00 | N/R | $ 192,289 |
| | 5.000%, 6/15/49 | | | |
| | Massachusetts Development Finance Agency, Revenue Bonds, Boston University, Tender | | | |
| | Option Bond Trust 2016-XG0070: | | | |
| 1,880 | | 17.561%, 10/01/48, 144A (IF) (4) | 10/23 at 100.00 | AA– | 2,658,320 |
| 575 | | 17.459%, 10/01/48, 144A (IF) (4) | 10/23 at 100.00 | AA– | 812,757 |
| 3,515 | | Massachusetts Development Finance Agency, Revenue Bonds, Berklee College of Music, | 10/26 at 100.00 | A | 3,914,655 |
| | Series 2016, 5.000%, 10/01/39 | | | |
| 2,200 | | Massachusetts Development Finance Agency, Revenue Bonds, Boston College, Series 2013S, | 7/23 at 100.00 | AA– | 2,441,406 |
| | 5.000%, 7/01/38 | | | |
| 730 | | Massachusetts Development Finance Agency, Revenue Bonds, Boston College, Series 2017T, | 7/27 at 100.00 | AA– | 878,511 |
| | 5.000%, 7/01/42 | | | |
| | Massachusetts Development Finance Agency, Revenue Bonds, Emerson College, Series 2017A: | | | |
| 2,000 | | 5.000%, 1/01/34 | 1/28 at 100.00 | BBB+ | 2,190,540 |
| 2,240 | | 5.000%, 1/01/37 | 1/28 at 100.00 | BBB+ | 2,431,856 |
| 1,955 | | Massachusetts Development Finance Agency, Revenue Bonds, Lesley University, Series 2016, | 7/26 at 100.00 | A– | 2,207,781 |
| | 5.000%, 7/01/35 | | | |
| 1,500 | | Massachusetts Development Finance Agency, Revenue Bonds, Massachusetts Institute of | No Opt. Call | AAA | 2,510,415 |
| | Technology, Series 2020P, 5.000%, 7/01/50 | | | |
| | Massachusetts Development Finance Agency, Revenue Bonds, MCPHS University Issue, | | | |
| | Series 2015H: | | | |
| 450 | | 3.500%, 7/01/35 | 7/25 at 100.00 | AA | 485,595 |
| 190 | | 5.000%, 7/01/37 | 7/25 at 100.00 | AA | 220,725 |
| 1,200 | | Massachusetts Development Finance Agency, Revenue Bonds, Merrimack College, Series 2017, | 7/26 at 100.00 | BBB– | 1,223,544 |
| | 5.000%, 7/01/47 | | | |
| 550 | | Massachusetts Development Finance Agency, Revenue Bonds, Northeastern University, Series | 10/22 at 100.00 | A1 | 593,356 |
| | 2012, 5.000%, 10/01/31 | | | |
| | Massachusetts Development Finance Agency, Revenue Bonds, Northeastern University, | | | |
| | Series 2014A: | | | |
| 875 | | 5.000%, 3/01/39 | 3/24 at 100.00 | A1 | 967,785 |
| 1,400 | | 5.000%, 3/01/44 | 3/24 at 100.00 | A1 | 1,539,944 |
| 500 | | Massachusetts Development Finance Agency, Revenue Bonds, Simmons College, Series 2013J, | 10/23 at 100.00 | BBB+ | 529,630 |
| | 5.250%, 10/01/39 | | | |
| 1,100 | | Massachusetts Development Finance Agency, Revenue Bonds, Simmons University Issue, | 10/30 at 100.00 | BBB+ | 1,079,078 |
| | Series 2020M, 4.000%, 10/01/38 | | | |
| 1,230 | | Massachusetts Development Finance Agency, Revenue Bonds, Sterling and Francine Clark Art | 7/25 at 100.00 | AA | 1,452,790 |
| | Institute, Series 2015, 5.000%, 7/01/33 | | | |
| 450 | | Massachusetts Development Finance Agency, Revenue Bonds, Suffolk University, Refunding | 7/29 at 100.00 | Baa2 | 488,952 |
| | Series 2019, 5.000%, 7/01/36 | | | |
| | Massachusetts Development Finance Agency, Revenue Bonds, The Broad Institute, | | | |
| | Series 2017: | | | |
| 2,200 | | 5.000%, 4/01/35 | 10/27 at 100.00 | AA– | 2,724,788 |
| 1,250 | | 5.000%, 4/01/36 | 10/27 at 100.00 | AA– | 1,542,212 |
| 875 | | Massachusetts Development Finance Agency, Revenue Bonds, Tufts University, Series 2015Q, | 8/25 at 100.00 | Aa2 | 1,017,039 |
| | 5.000%, 8/15/38 | | | |
| 1,325 | | Massachusetts Development Finance Agency, Revenue Bonds, Wheaton College, Series 2017H, | 1/28 at 100.00 | A3 | 1,480,661 |
| | 5.000%, 1/01/42 | | | |
54
| | | | | | |
| Principal | | | Optional Call | | |
| Amount (000) | | Description (1) | Provisions (2) | Ratings (3) | Value |
| | Education and Civic Organizations (continued) | | | |
| $ 1,510 | | Massachusetts Development Finance Agency, Revenue Bonds, Woods Hole Oceanographic | 6/28 at 100.00 | AA– | $ 1,850,913 |
| | Institution, Series 2018, 5.000%, 6/01/43 | | | |
| 1,365 | | Massachusetts Development Finance Agency, Revenue Bonds, Worcester Polytechnic | 9/22 at 100.00 | A | 1,416,051 |
| | Institute, Series 2012, 5.000%, 9/01/50 | | | |
| 840 | | Massachusetts Development Finance Agency, Revenue Bonds, Worcester Polytechnic | 9/26 at 100.00 | A | 930,779 |
| | Institute, Series 2016, 5.000%, 9/01/37 | | | |
| | Massachusetts Development Finance Agency, Revenue Bonds, Worcester Polytechnic | | | |
| | Institute, Series 2017: | | | |
| 550 | | 5.000%, 9/01/42 | 9/27 at 100.00 | A | 611,364 |
| 700 | | 5.000%, 9/01/47 | 9/27 at 100.00 | A | 773,262 |
| 2,500 | | Massachusetts Development Finance Agency, Revenue Bonds, Worcester Polytechnic | 9/27 at 100.00 | A | 2,778,925 |
| | Institute, Series 2017B, 5.000%, 9/01/42 | | | |
| 1,000 | | Massachusetts Development Finance Agency, Revenue Bonds, Worcester Polytechnic | 9/29 at 100.00 | A | 1,045,630 |
| | Institute, Series 2019, 4.000%, 9/01/44 | | | |
| 500 | | Massachusetts Development Finance Authority, Revenue Bonds, Suffolk University, | 7/27 at 100.00 | Baa2 | 537,540 |
| | Refunding Series 2017, 5.000%, 7/01/35 | | | |
| 3,000 | | Massachusetts Development Finance Authority, Revenue Bonds, WGBH Educational Foundation, | No Opt. Call | AA– | 4,697,190 |
| | Series 2002A, 5.750%, 1/01/42 – AMBAC Insured | | | |
| 2,495 | | Massachusetts Development Finance Authority, Revenue Bonds, WGBH Educational Foundation, | 7/26 at 100.00 | AA– | 2,983,122 |
| | Series 2016, 5.000%, 1/01/40 | | | |
| | Massachusetts Development Finance Authority, Revenue Refunding Bonds, Boston University, | | | |
| | Series 1999P: | | | |
| 1,090 | | 6.000%, 5/15/29 | No Opt. Call | Aa3 | 1,456,970 |
| 1,000 | | 6.000%, 5/15/59 | 5/29 at 105.00 | Aa3 | 1,334,130 |
| 320 | | Massachusetts Educational Financing Authority, Education Loan Revenue Bonds, Series | 7/21 at 100.00 | AA | 331,411 |
| | 2011J, 5.625%, 7/01/33 (AMT) | | | |
| 255 | | Massachusetts Health and Educational Facilities Authority, Revenue Bonds, Northeastern | 10/20 at 100.00 | A1 | 258,198 |
| | University, Series 2010A, 4.875%, 10/01/35 | | | |
| 380 | | University of Massachusetts Building Authority, Project Revenue Bonds, Senior Series | 11/24 at 100.00 | Aa2 | 432,866 |
| | 2014-1, 5.000%, 11/01/44 | | | |
| 4,000 | | University of Massachusetts Building Authority, Project Revenue Bonds, Senior Series | 11/25 at 100.00 | Aa2 | 4,698,560 |
| | 2015-1, 5.000%, 11/01/40 | | | |
| 690 | | University of Massachusetts Building Authority, Project Revenue Bonds, Senior Series | 11/29 at 100.00 | Aa2 | 891,742 |
| | 2020-1, 5.000%, 11/01/36 | | | |
| 52,595 | | Total Education and Civic Organizations | | | 62,613,282 |
| | Health Care – 31.6% (20.9% of Total Investments) | | | |
| 1,000 | | Massachusetts Development Finance Agency Revenue Bonds, Children’s Hospital Issue, | 10/24 at 100.00 | AA | 1,114,090 |
| | Series 2014P, 5.000%, 10/01/46 | | | |
| 1,340 | | Massachusetts Development Finance Agency Revenue Bonds, South Shore Hospital, Series | 7/26 at 100.00 | BBB+ | 1,484,425 |
| | 2016I, 5.000%, 7/01/41 | | | |
| 1,410 | | Massachusetts Development Finance Agency, Hospital Revenue Bonds, Cape Cod Healthcare | 11/23 at 100.00 | AA– | 1,537,210 |
| | Obligated Group, Series 2013, 5.250%, 11/15/41 | | | |
| 1,000 | | Massachusetts Development Finance Agency, Revenue Bonds, Baystate Medical Center Issue, | 7/24 at 100.00 | A+ | 1,090,880 |
| | Series 2014N, 5.000%, 7/01/44 | | | |
| | Massachusetts Development Finance Agency, Revenue Bonds, Berkshire Health Systems, | | | |
| | Series 2012G: | | | |
| 895 | | 5.000%, 10/01/29 | 10/21 at 100.00 | AA– | 930,782 |
| 700 | | 5.000%, 10/01/31 | 10/21 at 100.00 | AA– | 725,795 |
| 500 | | Massachusetts Development Finance Agency, Revenue Bonds, Boston Medical Center Issue, | 7/26 at 100.00 | BBB | 556,375 |
| | Series 2016E, 5.000%, 7/01/32 | | | |
| 1,675 | | Massachusetts Development Finance Agency, Revenue Bonds, CareGroup Issue, Refunding | 7/26 at 100.00 | A | 1,957,556 |
| | Series 2016-I, 5.000%, 7/01/30 | | | |
55
| | |
| NMT | Nuveen Massachusetts Quality Municipal Income Fund Portfolio of Investments (continued) May 31, 2020 |
| | | | | | |
| Principal | | | Optional Call | | |
| Amount (000) | | Description (1) | Provisions (2) | Ratings (3) | Value |
| | Health Care (continued) | | | |
| | Massachusetts Development Finance Agency, Revenue Bonds, CareGroup Issue, | | | |
| | Series 2015H-1: | | | |
| $ 900 | | 5.000%, 7/01/30 | 7/25 at 100.00 | A | $ 1,029,519 |
| 1,000 | | 5.000%, 7/01/32 | 7/25 at 100.00 | A | 1,133,900 |
| 500 | | 5.000%, 7/01/33 | 7/25 at 100.00 | A | 564,790 |
| | Massachusetts Development Finance Agency, Revenue Bonds, CareGroup Issue, Series 2018J-2: | | | |
| 1,500 | | 5.000%, 7/01/38 | 7/28 at 100.00 | A | 1,750,215 |
| 2,000 | | 5.000%, 7/01/43 | 7/28 at 100.00 | A | 2,284,840 |
| 1,000 | | Massachusetts Development Finance Agency, Revenue Bonds, Covenant Health System | 7/22 at 100.00 | BBB | 1,053,770 |
| | Obligated Group, Series 2012, 5.000%, 7/01/31 | | | |
| 2,800 | | Massachusetts Development Finance Agency, Revenue Bonds, Dana-Farber Cancer Institute | 12/26 at 100.00 | A1 | 3,177,412 |
| | Issue, Series 2016N, 5.000%, 12/01/46 | | | |
| 3,500 | | Massachusetts Development Finance Agency, Revenue Bonds, Lahey Health System Obligated | 8/25 at 100.00 | A | 3,882,865 |
| | Group Issue, Series 2015F, 5.000%, 8/15/45 | | | |
| 1,080 | | Massachusetts Development Finance Agency, Revenue Bonds, Milford Regional Medical Center | 7/23 at 100.00 | BB+ | 1,122,541 |
| | Issue, Series 2014F, 5.750%, 7/15/43 | | | |
| 3,450 | | Massachusetts Development Finance Agency, Revenue Bonds, Partners HealthCare System | 7/26 at 100.00 | AA– | 3,948,870 |
| | Issue, Series 2016Q, 5.000%, 7/01/47 | | | |
| | Massachusetts Development Finance Agency, Revenue Bonds, Partners HealthCare System | | | |
| | Issue, Series 2017S-1: | | | |
| 2,200 | | 5.000%, 7/01/37 | 1/28 at 100.00 | AA– | 2,611,554 |
| 2,100 | | 4.000%, 7/01/41 | 1/28 at 100.00 | AA– | 2,346,309 |
| 820 | | Massachusetts Development Finance Agency, Revenue Bonds, Southcoast Health System | 7/23 at 100.00 | BBB+ | 871,701 |
| | Obligated Group Issue, Series 2013F, 5.000%, 7/01/37 | | | |
| | Massachusetts Development Finance Agency, Revenue Bonds, The Lowell General Hospital, | | | |
| | Series 2013G: | | | |
| 1,000 | | 5.000%, 7/01/37 | 7/23 at 100.00 | BBB+ | 1,063,050 |
| 2,200 | | 5.000%, 7/01/44 | 7/23 at 100.00 | BBB+ | 2,309,582 |
| 610 | | Massachusetts Development Finance Agency, Revenue Bonds, UMass Memorial Health Care | 1/27 at 100.00 | A– | 667,505 |
| | Obligated Group Issue, Series 2017K, 5.000%, 7/01/38 | | | |
| | Massachusetts Development Finance Agency, Revenue Bonds, UMass Memorial Health Care | | | |
| | Obligated Group Issue, Series 2017L: | | | |
| 400 | | 3.625%, 7/01/37 | 7/27 at 100.00 | A– | 403,184 |
| 1,095 | | 5.000%, 7/01/44 | 7/27 at 100.00 | A– | 1,191,053 |
| 445 | | Massachusetts Development Finance Agency, Revenue Bonds, UMass Memorial Health Care, | 7/26 at 100.00 | A– | 487,631 |
| | Series 2016I, 5.000%, 7/01/36 | | | |
| 25 | | Massachusetts Development Finance Agency, Revenue Bonds, UMass Memorial Health, Series | 7/21 at 100.00 | BBB+ | 25,850 |
| | 2011H, 5.500%, 7/01/31 | | | |
| 280 | | Massachusetts Development Finance Agency, Revenue Bonds, Wellforce Issue, Series 2019A, | 1/29 at 100.00 | BBB+ | 312,522 |
| | 5.000%, 7/01/44 | | | |
| 1,495 | | Massachusetts Health and Educational Facilities Authority, Revenue Bonds, Milford | 6/20 at 100.00 | BB+ | 1,496,226 |
| | Regional Medical Center, Series 2007E, 5.000%, 7/15/32 | | | |
| 38,920 | | Total Health Care | | | 43,132,002 |
| | Housing/Multifamily – 0.7% (0.5% of Total Investments) | | | |
| 215 | | Massachusetts Housing Finance Agency, Housing Bonds, Series 2003H, 5.125%, 6/01/43 | 6/20 at 100.00 | AA | 215,297 |
| 745 | | Massachusetts Housing Finance Agency, Housing Bonds, Series 2019B-1, 3.100%, 12/01/44 | 12/28 at 100.00 | AA | 778,130 |
| 960 | | Total Housing/Multifamily | | | 993,427 |
56
| | | | | | |
| Principal | | | Optional Call | | |
| Amount (000) | | Description (1) | Provisions (2) | Ratings (3) | Value |
| | Long-Term Care – 3.1% (2.0% of Total Investments) | | | |
| | Massachusetts Development Finance Agency Revenue Refunding Bonds, NewBridge on the | | | |
| | Charles, Inc Issue, Series 2017: | | | |
| $ 1,040 | | 4.125%, 10/01/42, 144A | 10/22 at 105.00 | BB+ | $ 914,534 |
| 250 | | 5.000%, 10/01/47, 144A | 10/22 at 105.00 | BB+ | 247,045 |
| 460 | | Massachusetts Development Finance Agency, Revenue Bonds, Berkshire Retirement Community | 7/25 at 100.00 | A+ | 518,839 |
| | Lennox, Series 2015, 5.000%, 7/01/31 | | | |
| 485 | | Massachusetts Development Finance Agency, Revenue Bonds, Carleton-Willard Village, | 12/25 at 103.00 | A– | 462,137 |
| | Series 2019, 4.000%, 12/01/42 | | | |
| 1,000 | | Massachusetts Development Finance Agency, Revenue Bonds, Loomis Communities, Series | 1/23 at 100.00 | BBB | 1,027,390 |
| | 2013A, 5.250%, 1/01/26 | | | |
| 1,000 | | Massachusetts Development Finance Agency, Revenue Bonds, Orchard Cove, Inc, Refunding | 10/24 at 104.00 | BBB+ | 1,009,430 |
| | Series 2019, 5.000%, 10/01/49 | | | |
| 4,235 | | Total Long-Term Care | | | 4,179,375 |
| | Tax Obligation/General – 19.3% (12.8% of Total Investments) | | | |
| 1,250 | | Hudson, Massachusetts, General Obligation Bonds, Municipal Purpose Loan Series 2011, | 6/20 at 100.00 | AA | 1,253,600 |
| | 5.000%, 2/15/32 | | | |
| 330 | | Massachusetts Bay Transportation Authority, General Obligation Transportation System | No Opt. Call | Aa1 | 346,926 |
| | Bonds, Series 1991A, 7.000%, 3/01/21 | | | |
| 1,500 | | Massachusetts State, General Obligation Bonds, Consolidated Loan, Series 2004B, 5.250%, | No Opt. Call | Aa1 | 1,589,100 |
| | 8/01/21 – AGM Insured | | | |
| 2,000 | | Massachusetts State, General Obligation Bonds, Consolidated Loan, Series 2015C, | 7/25 at 100.00 | Aa1 | 2,342,440 |
| | 5.000%, 7/01/45 | | | |
| 3,895 | | Massachusetts State, General Obligation Bonds, Consolidated Loan, Series 2017F, | 11/27 at 100.00 | Aa1 | 4,804,482 |
| | 5.000%, 11/01/46 | | | |
| 4,000 | | Massachusetts State, General Obligation Bonds, Consolidated Loan, Series 2019A, | 1/29 at 100.00 | Aa1 | 5,147,920 |
| | 5.250%, 1/01/44 | | | |
| 2,500 | | Massachusetts State, General Obligation Bonds, Consolidated Loan, Series 2020C, | 3/30 at 100.00 | Aa1 | 2,673,600 |
| | 3.000%, 3/01/47 | | | |
| 1,775 | | North Reading, Massachusetts, General Obligation Bonds, Municipal Purpose Loan Series | 5/22 at 100.00 | Aa2 | 1,921,278 |
| | 2012, 5.000%, 5/15/35 | | | |
| 880 | | Norwell, Massachusetts, General Obligation Bonds, Series 2003, 5.000%, 11/15/20 – | No Opt. Call | AAA | 899,307 |
| | FGIC Insured | | | |
| 1,950 | | Pentucket Regional School District, Massachusetts, General Obligation Bonds, Series | 9/27 at 100.00 | Aa2 | 2,047,481 |
| | 2019, 3.000%, 9/01/42 | | | |
| | Quincy, Massachusetts, General Obligation Bonds, State Qualified Municipal Purpose Loan | | | |
| | Series 2011: | | | |
| 1,280 | | 5.125%, 12/01/33 | 12/20 at 100.00 | Aa2 | 1,308,198 |
| 2,000 | | 5.250%, 12/01/38 | 12/20 at 100.00 | Aa2 | 2,043,160 |
| 23,360 | | Total Tax Obligation/General | | | 26,377,492 |
| | Tax Obligation/Limited – 19.5% (12.9% of Total Investments) | | | |
| | Government of Guam, Business Privilege Tax Bonds, Series 2011A: | | | |
| 2,000 | | 5.250%, 1/01/36 | 1/22 at 100.00 | BB | 2,039,360 |
| 1,310 | | 5.125%, 1/01/42 | 1/22 at 100.00 | BB | 1,329,519 |
| | Government of Guam, Business Privilege Tax Bonds, Series 2012B-1: | | | |
| 400 | | 5.000%, 1/01/37 | 1/22 at 100.00 | BB | 406,092 |
| 1,115 | | 5.000%, 1/01/42 | 1/22 at 100.00 | BB | 1,129,495 |
| 855 | | Martha’s Vineyard Land Bank, Massachusetts, Revenue Bonds, Refunding Green Series 2014, | 11/24 at 100.00 | AA | 986,567 |
| | 5.000%, 5/01/33 – BAM Insured | | | |
| 500 | | Martha’s Vineyard Land Bank, Massachusetts, Revenue Bonds, Refunding Green Series 2017, | 5/27 at 100.00 | AA | 614,495 |
| | 5.000%, 5/01/35 | | | |
57
| | |
| NMT | Nuveen Massachusetts Quality Municipal Income Fund Portfolio of Investments (continued) May 31, 2020 |
| | | | | | |
| Principal | | | Optional Call | | |
| Amount (000) | | Description (1) | Provisions (2) | Ratings (3) | Value |
| | Tax Obligation/Limited (continued) | | | |
| $ 1,000 | | Massachusetts Bay Transportation Authority, Assessment Bonds, Series 2012A, | 7/22 at 100.00 | AAA | $ 1,086,960 |
| | 5.000%, 7/01/41 | | | |
| 770 | | Massachusetts Bay Transportation Authority, Sales Tax Revenue Bonds, Refunding Senior | No Opt. Call | AA | 812,466 |
| | Lien Series 2004C, 5.250%, 7/01/21 | | | |
| 1,610 | | Massachusetts College Building Authority, Project Revenue Bonds, Green Series 2014B, | 5/24 at 100.00 | Aa2 | 1,801,831 |
| | 5.000%, 5/01/44 | | | |
| 1,000 | | Massachusetts College Building Authority, Project Revenue Bonds, Refunding Series 2003B, | No Opt. Call | AA | 1,146,500 |
| | 5.375%, 5/01/23 – SYNCORA GTY Insured | | | |
| 1,350 | | Massachusetts School Building Authority, Dedicated Sales Tax Revenue Bonds, Senior | 8/25 at 100.00 | AAA | 1,598,076 |
| | Refunding Series 2015C, 5.000%, 8/15/37 | | | |
| 1,875 | | Massachusetts School Building Authority, Dedicated Sales Tax Revenue Bonds, Senior | 5/23 at 100.00 | AAA | 2,080,369 |
| | Series 2013A, 5.000%, 5/15/38 | | | |
| 2,000 | | Massachusetts School Building Authority, Dedicated Sales Tax Revenue Bonds, Subordinated | 2/28 at 100.00 | AA+ | 2,486,400 |
| | Series 2018A, 5.250%, 2/15/48 | | | |
| 1,500 | | Massachusetts School Building Authority, Dedicated Sales Tax Revenue Bonds, Subordinated | 2/29 at 100.00 | AA+ | 1,881,765 |
| | Series 2019A, 5.000%, 2/15/44 | | | |
| 1,500 | | Massachusetts State, Transportation Fund Revenue Bonds, Rail Enhancement Program, Series | 6/25 at 100.00 | AA+ | 1,733,295 |
| | 2015A, 5.000%, 6/01/45 | | | |
| | Puerto Rico Sales Tax Financing Corporation, Sales Tax Revenue Bonds, Restructured 2018A-1: | | | |
| 863 | | 4.550%, 7/01/40 | 7/28 at 100.00 | N/R | 855,457 |
| 820 | | 0.000%, 7/01/46 | 7/28 at 41.38 | N/R | 212,897 |
| 4,205 | | 0.000%, 7/01/51 | 7/28 at 30.01 | N/R | 797,688 |
| 775 | | 4.750%, 7/01/53 | 7/28 at 100.00 | N/R | 756,028 |
| 1,259 | | 5.000%, 7/01/58 | 7/28 at 100.00 | N/R | 1,263,104 |
| 520 | | Virgin Islands Public Finance Authority, Gross Receipts Taxes Loan Note, Refunding | 10/22 at 100.00 | AA | 563,748 |
| | Series 2012A, 5.000%, 10/01/32 – AGM Insured | | | |
| 1,000 | | Virgin Islands Public Finance Authority, Matching Fund Loan Notes Revenue Bonds, Series | 10/22 at 100.00 | AA | 1,084,130 |
| | 2012A, 5.000%, 10/01/32 – AGM Insured | | | |
| 28,227 | | Total Tax Obligation/Limited | | | 26,666,242 |
| | Transportation – 9.2% (6.1% of Total Investments) | | | |
| 2,500 | | Massachusetts Port Authority, Revenue Bonds, Refunding Series 2017A, 5.000%, 7/01/47 (AMT) | 7/27 at 100.00 | AA | 2,822,325 |
| 1,000 | | Massachusetts Port Authority, Revenue Bonds, Series 2010A, 5.000%, 7/01/30 | 7/20 at 100.00 | AA | 1,003,880 |
| 1,000 | | Massachusetts Port Authority, Revenue Bonds, Series 2012B, 5.000%, 7/01/33 | 7/22 at 100.00 | AA | 1,085,230 |
| | Massachusetts Port Authority, Revenue Bonds, Series 2014A: | | | |
| 1,000 | | 5.000%, 7/01/39 | 7/24 at 100.00 | AA | 1,115,450 |
| 2,500 | | 5.000%, 7/01/44 | 7/24 at 100.00 | AA | 2,772,150 |
| | Massachusetts Port Authority, Revenue Bonds, Series 2015A: | | | |
| 715 | | 5.000%, 7/01/40 | 7/25 at 100.00 | AA | 813,548 |
| 1,000 | | 5.000%, 7/01/45 | 7/25 at 100.00 | AA | 1,129,870 |
| 1,000 | | Massachusetts Port Authority, Special Facilities Revenue Bonds, BOSFUEL Corporation, | 7/29 at 100.00 | A1 | 1,054,050 |
| | Series 2019A, 4.000%, 7/01/44 (AMT) | | | |
| 730 | | Metropolitan Boston Transit Parking Corporation, Massachusetts, Systemwide Parking Revenue | 7/21 at 100.00 | A1 | 750,790 |
| | Bonds, Senior Lien Series 2011, 5.000%, 7/01/41 | | | |
| 11,445 | | Total Transportation | | | 12,547,293 |
| | U.S. Guaranteed – 12.6% (8.4% of Total Investments) (5) | | | |
| 2,000 | | Hampden-Wilbraham Regional School District, Hampden County, Massachusetts, General | 2/21 at 100.00 | Aa3 | 2,068,100 |
| | Obligation Bonds, Series 2011, 5.000%, 2/15/41 (Pre-refunded 2/15/21) | | | |
| 855 | | Massachusetts College Building Authority, Revenue Bonds, Refunding Series 2012B, 5.000%, | 5/22 at 100.00 | Aa2 | 933,010 |
| | 5/01/37 (Pre-refunded 5/01/22) | | | |
| 2,150 | | Massachusetts Development Finance Agency, Revenue Bonds, Lesley University, Series | 7/21 at 100.00 | AA | 2,267,132 |
| | 2011B-1, 5.250%, 7/01/33 (Pre-refunded 7/01/21) – AGM Insured | | | |
58
| | | | | | |
| Principal | | | Optional Call | | |
| Amount (000) | | Description (1) | Provisions (2) | Ratings (3) | Value |
| | U.S. Guaranteed (5) (continued) | | | |
| $ 434 | | Massachusetts Development Finance Agency, Revenue Bonds, North Hill Communities Issue, | 11/23 at 100.00 | N/R | $ 500,897 |
| | Series 2013A, 6.250%, 11/15/28 (Pre-refunded 11/15/23), 144A | | | |
| | Massachusetts Development Finance Agency, Revenue Bonds, Partners HealthCare System, | | | |
| | Series 2012L: | | | |
| 995 | | 5.000%, 7/01/36 (Pre-refunded 7/01/21) | 7/21 at 100.00 | N/R | 1,046,521 |
| 5 | | 5.000%, 7/01/36 (Pre-refunded 7/01/21) | 7/21 at 100.00 | AA– | 5,259 |
| 1,000 | | Massachusetts Development Finance Agency, Revenue Bonds, Sterling and Francine Clark Art | 7/21 at 100.00 | AA | 1,052,340 |
| | Institute, Series 2011A, 5.000%, 7/01/41 (Pre-refunded 7/01/21) | | | |
| 3,000 | | Massachusetts Development Finance Agency, Revenue Bonds, The Broad Institute, Series | 4/21 at 100.00 | Aa3 | 3,123,090 |
| | 2011A, 5.250%, 4/01/37 (Pre-refunded 4/01/21) | | | |
| 475 | | Massachusetts Development Finance Agency, Revenue Bonds, UMass Memorial Health, Series | 7/21 at 100.00 | N/R | 502,427 |
| | 2011H, 5.500%, 7/01/31 (Pre-refunded 7/01/21) | | | |
| 410 | | Massachusetts Health and Educational Facilities Authority, Revenue Bonds, CareGroup Inc, | 7/21 at 100.00 | N/R | 430,086 |
| | Series 1998A, 5.000%, 7/01/25 (Pre-refunded 7/01/21) – NPFG Insured | | | |
| 1,000 | | Massachusetts School Building Authority, Dedicated Sales Tax Revenue Bonds, Series | 10/21 at 100.00 | AAA | 1,066,320 |
| | 2011B, 5.000%, 10/15/41 (Pre-refunded 10/15/21) | | | |
| 1,500 | | Massachusetts State, Transportation Fund Revenue Bonds, Rail Enhancement Program, Series | 6/21 at 100.00 | AA+ | 1,572,465 |
| | 2013A, 5.000%, 6/01/38 (Pre-refunded 6/01/21) | | | |
| 720 | | Springfield Water and Sewer Commission, Massachusetts, General Revenue Bonds, Refunding | 11/20 at 100.00 | AA | 735,869 |
| | Series 2010B, 5.000%, 11/15/30 (Pre-refunded 11/15/20) – AGC Insured | | | |
| 1,620 | | University of Massachusetts Building Authority, Project Revenue Bonds, Senior Series | 11/24 at 100.00 | N/R | 1,955,988 |
| | 2014-1, 5.000%, 11/01/44 (Pre-refunded 11/01/24) | | | |
| 16,164 | | Total U.S. Guaranteed | | | 17,259,504 |
| | Utilities – 1.0% (0.7% of Total Investments) | | | |
| 1,265 | | Massachusetts Clean Energy Cooperative Corporation, Revenue Bonds, Massachusetts | 7/23 at 100.00 | AA– | 1,405,073 |
| | Municipal Lighting Plant Cooperative, Series 2013, 5.000%, 7/01/32 | | | |
| | Water and Sewer – 7.9% (5.3% of Total Investments) | | | |
| 565 | | Guam Government Waterworks Authority, Water and Wastewater System Revenue Bonds, | 7/24 at 100.00 | A– | 605,895 |
| | Refunding Series 2014A, 5.000%, 7/01/29 | | | |
| | Guam Government Waterworks Authority, Water and Wastewater System Revenue Bonds, | | | |
| | Refunding Series 2017: | | | |
| 1,250 | | 5.000%, 7/01/37 | 7/27 at 100.00 | A– | 1,353,862 |
| 420 | | 5.000%, 7/01/40 | 7/27 at 100.00 | A– | 453,361 |
| 415 | | Lynn Water and Sewer Commission, Massachusetts, General Revenue Bonds, Series 2003A, | 6/20 at 100.00 | A1 | 416,357 |
| | 5.000%, 12/01/32 – NPFG Insured | | | |
| 1,000 | | Massachusetts Clean Water Trust, State Revolving Fund Bonds, Green 18 Series 2015, | 2/24 at 100.00 | AAA | 1,135,270 |
| | 5.000%, 2/01/45 | | | |
| 60 | | Massachusetts Water Pollution Abatement Trust, Pooled Loan Program Bonds, Series 2003-9, | 6/20 at 100.00 | AAA | 60,219 |
| | 5.000%, 8/01/22 | | | |
| 140 | | Massachusetts Water Pollution Abatement Trust, Revenue Bonds, MWRA Loan Program, Series | 6/20 at 100.00 | AAA | 140,539 |
| | 2002A, 5.250%, 8/01/20 | | | |
| 500 | | Massachusetts Water Resources Authority, General Revenue Bonds, Refunding Series 2016B, | 8/26 at 100.00 | AA+ | 607,020 |
| | 5.000%, 8/01/40 | | | |
| 1,230 | | Massachusetts Water Resources Authority, General Revenue Bonds, Series 2017B, | 8/27 at 100.00 | AA+ | 1,509,542 |
| | 5.000%, 8/01/42 | | | |
| 2,000 | | Massachusetts Water Resources Authority, General Revenue Bonds, Series 2019B, | 8/29 at 100.00 | AA+ | 2,560,220 |
| | 5.000%, 8/01/44 | | | |
59
| | |
| NMT | Nuveen Massachusetts Quality Municipal Income Fund Portfolio of Investments (continued) May 31, 2020 |
| | | | | | |
| Principal | | | Optional Call | | |
| Amount (000) | | Description (1) | Provisions (2) | Ratings (3) | Value |
| | Water and Sewer (continued) | | | |
| $ 1,000 | | Springfield Water and Sewer Commission, Massachusetts, General Revenue Bonds, Series | 4/27 at 100.00 | AA | $ 1,227,080 |
| | 2017C, 5.000%, 4/15/37 | | | |
| 635 | | Springfield Water and Sewer Commission, Massachusetts, General Revenue Bonds, Series | 4/29 at 100.00 | AA | 743,325 |
| | 2019E, 4.000%, 4/15/38 | | | |
| 9,215 | | Total Water and Sewer | | | 10,812,690 |
| $ 186,386 | | Total Long-Term Investments (cost $193,787,873) | | | 205,986,380 |
| | Variable Rate Demand Preferred Shares, net of deferred offering costs – (54.0)% (6) | | | (73,739,043) |
| | Other Assets Less Liabilities – 3.2% | | | 4,324,283 |
| | Net Asset Applicable to Common Shares – 100% | | | $ 136,571,620 |
| | |
(1) | All percentages shown in the Portfolio of Investments are based on net assets applicable to common shares unless otherwise noted. |
(2) | Optional Call Provisions: Dates (month and year) and prices of the earliest optional call or redemption. There may be other call provisions at varying prices at later dates. Certain mortgage-backed securities may be subject to periodic principal paydowns. Optional Call Provisions are not covered by the report of independent registered public accounting firm. |
(3) | For financial reporting purposes, the ratings disclosed are the highest of Standard & Poor’s Group (“Standard & Poor’s”), Moody’s Investors Service, Inc. (“Moody’s”) or Fitch, Inc. (“Fitch”) rating. This treatment of split-rated securities may differ from that used for other purposes, such as for Fund investment policies. Ratings below BBB by Standard Poor’s, Baa by Moody’s or BBB by Fitch are considered to be below investment grade. Holdings designated N/R are not rated by any of these national rating agencies. Ratings are not covered by the report of independent registered public accounting firm. |
(4) | Investment, or portion of investment, has been pledged to collateralize the net payment obligations for investments in inverse floating rate transactions. |
(5) | Backed by an escrow or trust containing sufficient U.S. Government or U.S. Government agency securities, which ensure the timely payment of principal and interest. |
(6) | Variable Rate Demand Preferred Shares, net of deferred offering costs as a percentage of Total Investments is 35.8%. |
144A | Investment is exempt from registration under Rule 144A of the Securities Act of 1933, as amended. These investments may only be resold in transactions exempt from registration, which are normally those transactions with qualified institutional buyers. |
AMT | Alternative Minimum Tax |
IF | Inverse floating rate security issued by a tender option bond (“TOB”) trust, the interest rate on which varies inversely with the Securities Industry Financial Markets Association (SIFMA) short-term rate, which resets weekly, or a similar short-term rate, and is reduced by the expenses related to the TOB trust. |
| See accompanying notes to financial statements. |
60
| | |
| NMS | Nuveen Minnesota Quality Municipal Income Fund Portfolio of Investments May 31, 2020 |
| | | | | | |
| Principal | | | Optional Call | | |
| Amount (000) | | Description (1) | Provisions (2) | Ratings (3) | Value |
| | LONG-TERM INVESTMENTS – 155.5% (98.1% of Total Investments) | | | |
| | MUNICIPAL BONDS – 155.5% (98.1% of Total Investments) | | | |
| | Education and Civic Organizations – 30.1% (19.0% of Total Investments) | | | |
| | City of Ham Lake, Minnesota, Charter School Lease Revenue Bonds, DaVinci Academy | | | |
| | Project, Series 2016A: | | | |
| $ 500 | | 4.000%, 7/01/28 | 7/24 at 102.00 | N/R | $ 494,880 |
| 50 | | 5.000%, 7/01/36 | 7/24 at 102.00 | N/R | 50,704 |
| 830 | | City of Woodbury, Minnesota, Charter School Lease Revenue Bonds, Math and Science | 12/20 at 102.00 | BBB– | 852,410 |
| | Academy Building Company, Series 2012A, 5.000%, 12/01/43 | | | |
| 250 | | Deephaven, Minnesota, Charter School Lease Revenue Bonds, Eagle Ridge Academy Project, | 7/25 at 100.00 | BB+ | 262,355 |
| | Series 2015A, 5.250%, 7/01/40 | | | |
| 570 | | Forest Lake, Minnesota, Charter School Lease Revenue Bonds, Lakes International Language | 8/22 at 102.00 | BB+ | 595,935 |
| | Academy, Series 2014A, 5.750%, 8/01/44 | | | |
| 750 | | Forest Lake, Minnesota, Charter School Lease Revenue Bonds, Lakes International Language | 8/27 at 102.00 | BB+ | 769,695 |
| | Academy, Series 2019A, 5.250%, 8/01/43 | | | |
| 100 | | Greenwood, Minnesota, Charter School Lease Revenue Bonds, Main Street School of | 7/26 at 100.00 | N/R | 91,293 |
| | Performing Arts Project, Series 2016A, 5.000%, 7/01/47 | | | |
| 2,200 | | Hugo, Minnesota, Charter School Lease Revenue Bonds, Noble Academy Project, Series | 7/24 at 100.00 | BB+ | 2,202,310 |
| | 2014A, 5.000%, 7/01/44 | | | |
| 1,575 | | Independence, Minnesota, Charter School Lease Revenue Bonds, Beacon Academy Project, | 7/26 at 100.00 | N/R | 1,425,155 |
| | Series 2016A, 5.000%, 7/01/46 | | | |
| | Minneapolis, Minnesota, Charter School Lease Revenue Bonds, Yinghua Academy Project, | | | |
| | Series 2013A: | | | |
| 300 | | 6.000%, 7/01/33 | 7/23 at 100.00 | BB+ | 317,841 |
| 1,425 | | 6.000%, 7/01/43 | 7/23 at 100.00 | BB+ | 1,488,697 |
| | Minnesota Higher Education Facilities Authority, Revenue Bonds, Bethel University, | | | |
| | Refunding Series 2017: | | | |
| 750 | | 5.000%, 5/01/37 | 5/27 at 100.00 | BBB– | 782,932 |
| 2,000 | | 5.000%, 5/01/47 | 5/27 at 100.00 | BBB– | 2,054,560 |
| 1,580 | | Minnesota Higher Education Facilities Authority, Revenue Bonds, Carleton College, | 3/27 at 100.00 | Aa2 | 1,790,851 |
| | Refunding Series 2017, 4.000%, 3/01/42 | | | |
| | Minnesota Higher Education Facilities Authority, Revenue Bonds, College of Saint | | | |
| | Scholastica, Inc, Refunding Series 2019: | | | |
| 500 | | 4.000%, 12/01/34 | 12/29 at 100.00 | Baa2 | 497,050 |
| 425 | | 4.000%, 12/01/40 | 12/29 at 100.00 | Baa2 | 407,686 |
| 305 | | Minnesota Higher Education Facilities Authority, Revenue Bonds, College of St Benedict, | 3/26 at 100.00 | Baa1 | 284,153 |
| | Series 2016-8K, 4.000%, 3/01/43 | | | |
| 600 | | Minnesota Higher Education Facilities Authority, Revenue Bonds, Macalester College, | 3/27 at 100.00 | Aa3 | 669,414 |
| | Refunding Series 2017, 4.000%, 3/01/48 | | | |
| 225 | | Minnesota Higher Education Facilities Authority, Revenue Bonds, Saint Catherine | 10/28 at 100.00 | Baa1 | 237,026 |
| | University, Refunding Series 2018A, 5.000%, 10/01/45 | | | |
| 750 | | Minnesota Higher Education Facilities Authority, Revenue Bonds, University of Saint | 10/29 at 100.00 | A2 | 916,035 |
| | Thomas, Series 2019, 5.000%, 10/01/33 | | | |
| 705 | | Otsego, Minnesota, Charter School Lease Revenue Bonds, Kaleidoscope Charter School | 9/24 at 100.00 | BB– | 667,064 |
| | Project, Series 2014A, 5.000%, 9/01/44 | | | |
| 450 | | Ramsey, Anoka County, Minnesota, Lease Revenue Bonds, PACT Charter School Project, | 12/21 at 100.00 | BBB– | 466,074 |
| | Series 2004A, 5.500%, 12/01/33 | | | |
| 300 | | Rice County, Minnesota Educational Facility Revenue Bonds, Shattuck Saint Mary’s School | No Opt. Call | BB | 304,461 |
| | Project, Series 2015, 5.000%, 8/01/22, 144A | | | |
61
| | |
| NMS | Nuveen Minnesota Quality Municipal Income Fund Portfolio of Investments (continued) May 31, 2020 |
| | | | | | |
| Principal | | | Optional Call | | |
| Amount (000) | | Description (1) | Provisions (2) | Ratings (3) | Value |
| | Education and Civic Organizations (continued) | | | |
| $ 1,250 | | Saint Paul Housing & Redevelopment Authority, Minnesota, Charter School Lease Revenue | 12/29 at 100.00 | BBB– | $ 1,233,488 |
| | Bonds, Community of Peace Academy Project, Series 2019, 4.000%, 12/01/49 | | | |
| 500 | | Saint Paul Housing & Redevelopment Authority, Minnesota, Charter School Lease Revenue | 9/20 at 101.00 | BB+ | 506,440 |
| | Bonds, Hmong Education Reform Company, Series 2012A, 5.250%, 9/01/32 | | | |
| 1,100 | | Saint Paul Housing & Redevelopment Authority, Minnesota, Charter School Lease Revenue | 9/21 at 100.00 | BBB– | 1,152,338 |
| | Bonds, Nova Classical Academy, Series 2011A, 6.375%, 9/01/31 | | | |
| | Saint Paul Housing & Redevelopment Authority, Minnesota, Charter School Lease Revenue | | | |
| | Bonds, Twin Cities Academy Project, Series 2015A: | | | |
| 360 | | 5.300%, 7/01/45 | 7/25 at 100.00 | BB | 367,852 |
| 510 | | 5.375%, 7/01/50 | 7/25 at 100.00 | BB | 521,679 |
| 1,680 | | Saint Paul Housing & Redevelopment Authority, Minnesota, Charter School Lease Revenue | 7/23 at 100.00 | BB+ | 1,704,814 |
| | Bonds, Twin Cities German Immersion School, Series 2013A, 5.000%, 7/01/44 | | | |
| 800 | | Saint Paul Housing and Redevelopment Authority, Minnesota, Charter School Revenue Bonds, | 12/22 at 100.00 | BBB– | 825,144 |
| | Higher Ground Academy Charter School, Series 2013A, 5.000%, 12/01/33 | | | |
| 390 | | Saint Paul Housing and Redevelopment Authority, Minnesota, Lease Revenue Bonds, Saint | 3/23 at 100.00 | BB+ | 369,221 |
| | Paul Conservatory for Performing Artists Charter School Project, Series 2013A, 4.625%, 3/01/43 | | | |
| 1,000 | | Savage, Minnesota Charter School Lease Revenue Bonds, Aspen Academy Project, Series | 10/26 at 100.00 | N/R | 943,580 |
| | 2016A, 5.000%, 10/01/41 | | | |
| 500 | | St Paul Housing and Redevelopment Authority, Minnesota, Charter School Revenue Bonds, | 12/26 at 102.00 | BBB– | 532,125 |
| | Higher Ground Academy Charter School, Series 2018, 5.125%, 12/01/49 | | | |
| 25,230 | | Total Education and Civic Organizations | | | 25,785,262 |
| | Health Care – 32.7% (20.7% of Total Investments) | | | |
| 250 | | Chippewa County, Minnesota, Gross Revenue Hospital Bonds, Montevideo Hospital Project, | 3/26 at 100.00 | N/R | 256,890 |
| | Refunding Series 2016, 4.000%, 3/01/32 | | | |
| 180 | | City of Plato, Minnesota, Health Care Facilities Revenue Bonds, Glencoe Regional Health | 4/27 at 100.00 | BBB | 201,663 |
| | Services Project, Series 2017, 5.000%, 4/01/41 | | | |
| | Duluth Economic Development Authority, Minnesota, Health Care Facilities Revenue Bonds, | | | |
| | Essentia Health Obligated Group, Series 2018A: | | | |
| 700 | | 5.000%, 2/15/43 | 2/28 at 100.00 | A– | 785,890 |
| 3,000 | | 5.000%, 2/15/48 | 2/28 at 100.00 | A– | 3,350,730 |
| 2,750 | | 5.000%, 2/15/53 | 2/28 at 100.00 | A– | 3,061,602 |
| | Glencoe, Minnesota, Health Care Facilities Revenue Bonds, Glencoe Regional Health | | | |
| | Services Project, Series 2013: | | | |
| 400 | | 4.000%, 4/01/27 | 4/22 at 100.00 | BBB | 416,756 |
| 230 | | 4.000%, 4/01/31 | 4/22 at 100.00 | BBB | 236,661 |
| 500 | | Maple Grove, Minnesota, Health Care Facilities Revenue Refunding Bonds, North Memorial | 9/25 at 100.00 | Baa1 | 524,065 |
| | Health Care, Series 2015, 4.000%, 9/01/35 | | | |
| | Maple Grove, Minnesota, Health Care Facility Revenue Bonds, North Memorial Health Care, | | | |
| | Series 2017: | | | |
| 200 | | 5.000%, 5/01/31 | 5/27 at 100.00 | Baa1 | 230,464 |
| 165 | | 5.000%, 5/01/32 | 5/27 at 100.00 | Baa1 | 188,968 |
| | Minneapolis, Minnesota, Health Care System Revenue Bonds, Fairview Health Services, | | | |
| | Series 2015A: | | | |
| 265 | | 4.000%, 11/15/40 | 11/25 at 100.00 | A+ | 276,618 |
| 1,000 | | 5.000%, 11/15/44 | 11/25 at 100.00 | A+ | 1,099,130 |
| | Minneapolis, Minnesota, Health Care System Revenue Bonds, Fairview Health Services, | | | |
| | Series 2018A: | | | |
| 1,500 | | 4.000%, 11/15/48 | 11/28 at 100.00 | A+ | 1,543,350 |
| 1,500 | | 5.000%, 11/15/49 | 11/28 at 100.00 | A+ | 1,687,125 |
| 710 | | Northern Itasca Hospital District, Minnesota, Health Facilities Gross Revenue Bonds, | 12/20 at 100.00 | N/R | 634,314 |
| | Refunding Series 2013A, 4.400%, 12/01/33 | | | |
62
| | | | | | |
| Principal | | | Optional Call | | |
| Amount (000) | | Description (1) | Provisions (2) | Ratings (3) | Value |
| | Health Care (continued) | | | |
| | Northern Itasca Hospital District, Minnesota, Health Facilities Gross Revenue Bonds, | | | |
| | Series 2013C: | | | |
| $ 240 | | 4.500%, 12/01/25 | 12/20 at 100.00 | N/R | $ 237,067 |
| 190 | | 4.750%, 12/01/27 | 12/20 at 100.00 | N/R | 185,581 |
| 160 | | 5.000%, 12/01/28 | 12/20 at 100.00 | N/R | 158,010 |
| 310 | | 5.400%, 12/01/33 | 12/20 at 100.00 | N/R | 306,165 |
| 915 | | Rochester, Minnesota, Health Care Facilities Revenue Bonds, Mayo Clinic, Series 2018A, | 5/28 at 100.00 | AA | 1,020,390 |
| | 4.000%, 11/15/48 | | | |
| 30 | | Saint Cloud, Minnesota, Health Care Revenue Bonds, CentraCare Health System Project, | 6/20 at 100.00 | AA– | 30,069 |
| | Series 2010A, 5.125%, 5/01/30 | | | |
| 635 | | Saint Cloud, Minnesota, Health Care Revenue Bonds, CentraCare Health System, Series | 5/26 at 100.00 | AA– | 683,812 |
| | 2016A, 4.000%, 5/01/37 | | | |
| | Saint Cloud, Minnesota, Health Care Revenue Bonds, CentraCare Health System, Series 2019: | | | |
| 500 | | 5.000%, 5/01/48 | 5/29 at 100.00 | AA– | 582,320 |
| 750 | | 4.000%, 5/01/49 | 5/29 at 100.00 | AA– | 807,787 |
| 4,000 | | Saint Paul Housing and Redevelopment Authority, Minnesota, Health Care Facility Revenue | 7/25 at 100.00 | A | 4,276,440 |
| | Bonds, HealthPartners Obligated Group, Refunding Series 2015A, 4.000%, 7/01/35 | | | |
| | Saint Paul Housing and Redevelopment Authority, Minnesota, Health Care Revenue Bonds, | | | |
| | Fairview Health Services, Series 2017A: | | | |
| 245 | | 4.000%, 11/15/36 | 11/27 at 100.00 | A+ | 256,775 |
| 240 | | 4.000%, 11/15/37 | 11/27 at 100.00 | A+ | 250,810 |
| 2,170 | | 4.000%, 11/15/43 | 11/27 at 100.00 | A+ | 2,238,463 |
| 1,000 | | Saint Paul Port Authority, Minnesota, Lease Revenue Bonds, Regions Hospital Parking Ramp | 6/20 at 100.00 | N/R | 1,000,490 |
| | Project, Series 2007-1, 5.000%, 8/01/36 | | | |
| | Shakopee, Minnesota, Health Care Facilities Revenue Bonds, Saint Francis Regional | | | |
| | Medical Center, Refunding Series 2014: | | | |
| 765 | | 4.000%, 9/01/31 | 9/24 at 100.00 | A | 813,685 |
| 630 | | 5.000%, 9/01/34 | 9/24 at 100.00 | A | 689,648 |
| 26,130 | | Total Health Care | | | 28,031,738 |
| | Housing/Multifamily – 4.5% (2.8% of Total Investments) | | | |
| 1,700 | | Coon Rapids, Minnesota, Multifamily Housing Revenue Bonds, Tralee Terrace Apartments | 6/20 at 100.00 | Aaa | 1,704,182 |
| | Project, Series 2010, 4.500%, 6/01/26 | | | |
| | Minnesota Housing Finance Agency, Rental Housing Revenue Bonds, Series 2011: | | | |
| 355 | | 5.050%, 8/01/31 | 8/21 at 100.00 | AA+ | 368,746 |
| 1,700 | | 5.450%, 8/01/41 | 8/21 at 100.00 | AA+ | 1,760,758 |
| 3,755 | | Total Housing/Multifamily | | | 3,833,686 |
| | Housing/Single Family – 0.9% (0.6% of Total Investments) | | | |
| 13 | | Minneapolis-Saint Paul Housing Finance Board, Minnesota, Single Family Mortgage Revenue | 6/20 at 100.00 | AA+ | 13,023 |
| | Bonds, City Living Series 2006A-4, 5.000%, 11/01/38 (AMT) | | | |
| 120 | | Minnesota Housing Finance Agency, Homeownership Finance Bonds, Mortgage-Backed | 7/21 at 100.00 | Aaa | 124,007 |
| | Securities Program, Series 2011D, 4.700%, 1/01/31 | | | |
| 55 | | Minnesota Housing Finance Agency, Residential Housing Finance Bonds, Series 2013C, | 1/23 at 100.00 | AA+ | 57,161 |
| | 3.900%, 7/01/43 | | | |
| 35 | | Minnesota Housing Finance Agency, Residential Housing Finance Bonds, Series 2014C, | 7/24 at 100.00 | AA+ | 37,446 |
| | 3.500%, 1/01/32 | | | |
| 100 | | Minnesota Housing Finance Agency, Residential Housing Finance Bonds, Series 2015F, | 7/25 at 100.00 | AA+ | 110,282 |
| | 3.300%, 7/01/29 | | | |
| 295 | | Minnesota Housing Finance Agency, Residential Housing Finance Bonds, Series 2017A, | 1/27 at 100.00 | AA+ | 300,466 |
| | 3.200%, 7/01/30 (AMT) | | | |
| 145 | | Minnesota Housing Finance Agency, Residential Housing Finance Bonds, Series 2018A, | 7/27 at 100.00 | AA+ | 161,804 |
| | 3.625%, 7/01/32 (AMT) | | | |
| 763 | | Total Housing/Single Family | | | 804,189 |
63
| | |
| NMS | Nuveen Minnesota Quality Municipal Income Fund Portfolio of Investments (continued) May 31, 2020 |
| | | | | | |
| Principal | | | Optional Call | | |
| Amount (000) | | Description (1) | Provisions (2) | Ratings (3) | Value |
| | Industrials – 2.4% (1.5% of Total Investments) | | | |
| | Minneapolis, Minnesota, Limited Tax Supported Development Revenue Bonds, Common Bond | | | |
| | Fund Series 2013-1: | | | |
| $ 1,400 | | 4.500%, 6/01/33 | 6/21 at 100.00 | A+ | $ 1,443,540 |
| 600 | | 4.750%, 6/01/39 | 6/21 at 100.00 | A+ | 619,566 |
| 2,000 | | Total Industrials | | | 2,063,106 |
| | Long-Term Care – 12.1% (7.6% of Total Investments) | | | |
| 805 | | Anoka, Minnesota, Health Care and Housing Facility Revenue Bonds, The Homestead at | 11/24 at 100.00 | N/R | 738,233 |
| | Anoka, Inc Project, Series 2014, 5.125%, 11/01/49 | | | |
| 380 | | Center City, Minnesota, Health Care Facilities Revenue Bonds, Hazelden Betty Ford | 11/24 at 100.00 | Baa1 | 389,466 |
| | Foundation Project, Series 2014, 4.000%, 11/01/39 | | | |
| 875 | | Cold Spring, Minnesota, Health Care Facilities Revenue Bonds, Assumption Home, Inc, | 6/20 at 100.00 | N/R | 833,455 |
| | Refunding Series 2013, 5.200%, 3/01/43 | | | |
| | Columbus, Minnesota, Senior Housing Revenue Bonds, Richfield Senior Housing, Inc, | | | |
| | Refunding Series 2015: | | | |
| 175 | | 5.250%, 1/01/40 | 1/23 at 100.00 | N/R | 141,815 |
| 850 | | 5.250%, 1/01/46 | 1/23 at 100.00 | N/R | 661,521 |
| 500 | | Dakota County Community Development Agency, Minnesota, Senior Housing Revenue Bonds, | 8/22 at 100.00 | N/R | 482,375 |
| | Walker Highview Hills LLC Project, Refunding Series 2016A, 5.000%, 8/01/51, 144A | | | |
| 1,350 | | Minneapolis, Minnesota, Revenue Bonds, Walker Minneapolis Campus Project, Refunding | 11/22 at 100.00 | N/R | 1,235,156 |
| | Series 2012, 4.750%, 11/15/28 | | | |
| 750 | | Minneapolis, Minnesota, Senior Housing and Healthcare Revenue Bonds, Ecumen ? Abiitan | 5/23 at 100.00 | N/R | 683,430 |
| | Mill City Project, Series 2015, 5.250%, 11/01/45 | | | |
| 500 | | Rochester, Minnesota, Health Care and Housing Revenue Bonds, Samaritan Bethany, Inc | 8/25 at 100.00 | N/R | 460,350 |
| | Project, Refunding Series 2017A, 5.000%, 8/01/48 | | | |
| 215 | | Saint Joseph, Minnesota, Senior Housing and Healthcare Revenue Bonds, Woodcrest of | 7/24 at 102.00 | N/R | 183,937 |
| | Country Manor Project, Series 2019 A, 5.000%, 7/01/55 | | | |
| 1,300 | | Saint Louis Park, Minnesota, Health Care Facilities Revenue Bonds, Mount Olivet Careview | 6/26 at 100.00 | N/R | 1,125,306 |
| | Home Project, Series 2016B, 4.900%, 6/01/49 | | | |
| 500 | | Saint Paul Housing and Redevelopment Authority Minnesota, Senior Housing and Health Care | 5/23 at 100.00 | N/R | 421,505 |
| | Revenue Bonds, Episcopal Homes Project, Series 2013, 5.125%, 5/01/48 | | | |
| 1,044 | | Saint Paul Housing and Redevelopment Authority, Minnesota, Nursing Home Revenue Bonds, | 10/20 at 100.00 | N/R | 1,025,898 |
| | Episcopal Homes of Minnesota, Series 2006, 5.630%, 10/01/33 | | | |
| 100 | | Saint Paul Housing and Redevelopment Authority, Minnesota, Senior Housing and Health | 11/20 at 100.00 | N/R | 96,265 |
| | Care Revenue Bonds, Episcopal Homes Project, Refunding Series 2012A, 5.150%, 11/01/42 | | | |
| | Saint Paul Park, Minnesota, Senior Housing and Health Care Revenue Bonds, Presbyterian | | | |
| | Homes Bloomington Project, Refunding Series 2017: | | | |
| 500 | | 4.125%, 9/01/34 | 9/24 at 100.00 | N/R | 497,575 |
| 350 | | 4.125%, 9/01/35 | 9/24 at 100.00 | N/R | 344,337 |
| 585 | | Sauk Rapids, Minnesota, Health Care and Housing Facilities Revenue Bonds, Good Shepherd | 1/23 at 100.00 | N/R | 530,537 |
| | Lutheran Home, Refunding Series 2013, 5.125%, 1/01/39 | | | |
| 500 | | Wayzata, Minnesota Senior Housing Revenue Bonds, Folkestone Senior Living Community, | 8/24 at 102.00 | N/R | 503,390 |
| | Refunding Series 2019, 5.000%, 8/01/49 | | | |
| 11,279 | | Total Long-Term Care | | | 10,354,551 |
| | Materials – 2.8% (1.8% of Total Investments) | | | |
| 2,650 | | Saint Paul Port Authority, Minnesota, Solid Waste Disposal Revenue Bonds, Gerdau Saint | 10/22 at 100.00 | BBB– | 2,431,110 |
| | Paul Steel Mill Project, Series 2012-7, 4.500%, 10/01/37 (AMT), 144A | | | |
| | Tax Obligation/General – 30.3% (19.1% of Total Investments) | | | |
| 1,000 | | Bloomington Independent School District 271, Hennepin County, Minnesota, General | 2/27 at 100.00 | AAA | 1,134,090 |
| | Obligation Bonds, Facilities Maintenance, Series 2017A, 4.000%, 2/01/40 | | | |
64
| | | | | | |
| Principal | | | Optional Call | | |
| Amount (000) | | Description (1) | Provisions (2) | Ratings (3) | Value |
| | Tax Obligation/General (continued) | | | |
| | Brainerd Independent School District 181, Crow Wing County, Minnesota, General | | | |
| | Obligation Bonds, Facilities Maintenance Series 2018D: | | | |
| $ 1,015 | | 4.000%, 2/01/38 | 2/27 at 100.00 | AAA | $ 1,156,552 |
| 1,055 | | 4.000%, 2/01/39 | 2/27 at 100.00 | AAA | 1,199,282 |
| | Brainerd Independent School District 181, Crow Wing County, Minnesota, General | | | |
| | Obligation Bonds, School Building Series 2018A: | | | |
| 500 | | 4.000%, 2/01/38 | 2/27 at 100.00 | AAA | 569,730 |
| 1,000 | | 4.000%, 2/01/42 | 2/27 at 100.00 | AAA | 1,130,060 |
| 1,020 | | Brooklyn Center Independent School District 286, Minnesota, General Obligation Bonds, | 2/27 at 100.00 | Aa2 | 1,133,230 |
| | Series 2018A, 4.000%, 2/01/43 | | | |
| 300 | | Circle Pines Independent School District 12, Centennial, Minnesota, General Obligation | 2/25 at 67.23 | AAA | 185,091 |
| | Bonds, School Building Series 2015A, 0.000%, 2/01/35 | | | |
| 1,000 | | Cloquet Independent School District 94, Carlton and Sant Louis Counties, Minnesota, | 2/25 at 100.00 | Aa2 | 1,089,250 |
| | General Obligation Bonds, School Building Series 2015B, 4.000%, 2/01/36 | | | |
| 500 | | Forest Lake, Washington County, Minnesota, General Obligation Bonds, Series 2019A, | 2/29 at 100.00 | AA+ | 610,385 |
| | 4.000%, 2/01/32 | | | |
| | Hermantown Independent School District 700, Minnesota, General Obligation Bonds, School | | | |
| | Building Series 2015A: | | | |
| 940 | | 0.000%, 2/01/37 | 2/24 at 56.07 | Aa2 | 495,502 |
| 1,075 | | 0.000%, 2/01/38 | 2/24 at 53.49 | Aa2 | 539,929 |
| 2,000 | | Independent School District 621, Mounds View, Minnesota, General Obligation Bonds, | 2/27 at 100.00 | AAA | 2,257,440 |
| | School Building Series 2018A, 4.000%, 2/01/42 | | | |
| 345 | | Lake Crystal, Minnesota, General Obligation Bonds, Series 2019A, 3.000%, 12/15/33 | 12/27 at 100.00 | AA | 374,739 |
| 1,500 | | Mankato Independent School District 77, Minnesota, General Obligation Bonds, School | 2/24 at 100.00 | AAA | 1,670,700 |
| | Building Series 2014A, 4.000%, 2/01/30 | | | |
| 500 | | Minneapolis Special School District 1, Hennepin County, Minnesota, General Obligation | 2/28 at 100.00 | AAA | 585,575 |
| | Bonds, Long-Term Facilities Maintenance Series 2017B, 4.000%, 2/01/36 | | | |
| 1,345 | | Minneapolis, Minnesota, General Obligation Bonds, Improvement & Various Purpose Series | 12/26 at 100.00 | AAA | 1,539,783 |
| | 2018, 4.000%, 12/01/40 | | | |
| 600 | | Moorhead Independent School District 152, Clay County, Minnesota, General Obligation | 2/28 at 100.00 | Aa2 | 637,608 |
| | Bonds, School Building Series 2020A, 3.000%, 2/01/43 | | | |
| 1,000 | | Richfield Independent School District 280, Hennepin County, Minnesota, General | 2/27 at 100.00 | AAA | 1,127,410 |
| | Obligation Bonds, School Buildings Series 2018A, 4.000%, 2/01/40 | | | |
| 1,000 | | Roseville Independent School District 623, Ramsey County, Minnesota, General Obligation | 2/27 at 100.00 | Aa2 | 1,133,000 |
| | Bonds, Series 1994, 4.000%, 2/01/37 | | | |
| 1,000 | | Saint James Independent School District 840, Minnesota, General Obligation Bonds, School | 2/26 at 100.00 | AAA | 1,110,570 |
| | Building Series 2015B, 4.000%, 2/01/45 | | | |
| 1,000 | | Sartell Independent School District 748, Stearns County, Minnesota, General Obligation | 2/25 at 62.98 | Aa2 | 577,150 |
| | Bonds, School Building Capital Appreciation Series 2016B, 0.000%, 2/01/39 | | | |
| 1,500 | | Sibley East Independent School District 2310, Sibley, Minnesota, General Obligation | 2/25 at 100.00 | Aa2 | 1,645,455 |
| | Bonds, School Building Series 2015A, 4.000%, 2/01/40 | | | |
| 305 | | Sleepy Eye, Minnesota, General Obligation Bonds, Improvement Series 2020B, 4.000%, | No Opt. Call | AA | 367,687 |
| | 2/01/28 (WI/DD, Settling 6/24/20) | | | |
| 1,970 | | Wayzata Independent School District 284, Hennepin County, Minnesota, General Obligation | 2/23 at 100.00 | AAA | 2,084,260 |
| | Bonds, School Building Series 2014A, 3.500%, 2/01/31 | | | |
| 500 | | West Saint Paul-Mendota Heights-Eagan Independent School District 197, Dakota County, | 2/27 at 100.00 | AAA | 569,390 |
| | Minnesota, General Obligation Bonds, School Building Series 2018A, 4.000%, 2/01/39 | | | |
| 1,000 | | White Bear Lake Independent School District 624, Ramsey County, Minnesota, General | 2/28 at 100.00 | AAA | 1,064,720 |
| | Obligation Bonds, School Building Series 2020A, 3.000%, 2/01/42 | | | |
| 24,970 | | Total Tax Obligation/General | | | 25,988,588 |
65
| | |
| NMS | Nuveen Minnesota Quality Municipal Income Fund Portfolio of Investments (continued) May 31, 2020 |
| | | | | | |
| Principal | | | Optional Call | | |
| Amount (000) | | Description (1) | Provisions (2) | Ratings (3) | Value |
| | Tax Obligation/Limited – 14.8% (9.3% of Total Investments) | | | |
| $ 1,000 | | Anoka-Hennepin Independent School District 11, Minnesota, Certificates of Participation, | 2/23 at 100.00 | A+ | $ 1,045,290 |
| | Series 2015A, 4.000%, 2/01/41 | | | |
| 1,600 | | Duluth Independent School District 709, Minnesota, Certificates of Participation, | 2/22 at 77.70 | Aa2 | 1,197,328 |
| | Capital Appreciation Series 2012A, 0.000%, 2/01/28 – AGM Insured | | | |
| 125 | | Minneapolis, Minnesota, Tax Increment Revenue Bonds, Grant Park Project, Refunding | 3/23 at 100.00 | N/R | 122,824 |
| | Series 2015, 4.000%, 3/01/30 | | | |
| 500 | | Minneapolis, Minnesota, Tax Increment Revenue Bonds, Ivy Tower Project, Series 2015, | 3/24 at 100.00 | N/R | 500,690 |
| | 5.000%, 3/01/29 | | | |
| 375 | | Minnesota Housing Finance Agency, Housing Infrastructure State Appropriation Bonds, | 8/25 at 100.00 | AA+ | 415,579 |
| | Series 2016C, 4.000%, 8/01/35 | | | |
| 200 | | Minnesota Housing Finance Agency, Housing Infrastructure State Appropriation Bonds, | 8/27 at 100.00 | AA+ | 229,214 |
| | Series 2017A, 4.000%, 8/01/35 | | | |
| 500 | | Minnesota Housing Finance Agency, Housing Infrastructure State Appropriation Bonds, | 8/28 at 100.00 | AA+ | 566,955 |
| | Series 2018D, 4.000%, 8/01/39 | | | |
| 2,230 | | Minnesota Housing Finance Agency, Nonprofit Housing Bonds, State Appropriation Series | 8/21 at 100.00 | AA+ | 2,347,766 |
| | 2011, 5.000%, 8/01/31 | | | |
| 750 | | Northeast Metropolitan Intermediate School District 916, White Bear Lake, Minnesota, | 2/25 at 100.00 | A2 | 808,762 |
| | Certificates of Participation, Series 2015B, 4.000%, 2/01/42 | | | |
| 1,000 | | Northeast Metropolitan Intermediate School District 916, White Bear Lake, Minnesota, | 2/25 at 100.00 | A2 | 1,069,410 |
| | Certificates of Participation, Series 2015A, 3.750%, 2/01/36 | | | |
| | Saint Cloud Independent School District 742, Stearns County, Minnesota, Certificates of | | | |
| | Participation, Saint Cloud Area Public Schools, Series 2017A: | | | |
| 145 | | 5.000%, 2/01/32 | 2/25 at 100.00 | A1 | 170,926 |
| 500 | | 4.000%, 2/01/38 | 2/25 at 100.00 | A1 | 542,410 |
| | Saint Paul Housing and Redevelopment Authority, Minnesota, Multifamily Housing Revenue | | | |
| | Bonds, 2700 University at Westgate Station, Series 2015B: | | | |
| 455 | | 4.875%, 4/01/30 | 4/23 at 100.00 | N/R | 461,393 |
| 895 | | 5.250%, 4/01/43 | 4/23 at 100.00 | N/R | 895,626 |
| 1,150 | | Saint Paul Independent School District 625, Ramsey County, Minnesota, Certificates of | 2/29 at 100.00 | AAA | 1,411,234 |
| | Participation, Series 2019B, 4.000%, 2/01/31 | | | |
| 800 | | Saint Paul, Minnesota, Sales Tax Revenue Bonds, Series 2014G, 3.750%, 11/01/33 | 11/24 at 100.00 | A+ | 863,504 |
| 12,225 | | Total Tax Obligation/Limited | | | 12,648,911 |
| | Transportation – 3.9% (2.4% of Total Investments) | | | |
| 500 | | Minneapolis-St Paul Metropolitan Airports Commission, Minnesota, Airport Revenue Bonds, | 7/29 at 100.00 | A+ | 595,190 |
| | Refunding Subordinate Lien Series 2019A, 5.000%, 1/01/44 | | | |
| 750 | | Minneapolis-St Paul Metropolitan Airports Commission, Minnesota, Airport Revenue Bonds, | 7/29 at 100.00 | A+ | 872,175 |
| | Refunding Subordinate Lien Series 2019B, 5.000%, 1/01/49 (AMT) | | | |
| 1,600 | | Minneapolis-St Paul Metropolitan Airports Commission, Minnesota, Airport Revenue Bonds, | 1/27 at 100.00 | AA– | 1,830,432 |
| | Senior Lien Series 2016C, 5.000%, 1/01/46 | | | |
| 2,850 | | Total Transportation | | | 3,297,797 |
| | U.S. Guaranteed – 6.2% (3.9% of Total Investments) (4) | | | |
| 580 | | St Paul Housing and Redevelopment Authority, Minnesota, Hospital Revenue Bonds, | 11/25 at 100.00 | N/R | 723,051 |
| | HealthEast Inc, Series 2015A, 5.000%, 11/15/44 (Pre-refunded 11/15/25) | | | |
| 2,000 | | University of Minnesota, General Revenue Bonds, Series 2011A, 5.250%, 12/01/29 | 12/20 at 100.00 | Aa1 | 2,049,360 |
| | (Pre-refunded 12/01/20) | | | |
| | Western Minnesota Municipal Power Agency, Minnesota, Power Supply Revenue Bonds, | | | |
| | Series 2014A: | | | |
| 1,000 | | 4.000%, 1/01/40 (Pre-refunded 1/01/24) | 1/24 at 100.00 | Aa3 | 1,130,910 |
| 1,200 | | 5.000%, 1/01/46 (Pre-refunded 1/01/24) | 1/24 at 100.00 | Aa3 | 1,399,776 |
| 4,780 | | Total U.S. Guaranteed | | | 5,303,097 |
66
| | | | | | |
| Principal | | | Optional Call | | |
| Amount (000) | | Description (1) | Provisions (2) | Ratings (3) | Value |
| | Utilities – 14.2% (9.0% of Total Investments) | | | |
| $ 500 | | Minnesota Municipal Power Agency, Electric Revenue Bonds, Refunding Series 2014A, | 10/24 at 100.00 | A1 | $ 551,455 |
| | 4.000%, 10/01/33 | | | |
| 965 | | Minnesota Municipal Power Agency, Electric Revenue Bonds, Series 2016, 5.000%, 10/01/35 | 10/26 at 100.00 | A1 | 1,181,575 |
| 1,200 | | Rochester, Minnesota, Electric Utility Revenue Bonds, Refunding Series 2017A, | 12/26 at 100.00 | Aa3 | 1,436,976 |
| | 5.000%, 12/01/47 | | | |
| 500 | | Saint Paul Port Authority, Minnesota, District Energy Revenue Bonds, Series 2017-3, | 10/27 at 100.00 | A– | 562,030 |
| | 4.000%, 10/01/42 | | | |
| | Southern Minnesota Municipal Power Agency, Power Supply System Revenue Bonds, | | | |
| | Series 994A: | | | |
| 1,100 | | 0.000%, 1/01/23 – NPFG Insured | No Opt. Call | A+ | 1,079,815 |
| 3,070 | | 0.000%, 1/01/24 – NPFG Insured | No Opt. Call | A+ | 2,980,540 |
| 100 | | 0.000%, 1/01/26 – NPFG Insured | No Opt. Call | A+ | 93,666 |
| 3,500 | | Western Minnesota Municipal Power Agency, Minnesota, Power Supply Revenue Bonds, Series | 7/28 at 100.00 | Aa3 | 4,317,320 |
| | 2018A, 5.000%, 1/01/49 | | | |
| 10,935 | | Total Utilities | | | 12,203,377 |
| | Water and Sewer – 0.6% (0.4% of Total Investments) | | | |
| 415 | | Guam Government Waterworks Authority, Water and Wastewater System Revenue Bonds, Series | 7/26 at 100.00 | A– | 443,797 |
| | 2016, 5.000%, 1/01/46 | | | |
| 30 | | Guam Government Waterworks Authority, Water and Wastewater System Revenue Bonds, Series | 7/30 at 100.00 | A– | 33,231 |
| | 2020A, 5.000%, 1/01/50 | | | |
| 445 | | Total Water and Sewer | | | 477,028 |
| $ 128,012 | | Total Long-Term Investments (cost $127,503,581) | | | 133,222,440 |
|
| Principal | | | Optional Call | | |
| Amount (000) | | Description (1) | Provisions (2) | Ratings (3) | Value |
| | SHORT-TERM INVESTMENTS – 3.1% (1.9% of Total Investments) | | | |
| | MUNICIPAL BONDS – 3.1% (1.9% of Total Investments) | | | |
| | Health Care – 3.1% (1.9% of Total Investments) | | | |
| $ 1,100 | | Rochester, Minnesota, Health Care Facilities Revenue Bonds, Variable Rate Demand Obligation, | 7/20 at 100.00 | A-1+ | $ 1,100,000 |
| | Mayo Clinic Series 2008B, 0.120%, 11/15/38 (5) | | | |
| 940 | | Rochester, Minnesota, Health Care Facilities Revenue Bonds, Variable Rate Demand Obligation, | 7/20 at 100.00 | A-1+ | 940,000 |
| | Mayo Clinic, Series 2011, 0.120%, 11/15/38 (5) | | | |
| 575 | | Minneapolis, Minnesota, Health Care System Revenue Bonds, Variable Rate Demand Obligation, | 7/20 at 100.00 | A-1 | 575,000 |
| | Fairview Health Services, Series 2018C, 0.060%, 11/15/48 (5) | | | |
| $ 2,615 | | Total Short-Term Investments (cost $2,615,000) | | | 2,615,000 |
| | Total Investments (cost $130,118,581) – 158.6% | | | 135,837,440 |
| | Adjustable Rate MuniFund Term Preferred Shares, net of deferred offering costs – (61.6)% (6) | | | (52,755,713) |
| | Other Assets Less Liabilities – 3.0% | | | 2,562,211 |
| | Net Asset Applicable to Common Shares – 100% | | | $ 85,643,938 |
67
| | |
| NMS | Nuveen Minnesota Quality Municipal Income Fund Portfolio of Investments (continued) May 31, 2020 |
| | |
(1) | All percentages shown in the Portfolio of Investments are based on net assets applicable to common shares unless otherwise noted. |
(2) | Optional Call Provisions: Dates (month and year) and prices of the earliest optional call or redemption. There may be other call provisions at varying prices at later dates. Certain mortgage-backed securities may be subject to periodic principal paydowns. Optional Call Provisions are not covered by the report of independent registered public accounting firm. |
(3) | For financial reporting purposes, the ratings disclosed are the highest of Standard & Poor’s Group (“Standard & Poor’s”), Moody’s Investors Service, Inc. (“Moody’s”) or Fitch, Inc. (“Fitch”) rating. This treatment of split-rated securities may differ from that used for other purposes, such as for Fund investment policies. Ratings below BBB by Standard Poor’s, Baa by Moody’s or BBB by Fitch are considered to be below investment grade. Holdings designated N/R are not rated by any of these national rating agencies. Ratings are not covered by the report of independent registered public accounting firm. |
(4) | Backed by an escrow or trust containing sufficient U.S. Government or U.S. Government agency securities, which ensure the timely payment of principal and interest. |
(5) | Investment has a maturity of greater than one year, but has variable rate and/or demand features which qualify it as a short-term investment. The rate disclosed, as well as the reference rate and spread, where applicable, is that in effect as of the end of the reporting period. This rate changes periodically based on market conditions or a specified market index. |
(6) | Adjustable Rate MuniFund Term Preferred Shares, net of deferred offering cost as a percentage of Total Investments is 38.8%. |
144A | Investment is exempt from registration under Rule 144A of the Securities Act of 1933, as amended. These investments may only be resold in transactions exempt from registration, which are normally those transactions with qualified institutional buyers. |
AMT | Alternative Minimum Tax |
WI/DD | Purchased on a when-issued or delayed delivery basis. |
| See accompanying notes to financial statements. |
68
| | |
| NOM | Nuveen Missouri Quality Municipal Income Fund Portfolio of Investments May 31, 2020 |
| | | | | | |
| Principal | | | Optional Call | | |
| Amount (000) | | Description (1) | Provisions (2) | Ratings (3) | Value |
| | LONG-TERM INVESTMENTS – 156.3% (100.0% of Total Investments) | | | |
| | MUNICIPAL BONDS – 156.3% (100.0% of Total Investments) | | | |
| | Consumer Staples – 4.3% (2.8% of Total Investments) | | | |
| $ 1,055 | | Missouri Development Finance Board, Solid Waste Disposal Revenue Bonds, Procter and | No Opt. Call | AA– | $ 1,389,984 |
| | Gamble Inc, Series 1999, 5.200%, 3/15/29 (AMT) | | | |
| | Education and Civic Organizations – 16.0% (10.3% of Total Investments) | | | |
| 300 | | Curators of the University of Missouri, System Facilities Revenue Bonds, Series 2014A, | 11/24 at 100.00 | AA+ | 342,282 |
| | 4.000%, 11/01/33 | | | |
| 410 | | Missouri Health and Educational Facilities Authority, Educational Facilities Revenue | 6/23 at 100.00 | A1 | 457,658 |
| | Bonds, Kansas City University of Medicine and Biosciences, Series 2013A, 5.000%, 6/01/33 | | | |
| 750 | | Missouri Health and Educational Facilities Authority, Educational Facilities Revenue | 5/23 at 100.00 | BBB | 776,317 |
| | Bonds, Saint Louis College of Pharmacy, Series 2013, 5.500%, 5/01/43 | | | |
| 600 | | Missouri Health and Educational Facilities Authority, Educational Facilities Revenue | 10/22 at 100.00 | BBB– | 613,806 |
| | Bonds, Southwest Baptist University Project, Series 2012, 5.000%, 10/01/33 | | | |
| 725 | | Missouri Health and Educational Facilities Authority, Educational Facilities Revenue | 10/23 at 100.00 | A+ | 816,604 |
| | Bonds, University of Central Missouri, Series 2013C-2, 5.000%, 10/01/34 | | | |
| 1,000 | | Missouri Health and Educational Facilities Authority, Revenue Bonds, Saint Louis | 10/25 at 100.00 | AA– | 1,095,820 |
| | University, Series 2015A, 4.000%, 10/01/42 | | | |
| 500 | | Missouri Health and Educational Facilities Authority, Revenue Bonds, Saint Louis | 4/29 at 100.00 | AA– | 594,500 |
| | University, Series 2019A, 5.000%, 10/01/46 | | | |
| 115 | | Missouri Health and Educational Facilities Authority, Revenue Bonds, Webster University, | 4/27 at 100.00 | Baa1 | 105,445 |
| | Refunding Series 2017, 4.000%, 4/01/34 | | | |
| 210 | | Missouri Southern State University, Auxiliary Enterprise System Revenue Bonds, Series | 10/29 at 100.00 | AA | 227,632 |
| | 2019A, 4.000%, 10/01/39 – AGM Insured | | | |
| 100 | | Saline County Industrial Development Authority, Missouri, First Mortgage Revenue Bonds, | 10/23 at 100.00 | N/R | 96,001 |
| | Missouri Valley College, Series 2017, 4.500%, 10/01/40 | | | |
| 4,710 | | Total Education and Civic Organizations | | | 5,126,065 |
| | Health Care – 35.7% (22.8% of Total Investments) | | | |
| 300 | | Boone County, Missouri, Hospital Revenue Bonds, Boone Hospital Center, Refunding Series | 8/26 at 100.00 | BBB– | 328,863 |
| | 2016, 5.000%, 8/01/30 | | | |
| 400 | | Cape Girardeau County Industrial Development Authority, Missouri, Health Facilities | 3/27 at 100.00 | BBB– | 426,068 |
| | Revenue Bonds, Southeasthealth, Series 2017A, 5.000%, 3/01/36 | | | |
| | Hannibal Industrial Development Authority, Missouri, Health Facilities Revenue Bonds, | | | |
| | Hannibal Regional Healthcare System, Series 2017: | | | |
| 310 | | 5.000%, 10/01/42 | 10/27 at 100.00 | A– | 347,684 |
| 250 | | 5.000%, 10/01/47 | 10/27 at 100.00 | A– | 276,920 |
| 315 | | Joplin Industrial Development Authority, Missouri, Health Facilities Revenue Bonds, | 2/24 at 100.00 | A | 345,394 |
| | Freeman Health System, Series 2015, 5.000%, 2/15/35 | | | |
| 500 | | Missouri Health and Educational Facilities Authority, Health Facilities Revenue Bonds, | 1/25 at 100.00 | AA | 535,680 |
| | BJC Health System, Series 2015A, 4.000%, 1/01/45 | | | |
| 500 | | Missouri Health and Educational Facilities Authority, Health Facilities Revenue Bonds, | 7/26 at 100.00 | AA | 553,490 |
| | BJC Health System, Variable Rate Demand Obligation Series 2013C, 4.000%, 1/01/50 (Mandatory | | | |
| | Put 1/01/46) | | | |
| 750 | | Missouri Health and Educational Facilities Authority, Health Facilities Revenue Bonds, | 1/28 at 100.00 | AA | 828,578 |
| | BJC Health System, Series 2018D, 4.000%, 1/01/58 (Mandatory Put 1/01/48) (UB) (4) | | | |
| 540 | | Missouri Health and Educational Facilities Authority, Health Facilities Revenue Bonds, | 11/20 at 100.00 | Baa2 | 547,641 |
| | Capital Region Medical Center, Series 2011, 5.000%, 11/01/27 | | | |
69
| | |
| NOM | Nuveen Missouri Quality Municipal Income Fund Portfolio of Investments (continued) May 31, 2020 |
| | | | | | |
| Principal | | | Optional Call | | |
| Amount (000) | | Description (1) | Provisions (2) | Ratings (3) | Value |
| | Health Care (continued) | | | |
| $ 1,730 | | Missouri Health and Educational Facilities Authority, Health Facilities Revenue Bonds, | 11/23 at 100.00 | A2 | $ 1,851,792 |
| | CoxHealth, Series 2013A, 5.000%, 11/15/44 | | | |
| 415 | | Missouri Health and Educational Facilities Authority, Health Facilities Revenue Bonds, | 11/25 at 100.00 | A2 | 472,502 |
| | CoxHealth, Series 2015A, 5.000%, 11/15/32 | | | |
| 150 | | Missouri Health and Educational Facilities Authority, Health Facilities Revenue Bonds, | 5/29 at 100.00 | A2 | 175,561 |
| | CoxHealth, Series 2019A, 5.000%, 11/15/37 | | | |
| 335 | | Missouri Health and Educational Facilities Authority, Health Facilities Revenue Bonds, | 2/22 at 100.00 | AA– | 350,125 |
| | Heartland Regional Medical Center, Series 2012, 5.000%, 2/15/37 | | | |
| 290 | | Missouri Health and Educational Facilities Authority, Health Facilities Revenue Bonds, | 11/22 at 100.00 | AA– | 300,396 |
| | Mercy Health, Series 2012, 4.000%, 11/15/42 | | | |
| 550 | | Missouri Health and Educational Facilities Authority, Health Facilities Revenue Bonds, | 11/24 at 100.00 | AA– | 590,309 |
| | Mercy Health, Series 2014F, 4.250%, 11/15/48 | | | |
| 515 | | Missouri Health and Educational Facilities Authority, Health Facilities Revenue Bonds, | 11/27 at 100.00 | AA– | 604,584 |
| | Mercy Health, Series 2017C, 5.000%, 11/15/47 | | | |
| 2,000 | | Missouri Health and Educational Facilities Authority, Health Facility Revenue Bonds, | 11/20 at 100.00 | A+ | 2,028,800 |
| | Saint Luke’s Health System, Series 2010A, 5.000%, 11/15/30 | | | |
| 350 | | Missouri Health and Educational Facilities Authority, Revenue Bonds, Children’s Mercy | 5/25 at 102.00 | A+ | 374,853 |
| | Hospital, Series 2017A, 4.000%, 5/15/48 | | | |
| 500 | | Saint Louis County Industrial Development Authority, Missouri, Health Facilities Revenue | 11/25 at 100.00 | N/R | 483,610 |
| | Bonds, Ranken-Jordan Project, Refunding & Improvement Series 2016, 5.000%, 11/15/46 | | | |
| 10,700 | | Total Health Care | | | 11,422,850 |
| | Housing/Single Family – 0.6% (0.4% of Total Investments) | | | |
| 165 | | Missouri Housing Development Commission, Single Family Mortgage Revenue Bonds, First | 11/26 at 100.00 | AA+ | 181,424 |
| | Place Homeownership Loan Program, Series 2017A-2, 3.800%, 11/01/37 | | | |
| | Long-Term Care – 9.2% (5.9% of Total Investments) | | | |
| 190 | | Bridgeton Industrial Development Authority, Missouri, Senior Housing Revenue Bonds, The | 5/25 at 100.00 | N/R | 158,443 |
| | Sarah Community Project, Refunding Series 2016, 4.000%, 5/01/33 | | | |
| 100 | | Kirkwood Industrial Development Authority, Missouri, Retirement Community Revenue Bonds, | 5/27 at 100.00 | BB | 95,043 |
| | Aberdeen Heights Project, Refunding Series 2017A, 5.250%, 5/15/37 | | | |
| 250 | | Missouri Health and Educational Facilities Authority, Revenue Bonds, Lutheran Senior | 2/21 at 100.00 | BBB | 253,837 |
| | Services Projects, Series 2011, 6.000%, 2/01/41 | | | |
| 500 | | Missouri Health and Educational Facilities Authority, Revenue Bonds, Lutheran Senior | 2/24 at 100.00 | BBB | 483,140 |
| | Services Projects, Series 2014A, 5.000%, 2/01/44 | | | |
| | Missouri Health and Educational Facilities Authority, Revenue Bonds, Lutheran Senior | | | |
| | Services Projects, Series 2016A: | | | |
| 400 | | 5.000%, 2/01/36 | 2/26 at 100.00 | BBB | 400,952 |
| 500 | | 5.000%, 2/01/46 | 2/26 at 100.00 | BBB | 479,730 |
| 100 | | Missouri Health and Educational Facilities Authority, Revenue Bonds, Lutheran Senior | 2/29 at 100.00 | BBB | 77,506 |
| | Services Projects, Series 2019C, 4.000%, 2/01/48 | | | |
| | Saint Louis County Industrial Development Authority, Missouri, Revenue Bonds, Friendship | | | |
| | Village of Sunset Hills, Series 2012: | | | |
| 250 | | 5.000%, 9/01/32 | 9/22 at 100.00 | BB+ | 242,410 |
| 250 | | 5.000%, 9/01/42 | 9/22 at 100.00 | BB+ | 228,070 |
| 430 | | Saint Louis County Industrial Development Authority, Missouri, Revenue Bonds, Friendship | 9/23 at 100.00 | BB+ | 436,863 |
| | Village of Sunset Hills, Series 2013A, 5.875%, 9/01/43 | | | |
| 100 | | Saint Louis County Industrial Development Authority, Missouri, Revenue Bonds, Saint | 12/25 at 100.00 | N/R | 86,202 |
| | Andrew’s Resources for Seniors, Series 2015A, 5.125%, 12/01/45 | | | |
| 3,070 | | Total Long-Term Care | | | 2,942,196 |
| | Tax Obligation/General – 23.6% (15.1% of Total Investments) | | | |
| 500 | | Branson Reorganized School District R-4, Taney County, Missouri, General Obligation | 3/22 at 100.00 | A+ | 527,985 |
| | Bonds, School Building Series 2012, 4.375%, 3/01/32 | | | |
70
| | | | | | |
| Principal | | | Optional Call | | |
| Amount (000) | | Description (1) | Provisions (2) | Ratings (3) | Value |
| | Tax Obligation/General (continued) | | | |
| | Clay County Public School District 53, Liberty, Missouri, General Obligation Bonds, | | | |
| | Series 2018: | | | |
| $ 1,000 | | 4.000%, 3/01/34 | 3/26 at 100.00 | AA | $ 1,133,500 |
| 335 | | 4.000%, 3/01/36 | 3/26 at 100.00 | AA | 376,594 |
| 340 | | Clay County Reorganized School District R-II Smithville, Missouri, General Obligation | 3/27 at 100.00 | AA+ | 388,447 |
| | Bonds, Refunding Series 2015, 4.000%, 3/01/36 | | | |
| 500 | | Fort Zumwalt School District, Callaway County, Missouri, General Obligation Bonds, | 3/24 at 100.00 | AA+ | 554,320 |
| | Refunding & Improvement Series 2015, 4.000%, 3/01/32 | | | |
| 200 | | Fort Zumwalt School District, Callaway County, Missouri, General Obligation Bonds, | 3/27 at 100.00 | AA+ | 246,612 |
| | Refunding & Improvement Series 2018, 5.000%, 3/01/36 | | | |
| 500 | | Jackson County Reorganized School District 4, Blue Springs, Missouri, General Obligation | 3/21 at 100.00 | AA– | 517,450 |
| | Bonds, School Building Series 2013A, 5.000%, 3/01/31 | | | |
| 1,000 | | Joplin Schools, Missouri, General Obligation Bonds, Refunding, Direct Deposit Program | 3/27 at 100.00 | AA+ | 1,172,710 |
| | Series 2017, 4.000%, 3/01/32 | | | |
| 300 | | Kansas City, Missouri, General Obligation Bonds, Refunding & Improvement Series 2018A, | 2/28 at 100.00 | AA | 353,751 |
| | 4.000%, 2/01/35 | | | |
| 1,000 | | Valley Park Fire Protection District, Missouri, General Obligation Bonds, Series 2019, | 3/27 at 100.00 | AA | 1,140,190 |
| | 4.000%, 3/01/39 | | | |
| 1,000 | | Washington School District, Franklin County, Missouri, General Obligation Bonds, | 3/27 at 100.00 | AA+ | 1,152,900 |
| | Missouri Direct Deposit Program, Series 2019, 4.000%, 3/01/35 | | | |
| 6,675 | | Total Tax Obligation/General | | | 7,564,459 |
| | Tax Obligation/Limited – 26.5% (16.9% of Total Investments) | | | |
| 910 | | Bi-State Development Agency of the Missouri-Illinois Metropolitan District, Mass Transit | 10/22 at 100.00 | AA+ | 1,006,251 |
| | Sales Tax Appropriation Bonds, Refunding Combined Lien Series 2013A, 5.000%, 10/01/33 | | | |
| 500 | | Bi-State Development Agency of the Missouri-Illinois Metropolitan District, Mass Transit | 10/29 at 100.00 | AA+ | 561,255 |
| | Sales Tax Appropriation Bonds, Refunding Combined Lien Series 2019, 4.000%, 10/01/48 | | | |
| 350 | | Blue Springs, Missouri, Special Obligation Tax Increment Bonds, Adams Farm Project, | 6/24 at 100.00 | N/R | 324,419 |
| | Special Districts Refunding & Improvement Series 2015A, 4.750%, 6/01/30 | | | |
| 145 | | Clay, Jackson & Platte Counties Consolidated Public Library District 3, Missouri, | 3/26 at 100.00 | Aa3 | 159,425 |
| | Certificates of Participation, Mid-Continent Public Library Project, Series 2018, | | | |
| | 4.000%, 3/01/35 | | | |
| 250 | | Conley Road Transportation District, Missouri, Transportation Sales Tax Revenue Bonds, Series | 5/25 at 100.00 | N/R | 233,420 |
| | 2017, 5.125%, 5/01/41 | | | |
| 350 | | Fenton Missouri Fire Protection District, Missouri, General Obligation Bonds, Series | 3/27 at 100.00 | AA+ | 399,066 |
| | 2019, 4.000%, 3/01/39 | | | |
| 315 | | Fulton, Missouri, Tax Increment Revenue Bonds, Fulton Commons Redevelopment Project, | 6/20 at 100.00 | N/R | 163,800 |
| | Series 2006, 5.000%, 6/01/28 (5) | | | |
| 430 | | Government of Guam, Business Privilege Tax Bonds, Series 2012B-1, 5.000%, 1/01/42 | 1/22 at 100.00 | BB | 435,590 |
| | Howard Bend Levee District, St Louis County, Missouri, Levee District Improvement Bonds, | | | |
| | Series 2013B: | | | |
| 250 | | 4.875%, 3/01/33 | 3/23 at 100.00 | BB+ | 241,123 |
| 200 | | 5.000%, 3/01/38 | 3/23 at 100.00 | BB+ | 190,484 |
| 485 | | Jackson County, Missouri, Special Obligation Bonds, Truman Medical Center Project, | 12/21 at 100.00 | Aa3 | 510,264 |
| | Series 2011B, 4.350%, 12/01/23 | | | |
| 300 | | Kansas City Industrial Development Authority, Missouri, Downtown Redevelopment District | 9/21 at 100.00 | AA– | 317,274 |
| | Revenue Bonds, Series 2011A, 5.000%, 9/01/32 | | | |
| 125 | | Kansas City Industrial Development Authority, Missouri, Sales Tax Revenue Bonds, Ward | No Opt. Call | N/R | 122,403 |
| | Parkway Center Community Improvement District, Senior Refunding & Improvement Series 2016, | | | |
| | 4.250%, 4/01/26, 144A | | | |
| 325 | | Kansas City, Missouri, Special Obligation Bonds, Downtown Redevelopment District, Series | 9/23 at 100.00 | AA– | 365,310 |
| | 2014C, 5.000%, 9/01/33 | | | |
71
| | |
| NOM | Nuveen Missouri Quality Municipal Income Fund Portfolio of Investments (continued) May 31, 2020 |
| | | | | | |
| Principal | | | Optional Call | | |
| Amount (000) | | Description (1) | Provisions (2) | Ratings (3) | Value |
| | Tax Obligation/Limited (continued) | | | |
| | Land Clearance for Redevelopment Authority of Kansas City, Missouri, Project Revenue | | | |
| | Bonds, Convention Center Hotel Project – TIF Financing, Series 2018B: | | | |
| $ 100 | | 5.000%, 2/01/40, 144A | 2/28 at 100.00 | N/R | $ 100,505 |
| 100 | | 5.000%, 2/01/50, 144A | 2/28 at 100.00 | N/R | 99,686 |
| 245 | | Missouri Development Finance Board, Infrastructure Facilities Revenue Bonds, City of | 6/23 at 100.00 | A | 263,390 |
| | Branson – Branson Landing Project, Series 2015A, 4.000%, 6/01/34 | | | |
| 260 | | Osage Beach, Missouri, Tax Increment Revenue Bonds, Prewitts Point Project, Series 2006, | 6/20 at 100.00 | N/R | 243,958 |
| | 5.000%, 5/01/23 | | | |
| 140 | | Plaza at Noah’s Ark Community Improvement District, Saint Charles, Missouri, Tax | 5/21 at 100.00 | N/R | 141,438 |
| | Increment and Improvement District Revenue Bonds, Series 2015, 5.000%, 5/01/30 | | | |
| | Puerto Rico Sales Tax Financing Corporation, Sales Tax Revenue Bonds, Restructured 2018A-1: | | | |
| 200 | | 4.550%, 7/01/40 | 7/28 at 100.00 | N/R | 198,252 |
| 409 | | 0.000%, 7/01/46 | 7/28 at 41.38 | N/R | 106,189 |
| 170 | | 5.000%, 7/01/58 | 7/28 at 100.00 | N/R | 170,554 |
| | Puerto Rico Sales Tax Financing Corporation, Sales Tax Revenue Bonds, Taxable | | | |
| | Restructured COFINA Project Series 2019A-2: | | | |
| 252 | | 4.329%, 7/01/40 | 7/28 at 100.00 | N/R | 242,550 |
| 9 | | 4.784%, 7/01/58 | 7/28 at 100.00 | N/R | 8,745 |
| 50 | | Saint Charles County Industrial Development Authority, Missouri, Sales Tax Revenue | 11/29 at 102.00 | N/R | 40,627 |
| | Bonds, Wentzville Parkway Regional Community Improvement District Project, Series 2019B, | | | |
| | 4.250%, 11/01/49, 144A | | | |
| 250 | | Saint Louis County Industrial Development Authority, Missouri, Sales Tax Revenue Bonds, | 7/24 at 100.00 | N/R | 223,925 |
| | Chesterfield Blue Valley Community Improvement District Project, Series 2014A, 5.250%, | | | |
| | 7/01/44, 144A | | | |
| 300 | | Saint Louis Municipal Library District, Missouri, Certificates of Participation, | 3/30 at 100.00 | AA | 339,495 |
| | Refunding Series 2020, 4.000%, 3/15/44 – BAM Insured | | | |
| 600 | | Springfield, Missouri, Special Obligation Bonds, Sewer System Improvements Project, | 4/25 at 100.00 | Aa2 | 659,472 |
| | Series 2015, 4.000%, 4/01/35 | | | |
| 450 | | The Industrial Development Authority of the City of Saint Louis, Missouri, Development | 11/26 at 100.00 | N/R | 371,277 |
| | Financing Revenue Bonds, Ballpark Village Development Project, Series 2017A, 4.750%, 11/15/47 | | | |
| 215 | | Transportation Development District, Missouri, Transportation Sales Tax Revenue Bonds, | 6/26 at 100.00 | BBB | 231,523 |
| | Series 2017, 4.500%, 6/01/36 | | | |
| 8,685 | | Total Tax Obligation/Limited | | | 8,471,670 |
| | Transportation – 1.1% (0.7% of Total Investments) | | | |
| 335 | | Guam International Airport Authority, Revenue Bonds, Series 2013B, 5.500%, 10/01/33 – | 10/23 at 100.00 | AA | 361,626 |
| | AGM Insured | | | |
| | U.S. Guaranteed – 24.4% (15.6% of Total Investments) (6) | | | |
| 200 | | Joplin Industrial Development Authority, Missouri, Health Facilities Revenue Bonds, | 2/21 at 100.00 | A | 207,368 |
| | Freeman Health System, Series 2011, 5.500%, 2/15/31 (Pre-refunded 2/15/21) | | | |
| 2,000 | | Metropolitan St Louis Sewerage District, Missouri, Wastewater System Revenue Bonds, | 5/22 at 100.00 | AAA | 2,184,500 |
| | Series 2012A, 5.000%, 5/01/42 (Pre-refunded 5/01/22) | | | |
| 500 | | Missouri Health and Educational Facilities Authority, Health Facilities Revenue Bonds, | 12/21 at 100.00 | A+ | 526,310 |
| | Saint Luke’s Episcopal & Presbyterian Hospitals, Series 2011, 5.000%, 12/01/25 | | | |
| | (Pre-refunded 12/01/21) | | | |
| 630 | | Missouri Health and Educational Facilities Authority, Revenue Bonds, AT Still University | 10/21 at 100.00 | A– | 671,813 |
| | of Health Sciences, Series 2011, 5.250%, 10/01/41 (Pre-refunded 10/01/21) | | | |
| 510 | | Missouri Health and Educational Facilities Authority, Revenue Bonds, AT Still University | 10/23 at 100.00 | A– | 590,850 |
| | of Health Sciences, Series 2014, 5.000%, 10/01/39 (Pre-refunded 10/01/23) | | | |
| 550 | | Missouri Health and Educational Facilities Authority, Revenue Bonds, Washington | 11/21 at 100.00 | AA+ | 588,280 |
| | University, Series 2011B, 5.000%, 11/15/37 (Pre-refunded 11/15/21) | | | |
| 600 | | Missouri Health and Educational Facilities Authority, Revenue Bonds, Webster University, | 4/21 at 100.00 | Baa1 | 623,628 |
| | Series 2011, 5.000%, 4/01/36 (Pre-refunded 4/01/21) | | | |
72
| | | | | | |
| Principal | | | Optional Call | | |
| Amount (000) | | Description (1) | Provisions (2) | Ratings (3) | Value |
| | U.S. Guaranteed (6) (continued) | | | |
| | Missouri Joint Municipal Electric Utility Commission, Power Supply System Revenue Bonds, | | | |
| | MoPEP Facilities, Series 2012: | | | |
| $ 400 | | 5.000%, 1/01/32 (Pre-refunded 1/01/21) | 1/21 at 100.00 | A2 | $ 411,016 |
| 425 | | 5.000%, 1/01/37 (Pre-refunded 1/01/21) | 1/21 at 100.00 | A2 | 436,704 |
| 100 | | Saint Louis County Industrial Development Authority, Missouri, Revenue Bonds, Friendship | 9/22 at 100.00 | N/R | 110,470 |
| | Village of Chesterfield, Series 2012, 5.000%, 9/01/42 (Pre-refunded 9/01/22) | | | |
| 920 | | Springfield Public Building Corporation, Missouri, Lease Revenue Bonds, Jordan Valley | 8/20 at 100.00 | N/R | 943,497 |
| | Park Projects, Series 2000A, 6.125%, 6/01/21 – AMBAC Insured (ETM) | | | |
| 500 | | St Louis County, Missouri, GNMA Collateralized Mortgage Revenue Bonds, Series 1993D, | No Opt. Call | AA+ | 502,100 |
| | 5.650%, 7/01/20 (AMT) (ETM) | | | |
| 7,335 | | Total U.S. Guaranteed | | | 7,796,536 |
| | Utilities – 4.8% (3.1% of Total Investments) | | | |
| 350 | | Missouri Joint Municipal Electric Utility Commission, Power Project Revenue Bonds, Plum | 1/25 at 100.00 | A | 409,804 |
| | Point Project, Refunding Series 2014A, 5.000%, 1/01/32 | | | |
| 500 | | Missouri Joint Municipal Electric Utility Commission, Power Project Revenue Bonds, Plum | 1/26 at 100.00 | A | 549,235 |
| | Point Project, Refunding Series 2015A, 4.000%, 1/01/35 | | | |
| 500 | | Missouri Joint Municipal Electric Utility Commission, Power Supply System Revenue Bonds, | 6/27 at 100.00 | A2 | 586,925 |
| | MoPEP Facilities, Series 2018, 5.000%, 12/01/43 | | | |
| 1,350 | | Total Utilities | | | 1,545,964 |
| | Water and Sewer – 10.1% (6.4% of Total Investments) | | | |
| 250 | | Camden County Public Water Supply District 4, Missouri, Certificates of Participation, | 1/25 at 100.00 | A– | 277,882 |
| | Series 2017, 5.000%, 1/01/47 | | | |
| 150 | | Franklin County Public Water Supply District 3, Missouri, Certificates of Participation, | 12/24 at 100.00 | A+ | 164,776 |
| | Series 2017, 4.000%, 12/01/37 | | | |
| 160 | | Kansas City, Missouri, Sanitary Sewer System Revenue Bonds, Improvement Series 2018A, | 1/28 at 100.00 | AA | 188,440 |
| | 4.000%, 1/01/35 | | | |
| 125 | | Metropolitan St Louis Sewerage District, Missouri, Wastewater System Revenue Bonds, | 5/26 at 100.00 | AAA | 150,706 |
| | Refunding & Improvement Series 2016C, 5.000%, 5/01/46 | | | |
| 450 | | Metropolitan St Louis Sewerage District, Missouri, Wastewater System Revenue Bonds, | 5/27 at 100.00 | AAA | 546,300 |
| | Refunding & Improvement Series 2017A, 5.000%, 5/01/47 | | | |
| 500 | | Missouri Environmental Improvement and Energy Resources Authority, Water Facility | 1/25 at 100.00 | Aa3 | 578,160 |
| | Revenue Bonds, Tri-County Water Authority, Series 2015, 5.000%, 1/01/40 | | | |
| 585 | | Saint Charles County Public Water Supply District 2, Missouri, Certificates of | 12/25 at 100.00 | AA+ | 704,077 |
| | Participation, Refunding Series 2016C, 5.000%, 12/01/32 | | | |
| 550 | | Saint Charles County Public Water Supply District 2, Missouri, Certificates of | 12/25 at 100.00 | AA+ | 608,283 |
| | Participation, Series 2018, 4.000%, 12/01/39 | | | |
| 2,770 | | Total Water and Sewer | | | 3,218,624 |
| $ 46,850 | | Total Long-Term Investments (cost $47,434,249) | | | 50,021,398 |
| | Floating Rate Obligations – (1.9)% | | | (600,000) |
| | MuniFund Preferred Shares, net of deferred offering cost – (55.5)% (7) | | | (17,779,188) |
| | Other Assets Less Liabilities – 1.1% | | | 354,000 |
| | Net Asset Applicable to Common Shares – 100% | | | $ 31,996,210 |
73
| | |
| NOM | Nuveen Missouri Quality Municipal Income Fund Portfolio of Investments (continued) May 31, 2020 |
| | |
(1) | All percentages shown in the Portfolio of Investments are based on net assets applicable to common shares unless otherwise noted. |
(2) | Optional Call Provisions: Dates (month and year) and prices of the earliest optional call or redemption. There may be other call provisions at varying prices at later dates. Certain mortgage-backed securities may be subject to periodic principal paydowns. Optional Call Provisions are not covered by the report of independent registered public accounting firm. |
(3) | For financial reporting purposes, the ratings disclosed are the highest of Standard & Poor’s Group (“Standard & Poor’s”), Moody’s Investors Service, Inc. (“Moody’s”) or Fitch, Inc. (“Fitch”) rating. This treatment of split-rated securities may differ from that used for other purposes, such as for Fund investment policies. Ratings below BBB by Standard Poor’s, Baa by Moody’s or BBB by Fitch are considered to be below investment grade. Holdings designated N/R are not rated by any of these national rating agencies. Ratings are not covered by the report of independent registered public accounting firm. |
(4) | Investment, or portion of investment, has been pledged to collateralize the net payment obligations for investments in inverse floating rate transactions. |
(5) | Defaulted security. A security whose issuer has failed to fully pay principal and/or interest when due, or is under the protection of bankruptcy. |
(6) | Backed by an escrow or trust containing sufficient U.S. Government or U.S. Government agency securities, which ensure the timely payment of principal and interest. |
(7) | MuniFund Preferred Shares, net of deferred offering costs as a percentage of Total Investments is 35.5%. |
144A | Investment is exempt from registration under Rule 144A of the Securities Act of 1933, as amended. These investments may only be resold in transactions exempt from registration, which are normally those transactions with qualified institutional buyers. |
AMT | Alternative Minimum Tax |
ETM | Escrowed to maturity |
UB | Underlying bond of an inverse floating rate trust reflected as a financing transaction. See Notes to Financial Statements, Note 4 – Portfolio Securities and Investments in Derivatives for more information. |
| See accompanying notes to financial statements. |
74
| | |
| NPV | Nuveen Virginia Quality Municipal Income Fund Portfolio of Investments May 31, 2020 |
| | | | | | |
| Principal | | | Optional Call | | |
| Amount (000) | | Description (1) | Provisions (2) | Ratings (3) | Value |
| | LONG-TERM INVESTMENTS – 155.0% (100.0% of Total Investments) | | | |
| | MUNICIPAL BONDS – 155.0% (100.0% of Total Investments) | | | |
| | Consumer Staples – 4.6% (3.0% of Total Investments) | | | |
| | Guam Economic Development & Commerce Authority, Tobacco Settlement Asset-Backed Bonds, | | | |
| | Series 2007A: | | | |
| $ 545 | | 5.250%, 6/01/32 | 6/20 at 100.00 | N/R | $ 512,087 |
| 700 | | 5.625%, 6/01/47 | 6/20 at 100.00 | N/R | 614,663 |
| 4,135 | | Tobacco Settlement Financing Corporation of Virginia, Tobacco Settlement Asset Backed | 6/20 at 100.00 | B– | 4,116,020 |
| | Bonds, Series 2007B1, 5.000%, 6/01/47 | | | |
| 6,645 | | Tobacco Settlement Financing Corporation of Virginia, Tobacco Settlement Asset-Backed | 6/21 at 100.00 | B– | 6,669,919 |
| | Bonds, Series 2007B2, 5.200%, 6/01/46 | | | |
| 75 | | Tobacco Settlement Financing Corporation, Virgin Islands, Tobacco Settlement | 6/20 at 100.00 | A3 | 75,105 |
| | Asset-Backed Bonds, Series 2001, 5.000%, 5/15/31 | | | |
| 12,100 | | Total Consumer Staples | | | 11,987,794 |
| | Education and Civic Organizations – 12.3% (7.9% of Total Investments) | | | |
| 1,615 | | Alexandria Industrial Development Authority, Virginia, Educational Facilities Revenue | 1/22 at 100.00 | A1 | 1,678,453 |
| | Bonds, Episcopal High School, Series 2012, 3.750%, 1/01/30 | | | |
| | Alexandria Industrial Development Authority, Virginia, Educational Facilities Revenue | | | |
| | Bonds, Episcopal High School, Series 2017: | | | |
| 1,105 | | 4.000%, 1/01/37 | 1/27 at 100.00 | A1 | 1,249,070 |
| 565 | | 4.000%, 1/01/40 | 1/27 at 100.00 | A1 | 634,365 |
| 520 | | Amherst Industrial Development Authority, Virginia, Revenue Bonds, Sweet Briar College, | 6/20 at 100.00 | BB– | 509,590 |
| | Series 2006, 5.000%, 9/01/26 | | | |
| 1,000 | | Industrial Development Authority of the City of Lexington, Virginia, Washington and Lee | 1/28 at 100.00 | AA | 1,242,010 |
| | University, Educational Facility Revenue Bonds, Refunding Series 2018A, 5.000%, 1/01/43 | | | |
| 500 | | Montgomery County Economic Development Authority, Virginia, Revenue Bonds, Virginia Tech | 6/27 at 100.00 | Aa2 | 577,115 |
| | Foundation, Refunding Series 2017A, 4.000%, 6/01/36 | | | |
| | Montgomery County Economic Development Authority, Virginia, Revenue Bonds, Virginia Tech | | | |
| | Foundation, Refunding Series 2019A: | | | |
| 500 | | 4.000%, 6/01/37 | 6/29 at 100.00 | Aa2 | 594,960 |
| 905 | | 4.000%, 6/01/39 | 6/29 at 100.00 | Aa2 | 1,070,144 |
| 750 | | Roanoke Economic Development Authority, Virginia, Educational Facilities Revenue Bonds, | 9/28 at 100.00 | BBB+ | 791,543 |
| | Lynchburg College, Series 2018A, 5.000%, 9/01/43 | | | |
| 2,500 | | The Rector and Visitors of the University of Virginia, General Pledge Revenue Bonds, | 4/25 at 100.00 | AAA | 2,896,925 |
| | Green Series 2015A-2, 5.000%, 4/01/45 | | | |
| | The Rector and Visitors of the University of Virginia, General Pledge Revenue Bonds, | | | |
| | Refunding Series 2017A: | | | |
| 9,000 | | 5.000%, 4/01/42 (UB) (4) | 4/27 at 100.00 | AAA | 11,013,660 |
| 1,515 | | 5.000%, 4/01/42 | 4/27 at 100.00 | AAA | 1,853,966 |
| 1,000 | | Virginia College Building Authority, Educational Facilities Revenue Bonds, Marymount | 7/25 at 100.00 | BB+ | 899,770 |
| | University Project, Green Series 2015B, 5.000%, 7/01/45, 144A | | | |
| | Virginia College Building Authority, Educational Facilities Revenue Bonds, Marymount | | | |
| | University Project, Refunding Series 2015A: | | | |
| 1,500 | | 5.000%, 7/01/35, 144A | 7/25 at 100.00 | BB+ | 1,429,650 |
| 4,000 | | 5.000%, 7/01/45, 144A | 7/25 at 100.00 | BB+ | 3,599,080 |
| 80 | | Virginia College Building Authority, Educational Facilities Revenue Bonds, Washington | No Opt. Call | AA | 82,329 |
| | and Lee University, Series 2001, 5.375%, 1/01/21 | | | |
| 1,460 | | Virginia College Building Authority, Educational Facilities Revenue Bonds, Washington | 1/25 at 100.00 | AA | 1,659,743 |
| | and Lee University, Series 2015A, 5.000%, 1/01/40 | | | |
| 28,515 | | Total Education and Civic Organizations | | | 31,782,373 |
75
| | |
| NPV | Nuveen Virginia Quality Municipal Income Fund Portfolio of Investments (continued) May 31, 2020 |
| | | | | | |
| Principal | | | Optional Call | | |
| Amount (000) | | Description (1) | Provisions (2) | Ratings (3) | Value |
| | Health Care – 24.3% (15.6% of Total Investments) | | | |
| $ 5,000 | | Arlington County Industrial Development Authority, Virginia, Hospital Facility Revenue | 7/20 at 100.00 | AA– | $ 5,012,300 |
| | Bonds, Virginia Hospital Center Arlington Health System, Refunding Series 2010, 5.000%, 7/01/31 | | | |
| | Arlington County Industrial Development Authority, Virginia, Hospital Facility Revenue | | | |
| | Bonds, Virginia Hospital Center, Series 2020: | | | |
| 2,000 | | 4.000%, 7/01/39 | 7/30 at 100.00 | AA– | 2,199,020 |
| 225 | | 4.000%, 7/01/40 | 7/30 at 100.00 | AA– | 246,013 |
| 1,055 | | 4.000%, 7/01/45 | 7/30 at 100.00 | AA– | 1,142,523 |
| 1,000 | | Chesapeake Hospital Authority, Virginia, Hospital Facility Revenue Bonds, Chesapeake | 7/29 at 100.00 | A | 1,040,430 |
| | Regional Medical Center, Series 2019, 4.000%, 7/01/39 | | | |
| 1,920 | | Colorado Health Facilities Authority, Colorado, Revenue Bonds, CommonSpirit Health, | 8/29 at 100.00 | BBB+ | 1,966,195 |
| | Series 2019A-1, 4.000%, 8/01/44 | | | |
| 1,000 | | Fairfax County Industrial Development Authority, Virginia, Healthcare Revenue Bonds, | 5/22 at 100.00 | AA+ | 1,057,190 |
| | Inova Health System, Series 2012A, 5.000%, 5/15/40 | | | |
| 2,000 | | Fairfax County Industrial Development Authority, Virginia, Healthcare Revenue Bonds, | 5/28 at 100.00 | AA+ | 2,231,640 |
| | Inova Health System, Series 2018A, 4.000%, 5/15/48 | | | |
| 4,950 | | Fairfax County Industrial Development Authority, Virginia, Hospital Revenue Refunding | No Opt. Call | AA+ | 5,320,606 |
| | Bonds, Inova Health System, Series 1993A, 5.000%, 8/15/23 | | | |
| 2,500 | | Fredericksburg Economic Development Authority, Virginia, Hospital Facilities Revenue | No Opt. Call | A3 | 2,800,350 |
| | Bonds, MediCorp Health System, Series 2007, 5.250%, 6/15/23 | | | |
| 1,000 | | Front Royal and Warren County Industrial Development Authority, Virginia, Hospital | 1/25 at 103.00 | A+ | 1,071,400 |
| | Revenue Bonds, Valley Health System Obligated Group, Series 2018, 4.000%, 1/01/50 | | | |
| 3,500 | | Industrial Development Authority of the City of Newport News, Virginia, Health System | 7/25 at 100.00 | N/R | 3,828,335 |
| | Revenue Bonds, Riverside Health System, Series 2015A, 5.330%, 7/01/45, 144A | | | |
| | Lynchburg Economic Development Authority, Virginia, Hospital Revenue Bonds, Centra | | | |
| | Health Obligated Group, Refunding Series 2017A: | | | |
| 195 | | 5.000%, 1/01/31 | 1/27 at 100.00 | A | 229,577 |
| 2,000 | | 5.000%, 1/01/47 | 1/27 at 100.00 | A | 2,253,360 |
| 1,000 | | Norfolk Economic Development Authority, Virginia, Hospital Facility Revenue Bonds, | 11/28 at 100.00 | AA | 1,121,270 |
| | Sentara Healthcare Systems, Refunding Series 2018B, 4.000%, 11/01/48 | | | |
| 3,155 | | Prince William County Industrial Development Authority, Virginia, Health Care Facilities | 11/22 at 100.00 | AA– | 3,352,187 |
| | Revenue Bonds, Novant Health Obligated Group-Prince William Hospital, Refunding Series 2013B, | | | |
| | 5.000%, 11/01/46 | | | |
| 2,000 | | Roanoke Economic Development Authority, Virginia, Hospital Revenue Bonds, Carilion | 7/30 at 100.00 | AA– | 2,191,740 |
| | Clinic Obligated Group, Series 2020A, 4.000%, 7/01/51 | | | |
| | Stafford County Economic Development Authority, Virginia, Hospital Facilities Revenue | | | |
| | Bonds, Mary Washington Healthcare Obligated Group, Refunding Series 2016: | | | |
| 1,000 | | 5.000%, 6/15/32 | 6/26 at 100.00 | A3 | 1,154,640 |
| 1,440 | | 5.000%, 6/15/35 | 6/26 at 100.00 | A3 | 1,645,862 |
| 1,360 | | 4.000%, 6/15/37 | 6/26 at 100.00 | A3 | 1,466,107 |
| 3,200 | | Virginia Commonwealth University Health System Authority, General Revenue Bonds, Series | 7/27 at 100.00 | AA– | 3,757,056 |
| | 2017B, 5.000%, 7/01/46 | | | |
| 3,415 | | Virginia Small Business Finance Authority, Healthcare Facilities Revenue Bonds, Bon | 6/30 at 100.00 | AA– | 3,742,908 |
| | Secours Mercy Health, Inc, Series 2020A, 4.000%, 12/01/49 | | | |
| | Virginia Small Business Finance Authority, Healthcare Facilities Revenue Bonds, Sentara | | | |
| | Healthcare, Refunding Series 2020: | | | |
| 1,000 | | 4.000%, 11/01/38 | 11/29 at 100.00 | AA | 1,121,360 |
| 1,150 | | 4.000%, 11/01/39 | 11/29 at 100.00 | AA | 1,286,183 |
| 2,700 | | Washington Health Care Facilities Authority, Revenue Bonds, CommonSpirit Health, Series | 8/29 at 100.00 | BBB+ | 2,764,962 |
| | 2019A-1, 4.000%, 8/01/44 | | | |
| 2,335 | | Winchester Economic Development Authority, Virginia, Hospital Revenue Bonds, Valley | 1/24 at 100.00 | A+ | 2,523,761 |
| | Health System Obligated Group, Refunding Series 2014A, 5.000%, 1/01/44 | | | |
76
| | | | | | |
| Principal | | | Optional Call | | |
| Amount (000) | | Description (1) | Provisions (2) | Ratings (3) | Value |
| | Health Care (continued) | | | |
| | Winchester Economic Development Authority, Virginia, Hospital Revenue Bonds, Valley | | | |
| | Health System Obligated Group, Refunding Series 2015: | | | |
| $ 1,500 | | 5.000%, 1/01/33 | 1/26 at 100.00 | A+ | $ 1,732,725 |
| 1,000 | | 5.000%, 1/01/35 | 1/26 at 100.00 | A+ | 1,148,560 |
| 2,000 | | 4.000%, 1/01/37 | 1/26 at 100.00 | A+ | 2,179,960 |
| 1,215 | | 5.000%, 1/01/44 | 1/26 at 100.00 | A+ | 1,364,251 |
| 57,815 | | Total Health Care | | | 62,952,471 |
| | Housing/Multifamily – 6.2% (4.0% of Total Investments) | | | |
| 1,000 | | Richmond Redevelopment and Housing Authority, Virginia, Multi-Family Housing Revenue | 1/27 at 100.00 | N/R | 1,000,490 |
| | Bonds, American Tobacco Apartments, Series 2017, 5.550%, 1/01/37, 144A | | | |
| 1,000 | | Virginia Housing Development Authority, Rental Housing Bonds, Series 2012A, | 3/21 at 100.00 | AA+ | 1,014,320 |
| | 3.625%, 3/01/32 | | | |
| | Virginia Housing Development Authority, Rental Housing Bonds, Series 2015A: | | | |
| 1,000 | | 3.500%, 3/01/35 | 3/24 at 100.00 | AA+ | 1,057,960 |
| 1,000 | | 3.625%, 3/01/39 | 3/24 at 100.00 | AA+ | 1,044,170 |
| 900 | | Virginia Housing Development Authority, Rental Housing Bonds, Series 2015C, | 8/24 at 100.00 | AA+ | 957,483 |
| | 4.000%, 8/01/45 | | | |
| 2,750 | | Virginia Housing Development Authority, Rental Housing Bonds, Series 2015E, | 12/24 at 100.00 | AA+ | 2,938,732 |
| | 3.750%, 12/01/40 | | | |
| 1,500 | | Virginia Housing Development Authority, Rental Housing Bonds, Series 2016B, | 5/25 at 100.00 | AA+ | 1,593,465 |
| | 3.350%, 5/01/36 | | | |
| 1,700 | | Virginia Housing Development Authority, Rental Housing Bonds, Series 2017A, | 3/26 at 100.00 | AA+ | 1,834,368 |
| | 3.875%, 3/01/47 | | | |
| 3,000 | | Virginia Housing Development Authority, Rental Housing Bonds, Series 2019A, | 3/28 at 100.00 | AA+ | 3,304,230 |
| | 3.800%, 9/01/44 | | | |
| 1,310 | | Waynesboro Redevelopment and Housing Authority, Virginia, Multifamily Housing Revenue | 6/20 at 100.00 | AA+ | 1,313,773 |
| | Bonds, Epworth Manor, GNMA Collateralized Series 2010, 5.000%, 10/20/51 | | | |
| 15,160 | | Total Housing/Multifamily | | | 16,058,991 |
| | Long-Term Care – 6.6% (4.3% of Total Investments) | | | |
| 900 | | Alexandria Industrial Development Authority, Virginia, Residential Care Facilities | 10/25 at 100.00 | BBB+ | 908,316 |
| | Mortgage Revenue Bonds, Goodwin House Incorporated, Series 2015, 5.000%, 10/01/50 | | | |
| | Fairfax County Economic Development Authority, Virginia, Residential Care Facilities | | | |
| | Mortgage Revenue Bonds, Goodwin House, Inc, Series 2016A: | | | |
| 1,965 | | 5.000%, 10/01/42 | 10/24 at 102.00 | BBB+ | 2,000,056 |
| 700 | | 4.000%, 10/01/42 | 10/24 at 102.00 | BBB+ | 621,985 |
| 1,000 | | Fairfax County Economic Development Authority, Virginia, Residential Care Facilities | 12/23 at 100.00 | BBB+ | 982,400 |
| | Revenue Bonds, Vinson Hall LLC, Series 2013A, 5.000%, 12/01/47 | | | |
| 875 | | Henrico County Economic Development Authority, Virginia, Residential Care Facility | 10/20 at 100.00 | N/R | 871,981 |
| | Revenue Bonds, Westminster Canterbury of Richmond, Refunding Series 2015, 4.000%, 10/01/35 | | | |
| 1,000 | | Lexington Industrial Development Authority, Virginia, Residential Care Facility Revenue | 1/25 at 102.00 | BBB– | 846,890 |
| | Bonds, Kendal at Lexington Retirement Community Inc, Refunding Series 2016, 4.000%, 1/01/37 | | | |
| 1,250 | | Lexington Industrial Development Authority, Virginia, Residential Care Facility Revenue | 1/23 at 103.00 | BBB– | 1,183,788 |
| | Bonds, Kendal at Lexington Retirement Community Inc, Refunding Series 2017A, 5.000%, 1/01/48 | | | |
| | Norfolk Redevelopment and Housing Authority, Virginia, Fort Norfolk Retirement | | | |
| | Community, Inc, Harbor’s Edge Project, Series 2019A: | | | |
| 1,325 | | 5.000%, 1/01/49 | 1/24 at 104.00 | N/R | 1,261,148 |
| 2,000 | | 5.250%, 1/01/54 | 1/24 at 104.00 | N/R | 1,975,020 |
| | Prince William County Industrial Development Authority, Virginia, Residential Care | | | |
| | Facility Revenue Bonds, Westminster at Lake Ridge, Refunding Series 2016: | | | |
| 670 | | 5.000%, 1/01/37 | 1/25 at 102.00 | BBB | 677,457 |
| 2,000 | | 5.000%, 1/01/46 | 1/25 at 102.00 | BBB | 1,977,140 |
77
| | |
| NPV | Nuveen Virginia Quality Municipal Income Fund Portfolio of Investments (continued) May 31, 2020 |
| | | | | | |
| Principal | | | Optional Call | | |
| Amount (000) | | Description (1) | Provisions (2) | Ratings (3) | Value |
| | Long-Term Care (continued) | | | |
| $ 1,000 | | Roanoke Economic Development Authority, Virginia, Residential Care Facility Mortgage | 12/22 at 100.00 | N/R | $ 945,070 |
| | Revenue Refunding Bonds, Virginia Lutheran Homes Brandon Oaks Project, Series 2012, | | | |
| | 4.625%, 12/01/27 | | | |
| | Suffolk Economic Development Authority, Virginia, Retirement Facilities First Mortgage | | | |
| | Revenue Bonds, Lake Prince Center, Inc/United Church Homes and Services Obligated Group, | | | |
| | Refunding Series 2016: | | | |
| 1,000 | | 5.000%, 9/01/26 | 9/24 at 102.00 | N/R | 1,005,250 |
| 1,920 | | 5.000%, 9/01/31 | 9/24 at 102.00 | N/R | 1,895,482 |
| 17,605 | | Total Long-Term Care | | | 17,151,983 |
| | Tax Obligation/General – 1.4% (0.9% of Total Investments) | | | |
| 2,035 | | Arlington County, Virginia, General Obligation Bonds, Refunding Series 2014B, | No Opt. Call | AAA | 2,252,175 |
| | 5.000%, 8/15/22 | | | |
| 830 | | Bristol, Virginia, General Obligation Bonds, Refunding & Improvement Series 2010, | 7/20 at 100.00 | Aa1 | 834,773 |
| | 5.000%, 7/15/25 | | | |
| 380 | | Richmond, Virginia, General Obligation Bonds, Refunding & Public Improvement Series | No Opt. Call | AA+ | 551,410 |
| | 2017D, 5.000%, 3/01/33 | | | |
| 3,245 | | Total Tax Obligation/General | | | 3,638,358 |
| | Tax Obligation/Limited – 32.9% (21.2% of Total Investments) | | | |
| | Arlington County Industrial Development Authority, Virginia, Revenue Bonds, Refunding | | | |
| | County Projects, Series 2017: | | | |
| 1,730 | | 5.000%, 2/15/35 | 8/27 at 100.00 | Aa1 | 2,171,755 |
| 1,340 | | 5.000%, 2/15/37 | 8/27 at 100.00 | Aa1 | 1,665,258 |
| | Buena Vista Public Recreational Facilities Authority, Virginia, Lease Revenue Bonds, | | | |
| | Golf Course Project, Series 2005A: | | | |
| 365 | | 5.250%, 7/15/25 – ACA Insured | 6/20 at 100.00 | N/R | 336,431 |
| 520 | | 5.500%, 7/15/35 – ACA Insured | 6/20 at 100.00 | N/R | 416,624 |
| 1,150 | | Dulles Town Center Community Development Authority, Loudon County, Virginia Special | 3/22 at 100.00 | N/R | 1,126,391 |
| | Assessment Refunding Bonds, Dulles Town Center Project, Series 2012, 4.250%, 3/01/26 | | | |
| 100 | | Embrey Mill Community Development Authority, Virginia, Special Assessment Revenue Bonds, | 3/25 at 100.00 | N/R | 93,044 |
| | Series 2015, 5.600%, 3/01/45, 144A | | | |
| 1,000 | | Fairfax County Economic Development Authority, Virginia, County Facilities Revenue | 10/27 at 100.00 | AA+ | 1,268,750 |
| | Bonds, Refunding Series 2017B, 5.000%, 10/01/33 | | | |
| 1,500 | | Fairfax County Economic Development Authority, Virginia, Revenue Bonds, Metrorail | 4/27 at 100.00 | AA+ | 1,815,045 |
| | Parking System Project, Series 2017, 5.000%, 4/01/42 | | | |
| 4,000 | | Government of Guam, Business Privilege Tax Bonds, Refunding Series 2015D, | 11/25 at 100.00 | BB | 4,207,840 |
| | 5.000%, 11/15/34 | | | |
| | Government of Guam, Business Privilege Tax Bonds, Series 2011A: | | | |
| 1,020 | | 5.000%, 1/01/31 | 1/22 at 100.00 | BB | 1,039,196 |
| 500 | | 5.250%, 1/01/36 | 1/22 at 100.00 | BB | 509,840 |
| 1,000 | | Guam Government, Limited Obligation Section 30 Revenue Bonds, Series 2016A, | 12/26 at 100.00 | BB | 1,060,580 |
| | 5.000%, 12/01/34 | | | |
| | Hampton Roads Transportation Accountability Commission, Virginia, Hampton Roads | | | |
| | Transportation Fund Revenue Bonds, Senior Lien Series 2018A: | | | |
| 4,000 | | 5.000%, 7/01/48 (UB) (4) | 1/28 at 100.00 | AA+ | 4,927,400 |
| 2,000 | | 5.000%, 7/01/52 | 1/28 at 100.00 | AA+ | 2,455,340 |
| 13,000 | | 5.000%, 7/01/52 (UB) (4) | 1/28 at 100.00 | AA+ | 15,959,710 |
| 1,000 | | 5.500%, 7/01/57 | 1/28 at 100.00 | AA+ | 1,260,630 |
| 965 | | Lower Magnolia Green Community Development Authority, Virginia, Special Assessment | 3/25 at 100.00 | N/R | 916,605 |
| | Bonds, Series 2015, 5.000%, 3/01/35, 144A | | | |
| | Peninsula Town Center Community Development Authority, Virginia, Special Obligation | | | |
| | Bonds, Refunding Series 2018: | | | |
| 360 | | 4.500%, 9/01/28, 144A | 9/27 at 100.00 | N/R | 355,100 |
| 3,000 | | 5.000%, 9/01/45, 144A | 9/27 at 100.00 | N/R | 2,990,820 |
78
| | | | | | |
| Principal | | | Optional Call | | |
| Amount (000) | | Description (1) | Provisions (2) | Ratings (3) | Value |
| | Tax Obligation/Limited (continued) | | | |
| $ 645 | | Puerto Rico Highway and Transportation Authority, Highway Revenue Bonds, Series 2007N, | No Opt. Call | C | $ 709,990 |
| | 5.500%, 7/01/29 – AMBAC Insured | | | |
| 5,875 | | Puerto Rico Infrastructure Financing Authority, Special Tax Revenue Bonds, Refunding | No Opt. Call | C | 4,042,823 |
| | Series 2005C, 0.000%, 7/01/28 – AMBAC Insured | | | |
| 5,085 | | Puerto Rico Infrastructure Financing Authority, Special Tax Revenue Bonds, Series 2005A, | No Opt. Call | C | 3,320,556 |
| | 0.000%, 7/01/29 – AMBAC Insured | | | |
| | Puerto Rico Sales Tax Financing Corporation, Sales Tax Revenue Bonds, Restructured | | | |
| | 2018A-1: | | | |
| 57 | | 0.000%, 7/01/24 | No Opt. Call | N/R | 50,200 |
| 96 | | 0.000%, 7/01/27 | No Opt. Call | N/R | 75,826 |
| 94 | | 0.000%, 7/01/29 | 7/28 at 98.64 | N/R | 68,111 |
| 121 | | 0.000%, 7/01/31 | 7/28 at 91.88 | N/R | 79,646 |
| 136 | | 0.000%, 7/01/33 | 7/28 at 86.06 | N/R | 81,660 |
| 1,173 | | 4.500%, 7/01/34 | 7/25 at 100.00 | N/R | 1,186,478 |
| 3,609 | | 0.000%, 7/01/51 | 7/28 at 30.01 | N/R | 684,627 |
| 6,310 | | 5.000%, 7/01/58 | 7/28 at 100.00 | N/R | 6,330,571 |
| | Puerto Rico Sales Tax Financing Corporation, Sales Tax Revenue Bonds, Taxable | | | |
| | Restructured COFINA Project Series 2019A-2: | | | |
| 50 | | 4.329%, 7/01/40 | 7/28 at 100.00 | N/R | 48,125 |
| 4 | | 4.536%, 7/01/53 | 7/28 at 100.00 | N/R | 3,763 |
| 62 | | 4.784%, 7/01/58 | 7/28 at 100.00 | N/R | 60,241 |
| 760 | | Puerto Rico, Highway Revenue Bonds, Highway and Transportation Authority, Refunding | No Opt. Call | Baa2 | 777,708 |
| | Series 2007CC, 5.500%, 7/01/28 – NPFG Insured | | | |
| 1,500 | | Virgin Islands Public Finance Authority, Federal Highway Grant Anticipation Loan Note | 9/25 at 100.00 | A | 1,672,290 |
| | Revenue Bonds, Series 2015, 5.000%, 9/01/33, 144A | | | |
| 2,240 | | Virgin Islands Public Finance Authority, Gross Receipts Taxes Loan Note, Working Capital | 10/24 at 100.00 | AA | 2,522,957 |
| | Series 2014A, 5.000%, 10/01/34 – AGM Insured, 144A | | | |
| 1,380 | | Virgin Islands Public Finance Authority, Matching Fund Loan Notes Revenue Bonds, Senior | No Opt. Call | AA | 1,507,705 |
| | Lien, Refunding Series 2013B, 5.000%, 10/01/24 – AGM Insured | | | |
| 1,665 | | Virgin Islands Public Finance Authority, Matching Fund Loan Notes Revenue Bonds, Senior | No Opt. Call | AA | 1,819,079 |
| | Lien, Series 2013A, 5.000%, 10/01/24 – AGM Insured | | | |
| 1,725 | | Virgin Islands Public Finance Authority, Matching Fund Loan Notes Revenue Bonds, Series | 10/22 at 100.00 | AA | 1,870,124 |
| | 2012A, 5.000%, 10/01/32 – AGM Insured | | | |
| 3,500 | | Virginia Commonwealth Transportation Board, Federal Transportation Grant Anticipation | 9/26 at 100.00 | AA+ | 4,396,420 |
| | Revenue Notes, Series 2016, 5.000%, 9/15/30 | | | |
| 2,000 | | Virginia Public Building Authority, Public Facilities Revenue Bonds, Series 2019B, | 8/29 at 100.00 | AA+ | 2,397,720 |
| | 4.000%, 8/01/38 (AMT) | | | |
| 2,000 | | Virginia Public School Authority, School Financing Bonds, 1997 Resolution, Series 2015A, | 8/25 at 100.00 | AA+ | 2,456,760 |
| | 5.000%, 8/01/26 | | | |
| 35 | | Virginia Resources Authority, Infrastructure Revenue Bonds, Pooled Financing Program, | 11/22 at 100.00 | AAA | 37,973 |
| | Series 2012A, 5.000%, 11/01/42 | | | |
| 120 | | Virginia Small Business Finance Authority, Tourism Development Financing Program Revenue | 4/28 at 112.76 | N/R | 122,480 |
| | Bonds, Downtown Norfolk and Virginia Beach Oceanfront Hotel Projects, Series 2018A, 8.375%, | | | |
| | 4/01/41, 144A | | | |
| 1,000 | | Virginia Transportation Board, Transportation Revenue Bonds, Capital Projects, Series | 5/22 at 100.00 | AA+ | 1,054,050 |
| | 2012, 4.000%, 5/15/37 | | | |
| 1,000 | | Virginia Transportation Board, Transportation Revenue Bonds, Capital Projects, Series | 5/27 at 100.00 | AA+ | 1,140,340 |
| | 2017, 4.000%, 5/15/42 | | | |
| 1,000 | | Virginia Transportation Board, Transportation Revenue Bonds, Capital Projects, Series | 5/28 at 100.00 | AA+ | 1,170,070 |
| | 2018, 4.000%, 5/15/38 | | | |
| 920 | | Western Virginia Regional Jail Authority, Virginia, Facility Revenue Bonds, Refunding | 12/26 at 100.00 | Aa2 | 1,142,493 |
| | Series 2016, 5.000%, 12/01/36 | | | |
| 82,712 | | Total Tax Obligation/Limited | | | 85,407,145 |
79
| | |
| NPV | Nuveen Virginia Quality Municipal Income Fund Portfolio of Investments (continued) May 31, 2020 |
| | | | | | |
| Principal | | | Optional Call | | |
| Amount (000) | | Description (1) | Provisions (2) | Ratings (3) | Value |
| | Transportation – 44.9% (29.0% of Total Investments) | | | |
| | Capital Region Airport Commission, Virginia, Airport Revenue Bonds, Refunding Series 2016A: | | | |
| $ 775 | | 5.000%, 7/01/32 | 7/26 at 100.00 | A2 | $ 907,494 |
| 375 | | 4.000%, 7/01/34 | 7/26 at 100.00 | A2 | 411,473 |
| 400 | | 4.000%, 7/01/35 | 7/26 at 100.00 | A2 | 437,640 |
| 250 | | 4.000%, 7/01/38 | 7/26 at 100.00 | A2 | 271,188 |
| | Chesapeake Bay Bridge and Tunnel District, Virginia, General Resolution Revenue Bonds, | | | |
| | First Tier Series 2016: | | | |
| 1,705 | | 5.000%, 7/01/41 – AGM Insured | 7/26 at 100.00 | AA | 2,019,453 |
| 8,320 | | 5.000%, 7/01/46 | 7/26 at 100.00 | BBB | 8,937,594 |
| | Chesapeake, Virginia, Transportation System Senior Toll Road Revenue Bonds, Capital | | | |
| | Appreciation Series 2012B: | | | |
| 2,000 | | 0.000%, 7/15/32 (5) | 7/28 at 100.00 | BBB+ | 1,857,480 |
| 4,125 | | 0.000%, 7/15/40 (5) | 7/28 at 100.00 | BBB+ | 3,779,201 |
| 1,000 | | 0.000%, 7/15/40 (5) – AGM Insured | 7/28 at 100.00 | AA | 1,082,010 |
| 4,500 | | Metropolitan Washington Airports Authority, Virginia, Dulles Toll Road Revenue Bonds, | 10/29 at 100.00 | A– | 4,599,855 |
| | Dulles Metrorail & Capital improvement Projects, Refunding & Subordinate Lien Series 2019B, | | | |
| | 4.000%, 10/01/44 | | | |
| 3,800 | | Metropolitan Washington Airports Authority, Virginia, Dulles Toll Road Revenue Bonds, | 4/22 at 100.00 | A– | 3,902,068 |
| | Dulles Metrorail & Capital Improvement Projects, Refunding Second Senior Lien Series 2014A, | | | |
| | 5.000%, 10/01/53 | | | |
| | Metropolitan Washington Airports Authority, Virginia, Dulles Toll Road Revenue Bonds, | | | |
| | Dulles Metrorail & Capital improvement Projects, Second Senior Lien Series 2009B: | | | |
| 4,000 | | 0.000%, 10/01/26 – AGC Insured | No Opt. Call | AA | 3,525,280 |
| 11,825 | | 0.000%, 10/01/34 – AGC Insured | No Opt. Call | AA | 7,812,186 |
| 1,135 | | 0.000%, 10/01/36 – AGC Insured | No Opt. Call | AA | 687,662 |
| 5,010 | | 0.000%, 10/01/39 – AGC Insured | No Opt. Call | AA | 2,674,789 |
| 6,700 | | Metropolitan Washington Airports Authority, Virginia, Dulles Toll Road Revenue Bonds, | 10/28 at 100.00 | A– | 8,266,594 |
| | Dulles Metrorail Capital Appreciation, Second Senior Lien Series 2010B, 6.500%, 10/01/44 | | | |
| 750 | | Metropolitan Washington DC Airports Authority, Airport System Revenue Bonds, Refunding | 10/20 at 100.00 | AA– | 761,303 |
| | Series 2010B, 5.000%, 10/01/26 (AMT) | | | |
| | Metropolitan Washington DC Airports Authority, Airport System Revenue Bonds, Series | | | |
| | 2010A: | | | |
| 3,400 | | 5.000%, 10/01/30 | 10/20 at 100.00 | AA– | 3,454,128 |
| 420 | | 5.000%, 10/01/35 | 10/20 at 100.00 | AA– | 426,686 |
| 7,300 | | Metropolitan Washington DC Airports Authority, Airport System Revenue Bonds, Refunding | 10/26 at 100.00 | AA– | 8,419,382 |
| | Series 2016A, 5.000%, 10/01/35 (AMT) | | | |
| 375 | | Metropolitan Washington DC Airports Authority, Airport System Revenue Bonds, Refunding | 10/27 at 100.00 | AA– | 442,553 |
| | Series 2017, 5.000%, 10/01/34 (AMT) | | | |
| | Metropolitan Washington DC Airports Authority, Airport System Revenue Bonds, Refunding | | | |
| | Series 2018A: | | | |
| 2,000 | | 5.000%, 10/01/32 (AMT) | 10/28 at 100.00 | AA– | 2,427,180 |
| 3,290 | | 5.000%, 10/01/36 (AMT) | 10/28 at 100.00 | AA– | 3,923,489 |
| 2,000 | | 5.000%, 10/01/38 (AMT) | 10/28 at 100.00 | AA– | 2,370,740 |
| 4,000 | | Metropolitan Washington DC Airports Authority, Airport System Revenue Bonds, Refunding | 10/29 at 100.00 | AA– | 4,820,520 |
| | Series 2019A, 5.000%, 10/01/38 (AMT) | | | |
| | New York Transportation Development Corporation, New York, Special Facility Revenue | | | |
| | Bonds, American Airlines, Inc John F Kennedy International Airport Project, Refunding | | | |
| | Series 2016: | | | |
| 150 | | 5.000%, 8/01/26 (AMT) | 8/21 at 100.00 | BB– | 144,828 |
| 595 | | 5.000%, 8/01/31 (AMT) | 8/21 at 100.00 | BB– | 573,747 |
| 1,740 | | Norfolk Airport Authority, Virginia, Airport Revenue Bonds, Series 2019, 5.000%, 7/01/43 | 7/29 at 100.00 | A | 2,007,055 |
| 1,890 | | Richmond Metropolitan Authority, Virginia, Revenue Refunding Bonds, Expressway System, | No Opt. Call | A | 1,982,251 |
| | Series 2002, 5.250%, 7/15/22 – FGIC Insured | | | |
80
| | | | | | |
| Principal | | | Optional Call | | |
| Amount (000) | | Description (1) | Provisions (2) | Ratings (3) | Value |
| | Transportation (continued) | | | |
| | Virginia Small Business Financing Authority, Private Activity Revenue Bonds, Transform | | | |
| | 66 P3 Project, Senior Lien Series 2017: | | | |
| $ 3,250 | | 5.000%, 12/31/49 (AMT) | 6/27 at 100.00 | BBB | $ 3,411,720 |
| 5,785 | | 5.000%, 12/31/52 (AMT) | 6/27 at 100.00 | BBB | 6,054,812 |
| 1,500 | | Virginia Small Business Financing Authority, Senior Lien Revenue Bonds, 95 Express Lanes | 1/22 at 100.00 | BBB | 1,529,850 |
| | LLC Project, Series 2012, 5.000%, 1/01/40 (AMT) | | | |
| | Virginia Small Business Financing Authority, Senior Lien Revenue Bonds, 95 Express Lanes | | | |
| | LLC Project, Series 2019: | | | |
| 250 | | 5.000%, 1/01/44 (AMT) | 1/22 at 100.00 | BBB | 254,783 |
| 3,285 | | 5.000%, 7/01/49 (AMT) | 1/22 at 100.00 | BBB | 3,345,148 |
| | Virginia Small Business Financing Authority, Senior Lien Revenue Bonds, Elizabeth River | | | |
| | Crossing, Opco LLC Project, Series 2012: | | | |
| 750 | | 5.250%, 1/01/32 (AMT) | 7/22 at 100.00 | BBB | 777,135 |
| 5,025 | | 6.000%, 1/01/37 (AMT) | 7/22 at 100.00 | BBB | 5,253,487 |
| 5,700 | | 5.500%, 1/01/42 (AMT) | 7/22 at 100.00 | BBB | 5,875,503 |
| | Washington Metropolitan Area Transit Authority, District of Columbia, Gross Revenue | | | |
| | Bonds, Series 2017B: | | | |
| 3,000 | | 5.000%, 7/01/36 | 7/27 at 100.00 | AA | 3,560,790 |
| 2,000 | | 5.000%, 7/01/42 | 7/27 at 100.00 | AA | 2,341,860 |
| 1,000 | | Washington Metropolitan Area Transit Authority, District of Columbia, Gross Revenue | 7/27 at 100.00 | AA– | 1,168,950 |
| | Bonds, Series 2018, 5.000%, 7/01/43 | | | |
| 115,375 | | Total Transportation | | | 116,499,867 |
| | U.S. Guaranteed – 13.3% (8.6% of Total Investments) (6) | | | |
| 610 | | Bristol, Virginia, General Obligation Bonds, Refunding & Improvement Series 2010, | 7/20 at 100.00 | N/R | 613,471 |
| | 5.000%, 7/15/25 (Pre-refunded 7/15/20) | | | |
| 1,490 | | Bristol, Virginia, General Obligation Utility System Revenue Bonds, Series 2002, 5.000%, | No Opt. Call | AA | 1,638,210 |
| | 11/01/24 – AGM Insured (ETM) | | | |
| 430 | | Bristol, Virginia, Utility System Revenue Refunding Bonds, Series 2001, 5.000%, 7/15/21 | No Opt. Call | AA | 442,027 |
| | – AGM Insured (ETM) | | | |
| 1,030 | | Chesapeake Bay Bridge and Tunnel Commission, Virginia, General Resolution Revenue Bonds, | No Opt. Call | Baa2 | 1,221,508 |
| | Refunding Series 1998, 5.500%, 7/01/25 – NPFG Insured (ETM) | | | |
| 2,145 | | Chesterfield County Economic Development Authority, Virginia, Revenue Bonds, Bon Secours | 11/20 at 100.00 | A3 | 2,185,927 |
| | Health, Series 2010C-2, 5.000%, 11/01/42 (Pre-refunded 11/01/20) – AGC Insured | | | |
| 3,375 | | Colorado Health Facilities Authority, Colorado, Revenue Bonds, Catholic Health | 1/23 at 100.00 | BBB+ | 3,783,645 |
| | Initiatives, Series 2013A, 5.250%, 1/01/40 (Pre-refunded 1/01/23) | | | |
| | Hampton Roads Sanitation District, Virginia, Wastewater Revenue Bonds, Series 2012A: | | | |
| 1,295 | | 5.000%, 1/01/39 (Pre-refunded 1/01/21) | 1/21 at 100.00 | N/R | 1,329,887 |
| 5,205 | | 5.000%, 1/01/39 (Pre-refunded 1/01/21) | 1/21 at 100.00 | AA+ | 5,345,223 |
| | Hampton Roads Sanitation District, Virginia, Wastewater Revenue Bonds, Subordinate | | | |
| | Series 2018A: | | | |
| 1,415 | | 5.000%, 10/01/40 (Pre-refunded 10/01/27) | 10/27 at 100.00 | AA+ | 1,873,941 |
| 1,010 | | 5.000%, 10/01/42 (Pre-refunded 10/01/27) | 10/27 at 100.00 | AA+ | 1,337,583 |
| 1,000 | | 5.000%, 10/01/43 (Pre-refunded 10/01/27) | 10/27 at 100.00 | AA+ | 1,324,340 |
| 410 | | Henrico County Industrial Development Authority, Virginia, Healthcare Revenue Bonds, Bon | No Opt. Call | Baa2 | 414,941 |
| | Secours Health System, Series 1996, 6.250%, 8/15/20 – NPFG Insured (ETM) | | | |
| 1,630 | | Norfolk, Virginia, General Obligation Bonds, Refunding Series 2017C, 5.000%, 9/01/30 | 3/27 at 100.00 | AAA | 2,123,597 |
| | (Pre-refunded 3/01/27) | | | |
| | Portsmouth, Virginia, General Obligation Bonds, Refunding Series 2010D: | | | |
| 150 | | 5.000%, 7/15/34 (Pre-refunded 7/15/20) | 7/20 at 100.00 | AA | 150,872 |
| 1,630 | | Prince William County Industrial Development Authority, Virginia, Student Housing | 9/21 at 100.00 | N/R | 1,728,892 |
| | Revenue Bonds, George Mason University Foundation Prince William Housing LLC Project, Series | | | |
| | 2011A, 5.125%, 9/01/41 (Pre-refunded 9/01/21) | | | |
81
| | |
| NPV | Nuveen Virginia Quality Municipal Income Fund Portfolio of Investments (continued) May 31, 2020 |
| | | | | | |
| Principal | | | Optional Call | | |
| Amount (000) | | Description (1) | Provisions (2) | Ratings (3) | Value |
| | U.S. Guaranteed (6) (continued) | | | |
| $ 710 | | Puerto Rico, Highway Revenue Bonds, Highway and Transportation Authority, Series 2005BB, | No Opt. Call | A2 | $ 782,527 |
| | 5.250%, 7/01/22 – AGM Insured (ETM) | | | |
| 1,200 | | Virginia College Building Authority, Educational Facilities Revenue Bonds, 21st Century | 2/21 at 100.00 | AA+ | 1,230,648 |
| | College Program, Series 2011A, 4.000%, 2/01/29 (Pre-refunded 2/01/21) | | | |
| 5,225 | | Virginia Resources Authority, Infrastructure Revenue Bonds, Pooled Financing Program, | 11/22 at 100.00 | N/R | 5,825,927 |
| | Series 2012A, 5.000%, 11/01/42 (Pre-refunded 11/01/22) | | | |
| 915 | | Western Virginia Regional Jail Authority, Virginia, Facility Revenue Bonds, Refunding | 12/26 at 100.00 | N/R | 1,178,575 |
| | Series 2016, 5.000%, 12/01/36 (Pre-refunded 12/01/26) | | | |
| 30,875 | | Total U.S. Guaranteed | | | 34,531,741 |
| | Utilities – 5.1% (3.3% of Total Investments) | | | |
| 2,000 | | Beaver County Industrial Development Authority, Pennsylvania, Pollution Control Revenue | No Opt. Call | N/R | 2,000,000 |
| | Bonds, FirstEnergy Generation Project, Refunding Series 2006A, 4.375%, 1/01/35 (Mandatory Put | | | |
| | 7/01/22) (7) | | | |
| | Guam Power Authority, Revenue Bonds, Series 2012A: | | | |
| 1,500 | | 5.000%, 10/01/30 – AGM Insured | 10/22 at 100.00 | AA | 1,607,310 |
| 495 | | 5.000%, 10/01/34 | 10/22 at 100.00 | BBB | 509,400 |
| | Richmond, Virginia, Public Utility Revenue Bonds, Refunding Series 2016A: | | | |
| 5,000 | | 5.000%, 1/15/33 | 1/26 at 100.00 | Aa1 | 6,176,100 |
| 1,000 | | 5.000%, 1/15/35 | 1/26 at 100.00 | Aa1 | 1,233,360 |
| 730 | | Virgin Islands Water and Power Authority, Electric System Revenue Bonds, Refunding | 6/20 at 100.00 | CCC | 679,681 |
| | Series 2007A, 5.000%, 7/01/24 | | | |
| 1,000 | | Virginia Small Business Financing Authority, Solid Waste Disposal Revenue Bonds, Covanta | 7/23 at 100.00 | B– | 1,011,330 |
| | Project, Series 2018, 5.000%, 1/01/48 (AMT) (Mandatory Put 7/01/38), 144A | | | |
| 11,725 | | Total Utilities | | | 13,217,181 |
| | Water and Sewer – 3.4% (2.2% of Total Investments) | | | |
| 810 | | Guam Government Waterworks Authority, Water and Wastewater System Revenue Bonds, Series | 7/23 at 100.00 | A– | 853,222 |
| | 2013, 5.500%, 7/01/43 | | | |
| 1,675 | | Guam Government Waterworks Authority, Water and Wastewater System Revenue Bonds, Series | 7/26 at 100.00 | A– | 1,791,228 |
| | 2016, 5.000%, 1/01/46 | | | |
| 3,000 | | Norfolk, Virginia, Water Revenue Bonds, Series 2015A, 5.250%, 11/01/44 | 11/24 at 100.00 | AA+ | 3,585,450 |
| 1,000 | | Norfolk, Virginia, Water Revenue Bonds, Series 2017, 5.000%, 11/01/42 | 11/27 at 100.00 | AA+ | 1,241,300 |
| 625 | | Puerto Rico Aqueduct and Sewerage Authority, Revenue Bonds, Senior Lien Series 2012A, | 7/22 at 100.00 | CC | 618,750 |
| | 5.250%, 7/01/42 | | | |
| 1,000 | | Virginia Resources Authority, Water and Sewerage System Revenue Bonds, Goochland County | 11/22 at 63.13 | AA | 607,940 |
| | - Tuckahoe Creek Service District Project, Series 2012, 0.000%, 11/01/34 | | | |
| 8,110 | | Total Water and Sewer | | | 8,697,890 |
| $ 383,237 | | Total Long-Term Investments (cost $376,731,584) | | | 401,925,794 |
| | Floating Rate Obligations – (7.9)% | | | (20,350,000) |
| | Variable Rate Demand Preferred Shares, net of deferred offering costs – (49.2)% (8) | | | (127,648,200) |
| | Other Assets Less Liabilities – 2.1% | | | 5,410,731 |
| | Net Asset Applicable to Common Shares – 100% | | | $ 259,338,325 |
82
| | |
(1) | All percentages shown in the Portfolio of Investments are based on net assets applicable to common shares unless otherwise noted. |
(2) | Optional Call Provisions: Dates (month and year) and prices of the earliest optional call or redemption. There may be other call provisions at varying prices at later dates. Certain mortgage-backed securities may be subject to periodic principal paydowns. Optional Call Provisions are not covered by the report of independent registered public accounting firm. |
(3) | For financial reporting purposes, the ratings disclosed are the highest of Standard & Poor’s Group (“Standard & Poor’s”), Moody’s Investors Service, Inc. (“Moody’s”) or Fitch, Inc. (“Fitch”) rating. This treatment of split-rated securities may differ from that used for other purposes, such as for Fund investment policies. Ratings below BBB by Standard Poor’s, Baa by Moody’s or BBB by Fitch are considered to be below investment grade. Holdings designated N/R are not rated by any of these national rating agencies. Ratings are not covered by the report of independent registered public accounting firm. |
(4) | Investment, or portion of investment, has been pledged to collateralize the net payment obligations for investments in inverse floating rate transactions. |
(5) | Step-up coupon bond, a bond with a coupon that increases (“steps up”), usually at regular intervals, while the bond is outstanding. The rate shown is the coupon as of the end of the reporting period. |
(6) | Backed by an escrow or trust containing sufficient U.S. Government or U.S. Government agency securities, which ensure the timely payment of principal and interest. |
(7) | Defaulted security. A security whose issuer has failed to fully pay principal and/or interest when due, or is under the protection of bankruptcy. |
(8) | Variable Rate Demand Preferred Shares, net of deferred offering costs as a percentage of Total Investments is 31.8%. |
144A | Investment is exempt from registration under Rule 144A of the Securities Act of 1933, as amended. These investments may only be resold in transactions exempt from registration, which are normally those transactions with qualified institutional buyers. |
AMT | Alternative Minimum Tax |
ETM | Escrowed to maturity |
UB | Underlying bond of an inverse floating rate trust reflected as a financing transaction. See Notes to Financial Statements, Note 4 – Portfolio Securities and Investments in Derivatives for more information. |
| See accompanying notes to financial statements. |
83
Statement of Assets and Liabilities
May 31, 2020
| | | | | | | | | | |
| | NKG | | | NMY | | | NMT | |
| Assets | | | | | | | | | |
| Long-term investments, at value (cost $207,021,553, $505,401,414 and $193,787,873, respectively) | | $ | 219,475,020 | | | $ | 526,951,937 | | | $ | 205,986,380 | |
| Short-term investments, at value (cost $142,192, $ — and $ —, respectively) | | | 147,195 | | | | — | | | | — | |
Cash | | | 563,546 | | | | 2,399,036 | | | | 1,965,963 | |
Receivable for: | | | | | | | | | | | | |
| Interest | | | 2,890,906 | | | | 8,245,260 | | | | 2,924,911 | |
| Investments sold | | | 715,000 | | | | 8,309,174 | | | | — | |
Other assets | | | 3,824 | | | | 34,392 | | | | 9,060 | |
| Total assets | | | 223,795,491 | | | | 545,939,799 | | | | 210,886,314 | |
| Liabilities | | | | | | | | | | | | |
Cash overdraft | | | — | | | | — | | | | — | |
Floating rate obligations | | | 19,600,000 | | | | 28,405,000 | | | | — | |
Payable for: | | | | | | | | | | | | |
| Dividends | | | 404,947 | | | | 1,055,750 | | | | 403,314 | |
| Interest | | | 68,215 | | | | 110,287 | | | | — | |
| Investments purchased - regular settlement | | | — | | | | 2,168,872 | | | | — | |
| Investments purchased - when-issued/delayed-delivery settlement | | | — | | | | — | | | | — | |
Adjustable Rate MuniFund Term Preferred (“AMTP”) Shares, net of deferred offering costs | | | | | | | | | | | | |
| (liquidation preference $58,500,000, $182,000,000 and $ —, respectively) | | | 58,436,706 | | | | 181,896,908 | | | | — | |
MuniFund Preferred (“MFP”) Shares, net of deferred offering costs | | | | | | | | | | | | |
| (liquidation preference $ — $ — and $ —, respectively) | | | — | | | | — | | | | — | |
Variable Rate Demand Preferred (“VRDP”) Shares, net of deferred offering costs | | | | | | | | | | | | |
| (liquidation preference $ —, $ — and $74,000,000, respectively) | | | — | | | | — | | | | 73,739,043 | |
Accrued expenses: | | | | | | | | | | | | |
| Management fees | | | 112,915 | | | | 268,786 | | | | 110,025 | |
| Trustees fees | | | 1,941 | | | | 34,894 | | | | 2,016 | |
| Other | | | 57,044 | | | | 86,540 | | | | 60,296 | |
| Total liabilities | | | 78,681,768 | | | | 214,027,037 | | | | 74,314,694 | |
Net assets applicable to common shares | | $ | 145,113,723 | | | $ | 331,912,762 | | | $ | 136,571,620 | |
Common shares outstanding | | | 10,399,813 | | | | 23,099,664 | | | | 9,322,751 | |
Net asset value (“NAV”) per common share outstanding | | $ | 13.95 | | | $ | 14.37 | | | $ | 14.65 | |
| | |
| Net assets applicable to common shares consist of: | | | | | | | | | | | | |
Common shares, $0.01 par value per share | | $ | 103,998 | | | $ | 230,997 | | | $ | 93,228 | |
Paid-in surplus | | | 137,125,843 | | | | 324,924,292 | | | | 129,292,650 | |
Total distributable earnings | | | 7,883,882 | | | | 6,757,473 | | | | 7,185,742 | |
Net assets applicable to common shares | | $ | 145,113,723 | | | $ | 331,912,762 | | | $ | 136,571,620 | |
Authorized shares: | | | | | | | | | | | | |
| Common | | Unlimited | | | Unlimited | | | Unlimited | |
| Preferred | | Unlimited | | | Unlimited | | | Unlimited | |
See accompanying notes to financial statements.
84
| | | | | | | | | | |
| | NMS | | | NOM | | | NPV | |
| Assets | | | | | | | | | |
| Long-term investments, at value (cost $127,503,581, $47,434,249 and $376,731,584, respectively) | | $ | 133,222,440 | | | $ | 50,021,398 | | | $ | 401,925,794 | |
Short-term investments, at value (cost $2,615,000, $ — and $ —, respectively) | | | 2,615,000 | | | | — | | | | — | |
Cash | | | 489,324 | | | | 155,927 | | | | — | |
Receivable for: | | | | | | | | | | | | |
| Interest | | | 1,737,021 | | | | 520,134 | | | | 5,135,113 | |
| Investments sold | | | 1,109,583 | | | | 5,016 | | | | 4,103,751 | |
Other assets | | | 3,808 | | | | 6,717 | | | | 28,163 | |
| Total assets | | | 139,177,176 | | | | 50,709,192 | | | | 411,192,821 | |
| Liabilities | | | | | | | | | | | | |
Cash overdraft | | | — | | | | — | | | | 2,623,816 | |
Floating rate obligations | | | — | | | | 600,000 | | | | 20,350,000 | |
Payable for: | | | | | | | | | | | | |
| Dividends | | | 251,175 | | | | 81,182 | | | | 798,201 | |
| Interest | | | — | | | | 4,123 | | | | 119,042 | |
| Investments purchased - regular settlement | | | 32,467 | | | | 175,916 | | | | — | |
| Investments purchased - when-issued/delayed-delivery settlement | | | 366,872 | | | | — | | | | — | |
Adjustable Rate MuniFund Term Preferred (“AMTP”) Shares, net of deferred offering costs | | | | | | | | | | | | |
| (liquidation preference $52,800,000, $ —,and $ —, respectively) | | | 52,755,713 | | | | — | | | | — | |
MuniFund Preferred (“MFP”) Shares, net of deferred offering costs | | | | | | | | | | | | |
| (liquidation preference $ —, $18,000,000 and $ —, respectively) | | | — | | | | 17,779,188 | | | | — | |
Variable Rate Demand Preferred (“VRDP”) Shares, net of deferred offering costs | | | | | | | | | | | | |
| (liquidation preference $ —, $ — and $128,000,000, respectively) | | | — | | | | — | | | | 127,648,200 | |
Accrued expenses: | | | | | | | | | | | | |
| Management fees | | | 70,283 | | | | 25,870 | | | | 203,215 | |
| Trustees fees | | | 1,334 | | | | 481 | | | | 25,814 | |
| Other | | | 55,394 | | | | 46,222 | | | | 86,208 | |
| Total liabilities | | | 53,533,238 | | | | 18,712,982 | | | | 151,854,496 | |
Net assets applicable to common shares | | $ | 85,643,938 | | | $ | 31,996,210 | | | $ | 259,338,325 | |
Common shares outstanding | | | 5,782,386 | | | | 2,345,797 | | | | 17,878,247 | |
Net asset value (“NAV”) per common share outstanding | | $ | 14.81 | | | $ | 13.64 | | | $ | 14.51 | |
| Net assets applicable to common shares consist of: | | | | | | | | | | | | |
Common shares, $0.01 par value per share | | $ | 57,824 | | | $ | 23,458 | | | $ | 178,782 | |
Paid-in surplus | | | 80,893,613 | | | | 30,627,194 | | | | 250,140,598 | |
Total distributable earnings | | | 4,692,501 | | | | 1,345,558 | | | | 9,018,945 | |
Net assets applicable to common shares | | $ | 85,643,938 | | | $ | 31,996,210 | | | $ | 259,338,325 | |
Authorized shares: | | | | | | | | | | | | |
| Common | | Unlimited | | | Unlimited | | | Unlimited | |
| Preferred | | Unlimited | | | Unlimited | | | Unlimited | |
See accompanying notes to financial statements.
85
Year Ended May 31, 2020
| | | | | | | | | | |
| | NKG | | | NMY | | | NMT | |
| Investment Income | | $ | 8,066,896 | | | $ | 21,331,401 | | | $ | 7,852,691 | |
| Expenses | | | | | | | | | | | | |
Management fees | | | 1,357,649 | | | | 3,274,650 | | | | 1,322,651 | |
Interest expense and amortization of offering costs | | | 1,594,860 | | | | 4,492,096 | | | | 1,575,172 | |
Custodian fees | | | 31,084 | | | | 70,106 | | | | 35,836 | |
Trustees fees | | | 5,268 | | | | 13,620 | | | | 5,478 | |
Professional fees | | | 36,611 | | | | 47,478 | | | | 34,348 | |
Shareholder reporting expenses | | | 21,766 | | | | 40,563 | | | | 15,798 | |
Shareholder servicing agent fees | | | 15,367 | | | | 21,087 | | | | 789 | |
Stock exchange listing fees | | | 6,881 | | | | 6,881 | | | | 6,881 | |
Investor relations expenses | | | 11,862 | | | | 29,335 | | | | 12,169 | |
Other | | | 32,263 | | | | 64,317 | | | | 37,277 | |
Total expenses | | | 3,113,611 | | | | 8,060,133 | | | | 3,046,399 | |
Net investment income (loss) | | | 4,953,285 | | | | 13,271,268 | | | | 4,806,292 | |
| Realized and Unrealized Gain (Loss) | | | | | | | | | | | | |
Net realized gain (loss) from investments | | | (719,960 | ) | | | (2,449,067 | ) | | | 125,397 | |
Change in net unrealized appreciation (depreciation) of investments | | | 1,377,176 | | | | (8,668,995 | ) | | | (1,022,034 | ) |
Net realized and unrealized gain (loss) | | | 657,216 | | | | (11,118,062 | ) | | | (896,637 | ) |
Net increase (decrease) in net assets applicable to common shares | | | | | | | | | | | | |
| from operations | | $ | 5,610,501 | | | $ | 2,153,206 | | | $ | 3,909,655 | |
See accompanying notes to financial statements.
86
| | | | | | | | | | |
| | NMS | | | NOM | | | NPV | |
| Investment Income | | $ | 5,562,496 | | | $ | 2,029,265 | | | $ | 15,501,523 | |
| Expenses | | | | | | | | | | | | |
Management fees | | | 854,034 | | | | 310,630 | | | | 2,453,861 | |
Interest expense and amortization of offering costs | | | 1,165,179 | | | | 418,970 | | | | 3,117,053 | |
Custodian fees | | | 32,833 | | | | 19,997 | | | | 54,455 | |
Trustees fees | | | 3,638 | | | | 1,304 | | | | 10,145 | |
Professional fees | | | 39,327 | | | | 52,438 | | | | 49,193 | |
Shareholder reporting expenses | | | 17,361 | | | | 11,508 | | | | 34,845 | |
Shareholder servicing agent fees | | | 14,839 | | | | 14,868 | | | | 5,886 | |
Stock exchange listing fees | | | 6,881 | | | | 6,888 | | | | 6,881 | |
Investor relations expenses | | | 8,358 | | | | 3,460 | | | | 22,142 | |
Other | | | 28,030 | | | | 24,475 | | | | 72,870 | |
Total expenses | | | 2,170,480 | | | | 864,538 | | | | 5,827,331 | |
Net investment income (loss) | | | 3,392,016 | | | | 1,164,727 | | | | 9,674,192 | |
| Realized and Unrealized Gain (Loss) | | | | | | | | | | | | |
Net realized gain (loss) from investments | | | (354,596 | ) | | | (153,010 | ) | | | (1,816,192 | ) |
Change in net unrealized appreciation (depreciation) of investments | | | (1,883,164 | ) | | | (333,612 | ) | | | (1,326,562 | ) |
Net realized and unrealized gain (loss) | | | (2,237,760 | ) | | | (486,622 | ) | | | (3,142,754 | ) |
Net increase (decrease) in net assets applicable to common shares | | | | | | | | | | | | |
| from operations | | $ | 1,154,256 | | | $ | 678,105 | | | $ | 6,531,438 | |
See accompanying notes to financial statements.
87
Statement of Changes in Net Assets
| | | | | | | | | | | | | |
| | | NKG | | | NMY | |
| | | Year | | | Year | | | Year | | | Year | |
| | | Ended | | | Ended | | | Ended | | | Ended | |
| | | 5/31/20 | | | 5/31/19 | | | 5/31/20 | | | 5/31/19 | |
| Operations | | | | | | | | | | | | |
| Net investment income (loss) | | $ | 4,953,285 | | | $ | 4,839,423 | | | $ | 13,271,268 | | | $ | 12,560,036 | |
| Net realized gain (loss) from investments | | | (719,960 | ) | | | (791,963 | ) | | | (2,449,067 | ) | | | (1,232,606 | ) |
| Change in net unrealized appreciation (depreciation) of investments | | | 1,377,176 | | | | 5,780,144 | | | | (8,668,995 | ) | | | 12,354,292 | |
| Net increase (decrease) in net assets applicable to common shares | | | | | | | | | | | | | | | | |
| from operations | | | 5,610,501 | | | | 9,827,604 | | | | 2,153,206 | | | | 23,681,722 | |
| Distributions to Common Shareholders | | | | | | | | | | | | | | | | |
| Dividends | | | (4,648,716 | ) | | | (4,517,765 | ) | | | (12,300,571 | ) | | | (12,245,568 | ) |
| Decrease in net assets applicable to | | | | | | | | | | | | | | | | |
| common shares from distributions | | | | | | | | | | | | | | | | |
| to common shareholders | | | (4,648,716 | ) | | | (4,517,765 | ) | | | (12,300,571 | ) | | | (12,245,568 | ) |
| Capital Share Transactions | | | | | | | | | | | | | | | | |
| Common shares: | | | | | | | | | | | | | | | | |
| Net proceeds from shares issued | | | | | | | | | | | | | | | | |
| to shareholders due to | | | | | | | | | | | | | | | | |
| reinvestment of distributions | | | — | | | | — | | | | — | | | | — | |
| Cost of shares repurchased and retired | | | — | | | | (1,642,533 | ) | | | — | | | | (2,918,158 | ) |
| Net increase (decrease) in net assets | | | | | | | | | | | | | | | | |
| applicable to common shares from | | | | | | | | | | | | | | | | |
| capital share transactions | | | — | | | | (1,642,533 | ) | | | — | | | | (2,918,158 | ) |
| Net increase (decrease) in net assets | | | | | | | | | | | | | | | | |
| applicable to common shares | | | 961,785 | | | | 3,667,306 | | | | (10,147,365 | ) | | | 8,517,996 | |
| Net assets applicable to common | | | | | | | | | | | | | | | | |
| shares at the beginning of period | | | 144,151,938 | | | | 140,484,632 | | | | 342,060,127 | | | | 333,542,131 | |
| Net assets applicable to common | | | | | | | | | | | | | | | | |
| shares at the end of period | | $ | 145,113,723 | | | $ | 144,151,938 | | | $ | 331,912,762 | | | $ | 342,060,127 | |
See accompanying notes to financial statements.
88
| | | | | | | | | | | | | |
| | | NMT | | | NMS | |
| | | Year | | | Year | | | Year | | | Year | |
| | | Ended | | | Ended | | | Ended | | | Ended | |
| | | 5/31/20 | | | 5/31/19 | | | 5/31/20 | | | 5/31/19 | |
| Operations | | | | | | | | | | | | |
| Net investment income (loss) | | $ | 4,806,292 | | | $ | 4,875,152 | | | $ | 3,392,016 | | | $ | 3,569,638 | |
| Net realized gain (loss) from investments | | | 125,397 | | | | (762,614 | ) | | | (354,596 | ) | | | (377,996 | ) |
| Change in net unrealized appreciation (depreciation) of investments | | | (1,022,034 | ) | | | 4,696,560 | | | | (1,883,164 | ) | | | 3,251,354 | |
| Net increase (decrease) in net assets applicable to common shares | | | | | | | | | | | | | | | | |
| from operations | | | 3,909,655 | | | | 8,809,098 | | | | 1,154,256 | | | | 6,442,996 | |
| Distributions to Common Shareholders | | | | | | | | | | | | | | | | |
| Dividends | | | (4,619,423 | ) | | | (4,689,887 | ) | | | (3,321,981 | ) | | | (3,576,981 | ) |
| Decrease in net assets applicable to | | | | | | | | | | | | | | | | |
| common shares from distributions | | | | | | | | | | | | | | | | |
| to common shareholders | | | (4,619,423 | ) | | | (4,689,887 | ) | | | (3,321,981 | ) | | | (3,576,981 | ) |
| Capital Share Transactions | | | | | | | | | | | | | | | | |
| Common shares: | | | | | | | | | | | | | | | | |
| Net proceeds from shares issued | | | | | | | | | | | | | | | | |
| to shareholders due to | | | | | | | | | | | | | | | | |
| reinvestment of distributions | | | — | | | | — | | | | — | | | | — | |
| Cost of shares repurchased and retired | | | — | | | | (305,767 | ) | | | — | | | | (121,032 | ) |
| Net increase (decrease) in net assets | | | | | | | | | | | | | | | | |
| applicable to common shares from | | | | | | | | | | | | | | | | |
| capital share transactions | | | — | | | | (305,767 | ) | | | — | | | | (121,032 | ) |
| Net increase (decrease) in net assets | | | | | | | | | | | | | | | | |
| applicable to common shares | | | (709,768 | ) | | | 3,813,444 | | | | (2,167,725 | ) | | | 2,744,983 | |
| Net assets applicable to common | | | | | | | | | | | | | | | | |
| shares at the beginning of period | | | 137,281,388 | | | | 133,467,944 | | | | 87,811,663 | | | | 85,066,680 | |
| Net assets applicable to common | | | | | | | | | | | | | | | | |
| shares at the end of period | | $ | 136,571,620 | | | $ | 137,281,388 | | | $ | 85,643,938 | | | $ | 87,811,663 | |
See accompanying notes to financial statements.
89
Statement of Changes in Net Assets (continued)
| | | | | | | | | | | | | |
| | | NOM | | | NPV | |
| | | Year | | | Year | | | Year | | | Year | |
| | | Ended | | | Ended | | | Ended | | | Ended | |
| | | 5/31/20 | | | 5/31/19 | | | 5/31/20 | | | 5/31/19 | |
| Operations | | | | | | | | | | | | |
| Net investment income (loss) | | $ | 1,164,727 | | | $ | 1,223,981 | | | $ | 9,674,192 | | | $ | 9,564,575 | |
| Net realized gain (loss) from investments | | | (153,010 | ) | | | 152,623 | | | | (1,816,192 | ) | | | (837,682 | ) |
| Change in net unrealized appreciation (depreciation) of investments | | | (333,612 | ) | | | 671,591 | | | | (1,326,562 | ) | | | 9,418,868 | |
| Net increase (decrease) in net assets applicable to common shares | | | | | | | | | | | | | | | | |
| from operations | | | 678,105 | | | | 2,048,195 | | | | 6,531,438 | | | | 18,145,761 | |
| Distributions to Common Shareholders | | | | | | | | | | | | | | | | |
| Dividends | | | (1,143,252 | ) | | | (1,209,776 | ) | | | (9,395,020 | ) | | | (9,479,610 | ) |
| Decrease in net assets applicable to | | | | | | | | | | | | | | | | |
| common shares from distributions | | | | | | | | | | | | | | | | |
| to common shareholders | | | (1,143,252 | ) | | | (1,209,776 | ) | | | (9,395,020 | ) | | | (9,479,610 | ) |
| Capital Share Transactions | | | | | | | | | | | | | | | | |
| Common shares: | | | | | | | | | | | | | | | | |
| Net proceeds from shares issuedto shareholders due to | | | | | | | | | | | | | | | | |
| reinvestment of distributions | | | 17,775 | | | | — | | | | — | | | | — | |
| Cost of shares repurchased and retired | | | — | | | | — | | | | — | | | | (639,145 | ) |
| Net increase (decrease) in net assets | | | | | | | | | | | | | | | | |
| applicable to common shares from | | | | | | | | | | | | | | | | |
| capital share transactions | | | 17,775 | | | | — | | | | — | | | | (639,145 | ) |
| Net increase (decrease) in net assets | | | | | | | | | | | | | | | | |
| applicable to common shares | | | (447,372 | ) | | | 838,419 | | | | (2,863,582 | ) | | | 8,027,006 | |
| Net assets applicable to common | | | | | | | | | | | | | | | | |
| shares at the beginning of period | | | 32,443,582 | | | | 31,605,163 | | | | 262,201,907 | | | | 254,174,901 | |
| Net assets applicable to common | | | | | | | | | | | | | | | | |
| shares at the end of period | | $ | 31,996,210 | | | $ | 32,443,582 | | | $ | 259,338,325 | | | $ | 262,201,907 | |
See accompanying notes to financial statements.
90
Year Ended May 31, 2020
| | | | | | | | | | |
| | NKG | | | NMY | | | NMT | |
| Cash Flows from Operating Activities: | | | | | | | | | |
| Net Increase (Decrease) in Net Assets Applicable to Common Shares from Operations | | $ | 5,610,501 | | | $ | 2,153,206 | | | $ | 3,909,655 | |
Adjustments to reconcile the net increase (decrease) in net assets applicable to common | | | | | | | | | | | | |
| shares from operations to net cash provided by (used in) operating activities: | | | | | | | | | | | | |
Purchases of investments | | | (22,939,287 | ) | | | (70,264,293 | ) | | | (22,791,921 | ) |
Proceeds from sales and maturities of investments | | | 19,748,331 | | | | 82,961,678 | | | | 23,460,638 | |
Proceeds from (Purchase of) short-term investments, net | | | 89,068 | | | | — | | | | — | |
Taxes paid | | | (100 | ) | | | (4,224 | ) | | | (2,265 | ) |
Amortization (Accretion) of premiums and discounts, net | | | 1,544,657 | | | | 2,179,291 | | | | 1,568,889 | |
Amortization of deferred offering costs | | | 79,742 | | | | 87,571 | | | | 9,776 | |
(Increase) Decrease in: | | | | | | | | | | | | |
| Receivable for interest | | | (49,833 | ) | | | 53,015 | | | | 80,342 | |
| Receivable for investments sold | | | 1,325,513 | | | | (7,201,664 | ) | | | — | |
| Other assets | | | 387 | | | | (2,772 | ) | | | 388 | |
Increase (Decrease) in: | | | | | | | | | | | | |
| Payable for interest | | | (52,592 | ) | | | (286,841 | ) | | | — | |
| Payable for investments purchased – regular settlement | | | — | | | | 2,168,872 | | | | — | |
| Payable for investments purchased – when-issued/delayed delivery settlement | | | — | | | | (1,684,730 | ) | | | — | |
| Payable for offering costs | | | (66,075 | ) | | | (69,014 | ) | | | — | |
| Accrued management fees | | | (3,058 | ) | | | (6,645 | ) | | | (1,302 | ) |
| Accrued Trustees fees | | | (5 | ) | | | 3,231 | | | | (17 | ) |
| Accrued other expenses | | | 101 | | | | (14,710 | ) | | | (13,268 | ) |
Net realized (gain) loss from investments | | | 719,960 | | | | 2,449,067 | | | | (125,397 | ) |
Change in net unrealized (appreciation) depreciation of investments | | | (1,377,176 | ) | | | 8,668,995 | | | | 1,022,034 | |
Net cash provided by (used in) operating activities | | | 4,630,134 | | | | 21,190,033 | | | | 7,117,552 | |
| Cash Flows from Financing Activities: | | | | | | | | | | | | |
Proceeds from borrowings | | | 488,286 | | | | 11,703,666 | | | | 1,023,737 | |
(Repayments) of borrowings | | | (488,286 | ) | | | (11,703,666 | ) | | | (1,023,737 | ) |
Increase (Decrease) in cash overdraft | | | — | | | | (6,558,191 | ) | | | (564,312 | ) |
Cash distributions paid to common shareholders | | | (4,620,665 | ) | | | (12,232,806 | ) | | | (4,587,277 | ) |
Net cash provided by (used in) financing activities | | | (4,620,665 | ) | | | (18,790,997 | ) | | | (5,151,589 | ) |
| Net Increase (Decrease) in Cash | | | 9,469 | | | | 2,399,036 | | | | 1,965,963 | |
Cash at the beginning of period | | | 554,077 | | | | — | | | | — | |
Cash at the end of period | | $ | 563,546 | | | $ | 2,399,036 | | | $ | 1,965,963 | |
| | |
| Supplemental Disclosure of Cash Flow Information | | NKG | | | NMY | | | NMT | |
Cash paid for interest (excluding amortization of offering costs) | | $ | 1,633,785 | | | $ | 4,760,308 | | | $ | 1,565,396 | |
Non-cash financing activities not included herein consist of reinvestments of | | | | | | | | | | | | |
| common share distributions | | | — | | | | — | | | | — | |
See accompanying notes to financial statements.
91
Statement of Cash Flows (continued)
| | | | | | | | | | |
| | NMS | | | NOM | | | NPV | |
| Cash Flows from Operating Activities: | | | | | | | | | |
| Net Increase (Decrease) in Net Assets Applicable to Common Shares from Operations | | $ | 1,154,256 | | | $ | 678,105 | | | $ | 6,531,438 | |
Adjustments to reconcile the net increase (decrease) in net assets applicable to common | | | | | | | | | | | | |
| shares from operations to net cash provided by (used in) operating activities: | | | | | | | | | | | | |
Purchases of investments | | | (16,262,466 | ) | | | (4,895,596 | ) | | | (74,468,363 | ) |
Proceeds from sales and maturities of investments | | | 17,014,297 | | | | 5,443,381 | | | | 72,338,096 | |
Proceeds from (Purchase of) short-term investments, net | | | 385,000 | | | | 205,000 | | | | 395,000 | |
Taxes paid | | | — | | | | (743 | ) | | | (2,292 | ) |
Amortization (Accretion) of premiums and discounts, net | | | 69,621 | | | | 172,842 | | | | 1,277,237 | |
Amortization of deferred offering costs | | | 98,710 | | | | 8,096 | | | | 15,215 | |
(Increase) Decrease in: | | | | | | | | | | | | |
| Receivable for interest | | | (17,796 | ) | | | 17,828 | | | | (134,808 | ) |
| Receivable for investments sold | | | (1,089,719 | ) | | | 654,874 | | | | 363,965 | |
| Other assets | | | 366 | | | | 346 | | | | (1,990 | ) |
Increase (Decrease) in: | | | | | | | | | | | | |
| Payable for interest | | | (114,858 | ) | | | 4,123 | | | | 119,042 | |
| Payable for investments purchased – regular settlement | | | 32,467 | | | | 175,916 | | | | (59,392 | ) |
| Payable for investments purchased – when-issued/delayed delivery settlement | | | 366,872 | | | | (1,651,530 | ) | | | (6,549,774 | ) |
| Payable for offering costs | | | (85,533 | ) | | | — | | | | — | |
| Accrued management fees | | | (1,805 | ) | | | (364 | ) | | | (3,850 | ) |
| Accrued Trustees fees | | | (17 | ) | | | (7 | ) | | | 2,421 | |
| Accrued other expenses | | | 1,555 | | | | 941 | | | | (1,480 | ) |
Net realized (gain) loss from investments | | | 354,596 | | | | 153,010 | | | | 1,816,192 | |
Change in net unrealized (appreciation) depreciation of investments | | | 1,883,164 | | | | 333,612 | | | | 1,326,562 | |
Net cash provided by (used in) operating activities | | | 3,788,710 | | | | 1,299,834 | | | | 2,963,219 | |
| Cash Flows from Financing Activities: | | | | | | | | | | | | |
Proceeds from borrowings | | | 320,708 | | | | 112,909 | | | | 3,764,146 | |
(Repayments) of borrowings | | | (320,708 | ) | | | (112,909 | ) | | | (3,764,146 | ) |
Increase (Decrease) in cash overdraft | | | — | | | | (2,562 | ) | | | 2,623,816 | |
Cash distributions paid to common shareholders | | | (3,348,409 | ) | | | (1,141,345 | ) | | | (9,333,095 | ) |
Net cash provided by (used in) financing activities | | | (3,348,409 | ) | | | (1,143,907 | ) | | | (6,709,279 | ) |
| Net Increase (Decrease) in Cash | | | 440,301 | | | | 155,927 | | | | (3,746,060 | ) |
Cash at the beginning of period | | | 49,023 | | | | — | | | | 3,746,060 | |
Cash at the end of period | | $ | 489,324 | | | $ | 155,927 | | | $ | — | |
| | |
| Supplemental Disclosure of Cash Flow Information | | NMS | | | NOM | | | NPV | |
Cash paid for interest (excluding amortization of offering costs) | | $ | 1,266,789 | | | $ | 406,751 | | | $ | 2,982,796 | |
Non-cash financing activities not included herein consists of reinvestments of | | | | | | | | | | | | |
| common share distributions | | | — | | | | 17,775 | | | | — | |
See accompanying notes to financial statements.
92
THIS PAGE INTENTIONALLY LEFT BLANK
93
Selected data for a common share outstanding throughout each period:
| | | | | | | | | | | | | | | | | | | | | | | | | | | | | | | |
| | | | | Investment Operations | | | Less Distributions to Common Shareholders | | | Common Share | |
| | Beginning Common Share NAV | | | Net Investment Income (Loss) | | | Net Realized/ Unrealized Gain (Loss) | | | Total | | | From Net Investment Income | | | From Accumu- lated Net Realized Gains | | | Total | | | Discount Per Share Repurchased and Retired | | | Ending NAV | | | Ending Share Price | |
| NKG | | | | | | | | | | | | | | | | | | | | | | | | | | | | | | |
Year Ended 5/31:
| | | | | | | | | | | | | | | | | | | | | | |
2020 | | $ | 13.86 | | | $ | 0.48 | | | $ | 0.06 | | | $ | 0.54 | | | $ | (0.45 | ) | | $ | — | | | $ | (0.45 | ) | | $ | — | | | $ | 13.95 | | | $ | 11.98 | |
2019 | | | 13.32 | | | | 0.46 | | | | 0.48 | | | | 0.94 | | | | (0.43 | ) | | | — | | | | (0.43 | ) | | | 0.03 | | | | 13.86 | | | | 12.46 | |
2018 | | | 13.80 | | | | 0.49 | | | | (0.46 | ) | | | 0.03 | | | | (0.51 | ) | | | — | | | | (0.51 | ) | | | — | | | | 13.32 | | | | 11.38 | |
2017 | | | 14.40 | | | | 0.55 | | | | (0.55 | ) | | | — | | | | (0.60 | ) | | | — | | | | (0.60 | ) | | | — | | | | 13.80 | | | | 13.28 | |
2016 | | | 13.98 | | | | 0.68 | | | | 0.38 | | | | 1.06 | | | | (0.64 | ) | | | — | | | | (0.64 | ) | | | — | | | | 14.40 | | | | 14.28 | |
| | |
| NMY | | | | | | | | | | | | | | | | | | | | | | | | | | | | | | | | | | | | | | | | |
Year Ended 5/31:
| | | | | | | | | | | | | | | | | | | | | | | | | | | | | |
2020 | | | 14.81 | | | | 0.57 | | | | (0.48 | ) | | | 0.09 | | | | (0.53 | ) | | | — | | | | (0.53 | ) | | | — | | | | 14.37 | | | | 12.62 | |
2019 | | | 14.29 | | | | 0.54 | | | | 0.49 | | | | 1.03 | | | | (0.53 | ) | | | — | | | | (0.53 | ) | | | 0.02 | | | | 14.81 | | | | 12.79 | |
2018 | | | 14.65 | | | | 0.56 | | | | (0.32 | ) | | | 0.24 | | | | (0.60 | ) | | | — | | | | (0.60 | ) | | | — | * | | | 14.29 | | | | 12.21 | |
2017 | | | 15.08 | | | | 0.61 | | | | (0.38 | ) | | | 0.23 | | | | (0.66 | ) | | | — | | | | (0.66 | ) | | | — | | | | 14.65 | | | | 13.08 | |
2016 | | | 14.59 | | | | 0.67 | | | | 0.47 | | | | 1.14 | | | | (0.67 | ) | | | — | | | | (0.67 | ) | | | 0.02 | | | | 15.08 | | | | 13.65 | |
| | |
(a) | Total Return Based on Common Share NAV is the combination of changes in common share NAV, reinvested dividend income at NAV and reinvested capital gains distributions at NAV, if any. The last dividend declared in the period, which is typically paid on the first business day of the following month, is assumed to be reinvested at the ending NAV. The actual reinvest price for the last dividend declared in the period may often be based on the Fund’s market price (and not its NAV), and therefore may be different from the price used in the calculation. Total returns are not annualized. |
| Total Return Based on Common Share Price is the combination of changes in the market price per share and the effect of reinvested dividend income and reinvested capital gains distributions, if any, at the average price paid per share at the time of reinvestment. The last dividend declared in the period, which is typically paid on the first business day of the following month, is assumed to be reinvested at the ending market price. The actual reinvestment for the last dividend declared in the period may take place over several days, and in some instances may not be based on the market price, so the actual reinvestment price may be different from the price used in the calculation. Total returns are not annualized. |
94
| | | | | | | | | | | | | | | | | |
| | | | | | | Common Share Supplemental Data/ Ratios Applicable to Common Shares
| |
Common Share Total Returns | | | | | | Ratios to Average Net Assets(b) | | | | |
| | |
Based on NAV(a) | | | Based on Share Price(a) | | | Ending Net Assets (000) | | | Expenses | | | Net Investment Income (Loss) | | | Portfolio Turnover Rate(c) | |
| | |
| | |
| | 3.90 | % | | | (0.33 | )% | | $ | 145,114 | | | | 2.13 | % | | | 3.40 | % | | | 9 | % |
| | 7.49 | | | | 13.72 | | | | 144,152 | | | | 2.45 | | | | 3.50 | | | | 20 | |
| | 0.22 | | | | (10.74 | ) | | | 140,485 | | | | 2.19 | | | | 3.64 | | | | 15 | |
| | 0.07 | | | | (2.76 | ) | | | 145,577 | | | | 2.10 | | | | 3.94 | | | | 13 | |
| | 7.80 | | | | 16.94 | | | | 151,860 | | | | 1.60 | | | | 4.83 | | | | 13 | |
| | |
| | |
| | |
| | 0.55 | | | | 2.73 | | | | 331,913 | | | | 2.34 | | | | 3.85 | | | | 13 | |
| | 7.56 | | | | 9.40 | | | | 342,060 | | | | 2.61 | | | | 3.82 | | | | 17 | |
| | 1.68 | | | | (2.10 | ) | | | 333,542 | | | | 2.25 | | | | 3.91 | | | | 20 | |
| | 1.61 | | | | 0.69 | | | | 342,427 | | | | 2.08 | | | | 4.14 | | | | 42 | |
| | 8.13 | | | | 14.77 | | | | 352,581 | | | | 1.55 | | | | 4.56 | | | | 19 | |
| | |
(b) | • Net Investment Income (Loss) ratios reflect income earned and expenses incurred on assets attributable to preferred shares issued by the Fund. |
| • The expense ratios reflect, among other things, all interest expense and other costs related to preferred shares (as described in Note 5 – Fund Shares) and/or the interest expense deemed to have been paid by the Fund on the floating rate certificates issued by the special purpose trusts for the self-deposited inverse floaters held by the Fund (as described in Note 4 – Portfolio Securities and Investments in Derivatives), where applicable, as follows: |
| | | | | |
| NKG | | | NMY | |
Year Ended 5/31: | | Year Ended 5/31: |
2020 | 1.09% | | 2020 | 1.30% |
2019 | 1.36 | | 2019 | 1.56 |
2018 | 1.11 | | 2018 | 1.21 |
2017 | 1.03 | | 2017 | 1.04 |
2016 | 0.55 | | 2016 | 0.55 |
| | |
(c) | Portfolio Turnover Rate is calculated based on the lesser of long-term purchases or sales (as disclosed in Note 4 – Portfolio Securities and Investments in Derivatives) divided by the average long-term market value during the period. |
* | Rounds to less than $0.01 per share. |
See accompanying notes to financial statements.
95
Financial Highlights (continued)
Selected data for a common share outstanding throughout each period:
| | | | | | | | | | | | | | | | | | | | | | | | | | | | | | | | | | |
| | | | | Investment Operations | | | Less Distributions to Common Shareholders | | | Common Share | |
| | | Beginning Common Share NAV | | | Net Investment Income (Loss) | | | Net Realized/ Unrealized Gain (Loss)
| | | Total | | | From Net Investment Income | | | From Accumu- lated Net Realized Gains | | | Total | | | Premium per Share Sold through Shelf Offering | | | Discount per Share Repurchased and Retired | | | Ending NAV | | | Ending Share Price | |
| NMT | | | | | | | | | | | | | | | | | | | | | | | | | | | | | | | | | |
Year Ended 5/31:
| | | | | | | | | | | | | | | | | | | | | | |
2020 | | $ | 14.73 | | | $ | 0.52 | | | $ | (0.10 | ) | | | 0.42 | | | $ | (0.50 | ) | | $ | — | | | $ | (0.50 | ) | | $ | — | | | $ | — | | | $ | 14.65 | | | $ | 13.15 | |
2019 | | | 14.28 | | | | 0.52 | | | | 0.42 | | | | 0.94 | | | | (0.50 | ) | | | — | | | | (0.50 | ) | | | — | | | | 0.01 | | | | 14.73 | | | | 12.84 | |
2018 | | | 14.72 | | | | 0.59 | | | | (0.40 | ) | | | 0.19 | | | | (0.63 | ) | | | — | | | | (0.63 | ) | | | — | | | | — | | | | 14.28 | | | | 12.64 | |
2017 | | | 15.34 | | | | 0.64 | | | | (0.58 | ) | | | 0.06 | | | | (0.68 | ) | | | — | | | | (0.68 | ) | | | — | | | | — | | | | 14.72 | | | | 13.90 | |
2016 | | | 14.67 | | | | 0.69 | | | | 0.69 | | | | 1.38 | | | | (0.71 | ) | | | — | | | | (0.71 | ) | | | — | | | | — | | | | 15.34 | | | | 14.99 | |
| | |
| NMS | | | | | | | | | | | | | | | | | | | | | | | | | | | | | | | | | | | | | | | | | | | | |
Year Ended 5/31:
| | | | | | | | | | | | | | | | | | | | | | | | | | | | | | | | | |
2020 | | | 15.19 | | | | 0.59 | | | | (0.40 | ) | | | 0.19 | | | | (0.57 | ) | | | — | | | | (0.57 | ) | | | — | | | | — | | | | 14.81 | | | | 13.55 | |
2019 | | | 14.69 | | | | 0.62 | | | | 0.50 | | | | 1.12 | | | | (0.62 | ) | | | — | | | | (0.62 | ) | | | — | | | | — | * | | | 15.19 | | | | 13.76 | |
2018 | | | 15.08 | | | | 0.70 | | | | (0.37 | ) | | | 0.33 | | | | (0.74 | ) | | | — | | | | (0.74 | ) | | | 0.02 | | | | — | | | | 14.69 | | | | 13.60 | |
2017 | | | 15.78 | | | | 0.70 | | | | (0.62 | ) | | | 0.08 | | | | (0.79 | ) | | | — | | | | (0.79 | ) | | | 0.01 | | | | — | | | | 15.08 | | | | 16.18 | |
2016 | | | 15.46 | | | | 0.80 | | | | 0.33 | | | | 1.13 | | | | (0.81 | ) | | | — | | | | (0.81 | ) | | | — | | | | — | | | | 15.78 | | | | 15.99 | |
| | |
(a) | Total Return Based on Common Share NAV is the combination of changes in common share NAV, reinvested dividend income at NAV and reinvested capital gains distributions at NAV, if any. The last dividend declared in the period, which is typically paid on the first business day of the following month, is assumed to be reinvested at the ending NAV. The actual reinvest price for the last dividend declared in the period may often be based on the Fund’s market price (and not its NAV), and therefore may be different from the price used in the calculation. Total returns are not annualized. |
| Total Return Based on Common Share Price is the combination of changes in the market price per share and the effect of reinvested dividend income and reinvested capital gains distributions, if any, at the average price paid per share at the time of reinvestment. The last dividend declared in the period, which is typically paid on the first business day of the following month, is assumed to be reinvested at the ending market price. The actual reinvestment for the last dividend declared in the period may take place over several days, and in some instances may not be based on the market price, so the actual reinvestment price may be different from the price used in the calculation. Total returns are not annualized. |
96
| | | | | | | | | | | | | | | | | |
| | | | | | | Common Share Supplemental Data/ Ratios Applicable to Common Shares | |
Common Share Total Returns | | | | | | Ratios to Average Net Assets(b) | | | | |
| | |
| | |
| | |
Based on NAV(a) | | | Based on Share Price(a) | | | Ending Net Assets (000) | | | Expenses | | | Net Investment Income (Loss) | | | Portfolio Turnover Rate(c) | |
| | |
| | |
| | 2.83 | % | | | 6.14 | % | | $ | 136,572 | | | | 2.20 | % | | | 3.47 | % | | | 11 | % |
| | 6.87 | | | | 5.80 | | | | 137,281 | | | | 2.45 | | | | 3.70 | | | | 16 | |
| | 1.29 | | | | (4.84 | ) | | | 133,468 | | | | 2.13 | | | | 4.04 | | | | 17 | |
| | 0.43 | | | | (2.78 | ) | | | 137,639 | | | | 1.91 | | | | 4.29 | | | | 12 | |
| | 9.64 | | | | 20.01 | | | | 143,395 | | | | 1.62 | | | | 4.65 | | | | 13 | |
| | |
| | |
| | |
| | 1.24 | | | | 2.57 | | | | 85,644 | | | | 2.46 | | | | 3.85 | | | | 12 | |
| | 7.88 | | | | 6.13 | | | | 87,812 | | | | 2.75 | | | | 4.25 | | | | 30 | |
| | 2.37 | | | | (11.55 | ) | | | 85,067 | | | | 2.40 | | | | 4.66 | | | | 13 | |
| | 0.68 | | | | 6.41 | | | | 84,726 | | | | 2.47 | | | | 4.59 | | | | 19 | |
| | 7.47 | | | | 12.84 | | | | 87,942 | | | | 1.69 | | | | 5.14 | | | | 17 | |
| | |
(b) | • Net Investment Income (Loss) ratios reflect income earned and expenses incurred on assets attributable to preferred shares issued by the Fund. |
| • The expense ratios reflect, among other things, all interest expense and other costs related to preferred shares (as described in Note 5 – Fund Shares) and/or the interest expense deemed to have been paid by the Fund on the floating rate certificates issued by the special purpose trusts for the self-deposited inverse floaters held by the Fund (as described in Note 4 – Portfolio Securities and Investments in Derivatives), where applicable, as follows: |
| | | | | |
| NMT | | | NMS | |
Year Ended 5/31: | | Year Ended 5/31: |
2020 | 1.14% | | 2020 | 1.32% |
2019 | 1.30 | | 2019 | 1.59 |
2018 | 1.00 | | 2018 | 1.06 |
2017 | 0.83 | | 2017 | 1.29 |
2016 | 0.58 | | 2016 | 0.62 |
| | |
(c) | Portfolio Turnover Rate is calculated based on the lesser of long-term purchases or sales (as disclosed in Note 4 – Portfolio Securities and Investments in Derivatives) divided by the average long-term market value during the period. |
* | Rounds to less than $0.01 per share. |
See accompanying notes to financial statements.
97
Financial Highlights (continued)
Selected data for a common share outstanding throughout each period:
| | | | | | | | | | | | | | | | | | | | | | | | | | | | | | | | | | |
| | | | | Investment Operations | | | Less Distributions to Common Shareholders | | | Common Share | |
| | | Beginning Common Share NAV | | | Net Investment Income (Loss) | | | Net Realized/ Unrealized Gain (Loss) | | | Total | | | From Net Investment Income | | | Accumu- lated Net Realized Gains | | | Return of Capital | | | Total | | | Discount Per Share Repurchased and Retired | | | Ending NAV | | | Ending Share Price | |
| NOM | | | | | | | | | | | | | | | | | | | | | | | | | | | | | | | | | |
Year Ended 5/31:
| | | | | | | | | | | | | | | | | | | | | | |
2020 | | $ | 13.84 | | | $ | 0.50 | | | $ | (0.21 | ) | | $ | 0.29 | | | $ | (0.49 | ) | | $ | — | | | $ | — | | | $ | (0.49 | ) | | $ | — | | | $ | 13.64 | | | $ | 14.56 | |
2019 | | | 13.48 | | | | 0.52 | | | | 0.36 | | | | 0.88 | | | | (0.52 | ) | | | — | | | | — | | | | (0.52 | ) | | | — | | | | 13.84 | | | | 13.97 | |
2018 | | | 13.95 | | | | 0.57 | | | | (0.41 | ) | | | 0.16 | | | | (0.62 | ) | | | — | | | | (0.01 | ) | | | (0.63 | ) | | | — | | | | 13.48 | | | | 13.34 | |
2017 | | | 14.45 | | | | 0.65 | | | | (0.44 | ) | | | 0.21 | | | | (0.71 | ) | | | — | | | | — | | | | (0.71 | ) | | | — | | | | 13.95 | | | | 16.20 | |
2016 | | | 13.91 | | | | 0.72 | | | | 0.55 | | | | 1.27 | | | | (0.73 | ) | | | — | | | | — | | | | (0.73 | ) | | | — | | | | 14.45 | | | | 16.03 | |
| | | | | | | | | | | | | | | | | | | | | | | | | | | | | | | | | | | | | | | | | | | | | |
| NPV | | | | | | | | | | | | | | | | | | | | | | | | | | | | | | | | | | | | | | | | | | | | |
Year Ended 5/31: | | | | | | | | | | | | | | | | | | | | | | | | | | | | | |
2020 | | | 14.67 | | | | 0.54 | | | | (0.17 | ) | | | 0.37 | | | | (0.53 | ) | | | — | | | | — | | | | (0.53 | ) | | | — | | | | 14.51 | | | | 13.40 | |
2019 | | | 14.17 | | | | 0.53 | | | | 0.49 | | | | 1.02 | | | | (0.53 | ) | | | — | | | | — | | | | (0.53 | ) | | | 0.01 | | | | 14.67 | | | | 12.92 | |
2018 | | | 14.49 | | | | 0.56 | | | | (0.32 | ) | | | 0.24 | | | | (0.56 | ) | | | — | | | | — | | | | (0.56 | ) | | | — | | | | 14.17 | | | | 12.35 | |
2017 | | | 15.00 | | | | 0.58 | | | | (0.50 | ) | | | 0.08 | | | | (0.59 | ) | | | — | | | | — | | | | (0.59 | ) | | | — | | | | 14.49 | | | | 13.25 | |
2016 | | | 14.50 | | | | 0.66 | | | | 0.53 | | | | 1.19 | | | | (0.69 | ) | | | — | | | | — | | | | (0.69 | ) | | | — | | | | 15.00 | | | | 14.43 | |
| | |
(a) | Total Return Based on Common Share NAV is the combination of changes in common share NAV, reinvested dividend income at NAV and reinvested capital gains distributions at NAV, if any. The last dividend declared in the period, which is typically paid on the first business day of the following month, is assumed to be reinvested at the ending NAV. The actual reinvest price for the last dividend declared in the period may often be based on the Fund’s market price (and not its NAV), and therefore may be different from the price used in the calculation. Total returns are not annualized. |
| Total Return Based on Common Share Price is the combination of changes in the market price per share and the effect of reinvested dividend income and reinvested capital gains distributions, if any, at the average price paid per share at the time of reinvestment. The last dividend declared in the period, which is typically paid on the first business day of the following month, is assumed to be reinvested at the ending market price. The actual reinvestment for the last dividend declared in the period may take place over several days, and in some instances may not be based on the market price, so the actual reinvestment price may be different from the price used in the calculation. Total returns are not annualized. |
98
| | | | | | | | | | | | | | | | | |
| | | | | | | Common Share Supplemental Data/ Ratios Applicable to Common Shares | |
Common Share Total Returns | | | | | | Ratios to Average Net Assets(b) | | | | |
| | |
Based on NAV(a) | | | Based on Share Price(a) | | | Ending Net Assets (000) | | | Expenses | | | Net Investment Income (Loss) | | | Portfolio Turnover Rate(c) | |
| | |
| | |
| | 2.07 | % | | | 7.93 | % | | $ | 31,996 | | | | 2.66 | % | | | 3.58 | % | | | 10 | % |
| | 6.70 | | | | 9.06 | | | | 32,444 | | | | 2.72 | | | | 3.90 | | | | 23 | |
| | 1.15 | | | | (13.89 | ) | | | 31,605 | | | | 2.54 | | | | 4.15 | | | | 20 | |
| | 1.53 | | | | 5.77 | | | | 32,658 | | | | 2.27 | | | | 4.65 | | | | 14 | |
| | 9.40 | | | | 10.34 | | | | 33,777 | | | | 1.94 | | | | 5.13 | | | | 5 | |
| | |
| | |
| | |
| | 2.48 | | | | 7.74 | | | | 259,338 | | | | 2.20 | | | | 3.65 | | | | 18 | |
| | 7.49 | | | | 9.23 | | | | 262,202 | | | | 2.48 | | | | 3.81 | | | | 21 | |
| | 1.70 | | | | (2.62 | ) | | | 254,175 | | | | 2.07 | | | | 3.92 | | | | 22 | |
| | 0.63 | | | | (4.14 | ) | | | 259,831 | | | | 1.97 | | | | 3.98 | | | | 38 | |
| | 8.41 | | | | 13.22 | | | | 268,960 | | | | 1.64 | | | | 4.51 | | | | 18 | |
| | |
(b) | • Net Investment Income (Loss) ratios reflect income earned and expenses incurred on assets attributable to preferred shares issued by the Fund. |
| • The expense ratios reflect, among other things, all interest expense and other costs related to preferred shares (as described in Note 5 – Fund Shares) and/or the interest expense deemed to have been paid by the Fund on the floating rate certificates issued by the special purpose trusts for the self-deposited inverse floaters held by the Fund (as described in Note 4 – Portfolio Securities and Investments in Derivatives), where applicable, as follows: |
| | | | | |
| NOM | | | NPV | |
Year Ended 5/31: | | Year Ended 5/31: |
2020 | 1.29% | | 2020 | 1.18% |
2019 | 1.40 | | 2019 | 1.42 |
2018 | 1.19 | | 2018 | 1.02 |
2017 | 0.99 | | 2017 | 0.94 |
2016 | 0.69 | | 2016 | 0.62 |
| | |
(c) | Portfolio Turnover Rate is calculated based on the lesser of long-term purchases or sales (as disclosed in Note 4 – Portfolio Securities and Investments in Derivatives) divided by the average long-term market value during the period. |
See accompanying notes to financial statements.
99
Financial Highlights (continued)
| | | | | | | | | | | | | |
| | AMTP Shares at the End of Period | | | VMTP Shares at the End of Period | |
| | | Aggregate Amount Outstanding (000) | | | Asset Coverage Per $100,000 Share | | | Aggregate Amount Outstanding (000) | | | Asset Coverage Per $100,000 Share | |
| NKG | | | | | | | | | | | | |
Year Ended 5/31: | | | | | | | | | | | | |
2020 | | $ | 58,500 | | | $ | 348,058 | | | $ | — | | | $ | — | |
2019 | | | 58,500 | | | | 346,414 | | | | — | | | | — | |
2018 | | | — | | | | — | | | | 82,000 | | | | 271,323 | |
2017 | | | — | | | | — | | | | 82,000 | | | | 277,532 | |
2016 | | | — | | | | — | | | | 75,000 | | | | 302,480 | |
| | |
| NMY | | | | | | | | | | | | | | | | |
Year Ended 5/31: | | | | | | | | | | | | | | | | |
2020 | | | 182,000 | | | | 282,370 | | | | — | | | | — | |
2019 | | | 182,000 | | | | 287,945 | | | | — | | | | — | |
2018 | | | — | | | | — | | | | 197,000 | | | | 269,311
| |
2017 | | | — | | | | — | | | | 197,000 | | | | 273,821
| |
2016 | | | — | | | | — | | | | 167,000 | | | | 311,126
| |
See accompanying notes to financial statements.
100
| | | | | | | | | | | | | | | | | | | |
| | AMTP Shares at the End of Period | | | VMTP Shares at the End of Period | | | VRDP Shares at the End of Period | |
| | Aggregate Amount Outstanding (000) | | | Asset Coverage Per $100,000 Share | | | Aggregate Amount Outstanding (000) | | | Asset Coverage Per $100,000 Share | | | Aggregate Amount Outstanding (000) | | | Asset Coverage Per $100,000 Share | |
| NMT | | | | | | | | | | | | | | | | | | |
Year Ended 5/31: | | | | | | | | | | | | | | | | | | |
2020 | | $ | — | | | $ | — | | | $ | — | | | $ | — | | | $ | 74,000 | | | $ | 284,556 | |
2019 | | | — | | | | — | | | | — | | | | — | | | | 74,000 | | | | 285,515 | |
2018 | | | — | | | | — | | | | — | | | | — | | | | 74,000 | | | | 280,362 | |
2017 | | | — | | | | — | | | | — | | | | — | | | | 74,000 | | | | 285,999 | |
2016 | | | — | | | | — | | | | 74,000 | | | | 293,776 | | | | — | | | | — | |
| | |
| NMS | | | | | | | | | | | | | | | | | | | | | | | | |
Year Ended 5/31: | | | | | | | | | | | | | | | | | | | | | | | | |
2020 | | | 52,800 | | | | 262,204 | | | | — | | | | — | | | | — | | | | — | |
2019 | | | 52,800 | | | | 266,310 | | | | — | | | | — | | | | — | | | | — | |
2018 | | | — | | | | — | | | | 52,800 | | | | 261,111 | | | | — | | | | — | |
2017 | | | — | | | | — | | | | 52,800 | | | | 260,466 | | | | — | | | | — | |
2016 | | | — | | | | — | | | | 44,100 | | | | 299,415 | | | | — | | | | — | |
See accompanying notes to financial statements.
101
Financial Highlights (continued)
| | | | | | | | | | | | | | | | | | | |
| | MFP Shares at the End of Period | | | VMTP Shares at the End of Period | | | VRDP Shares at the End of Period | |
| | | Aggregate Amount Outstanding (000) | | | Asset Coverage Per $100,000 Share | | | Aggregate Amount Outstanding (000) | | | Asset Coverage Per $100,000 Share | | | Aggregate Amount Outstanding (000) | | | Asset Coverage Per $100,000 Share | |
| NOM | | | | | | | | | | | | | | | | | | |
Year Ended 5/31: | | | | | | | | | | | | | | | | | | |
2020 | | $ | 18,000 | | | $ | 277,757 | | | $ | — | | | $ | — | | | $ | — | | | $ | — | |
2019 | | | 18,000 | | | | 280,242 | | | | — | | | | — | | | | — | | | | — | |
2018 | | | 18,000 | | | | 275,584 | | | | — | | | | — | | | | — | | | | — | |
2017 | | | — | | | | — | | | | 18,000 | | | | 281,436 | | | | — | | | | — | |
2016 | | | — | | | | — | | | | 18,000 | | | | 287,651 | | | | — | | | | — | |
| | |
| NPV | | | | | | | | | | | | | | | | | | | | | | | | |
Year Ended 5/31: | | | | | | | | | | | | | | | | | | | | | | | | |
2020 | | | — | | | | — | | | | — | | | | — | | | | 128,000 | | | | 302,608 | |
2019 | | | — | | | | — | | | | — | | | | — | | | | 128,000 | | | | 304,845 | |
2018 | | | — | | | | — | | | | — | | | | — | | | | 128,000 | | | | 298,574 | |
2017 | | | — | | | | — | | | | — | | | | — | | | | 128,000 | | | | 302,993 | |
2016 | | | — | | | | — | | | | — | | | | — | | | | 128,000 | | | | 310,125 | |
See accompanying notes to financial statements.
102
Notes toFinancial Statements 1. General Information
Fund Information
The state funds covered in this report and their corresponding New York Stock Exchange (“NYSE”) symbols are as follows (each a “Fund” and collectively, the “Funds”):
• Nuveen Georgia Quality Municipal Income Fund (NKG)
• Nuveen Maryland Quality Municipal Income Fund (NMY)
• Nuveen Massachusetts Quality Municipal Income Fund (NMT)
• Nuveen Minnesota Quality Municipal Income Fund (NMS)
• Nuveen Missouri Quality Municipal Income Fund (NOM)
• Nuveen Virginia Quality Municipal Income Fund (NPV)
The Funds are registered under the Investment Company Act of 1940 (the “1940 Act”), as amended, as diversified closed-end management investment companies. NKG, NMS and NOM were organized as Massachusetts business trusts on October 26, 2001, April 28, 2014 and March 29, 1993, respectively. NMY, NMT and NPV were organized as Massachusetts business trusts on January 12, 1993.
The end of the reporting period for the Funds is May 31, 2020, and the period covered by these Notes to Financial Statements is the fiscal year ended May 31, 2020 (the “current fiscal period”).
Investment Adviser and Sub-Adviser
The Funds’ investment adviser is Nuveen Fund Advisors, LLC (the “Adviser”), a subsidiary of Nuveen, LLC (“Nuveen”). Nuveen is the investment management arm of Teachers Insurance and Annuity Association of America (TIAA). The Adviser has overall responsibility for management of the Funds, oversees the management of the Funds’ portfolios, manages the Funds’ business affairs and provides certain clerical, bookkeeping and other administrative services, and if necessary, asset allocation decisions. The Adviser has entered into sub-advisory agreements with Nuveen Asset Management, LLC (the “Sub-Adviser”), a subsidiary of the Adviser, under which the Sub-Adviser manages the investment portfolios of the Funds.
Other Matters
The outbreak of the novel coronavirus (“COVID-19”) and subsequent global pandemic began significantly impacting the U.S. and global financial markets and economies during the calendar quarter ended March 31, 2020. The worldwide spread of COVID-19 has created significant uncertainty in the global economy. The duration and extent of COVID-19 over the long-term cannot be reasonably estimated at this time. The ultimate impact of COVID-19 and the extent to which COVID-19 impacts the Fund’s normal course of business, results of operations, investments, and cash flows will depend on future developments, which are highly uncertain and difficult to predict. Management continues to monitor and evaluate this situation.
2. Significant Accounting Policies
The accompanying financial statements were prepared in accordance with accounting principles generally accepted in the United States of America (“U.S. GAAP”), which may require the use of estimates made by management and the evaluation of subsequent events. Actual results may differ from those estimates. Each Fund is an investment company and follows the accounting guidance in the Financial Accounting Standards Board (“FASB”) Accounting Standards Codification 946, Financial Services—Investment Companies. The net asset value (“NAV”) for financial reporting purposes may differ from the NAV for processing security and common share transactions. The NAV for financial reporting purposes includes security and common share transactions through the date of the report. Total return is computed based on the NAV used for processing security and common share transactions. The following is a summary of the significant accounting policies consistently followed by the Funds.
Compensation
The Funds pay no compensation directly to those of its trustees who are affiliated with the Adviser or to its officers, all of whom receive remuneration for their services to the Funds from the Adviser or its affiliates. The Funds’ Board of Trustees (“the Board”) has adopted a deferred compensation plan for independent trustees that enables trustees to elect to defer receipt of all or a portion of the annual compensation they are entitled to receive from certain Nuveen-advised funds. Under the plan, deferred amounts are treated as though equal dollar amounts had been invested in shares of select Nuveen-advised funds.
103
Notes to Financial Statements (continued)
Distributions to Common Shareholders
Distributions to common shareholders are recorded on the ex-dividend date. The amount, character and timing of distributions are determined in accordance with federal income tax regulations, which may differ from U.S. GAAP.
Indemnifications
Under the Funds’ organizational documents, their officers and trustees are indemnified against certain liabilities arising out of the performance of their duties to the Funds. In addition, in the normal course of business, the Funds enter into contracts that provide general indemnifications to other parties. The Funds’ maximum exposure under these arrangements is unknown as this would involve future claims that may be made against the Funds that have not yet occurred. However, the Funds have not had prior claims or losses pursuant to these contracts and expect the risk of loss to be remote.
Investments and Investment Income
Securities transactions are accounted for as of the trade date for financial reporting purposes. Realized gains and losses on securities transactions are based upon the specific identification method. Investment income is comprised of interest income, which is recorded on an accrual basis and includes the accretion of discounts and the amortization of premiums for financial reporting purposes. Investment income also reflects payment-in-kind (“PIK”) interest and paydown gains and losses, if any. PIK interest represents income received in the form of securities in lieu of cash.
Netting Agreements
In the ordinary course of business, the Funds may enter into transactions subject to enforceable International Swaps and Derivatives Association, Inc. (ISDA) master agreements or other similar arrangements (“netting agreements”). Generally, the right to offset in netting agreements allows each Fund to offset certain securities and derivatives with a specific counterparty, when applicable, as well as any collateral received or delivered to that counterparty based on the terms of the agreements. Generally, each Fund manages its cash collateral and securities collateral on a counterparty basis.
The Funds’ investments subject to netting agreements as of the end of the reporting period, if any, are further described in Note 4 – Portfolio Securities and Investments in Derivatives.
New Accounting Pronouncements and Rule Issuances
FASB Accounting Standards Update (“ASU”) 2017-08 (“ASU 2017-08”) Premium Amortization on Purchased Callable Debt Securities
The FASB has issued ASU 2017-08, which shortens the premium amortization period for purchased non-contingently callable debt securities. ASU 2017-08 specifies that the premium amortization period ends at the earliest call date, for purchased non-contingently callable debt securities. ASU 2017-08 effective for fiscal years, and interim periods within those fiscal years, beginning after December 15, 2018. During the current fiscal period, ASU 2017-08 became effective for the Funds and it did not have a material impact on the Funds’ financial statements.
Fair Value Measurement: Disclosure Framework
During August 2018, the FASB issued ASU 2018-13 (“ASU 2018-13”), Fair Value Measurement: Disclosure Framework – Changes to the Disclosure Requirements for Fair Value Measurements. ASU 2018-13 modifies the disclosures required by Topic 820, Fair Value Measurements. The amendments in ASU 2018-13 are effective for all entities for fiscal years, and interim periods within those fiscal years, beginning after December 15, 2019. Management early implemented this guidance and it did not have a material impact on the Funds’ financial statements.
Reference Rate Reform
In March 2020, FASB issued ASU 2020-04, Reference Rate Reform: Facilitation of the Effects of Reference Rate Reform on Financial Reporting. The main objective of the new guidance is to provide relief to companies that will be impacted by the expected change in benchmark interest rates at the end of 2021, when participating banks will no longer be required to submit London Interbank Offered Rate (LIBOR) quotes by the UK Financial Conduct Authority (FCA). The new guidance allows companies to, provided the only change to existing contracts are a change to an approved benchmark interest rate, account for modifications as a continuance of the existing contract without additional analysis. For new and existing contracts, the Funds may elect to apply the amendments as of March 12, 2020 through December 31, 2022. Management has not yet elected to apply the amendments, but is currently assessing the impact of the ASU’s adoption to the Funds’ financial statements and various filings.
3. Investment Valuation and Fair Value Measurements
The fair valuation input levels as described below are for fair value measurement purposes.
The Funds’ investments in securities are recorded at their estimated fair value. Fair value is defined as the price that would be received upon selling an investment or transferring a liability in an orderly transaction to an independent buyer in the principal or most advantageous market for the investment. A three-tier hierarchy is used to maximize the use of observable market data and minimize the use of unobservable inputs and to establish classification of fair value measurements for disclosure purposes. Observable inputs reflect the assumptions market participants would use in pricing the asset or
104
liability. Observable inputs are based on market data obtained from sources independent of the reporting entity. Unobservable inputs reflect the reporting entity’s own assumptions about the assumptions market participants would use in pricing the asset or liability. Unobservable inputs are based on the best information available in the circumstances. The following is a summary of the three-tiered hierarchy of valuation input levels.
Level 1 – Inputs are unadjusted and prices are determined using quoted prices in active markets for identical securities.
Level 2 – Prices are determined using other significant observable inputs (including quoted prices for similar securities, interest rates, credit spreads, etc.).
Level 3 – Prices are determined using significant unobservable inputs (including management’s assumptions in determining the fair value of investments).
Prices of fixed income securities are provided by an independent pricing service (“pricing service”) approved by the Board. The pricing service establishes a security’s fair value using methods that may include consideration of the following: yields or prices of investments of comparable quality, type of issue, coupon, maturity and rating, market quotes or indications of value from security dealers, evaluations of anticipated cash flows or collateral, general market conditions and other information and analysis, including the obligor’s credit characteristics considered relevant. These securities are generally classified as Level 2. In pricing certain securities, particularly less liquid and lower quality securities, the pricing service may consider information about a security, its issuer or market activity, provided by the Adviser. These securities are generally classified as Level 2 or Level 3 depending on the observability of the significant inputs.
Certain securities may not be able to be priced by the pre-established pricing methods as described above. Such securities may be valued by the Board and/or its appointee at fair value. These securities generally include, but are not limited to, restricted securities (securities which may not be publicly sold without registration under the Securities Act of 1933, as amended) for which a pricing service is unable to provide a market price; securities whose trading has been formally suspended; debt securities that have gone into default and for which there is no current market quotation; a security whose market price is not available from a pre-established pricing source; a security with respect to which an event has occurred that is likely to materially affect the value of the security after the market has closed but before the calculation of a Fund’s NAV (as may be the case in non-U.S. markets on which the security is primarily traded) or make it difficult or impossible to obtain a reliable market quotation; and a security whose price, as provided by the pricing service, is not deemed to reflect the security’s fair value. As a general principle, the fair value of a security would appear to be the amount that the owner might reasonably expect to receive for it in a current sale. A variety of factors may be considered in determining the fair value of such securities, which may include consideration of the following: yields or prices of investments of comparable quality, type of issue, coupon, maturity and rating, market quotes or indications of value from security dealers, evaluations of anticipated cash flows or collateral, general market conditions and other information and analysis, including the obligor’s credit characteristics considered relevant. These securities are generally classified as Level 2 or Level 3 depending on the observability of the significant inputs. Regardless of the method employed to value a particular security, all valuations are subject to review by the Board and/or its appointee.
The inputs or methodologies used for valuing securities are not an indication of the risks associated with investing in those securities. The following is a summary of each Fund’s fair value measurements as of the end of the reporting period:
| | | | | | | | | | | | | |
| NKG | | Level 1 | | | Level 2 | | | Level 3 | | | Total | |
Long-Term Investments*: | | | | | | | | | | | | |
| Municipal Bonds | | $ | — | | | $ | 219,397,054 | | | $ | 77,966 | ** | | $ | 219,475,020 | |
Short-Term Investments*: | | | | | | | | | | | | | | | | |
| Municipal Bonds | | | — | | | | — | | | | 147,195 | ** | | | 147,195 | |
Total | | $ | — | | | $ | 219,397,054 | | | $ | 225,161 | | | $ | 219,622,215 | |
| NMY | | | | | | | | | | | | | | | | |
Long-Term Investments*: | | | | | | | | | | | | | | | | |
| Municipal Bonds | | $ | — | | | $ | 526,951,937 | | | $ | — | | | $ | 526,951,937 | |
| NMT | | | | | | | | | | | | | | | | |
Long-Term Investments*: | | | | | | | | | | | | | | | | |
| Municipal Bonds | | $ | — | | | $ | 205,986,380 | | | $ | — | | | $ | 205,986,380 | |
| NMS | | | | | | | | | | | | | | | | |
Long-Term Investments*: | | | | | | | | | | | | | | | | |
| Municipal Bonds | | $ | — | | | $ | 133,222,440 | | | $ | — | | | $ | 133,222,440 | |
Short-Term Investments*: | | | | | | | | | | | | | | | | |
| Municipal Bonds | | | — | | | | 2,615,000 | | | | — | | | | 2,615,000 | |
Total | | $ | — | | | $ | 135,837,440 | | | $ | — | | | $ | 135,837,440 | |
105
Notes to Financial Statements (continued)
| | | | | | | | | | | | | |
| NOM | | Level 1 | | | Level 2 | | | Level 3 | | | Total | |
Long-Term Investments*: | | | | | | | | | | | | |
| Municipal Bonds | | $ | — | | | $ | 50,021,398 | | | $ | — | | | $ | 50,021,398 | |
| NPV | | | | | | | | | | | | | | | | |
Long-Term Investments*: | | | | | | | | | | | | | | | | |
| Municipal Bonds | | $ | — | | | $ | 401,925,794 | | | $ | — | | | $ | 401,925,794 | |
*
| Refer to the Fund’s Portfolio of Investments for industry classifications. |
**
| Refer to the Fund’s Portfolio of Investments for securities classified as Level 3. |
4. Portfolio Securities and Investments in Derivatives
Portfolio Securities
Inverse Floating Rate Securities
Each Fund is authorized to invest in inverse floating rate securities. An inverse floating rate security is created by depositing a municipal bond (referred to as an “Underlying Bond”), typically with a fixed interest rate, into a special purpose tender option bond (“TOB”) trust (referred to as the “TOB Trust”) created by or at the direction of one or more Funds. In turn, the TOB Trust issues (a) floating rate certificates (referred to as “Floaters”) in face amounts equal to some fraction of the Underlying Bond’s par amount or market value, and (b) an inverse floating rate certificate (referred to as an “Inverse Floater”) that represents all remaining or residual interest in the TOB Trust. Floaters typically pay short-term tax-exempt interest rates to third parties who are also provided a right to tender their certificate and receive its par value, which may be paid from the proceeds of a remarketing of the Floaters, by a loan to the TOB Trust from a third party liquidity provider (“Liquidity Provider”), or by the sale of assets from the TOB Trust. The Inverse Floater is issued to a long term investor, such as one or more of the Funds. The income received by the Inverse Floater holder varies inversely with the short-term rate paid to holders of the Floaters, and in most circumstances the Inverse Floater holder bears substantially all of the Underlying Bond’s downside investment risk and also benefits disproportionately from any potential appreciation of the Underlying Bond’s value. The value of an Inverse Floater will be more volatile than that of the Underlying Bond because the interest rate is dependent on not only the fixed coupon rate of the Underlying Bond but also on the short-term interest paid on the Floaters, and because the Inverse Floater essentially bears the risk of loss (and possible gain) of the greater face value of the Underlying Bond.
The Inverse Floater held by a Fund gives the Fund the right to (a) cause the holders of the Floaters to tender their certificates at par (or slightly more than par in certain circumstances), and (b) have the trustee of the TOB Trust (the “Trustee”) transfer the Underlying Bond held by the TOB Trust to the Fund, thereby collapsing the TOB Trust.
The Fund may acquire an Inverse Floater in a transaction where it (a) transfers an Underlying Bond that it owns to a TOB Trust created by a third party or (b) transfers an Underlying Bond that it owns, or that it has purchased in a secondary market transaction for the purpose of creating an Inverse Floater, to a TOB Trust created at its direction, and in return receives the Inverse Floater of the TOB Trust (referred to as a “self-deposited Inverse Floater”). A Fund may also purchase an Inverse Floater in a secondary market transaction from a third party creator of the TOB Trust without first owning the Underlying Bond (referred to as an “externally-deposited Inverse Floater”).
An investment in a self-deposited Inverse Floater is accounted for as a “financing” transaction (i.e., a secured borrowing). For a self-deposited Inverse Floater, the Underlying Bond deposited into the TOB Trust is identified in the Fund’s Portfolio of Investments as “(UB) – Underlying bond of an inverse floating rate trust reflected as a financing transaction,” with the Fund recognizing as liabilities, labeled “Floating rate obligations” on the Statement of Assets and Liabilities, (a) the liquidation value of Floaters issued by the TOB Trust, and (b) the amount of any borrowings by the TOB Trust from a Liquidity Provider to enable the TOB Trust to purchase outstanding Floaters in lieu of a remarketing. In addition, the Fund recognizes in “Investment Income” the entire earnings of the Underlying Bond, and recognizes (a) the interest paid to the holders of the Floaters or on the TOB Trust’s borrowings, and (b) other expenses related to remarketing, administration, trustee, liquidity and other services to a TOB Trust, as a component of “Interest expense and amortization of offering costs” on the Statement of Operations. Earnings due from the Underlying Bond and interest due to the holders of the Floaters as of the end of the reporting period are recognized as components of “Receivable for interest” and “Payable for interest” on the Statement of Assets and Liabilities, respectively.
In contrast, an investment in an externally-deposited Inverse Floater is accounted for as a purchase of the Inverse Floater and is identified in the Fund’s Portfolio of Investments as “(IF) – Inverse floating rate investment.” For an externally-deposited Inverse Floater, a Fund’s Statement of Assets and Liabilities recognizes the Inverse Floater and not the Underlying Bond as an asset, and the Fund does not recognize the Floaters, or any related borrowings from a Liquidity Provider, as a liability. Additionally, the Fund reflects in “Investment Income” only the net amount of earnings on the Inverse Floater (net of the interest paid to the holders of the Floaters or the Liquidity Provider as lender, and the expenses of the Trust), and does not show the amount of that interest paid or the expenses of the TOB Trust as described above as interest expense on the Statement of Operations.
Fees paid upon the creation of a TOB Trust for self-deposited Inverse Floaters and externally-deposited Inverse Floaters are recognized as part of the cost basis of the Inverse Floater and are capitalized over the term of the TOB Trust.
106
As of the end of the reporting period, the aggregate value of Floaters issued by each Fund’s TOB Trust for self-deposited Inverse Floaters and externally-deposited Inverse Floaters was as follows:
| | | | | | | | | | | | | | | | | | | |
| Floating Rate Obligations Outstanding | | NKG | | | NMY | | | NMT | | | NMS | | | NOM | | | NPV | |
Floating rate obligations: self-deposited Inverse Floaters | | $ | 19,600,000 | | | $ | 28,405,000 | | | $ | — | | | $ | — | | | $ | 600,000 | | | $ | 20,350,000 | |
Floating rate obligations: externally-deposited Inverse Floaters | | | — | | | | — | | | | 7,325,000 | | | | — | | | | — | | | | — | |
Total | | $ | 19,600,000 | | | $ | 28,405,000 | | | $ | 7,325,000 | | | $ | — | | | $ | 600,000 | | | $ | 20,350,000 | |
During the current fiscal period, the average amount of Floaters (including any borrowings from a Liquidity Provider) outstanding, and average annual interest rate and fees related to self-deposited Inverse Floaters, were as follows:
| | | | | | | | | | | | | | | | | | | |
| Self-Deposited Inverse Floaters | | NKG | | | NMY | | | NMT | | | NMS | | | NOM | | | NPV | |
Average floating rate obligations outstanding | | $ | 19,600,000 | | | $ | 28,405,000 | | | $ | — | | | $ | — | | | $ | 600,000 | | | $ | 20,350,000 | |
Average annual interest rate and fees | | | 1.75 | % | | | 1.78 | % | | | — | % | | | — | % | | | 1.74 | % | | | 1.81 | % |
TOB Trusts are supported by a liquidity facility provided by a Liquidity Provider pursuant to which the Liquidity Provider agrees, in the event that Floaters are (a) tendered to the Trustee for remarketing and the remarketing does not occur, or (b) subject to mandatory tender pursuant to the terms of the TOB Trust agreement, to either purchase Floaters or to provide the Trustee with an advance from a loan facility to fund the purchase of Floaters by the TOB Trust. In certain circumstances, the Liquidity Provider may otherwise elect to have the Trustee sell the Underlying Bond to retire the Floaters that were tendered and not remarketed prior to providing such a loan. In these circumstances, the Liquidity Provider remains obligated to provide a loan to the extent that the proceeds of the sale of the Underlying Bond is not sufficient to pay the purchase price of the Floaters.
The size of the commitment under the loan facility for a given TOB Trust is at least equal to the balance of that TOB Trust’s outstanding Floaters plus any accrued interest. In consideration of the loan facility, fee schedules are in place and are charged by the Liquidity Provider(s). Any loans made by the Liquidity Provider will be secured by the purchased Floaters held by the TOB Trust. Interest paid on any outstanding loan balances will be effectively borne by the Fund that owns the Inverse Floaters of the TOB Trust that has incurred the borrowing and may be at a rate that is greater than the rate that would have been paid had the Floaters been successfully remarketed.
As described above, any amounts outstanding under a liquidity facility are recognized as a component of “Floating rate obligations” on the Statement of Assets and Liabilities by the Fund holding the corresponding Inverse Floaters issued by the borrowing TOB Trust. As of the end of the reporting period, there were no loans outstanding under such facilities for any of the Funds as of the end of the reporting period.
Each Fund may also enter into shortfall and forbearance agreements (sometimes referred to as a “recourse arrangement”) (TOB Trusts involving such agreements are referred to herein as “Recourse Trusts”), under which a Fund agrees to reimburse the Liquidity Provider for the Trust’s Floaters, in certain circumstances, for the amount (if any) by which the liquidation value of the Underlying Bond held by the TOB Trust may fall short of the sum of the liquidation value of the Floaters issued by the TOB Trust plus any amounts borrowed by the TOB Trust from the Liquidity Provider, plus any shortfalls in interest cash flows. Under these agreements, a Fund’s potential exposure to losses related to or on an Inverse Floater may increase beyond the value of the Inverse Floater as a Fund may potentially be liable to fulfill all amounts owed to holders of the Floaters or the Liquidity Provider. Any such shortfall amount in the aggregate is recognized as “Unrealized depreciation on Recourse Trusts” on the Statement of Assets and Liabilities.
As of the end of the reporting period, each Fund’s maximum exposure to the Floaters issued by Recourse Trusts for self-deposited Inverse Floaters and externally-deposited Inverse Floaters was as follows:
| | | | | | | | | | | | | | | | | | | |
| Floating Rate Obligations – Recourse Trusts | | NKG | | | NMY | | | NMT | | | NMS | | | NOM | | | NPV | |
Maximum exposure to Recourse Trusts: self-deposited Inverse Floaters | | $ | 19,600,000 | | | $ | 28,405,000 | | | $ | — | | | $ | — | | | $ | 600,000 | | | $ | 20,350,000 | |
Maximum exposure to Recourse Trusts: externally-deposited Inverse Floaters | | | — | | | | — | | | | 7,325,000 | | | | — | | | | — | | | | — | |
Total | | $ | 19,600,000 | | | $ | 28,405,000 | | | $ | 7,325,000 | | | $ | — | | | $ | 600,000 | | | $ | 20,350,000 | |
Zero Coupon Securities
A zero coupon security does not pay a regular interest coupon to its holders during the life of the security. Income to the holder of the security comes from accretion of the difference between the original purchase price of the security at issuance and the par value of the security at maturity and is effectively paid at maturity. The market prices of zero coupon securities generally are more volatile than the market prices of securities that pay interest periodically.
107
Notes to Financial Statements (continued)
Investment Transactions
Long-term purchases and sales (including maturities) during the current fiscal period were as follows:
| | | | | | | | | | | | | | | | | | | |
| | NKG | | | NMY | | | NMT | | | NMS | | | NOM | | | NPV | |
Purchases | | $ | 22,939,287 | | | $ | 70,264,293 | | | $ | 22,791,921 | | | $ | 16,262,466 | | | $ | 4,895,596 | | | $ | 74,468,363 | |
Sales and maturities | | | 19,748,331 | | | | 82,961,678 | | | | 23,460,638 | | | | 17,014,297 | | | | 5,443,381 | | | | 72,338,096 | |
The Funds may purchase securities on a when-issued or delayed-delivery basis. Securities purchased on a when-issued or delayed-delivery basis may have extended settlement periods; interest income is not accrued until settlement date. Any securities so purchased are subject to market fluctuation during this period. The Funds have earmarked securities in their portfolios with a current value at least equal to the amount of the when issued/ delayed-delivery purchase commitments. If the Funds have outstanding when-issued/delayed-delivery purchases commitments as of the end of the reporting period, such amounts are recognized on the Statement of Assets and Liabilities.
Investments in Derivatives
In addition to the inverse floating rate securities in which each Fund may invest, which are considered portfolio securities for financial reporting purposes, each Fund is authorized to invest in certain other derivative instruments such as futures, options and swap contracts. Each Fund limits its investments in futures, options on futures and swap contracts to the extent necessary for the Adviser to claim exclusion from registration by the Commodity Futures Trading Commission as a commodity pool operator with respect to the Fund. The Funds record derivative instruments at fair value, with changes in fair value recognized on the Statement of Operations, when applicable. Even though the Funds’ investments in derivatives may represent economic hedges, they are not considered to be hedge transactions for financial reporting purposes.
Although the Funds are authorized to invest in derivative instruments and may do so in the future, they did not make any such investments during the current fiscal period.
Market and Counterparty Credit Risk
In the normal course of business each Fund may invest in financial instruments and enter into financial transactions where risk of potential loss exists due to changes in the market (market risk) or failure of the other party to the transaction to perform (counterparty credit risk). The potential loss could exceed the value of the financial assets recorded on the financial statements. Financial assets, which potentially expose each Fund to counterparty credit risk, consist principally of cash due from counterparties on forward, option and swap transactions, when applicable. The extent of each Fund’s exposure to counterparty credit risk in respect to these financial assets approximates their carrying value as recorded on the Statement of Assets and Liabilities.
Each Fund helps manage counterparty credit risk by entering into agreements only with counterparties the Adviser believes have the financial resources to honor their obligations and by having the Adviser monitor the financial stability of the counterparties. Additionally, counterparties may be required to pledge collateral daily (based on the daily valuation of the financial asset) on behalf of each Fund with a value approximately equal to the amount of any unrealized gain above a pre-determined threshold. Reciprocally, when each Fund has an unrealized loss, the Funds have instructed the custodian to pledge assets of the Funds as collateral with a value approximately equal to the amount of the unrealized loss above a pre-determined threshold. Collateral pledges are monitored and subsequently adjusted if and when the valuations fluctuate, either up or down, by at least the pre-determined threshold amount.
5. Fund Shares
Common Shares
Common Shares Equity Shelf Programs and Offering Costs
NMS has filed a registration statement with the Securities and Exchange Commission (“SEC”) authorizing the Fund to issue additional common shares through one or more equity shelf programs (“Shelf Offering”), which became effective with the SEC during a prior fiscal period.
Under this Shelf Offering, the Fund, subject to market conditions, may raise additional equity capital by issuing additional common shares from time to time in varying amounts and by different offering methods at a net price at or above the Fund’s NAV per common share. In the event the Fund’s Shelf Offering registration statement is no longer current, the Fund may not issue additional common shares until a post-effective amendment to the registration statement has been filed with the SEC.
108
Additional authorized common shares, common shares sold and offering proceeds, net of offering costs under the Fund’s Shelf Offering during the Fund’s current and prior fiscal period were as follows:
| | | | | | | |
| | NMS | |
| | Year | | | Year | |
| | Ended | | | Ended | |
| | 5/31/20 | | | 5/31/19 | |
Additional authorized common shares | | | — | | | | 500,000 | * |
Common shares sold | | | — | | | | — | |
Offering proceeds, net of offering costs | | $ | — | | | $ | — | |
* Represents additional authorized common shares for the period June 1, 2018 through March 29, 2019.
Costs incurred by the Fund in connection with its initial shelf registrations are recorded as a prepaid expense and recognized as “Deferred offering costs” on the Statement of Assets and Liabilities. These costs are amortized pro rata as shares are sold and are recognized as a component of “Proceeds from shelf offering, net of offering costs” on the Statement of Changes in Net Assets. Any deferred offering costs remaining one year after the effectiveness of the initial shelf registration will be expensed. Costs incurred by the Fund to keep the shelf registration current are expensed as incurred and recognized as a component of “Other expenses” on the Statement of Operations.
Common Share Transactions
Transactions in common shares for the Funds during the Funds’ current and prior fiscal period, where applicable. were as follows:
| | | | | | | | | | | | | | | | | | | |
| | NKG | | | NMY | | | NMT | |
| | Year | | | Year | | | Year | | | Year | | | Year | | | Year | |
| | Ended | | | Ended | | | Ended | | | Ended | | | Ended | | | Ended | |
| | 5/31/20 | | | 5/31/19 | | | 5/31/20 | | | 5/31/19 | | | 5/31/20 | | | 5/31/19 | |
| | |
Common shares: | | | | | | | | | | | | | | | | | | |
| Repurchased and retired | | | — | | | | (149,500 | ) | | | — | | | | (247,500 | ) | | | — | | | | (26,148 | ) |
| | |
Weighted average common share: | | | | | | | | | | | | | | | | | | | | | | | | |
| Price per share repurchased and retired | | | — | | | $ | 10.97 | | | | — | | | $ | 11.77 | | | | — | | | $ | 11.67 | |
| Discount per share repurchased and retired | | | — | | | | 15.65 | % | | | — | | | | 15.60 | % | | | — | | | | 15.20 | % |
| | |
| | NMS | | | NOM | | | NPV | |
| | Year | | | Year | | | Year | | | Year | | | Year | | | Year | |
| | Ended | | | Ended | | | Ended | | | Ended | | | Ended | | | Ended | |
| | 5/31/20 | | | 5/31/19 | | | 5/31/20 | | | 5/31/19 | | | 5/31/20 | | | 5/31/19 | |
| | |
Common shares: | | | | | | | | | | | | | | | | | | | | | | | | |
| Issued to shareholders due to reinvestment of distributions | | | — | | | | — | | | | 1,271 | | | | — | | | | — | | | | — | |
| Repurchased and retired | | | — | | | | (10,000 | ) | | | — | | | | — | | | | — | | | | (55,000 | ) |
| | |
Weighted average common share: | | | | | | | | | | | | | | | | | | | | | | | | |
| Price per share repurchased and retired | | | — | | | $ | 12.08 | | | | — | | | | — | | | | — | | | $ | 11.60 | |
| Discount per share repurchased and retired | | | — | | | | 15.12 | % | | | — | | | | — | | | | — | | | | 15.41 | % |
Preferred Shares
Adjustable Rate MuniFund Term Preferred Shares
The following Funds have issued and have outstanding Adjustable Rate MuniFund Term Preferred (“AMTP”) Shares, with a $100,000 liquidation preference per share. AMTP Shares are issued via private placement and are not publically available.
The details of the each Funds’ AMTP Shares outstanding as of the end of the reporting period, were as follows:
| | | | | |
| | | | Liquidation |
| | | | Preference, |
| | Shares | Liquidation | net of deferred |
| Fund | Series | Outstanding | Preference | offering costs |
| NKG | 2028 | 585 | $58,500,000 | $58,436,706 |
| NMY | 2028 | 1,820 | $182,000,000 | $181,896,908 |
| NMS | 2028 | 528 | $52,800,000 | $52,755,713 |
109
Notes to Financial Statements (continued)
Each Fund is obligated to redeem its AMTP Shares by the date as specified in its offering document (“Term Redemption Date”), unless earlier redeemed by the Fund. AMTP Shares are subject to optional and mandatory redemption in certain circumstances. The AMTP Shares may be redeemed at the option of the Fund, subject to payment of premium for approximately six months following the date of issuance (“Premium Expiration Date”), and at the redemption price per share thereafter. The redemption price per share is equal to the sum of the liquidation preference per share plus any accumulated but unpaid dividends.
AMTP Shares are short-term or short/intermediate-term instruments that pay a variable dividend rate tied to a short-term index, plus an additional fixed “spread” amount which is initially established at the time of issuance and may be adjusted in the future based upon a mutual agreement between the majority owner and the Fund. From time-to-time the majority owner may propose to the Fund an adjustment to the dividend rate. Should the majority owner and the Fund fail to agree upon an adjusted dividend rate, and such proposed dividend rate adjustment is not withdrawn, the Fund will be required to redeem all outstanding shares upon the end of a notice period.
In addition, the Fund may be obligated to redeem a certain amount of the AMTP Shares if the Fund fails to maintain certain asset coverage and leverage ratio requirements and such failures are not cured by the applicable cure date. The Term Redemption Date and Premium Expiration Date for each Fund’s AMTP Shares are as follows:
| | | | | |
| Notice | | Term | Premium |
| Fund | Period | Series | Redemption Date | Expiration Date |
| NKG | 540-day | 2028 | December 1 2028* | February 13, 2019 |
| NMY | 360-day | 2028 | December 1 2028* | November 30, 2019 |
| NMS | 360-day | 2028 | December 1 2028* | November 30, 2019 |
* Subject to early termination by either the Fund or the holder.
The average liquidation preference of AMTP Shares outstanding and annualized dividend rate for each Fund during the current fiscal period were as follows:
| | | | | | | | | | |
| | NKG | | | NMY | | | NMS | |
Average liquidation preference of AMTP shares outstanding | | $ | 58,500,000 | | | $ | 182,000,000 | | | $ | 52,800,000 | |
Annualized dividend rate | | | 2.12 | % | | | 2.18 | % | | | 2.18 | % |
AMTP Shares are subject to restrictions on transfer, generally do not trade, and market quotations are generally not available. The fair value of AMTP Shares is expected to be approximately their liquidation preference so long as the fixed “spread” on the AMTP Shares remains roughly in line with the “spread” being demanded by investors on instruments having similar terms in the current market environment. In present market conditions, the Funds’ Adviser has determined that the fair value of AMTP Shares is approximately their liquidation preference, but their fair value could vary if market conditions change materially. For financial reporting purposes, the liquidation preference of AMTP Shares is a liability and is recognized as a component of “Adjustable Rate MuniFund Term Preferred (“AMTP”) Shares, net of deferred offering costs” on the Statement of Assets and Liabilities.
AMTP Share dividends are treated as interest payments for financial reporting purposes. Unpaid dividends on AMTP Shares are recognized as a component of “Interest payable” on the Statement of Assets and Liabilities. Dividends accrued on AMTP Shares are recognized as a component of “Interest expense and amortization of offering costs” on the Statement of Operations.
Costs incurred in connection with each Fund’s offering of AMTP Shares were recorded as deferred charges, which are amortized over the life of the shares and are recognized as components of “Adjustable Rate MuniFund Term Preferred (“AMTP”) Shares, net of deferred offering costs” on the Statement of Assets and Liabilities and “Interest expense and amortization of offering costs” on the Statement of Operations.
MuniFund Preferred Shares
NOM has issued and has outstanding MuniFund Preferred (“MFP”) Shares, with a $100,000 liquidation preference per share. These MFP Shares were issued via private placement and are not publicly available.
The Fund is obligated to redeem its MFP Shares by the date as specified in its offering documents (“Term Redemption Date”), unless earlier redeemed by the Fund. MFP Shares are initially issued in a pre-specified mode, however, MFP Shares can be subsequently designated as an alternative mode at a later date at the discretion of the Fund. The modes within MFP Shares detail the dividend mechanics and are described as follows. At a subsequent date, the Fund may establish additional mode structures with the MFP Share.
| • | Variable Rate Remarketed Mode (“VRRM”) – Dividends for MFP Shares within this mode will be established by a remarketing agent; therefore, the market value of the MFP Shares is expected to approximate its liquidation preference. Shareholders have the ability to request a best- efforts tender of its shares upon seven days notice. If the remarketing agent is unable to identify an alternative purchaser, the shares will be retained by the shareholder requesting tender and the subsequent dividend rate will increase to its step-up dividend rate. If after one consecutive year of unsuccessful remarketing attempts, the Fund will be required to designate an alternative mode or redeem the shares. |
110
The Fund will pay a remarketing fee on the aggregate principal amount of all MFP shares while designated in VRRM. Payments made by the Fund to the remarketing agent are recognized as “Remarketing fees” on the Statement of Operations.
| • | Variable Rate Mode (“VRM”) – Dividends for MFP Shares designated in this mode are based upon a short-term index plus an additional fixed “spread” amount established at the time of issuance or renewal / conversion of its mode. At the end of the period of the mode, the Fund will be required to either extend the term of the mode, designate an alternative mode or redeem the MFP Shares.
The fair value of MFP Shares while in VRM are expected to approximate their liquidation preference so long as the fixed “spread” on the shares remains roughly in line with the “spread’ being demanded by investors on instruments having similar terms in the current market. In current market conditions, the Adviser has determined that the fair value of the shares are approximately their liquidation preference, but their fair value could vary if market conditions change materially. |
| • | Variable Rate Demand Mode (“VRDM”) – Dividends for MFP Shares designated in this mode will be established by a remarketing agent; therefore, the market value of the MFP Shares is expected to approximate its liquidation preference. While in this mode, shares will have an unconditional liquidity feature that enable its shareholders to require a liquidity provider, which the Fund has entered into a contractual agreement, to purchase shares in the event that the shares are not able to be successfully remarketed. In the event that shares within this mode are unable to be successfully remarketed and are purchased by the liquidity provider, the dividend rate will be the maximum rate which is designed to escalate according to a specified schedule in order to enhance the remarketing agent’s ability to successfully remarket the shares.
The Fund is required to redeem any shares that are still owned by a liquidity provider after six months of continuous, unsuccessful remarketing. The Fund will pay a liquidity and remarketing fee on the aggregate principal amount of all MFP Shares while within VRDM. Payments made by the Fund to the liquidity provider and remarketing agent are recognized as “Liquidity fees” and “Remarketing fees”, respectively, on the Statement of Operations. |
For financial reporting purposes, the liquidation preference of MFP Shares is recorded as a liability and is recognized as a component of “MuniFund Preferred (“MFP”) Shares, net of deferred offering costs” on the Statement of Assets and Liabilities. Dividends on the MFP shares are treated as interest payments for financial reporting purposes. Unpaid dividends on MFP shares are recognized as a component on “Interest payable” on the Statement of Assets and Liabilities. Dividends accrued on MFP Shares are recognized as a component of “Interest expense and amortization of offering costs” on the Statement of Operations.
Subject to certain conditions, MFP Shares may be redeemed, in whole or in part, at any time at the option of the Fund. The Fund may also be required to redeem certain MFP shares if the Fund fails to maintain certain asset coverage requirements and such failures are not cured by the applicable cure date. The redemption price per share in all circumstances is equal to the liquidation preference per share plus any accumulated but unpaid dividends.
Costs incurred in connection with the Fund’s offering of MFP Shares were recorded as a deferred charge and are being amortized over the life of the shares. These offering costs are recognized as a component of “MuniFund Preferred (“MFP”) Shares, net of deferred offering costs” on the Statement of Assets and Liabilities and “Interest expense and amortization of offering costs” on the Statement of Operations.
As of the end of the reporting period, details of the Fund’s MFP Shares outstanding were as follows:
| | | | | | | | |
| | | | Liquidation | | | |
| | | | Preference, | Term | | Mode |
| | Shares | Liquidation | net of deferred | Redemption | | Termination |
| Fund | Series | Outstanding | Preference | offering costs | Date | Mode | Date |
| NOM | A | 180 | $18,000,000 | $17,779,188 | October 1, 2047 | VRM | October 12, 2022 |
The average liquidation preference of MFP Shares outstanding and annualized dividend rate for the Fund during the current fiscal period were as follows:
| | |
| NOM |
Average liquidation preference of MFP Shares outstanding | $18,000,000 |
Annualized dividend rate | 2.22% |
Variable Rate Demand Preferred Shares
The following Funds have issued and have outstanding Variable Rate Demand Preferred (“VRDP”) Shares, with a $100,000 liquidation preference per share. VRDP Shares are issued via private placement and are not publicly available.
111
| |
| Notes to Financial Statements (continued) |
|
|
As of the end of the reporting period, details of the Funds’ VRDP Shares outstanding were as follows: |
| | | | | Liquidation | | |
| | | | | Preference, | Special Rate | |
| | Shares | Liquidation | Remarketing | net of deferred | Period | |
| Fund | Series | Outstanding | Preference | Fees* | offering costs | Expiration | Maturity |
| NMT | 1 | 740 | $ 74,000,000 | N/A | $ 73,739,043 | March 1, 2047 | March 1, 2047 |
| NPV | 1 | 1,280 | $128,000,000 | N/A | $127,648,200 | July 21, 2021 | August 3, 2043 |
*
| Remarketing fees as a percentage of the aggregate principal amount of all VRDP Shares outstanding for each series. |
| N/A | Not applicable. Series is considered to be Special Rate VRDP and therefore does not pay a remarketing fee. |
VRDP Shares include a liquidity feature that allows VRDP shareholders to have their shares purchased by a liquidity provider with whom the each Fund has contracted in the event that the VRDP Shares are not able to be successfully remarketed. Each Fund is required to redeem any VRDP Shares that are still owned by the liquidity provider after six months of continuous, unsuccessful remarketing. Each Fund pays an annual remarketing fee on the aggregate principal amount of all VRDP Shares outstanding. Each Fund’s VRDP Shares have successfully remarketed since issuance.
Each Fund’s Series 1 VRDP Shares are considered to be Special Rate VRDP, which are sold to institutional investors. During the special rate period, the VRDP Shares will not be remarketed by a remarketing agent, be subject to optional or mandatory tender events, or be supported by a liquidity provider and are not subject to remarketing fees or liquidity fees. During the special rate period, VRDP dividends will be set monthly as a floating rate based on the predetermined formula. Following the initial special rate period, Special Rate VRDP Shares may transition to traditional VRDP Shares with dividends set at weekly remarketings, and be supported by a designated liquidity provider, or the Board may approve a subsequent special rate period.
Dividends on the VRDP Shares (which are treated as interest payments for financial reporting purposes) are set at a rate established by a remarketing agent; therefore, the market value of the VRDP Shares is expected to approximate its liquidation preference. In the event that VRDP Shares are unable to be successfully remarketed, the dividend rate will be the maximum rate which is designed to escalate according to a specified schedule in order to enhance the remarketing agent’s ability to successfully remarket the VRDP Shares.
Subject to certain conditions, VRDP Shares may be redeemed, in whole or in part, at any time at the option of the each Fund. Each Fund may also redeem certain of the VRDP Shares if the Fund fails to maintain certain asset coverage requirements and such failures are not cured by the applicable cure date. The redemption price per share is equal to the sum of the liquidation preference per share plus any accumulated but unpaid dividends.
The average liquidation preference of VRDP Shares outstanding and annualized dividend rate for each Fund during the current fiscal period were as follows:
| | | | | | | |
| | NMT | | | NPV | |
Average liquidation preference of VRDP Shares outstanding | | $ | 74,000,000 | | | $ | 128,000,000 | |
Annualized dividend rate | | | 2.12 | % | | | 2.13 | % |
For financial reporting purposes, the liquidation preference of VRDP Shares is a liability and is recognized as a component of “Variable Rate Demand Preferred (“VRDP”) Shares, net of deferred offering costs” on the Statement of Assets and Liabilities. Unpaid dividends on VRDP Shares are recognized as a component of “Interest payable” on the Statement of Assets and Liabilities, when applicable. Dividends accrued on VRDP Shares are recognized as a component of “Interest expense and amortization of offering costs” on the Statement of Operations. Costs incurred by the Fund in connection with its offerings of VRDP Shares were recorded as a deferred charge, which are amortized over the life of the shares and are recognized as a component of “Variable Rate Demand Preferred (“VRDP”) Shares, net of deferred offering costs” on the Statement of Assets and Liabilities and “Interest expense and amortization of offering costs” on the Statement of Operations. In addition to interest expense, the Fund also pays a per annum liquidity fee to the liquidity provider, as well as a remarketing fee, which are recognized as “Liquidity fees” and “Remarketing fees,” respectively, on the Statement of Operations.
Preferred Share Transactions
Transactions in preferred shares for the Funds during the Funds’ current and prior fiscal period, where applicable, are noted in the following tables.
Transactions in AMTP Shares for the Funds, where applicable, were as follows:
| | | | |
| Year Ended |
| May 31, 2019 |
| NKG | Series | Shares | Amount |
AMTP Shares issued | 2028 | 585 | $58,500,000 |
112
| | | | |
| Year Ended May 31, 2019 |
| NMY | Series | Shares | Amount |
AMTP Shares issued | 2028 | 1,820 | $182,000,000 |
|
| Year Ended May 31, 2019 |
| NMS | Series | Shares | Amount |
AMTP Shares issued | 2028 | 528 | $52,800,000 |
Transactions in VMTP Shares for the Funds, where applicable, were as follows:
| | | | |
| Year Ended May 31, 2019 |
| NKG | Series | Shares | Amount |
VMTP Shares redeemed | 2019 | (820) | $(82,000,000) |
|
| Year Ended May 31, 2019 |
| NMY | Series | Shares | Amount |
VMTP Shares redeemed | 2019 | (1,970) | $(197,000,000) |
|
| Year Ended May 31, 2019 |
| NMS | Series | Shares | Amount |
VMTP Shares redeemed | 2019 | (528) | $(52,800,000) |
6. Income Tax Information
Each Fund is a separate taxpayer for federal income tax purposes. Each Fund intends to distribute substantially all of its net investment income and net capital gains to shareholders and to otherwise comply with the requirements of Subchapter M of the Internal Revenue Code applicable to regulated investment companies. Therefore, no federal income tax provision is required. Furthermore, each Fund intends to satisfy conditions that will enable interest from municipal securities, which is exempt from regular federal and designated state income taxes, to retain such tax-exempt status when distributed to shareholders of the Funds. Net realized capital gains and ordinary income distributions paid by the Funds are subject to federal taxation.
For all open tax years and all major taxing jurisdictions, management of the Funds has concluded that there are no significant uncertain tax positions that would require recognition in the financial statements. Open tax years are those that are open for examination by taxing authorities (i.e., generally the last four tax year ends and the interim tax period since then). Furthermore, management of the Funds is also not aware of any tax positions for which it is reasonably possible that the total amounts of unrecognized tax benefits will significantly change in the next twelve months.
The following information is presented on an income tax basis. Differences between amounts for financial statement and federal income tax purposes are primarily due to timing differences in recognizing taxable market discount, timing differences in recognizing certain gains and losses on investment transactions and the treatment of investments in inverse floating rate securities reflected as financing transactions, if any. To the extent that differences arise that are permanent in nature, such amounts are reclassified within the capital accounts as detailed below. Temporary differences do not require reclassification. Temporary and permanent differences do not impact the NAVs of the Funds.
The table below presents the cost and unrealized appreciation (depreciation) of each Fund’s investment portfolio, as determined on a federal income tax basis, as of May 31, 2020.
| | | | | | | | | | | | | | | | | | | |
| | NKG | | | NMY | | | NMT | | | NMS | | | NOM | | | NPV | |
Tax cost of investments | | $ | 187,426,555 | | | $ | 476,599,224 | | | $ | 193,770,134 | | | $ | 130,019,181 | | | $ | 46,783,663 | | | $ | 356,581,427 | |
Gross unrealized: | | | | | | | | | | | | | | | | | | | | | | | | |
| Appreciation | | $ | 13,494,781 | | | $ | 28,813,829 | | | $ | 12,895,879 | | | $ | 7,621,140 | | | $ | 3,141,661 | | | $ | 27,901,261 | |
| Depreciation | | | (899,143 | ) | | | (6,866,187 | ) | | | (679,633 | ) | | | (1,802,881 | ) | | | (503,928 | ) | | | (2,906,884 | ) |
Net unrealized appreciation (depreciation) of investments | | $ | 12,595,638 | | | $ | 21,947,642 | | | $ | 12,216,246 | | | $ | 5,818,259 | | | $ | 2,637,733 | | | $ | 24,994,377 | |
113
Notes to Financial Statements (continued)
Permanent differences, primarily due to taxable market discount, federal taxes paid, and nondeductible offering costs resulted in reclassifications among the Funds’ components of common share net assets as of May 31, 2020, the Funds’ tax year end.
The tax components of undistributed net tax-exempt income, net ordinary income and net long-term capital gains as of May 31, 2020, the Funds’ tax year end, were as follows:
| | | | | | | |
| NKG | NMY | NMT | NMS | NOM | NPV |
Undistributed net tax-exempt income1 | $617,010 | $1,423,116 | $450,631 | $43,345 | $40,447 | $1,128,419 |
Undistributed net ordinary income2 | 2,024 | 1,776 | — | — | 206 | 1,622 |
Undistributed net long-term capital gains | — | — | — | — | — | — |
1
| Undistributed net tax-exempt income (on a tax basis) has not been reduced for the dividend declared on May 1, 2020, paid on June 1, 2020. |
2
| Net ordinary income consists of taxable market discount income and net short-term capital gains, if any. |
The tax character of distributions paid during the Funds’ tax years ended May 31, 2020 and May 31, 2019 was designated for purposes of the dividends paid deduction as follows:
| | | | | | | |
| 2020 | NKG | NMY | NMT | NMS | NOM | NPV |
Distributions from net tax-exempt income3 | $5,884,220 | $16,213,229 | $4,589,343 | $4,473,912 | $1,532,957 | $12,090,870 |
Distributions from net ordinary income2 | 2,005 | 55,707 | 30,080 | — | 10,708 | 36,820 |
Distributions from net long-term capital gains | — | — | — | — | — | — |
| 2019 | NKG | NMY | NMT | NMS | NOM | NPV |
Distributions from net tax-exempt income | $6,188,258 | $17,010,459 | $6,479,015 | $4,937,092 | $1,628,103 | $12,646,691 |
Distributions from net ordinary income2 | 6,423 | 11,453 | — | — | 11,866 | 7,470 |
Distributions from net long-term capital gains | — | — | — | — | — | — |
2
| Net ordinary income consists of taxable market discount income and net short-term capital gains, if any. |
3
| The Funds hereby designate these amounts paid during the fiscal year ended May 31, 2020, as Exempt Interest Dividends. |
As of May 31, 2020, the Funds’ tax year end, the Funds had unused capital losses carrying forward available for federal income tax purposes to be applied against future capital gains, if any. The capital losses are not subject to expiration.
| | | | | | | |
| NKG | NMY | NMT | NMS | NOM | NPV |
Not subject to expiration: | | | | | | |
| Short-Term | $2,007,608 | $ 7,583,234 | $1,666,131 | $661,263 | $ 515,305 | $ 6,176,787 |
| Long-Term | 2,907,190 | 7,911,493 | 3,400,142 | 250,524 | 733,074 | 10,081,068 |
Total | $4,914,798 | $15,494,727 | $5,066,273 | $911,787 | $1,248,379 | $16,257,855 |
During the Funds’ tax year ended May 31, 2020, NMT utilized $127,911 of its capital loss carryforward.
7. Management Fees and Other Transactions with Affiliates
Management Fees
Each Fund’s management fee compensates the Adviser for overall investment advisory and administrative services and general office facilities. The Sub-Adviser is compensated for its services to the Funds from the management fees paid to the Adviser.
Each Fund’s management fee consists of two components – a fund-level fee, based only on the amount of assets within each individual Fund, and a complex-level fee, based on the aggregate amount of all eligible fund assets managed by the Adviser. This pricing structure enables Fund shareholders to benefit from growth in the assets within their respective Fund as well as from growth in the amount of complex-wide assets managed by the Adviser.
The annual fund-level fee, payable monthly, for each Fund is calculated according to the following schedule:
| | | | |
| Average Daily Managed Assets* | | Fund-Level Fee Rate | |
For the first $125 million | | | 0.4500 | % |
For the next $125 million | | | 0.4375 | |
For the next $250 million | | | 0.4250 | |
For the next $500 million | | | 0.4125 | |
For the next $1 billion | | | 0.4000 | |
For the next $3 billion | | | 0.3750 | |
For managed assets over $5 billion | | | 0.3625 | |
114
The annual complex-level fee, payable monthly, for each Fund is calculated by multiplying the current complex-wide fee rate, determined according to the following schedule by the Fund’s daily managed assets:
| | | | |
| Complex-Level Eligible Asset Breakpoint Level* | | Effective Complex-Level Fee Rate at Breakpoint Level | |
$55 billion | | | 0.2000 | % |
$56 billion | | | 0.1996 | |
$57 billion | | | 0.1989 | |
$60 billion | | | 0.1961 | |
$63 billion | | | 0.1931 | |
$66 billion | | | 0.1900 | |
$71 billion | | | 0.1851 | |
$76 billion | | | 0.1806 | |
$80 billion | | | 0.1773 | |
$91 billion | | | 0.1691 | |
$125 billion | | | 0.1599 | |
$200 billion | | | 0.1505 | |
$250 billion | | | 0.1469 | |
$300 billion | | | 0.1445 | |
* For the complex-level fees, managed assets include closed-end fund assets managed by the Adviser that are attributable to certain types of leverage. For these purposes, leverage includes the funds’ use of preferred stock and borrowings and certain investments in the residual interest certificates (also called inverse floating rate securities) in tender option bond (TOB) trusts, including the portion of assets held by a TOB trust that has been effectively financed by the trust’s issuance of floating rate securities, subject to an agreement by the Adviser as to certain funds to limit the amount of such assets for determining managed assets in certain circumstances. The complex-level fee is calculated based upon the aggregate daily managed assets of all Nuveen open-end and closed-end funds that constitute “eligible assets.” Eligible assets do not include assets attributable to investments in other Nuveen funds or assets in excess of a determined amount (originally $2 billion) added to the Nuveen fund complex in connection with the Adviser’s assumption of the management of the former First American Funds effective January 1, 2011, but do not include certain Nuveen Funds that were reorganized into funds advised by an affiliate of the Adviser during the 2019 calendar year. As of May 31, 2020, the complex-level fee for each Fund was 0.1587%.
Other Transactions with Affiliates
Each Fund is permitted to purchase or sell securities from or to certain other funds or accounts managed by the Sub-Adviser (“Affiliated Entity”) under specified conditions outlined in procedures adopted by the Board (“cross-trade”). These procedures have been designed to ensure that any cross-trade of securities by the Fund from or to an Affiliated Entity by virtue of having a common investment adviser (or affiliated investment adviser), common officer and/or common trustee complies with Rule 17a-7 under the 1940 Act. These transactions are effected at the current market price (as provided by an independent pricing service) without incurring broker commissions.
During the current fiscal period, the following Funds engaged in inter-fund trades pursuant to these procedures as follows:
| | | | | | | |
| Inter-Fund Trades | NKG | NMY | NMT | NMS | NOM | NPV |
Purchases | $2,596,875 | $6,818,970 | $424,267 | $3,080,771 | $ 915,449 | $ 8,091,372 |
Sales | 2,610,475 | 6,746,483 | 420,118 | 3,067,695 | 1,395,416 | 11,151,643 |
8. Borrowing Arrangements
Committed Line of Credit
The Funds, along with certain other funds managed by the Adviser (“Participating Funds”), have established a 364-day, $2.65 billion standby credit facility with a group of lenders, under which the Participating Funds may borrow for various purposes other than leveraging for investment purposes. Each Participating Fund is allocated a designated proportion of the facility’s capacity (and its associated costs, as described below) based upon a multi-factor assessment of the likelihood and frequency of its need to draw on the facility, the size of the Fund and its anticipated draws, and the potential importance of such draws to the operations and well-being of the Fund, relative to those of the other Funds. A Fund may effect draws on the facility in excess of its designated capacity if and to the extent that other Participating Funds have undrawn capacity. The credit facility expires in June 2020 unless extended or renewed.
The credit facility has the following terms: a fee of 0.15% per annum on unused commitment amounts, and interest at a rate equal to the higher of (a) one-month LIBOR (London Inter-Bank Offered Rate) plus 1.00% per annum or (b) the Fed Funds rate plus 1.00% per annum on amounts borrowed. Participating Funds paid administration, legal and arrangement fees, which are recognized as a component of “Other expenses” on the Statement of Operations, and along with commitment fees, have been allocated among such Participating Funds based upon the relative proportions of the facility’s aggregate capacity reserved for them and other factors deemed relevant by the Adviser and the Board of each Participating Fund.
115
Notes to Financial Statements (continued)
During the current fiscal period, all of the Funds utilized this facility. Each Fund’s maximum outstanding balance during the utilization period was as follows:
| | | | | | | |
| NKG | NMY | NMT | NMS | NOM | NPV |
Maximum outstanding balance | $488,286 | $8,700,000 | $1,023,737 | $320,708 | $112,909 | $3,764,146 |
During the Fund’s utilization period(s) during the current fiscal period, the average daily balance outstanding and average annual interest rate on the Borrowings were as follows:
| | | | | | | |
| NKG | NMY | NMT | NMS | NOM | NPV |
Utilization period (days outstanding) | 2 | 15 | 2 | 2 | 2 | 2 |
Average daily balance outstanding | $488,286 | $7,087,155 | $1,023,737 | $320,708 | $112,909 | $3,764,146 |
Average annual interest rate | 2.76% | 3.32% | 2.76% | 2.76% | 2.76% | 2.76% |
Borrowings outstanding as of the end of the reporting period are recognized as “Borrowings” on the Statement of Assets and Liabilities, where applicable.
Inter-Fund Borrowing and Lending
The SEC has granted an exemptive order permitting registered open-end and closed-end Nuveen funds to participate in an inter-fund lending facility whereby the Nuveen funds may directly lend to and borrow money from each other for temporary purposes (e.g., to satisfy redemption requests or when a sale of securities “fails,” resulting in an unanticipated cash shortfall) (the “Inter-Fund Program”). The closed-end Nuveen funds, including the Funds covered by this shareholder report, will participate only as lenders, and not as borrowers, in the Inter-Fund Program because such closed-end funds rarely, if ever, need to borrow cash to meet redemptions. The Inter-Fund Program is subject to a number of conditions, including, among other things, the requirements that (1) no fund may borrow or lend money through the Inter-Fund Program unless it receives a more favorable interest rate than is typically available from a bank or other financial institution for a comparable transaction; (2) no fund may borrow on an unsecured basis through the Inter-Fund Program unless the fund’s outstanding borrowings from all sources immediately after the inter-fund borrowing total 10% or less of its total assets; provided that if the borrowing fund has a secured borrowing outstanding from any other lender, including but not limited to another fund, the inter-fund loan must be secured on at least an equal priority basis with at least an equivalent percentage of collateral to loan value; (3) if a fund’s total outstanding borrowings immediately after an inter-fund borrowing would be greater than 10% of its total assets, the fund may borrow through the inter-fund loan on a secured basis only; (4) no fund may lend money if the loan would cause its aggregate outstanding loans through the Inter-Fund Program to exceed 15% of its net assets at the time of the loan; (5) a fund’s inter-fund loans to any one fund shall not exceed 5% of the lending fund’s net assets; (6) the duration of inter-fund loans will be limited to the time required to receive payment for securities sold, but in no event more than seven days; and (7) each inter-fund loan may be called on one business day’s notice by a lending fund and may be repaid on any day by a borrowing fund. In addition, a Nuveen fund may participate in the Inter-Fund Program only if and to the extent that such participation is consistent with the fund’s investment objective and investment policies. The Board is responsible for overseeing the Inter-Fund Program.
The limitations detailed above and the other conditions of the SEC exemptive order permitting the Inter-Fund Program are designed to minimize the risks associated with Inter-Fund Program for both the lending fund and the borrowing fund. However, no borrowing or lending activity is without risk. When a fund borrows money from another fund, there is a risk that the loan could be called on one day’s notice or not renewed, in which case the fund may have to borrow from a bank at a higher rate or take other actions to payoff such loan if an inter-fund loan is not available from another fund. Any delay in repayment to a lending fund could result in a lost investment opportunity or additional borrowing costs.
During the current reporting period, none of the Funds covered by this shareholder report have entered into any inter-fund loan activity.
9. Subsequent Events
Committed Line of Credit
During June 2020, the Participating Funds renewed the standby credit facility through June 2021. In conjunction with this renewal the commitment amount decreased from $2.65 billion to $2.405 billion and the interest rate increased from LIBOR plus 1.00% to LIBOR plus 1.25%. The Participating Funds also incurred a 0.10% upfront fee. All other terms remain unchanged.
116
Additional Fund Information (Unaudited)
| | | | | | | | |
| Board of Trustees | | | | | | | |
Jack B. Evans | William C. Hunter | Albin F. Moschner | John K. Nelson | Judith M. Stockdale | Carole E. Stone |
Terence J. Toth | Margaret L. Wolff | Robert L. Young | | | | | |
|
|
|
| Investment Adviser | Custodian | Legal Counsel | | Independent Registered | Transfer Agent and |
Nuveen Fund Advisors, LLC
| | Chapman and Cutler LLP | Public Accounting Firm | Shareholder Services |
333 West Wacker Drive | & Trust Company | Chicago, IL 60603 | | KPMG LLP | | Computershare Trust |
Chicago, IL 60606 | One Lincoln Street | | 200 East Randolph Street | Company, N.A. |
| Boston, MA 02111 | | | Chicago, IL 60601 | 150 Royall Street |
| | | | | | Canton, MA 02021 |
| | | | | | (800) 257-8787 |
Portfolio of Investments Information
Each Fund is required to file its complete schedule of portfolio holdings with the Securities and Exchange Commission (SEC) for the first and third quarters of each fiscal year as an exhibit to its report on Form N-PORT. You may obtain this information on the SEC’s website at http:www.sec.gov.
Nuveen Funds’ Proxy Voting InformationYou may obtain (i) information regarding how each fund voted proxies relating to portfolio securities held during the most recent twelve-month period ended June 30, without charge, upon request, by calling Nuveen toll-free at (800) 257-8787 or on Nuveen’s website at www.nuveen.com and (ii) a description of the policies and procedures that each fund used to determine how to vote proxies relating to portfolio securities without charge, upon request, by calling Nuveen toll free at (800) 257-8787. You may also obtain this information directly from the SEC. Visit the SEC on-line at http://www.sec.gov.
CEO Certification DisclosureEach Fund’s Chief Executive Officer (CEO) has submitted to the New York Stock Exchange (NYSE) the annual CEO certification as required by Section 303A.12(a) of the NYSE Listed Company Manual. Each Fund has filed with the SEC the certification of its CEO and Chief Financial Officer required by Section 302 of the Sarbanes-Oxley Act.
Common Share RepurchasesEach Fund intends to repurchase, through its open-market share repurchase program, shares of its own common stock at such times and in such amounts as is deemed advisable. During the period covered by this report, each Fund repurchased shares of its common stock, as shown in the accompanying table. Any future repurchases will be reported to shareholders in the next annual or semi-annual report.
| | | | | | | |
| NKG | NMY | NMT | NMS | NOM | NPV |
Common shares repurchased | — | — | — | — | — | — |
FINRA BrokerCheck
The Financial Industry Regulatory Authority (FINRA) provides information regarding the disciplinary history of FINRA member firms and associated investment professionals. This information as well as an investor brochure describing FINRA BrokerCheck is available to the public by calling the FINRA BrokerCheck Hotline number at (800) 289-9999 or by visiting www.FINRA.org.
117
Glossary of Terms Used in this Report (Unaudited)
| ■ | Average Annual Total Return: This is a commonly used method to express an investment’s performance over a particular, usually multi-year time period. It expresses the return that would have been necessary each year to equal the investment’s actual cumula- tive performance (including change in NAV or market price and reinvested dividends and capital gains distributions, if any) over the time period being considered. |
| ■ | Duration: Duration is a measure of the expected period over which a bond’s principal and interest will be paid, and consequently is a measure of the sensitivity of a bond’s or bond fund’s value to changes when market interest rates change. Generally, the longer a bond’s or fund’s duration, the more the price of the bond or fund will change as interest rates change. |
| ■ | Effective Leverage: Effective leverage is a fund’s effective economic leverage, and includes both regulatory leverage (see leverage) and the leverage effects of certain derivative investments in the fund’s portfolio. Currently, the leverage effects of Tender Option Bond (TOB) inverse floater holdings are included in effective leverage values, in addition to any regulatory leverage. |
| ■ | Escrowed to Maturity Bond: When proceeds of a refunding issue are deposited in an escrow account for investment in an amount sufficient to pay the principal and interest on the issue being refunded. In some cases, though, an issuer may expressly reserve its right to exercise an early call of bonds that have been escrowed to maturity. |
| ■ | Gross Domestic Product (GDP): The total market value of all final goods and services produced in a country/region in a given year, equal to total consumer, investment and government spending, plus the value of exports, minus the value of imports. |
| ■ | Inverse Floating Rate Securities: Inverse floating rate securities, also known as inverse floaters or tender option bonds (TOBs), are created by depositing a municipal bond, typically with a fixed interest rate, into a special purpose trust. This trust, in turn, (a) issues floating rate certificates typically paying short-term tax-exempt interest rates to third parties in amounts equal to some fraction of the deposited bond’s par amount or market value, and (b) issues an inverse floating rate certificate (sometimes referred to as an “inverse floater”) to an investor (such as a Fund) interested in gaining investment exposure to a long-term municipal bond. The income received by the holder of the inverse floater varies inversely with the short term rate paid to the floating rate certificates’ holders, and in most circumstances the holder of the inverse floater bears substantially all of the underlying bond’s downside investment risk. The holder of the inverse floater typically also benefits disproportionately from any potential appreciation of the underlying bond’s value. Hence, an inverse floater essentially represents an investment in the underlying bond on a leveraged basis. |
| ■ | Leverage: Leverage is created whenever a fund has investment exposure (both reward and/or risk) equivalent to more than 100% of the investment capital. |
| ■ | Net Asset Value (NAV) Per Share: A fund’s Net Assets is equal to its total assets (securities, cash, accrued earnings and receiv- ables) less its total liabilities. NAV per share is equal to the fund’s Net Assets divided by its number of shares outstanding. |
| ■ | Pre-Refunding: Pre-Refunding, also known as advanced refundings or refinancings, is a procedure used by state and local govern- ments to refinance municipal bonds to lower interest expenses. The issuer sells new bonds with a lower yield and uses the proceeds to buy U.S. Treasury securities, the interest from which is used to make payments on the higher-yielding bonds. Because of this collateral, pre-refunding generally raises a bond’s credit rating and thus its value. |
118
| ■ | Regulatory Leverage: Regulatory Leverage consists of preferred shares issued by or borrowings of a fund. Both of these are part of a fund’s capital structure. Regulatory leverage is subject to asset coverage limits set in the Investment Company Act of 1940. |
| ■ | S&P Municipal Bond Georgia Index: An unleveraged, market value-weighted index designed to measure the performance of the tax-exempt, investment-grade Georgia municipal bond market. Index returns assume reinvestment of distributions, but do not reflect any applicable sales charges or management fees. |
| ■ | S&P Municipal Bond Index: An unleveraged, market value-weighted index designed to measure the performance of the tax- exempt, investment-grade U.S. municipal bond market. Index returns assume reinvestment of distributions, but do not reflect any applicable sales charges or management fees. |
| ■ | S&P Municipal Bond Maryland Index: An unleveraged, market value-weighted index designed to measure the performance of the tax-exempt, investment-grade Maryland municipal bond market. Index returns assume reinvestment of distributions, but do not reflect any applicable sales charges or management fees. |
| ■ | S&P Municipal Bond Massachusetts Index: An unleveraged, market value-weighted index designed to measure the performance of the tax-exempt, investment-grade Massachusetts municipal bond market. Index returns assume reinvestment of distributions, but do not reflect any applicable sales charges or management fees. |
| ■ | S&P Municipal Bond Minnesota Index: An unleveraged, market value-weighted index designed to measure the performance of the tax-exempt, investment-grade Minnesota municipal bond market. Index returns assume reinvestment of distributions, but do not reflect any applicable sales charges or management fees. |
| ■ | S&P Municipal Bond Missouri Index: An unleveraged, market value-weighted index designed to measure the performance of the tax-exempt, investment-grade Missouri municipal bond market. Index returns assume reinvestment of distributions, but do not reflect any applicable sales charges or management fees. |
| ■ | S&P Municipal Bond Virginia Index: An unleveraged, market value-weighted index designed to measure the performance of the tax-exempt, investment-grade Virginia municipal bond market. Index returns assume reinvestment of distributions, but do not reflect any applicable sales charges or management fees. |
| ■ | Total Investment Exposure: Total investment exposure is a fund’s assets managed by the Adviser that are attributable to financial leverage. For these purposes, financial leverage includes a fund’s use of preferred stock and borrowings and investments in the residual interest certificates (also called inverse floating rate securities) in tender option bond (TOB) trusts, including the portion of assets held by a TOB trust that has been effectively financed by the trust’s issuance of floating rate securities. |
| ■ | Zero Coupon Bond: A zero coupon bond does not pay a regular interest coupon to its holders during the life of the bond. Income to the holder of the bond comes from accretion of the difference between the original purchase price of the bond at issuance and the par value of the bond at maturity and is effectively paid at maturity. The market prices of zero coupon bonds generally are more volatile than the market prices of bonds that pay interest periodically. |
119
Reinvest Automatically, Easily and Conveniently
Nuveen makes reinvesting easy. A phone call is all it takes to set up your reinvestment account.
Nuveen Closed-End Funds Automatic Reinvestment PlanNuveen Closed-End Fund allows you to conveniently reinvest distributions in additional Fund shares. By choosing to reinvest, you’ll be able to invest money regularly and automatically, and watch your investment grow through the power of compounding. Just like distributions in cash, there may be times when income or capital gains taxes may be payable on distributions that are reinvested. It is important to note that an automatic reinvestment plan does not ensure a profit, nor does it protect you against loss in a declining market.
Easy and convenient
To make recordkeeping easy and convenient, each month you’ll receive a statement showing your total distributions, the date of investment, the shares acquired and the price per share, and the total number of shares you own.
How shares are purchased
The shares you acquire by reinvesting will either be purchased on the open market or newly issued by the Fund. If the shares are trading at or above net asset value at the time of valuation, the Fund will issue new shares at the greater of the net asset value or 95% of the then-current market price. If the shares are trading at less than net asset value, shares for your account will be purchased on the open market. If the Plan Agent begins purchasing Fund shares on the open market while shares are trading below net asset value, but the Fund’s shares subsequently trade at or above their net asset value before the Plan Agent is able to complete its purchases, the Plan Agent may cease open-market purchases and may invest the uninvested portion of the distribution in newly-issued Fund shares at a price equal to the greater of the shares’ net asset value or 95% of the shares’ market value on the last business day immediately prior to the purchase date. Distributions received to purchase shares in the open market will normally be invested shortly after the distribution payment date. No interest will be paid on distributions awaiting reinvestment. Because the market price of the shares may increase before purchases are completed, the average purchase price per share may exceed the market price at the time of valuation, resulting in the acquisition of fewer shares than if the distribution had been paid in shares issued by the Fund. A pro rata portion of any applicable brokerage commissions on open market purchases will be paid by Plan participants. These commissions usually will be lower than those charged on individual transactions.
Flexible
You may change your distribution option or withdraw from the Plan at any time, should your needs or situation change. You can reinvest whether your shares are registered in your name, or in the name of a brokerage firm, bank, or other nominee. Ask your investment advisor if his or her firm will participate on your behalf. Participants whose shares are registered in the name of one firm may not be able to transfer the shares to another firm and continue to participate in the Plan. The Fund reserves the right to amend or terminate the Plan at any time. Although the Fund reserves the right to amend the Plan to include a service charge payable by the participants, there is no direct service charge to participants in the Plan at this time.
Call today to start reinvesting distributions
For more information on the Nuveen Automatic Reinvestment Plan or to enroll in or withdraw from the Plan, speak with your financial professional or call us at (800) 257-8787.
120
Annual Investment Management Agreement Approval Process (Unaudited)
At a meeting held on May 19-21, 2020 (the “May Meeting”), the Boards of Trustees (collectively, the “Board” and each Trustee, a “Board Member”) of the Funds, which are comprised entirely of Board Members who are not “interested persons” (as defined under the Investment Company Act of 1940 (the “1940 Act”)) (the “Independent Board Members”), approved, for their respective Fund, the renewal of the management agreement (each, an “Investment Management Agreement”) with Nuveen Fund Advisors, LLC (the “Adviser”) pursuant to which the Adviser serves as investment adviser to such Fund and the sub-advisory agreement (each, a “Sub-Advisory Agreement”) with Nuveen Asset Management, LLC (the “Sub-Adviser”) pursuant to which the Sub-Adviser serves as the sub-adviser to such Fund. Although the 1940 Act requires that continuances of the Advisory Agreements (as defined below) be approved by the in-person vote of a majority of the Independent Board Members, the May Meeting was held virtually through the internet in view of the health risks associated with holding an in-person meeting during the COVID-19 pandemic and governmental restrictions on gatherings. The May Meeting was held in reliance on an order issued by the Securities and Exchange Commission on March 13, 2020, as extended on March 25, 2020, which provided registered investment companies temporary relief from the in-person voting requirements of the 1940 Act with respect to the approval of a fund’s advisory agreement in response to the challenges arising in connection with the COVID-19 pandemic.
Following up to an initial two-year period, the Board considers the renewal of each Investment Management Agreement and Sub-Advisory Agreement on behalf of the applicable Fund on an annual basis. The Investment Management Agreements and Sub-Advisory Agreements are collectively referred to as the “Advisory Agreements” and the Adviser and the Sub-Adviser are collectively, the “Fund Advisers” and each, a “Fund Adviser.” Throughout the year, the Board and its committees meet regularly and, at these meetings, review an extensive array of topics and information that are relevant to its annual consideration of the renewal of the advisory agreements for the Nuveen funds. Such information may address, among other things, fund performance; the Adviser’s strategic plans; the review of the funds and investment teams; compliance, regulatory and risk management matters; the trading practices of the various sub-advisers to the funds; valuation of securities; fund expenses; overall market and regulatory developments; the management of leverage financing; and the secondary market trading of the closed-end funds and any actions to address discounts.
In addition to the information and materials received during the year, the Board, in response to a request made on its behalf by independent legal counsel, received extensive materials and information prepared specifically for its annual consideration of the renewal of the advisory agreements for the Nuveen funds by the Adviser and by Broadridge Financial Solutions, Inc. (“Broadridge”), an independent provider of investment company data. The materials cover a wide range of topics including, but not limited to, a description of the nature, extent and quality of services provided by the Fund Advisers; a review of each sub-adviser to the Nuveen funds and the applicable investment teams; an analysis of fund performance in absolute terms and as compared to the performance of certain peer funds and benchmarks with a focus on any performance outliers; an analysis of the fees and expense ratios of the Nuveen funds in absolute terms and as compared to those of certain peer funds with a focus on any expense outliers; a description of portfolio manager compensation; a review of the secondary market trading of shares of the Nuveen closed-end funds (including, among other things, an analysis of performance, distribution and valuation and capital raising trends in the broader closed-end fund market and in particular with respect to Nuveen closed-end funds; a review of the leverage management actions taken on behalf of the Nuveen closed-end funds and their resulting impact on performance; and a description of the distribution management process and any capital management activities); a review of the performance of various service providers; a description of various initiatives Nuveen had undertaken or continued during the year for the benefit of particular fund(s) and/or the complex; a description of the profitability or financial data of Nuveen and the sub-advisers to the Nuveen funds; and a description of indirect benefits received by the Adviser and the sub-advisers as a result of their relationships with the Nuveen funds.
121
Annual Investment Management Agreement Approval Process (Unaudited) (continued)
In continuing its practice, the Board met prior to the May Meeting to begin its considerations of the renewal of the Advisory Agreements. Accordingly, on April 27-28, 2020 (the “April Meeting”), the Board met to review and discuss, in part, the performance of the Nuveen funds and the Adviser’s evaluation of each sub-adviser to the Nuveen funds. In its review, the Board recognized the volatile market conditions occurring during the first half of 2020 arising, in part, from the public health crisis caused by the novel coronavirus known as COVID-19 and the resulting impact on fund performance. Accordingly, the Board reviewed, among other things, fund performance reflecting the more volatile periods, including for various time periods ended the first quarter of 2020 and for various time periods ended April 17, 2020. At the April Meeting, the Board Members asked questions and requested additional information that was provided for the May Meeting. In continuing its review of the Nuveen funds in light of the extraordinary market conditions experienced in early 2020, the Board received updated fund performance data reflecting various time periods ended May 8, 2020 for its May Meeting. The Board also continued its practice of seeking to meet periodically with the various sub-advisers to the Nuveen funds and their investment teams, when feasible.
The Independent Board Members considered the review of the advisory agreements for the Nuveen funds to be an ongoing process and employed the accumulated information, knowledge, and experience the Board Members had gained during their tenure on the boards governing the Nuveen funds and working with the Adviser and sub-advisers in their review of the advisory agreements. The contractual arrangements are a result of multiple years of review, negotiation and information provided in connection with the boards’ annual review of the Nuveen funds’ advisory arrangements and oversight of the Nuveen funds.
The Independent Board Members were advised by independent legal counsel during the annual review process as well as throughout the year, including meeting in executive sessions with such counsel at which no representatives from the Adviser or the Sub-Adviser were present. In connection with their annual review, the Independent Board Members also received a memorandum from independent legal counsel outlining their fiduciary duties and legal standards in reviewing the Advisory Agreements.
The Board’s decision to renew the Advisory Agreements was not based on a single identified factor, but rather the decision reflected the comprehensive consideration of all the information provided throughout the year and at the April and May Meetings, and each Board Member may have attributed different levels of importance to the various factors and information considered in connection with the approval process. The following summarizes the principal factors and information, but not all the factors, the Board considered in deciding to renew the Advisory Agreements and its conclusions.
A. Nature, Extent and Quality of Services
In evaluating the renewal of the Advisory Agreements, the Independent Board Members received and considered information regarding the nature, extent and quality of the applicable Fund Adviser’s services provided to the respective Fund with particular focus on the services and enhancements to such services provided during the last year. The Independent Board Members considered the Investment Management Agreements and the Sub-Advisory Agreements separately in the course of their review. With this approach, they considered the respective roles of the Adviser and the Sub-Adviser in providing services to the Funds.
With respect to the Adviser, the Board recognized that the Adviser has provided a vast array of services the scope of which has expanded over the years in light of regulatory, market and other developments, such as the development of expanded compliance programs for the Nuveen funds. The Board also noted the extensive resources, tools and capabilities the Adviser and its affiliates devoted to the various operations of the Nuveen funds. These services include, but are not limited to: investment oversight, risk management and securities valuation services (such as analyzing investment performance and risk data; overseeing and reviewing the various sub-advisers to the Nuveen funds and their investment teams; overseeing trade execution, soft dollar practices and securities lending activities; providing daily valuation services and developing related valuation policies, procedures and methodologies; overseeing risk disclosure; periodic testing of investment and liquidity risks; participating in financial statement and marketing disclosures; participating in product development; and participating in
122
leverage management and liquidity monitoring); product management (such as analyzing a fund’s position in the marketplace, setting dividends, preparing shareholder and intermediary communications and other due diligence support); fund administration (such as preparing fund tax returns and other tax compliance services, overseeing the funds’ independent public accountants and other service providers; managing fund budgets and expenses; and helping to fulfill the funds’ regulatory filing requirements); oversight of shareholder services and transfer agency functions (such as overseeing transfer agent service providers which include registered shareholder customer service and transaction processing; and overseeing proxy solicitation and tabulation services); Board relations services (such as organizing and administering Board and committee meetings, preparing various reports to the Board and committees and providing other support services); compliance and regulatory oversight services (such as devising compliance programs; managing compliance policies; monitoring compliance with applicable fund policies and laws and regulations; and evaluating the compliance programs of the various sub-advisers to the Nuveen funds and certain other service providers); legal support and oversight of outside law firms (such as helping to prepare and file registration statements and proxy statements; overseeing fund activities and providing legal interpretations regarding such activities; and negotiating agreements with other fund service providers); and providing leverage, capital and distribution management services.
The Board also recognized that the Adviser and its affiliates have undertaken a number of initiatives over the previous year that benefited the complex and/or particular Nuveen funds including, but not limited to:
• Fund Improvements and Product Management Initiatives – continuing to proactively manage the Nuveen fund complex as a whole and at the individual fund level with an aim to enhance the shareholder outcomes through, among other things, rationalizing the product line and gaining efficiencies through mergers, repositionings and liquidations; reviewing and updating investment policies and benchmarks; and integrating certain investment teams and changing the portfolio managers serving various funds;
• Capital Initiatives – continuing to invest capital to support new Nuveen funds with initial capital as well as to facilitate modifications to the strategies or structure of existing funds;
• Compliance Program Initiatives – continuing efforts to mitigate compliance risk, increase operating efficiencies, strengthen key compliance program elements and support international business growth and other objectives through, among other things, integrating various investment teams across affiliates, consolidating marketing review functions, enhancing compliance related technologies and establishing and maintaining shared broad-based compliance policies throughout the organization and its affiliates;
• Risk Management and Valuation Services - continuing efforts to provide Nuveen with a more disciplined and consistent approach to identifying and mitigating the firm’s operational risks through, among other things, enhancing the interaction and reporting between the investment risk management team and various affiliates and adopting a risk operational framework across the complex;
• Regulatory Matters – continuing efforts to monitor regulatory trends and advocate on behalf of the Nuveen funds, to implement and comply with new or revised rules and mandates and to respond to regulatory inquiries and exams;
• Government Relations – continuing efforts of various Nuveen teams and affiliates to develop policy positions on a broad range of issues that may impact the Nuveen funds, advocate and communicate these positions to lawmakers and other regulatory authorities and work with trade associations to ensure these positions are represented;
• Business Continuity, Disaster Recovery and Information Services – continuing to periodically test business continuity and disaster recovery plans, maintain an information security program designed to identify and manage information security risks, and provide reports to the Board, at least annually, addressing, among other things, management’s security risk assessment,
123
Annual Investment Management Agreement Approval Process (Unaudited) (continued)
cyber risk profile, potential impact of new or revised laws and regulations, incident tracking and other relevant information technology risk-related reports;
• Expanded Dividend Management Services – continuing to manage the dividends among the varying types of Nuveen funds within the Nuveen complex to be consistent with the respective fund’s product design and investing resources to develop systems to assist in the process for newer products such as target term funds; and
• with respect specifically to closed-end funds, such initiatives also included:
•• Leverage Management Services – continuing to actively manage leverage including developing new leverage instruments, managing leverage exposure and costs through various providers, and managing and adapting tender option bond structures to comply with regulations and developing further relationships with leverage providers;
•• Capital Management, Market Intelligence and Secondary Market Services – ongoing capital management efforts through shelf offerings, share repurchases as appropriate to address discounts, tender offers and capital return programs as well as providing market data analysis to help understand closed-end fund ownership cycles and their impact on secondary market trading as well as to improve proxy solicitation efforts; and
•• Closed-end Fund Investor Relations Program – maintaining the closed-end fund investor relations program which, among other things, raises awareness, provides educational materials and cultivates advocacy for closed-end funds and the Nuveen closed-end fund product line.
The Board also noted the benefits to shareholders of investing in a Nuveen fund, as each Nuveen fund is a part of a large fund
complex with a variety of investment disciplines, capabilities, expertise and resources available to navigate and support the funds including during stressed times as occurred in the market in the first half of 2020. In addition to the services provided by the Adviser, the Board also considered the risks borne by the Adviser and its affiliates in managing the Nuveen funds, including entrepreneurial, operational, reputational, regulatory and litigation risks.
The Board further considered the division of responsibilities between the Adviser and the Sub-Adviser and recognized that the Sub-Adviser and its investment personnel generally are responsible for the management of each Fund’s portfolio under the oversight of the Adviser and the Board. The Board considered an analysis of the Sub-Adviser provided by the Adviser which included, among other things, the Sub-Adviser’s assets under management and changes thereto, a summary of the applicable investment team and changes thereto, the investment approach of the team and the performance of the funds sub-advised by the Sub-Adviser over various periods. The Board further considered at the May Meeting or prior meetings evaluations of the Sub-Adviser’s compliance program and trade execution. The Board also considered the structure of investment personnel compensation programs and whether this structure provides appropriate incentives to act in the best interests of the respective Nuveen funds. The Board noted that the Adviser recommended the renewal of the Sub-Advisory Agreements.
Based on its review, the Board determined, in the exercise of its reasonable business judgment, that it was satisfied with the nature, extent and quality of services provided to the respective Funds under each applicable Advisory Agreement.
B. The Investment Performance of the Funds and Fund Advisers
In evaluating the quality of the services provided by the Fund Advisers, the Board also received and considered a variety of investment performance data of the Nuveen funds they advise. In this regard, the Board reviewed, among other things, Fund performance over the quarter, one-, three- and five-year periods ending December 31, 2019. Unless otherwise indicated, the performance data referenced below reflects the periods ended December 31, 2019. In general, the year 2019 was a period of strong market performance. However, as noted above, the Board recognized the unprecedented market volatility and decline that occurred in early 2020 and the significant impact it would have on fund performance. As a result, the Board reviewed
124
performance data capturing more recent time periods, including performance data reflecting the first quarter of 2020 as well as performance data for various periods ended April 17, 2020 for its April Meeting and May 8, 2020 for its May Meeting.
The Board reviewed both absolute and relative fund performance during the annual review over the various time periods. With respect to the latter, the Board considered fund performance in comparison to the performance of peer funds (the “Performance Peer Group”) and recognized and/or customized benchmarks (i.e., generally benchmarks derived from multiple recognized benchmarks). For funds that had changes in portfolio managers, the Board considered performance data of such funds before and after such changes. In considering performance data, the Board is aware of certain inherent limitations with such data, including that differences between the objective(s), strategies and other characteristics of the Nuveen funds compared to the respective Performance Peer Group and/or benchmark(s) (such as differences in the use of leverage) as well as differences in the composition of the Performance Peer Group over time will necessarily contribute to differences in performance results and limit the value of the comparative information. To assist the Board in its review of the comparability of the relative performance, the Adviser has ranked the relevancy of the peer group to the funds as low, medium or high.
As noted above, the Board reviewed fund performance over various periods ended December 31, 2019 as well as the first quarter of 2020 and various time periods ended April 17, 2020 and May 8, 2020. In light of the significant market decline in the early part of 2020, the Board noted that a shorter period of underperformance may significantly impact longer term performance. Further, the Board recognized that performance data may differ significantly depending on the ending date selected and accordingly, performance results for periods ended at the year-end of 2019 may vary significantly from performance results for periods ended in the first quarter of 2020, particularly given the extraordinary market conditions at that time as the impact of COVID-19 and other market developments unfolded. The Board considered a fund’s performance in light of the overall financial market conditions. In addition, the Board recognized that shareholders may evaluate performance based on their own holding periods which may differ from the periods reviewed by the Board and lead to differing results.
The secondary market trading of shares of the Nuveen closed-end funds continues to be a priority for the Board given its importance to shareholders, and therefore data reflecting the premiums and discounts at which the shares of the closed-end funds trade is reviewed by the Board during its annual review and by the Board and/or its Closed-end Fund committee during its respective quarterly meetings throughout the year.
In addition to the performance data prepared in connection with the annual review of the advisory agreements of the Nuveen funds, the Board reviewed fund performance throughout the year at its quarterly meetings representing differing time periods and took into account the discussions that occurred at these Board meetings in evaluating a fund’s overall performance. The Board also considered, among other things, the Adviser’s analysis of each Nuveen fund’s performance, with particular focus on funds that were considered performance outliers (both overperformance and underperformance), the factors contributing to the performance and any steps taken to address any performance concerns. Given the volatile market conditions of early 2020, the Board considered the Adviser’s analysis of the impact of such conditions on the Nuveen funds’ performance.
The Board evaluated performance in light of various factors, including general market conditions, issuer-specific information, asset class information, fund cash flows and other factors. Accordingly, depending on the facts and circumstances, the Board may be satisfied with a fund’s performance notwithstanding that its performance may be below its benchmark or peer group for certain periods. However, with respect to any Nuveen funds for which the Board had identified performance issues, the Board monitors such funds closely until performance improves, discusses with the Adviser the reasons for such results, considers whether any steps are necessary or appropriate to address such issues, and reviews the results of any efforts undertaken.
The Board’s determinations with respect to each Fund are summarized below.
For Nuveen Georgia Quality Municipal Income Fund (the “Georgia Fund”), the Board noted that the Fund outperformed its benchmark for the one-, three- and five-year periods ended December 31, 2019. The Fund also ranked in the second quartile of its Performance Peer Group for the one-year period, third quartile for the three-year period and fourth quartile for the five-year
125
Annual Investment Management Agreement Approval Process (Unaudited) (continued)
period ended December 31, 2019. With the market decline in the first quarter of 2020, the Fund outperformed its benchmark for the one-, three- and five-year periods ended March 31, 2020. The Fund also ranked in the first quartile of its Performance Peer Group for the one-year period ended March 31, 2020, the second quartile of its Performance Peer Group for the three-year period ended March 31, 2020, and the third quartile of its Performance Peer Group for the five-year period ended March 31, 2020. The Board was satisfied with the Fund’s overall performance.
For Nuveen Maryland Quality Municipal Income Fund (the “Maryland Fund”), the Board noted that the Fund outperformed its benchmark and ranked in the first quartile of its Performance Peer Group for the one-, three- and five-year periods ended December 31, 2019. With the market decline in the first quarter of 2020, although the Fund’s performance was below the performance of its benchmark for the one-year period ended March 31, 2020, the Fund outperformed its benchmark for the three- and five-year periods ended March 31, 2020. The Fund further ranked in the third quartile of its Performance Peer Group for the one-year period ended March 31, 2020 and the second quartile of its Performance Peer Group for the three- and five-year periods ended March 31, 2020. The Board was satisfied with the Fund’s overall performance.
For Nuveen Massachusetts Quality Municipal Income Fund (the “Massachusetts Fund”), the Board noted that the Fund outperformed its benchmark for the one-, three- and five-year periods ended December 31, 2019. The Fund further ranked in the second quartile of its Performance Peer Group for the one-year period ended December 31, 2019 and third quartile for the three- and five-year periods ended December 31, 2019. With the market decline in the first quarter of 2020, although the Fund’s performance was below the performance of its benchmark for the one-year period ended March 31, 2020, the Fund outperformed its benchmark for the three- and five-year periods ended March 31, 2020. The Fund further ranked in the second quartile of its Performance Peer Group for the one-, three- and five-year periods ended March 31, 2020. The Board was satisfied with the Fund’s overall performance.
For Nuveen Minnesota Quality Municipal Income Fund (the “Minnesota Fund”), the Board noted that the Fund outperformed its benchmark for the one-, three- and five-year periods ended December 31, 2019. The Fund further ranked in the first quartile of its Performance Peer Group for the one- and three-year periods ended December 31, 2019 and second quartile of its Performance Peer Group for the five-year period ended December 31, 2019. With the market decline in the first quarter of 2020, although the Fund’s performance was below the performance of its benchmark for the one-year period ended March 31, 2020, the Fund outperformed its benchmark for the three- and five-year periods ended March 31, 2020. The Fund further ranked in the second quartile of its Performance Peer Group for the one- and five-year periods ended March 31, 2020 and first quartile of its Performance Peer Group for the three-year period ended March 31, 2020. The Board was satisfied with the Fund’s overall performance.
For Nuveen Missouri Quality Municipal Income Fund (the “Missouri Fund”), the Board noted that the Fund outperformed its benchmark for the one-, three- and five-year periods ended December 31, 2019. The Fund further ranked in the third quartile of its Performance Peer Group for the one- and five-year periods ended December 31, 2019 and fourth quartile of its Performance Peer Group for the three-year period ended December 31, 2019. With the market decline in the first quarter of 2020, although the Fund’s performance was below the performance of its benchmark for the one-year period ended March 31, 2020, the Fund outperformed its benchmark for the three- and five-year periods ended March 31, 2020. The Fund further ranked in the second quartile of its Performance Peer Group for the one-year period ended March 31, 2020, the third quartile of its Performance Peer Group for the three-year period ended March 31, 2020, and the first quartile of its Performance Peer Group for the five-year period ended March 31, 2020. The Board was satisfied with the Fund’s overall performance.
For Nuveen Virginia Quality Municipal Income Fund (the “Virginia Fund”), the Board noted that the Fund outperformed its benchmark and ranked in the first quartile of its Performance Peer Group for the one-, three- and five-year periods ended December 31, 2019. With the market decline in the first quarter of 2020, although the Fund’s performance was below the performance of its benchmark for the one-year period ended March 31, 2020, the Fund outperformed its benchmark for the three- and five-year periods ended March 31, 2020. The Fund further ranked in the first quartile of its Performance Peer Group
126
for the one- and three-year periods ended March 31, 2020 and the second quartile of its Performance Peer Group for the five-year period ended March 31, 2020. The Board was satisfied with the Fund’s overall performance.
C. Fees, Expenses and Profitability
1. Fees and Expenses
As part of its annual review, the Board considered the contractual management fee and net management fee (the management fee after taking into consideration fee waivers and/or expense reimbursements, if any) paid by a fund to the Adviser in light of the nature, extent and quality of the services provided. The Board also considered the total operating expense ratio of each fund before and after any fee waivers and/or expense reimbursements. More specifically, the Independent Board Members reviewed, among other things, each fund’s gross and net management fee rates (i.e., before and after expense reimbursements and/or fee waivers, if any) and net total expense ratio in relation to those of a comparable universe of funds (the “Peer Universe”) established by Broadridge. The Independent Board Members reviewed the methodology Broadridge employed to establish its Peer Universe and recognized that differences between the applicable fund and its respective Peer Universe as well as changes to the composition of the Peer Universe from year to year may limit some of the value of the comparative data. The Independent Board Members also considered a fund’s operating expense ratio as it more directly reflected the shareholder’s costs in investing in the respective fund.
In their review, the Independent Board Members considered, in particular, each fund with a net expense ratio (excluding investment-related costs of leverage) of six basis points or higher compared to that of its peer average (each, an “Expense Outlier Fund”), including the Missouri Fund, and an analysis as to the factors contributing to each such fund’s higher relative net expense ratio. In addition, although the Board reviewed a fund’s total net expenses both including and excluding investment-related expenses (i.e., leverage costs) and taxes for certain of the closed-end funds, the Board recognized that leverage expenses will vary across funds and in comparison to peers because of differences in the forms and terms of leverage employed by the respective fund. Accordingly, in reviewing the comparative data between a fund and its peers, the Board generally considered the fund’s net expense ratio and fees (excluding leverage costs and leveraged assets) to be higher if they were over 10 basis points higher, slightly higher if they were 6 to 10 basis points higher, in line if they were within approximately 5 basis points higher than the peer average and below if they were below the peer average of the Peer Universe. The Independent Board Members also considered, in relevant part, a fund’s net management fee and net total expense ratio in light of its performance history.
In their review of the fee arrangements for the Nuveen funds, the Independent Board Members considered the management fee schedules, including the complex-wide and fund-level breakpoint schedules. The Board noted that across the Nuveen fund complex, the complex-wide fee breakpoints reduced fees by $56.6 million and fund-level breakpoints reduced fees by $66.8 million in 2019.
With respect to the Sub-Adviser, the Board also considered the sub-advisory fee schedule paid to the Sub-Adviser in light of the sub-advisory services provided to the respective Fund, the breakpoint schedule and comparative data of the fees the Sub-Adviser charges to other clients, if any. In its review, the Board recognized that the compensation paid to the Sub-Adviser is the responsibility of the Adviser, not the Funds.
The Independent Board Members noted that the Georgia Fund, the Maryland Fund and the Virginia Fund each had a net management fee slightly higher than its peer average but a net expense ratio below its peer average. The Independent Board Members noted that the Massachusetts Fund and the Minnesota Fund each had a net management fee slightly higher than its peer average but a net expense ratio in line with its peer average. The Independent Board Members noted that the Missouri Fund had a net management fee slightly higher than its peer average and a net expense ratio higher than its peer average. The Independent Board Members recognized the Missouri Fund’s net expense ratio was higher than the peer average due, in part, to the small size of such Fund compared to peers in the peer set.
127
Annual Investment Management Agreement Approval Process (Unaudited) (continued)
Based on its review of the information provided, the Board determined that each Fund’s management fees (as applicable) to a Fund Adviser were reasonable in light of the nature, extent and quality of services provided to the Fund.
2. Comparisons with the Fees of Other Clients
In determining the appropriateness of fees, the Board also considered information regarding the fee rates the respective Fund Advisers charged to certain other types of clients and the type of services provided to these other clients. With respect to the Adviser and/or the Sub-Adviser, such other clients may include retail and institutional managed accounts, passively managed exchange-traded funds (“ETFs”) sub-advised by the Sub-Adviser but that are offered by another fund complex and municipal managed accounts offered by an unaffiliated adviser. With respect to the Sub-Adviser, the Board reviewed, among other things, the fee range and average fee of municipal retail wrap accounts and municipal institutional accounts.
In considering the fee data of other clients, the Board considered, among other things, the differences in the amount, type and level of services provided to the Nuveen funds relative to other clients as well as the differences in portfolio investment policies, investor profiles, account sizes and regulatory requirements, all of which contribute to the variations in the fee schedules. The Board recognized the complexity and myriad of services the Adviser had provided to the Nuveen funds compared to the other types of clients as the Adviser is principally responsible for all aspects of operating the funds, including complying with the increased regulatory requirements required when managing the funds as well as the increased entrepreneurial, legal and regulatory risks that the Adviser incurs in sponsoring and managing the funds. Further, with respect to ETFs, the Board considered that Nuveen ETFs are passively managed compared to the active management of the other Nuveen funds which contributed to the differences in fee levels between the Nuveen ETFs and other Nuveen funds. In general, higher fee levels reflect higher levels of service provided by the Adviser, increased investment management complexity, greater product management requirements, and higher levels of business risk or some combination of these factors. The Board further considered that the Sub-Adviser’s fee is essentially for portfolio management services and therefore more comparable to the fees it receives for retail wrap accounts and other external sub-advisory mandates. The Board concluded the varying levels of fees were justified given, among other things, the inherent differences in the products and the level of services provided to the Nuveen funds versus other clients, the differing regulatory requirements and legal liabilities and the entrepreneurial, legal and regulatory risks incurred in sponsoring and advising a registered investment company.
3. Profitability of Fund Advisers
In their review, the Independent Board Members considered information regarding Nuveen’s level of profitability for its advisory services to the Nuveen funds for the calendar years 2019 and 2018. The Board reviewed, among other things, Nuveen’s net margins (pre-tax) (both including and excluding distribution expenses); gross and net revenue margins (pre- and post-tax); revenues, expenses, and net income (pre-tax and after-tax and before distribution) of Nuveen for fund advisory services; and comparative profitability data comparing the margins of Nuveen compared to the adjusted margins of certain peers with publicly available data and with the most comparable assets under management (based on asset size and asset composition) for each of the last two calendar years. The Board also reviewed the revenues and expenses the Adviser derived from its ETF product line for the 2018 and 2019 calendar years.
In reviewing the profitability data, the Independent Board Members recognized the subjective nature of calculating profitability as the information is not audited and is dependent on cost allocation methodologies to allocate expenses of Nuveen and its affiliates between the fund and non-fund businesses. The expenses to be allocated include direct expenses in servicing the Nuveen funds as well as indirect and/or shared costs (such as overhead, legal and compliance) some of which are attributed to the Nuveen funds pursuant to the cost allocation methodologies. The Independent Board Members reviewed a description of the cost allocation methodologies employed to develop the financial information and a summary of the history of changes to the methodology over the eleven-year period from 2008 to 2019. The Board had also appointed three Independent Board Members, along with the assistance of independent counsel, to serve as the Board’s liaisons to review the development of the profitability data and any proposed changes to the cost allocation methodology prior to incorporating any such changes and to
128
report to the full Board. The Board recognized that other reasonable and valid allocation methodologies could be employed and could lead to significantly different results. Based on the data, the Independent Board Members noted that Nuveen’s net margins were higher in 2019 than the previous year and considered the key drivers behind the revenue and expense changes that impacted Nuveen’s net margins between the years. The Board also noted the reinvestments of some of the profits into the business through, among other things, the investment of seed capital in certain funds and continued investments in enhancements to information technology, internal infrastructure and data management improvements and global investment and innovation projects.
As noted above, the Independent Board Members also considered Nuveen’s margins from its relationship to the Nuveen funds compared to the adjusted margins of certain peers with publicly available data and with the most comparable assets under management (based on asset size and asset composition) to Nuveen for the calendar years 2019 and 2018. The Independent Board Members noted that Nuveen’s margins from its relationships with the Nuveen funds were on the low range compared to the adjusted margins of the peers. The Independent Board Members, however, recognized that it is difficult to make comparisons of profitability with other investment adviser peers given that comparative data is not generally public and the calculation of profitability is subjective and affected by numerous factors (such as types of funds a peer manages, its business mix, its cost of capital, the numerous assumptions underlying the methodology used to allocate expenses and other factors) which can have a significant impact on the results.
Aside from Nuveen’s profitability, the Board recognized that the Adviser is a subsidiary of Nuveen, LLC, the investment management arm of Teachers Insurance and Annuity Association of America (“TIAA”). As such, the Board also reviewed a balance sheet for TIAA reflecting its assets, liabilities and capital and contingency reserves for the 2019 and 2018 calendar years to consider the financial strength of TIAA. The Board recognized the benefit of having an investment adviser and its parent with significant resources, particularly during periods of market stress.
In addition to Nuveen, the Independent Board Members also considered the profitability of the Sub-Adviser from its relationships with the Nuveen funds. In this regard, the Independent Board Members reviewed, among other things, the Sub-Adviser’s revenues, expenses and net revenue margins (pre- and post-tax) for its advisory activities for the calendar year ended December 31, 2019 as well as its pre-tax and after-tax net revenue margins for 2019 compared to such margins for 2018. The Independent Board Members also reviewed a profitability analysis reflecting the revenues, expenses and revenue margin (pre-and post-tax) by asset type for the Sub-Adviser for the calendar year ended December 31, 2019 and the pre- and post-tax revenue margins from 2019 and 2018.
In evaluating the reasonableness of the compensation, the Independent Board Members also considered any other ancillary benefits derived by the respective Fund Adviser from its relationship with the Nuveen funds as discussed in further detail below.
Based on a consideration of all the information provided, the Board noted that Nuveen’s and the Sub-Adviser’s level of profitability was acceptable and not unreasonable in light of the services provided.
D. Economies of Scale and Whether Fee Levels Reflect These Economies of Scale
The Board considered whether there have been economies of scale with respect to the management of the Nuveen funds and whether these economies of scale have been appropriately shared with the funds. The Board recognized that although economies of scale are difficult to measure, there are several methods to help share the benefits of economies of scale, including breakpoints in the management fee schedule, fee waivers and/or expense limitations, the pricing of Nuveen funds at scale at inception and investments in Nuveen’s business which can enhance the services provided to the funds for the fees paid. The Board noted that Nuveen generally has employed these various methods. In this regard, the Board noted that the management fee of the Adviser is generally comprised of a fund-level component and a complex-level component each with its own breakpoint schedule, subject to certain exceptions. The Board reviewed the fund-level and complex-level fee schedules. The Board considered that the fund-level breakpoint schedules are designed to share economies of scale with shareholders if
129
Annual Investment Management Agreement Approval Process (Unaudited) (continued)
the particular fund grows, and the complex-level breakpoint schedule is designed to deliver the benefits of economies of scale to shareholders when the eligible assets in the complex pass certain thresholds even if the assets of a particular fund are unchanged or have declined. With respect to the Nuveen closed-end funds, the Board noted that, although such funds may from time to time make additional share offerings, the growth of their assets would occur primarily through the appreciation of such funds’ investment portfolios. Further, in the calculation of the complex-level component, the Board noted that it had approved the acquisition of several Nuveen funds by similar TIAA-CREF funds in 2019. However, to mitigate the loss of the assets of these Nuveen funds deemed eligible to be included in the calculation of the complex-wide fee when these Nuveen funds left the complex upon acquisition, Nuveen agreed to credit approximately $460 million to assets under management to the Nuveen complex in calculating the complex-wide component.
The Independent Board Members also recognized the Adviser’s continued reinvestment in its business through, among other things, investments in its business infrastructure and information technology, portfolio accounting system and other systems and platforms that will, among other things, support growth, simplify and enhance information sharing, and enhance the investment process to the benefit of all of the Nuveen funds.
Based on its review, the Board concluded that the current fee arrangements together with the Adviser’s reinvestment in its business appropriately shared any economies of scale with shareholders.
E. Indirect Benefits
The Independent Board Members received and considered information regarding other benefits the respective Fund Adviser or its affiliates may receive as a result of their relationship with the Nuveen funds. The Board considered the compensation that an affiliate of the Adviser received for serving as co-manager in the initial public offerings of new closed-end funds and for serving as an underwriter on shelf offerings of existing closed-end funds. In addition, the Independent Board Members also noted that various sub-advisers (including the Sub-Adviser) may engage in soft dollar transactions pursuant to which they may receive the benefit of research products and other services provided by broker-dealers executing portfolio transactions on behalf of the applicable Nuveen funds, although the Board recognized that certain sub-advisers may be phasing out the use of soft dollars over time.
The Board, however, noted that the benefits for the Sub-Adviser when transacting in fixed-income securities may be more limited as such securities generally trade on a principal basis and therefore do not generate brokerage commissions. Further, the Board considered that although the Sub-Adviser may benefit from the receipt of research and other services that it may otherwise have to pay for out of its own resources, the research may also benefit the Nuveen funds to the extent it enhances the ability of the Sub-Adviser to manage such funds or is acquired through the commissions paid on portfolio transactions of other clients.
Based on its review, the Board concluded that any indirect benefits received by a Fund Adviser as a result of its relationship with the Funds were reasonable and within acceptable parameters.
F. Other Considerations
The Board Members did not identify any single factor discussed previously as all-important or controlling. The Board Members, including the Independent Board Members, concluded that the terms of each Advisory Agreement were fair and reasonable, that the respective Fund Adviser’s fees were reasonable in light of the services provided to each Fund and that the Advisory Agreements be renewed.
130
Board Members & Officers (Unaudited)
The management of the Funds, including general supervision of the duties performed for the Funds by the Adviser, is the responsibility of the Board of Trustees of the Funds. The number of trustees of the Funds is set at nine. None of the trustees who are not “interested” persons of the Funds (referred to herein as “independent board members”) has ever been a director or employee of, or consultant to, Nuveen or its affiliates. The names and business addresses of the trustees and officers of the Funds, their principal occupations and other affiliations during the past five years, the number of portfolios each Trustee oversees and other directorships they hold are set forth below.
| Name, | Position(s) Held | Year First | Principal | Number |
| Year of Birth | with the Funds | Elected or | Occupation(s) | of Portfolios |
| & Address | | Appointed | Including other | in Fund Complex |
| | and Term(1) | Directorships | Overseen by |
| | | During Past 5 Years | Board Member |
|
Independent Board Members: | |
|
■ TERENCE J. TOTH 1959 333 W. Wacker Drive Chicago, IL 6o6o6 |
Chairman and Board Member |
2008 Class II | Formerly, a Co-Founding Partner, Promus Capital (2008-2017); Director, Quality Control Corporation (since 2012); member: Catalyst Schools of Chicago Board (since 2008) and Mather Foundation Board (since 2012), and chair of its Investment Committee; formerly, Director, Fulcrum IT Services LLC (2010- 2019); formerly, Director, Legal & General Investment Management America, Inc. (2008-2013); formerly, CEO and President, Northern Trust Global Investments (2004-2007): Executive Vice President, Quantitative Management & Securities Lending (2000-2004); prior thereto, various positions with Northern Trust Company (since 1994); formerly, Member, Northern Trust Mutual Funds Board (2005-2007), Northern Trust Global Investments Board (2004-2007), Northern Trust Japan Board (2004-2007), Northern Trust Securities Inc. Board (2003-2007) and Northern Trust Hong Kong Board (1997-2004). |
154 |
|
■ JACK B. EVANS 1948 333 W. Wacker Drive Chicago, IL 6o6o6 |
Board Member |
1999 Class III | Chairman (since 2019), formerly, President (1996-2019), The Hall-Perrine Foundation, a private philanthropic corporation; Director and Chairman, United Fire Group, a publicly held company; Director, Public Member, American Board of Orthopaedic Surgery (since 2015); Life Trustee of Coe College and the Iowa College Foundation; formerly, President Pro-Tem of the Board of Regents for the State of Iowa University System; formerly, Director, Alliant Energy and The Gazette Company; formerly, Director, Federal Reserve Bank of Chicago; formerly, President and Chief Operating Officer, SCI Financial Group, Inc., a regional financial services firm. |
154 |
|
■ WILLIAM C. HUNTER 1948 333 W. Wacker Drive Chicago, IL 6o6o6 |
Board Member |
2003 Class I | Dean Emeritus, formerly, Dean, Tippie College of Business, University of Iowa (2006-2012); Director of Wellmark, Inc. (since 2009); past Director (2005-2015), and past President (2010-2014) Beta Gamma Sigma, Inc., The International Business Honor Society; formerly, Director (2004-2018) of Xerox Corporation; Dean and Distinguished Professor of Finance, School of Business at the University of Connecticut (2003-2006); previously, Senior Vice President and Director of Research at the Federal Reserve Bank of Chicago (1995-2003); formerly, Director (1997-2007), Credit Research Center at Georgetown University. |
154 |
|
■ ALBIN F. MOSCHNER 1952 333 W. Wacker Drive Chicago, IL 6o6o6 |
Board Member |
2016 Class III | Founder and Chief Executive Officer, Northcroft Partners, LLC, a management consulting firm (since 2012); formerly, Chairman (2019), and Director (2012-2019), USA Technologies, Inc., a provider of solutions and services to facilitate electronic payment transactions; formerly, Director, Wintrust Financial Corporation (1996-2016); previously, held positions at Leap Wireless International, Inc., including Consultant (2011-2012), Chief Operating Officer (2008-2011), and Chief Marketing Officer (2004-2008); formerly, President, Verizon Card Services division of Verizon Communications, Inc. (2000-2003); formerly, President, One Point Services at One Point Communications (1999- 2000); formerly, Vice Chairman of the Board, Diba, Incorporated (1996-1997); formerly, various executive positions (1991-1996) and Chief Executive Officer (1995-1996) of Zenith Electronics Corporation. |
154 |
131
Board Members & Officers (Unaudited) (continued)
| Name, | Position(s) Held | Year First | Principal | Number |
| Year of Birth | with the Funds | Elected or | Occupation(s) | of Portfolios |
| & Address | | Appointed | Including other | in Fund Complex |
| | and Term(1) | Directorships | Overseen by |
| | | During Past 5 Years | Board Member |
|
Independent Board Members (continued): | |
|
■ JOHN K. NELSON 1962 333 W. Wacker Drive Chicago, IL 6o6o6 |
Board Member |
2013 Class II | Member of Board of Directors of Core12 LLC. (since 2008), a private firm which develops branding, marketing and communications strategies for clients; served on The President’s Council of Fordham University (2010- 2019) and previously a Director of the Curran Center for Catholic American Studies (2009- 2018); formerly, senior external advisor to the Financial Services practice of Deloitte Consulting LLP. (2012-2014); former Chair of the Board of Trustees of Marian University (2010-2014 as trustee, 2011-2014 as Chair); formerly Chief Executive Officer of ABN AMRO Bank N.V., North America, and Global Head of the Financial Markets Division (2007-2008), with various executive leadership roles in ABN AMRO Bank N.V. between 1996 and 2007. |
154 |
|
■ JUDITH M. STOCKDALE 1947 333 W. Wacker Drive Chicago, IL 6o6o6 |
Board Member |
1997 Class I | Board Member, Land Trust Alliance (since 2013); formerly, Board Member, U.S. Endowment for Forestry and Communities (2013-2019); formerly, Executive Director (1994-2012), Gaylord and Dorothy Donnelley Foundation; prior thereto, Executive Director, Great Lakes Protection Fund (1990-1994). |
154 |
|
■ CAROLE E. STONE 1947 333 W. Wacker Drive Chicago, IL 6o6o6 |
Board Member |
2007 Class I | Former Director, Chicago Board Options Exchange, Inc. (2006-2017); and C2 Options Exchange, Incorporated (2009-2017); former Director, Cboe, Global Markets, Inc., formerly, CBOE Holdings, Inc. (2010-May 2020); formerly, Commissioner, New York State Commission on Public Authority Reform (2005-2010). |
154 |
|
■ MARGARET L. WOLFF 1955 333 W. Wacker Drive Chicago, IL 6o6o6 |
Board Member |
2016 Class I | Formerly, member of the Board of Directors (2013-2017) of Travelers Insurance Company of Canada and The Dominion of Canada General Insurance Company (each, a part of Travelers Canada, the Canadian operation of The Travelers Companies, Inc.); formerly, Of Counsel, Skadden, Arps, Slate, Meagher & Flom LLP (Mergers & Acquisitions Group) (2005-2014); Member of the Board of Trustees of New York-Presbyterian Hospital (since 2005); Member (since 2004) and Chair (since 2015) of the Board of Trustees of The John A. Hartford Foundation (a philanthropy dedicated to improving the care of older adults); formerly, Member (2005-2015) and Vice Chair (2011-2015) of the Board of Trustees of Mt. Holyoke College. |
154 |
|
■ ROBERT L. YOUNG 1963 333 W. Wacker Drive Chicago, IL 6o6o6 |
Board Member |
2017 Class II | Formerly, Chief Operating Officer and Director, J.P.Morgan Investment Management Inc. (2010-2016); formerly, President and Principal Executive Officer (2013-2016), and Senior Vice President and Chief Operating Officer (2005-2010), of J.P.Morgan Funds; formerly, Director and various officer positions for J.P.Morgan Investment Management Inc. (formerly, JPMorgan Funds Management, Inc. and formerly, One Group Administrative Services) and JPMorgan Distribution Services, Inc. (formerly, One Group Dealer Services, Inc.) (1999-2017). |
154 |
132
| Name, | Position(s) Held | Year First | Principal |
| Year of Birth | with the Funds | Elected or | Occupation(s) |
| & Address | | Appointed(2) | During Past 5 Years |
|
Officers of the Funds: | |
|
■ CEDRIC H. ANTOSIEWICZ 1962 333 W. Wacker Drive Chicago, IL 6o6o6 |
Chief Administrative Officer |
2007 | Senior Managing Director (since 2017), formerly, Managing Director (2004-2017) of Nuveen Securities, LLC; Senior Managing Director (since 2017), formerly, Managing Director (2014-2017) of Nuveen Fund Advisors, LLC. |
|
■ NATHANIEL T. JONES 1979 333 W. Wacker Drive Chicago, IL 6o6o6 |
Vice President and Treasurer |
2016 | Managing Director (since 2017), formerly, Senior Vice President (2016-2017), formerly, Vice President (2011-2016) of Nuveen; Managing Director (since 2015) of Nuveen Fund Advisors, LLC; Chartered Financial Analyst. |
|
■ WALTER M. KELLY 1970 333 W. Wacker Drive Chicago, IL 6o6o6 |
Chief Compliance Officer and Vice President |
2003 | Managing Director (since 2017), formerly, Senior Vice President (2008-2017) of Nuveen. |
|
■ DAVID J. LAMB 1963 333 W. Wacker Drive Chicago, IL 6o6o6 |
Vice President | 2015 | Managing Director (since 2017), formerly, Senior Vice President of Nuveen (since 2006), Vice President prior to 2006. |
|
■ TINA M. LAZAR 1961 333 W. Wacker Drive Chicago, IL 6o6o6 |
Vice President |
2002 | Managing Director (since 2017), formerly, Senior Vice President (2014-2017) of Nuveen Securities, LLC. |
| |
|
|
■ BRIAN J. LOCKHART 1974 333 W. Wacker Drive Chicago, IL 6o6o6 |
Vice President |
2019 | Managing Director (since 2019) of Nuveen Fund Advisors, LLC; Managing Director (since 2017), formerly, Vice President (2010-2017) of Nuveen; Head of Investment Oversight (since 2017), formerly, Team Leader of Manager Oversight (2015-2017); Chartered Financial Analyst and Certified Financial Risk Manager. |
|
■ JACQUES M. LONGERSTAEY 1963 8500 Andrew Carnegie Blvd. Charlotte, NC 28262 |
Vice President |
2019 | Senior Managing Director, Chief Risk Officer, Nuveen, LLC (since May 2019); Senior Managing Director (since May 2019) of Nuveen Fund Advisors, LLC; formerly, Chief Investment and Model Risk Officer, Wealth & Investment Management Division, Wells Fargo Bank (NA) (from 2013-2019). |
133
Board Members & Officers (Unaudited) (continued)
| Name, | Position(s) Held | Year First | Principal |
| Year of Birth | with the Funds | Elected or | Occupation(s) |
| & Address | | Appointed(2) | During Past 5 Years |
|
Officers of the Funds (continued):
|
|
■ KEVIN J. MCCARTHY 1966 333 W. Wacker Drive Chicago, IL 6o6o6 |
Vice President and Assistant Secretary |
2007 | Senior Managing Director (since 2017) and Secretary and General Counsel (since 2016) of Nuveen Investments, Inc., formerly, Executive Vice President (2016-2017) and Managing Director and Assistant Secretary (2008-2016); Senior Managing Director (since 2017) and Assistant Secretary (since 2008) of Nuveen Securities, LLC, formerly Executive Vice President (2016-2017) and Managing Director (2008-2016); Senior Managing Director (since 2017), Secretary (since 2016) and Co-General Counsel (since 2011) of Nuveen Fund Advisors, LLC, formerly, Executive Vice President (2016-2017), Managing Director (2008-2016) and Assistant Secretary (2007-2016); Senior Managing Director (since 2017), Secretary (since 2016) and Associate General Counsel (since 2011) of Nuveen Asset Management, LLC, formerly Executive Vice President (2016-2017) and Managing Director and Assistant Secretary (2011- 2016); Senior Managing Director (since 2017) and Secretary (since 2016) of Nuveen Investments Advisers, LLC, formerly Executive Vice President (2016- 2017); Vice President (since 2007) and Secretary (since 2016), formerly, Assistant Secretary, of NWQ Investment Management Company, LLC, Symphony Asset Management LLC, Santa Barbara Asset Management, LLC and Winslow Capital Management, LLC (since 2010). Senior Managing Director (since 2017) and Secretary (since 2016) of Nuveen Alternative Investments, LLC. |
|
■ JON SCOTT MEISSNER 1973 8500 Andrew Carnegie Blvd. Charlotte, NC 28262 |
Vice President |
2019 | Managing Director of Mutual Fund Tax and Financial Reporting groups at Nuveen (since 2017); Managing Director of Nuveen Fund Advisors, LLC (since 2019); Senior Director of Teachers Advisors, LLC and TIAA-CREF Investment Management, LLC (since 2016); Senior Director (since 2015) Mutual Fund Taxation to the TIAA-CREF Funds, the TIAA-CREF Life Funds, the TIAA Separate Account VA-1 and the CREF Accounts; has held various positions with TIAA since 2004. |
|
■ WILLIAM T. MEYERS 1966 333 W. Wacker Drive Chicago, IL 60606 |
Vice President |
2018 | Senior Managing Director (since 2017), formerly, Managing Director (2016-2017), Senior Vice President (2010-2016) of Nuveen Securities, LLC and Nuveen Fund Advisors, LLC; Senior Managing Director (since 2017), formerly, Managing Director (2016-2017), Senior Vice President (2010-2016) of Nuveen, has held various positions with Nuveen since 1991. |
|
■ DEANN D. MORGAN 1969 100 Park Avenue New York, NY 10016 |
Vice President |
2020 | Executive Vice President, Global Head of Product at Nuveen (since November 2019); Co-Chief Executive Officer of Nuveen Securities, LLC (since March 2020); Managing Member MDR Collaboratory LLC (since 2018); Managing Director, Head of Wealth Management Product Structuring & COO Multi Asset Investing, The Blackstone Group (2013-2017). |
|
■ MICHAEL A. PERRY 1967 333 W. Wacker Drive Chicago, IL 6o6o6 |
Vice President |
2017 | Executive Vice President (since 2017), previously Managing Director from 2016), of Nuveen Fund Advisors, LLC and Nuveen Alternative Investments, LLC; Executive Vice President (since 2017), formerly, Managing Director (2015-2017), of Nuveen Securities, LLC; formerly, Managing Director (2010-2015) of UBS Securities, LLC. |
|
■ CHRISTOPHER M. ROHRBACHER 1971 333 W. Wacker Drive Chicago, IL 6o6o6 |
Vice President and Assistant Secretary |
2008 | Managing Director (since 2017) and Assistant Secretary of Nuveen Securities, LLC; Managing Director (since 2017), formerly, Senior Vice President (2016-2017), Co-General Counsel (since 2019) and Assistant Secretary (since 2016) of Nuveen Fund Advisors, LLC; Managing Director (since 2017), formerly, Senior Vice President (2012-2017) and Associate General Counsel (since 2016), formerly, Assistant General Counsel (2008-2016) of Nuveen. |
134
| Name, | Position(s) Held | Year First | Principal |
| Year of Birth | with the Funds | Elected or | Occupation(s) |
| & Address | | Appointed(2) | During Past 5 Years |
|
Officers of the Funds (continued):
|
|
■ WILLIAM A. SIFFERMANN 1975 333 W. Wacker Drive Chicago, IL 6o6o6 |
Vice President |
2017 | Managing Director (since 2017), formerly Senior Vice President (2016-2017) and Vice President (2011-2016) of Nuveen. |
|
■ E. SCOTT WICKERHAM 1973 TIAA 730 Third Avenue New York, NY 10017 |
Vice President and Controller |
2019 | Senior Managing Director, Head of Fund Administration at Nuveen, LLC (since 2019), formerly, Managing Director; Senior Managing Director (since 2019), Nuveen Fund Advisers, LLC; Principal Financial Officer, Principal Accounting Officer and Treasurer (since 2017) to the TIAA-CREF Funds, the TIAA-CREF Life Funds, the TIAA Separate Account VA-1 and the Treasurer (since 2017) to the CREF Accounts; Senior Director, TIAA-CREF Fund Administration (2014-2015); has held various positions with TIAA since 2006. |
|
■ MARK L. WINGET 1968 333 W. Wacker Drive Chicago, IL 60606 |
Vice President and Assistant Secretary |
2008
| Vice President and Assistant Secretary of Nuveen Securities, LLC (since 2008); Vice President and Assistant Secretary of Nuveen Fund Advisors, LLC (since 2019); Vice President (since 2010) and Associate General Counsel (since 2016), formerly, Assistant General Counsel (2008-2016) of Nuveen. |
|
■ GIFFORD R. ZIMMERMAN 1956 333 W. Wacker Drive Chicago, IL 60606 |
Vice President Secretary |
1988 | Managing Director (since 2002), and Assistant Secretary of Nuveen Securities, LLC; Managing Director (since 2004) and Assistant Secretary (since 1994) of Nuveen Investments, Inc.; Managing Director (since 2002), Assistant Secretary (since 1997) and Co-General Counsel (since 2011) of Nuveen Fund Advisors, LLC; Managing Director, Assistant Secretary and Associate General Counsel of Nuveen Asset Management, LLC (since 2011); Vice President (since 2017), formerly, Managing Director (2003-2017) and Assistant Secretary (since 2003) of Symphony Asset Management LLC; Managing Director and Assistant Secretary (since 2002) of Nuveen Investments Advisers, LLC; Vice President and Assistant Secretary of NWQ Investment Management Company, LLC (since 2002), Santa Barbara Asset Management, LLC (since 2006), and of Winslow Capital Management, LLC, (since 2010); Chartered Financial Analyst. |
(1) The Board of Trustees is divided into three classes, Class I, Class II, and Class III, with each being elected to serve until the third succeeding annual shareholders’ meeting subsequent to its election or thereafter in each case when its respective successors are duly elected or appointed, except two board members are elected by the holders of Preferred Shares, when applicable, to serve until the next annual shareholders’ meeting subsequent to its election or thereafter in each case when its respective successors are duly elected or appointed. The year first elected or appointed represents the year in which the board member was first elected or appointed to any fund in the Nuveen complex.
(2) Officers serve one year terms through August of each year. The year first elected or appointed represents the year in which the Officer was first elected or appointed to any fund in the Nuveen complex.
135
Nuveen:
Serving Investors for Generations
Since 1898, financial professionals and their clients have relied on Nuveen to provide dependable investment solutions through continued adherence to proven, long-term investing principles. Today, we offer a range of high quality solutions designed to be integral components of a well-diversified core portfolio.
Focused on meeting investor needs.
Nuveen is the investment manager of TIAA. We have grown into one of the world’s premier global asset managers, with specialist knowledge across all major asset classes and particular strength in solutions that provide income for investors and that draw on our expertise in alternatives and responsible investing. Nuveen is driven not only by the independent investment processes across the firm, but also the insights, risk management, analytics and other tools and resources that a truly world-class platform provides. As a global asset manager, our mission is to work in partnership with our clients to create solutions which help them secure their financial future.
Find out how we can help you.
To learn more about how the products and services of Nuveen may be able to help you meet your financial goals, talk to your financial professional, or call us at (800) 257-8787. Please read the information provided carefully before you invest. Investors should consider the investment objective and policies, risk considerations, charges and expenses of any investment carefully. Where applicable, be sure to obtain a prospectus, which contains this and other relevant information. To obtain a prospectus, please contact your securities representative or Nuveen, 333 W. Wacker Dr., Chicago, IL 60606. Please read the prospectus carefully before you invest or send money.
Learn more about Nuveen Funds at: www.nuveen.com/closed-end-funds
| Nuveen Securities, LLC member of FINRA and SIPC | 333 West Wacker Drive Chicago, IL 60606 | www.nuveen.com |  |
EAN-A-0520D 1234509-INV-Y-07/21