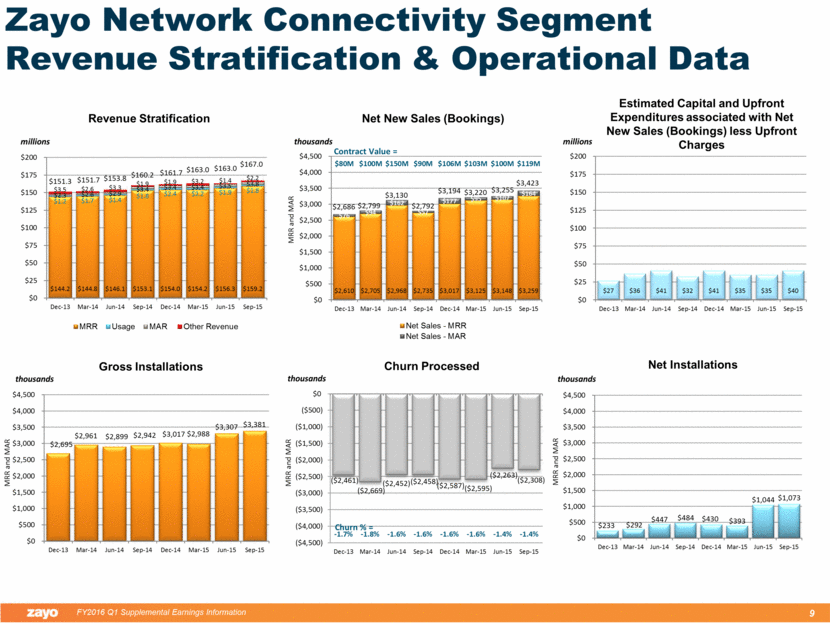
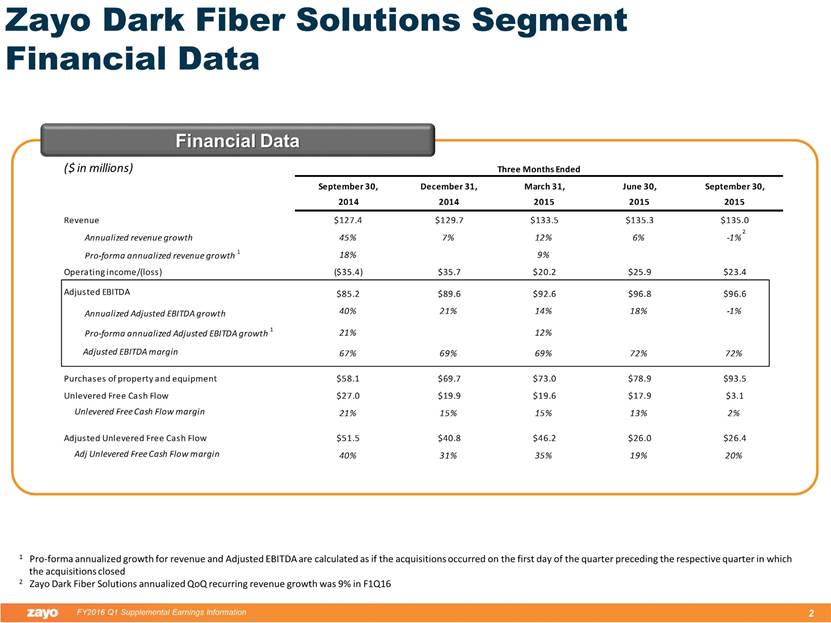
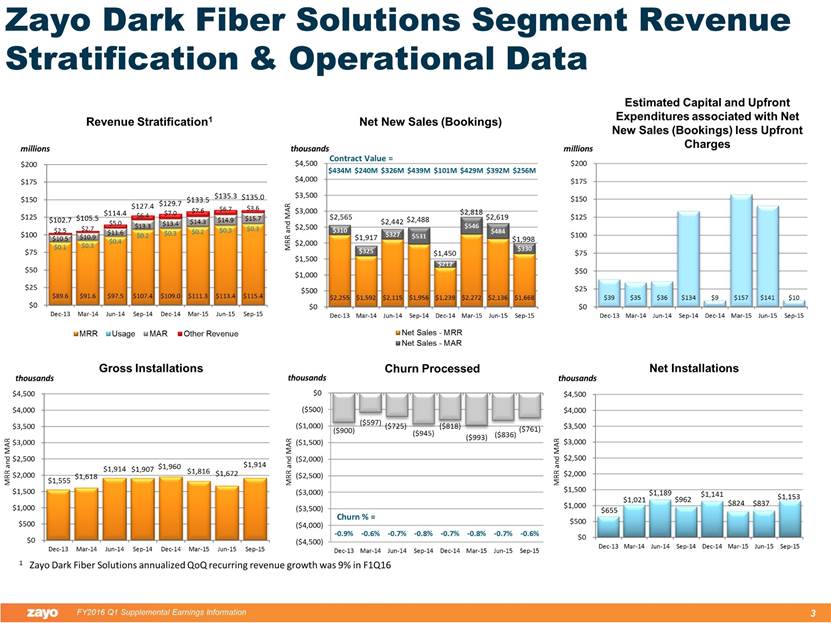
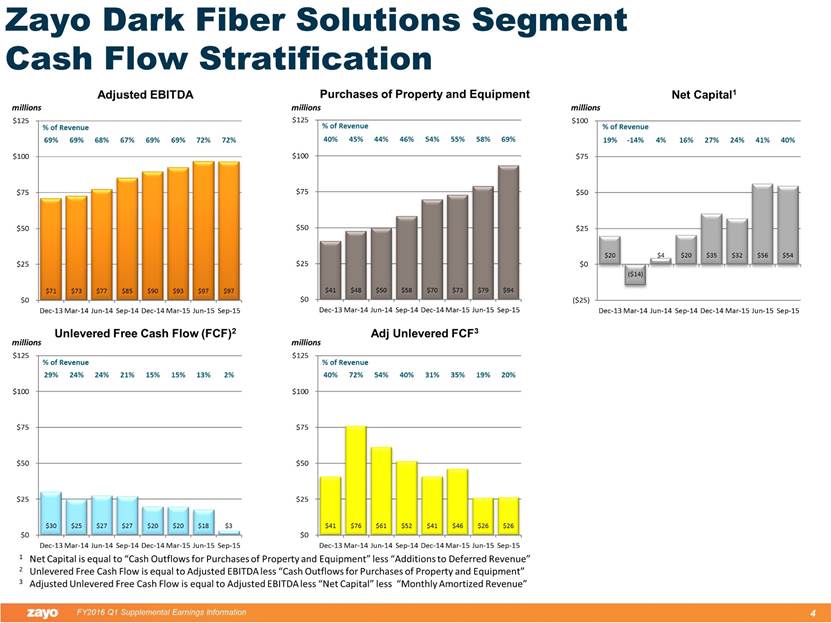
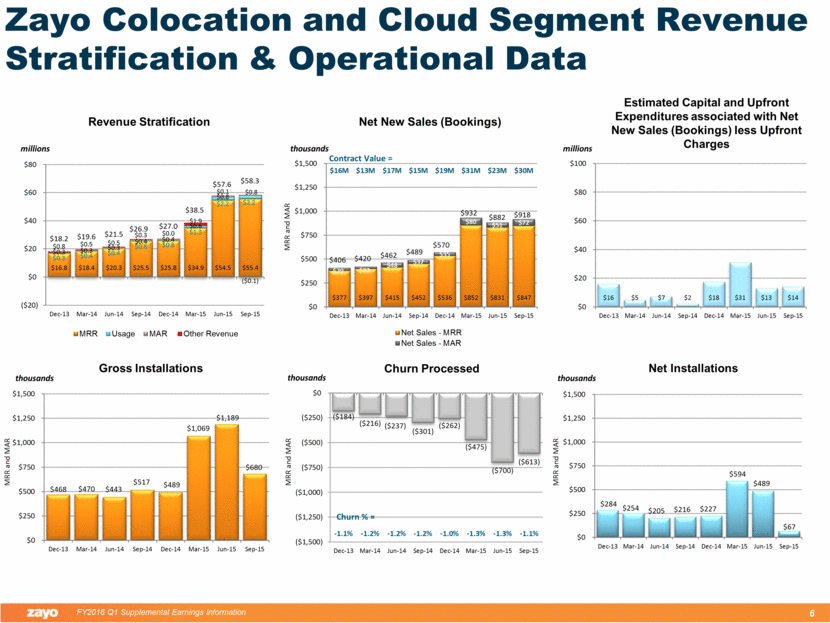
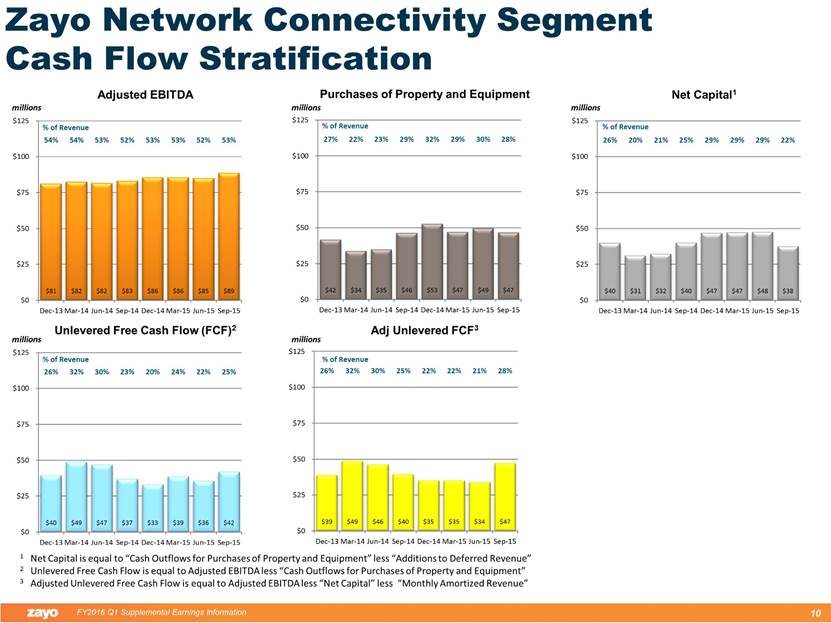
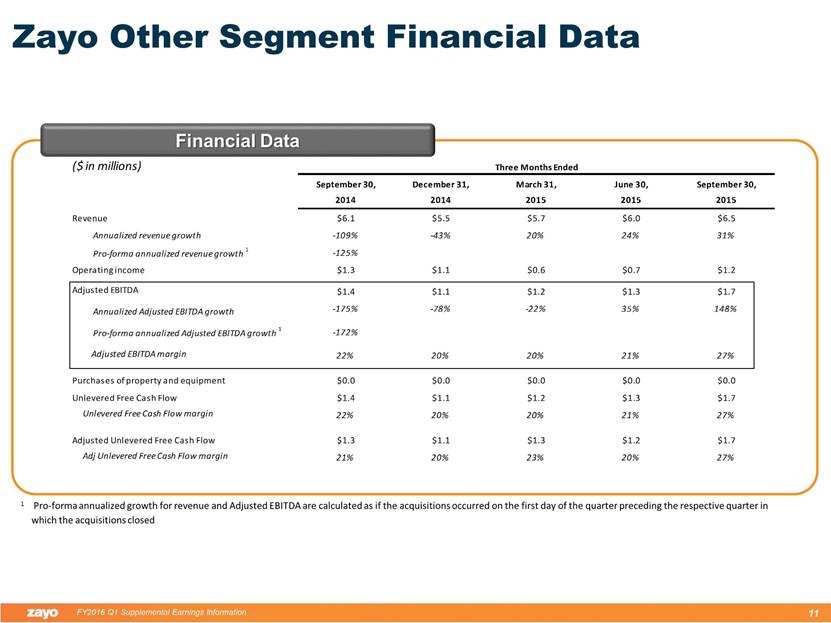
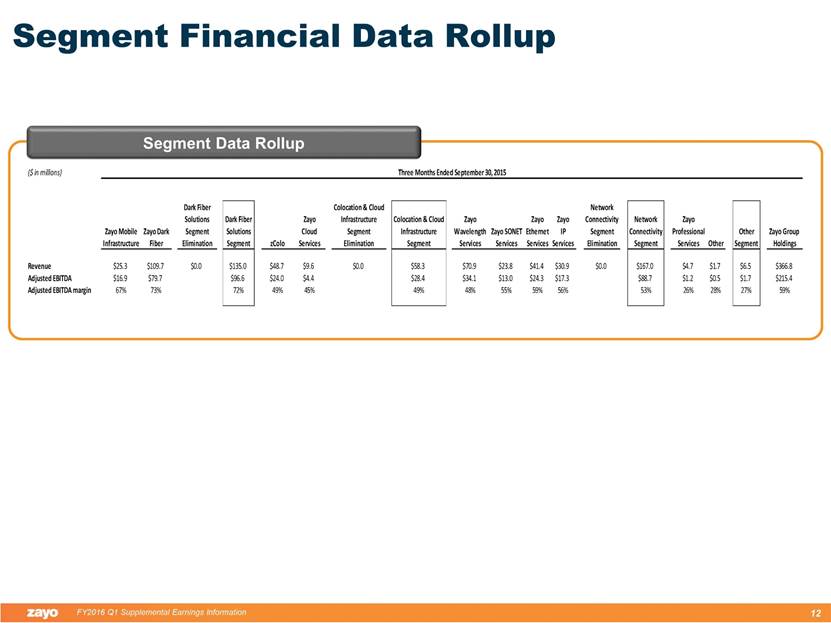
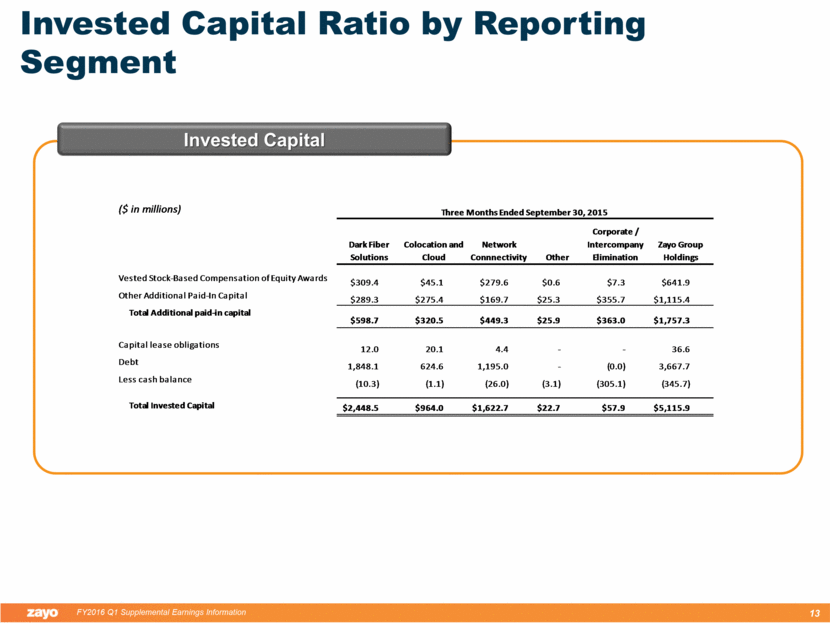
millions Revenue Stratification Net New Sales (Bookings) thousands MRR and MAR Zayo Network Connectivity Segment Revenue Stratification & Operational Data thousands Churn Processed Gross Installations MRR and MAR MRR and MAR thousands Net Installations thousands MRR and MAR Churn % = Estimated Capital and Upfront Expenditures associated with Net New Sales (Bookings) less Upfront Charges millions $2,695 $2,961 $2,899 $2,942 $3,017 $2,988 $3,307 $3,381 $0 $500 $1,000 $1,500 $2,000 $2,500 $3,000 $3,500 $4,000 $4,500 Dec-13 Mar-14 Jun-14 Sep-14 Dec-14 Mar-15 Jun-15 Sep-15 $144.2 $144.8 $146.1 $153.1 $154.0 $154.2 $156.3 $159.2 $1.2 $1.7 $1.4 $1.8 $2.4 $2.2 $1.9 $1.8 $2.3 $2.6 $2.9 $3.4 $3.4 $3.4 $3.5 $3.8 $3.5 $2.6 $3.3 $1.9 $1.9 $3.2 $1.4 $2.2 $151.3 $151.7 $153.8 $160.2 $161.7 $163.0 $163.0 $167.0 $0 $25 $50 $75 $100 $125 $150 $175 $200 Dec-13 Mar-14 Jun-14 Sep-14 Dec-14 Mar-15 Jun-15 Sep-15 MRR Usage MAR Other Revenue $2,610 $2,705 $2,968 $2,735 $3,017 $3,125 $3,148 $3,259 $76 $94 $162 $57 $177 $95 $107 $164 $2,686 $2,799 $3,130 $2,792 $3,194 $3,220 $3,255 $3,423 $80M $100M $150M $90M $106M $103M $100M $119M $0 $500 $1,000 $1,500 $2,000 $2,500 $3,000 $3,500 $4,000 $4,500 Dec-13 Mar-14 Jun-14 Sep-14 Dec-14 Mar-15 Jun-15 Sep-15 Net Sales - MRR Net Sales - MAR Contract Value = ($2,461) ($2,669) ($2,452) ($2,458) ($2,587) ($2,595) ($2,263) ($2,308) -1.7% -1.8% -1.6% -1.6% -1.6% -1.6% -1.4% -1.4% ($4,500) ($4,000) ($3,500) ($3,000) ($2,500) ($2,000) ($1,500) ($1,000) ($500) $0 Dec-13 Mar-14 Jun-14 Sep-14 Dec-14 Mar-15 Jun-15 Sep-15 $233 $292 $447 $484 $430 $393 $1,044 $1,073 $0 $500 $1,000 $1,500 $2,000 $2,500 $3,000 $3,500 $4,000 $4,500 Dec-13 Mar-14 Jun-14 Sep-14 Dec-14 Mar-15 Jun-15 Sep-15 $27 $36 $41 $32 $41 $35 $35 $40 $0 $25 $50 $75 $100 $125 $150 $175 $200 Dec-13 Mar-14 Jun-14 Sep-14 Dec-14 Mar-15 Jun-15 Sep-15
